doi:10.1182/blood-2007-11-124545Prepublished online March 4, 2008;2008 112: 277-286
Fieschi, Vojtech Thon, Mohammad R. Abedi and Lennart HammarstromHelen Chapel, Mary Lucas, Martin Lee, Janne Bjorkander, David Webster, Bodo Grimbacher, Claire clinical phenotypesCommon variable immunodeficiency disorders: division into distinct
http://bloodjournal.hematologylibrary.org/content/112/2/277.full.htmlUpdated information and services can be found at:
(5019 articles)Immunobiology � (1725 articles)Free Research Articles �
(3716 articles)Clinical Trials and Observations �Articles on similar topics can be found in the following Blood collections
http://bloodjournal.hematologylibrary.org/site/misc/rights.xhtml#repub_requestsInformation about reproducing this article in parts or in its entirety may be found online at:
http://bloodjournal.hematologylibrary.org/site/misc/rights.xhtml#reprintsInformation about ordering reprints may be found online at:
http://bloodjournal.hematologylibrary.org/site/subscriptions/index.xhtmlInformation about subscriptions and ASH membership may be found online at:
Copyright 2011 by The American Society of Hematology; all rights reserved.Washington DC 20036.by the American Society of Hematology, 2021 L St, NW, Suite 900, Blood (print ISSN 0006-4971, online ISSN 1528-0020), is published weekly
For personal use only. by guest on June 2, 2013. bloodjournal.hematologylibrary.orgFrom
CLINICAL TRIALS AND OBSERVATIONS
Common variable immunodeficiency disorders: division into distinctclinical phenotypesHelen Chapel,1 Mary Lucas,1 Martin Lee,2 Janne Bjorkander,3 David Webster,4 Bodo Grimbacher,4,5 Claire Fieschi,6
Vojtech Thon,7 Mohammad R. Abedi,8,9 and Lennart Hammarstrom9
1Department of Clinical Immunology, Nuffield Department of Medicine, University of Oxford, Oxford, United Kingdom; 2Department of Biostatistics, University ofCalifornia at Los Angeles; 3Department of Immunology and Allergy, Sahlgrenska University Hospital, Gothenberg, Sweden; 4Department of Immunology, RoyalFree Hospital, London, United Kingdom; 5Department of Immunology and Rheumatology, University of Freiburg, Freiburg, Germany; 6Department of Medicine,Saint-Louis Hospital, Paris, France; 7Department of Clinical Immunology, Masaryk University, Brno, Czech Republic; 8Department of Transfusion Medicine,Orebro University Hospital, Orebro, Sweden; and 9Department of Clinical Immunology, Karolinska Institute at KUS Huddinge, Stockholm, Sweden
The European Common Variable Immuno-deficiency Disorders registry was startedin 1996 to define distinct clinical pheno-types and determine overlap within indi-vidual patients. A total of 7 centers contrib-uted patient data, resulting in the largestcohort yet reported. Patients (334), vali-dated for the diagnosis, were followed foran average of 25.6 years (9461 patient-years). Data were used to define 5 distinctclinical phenotypes: no complications,autoimmunity, polyclonal lymphocytic in-filtration, enteropathy, and lymphoid ma-
lignancy. A total of 83% of patients hadonly one of these phenotypes. Analysis ofmortality showed a considerable reduc-tion in the last 15 years and that differentphenotypes were associated with differ-ent survival times. Types of complica-tions and clinical phenotypes varied sig-nificantly between countries, indicatingthe need for large, international regis-tries. Ages at onset of symptoms anddiagnosis were shown to have a Gauss-ian distribution, but were not useful pre-dictors of phenotype. The only clinical
predictor was polyclonal lymphocytic in-filtration, which was associated with a5-fold increased risk of lymphoid malig-nancy. There was widespread variation inthe levels of serum immunoglobulin iso-types as well as in the percentages andabsolute numbers of B cells, confirmingthe heterogeneity of these conditions.Higher serum IgM and lower circulatingCD8 proportions were found to be predic-tive markers for polyclonal lymphocyticinfiltration and autoimmunity, respec-tively. (Blood. 2008;112:277-286)
Introduction
Common variable immunodeficiency disorders (CVIDs) form agroup of disorders of primary antibody production failure.1 Theseintrinsic diseases are the most common forms of clinical significantprimary antibody failure in adults and children.
Less than 10% of these conditions are inherited.2 In some ofthese families, possible loci for dominant CVID genes on chromo-somes 4q and 16q by genetic linkage studies have been identified.There is also rare evidence of recessive diseases involving B-cellgenes (CD19)3 and T-cell genes (ICOS)4 in patients with thesetypes of primary antibody failures. In addition, some polymor-phisms in genes needed for B-cell survival (TACI and Msh5) arethought to be associated with CVIDs, due to a higher geneprevalence in patients compared with the general population.5,6
Diagnosis of a CVID is made by exclusion of currently knowndisorders of B-cell failure, including defects of B-cell differentiation(absent B cells), B-cell function (such as activation-induced cytidinedeaminase [AID] and uracil-DNAglycosylase [UNG] deficiencies), andT-cell switching pathways, as well as those defects associated withdistinct clinical or laboratory features. B-cell differentiation and class-switch disorders were avoided in this study by considering only patientswho presented older than 4 years, those without a positive family historyof infections in males,7 and those with an absence of previousopportunistic infections.
Even once these conditions have been excluded, it has beenclear for some time that CVIDs represent many differentconditions.8,9 Evidence for this includes the widely differentclinical features of patients; the growing appreciation of thesignificance of normal or raised levels of IgM to indicateautosomal forms of hyper-IgM syndromes;10 phenotyping oflymphocyte T-, B-, and natural killer (NK)–cell subpopula-tions11; immunization responses;12 and the variable levels ofB memory cells.13-17 Many papers in the last 2 decades havestudied potential immunopathogenic mechanisms without refer-ence to this heterogeneity, and this has resulted in a plethora ofpossible mechanisms in varying proportions of patients withclinically diverse CVIDs.
The hunt for genes relating to etiology or disease modificationcontinues. Several genetic abnormalities in different immunepathways may account for the many distinct mechanistic failures inthis group of late-onset but intrinsic antibody deficiencies. Beforesignificant progress can be made, it may be helpful to definedistinct clinical phenotypes more precisely and to investigate theextent of overlap of these phenotypes, as in other multifactorialdiseases such as inflammatory bowel diseases. Moreover, it isimportant to distinguish those complications that are part of theunderlying immune dysregulation from those that result from
Submitted November 28, 2007; accepted February 26, 2008. Prepublishedonline as Blood First Edition paper, March 4, 2008; DOI 10.1182/blood-2007-11-124545.
The online version of this article contains a data supplement.
The publication costs of this article were defrayed in part by page chargepayment. Therefore, and solely to indicate this fact, this article is herebymarked ‘‘advertisement’’ in accordance with 18 USC section 1734.
© 2008 by The American Society of Hematology
277BLOOD, 15 JULY 2008 � VOLUME 112, NUMBER 2
For personal use only. by guest on June 2, 2013. bloodjournal.hematologylibrary.orgFrom
infections (such as bronchiectasis) in order to exclude the latterfrom criteria for disease phenotyping.
The CVID registry was established in 1996, with a grant fromthe European Union (EU) 5th Framework, to provide clinical dataon these disorders in a large cohort of patients from differentEuropean countries. The aims of this first multicenter clinical datacollection were as follows: (1) to define particular clinical pheno-types and to look for overlap within individual patients to lay abasis for correlations with genetic markers; and (2) to show anyvariation in the proportions of clinical phenotypes and individualcomplications between countries across Europe. There is someevidence that mortality of these patients has decreased,2,18,19 so itwas important to examine the variable clinical phenotypes forsurvival to provide prognoses for particular clinical groups.
Methods
This registry was started in 1996 in Stockholm. At first 4 centers, 2 inSweden (Stockholm and Gothenberg) and 2 in the United Kingdom (Oxfordand the Royal Free Hospital, London), contributed patient data. A total of3 other centers were added in 2002: Freiburg, Brno, and Paris. A range ofclinical, immunologic, and follow-up anonymous data were collected inspecific fields. This was checked, validated, and finally completed byrequest in 2005 and 2006. To ensure complete data collection, 3 meetingswere held in 10 years, and there were 3 electronic reminders. The EuropeanSociety for Immunodeficiencies (ESID) online register has now supersededthis registry. Informed consent was not required in all countries in 1996, butpatients were informed that data were being collected as part of clinicalgovernance.
Validation of diagnosis
Standardized diagnostic criteria were used, consistent with the ESID/Pan-American Group for Immunodeficiency (PAGID) criteria20: recurrentbacterial infections, age older than 4 years, serum IgG level below the lowernormal range with at least one other serum immunoglobulin isotype(usually IgA) below lower limit of normal, and exclusion of an underlyingcause. If no initial immunoglobulin levels were available, an individual wasincluded provided that posttreatment levels of IgA or IgM met the criteriaand there was evidence of a low IgG, usually in association with a lowreplacement dose or a break in therapy. Normal ranges for IgG levels variedbetween centers, so lower normal limits (fifth centile) was used. All patientshad excessive infections and were on treatment.
Those with B cells less than 1% were included provided that X-linkedagammaglobulinemia (XLA) had been excluded (BTK mutation/proteinanalysis, female sex, or older than 10 years at presentation). Other B-celldifferentiation defects (�5, �, or BLNK) were considered to be rare in theabsence of a family history. A total of 50 patients (31 female) had normalIgM levels; although these might represent autosomal-recessive hyper-IgMsyndromes, they are included because they met the current CVID criteria.
If there were insufficient data to validate the diagnosis, all the data forthat patient were excluded (Figure S1, available on the Blood website; seethe Supplemental Materials link at the top of the online article). Where datafor a particular section were incomplete, this was not included in therelevant analysis. The following numbers of patients were used: age at onsetof diagnosis, 413; age at onset of symptoms, 389; diagnostic delay, 388;mortality, 352; and clinical phenotyping, 334.
Disease complications
Complications were entered into specific fields; additional or confirmatorydata were obtained from pathology, imaging, and clinical problems sectionsto enable validation. Patients were included in this part of the analysis ifthey had been followed for at least 5 years since the onset of symptoms.Breakthrough infections were not considered to be related to the underlyingimmune dysregulation, only the result of the consequent antibody deficiency.
In determining the prevalence of each complication, it was important torealize that an individual patient might have more than one complication,and that these prevalences might add up to more than 100%.
Development of criteria for clinical phenotyping
The initial criteria for inclusion of a patient into a specific group are givenas follows.
Viral infections: persistent infection with enterovirus, hepatitis B virus(HBV), and hepatitis C virus (HCV). This group was excluded subse-quently, as this study was designed to account for natural diseaseprogression only.
Autoimmunity: rheumatoid arthritis, systemic lupus erythematosus,seronegative arthritis (meeting the American Rheumatism Association[ARA] criteria), Graves disease, primary thyroid failure, insulin-dependentdiabetes mellitus, pernicious anemia, atrophic gastritis (biopsy proven withantral sparing), chronic autoimmune hemolytic anemia, chronic immunethrombocytopenia, persistent unexplained neutropenia, psoriasis, and viti-ligo. Transient arthropathy was excluded.
Polyclonal lymphocytic infiltration: this included lymphoid interstitialpneumonitis (LIP), unexplained granuloma (biopsy-proven; Crohn diseaseexcluded), unexplained hepatomegaly (clinical examination or ultrasound),splenomegaly (on palpation or 11 cm or greater on ultrasound), andextensive and persistent lymphadenopathy (on palpation, ultrasound, orcomputed tomography [CT] scan).
Enteropathy: biopsy-proven lymphocytic infiltration in lamina propriaand interepithelial mucous with villous atrophy, insensitive to glutenwithdrawal.
Malignancies: lymphoid and other forms of cancer.Structural damage: bronchiectasis (CT-proven); chronic sinusitis was
not included due to lack of objective evidence.No complications.
These criteria were later simplified on the basis of significant associationsbetween particular complications and the exclusion of the commonestcomplications, namely bronchiectasis, splenomegaly and iron deficiency.Concurrent but unrelated conditions were not included.
Age of onset of significant symptoms and diagnostic delay
Age of onset was given for 384 of 389 patients; a decision was taken todefine childhood as less than 13 years in 5 patients. Significant symptomswere defined as pneumonia, meningitis, or a significant increase of severityor frequency of bacterial infections in the respiratory tract.
Immunophenotyping of peripheral lymphocytes
In order to assess the value of T-, B-, and NK-lymphocyte percentages aspredictors of clinical phenotype, analysis of pretreatment and posttreatmentdata for CD3�:CD4�, CD3�:CD8�, and CD19� peripheral cells was done.A preanalysis check using serial data showed that using mixed before andafter data did not result in significant differences. Examination of serial dataon B cells on 177 patients from this registry show that there were nosignificant changes (� 15%) in peripheral CD19 B-cell numbers in 97% ofthe patients, as found previously (B. Ferry, N. Kaenzig, K. Packwood,J. Burden, D. Harrison, H.C., unpublished data, June 2006). Four yearreview of CVIDs patients in Oxford: is the classification by memory B-cellphenotypes reproducible? Unpublished data, June 1, 2006. Likewise, thefigures for unchanging proportions of CD4� and CD8� cells were 92% and90%, respectively.
Statistical analyses
For comparison of any 2 qualitative (categoric) variables, the calculationwas based on the chi-square test for homogeneity using a Monte Carlosimulation of the exact distribution of the test statistic to determine theP value. This was needed because of the relatively small cell sizes in manyof the contingency tables evaluated. Comparison of differences betweencenters used the Kruskal-Wallis nonparametric one-way analysis of vari-ance (ANOVA) test of the median findings across the 7 centers.
278 CHAPEL et al BLOOD, 15 JULY 2008 � VOLUME 112, NUMBER 2
For personal use only. by guest on June 2, 2013. bloodjournal.hematologylibrary.orgFrom
The logistic regression model was used for evaluating the predictiveeffect of baseline laboratory results for the various phenotypes. Where theP value for a predictive effect of the given laboratory parameter was lessthan .05, then the odds ratio was given with a 95% confidence interval (CI).Note that the following transformations were used when needed in theanalyses: IgG, square root; IgM, log; CD19, square root; CD19A, log; CD8,square root; CD4, square root; and CD4/CD8, log. These were identifiedfrom the Box-Cox family of data transformations.
Associations between the clinical phenotypes and age of onset ofsymptoms, age at diagnosis, and length of diagnostic delay were examinedby the Mann-Whitney test. The Pearson correlation coefficient was used toexamine the relationship between laboratory results. The aforementionedtransformations were used in these analyses. For correlations betweenimmunoglobulin levels and lymphocyte subpopulations, correlation coeffi-cients were calculated for square root–transformed IgG levels and lympho-cyte percentages and log-transformed absolute lymphocyte numbers.
The method of Kaplan and Meier was used to plot mortality data andestimate survival. Comparison of the survival distribution by phenotypewas determined using the log-rank test.
Results
Validation of diagnosis and patient characteristics
Completion of the registry took 10 years. Data for 536 patientsfrom 7 centers was checked to ensure that each individual met thediagnostic criteria for a CVID, though antibody responses were notavailable in all countries at diagnosis. A total of 112 patients wereremoved for the following reasons: inappropriate diagnosis (thy-moma; 4 patients); secondary antibody defects (2 patients); normalserum levels of IgA and IgM (7 patients); IgG level within normallimits (11 patients); no serum immunoglobulin levels available(39 patients); no data on recurrent infections (36 patients), no dataon infections or immunoglobulin levels (8 patients), and incom-plete data for immunoglobulin levels (5 patients). The diagnosiswas validated on 424 patients; patients with IgG subclass orspecific antibody deficiency were excluded. In only 9 patients wereIgG (3 patients) or IgA (6 patients) levels between 5.5 and 6.0 and0.6 and 0.79 g/L (fifth to third centiles), respectively. A total of64 (21%) patients had undetectable IgG, IgM, and IgA (IgG � 1.0g/L; IgA � 0.1 g/L; and IgM � 0.1 g/L). A total of 50 patients hadIgM concentrations greater than 0.5 g/L (31 females; Figure S2).Particularly low levels of IgG at diagnosis (� 1.5 g/L) were notassociated with diagnostic delay (P � .19) or severe infections(such as pneumonia or septicemia) before diagnosis (P � .84).
The ages of the patients at analysis ranged from 11 to90 years, with a mean of 49.4 plus or minus 16.3 (mean and1 SD). There were 177 males and 128 females (for 19 patients,sex was not specified).
The most common age at onset of symptoms was in the third decade(mean, 26.3 years; median, 24 years) and was continuous (Figure S3).There were no significant differences in the age at onset of symptomsbetween the country cohorts (P � .08). The age at diagnosis wasrecorded in 97% of patients (n � 413) and proved to be a continuouscurve, though the rate of diagnosis fell in the eighth decade. The meanwas 35.3 years, and the median was 33 years. More diagnoses weremade in the United Kingdom under the age of 10 years (8%) whencompared with Brno, Freiburg, and Sweden (2%; P � .002; Table S2).
Analysis of diagnostic delay (388 patients) showed a range of0 to 61 years, with 20% of the patients being diagnosed with aCVID more than 15 years after the onset of symptoms. The meandiagnostic delay was 7.46 years, and median was 5 years, with94.9% of the values being within 14.84 years (2 SD). There was aninverse correlation between the age of onset of symptoms anddiagnostic delay (P � .001; Pearson correlation coefficient, �0.37).The hypothesis that a longer time span since the triggering event inthese acquired diseases resulted in particularly low presentingserum IgG levels was not supported, since diagnostic delay did notcorrelate with IgG concentration at diagnosis (P � .19).
Length of follow-up and overall mortality
Times of follow-up since onset of symptoms, as well as time fromdiagnosis, were calculated for each patient. Data for age at onset ofsymptoms, and therefore length of follow-up, were available for389 patients (Table S1). A total of 326 (84%) patients werefollowed for at least 10 years since onset of symptoms; 237 (61%)patients were followed for more than 18 years.
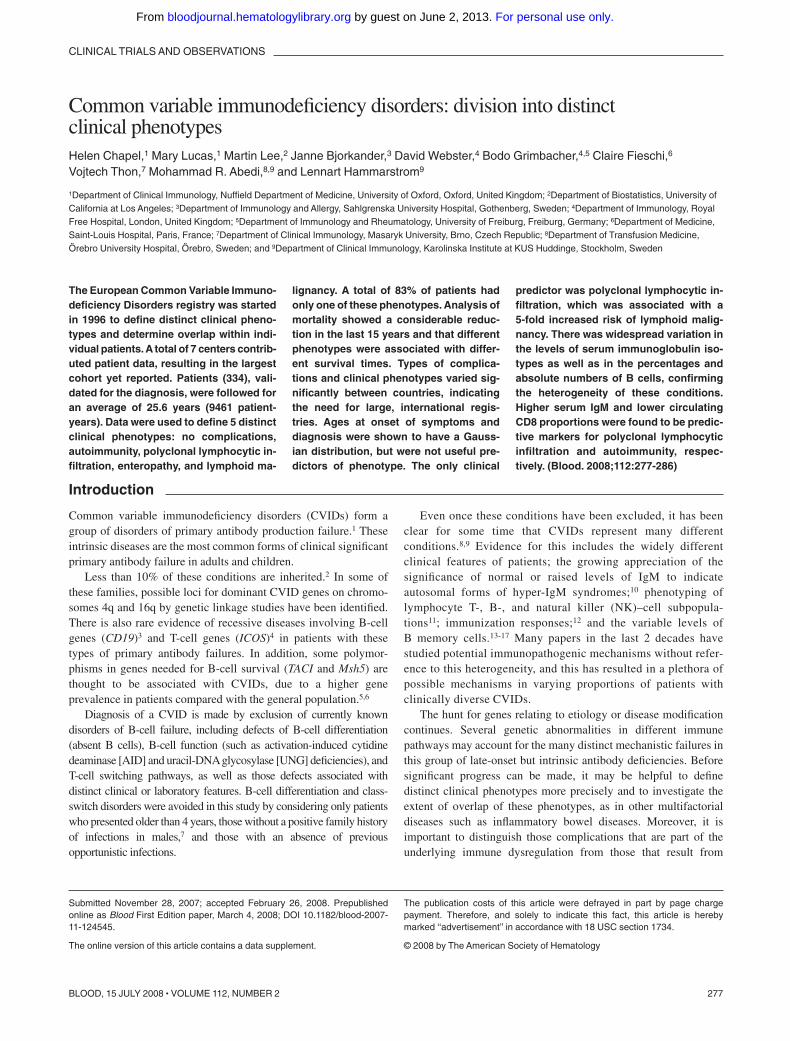
The mortality figures (Figure 1) are given relative to data fromother cohorts published in 197118 and 1999,2 as well as figures fromactuarial life tables for the United Kingdom.21 This shows that the75th percentile for survival is 25 years after diagnosis (95% CI:22-33 years) and the 60th percentile is 41 years (95% CI:33-41 years). These figures do not account for the variable ages atpresentation. However, the mean ages at onset of symptoms weresignificantly different in the surviving group (25 years) and thedeceased group (34 years; P � .005). There were no associationsbetween survival and sex (P � .78 by chi-square test) or initialserum IgG (P � .51), IgA (P � .19), or IgM (P � .06) levels.
Figure 1. Mortality by year since diagnosis. Patients inthis study (yellow line) are compared with those reportedpreviously in the relevant references. Kaplan-Meier plotof survival. Data for comparison from Cunningham-Rundles and Bodian2 (pink line), Healy et al18 (blue line),UK actuarial life figures 2003—men (turquoise line), andUK actuarial life figures 2003—women (purple line);because these are based on data from birth, they areboth adjusted to start from the mean age of onset inpatients, for comparison with start of patient data.
CLINICAL PHENOTYPING OF CVIDs 279BLOOD, 15 JULY 2008 � VOLUME 112, NUMBER 2
For personal use only. by guest on June 2, 2013. bloodjournal.hematologylibrary.orgFrom
Atotal of 51 patients died in this cohort; the median follow-up period(22.5 years) of those that died was not significantly different from that ofsurvivors (22 years; P � .59). Causes of death were given for 37 (73%)patients. There were 10 deaths from disease-related complications:sepsis (4 patients), lymphoid malignancy (non-Hodgkin lymphoma;5 patients), and unexplained liver disease (1 patient). A total of 9 deathswere due to complications of treatment: opportunistic infections(3 patients) and HCV infection (6 patients). The other deaths (18 pa-tients), assumed to be unrelated, included cardiac/vascular diseases(11 patients), epithelial cancers (2 patients), and chronic obstructiveairways disease related to smoking (5 patients).
From analysis of the overall data there was no relationshipbetween mortality and the length of diagnostic delay (P � .33).Bronchiectasis was associated with reduced survival; 23 of84 patients with bronchiectasis died, while only 28 of 250 withoutbronchiectasis died (P � .001).
Disease complications and comparison of complication ratesbetween centers
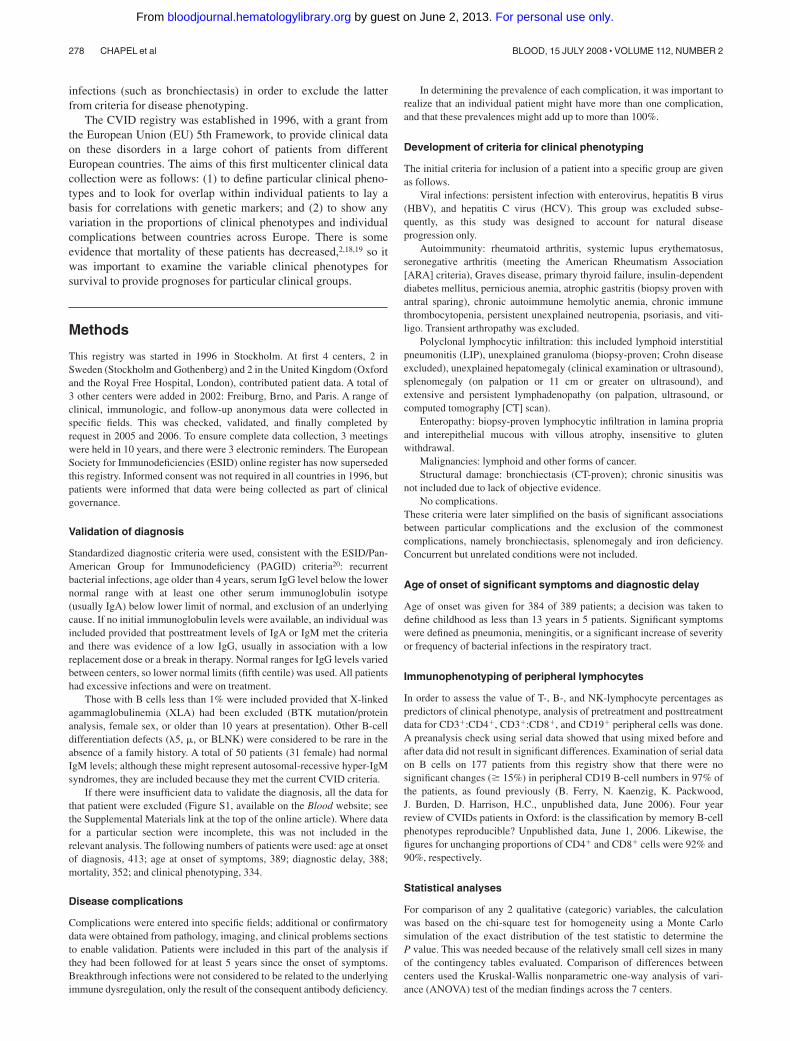
The minimum considered for analysis of morbidity was 5 years; 19patients who were followed for less than 5 years since onset ofsymptoms were excluded from the phenotyping analysis. Datafrom 64 patients from one center was excluded due to incomplete-ness. Low patient numbers (n � 7) from another center resulted inexclusion of that center to avoid selection bias. There was validateddata regarding morbidity for 334 patients followed for more than5 years, giving a total follow-up time of 9461 patient-years.
These 334 patients showed a wide range of individual complica-tions (Figure 2). The prevalence of each complication is shown inTable 1. There was considerable variability in the prevalence ofcomplications by center (Table 2; Figures S4A,B). The prevalenceof splenomegaly varied from 3% to 66% (P � .001). Granulomawas also significantly different, with only 2% to 4% in the Swedishcohorts, 10% in Freiburg, and 16% in Oxford (P � .01). Unex-plained hepatomegaly varied from 0% to 15% (P � .008), butdifferences in biopsy-proven enteropathy, although varying from3% to 15%, was not significant (P � .06). Other differencesbetween centers in the rates for specific complications included
those for psoriasis, chronic immune thrombocytopenia, persistentlymphadenopathy, LIP, or unexplained iron deficiency. Perniciousanemia and autoimmune hemolytic anemia were not significantlyvariable (P � .08; Table 2).
There were also different proportions of patients in each centerwith bronchiectasis (P � .001). Bronchiectasis was associated with
Figure 2. Individual complications associated with CVIDs across Europe, as a percentage of the all patients. Patients may have had more than one complication.
Table 1. Categories and prevalence of individual complications
CategoryPrevalence,
%
Specific autoimmune diseases
Cytopenias
ITP 7
AHA 4
Neutropenias 1
Skin diseases
Vitiligo 5
Psoriasis 2
Gastrointestinal diseases
Pernicious anemia 9
Atrophic gastritis 6
Endocrine diseases
Hypothyroidism 4
Thyrotoxicosis 1
Diabetes 3
Types of polyclonal lymphocytic infiltration
Enteropathy* 9
Granuloma† 8
Unexplained hepatomegaly 9
Persistent lymphadenopathy 15
Splenomegaly 30
Lymphoid interstitial pneumonitis 3
Malignancies 6
Lymphoid malignancies 3
Other malignancies 3
No complications 26
Demonstration of the different types of autoimmune diseases, polyclonal lymphocyticinfiltrative conditions, and malignancies in 334 patients, giving the prevalence of individualcomplications; any individual patient may have more than one complication.
*Lymphocytic infiltration of small intestine that was not gluten-sensitive.†Biopsy-proven but regardless of site; excludes Crohn disease.
280 CHAPEL et al BLOOD, 15 JULY 2008 � VOLUME 112, NUMBER 2
For personal use only. by guest on June 2, 2013. bloodjournal.hematologylibrary.orgFrom
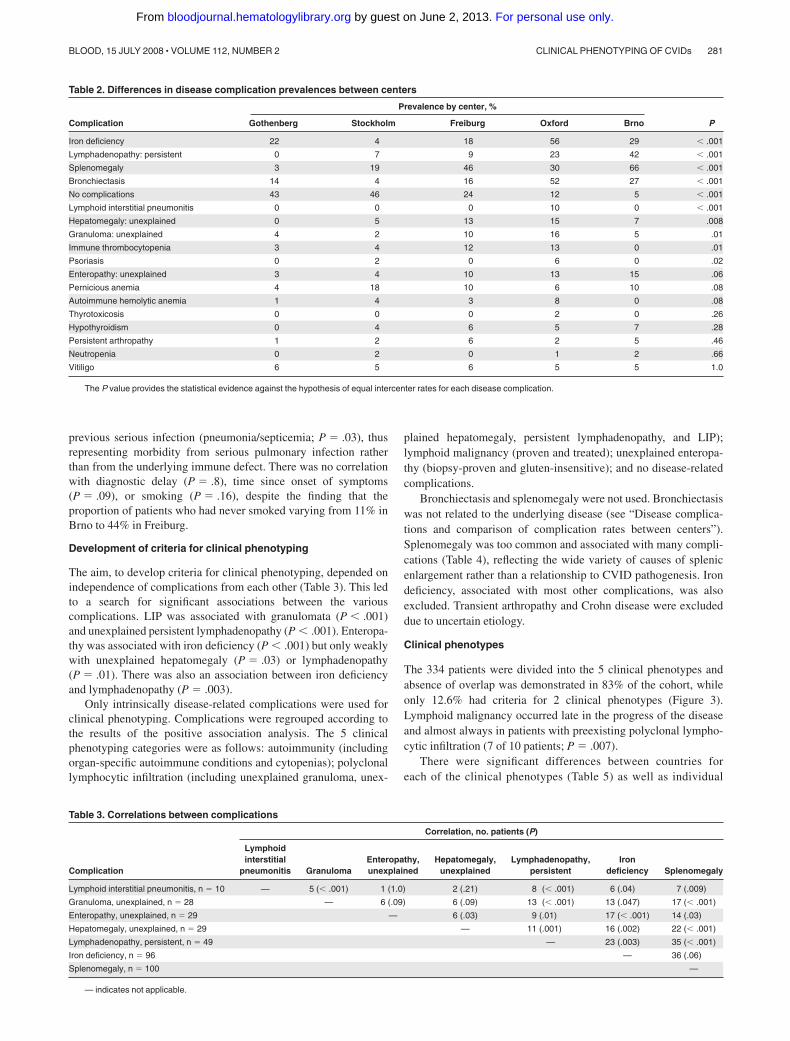
previous serious infection (pneumonia/septicemia; P � .03), thusrepresenting morbidity from serious pulmonary infection ratherthan from the underlying immune defect. There was no correlationwith diagnostic delay (P � .8), time since onset of symptoms(P � .09), or smoking (P � .16), despite the finding that theproportion of patients who had never smoked varying from 11% inBrno to 44% in Freiburg.
Development of criteria for clinical phenotyping
The aim, to develop criteria for clinical phenotyping, depended onindependence of complications from each other (Table 3). This ledto a search for significant associations between the variouscomplications. LIP was associated with granulomata (P � .001)and unexplained persistent lymphadenopathy (P � .001). Enteropa-thy was associated with iron deficiency (P � .001) but only weaklywith unexplained hepatomegaly (P � .03) or lymphadenopathy(P � .01). There was also an association between iron deficiencyand lymphadenopathy (P � .003).
Only intrinsically disease-related complications were used forclinical phenotyping. Complications were regrouped according tothe results of the positive association analysis. The 5 clinicalphenotyping categories were as follows: autoimmunity (includingorgan-specific autoimmune conditions and cytopenias); polyclonallymphocytic infiltration (including unexplained granuloma, unex-
plained hepatomegaly, persistent lymphadenopathy, and LIP);lymphoid malignancy (proven and treated); unexplained enteropa-thy (biopsy-proven and gluten-insensitive); and no disease-relatedcomplications.
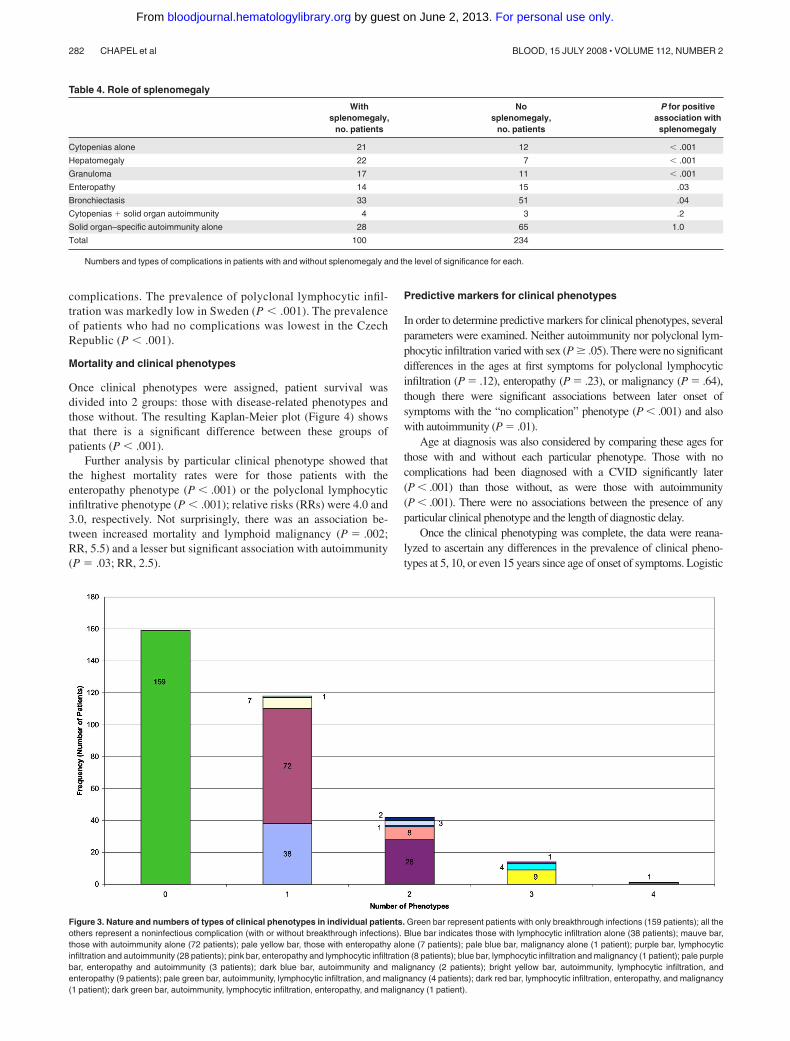
Bronchiectasis and splenomegaly were not used. Bronchiectasiswas not related to the underlying disease (see “Disease complica-tions and comparison of complication rates between centers”).Splenomegaly was too common and associated with many compli-cations (Table 4), reflecting the wide variety of causes of splenicenlargement rather than a relationship to CVID pathogenesis. Irondeficiency, associated with most other complications, was alsoexcluded. Transient arthropathy and Crohn disease were excludeddue to uncertain etiology.
Clinical phenotypes
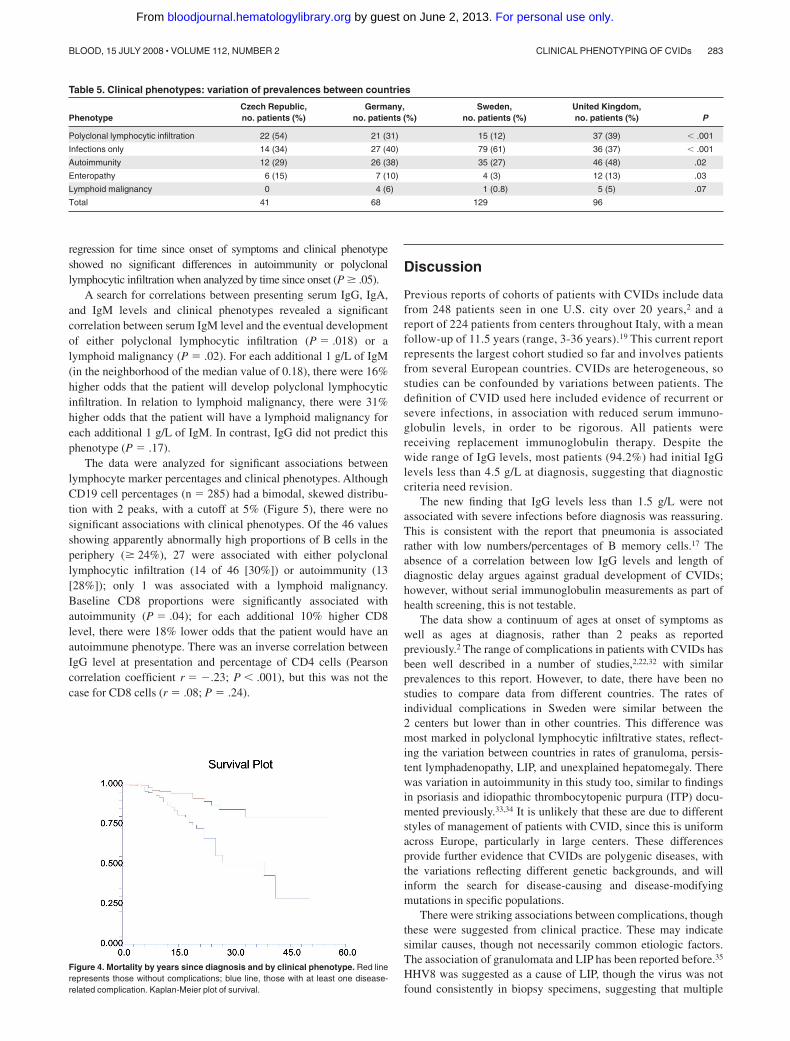
The 334 patients were divided into the 5 clinical phenotypes andabsence of overlap was demonstrated in 83% of the cohort, whileonly 12.6% had criteria for 2 clinical phenotypes (Figure 3).Lymphoid malignancy occurred late in the progress of the diseaseand almost always in patients with preexisting polyclonal lympho-cytic infiltration (7 of 10 patients; P � .007).
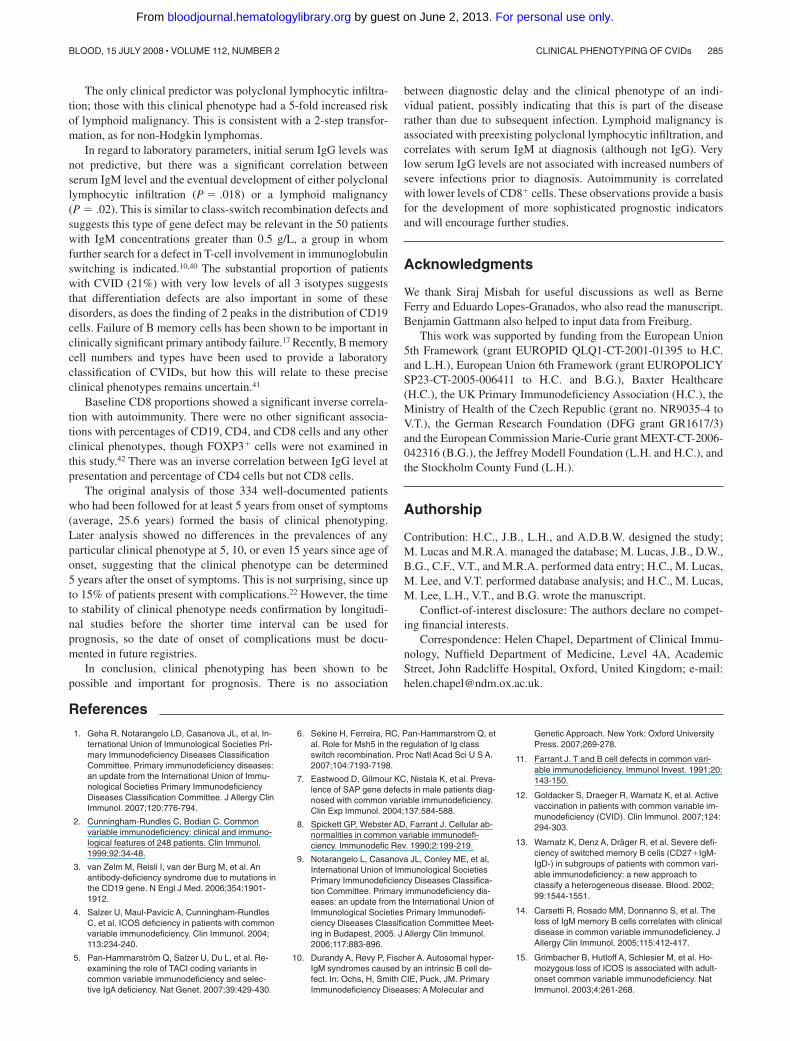
There were significant differences between countries foreach of the clinical phenotypes (Table 5) as well as individual
Table 2. Differences in disease complication prevalences between centers
Complication
Prevalence by center, %
PGothenberg Stockholm Freiburg Oxford Brno
Iron deficiency 22 4 18 56 29 � .001
Lymphadenopathy: persistent 0 7 9 23 42 � .001
Splenomegaly 3 19 46 30 66 � .001
Bronchiectasis 14 4 16 52 27 � .001
No complications 43 46 24 12 5 � .001
Lymphoid interstitial pneumonitis 0 0 0 10 0 � .001
Hepatomegaly: unexplained 0 5 13 15 7 .008
Granuloma: unexplained 4 2 10 16 5 .01
Immune thrombocytopenia 3 4 12 13 0 .01
Psoriasis 0 2 0 6 0 .02
Enteropathy: unexplained 3 4 10 13 15 .06
Pernicious anemia 4 18 10 6 10 .08
Autoimmune hemolytic anemia 1 4 3 8 0 .08
Thyrotoxicosis 0 0 0 2 0 .26
Hypothyroidism 0 4 6 5 7 .28
Persistent arthropathy 1 2 6 2 5 .46
Neutropenia 0 2 0 1 2 .66
Vitiligo 6 5 6 5 5 1.0
The P value provides the statistical evidence against the hypothesis of equal intercenter rates for each disease complication.
Table 3. Correlations between complications
Complication
Correlation, no. patients (P)
Lymphoidinterstitial
pneumonitis GranulomaEnteropathy,unexplained
Hepatomegaly,unexplained
Lymphadenopathy,persistent
Irondeficiency Splenomegaly
Lymphoid interstitial pneumonitis, n � 10 — 5 (� .001) 1 (1.0) 2 (.21) 8 (� .001) 6 (.04) 7 (.009)
Granuloma, unexplained, n � 28 — 6 (.09) 6 (.09) 13 (� .001) 13 (.047) 17 (� .001)
Enteropathy, unexplained, n � 29 — 6 (.03) 9 (.01) 17 (� .001) 14 (.03)
Hepatomegaly, unexplained, n � 29 — 11 (.001) 16 (.002) 22 (� .001)
Lymphadenopathy, persistent, n � 49 — 23 (.003) 35 (� .001)
Iron deficiency, n � 96 — 36 (.06)
Splenomegaly, n � 100 —
— indicates not applicable.
CLINICAL PHENOTYPING OF CVIDs 281BLOOD, 15 JULY 2008 � VOLUME 112, NUMBER 2
For personal use only. by guest on June 2, 2013. bloodjournal.hematologylibrary.orgFrom
complications. The prevalence of polyclonal lymphocytic infil-tration was markedly low in Sweden (P � .001). The prevalenceof patients who had no complications was lowest in the CzechRepublic (P � .001).
Mortality and clinical phenotypes
Once clinical phenotypes were assigned, patient survival wasdivided into 2 groups: those with disease-related phenotypes andthose without. The resulting Kaplan-Meier plot (Figure 4) showsthat there is a significant difference between these groups ofpatients (P � .001).
Further analysis by particular clinical phenotype showed thatthe highest mortality rates were for those patients with theenteropathy phenotype (P � .001) or the polyclonal lymphocyticinfiltrative phenotype (P � .001); relative risks (RRs) were 4.0 and3.0, respectively. Not surprisingly, there was an association be-tween increased mortality and lymphoid malignancy (P � .002;RR, 5.5) and a lesser but significant association with autoimmunity(P � .03; RR, 2.5).
Predictive markers for clinical phenotypes
In order to determine predictive markers for clinical phenotypes, severalparameters were examined. Neither autoimmunity nor polyclonal lym-phocytic infiltration varied with sex (P � .05). There were no significantdifferences in the ages at first symptoms for polyclonal lymphocyticinfiltration (P � .12), enteropathy (P � .23), or malignancy (P � .64),though there were significant associations between later onset ofsymptoms with the “no complication” phenotype (P � .001) and alsowith autoimmunity (P � .01).
Age at diagnosis was also considered by comparing these ages forthose with and without each particular phenotype. Those with nocomplications had been diagnosed with a CVID significantly later(P � .001) than those without, as were those with autoimmunity(P � .001). There were no associations between the presence of anyparticular clinical phenotype and the length of diagnostic delay.
Once the clinical phenotyping was complete, the data were reana-lyzed to ascertain any differences in the prevalence of clinical pheno-types at 5, 10, or even 15 years since age of onset of symptoms. Logistic
Figure 3. Nature and numbers of types of clinical phenotypes in individual patients. Green bar represent patients with only breakthrough infections (159 patients); all theothers represent a noninfectious complication (with or without breakthrough infections). Blue bar indicates those with lymphocytic infiltration alone (38 patients); mauve bar,those with autoimmunity alone (72 patients); pale yellow bar, those with enteropathy alone (7 patients); pale blue bar, malignancy alone (1 patient); purple bar, lymphocyticinfiltration and autoimmunity (28 patients); pink bar, enteropathy and lymphocytic infiltration (8 patients); blue bar, lymphocytic infiltration and malignancy (1 patient); pale purplebar, enteropathy and autoimmunity (3 patients); dark blue bar, autoimmunity and malignancy (2 patients); bright yellow bar, autoimmunity, lymphocytic infiltration, andenteropathy (9 patients); pale green bar, autoimmunity, lymphocytic infiltration, and malignancy (4 patients); dark red bar, lymphocytic infiltration, enteropathy, and malignancy(1 patient); dark green bar, autoimmunity, lymphocytic infiltration, enteropathy, and malignancy (1 patient).
Table 4. Role of splenomegaly
Withsplenomegaly,
no. patients
Nosplenomegaly,
no. patients
P for positiveassociation withsplenomegaly
Cytopenias alone 21 12 � .001
Hepatomegaly 22 7 � .001
Granuloma 17 11 � .001
Enteropathy 14 15 .03
Bronchiectasis 33 51 .04
Cytopenias � solid organ autoimmunity 4 3 .2
Solid organ–specific autoimmunity alone 28 65 1.0
Total 100 234
Numbers and types of complications in patients with and without splenomegaly and the level of significance for each.
282 CHAPEL et al BLOOD, 15 JULY 2008 � VOLUME 112, NUMBER 2
For personal use only. by guest on June 2, 2013. bloodjournal.hematologylibrary.orgFrom
regression for time since onset of symptoms and clinical phenotypeshowed no significant differences in autoimmunity or polyclonallymphocytic infiltration when analyzed by time since onset (P � .05).
A search for correlations between presenting serum IgG, IgA,and IgM levels and clinical phenotypes revealed a significantcorrelation between serum IgM level and the eventual developmentof either polyclonal lymphocytic infiltration (P � .018) or alymphoid malignancy (P � .02). For each additional 1 g/L of IgM(in the neighborhood of the median value of 0.18), there were 16%higher odds that the patient will develop polyclonal lymphocyticinfiltration. In relation to lymphoid malignancy, there were 31%higher odds that the patient will have a lymphoid malignancy foreach additional 1 g/L of IgM. In contrast, IgG did not predict thisphenotype (P � .17).
The data were analyzed for significant associations betweenlymphocyte marker percentages and clinical phenotypes. AlthoughCD19 cell percentages (n � 285) had a bimodal, skewed distribu-tion with 2 peaks, with a cutoff at 5% (Figure 5), there were nosignificant associations with clinical phenotypes. Of the 46 valuesshowing apparently abnormally high proportions of B cells in theperiphery (� 24%), 27 were associated with either polyclonallymphocytic infiltration (14 of 46 [30%]) or autoimmunity (13[28%]); only 1 was associated with a lymphoid malignancy.Baseline CD8 proportions were significantly associated withautoimmunity (P � .04); for each additional 10% higher CD8level, there were 18% lower odds that the patient would have anautoimmune phenotype. There was an inverse correlation betweenIgG level at presentation and percentage of CD4 cells (Pearsoncorrelation coefficient r � �.23; P � .001), but this was not thecase for CD8 cells (r � .08; P � .24).
Discussion
Previous reports of cohorts of patients with CVIDs include datafrom 248 patients seen in one U.S. city over 20 years,2 and areport of 224 patients from centers throughout Italy, with a meanfollow-up of 11.5 years (range, 3-36 years).19 This current reportrepresents the largest cohort studied so far and involves patientsfrom several European countries. CVIDs are heterogeneous, sostudies can be confounded by variations between patients. Thedefinition of CVID used here included evidence of recurrent orsevere infections, in association with reduced serum immuno-globulin levels, in order to be rigorous. All patients werereceiving replacement immunoglobulin therapy. Despite thewide range of IgG levels, most patients (94.2%) had initial IgGlevels less than 4.5 g/L at diagnosis, suggesting that diagnosticcriteria need revision.
The new finding that IgG levels less than 1.5 g/L were notassociated with severe infections before diagnosis was reassuring.This is consistent with the report that pneumonia is associatedrather with low numbers/percentages of B memory cells.17 Theabsence of a correlation between low IgG levels and length ofdiagnostic delay argues against gradual development of CVIDs;however, without serial immunoglobulin measurements as part ofhealth screening, this is not testable.
The data show a continuum of ages at onset of symptoms aswell as ages at diagnosis, rather than 2 peaks as reportedpreviously.2 The range of complications in patients with CVIDs hasbeen well described in a number of studies,2,22,32 with similarprevalences to this report. However, to date, there have been nostudies to compare data from different countries. The rates ofindividual complications in Sweden were similar between the2 centers but lower than in other countries. This difference wasmost marked in polyclonal lymphocytic infiltrative states, reflect-ing the variation between countries in rates of granuloma, persis-tent lymphadenopathy, LIP, and unexplained hepatomegaly. Therewas variation in autoimmunity in this study too, similar to findingsin psoriasis and idiopathic thrombocytopenic purpura (ITP) docu-mented previously.33,34 It is unlikely that these are due to differentstyles of management of patients with CVID, since this is uniformacross Europe, particularly in large centers. These differencesprovide further evidence that CVIDs are polygenic diseases, withthe variations reflecting different genetic backgrounds, and willinform the search for disease-causing and disease-modifyingmutations in specific populations.
There were striking associations between complications, thoughthese were suggested from clinical practice. These may indicatesimilar causes, though not necessarily common etiologic factors.The association of granulomata and LIP has been reported before.35
HHV8 was suggested as a cause of LIP, though the virus was notfound consistently in biopsy specimens, suggesting that multiple
Figure 4. Mortality by years since diagnosis and by clinical phenotype. Red linerepresents those without complications; blue line, those with at least one disease-related complication. Kaplan-Meier plot of survival.
Table 5. Clinical phenotypes: variation of prevalences between countries
PhenotypeCzech Republic,no. patients (%)
Germany,no. patients (%)
Sweden,no. patients (%)
United Kingdom,no. patients (%) P
Polyclonal lymphocytic infiltration 22 (54) 21 (31) 15 (12) 37 (39) � .001
Infections only 14 (34) 27 (40) 79 (61) 36 (37) � .001
Autoimmunity 12 (29) 26 (38) 35 (27) 46 (48) .02
Enteropathy 6 (15) 7 (10) 4 (3) 12 (13) .03
Lymphoid malignancy 0 4 (6) 1 (0.8) 5 (5) .07
Total 41 68 129 96
CLINICAL PHENOTYPING OF CVIDs 283BLOOD, 15 JULY 2008 � VOLUME 112, NUMBER 2
For personal use only. by guest on June 2, 2013. bloodjournal.hematologylibrary.orgFrom

causes were more likely.36 The significant relationship betweengluten-resistant enteropathy and unexplained hepatomegaly sug-gests that the liver disease could be secondary to an unknowninfiltrative process in the small bowel. The nature of liver disease inpatients with CVID is under review currently (C. Ward, oral andwritten communication, February 2008); the association withpersistent lymphadenopathy and enteropathy is intriguing.
The criteria for each phenotype were based on associations ofcomplications in an attempt to separate the infiltrative conditionsfrom autoimmunity and avoidance of common complications.Splenomegaly was associated with a wide range of complications,including cytopenias, hepatomegaly, and granulomata, and notwith solid organ–specific autoimmunity; splenomegaly was there-fore not used. Bronchiectasis was significantly related to priorserious infection and not part of the underlying process. The highprevalence of iron deficiency anemia (29%) was not uniquelyrelated to enteropathy (37% of patients were women in theirreproductive years). None of these common complications wereused as criteria. Enteropathy was the only infiltrative complicationthat was not strongly associated with persistent lymphadenopathyand was taken as a distinct phenotype; it is possible that the causeof hepatomegaly might also be distinct, and this would bearexamination in larger studies in the future.
Clinical phenotyping resulted in 83% of the patients exhibitingfeatures of only one clinical phenotype, giving credence to thecriteria selected. Furthermore, each distinct phenotype had aparticular correlation with survival. The highest mortality rateswere in those patients with enteropathy or polyclonal lymphocyticinfiltration. The association between granulomata/LIP and short-ened survival has been reported before.35 There was also anassociation between mortality and lymphoid malignancy (notsurprisingly), and a lesser but significant association with autoim-munity. This data, and the Kaplan-Meier plot (Figure 4), giveweight to the biological validity of the criteria for clinicalphenotyping. However, this analysis is based on retrospective data
and it is important that these findings be confirmed by prospectivestudies in several continents.
Comparison of overall survival data with previously publishedcohorts shows a considerable increase in survival in recent years(Figure 1).2,18,22 Comparison with data from Iran, a country inwhich postdiagnosis survival (14% at 14 years) was very poor priorto the availability of therapeutic immunoglobulin,37 suggests thatsuch treatment is effective in prolonging life. Reduced diagnosticdelay does not account for the improvement in survival, since thishas changed little.2,38 The calculated mean diagnostic delay for 388patients was 7.46 years, with a median of 5 years, consistent withthe Italian figure of 8.9 years.19 Although the mean ages at onset ofsymptoms were significantly different in the surviving versus thedeceased group, a larger prospective cohort is needed to examinesurvival against age at onset of symptoms.
An attempt was made to search for predictors for any givenclinical phenotype. These included demographic data, ages of onsetof symptoms and diagnosis, length of diagnostic delay, associationsbetween the phenotypes, and laboratory parameters. Sex, timesince onset of symptoms, and length of diagnostic delay were notassociated with a particular clinical phenotype of CVID. Thedevelopment of complications does not appear to be time depen-dent but rather intrinsic to the disease processes.
The hypothesis that a longer time span since a triggering eventin these acquired diseases results in particularly low presentingserum IgG levels was not supported either, since diagnostic delaydid not correlate with IgG concentration at diagnosis (P � .19).The association between autoimmunity and later age at diagnosis(P � .001) may indicate lack of awareness of this association andis unexpected, since autoimmunity is usually more common inyoung females. Those patients without complications had also beendiagnosed with CVID later in life, in comparison with those with amore complicated clinical phenotype (P � .001). This confirms thereported experience that children with CVIDs have a high inci-dence of complicated disease.39
Figure 5. Distribution of B cells in the circulation (as a percentage). Number of values of B cells on the y-axis.
284 CHAPEL et al BLOOD, 15 JULY 2008 � VOLUME 112, NUMBER 2
For personal use only. by guest on June 2, 2013. bloodjournal.hematologylibrary.orgFrom
The only clinical predictor was polyclonal lymphocytic infiltra-tion; those with this clinical phenotype had a 5-fold increased riskof lymphoid malignancy. This is consistent with a 2-step transfor-mation, as for non-Hodgkin lymphomas.
In regard to laboratory parameters, initial serum IgG levels wasnot predictive, but there was a significant correlation betweenserum IgM level and the eventual development of either polyclonallymphocytic infiltration (P � .018) or a lymphoid malignancy(P � .02). This is similar to class-switch recombination defects andsuggests this type of gene defect may be relevant in the 50 patientswith IgM concentrations greater than 0.5 g/L, a group in whomfurther search for a defect in T-cell involvement in immunoglobulinswitching is indicated.10,40 The substantial proportion of patientswith CVID (21%) with very low levels of all 3 isotypes suggeststhat differentiation defects are also important in some of thesedisorders, as does the finding of 2 peaks in the distribution of CD19cells. Failure of B memory cells has been shown to be important inclinically significant primary antibody failure.17 Recently, B memorycell numbers and types have been used to provide a laboratoryclassification of CVIDs, but how this will relate to these preciseclinical phenotypes remains uncertain.41
Baseline CD8 proportions showed a significant inverse correla-tion with autoimmunity. There were no other significant associa-tions with percentages of CD19, CD4, and CD8 cells and any otherclinical phenotypes, though FOXP3� cells were not examined inthis study.42 There was an inverse correlation between IgG level atpresentation and percentage of CD4 cells but not CD8 cells.
The original analysis of those 334 well-documented patientswho had been followed for at least 5 years from onset of symptoms(average, 25.6 years) formed the basis of clinical phenotyping.Later analysis showed no differences in the prevalences of anyparticular clinical phenotype at 5, 10, or even 15 years since age ofonset, suggesting that the clinical phenotype can be determined5 years after the onset of symptoms. This is not surprising, since upto 15% of patients present with complications.22 However, the timeto stability of clinical phenotype needs confirmation by longitudi-nal studies before the shorter time interval can be used forprognosis, so the date of onset of complications must be docu-mented in future registries.
In conclusion, clinical phenotyping has been shown to bepossible and important for prognosis. There is no association
between diagnostic delay and the clinical phenotype of an indi-vidual patient, possibly indicating that this is part of the diseaserather than due to subsequent infection. Lymphoid malignancy isassociated with preexisting polyclonal lymphocytic infiltration, andcorrelates with serum IgM at diagnosis (although not IgG). Verylow serum IgG levels are not associated with increased numbers ofsevere infections prior to diagnosis. Autoimmunity is correlatedwith lower levels of CD8� cells. These observations provide a basisfor the development of more sophisticated prognostic indicatorsand will encourage further studies.
Acknowledgments
We thank Siraj Misbah for useful discussions as well as BerneFerry and Eduardo Lopes-Granados, who also read the manuscript.Benjamin Gattmann also helped to input data from Freiburg.
This work was supported by funding from the European Union5th Framework (grant EUROPID QLQ1-CT-2001-01395 to H.C.and L.H.), European Union 6th Framework (grant EUROPOLICYSP23-CT-2005-006411 to H.C. and B.G.), Baxter Healthcare(H.C.), the UK Primary Immunodeficiency Association (H.C.), theMinistry of Health of the Czech Republic (grant no. NR9035-4 toV.T.), the German Research Foundation (DFG grant GR1617/3)and the European Commission Marie-Curie grant MEXT-CT-2006-042316 (B.G.), the Jeffrey Modell Foundation (L.H. and H.C.), andthe Stockholm County Fund (L.H.).
Authorship
Contribution: H.C., J.B., L.H., and A.D.B.W. designed the study;M. Lucas and M.R.A. managed the database; M. Lucas, J.B., D.W.,B.G., C.F., V.T., and M.R.A. performed data entry; H.C., M. Lucas,M. Lee, and V.T. performed database analysis; and H.C., M. Lucas,M. Lee, L.H., V.T., and B.G. wrote the manuscript.
Conflict-of-interest disclosure: The authors declare no compet-ing financial interests.
Correspondence: Helen Chapel, Department of Clinical Immu-nology, Nuffield Department of Medicine, Level 4A, AcademicStreet, John Radcliffe Hospital, Oxford, United Kingdom; e-mail:[email protected].
References
1. Geha R, Notarangelo LD, Casanova JL, et al, In-ternational Union of Immunological Societies Pri-mary Immunodeficiency Diseases ClassificationCommittee. Primary immunodeficiency diseases:an update from the International Union of Immu-nological Societies Primary ImmunodeficiencyDiseases Classification Committee. J Allergy ClinImmunol. 2007;120:776-794.
2. Cunningham-Rundles C, Bodian C. Commonvariable immunodeficiency: clinical and immuno-logical features of 248 patients. Clin Immunol.1999;92:34-48.
3. van Zelm M, Reisli I, van der Burg M, et al. Anantibody-deficiency syndrome due to mutations inthe CD19 gene. N Engl J Med. 2006;354:1901-1912.
4. Salzer U, Maul-Pavicic A, Cunningham-RundlesC, et al. ICOS deficiency in patients with commonvariable immunodeficiency. Clin Immunol. 2004;113:234-240.
5. Pan-Hammarstrom Q, Salzer U, Du L, et al. Re-examining the role of TACI coding variants incommon variable immunodeficiency and selec-tive IgA deficiency. Nat Genet. 2007;39:429-430.
6. Sekine H, Ferreira, RC, Pan-Hammarstrom Q, etal. Role for Msh5 in the regulation of Ig classswitch recombination. Proc Natl Acad Sci U S A.2007;104:7193-7198.
7. Eastwood D, Gilmour KC, Nistala K, et al. Preva-lence of SAP gene defects in male patients diag-nosed with common variable immunodeficiency.Clin Exp Immunol. 2004;137:584-588.
8. Spickett GP, Webster AD, Farrant J. Cellular ab-normalities in common variable immunodefi-ciency. Immunodefic Rev. 1990;2:199-219.
9. Notarangelo L, Casanova JL, Conley ME, et al,International Union of Immunological SocietiesPrimary Immunodeficiency Diseases Classifica-tion Committee. Primary immunodeficiency dis-eases: an update from the International Union ofImmunological Societies Primary Immunodefi-ciency Diseases Classification Committee Meet-ing in Budapest, 2005. J Allergy Clin Immunol.2006;117:883-896.
10. Durandy A, Revy P, Fischer A. Autosomal hyper-IgM syndromes caused by an intrinsic B cell de-fect. In: Ochs, H, Smith CIE, Puck, JM. PrimaryImmunodeficiency Diseases: A Molecular and
Genetic Approach. New York: Oxford UniversityPress. 2007;269-278.
11. Farrant J. T and B cell defects in common vari-able immunodeficiency. Immunol Invest. 1991;20:143-150.
12. Goldacker S, Draeger R, Warnatz K, et al. Activevaccination in patients with common variable im-munodeficiency (CVID). Clin Immunol. 2007;124:294-303.
13. Warnatz K, Denz A, Drager R, et al. Severe defi-ciency of switched memory B cells (CD27�IgM-IgD-) in subgroups of patients with common vari-able immunodeficiency: a new approach toclassify a heterogeneous disease. Blood. 2002;99:1544-1551.
14. Carsetti R, Rosado MM, Donnanno S, et al. Theloss of IgM memory B cells correlates with clinicaldisease in common variable immunodeficiency. JAllergy Clin Immunol. 2005;115:412-417.
15. Grimbacher B, Hutloff A, Schlesier M, et al. Ho-mozygous loss of ICOS is associated with adult-onset common variable immunodeficiency. NatImmunol. 2003;4:261-268.
CLINICAL PHENOTYPING OF CVIDs 285BLOOD, 15 JULY 2008 � VOLUME 112, NUMBER 2
For personal use only. by guest on June 2, 2013. bloodjournal.hematologylibrary.orgFrom
16. Moratto DGA, Fontana S, Mori L, et al. Combineddecrease of defined B and T cell subsets in agroup of common variable immunodeficiency pa-tients. Clin Immunol. 2006;121:203-214.
17. Alachkar H, Taubenheim N, Haeney MR,Durandy A, Arkwright PD. Memory switched Bcell percentage and not serum immunoglobulinconcentration is associated with clinical complica-tions in children and adults with specific antibodydeficiency and common variable immunodefi-ciency. Clin Immunol. 2006;120:310-318.
18. Healy M, for the Medical Research Council work-ing party on hypogammaglobulinaemia. Hypo-gammaglobulinaemia in the United Kingdom: XIIStatistical analyses: prevalence, mortality andeffects of treatment. Special Report Series of theMedical Research Council (GB). 1971;310:115-123.
19. Quinti I, Soresina A, Sparado G, et al. Long-termfollow-up and outcome of a large cohort of pa-tients with common variable immunodeficiency.J Clin Immunol. 2007;27:308-316.
20. Conley M, Notarangelo LD, Etzioni A. Diagnosticcriteria for primary immunodeficiencies: repre-senting PAGID (Pan-American Group for Immu-nodeficiency) and ESID (European Society forImmunodeficiencies). Clin Immunol. 1999;93:190-197.
21. Government Actuary’s Department. Historic in-terim life tables. http://www.gad.gov.uk/Demog-raphy_Data/Life_Tables/Historical_Interim_life_tables.asp. Accessed January 12, 2008.
22. Hermaszewski R, Webster ABD. Primary hypo-gammaglobulinaemia: a survery of clinical mani-festations and complications. Q J Med. 1993;86:31-42.
23. Aghamohammadi AFA, Moin M, Rezaei N, et al.Clinical and immunological features of 65 Iranian
patients with common variable immunodeficiency.Clin Diag Lab Immunol. 2005;12:825-832.
24. Kainulainen L, Varpula M, Liippo K, Svedstrom E,Nikoskelainen J, Ruuskanen O. Pulmomary ab-normalities in patients with primary hypogamma-globulinaemia. J Allergy Clin Immunol. 1999;104:1031-1036.
25. Kokron CM, Errante PR, Barros MT, et al. Clinicaland laboratory aspects of common variable im-munodeficiency. An Acad Bras Cienc. 2004;76:707-726.
26. Morrell D, Chase CL, Swift M. Cancer and auto-immune disease in families with common variableimmune deficiency. Genet Epidemiol. 1986;3:17-26.
27. Muscaritoli M, Fanfarillo F, Luzi G, et al. Impairednutritional status in common variable immunode-ficiency patients correlates with reduced levels ofserum IgA and of circulating CD4� T lympho-cytes. Eur J Clin Invest. 2001;31:544-549.
28. Park JE, Beal I, Dilworth JP, Tormey V, HaddockJ. The HRCT appearances of granulomatous pul-monary disease in common variable immune de-ficiency. Eur J Radiol. 2005;54:359-364.
29. Sleasman JW. The association between immuno-deficiency and the development of autoimmunedisease. Adv Dent Res. 1996;10:57-61.
30. Sordet C, Cantagrel A, Schaeverbeke T, SibiliaJ. Bone and joint disease associated with primaryimmune deficiencies. Joint Bone Spine. 2005;72:503-514.
31. Spickett G, Prentice AG, Wallington T, WebsterAD, Chapel H. Alopecia totalis and vitiligo in com-mon variable immunodeficiency. Postgrad Med J.1991;67:291-294.
32. Thickett KM, Kumararatne DS, Banerjee AK,Dudley R, Stableforth DE. Common variable im-mune deficiency: respiratory manifestations, pul-
monary function and high-resolution CT scanfindings. Q J Med. 2002;95:655-662.
33. Langley R, Krueger G, Griffiths CEM. Psoriaticarthritis and psoriasis: classification, clinical fea-tures, pathophysiology, immunology, genetics,epidemiology, clinical features, and quality of life.Ann Rheum Dis. 2005;64:18-23.
34. Psaila B, Bussel JB. Immune thrombocytopenicpurpura. Hematol Oncol Clin North Am. 2007;21:743-759.
35. Bates C, Ellison MC, Lynch DA, Cool CD, BrownKK, Routes JM. Granulomatous lymphocytic lungdisease shortens survival in CVID. J Allergy ClinImmunol. 2004;114:415-421.
36. Wheat W, Cool SD, Morimoto Y, et al. Possiblerole of human herpes virus 8 in the lymphoprolif-erative disorders in CVIDs. J Exp Med. 2005;202:479-484.
37. Aghamohammadi A, Pouladi N, Parvaneh N, etal. Mortality and morbidity in common variableimmunodeficiency. J Trop Pediatr. 2007;53:32-38.
38. Seymour B, Miles J, Haeney M. Primary antibodydeficiency and diagnostic delay. J Clin Path.2005;58:546-547.
39. Ogershok P, Hogan MB, Welch JE, Corder WT,Wilson NW. Spectrum of illness in pediatric com-mon variable immunodeficiency. Ann AllergyAsthma Immunol. 2006;97:653-656.
40. Salzer U, Grimbacher B. Common variable immu-nodeficiency: the power of co-stimulation. SeminImmunol. 2006;18:337-346.
41. Wehr C, Kivioja T, Schmitt C, et al. The EURO-class trial: Defining subgroups in common vari-able immunodeficiency. Blood. 2008;111;77-85.
42. Fevang B, Ynestad A, Sandberg WJ, et al. Lownumbers of regulatory T cells in CVID: associa-tion with chronic inflammation. Clin Exp Immunol.2007;147:521-525.
286 CHAPEL et al BLOOD, 15 JULY 2008 � VOLUME 112, NUMBER 2
For personal use only. by guest on June 2, 2013. bloodjournal.hematologylibrary.orgFrom