GEO/LEO/SAR Flood Pilot
Guy Schumann, Remote Sensing Solutions
Mitch Goldberg, NOAA/NESDIS
Andrew Molthan, NASA
Dave Borges, NASA
WGDisasters-15 Meeting
Virtual Meeting
9 – 11 March 2021
Committee on Earth Observation Satellites
WGDisasters-15
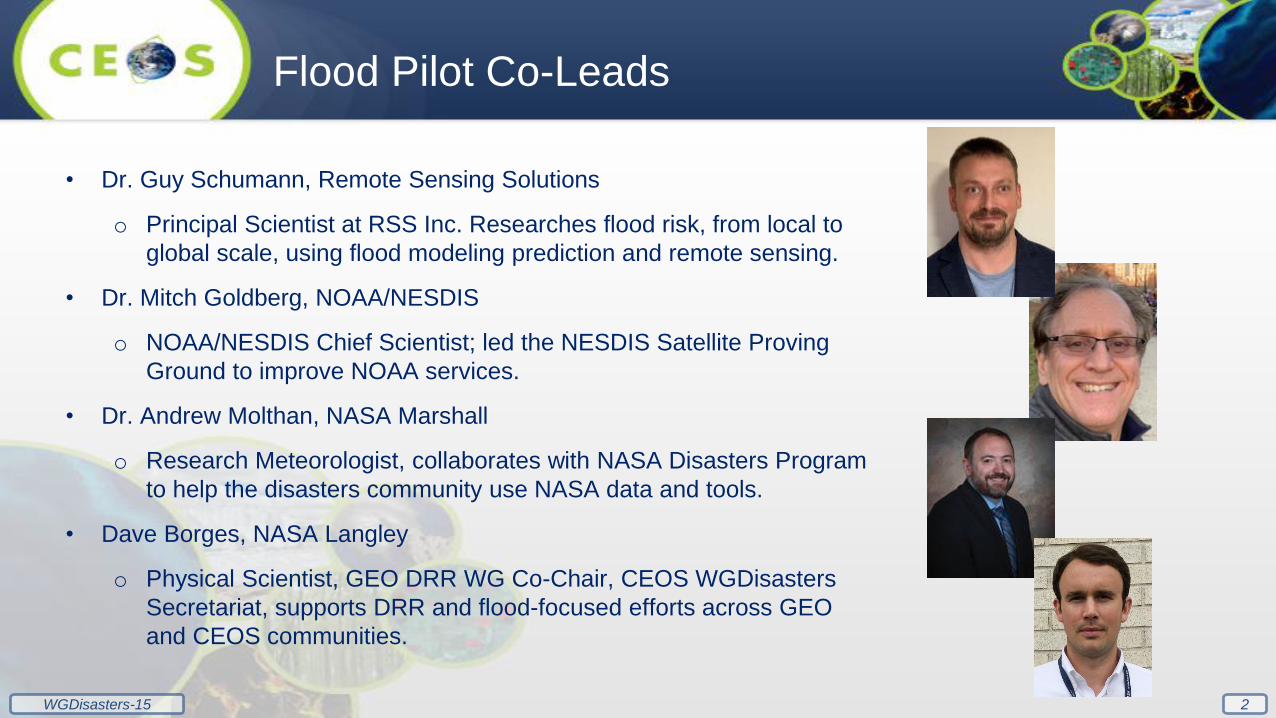
• Dr. Guy Schumann, Remote Sensing Solutions
o Principal Scientist at RSS Inc. Researches flood risk, from local to
global scale, using flood modeling prediction and remote sensing.
• Dr. Mitch Goldberg, NOAA/NESDIS
o NOAA/NESDIS Chief Scientist; led the NESDIS Satellite Proving
Ground to improve NOAA services.
• Dr. Andrew Molthan, NASA Marshall
o Research Meteorologist, collaborates with NASA Disasters Program
to help the disasters community use NASA data and tools.
• Dave Borges, NASA Langley
o Physical Scientist, GEO DRR WG Co-Chair, CEOS WGDisasters
Secretariat, supports DRR and flood-focused efforts across GEO
and CEOS communities.
Flood Pilot Co-Leads
2
WGDisasters-15 3
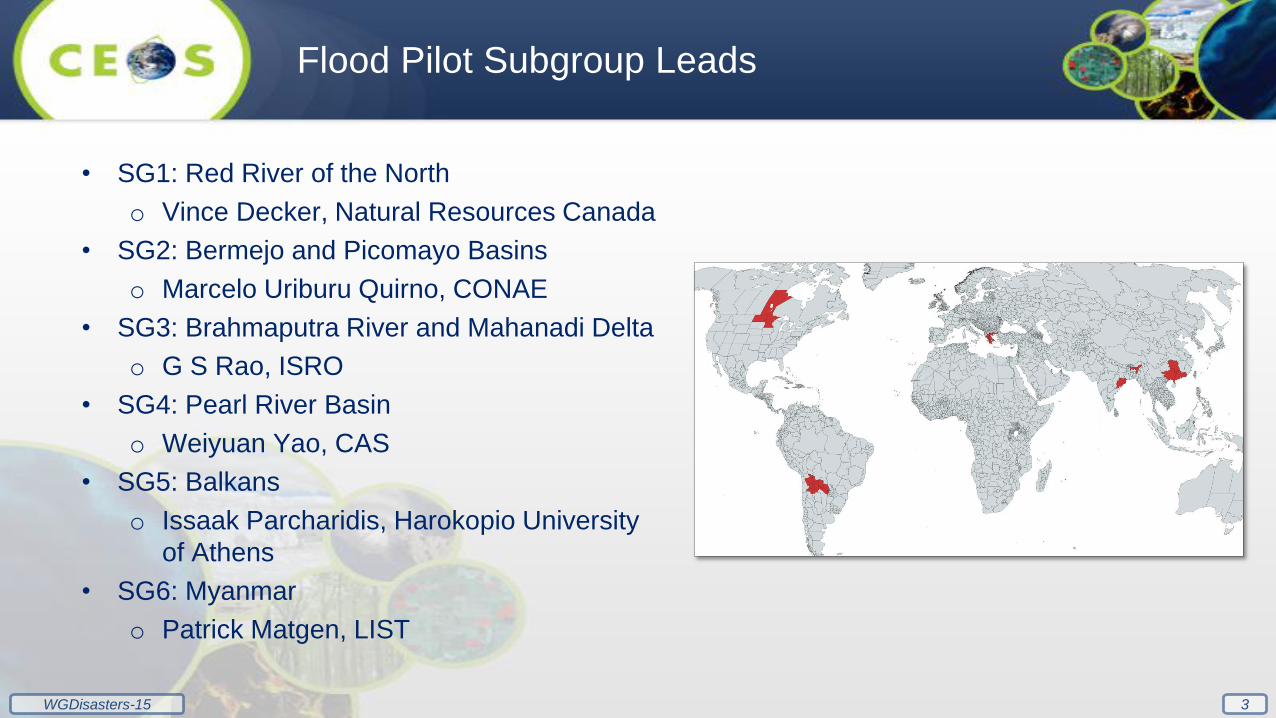
• SG1: Red River of the North
o Vince Decker, Natural Resources Canada
• SG2: Bermejo and Picomayo Basins
o Marcelo Uriburu Quirno, CONAE
• SG3: Brahmaputra River and Mahanadi Delta
o G S Rao, ISRO
• SG4: Pearl River Basin
o Weiyuan Yao, CAS
• SG5: Balkans
o Issaak Parcharidis, Harokopio University
of Athens
• SG6: Myanmar
o Patrick Matgen, LIST
Flood Pilot Subgroup Leads

WGDisasters-15 4
• WGDisasters Flood Pilot Implementation Plan was endorsed during the CEOS
2020 Plenary
• Key Milestones:
o 2020-21
Begin regional studies; collect data; establish relationships
o 2021-22
Provide derived products to users for feedback and explore refinement of
monitoring strategies. Initial evaluation of pilot results to GFP and
international conferences.
o 2022+
Develop reports from users on derived products, best practices, and
evaluate results from study sites. Explore whether broader EO strategies
can be developed.
Implementation Plan Endorsement
WGDisasters-15 5
Pilot Goals
• Objective A
o Solicit input from CEOS partnering agencies and participants on current and
upcoming efforts to map water and flood extent from diversity of LEO/GEO and
SAR contributions.
• Objective B
o Capture underlying requirements and future needs to sustain and improve upon
these capabilities.
• Objective C
o Explore ideal combination of LEO/GEO/SAR flood mapping outputs, using
representative regional events of interest to partners.
o Develop and document best practices for combining and sharing flood information
from multiple platforms with diversity in sensor, spatial/temporal resolution, etc.

WGDisasters-15 6
• CEOS Chair (NASA) 2021 Theme / Implementation Plan
o Space-based EO Data for Open Science and Decision Support
Develop a demonstration of a repository of data, methodologies and capacity building
resources for open science and decision support for flood research and applications, ensuring
relevance of outputs that can inform choices, support decisions, and guide actions using open
science principles for disaster risk reduction through partnership efforts with CEOS WGCapD
and stakeholder engagement. (DIS-20-06)
CEOS Chair 2021 Theme Alignment
WGDisasters-15 7
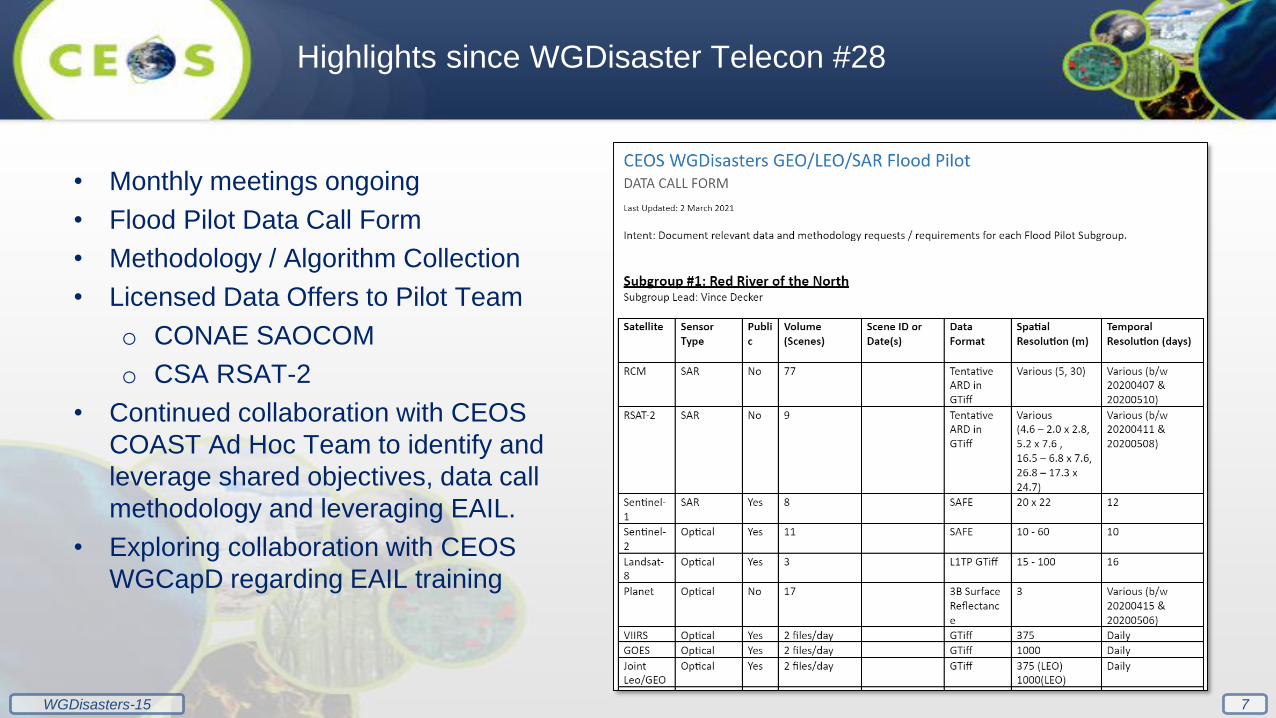
Highlights since WGDisaster Telecon #28
• Monthly meetings ongoing
• Flood Pilot Data Call Form
• Methodology / Algorithm Collection
• Licensed Data Offers to Pilot Team
o CONAE SAOCOM
o CSA RSAT-2
• Continued collaboration with CEOS
COAST Ad Hoc Team to identify and
leverage shared objectives, data call
methodology and leveraging EAIL.
• Exploring collaboration with CEOS
WGCapD regarding EAIL training

WGDisasters-15 8
• CEOS Earth Analytics
Interoperability Lab (WGISS, SEO)
• First EAIL deployed, initial access
will be rolling out to Pilot Team
soon
• Will serve as centralized sandbox
environment where entire Pilot
team can share methodologies and
data.
Leveraging CEOS EAIL

WGDisasters-15 9
Subgroup 1: Red River of the North
From the Natural Resources Canada/Red River of the North team:
• 77 RCM scenes used to create 20 flood maps between April 14th and May 10th
• Preliminary plans on algorithm sharing for community use and development

WGDisasters-15 10
Red River: Data Plan
RCMn=26 (77
frames)
RSAT-2n=6 (9 frames)
Sentinel-1n=4 (8 frames)
Sentinel-2n=7 (11
frames)
Landsat-8n=3
VIIRSn=34
GOESn=34
Planetn=5 (17
frames)
Apr May
2020
Apr 7 Apr 10 Apr 14 Apr 19 Apr 23 Apr 27 Apr 30 May 5 May 9
Apr 11 Apr 18 Apr 21 Apr 25 Apr 28 May 8
Apr 11 Apr 16 Apr 28 May 10
Apr 10 Apr 17 Apr 27 Apr 30 May 10Apr 15 Apr 22
Apr 17 Apr 24 May 10
May 3
Apr 15 Apr 17 Apr 22 May 6
Apr 7 Apr 10 Apr 13 Apr 16 Apr 19 Apr 22 Apr 25 Apr 28 May 1 May 4 May 7 May 10
Apr 7 Apr 10 Apr 13 Apr 16 Apr 19 Apr 22 Apr 25 Apr 28 May 1 May 4 May 7 May 10
Peak Flood
Legend:
Stripmap 5m Dual-Pol
Stripmap 5m & 30m Compact-Pol
Standard & Ultra-fine
Fine Quad Wide
Interferometric Wide
Multispectral L1C
LC08 L1TP
PlanetScope 3m Multispectral
VIIRS
GOESCloud-free data TBD
Red River of the North Team / NRCan have demonstrated their need and goals for
multi-platform and partner data supporting analysis in the 2020 event and year
Next Steps
• Leverage the CEOS data interoperability/sharing platform with all relevant
available Red River data.
• Bring code to the infrastructure & collaborate towards improving existing
mapping tools: open water, flooded vegetation, urban and critical
infrastructure, multi-platform downscaling, identify gaps, etc…
• RSAT-2 availability with an open license being discussed.
• Have a ready to use conditioned trans-boundary high resolution DEM.
• Fill data gaps and promote cross sensor validation with other LEO platforms.
11
WGDisasters-15 12
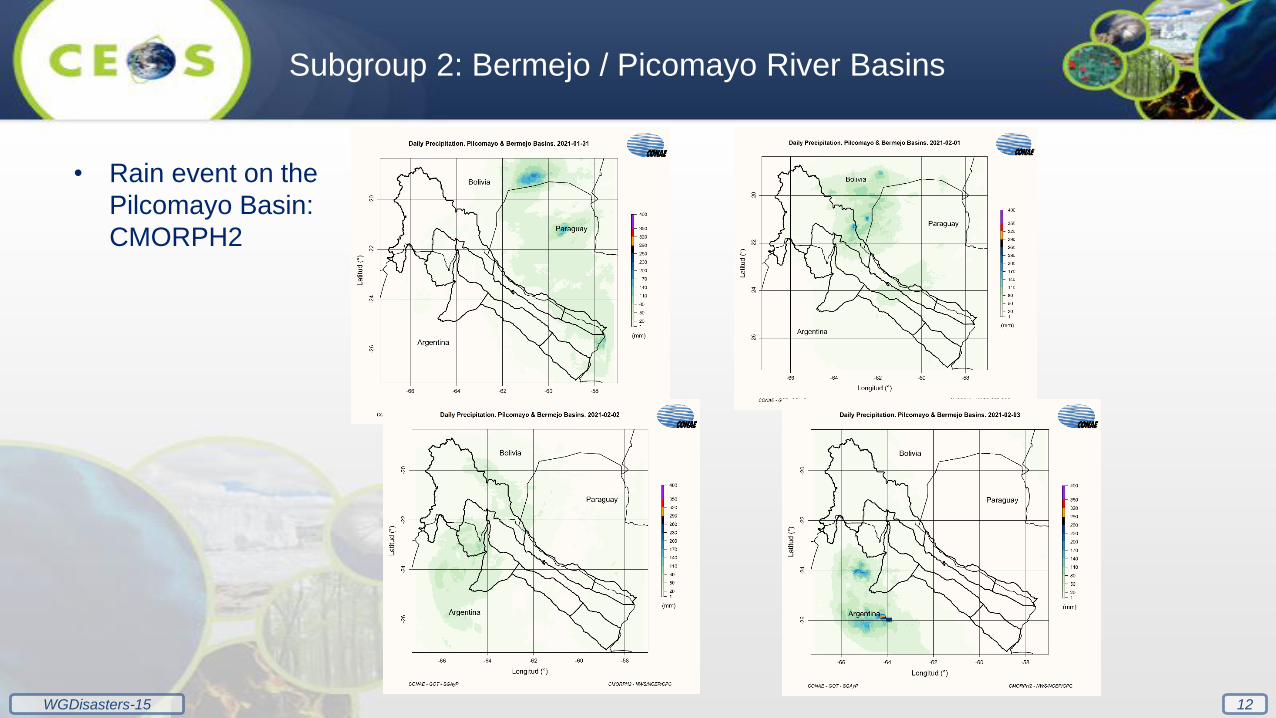
• Rain event on the
Pilcomayo Basin:
CMORPH2
Subgroup 2: Bermejo / Picomayo River Basins

WGDisasters-15 13
Rain event on the Pilcomayo Basin
ABI/VIIRS Flood Product
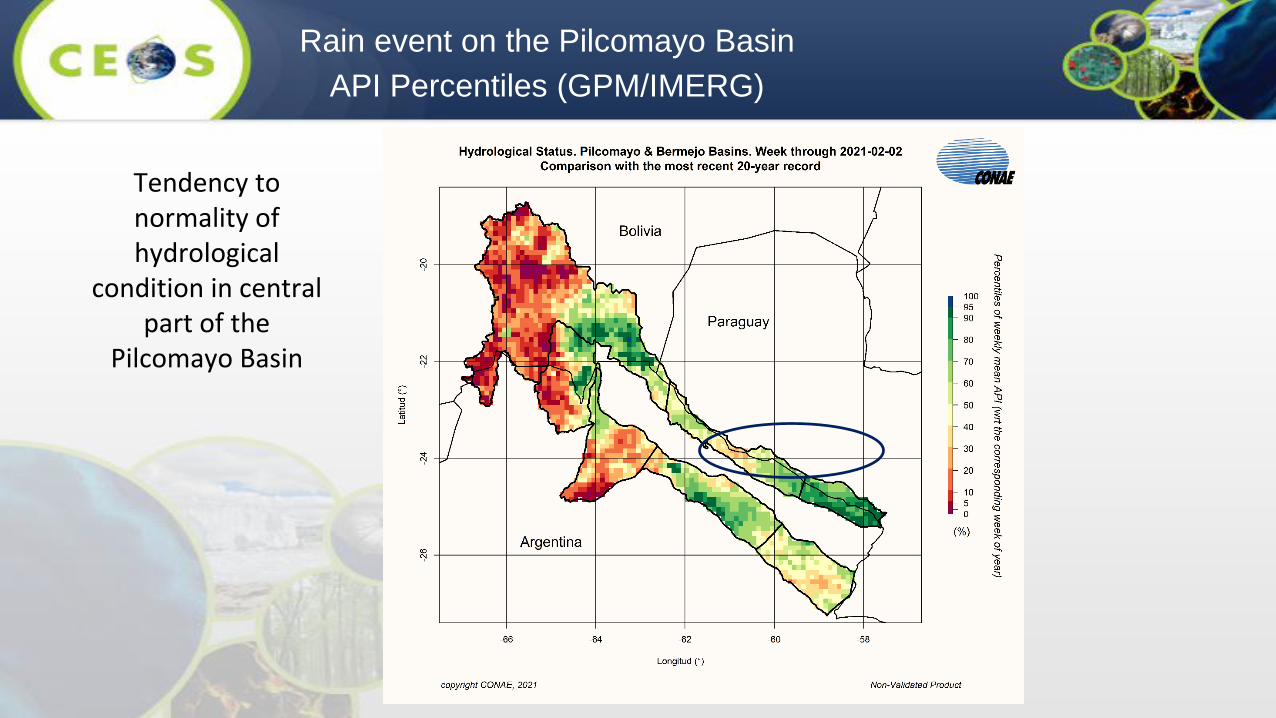
Rain event on the Pilcomayo Basin
API Percentiles (GPM/IMERG)
Tendency to normality of hydrological
condition in central part of the
Pilcomayo Basin

WGDisasters-15 15
Progress: Pilcomayo and Bermejo
QUARTERS
DELIVERABLES Q1 Q2 Q3 Q4 Q5 Q6 Q7 Q8 Q9 Q10 Q11 Q12
Pre – event monitoring of basin antecedent conditions
Hydrological status. Percentiles of weekly mean API (GPM and TRMM) #Daily API, as a proxy of soil moisture (GPM) #Satellite rainfall estimates (GEO Hydro-estimator, LEO GPM) #
Post – event assessments
Flood extent maps with SAR (SAOCOM, COSMO-SkyMed, Sentinel-1) #Flood extent mapping with GEO + LEO (Joint ABI/VIIRS Flood Product) #Impact of flood waves on bridges #Inundation depths #
Flood Risk Analysis
Flood extent frequency maps (LEO, optical and SAR) #Land use / land cover (NDVI, EVI, RVI, optical classification) #Digital elevation models for specific reaches #Support to vulnerability and exposure assessments #
#: MILESTONES FOR DELIVERABLES
Progress of these products in good agreement with Gantt chart
CONAE-led team for Pilcomayo and Bermejo Transboundary Basins area of interest
continues progress in line with expected contributions. Data requests submitted.

WGDisasters-15 16
Subgroup 3: Brahmaputra River & Mahanadi Delta
Aggregate Flood MapsRecent Floods in India
• Difficulties in providing daily updates, complete updates

WGDisasters-15 17
• LEO Satellites
o Optical – Multi-Spectral- NDWI
o Optical – Cloud Cover, Limited Coverage
• GEO Satellites
o Optical – Highly temporal
o Optical – Cloud Cover, Low resolution,
• Synthetic Aperture Radar (SAR)
o SAR – All weather-Backscatter Threshold
o SAR – Hill shadows, Winds, Protruding vegetation, Problems due to thick clouds, …
• Passive Microwave – Very Low Resolution
• Digital Elevation Models – Less utilized
• Others – Alti-meter, River Gauges
Subgroup 3: GEO/LEO/SAR Data considered

Improved Flood Mapping
1. Feasibility of integrating LEO-GEO-SAR-DEM-Other Datasets
2. Indian Case Study: Brahmaputra River (Assam State)
Grid-wise
Flood
SusceptibilityModel
3
Integrate
4
DEM,
WL
1LEO
Optical
LEO
SAR Model
High Res.
Water
Layer
2GEO
Optical
Passive
MicrowaveModel
Low Res.
Water
Fraction
Improved
Flood
Extent
LEO
WGDisasters-15 19
• Daily / Sub-daily Flood Inundation
• Inundation for complete State / District
• Flood depth maps
• Pending Actions
o Methodology Finalization
o Action Plan Preparation
Subgroup 3: Expected Outcomes

WGDisasters-15 20
Subgroup 4: Pearl River Basin
Status and Level of Effort
Expected Outcomes
Data Needs, Challenges, and Risks
• The Pearl River Basin
experiences heavy
rainfall from coastal
storms (cyclones,
typhoons) and heavy
interior rainfall events
• Events have included
Typhoon Rumbia and
other major storms in
the region
• Leverage imagery from Chinese optical
remote sensing satellites
• GF4, HJ, ZY, each providing resolutions of 5-
30 m and multispectral bands of VIS-MWIR
• Explore benefits of using GF3, a multi-
polarized C-band SAR sensor offering
resolutions of 5-50 m
• Leads: Chinese Academy of Sciences (CAS)
• Regions of interest and some preliminary events
have been identified in 2018, may also be able to
use most recent flooding event in 2020.
• Collaborations with other data partners on any
available in situ data for validation, imagery
collections through partners and/or the Charter
• Expecting heavy use of Chinese / China
Academy of Space Technology assets for optical
and including SAR imaging capabilities
NASA MODIS via Worldview
WGDisasters-15 21
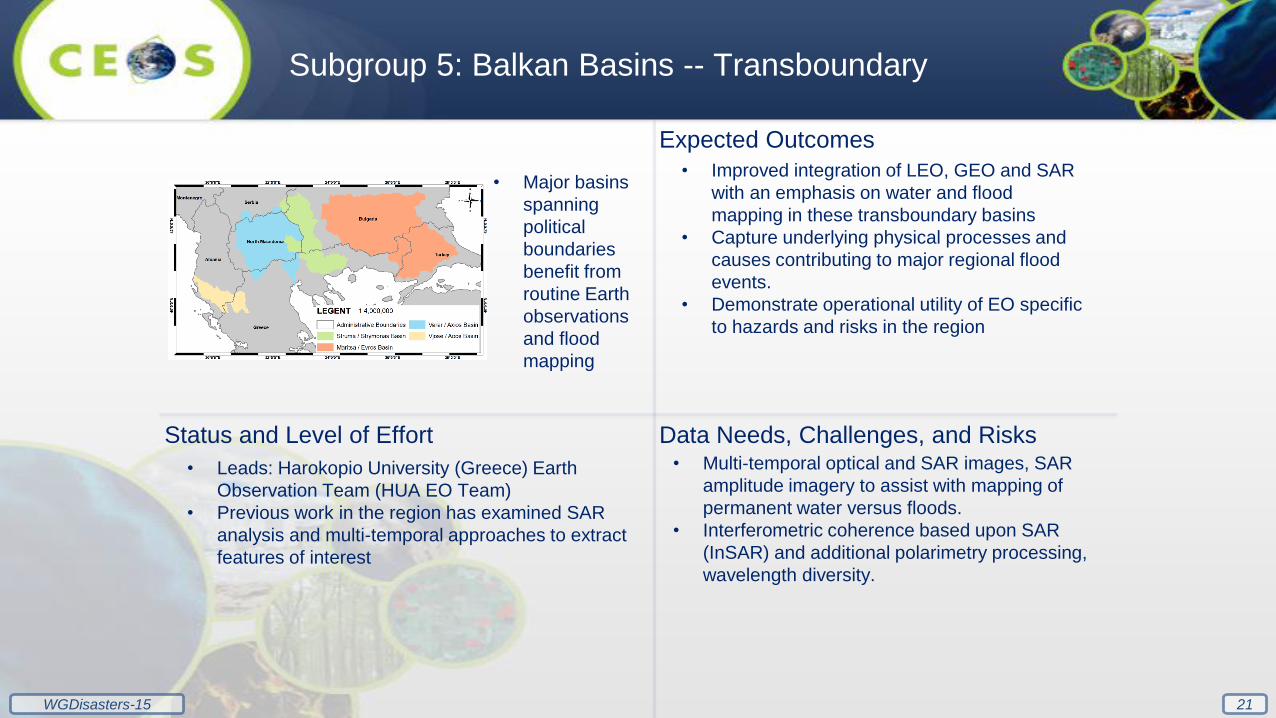
Subgroup 5: Balkan Basins -- Transboundary
Status and Level of Effort
Expected Outcomes
Data Needs, Challenges, and Risks
• Major basins
spanning
political
boundaries
benefit from
routine Earth
observations
and flood
mapping
• Improved integration of LEO, GEO and SAR
with an emphasis on water and flood
mapping in these transboundary basins
• Capture underlying physical processes and
causes contributing to major regional flood
events.
• Demonstrate operational utility of EO specific
to hazards and risks in the region
• Leads: Harokopio University (Greece) Earth
Observation Team (HUA EO Team)
• Previous work in the region has examined SAR
analysis and multi-temporal approaches to extract
features of interest
• Multi-temporal optical and SAR images, SAR
amplitude imagery to assist with mapping of
permanent water versus floods.
• Interferometric coherence based upon SAR
(InSAR) and additional polarimetry processing,
wavelength diversity.

WGDisasters-15 22
Subgroup 6: Myanmar
Status and Level of Effort
Expected Outcomes
Data Needs, Challenges, and Risks
• Seeking to
understand flood
risk at large scales
and establish risk
profiles via satellite
archive.
• Strengthen
emergency
response efforts.
• Partner with the World Bank to enhance use
of satellite-derived information in the disaster
risk financing sector for SE Asia
• Strengthen emergency response through
parametric insurance modeling that looks to
expedite pay-out based upon clear and
transparent rule sets
• Use multi-temporal SAR and other
complementary images to improve water
mapping
• Leads: Luxembourg Institute of Science and
Technology (LIST)
• Past work has examined mapping the extent of
permanent water bodies, separating permanent
water from flood extent, and relating flood events
to impacts via population and other human
settlement information
• Adapting InSAR coherence imagery to improve
the performance of flood detections in urban
areas and the urban-suburban-rural interfaces,
also for regions with extensive vegetation
• Increased sampling rate of imagery over the
region through a multi-sensor approach (e.g.
incorporate Radarsat-2, Sentinel, others) as well
as combined radar and optical data
• Explore additional L-band wavelengths to
improve detections within vegetated regions and
to prep for ESA’s ROSE-L mission

WGDisasters-15 23
• Finalize Flood Pilot Data Call Form to include data formats and temporal/scene details.
• Address outstanding licensed data sharing opportunities with CSA & CONAE.
• Continue collaboration with CEOS WGISS & SEO to roll out Flood Pilot EAIL.
• Pilot data and algorithm aggregation within EAIL.
• Continue close collaboration with CEOS COAST Ad Hoc Team.
o Specifically their ‘Sea to Land’ Subgroup focused on coastal inundation.
• Documentation of methodologies, successes, challenges to inform Pilot Deliverables to
include GEO/LEO/SAR data fusion towards improved flood mapping.
• Questions / Discussion
Upcoming Activities