‘Colitis’ treatment and control(The grey scour syndrome)
David Burch
Octagon Services Ltd

Overview
• Diseases – organisms• Sensitivity - MICs – MBCs,• Resistance / Breakpoints• Medications• Pharmacokinetics (PK) – in the gut• Efficacy• Immunity• Approaches to control

Overview – diseases and organisms
• Brachyspira pilosicoli
• B. hyodysenteriae• Lawsonia intracellularis
• S. enterica Typhimurium• Y. enterocolitica• E. coli• Clostridium perfringens
• Spirochaetal diarrhoea (colitis)
• Swine dysentery• Porcine proliferative
enteropathy (ileitis)• Salmonellosis• Yersinia• Collibacillosis• Clostridium

Infectious causes of colitis and their incidence (Thomson et al, 1998)
Organism Single Mixed Total Ident(%)
Farms (%)
B. pilosicoli 21 23 44 39 52
Atypical B. hyo 7 2 9 8 11
B. hyodysenteriae 6 3 9 8 11
L. intracellularis 3 10 13 12 15
Salmonella spp 4 8 12 11 14
Y. pseudotuberculosis 4 13 17 15 20
E. coli 1 5 6 5 7
C. perfringens 0 2 2 2 2

Conclusions• B. pilosicoli may be more widespread than
thought (Scottish phenomenon – doubt it?)• Lawsonia may be less problematic than we
expect (95% farms, 62% pigs - Mortimer et al, 2000) - (Control measures good – Salinomycin, CTC & Tylosin?) – acute deaths (PHE)
• B. hyodysenteriae low – good - severity• Salmonella – on-going problem (PMWS)• Yersinia?• Others?

Comparative effects of Brachyspira on production (Thomson et al, 2003)
Group Feature Clinical score (%)
Path score (%)
ADG (g)
ADG (%)
Control Uninfected 0 1 810 -
B. hyodysenteriae Path form 29 45 590 -27
B. hyodysenteriae Mild form 8 16 740 -9
B. pilosicoli - 10 19 710 -12

Bacterial susceptibility to antimicrobials• Sensitivity discs – plate test – zone diameter (13mm VLA) –
sensitive / intermediate / resistant• Minimum inhibitory concentrations (MICs)
– Level of antimicrobial that prevents growth– Plate dilution tests - antibiotic in the agar – less sensitive– Broth dilution – doubling dilutions – can be very sensitive
• Minimum bactericidal concentrations (MBCs)– Usually broth culture and sub-culture to plate or broth– Level of drug that prevents growth on sub-culture
• Bacteriostatics – macrolides, lincosamides, pleuromutilins, tetracyclines– MBC/MIC can be very large
• Bactericidals – Aminoglycosides, aminocyclitols, fluoroquinolones, penicillins, trimethoprim/sulphas– MBC/MIC small or the same

MICs against B. hyodysenteriae (76 isolates)(Karlsson et al, 2002)
Antibiotic MIC 50 (µg/ml) MIC 90 (µg/ml) Range (µg/ml)
Valnemulin 0.031 0.5 ≤0.016 - 2.0
Tiamulin 0.125 1.0 ≤0.016 - 2.0
Lincomycin 16 64 ≤1.0 - 64
Tylosin >256 >256 ≤2.0- >256
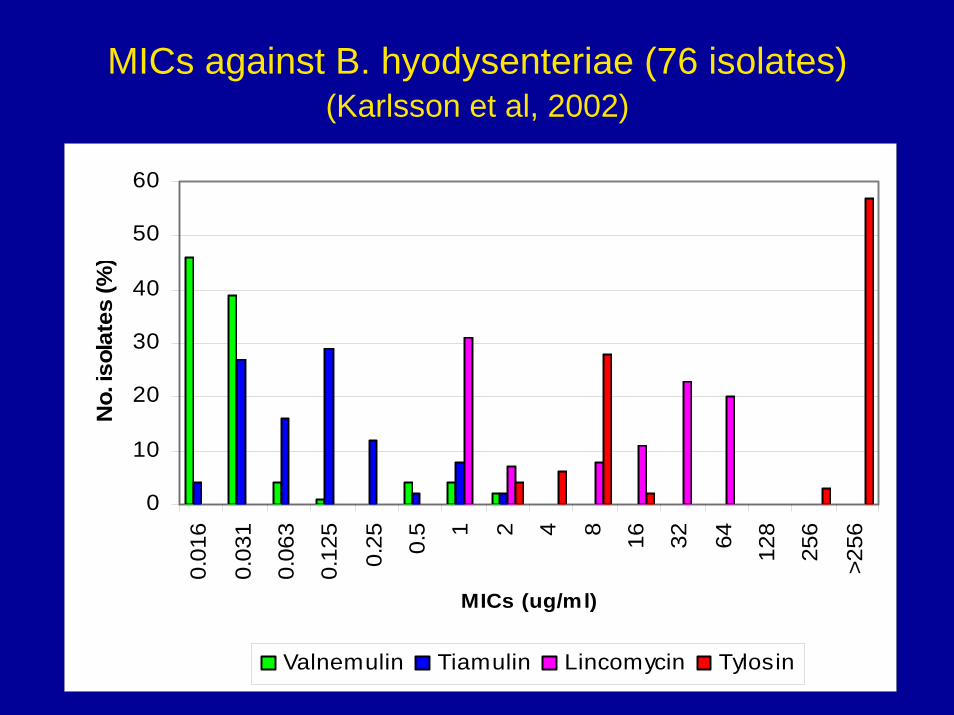
MICs against B. hyodysenteriae (76 isolates)(Karlsson et al, 2002)
0
10
20
30
40
50
600.
016
0.03
1
0.06
3
0.12
5
0.25 0.5 1 2 4 8 16 32 64 128
256
>256
MICs (ug/ml)
No.
isol
ates
(%)
Valnemulin Tiamulin Lincomycin Tylosin

Sensitivity – breakpoints (Ronne and Szancer, 1990)
Antimicrobial MIC breakpoints (µg/ml)
Sensitive Intermediate Resistant
Tiamulin ≤1 >1 - 4 >4
Lincomycin ≤4 >4 – 36 >36
Tylosin ≤1 (8) >1 – 4 (8 -16) >4 (>16)
Dimetridazole ≤8 >8-16 >16

Sensitivity/breakpoints - comments
• Ronne and Szancer are about right for tiamulin, lincomycin and dimetridazole
• Probably a bit low for tylosin (>16?)• Valnemulin breaks lower than tiamulin?• Precision difficult• Difference in susceptibility patterns – waves• Dosage/concentration effect in gut• Mutations – change to site of activity• Resistance – Step to Jump (tylosin)

MICs B. pilosicoli (25 isolates)(Kinyon et al, 2002)
Antibiotic(Breakpoint)
MIC 50 (µg/ml) MIC 90 (µg/ml) Range (µg/ml)
Valnemulin(>4)
0.06 0.5 0.03 - 2.0
Tiamulin(>4)
0.125 1.0 0.06 - 8.0
Lincomycin(>36)
32 64 >512
Tylosin(>16)
>512 >512 <16 - >512
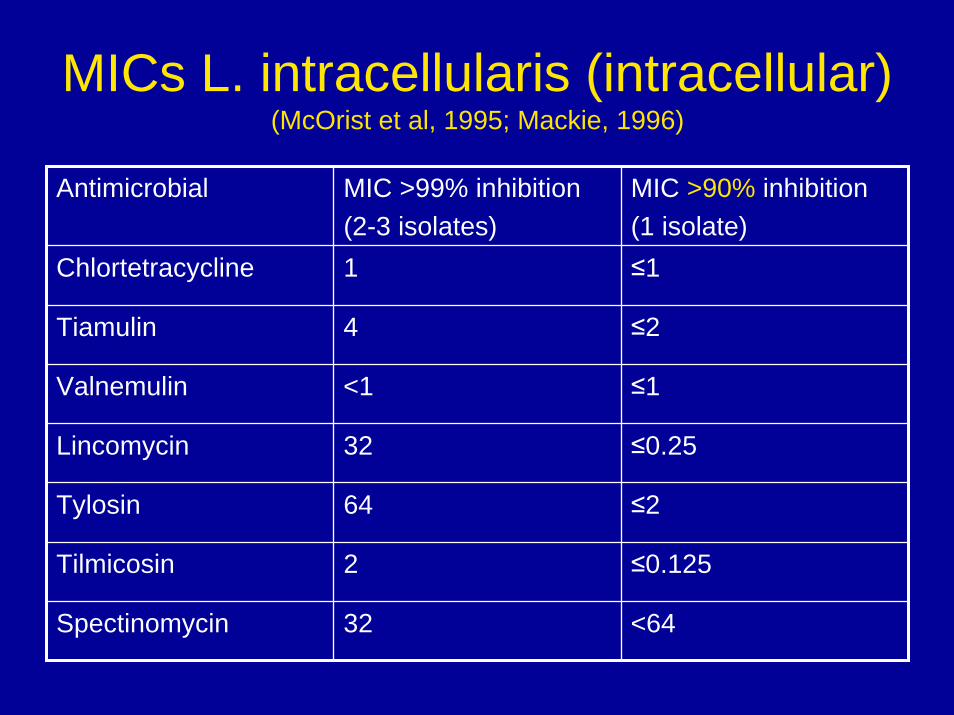
MICs L. intracellularis (intracellular)(McOrist et al, 1995; Mackie, 1996)
Antimicrobial MIC >99% inhibition(2-3 isolates)
MIC >90% inhibition(1 isolate)
Chlortetracycline 1 ≤1
Tiamulin 4 ≤2
Valnemulin <1 ≤1
Lincomycin 32 ≤0.25
Tylosin 64 ≤2
Tilmicosin 2 ≤0.125
Spectinomycin 32 <64

MICs L. intracellularis (intracellular)(McOrist et al, 1995; Mackie, 1996)
• Intracellular MICs – bathe infected cells in antibiotic for 6 days – difficult work
• It is a bio-model – like gut being bathed in medication – intracellular concentration of AM required
• MIC 99% - could not correlate with AM concentrations in the small intestine
• MIC 90% - demonstrates strong inhibitory bio-effect – correlates quite well

Intracellular/extracellular inhibitory effect of tylosin (MIC 99% 64µg/ml) (Mackie, 1996)
0102030405060708090
100
0 4 8 12 16Tylosin (ug/ml)
Inhi
bitio
n (%
)
MIC Intacellular(51/89) MIC Extracellular(51/89) MBC Intracellular(1482/89)

Other organisms – resistance (%)Antimicrobial(Disc strength)
Salmonella spp(VLA, 2003)
E. coli(VLA, 2004)
Y. enterocolitica(Fossler et al, 1996) MIC
Ampicillin (10ug) 61 44 97
Tetracycline (10ug) 84 90 50
Neomycin (10ug) 7 10 0
Apramycin (15ug) 5 11 0
Trimethoprim/S (25ug) 63 49 0
Enrofloxacin (5ug) 0 4 0
Spectinomycin (Laperle et al, 1996)
44 69 0

‘Colitis’ medications and dosage rates
Antimicrobial Injection Water Feed
Treat Treat Treat Prevent
Tylosin 2-10 25 3-6 (5) 3-6 (2)
Lincomycin 10 4.5 5.5 2.2
LINCO/spectin - 3.3 2.2 1.1
Linco/SPECTIN - 6.7 2.2 1.1
Tiamulin 10 8.8 5 2
Valnemulin - - 3.75 1.25

‘Colitis’ medications and dosage rates
Antimicrobial Injection Water Feed
Treat Treat Treat
Amoxycillin 7 10 15
Apramycin - 7.5-12.5 4-8
Neomycin - 11 11
Trimethoprim/S 15 30 15
Chlortetracycline - 10-20 10-20
Oxytetracycline 10-20 10-30 20
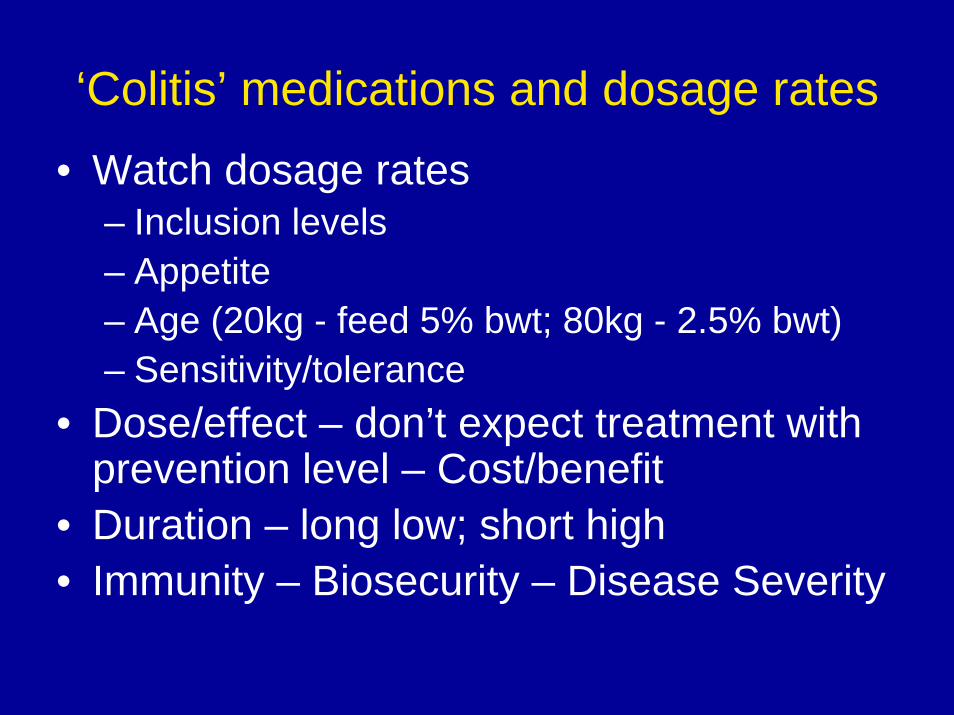
‘Colitis’ medications and dosage rates• Watch dosage rates
– Inclusion levels – Appetite– Age (20kg - feed 5% bwt; 80kg - 2.5% bwt)– Sensitivity/tolerance
• Dose/effect – don’t expect treatment with prevention level – Cost/benefit
• Duration – long low; short high• Immunity – Biosecurity – Disease Severity

Gut pharmacokinetics – single feed(Clemens et al, 1975)
-20
0
20
40
60
80
100
0 4 8 12 16 20 24
Hours
Dose
(%)
Stomach Ileum Caecum Colon

Gut pharmacokinetics – single feed(Clemens et al, 1975)
-10
0
10
20
30
40
50
0 4 8 12 16
Hours
Dos
e (%
)
Ileum Colon

Gut pharmacokinetics• Simple rules of thumb
– Feed to faeces 1kg to 0.4 kg = X 2.5• Non-absorbed products - eg spectinomycin approx
44ppm in feed could give 110ppm in colon• Absorbed products – eg valnemulin 75ppm in feed
gives 1.68ppm in colon– Colon contents to ileal contents (rolling
means) = ÷ 4• eg spectinomycin 27.5ppm• eg valnemulin 0.42ppm
– Approaching MICs for Lawsonia

Efficacy – dose titration valnemulin for the prevention of SD (Burrows et al, 1996)
0102030405060708090
100
0 2 4 6 8 10 12 14 16 18 20
Valnemulin conc. (ppm)
Prot
ectio
n (%
)
Protection SD Protection lesions Protection B. hyo

Efficacy – dose titration valnemulin for the treatment of SD (Burrows et al 1996)
0102030405060708090
100
0 10 20 30 40 50 60 70 80 90 100
Valnemulin inclusion level (ppm)
Prot
ectio
n (%
)
Protection SD Protection lesions Protection B. hyo

SD treatment conclusions
• Prevention is a valid claim - dose/effect• Prevention low dose – can control infection• Treatment higher dose (10 times prevention)
– More organisms– Deeper infection– Drug concentration gradient– Higher risk of incomplete elimination?– Higher risk of resistance?
• Eradication potential – bactericidal levels

Spirochaetes in a colonic crypt(Thomson 2004)
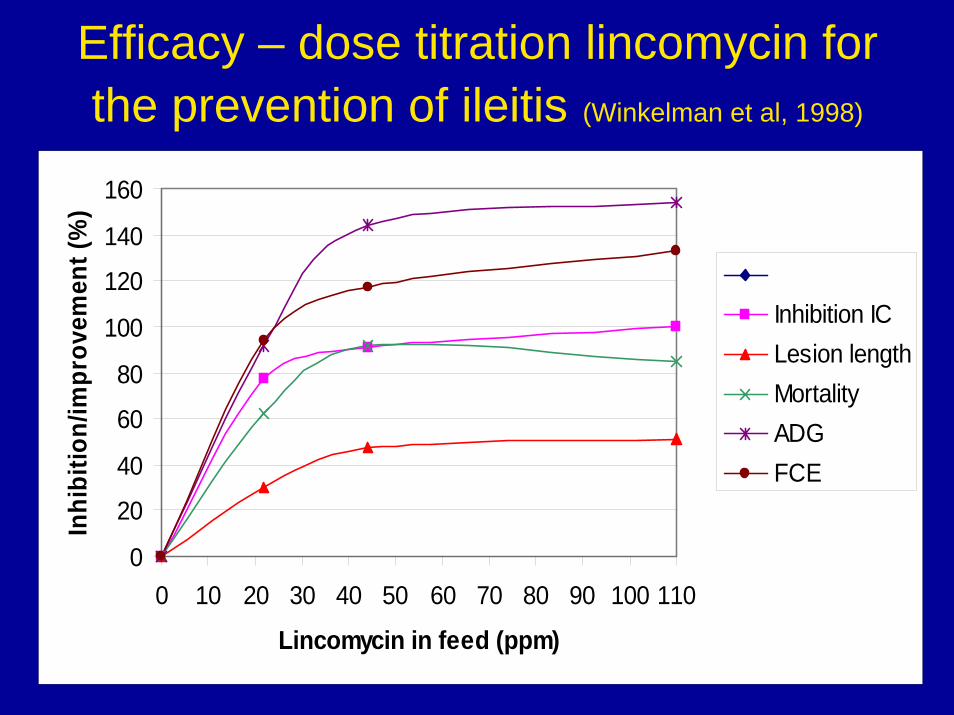
Efficacy – dose titration lincomycin for the prevention of ileitis (Winkelman et al, 1998)
0
20
40
60
80
100
120
140
160
0 10 20 30 40 50 60 70 80 90 100 110
Lincomycin in feed (ppm)
Inhi
bitio
n/im
prov
emen
t (%
)
Inhibition ICLesion lengthMortalityADGFCE

Ileitis prevention conclusions
• Good dose/effect correlation with intracellular MIC and in feed level
• Lincomycin 22ppm too low • Lincomycin 44ppm and above good effect,
little improvement as dose increases to 110ppm
• Lincomycin 220ppm in feed, 25ppm in ileum and 101ppm in colon (DeGeeter et al, 1980)

Immunity• Immunity can develop usually 2 weeks after
infection– Ileitis (L. intracellularis)– Colitis (B. pilosicoli)
• Self cure seen• Performance deterioration though• Prolonged protection• Strategic medication – moderate disease • Antibiotic resistance?

Colitis prevention trial (Glossop et al, 2000)
00.10.20.30.40.50.60.70.80.9
1
0 7 14 21 28
Days
Mea
n di
arrh
oea
scor
e
Control Valnemulin 25ppm

Ileitis treatment trial (Jones et al, 2004)
00.10.20.30.40.50.60.70.80.9
11.1
0 7 14
Days
Ave
diar
rhoe
a sc
ore
Control Valnemulin 75ppm

Ileitis patterns of infection (McOrist, 2004)
0102030405060708090
100
4 6 8 10 12 14 16 18 20 22 24
Weeks of age
Ser
o-po
sitiv
es (%
)
Chronic form (PIA) Acute form (PHE)

Approaches to ‘colitis’ control• Eliminate infections
– Eradication – SD done, difficult ileitis, colitis (Bp), salmonella
– High level treatment short period at break in production on entry to the finishers
– When move to clean buildings (poultry approach)– Water medication may be better approach
• Higher levels• Better kill• Better control – timing, duration and levels

Approaches to ‘colitis’ control
• Long term low level approach– Salinomycin (GPs) all the time– Tylosin all the time?
• Acceptability any more?– Processors / supermarkets– Banning GPs– Reduction in AB usage

Approaches to ‘colitis’ control• Strategic use plus immunity (unclean units)
– Allow some disease to build immunity– Use ABs strategically to bring infection under control to reduce
production losses– Not suitable for severe diseases such as SD– Possible for Ileitis and Colitis?
• Need history and good diagnostics – source/batch basis– Lowest common denominator
• Medication built in with other disease patterns on unit eg respiratory (CTC, TMPS, EP vaccination)– High, low level– In feed (routine / delays / mills) or water – even injectables– Timing – on arrival – when disease expected? – Duration – infection dies out LI 14 days, Bp 28 days, Bh 60days– Medication selection
• Production performance / cost / value

Thank you for your kind attention
For further informationVisit
www.octagon-services.co.uk