Clinical Applications of
Chest Sonography
Professor Gamal Agmy, MD, FCCP
Professor of chest diseases, Assiut University

• Diagnostic ultrasonography
is the only clinical imaging
technology currently in use
that does not depend on
electromagnetic radiation.
• U/S probes emit and
receive the energy as
waves to form pictures
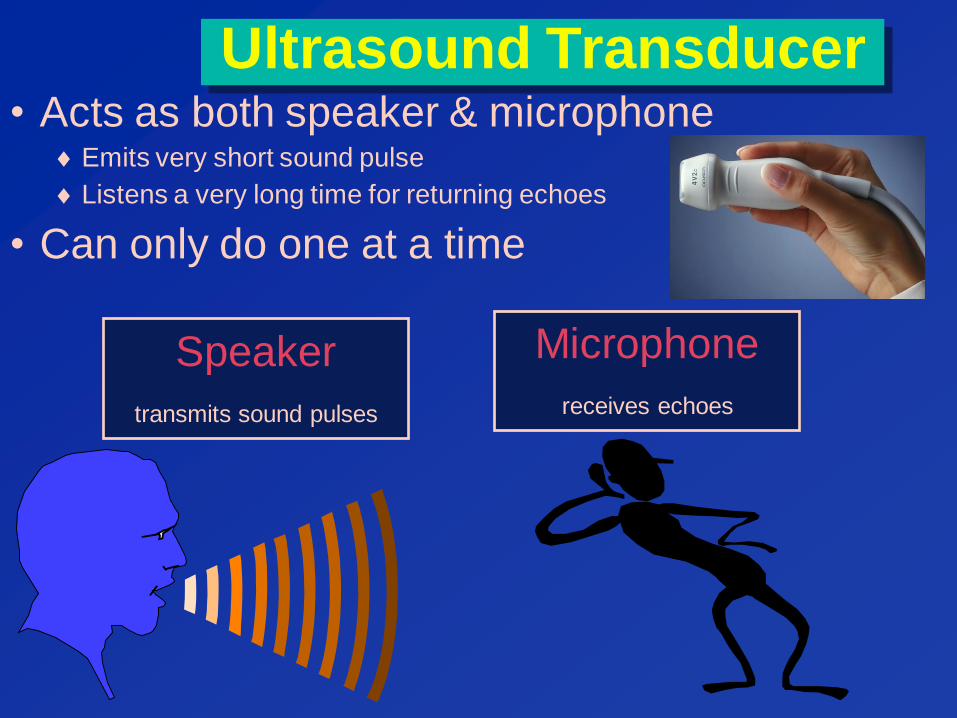
Ultrasound Transducer
Speaker
transmits sound pulses
Microphone
receives echoes
• Acts as both speaker & microphone Emits very short sound pulse
Listens a very long time for returning echoes
• Can only do one at a time

• Immediate bedside availability
• Immediate bedside repeatability
• Rapid goal directed application
• Cost saving
• Reduction in radiation exposure
Advantages of Transthoracic
Ultrasonography
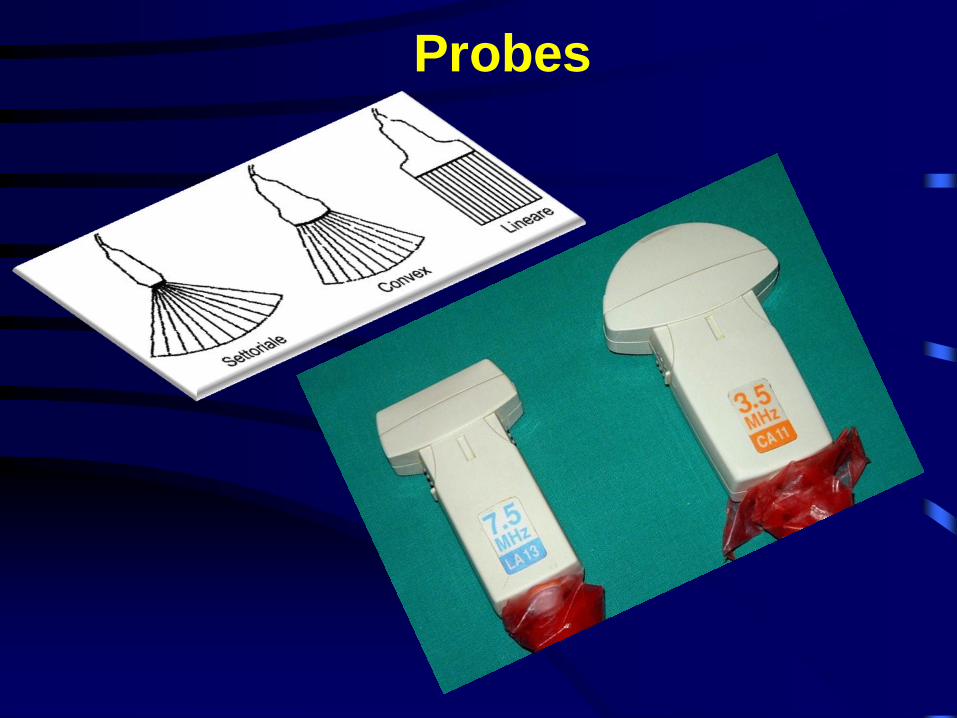
Probes
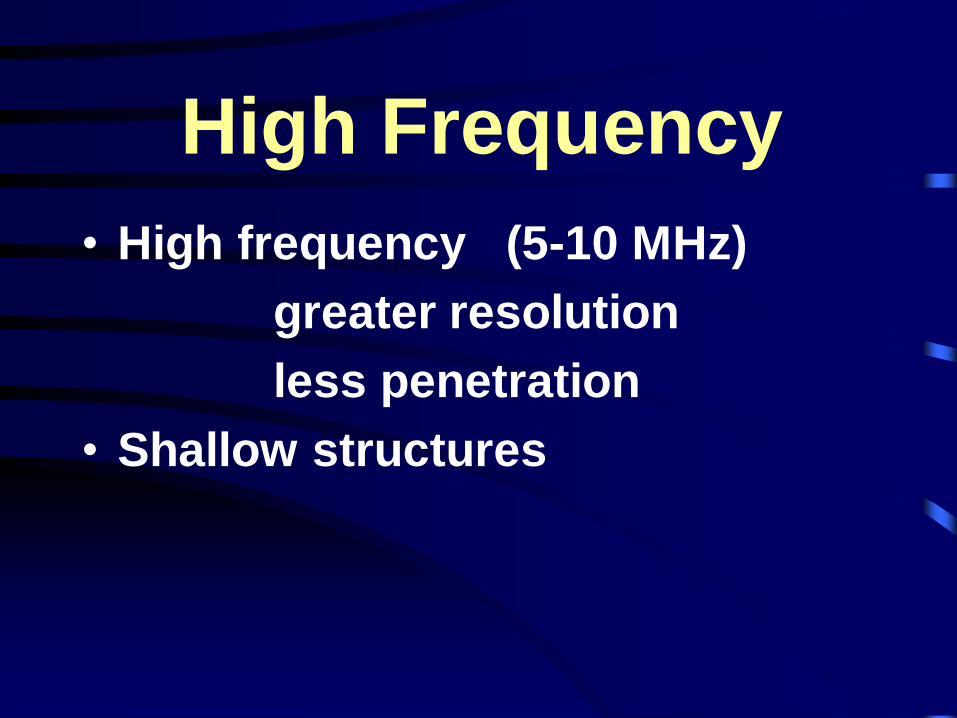
High Frequency
• High frequency (5-10 MHz)
greater resolution
less penetration
• Shallow structures
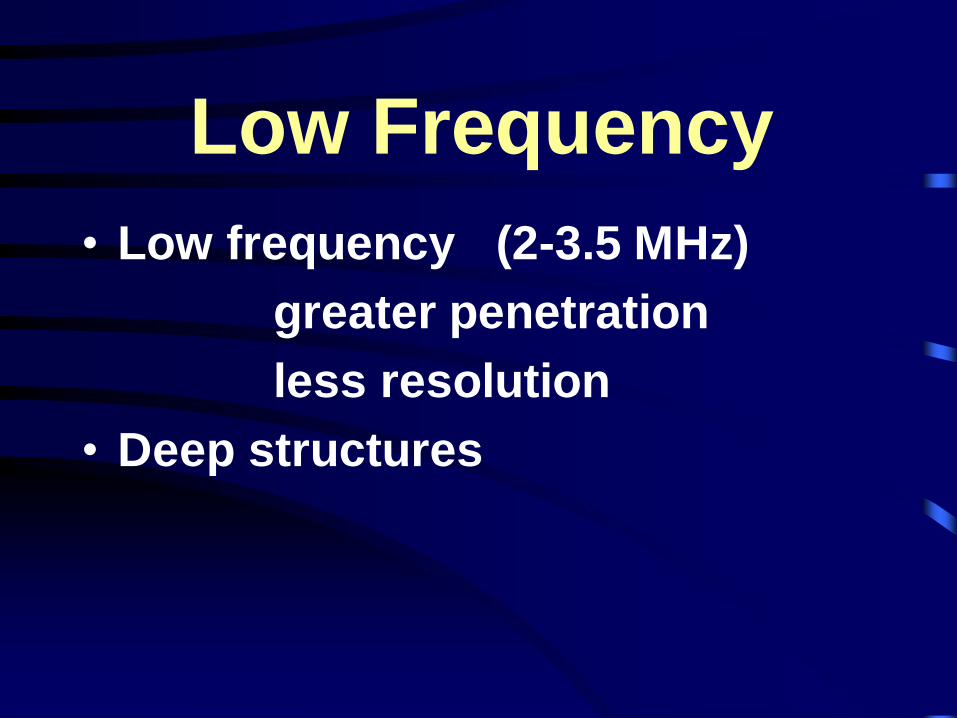
Low Frequency
• Low frequency (2-3.5 MHz)
greater penetration
less resolution
• Deep structures
Displays
• B-mode
– Real time gray scale, 2D
– Flip book- 15-60 images per second
• M-mode
– Echo amplitude and position of moving
targets
– Valves, vessels, chambers
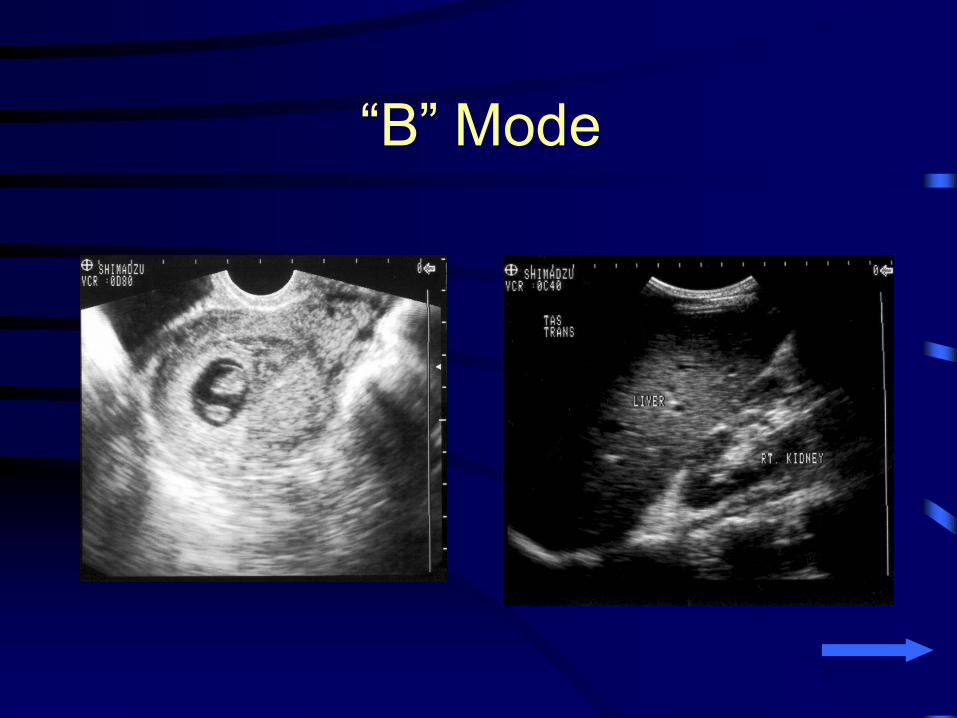
“B” Mode
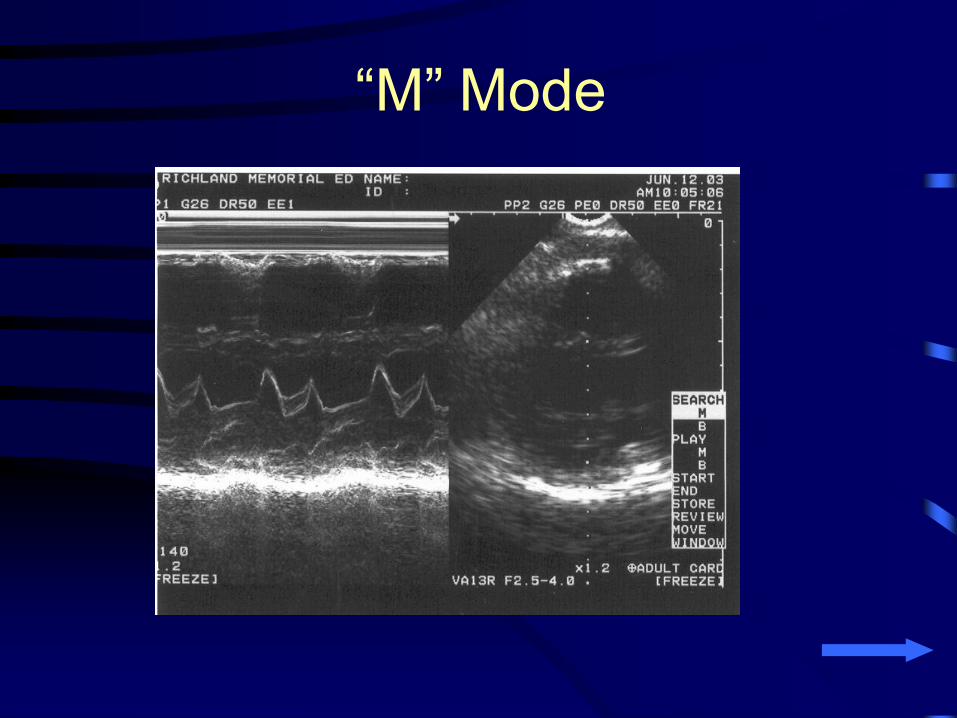
“M” Mode
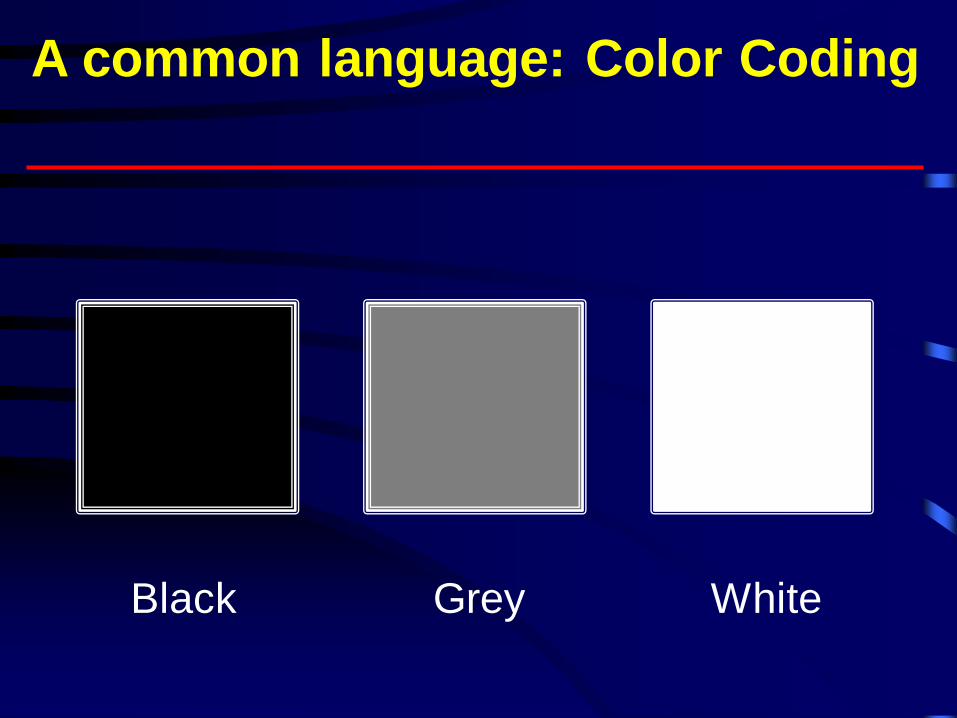
A common language: Color Coding
Black Grey White
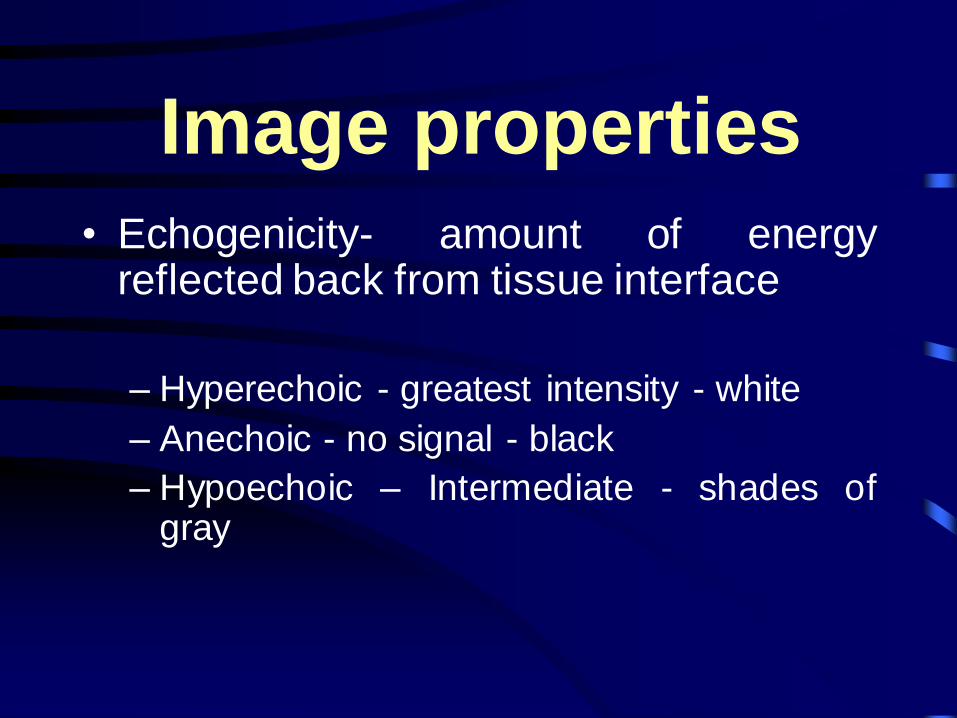
Image properties
• Echogenicity- amount of energy reflected back from tissue interface
– Hyperechoic - greatest intensity - white
– Anechoic - no signal - black
– Hypoechoic – Intermediate - shades of gray
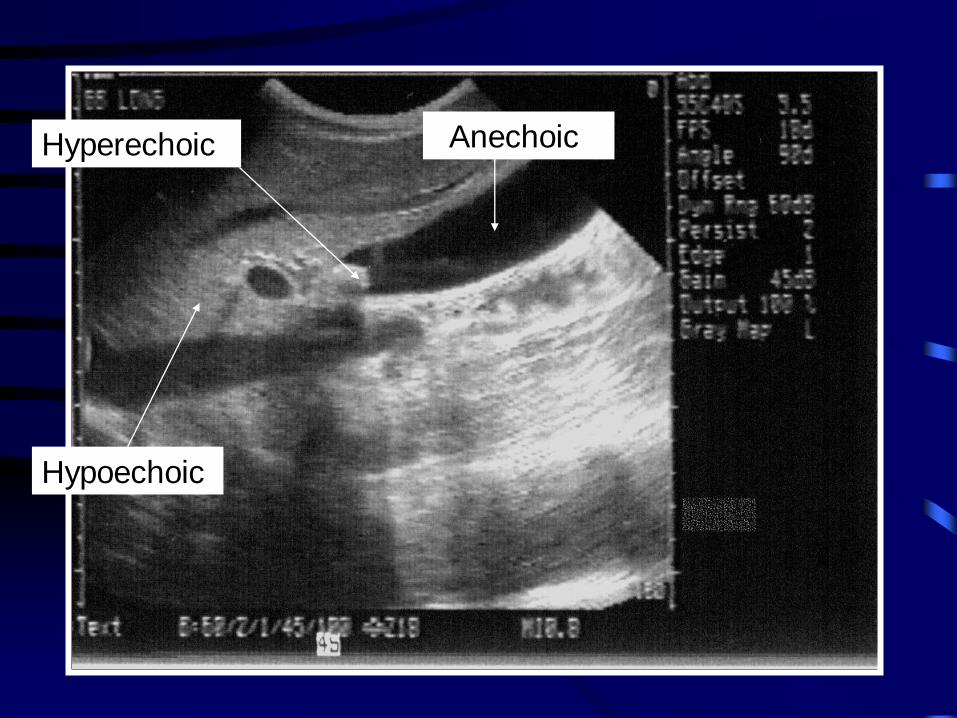
Hyperechoic
Hypoechoic
Anechoic
Ultrasound Artifacts
• Can be falsely interpreted as real
pathology
• May obscure pathology
• Important to understand and appreciate
Ultrasound Artifacts
• Acoustic enhancement
• Acoustic shadowing
• Lateral cystic shadowing (edge artifact)
• Wide beam artifact
• Side lobe artifact
• Reverberation artifact
• Gain artifact
• Contact artifact
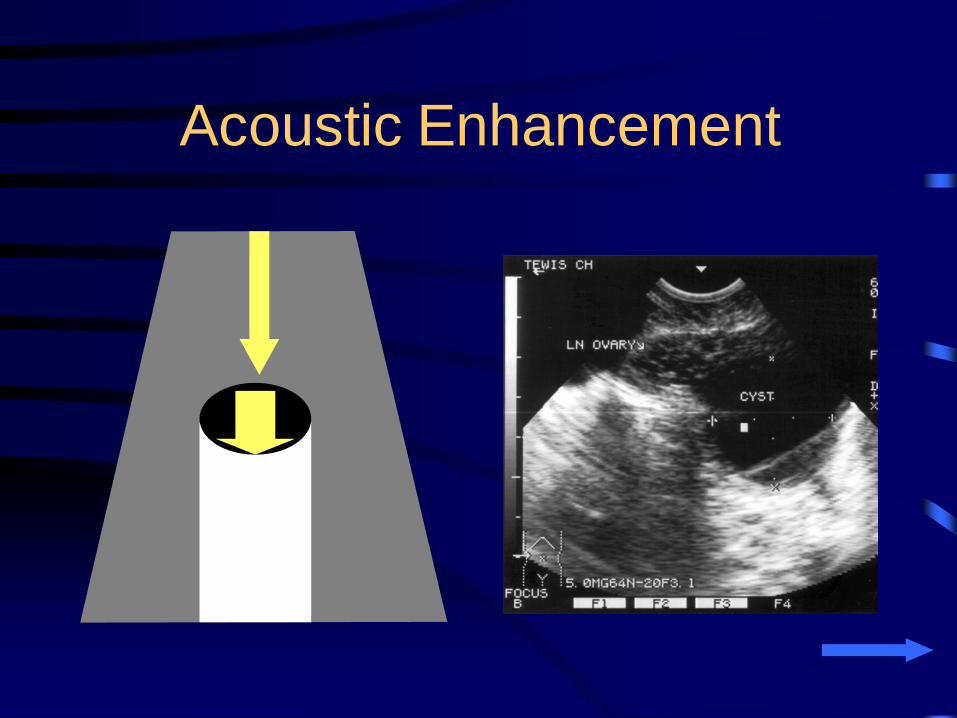
Acoustic Enhancement
• Opposite of acoustic shadowing
• Better ultrasound transmission allows
enhancement of the ultrasound signal
distal to that region
Acoustic Enhancement
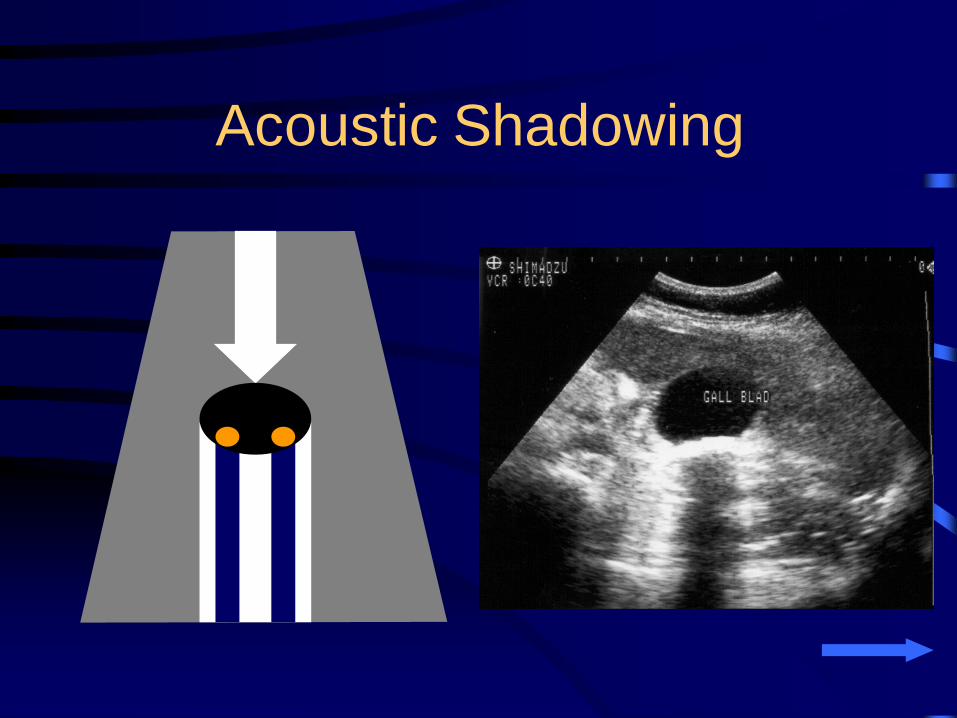
Acoustic Shadowing
• Occurs distal to any highly reflective or
highly attenuating surface
• Important diagnostic clue seen in a
large number of medical conditions
– Biliary stones
– Renal stones
– Tissue calcifications
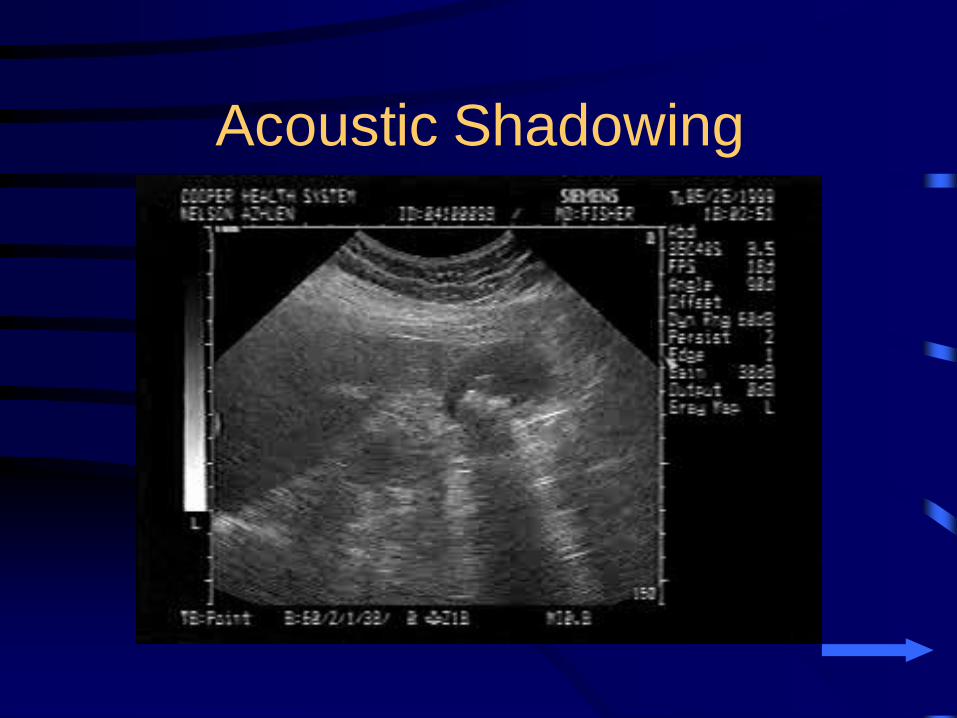
Acoustic Shadowing
• Shadow may be more prominent than
the object causing it
• Failure to visualize the source of a
shadow is usually caused by the object
being outside the plane of the
ultrasound beam
Acoustic Shadowing
Acoustic Shadowing

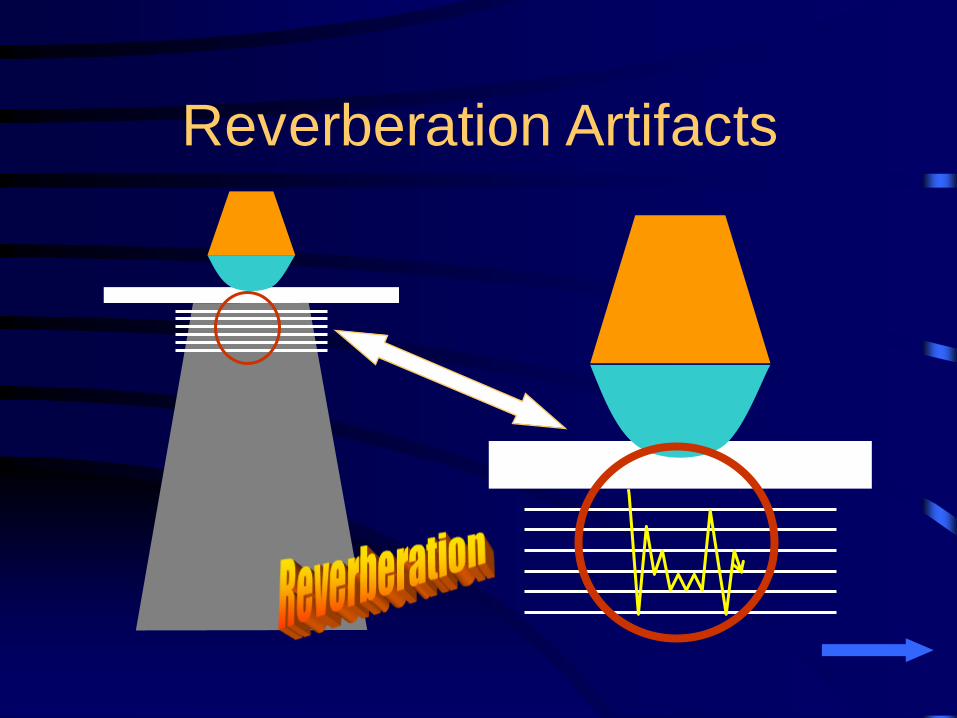
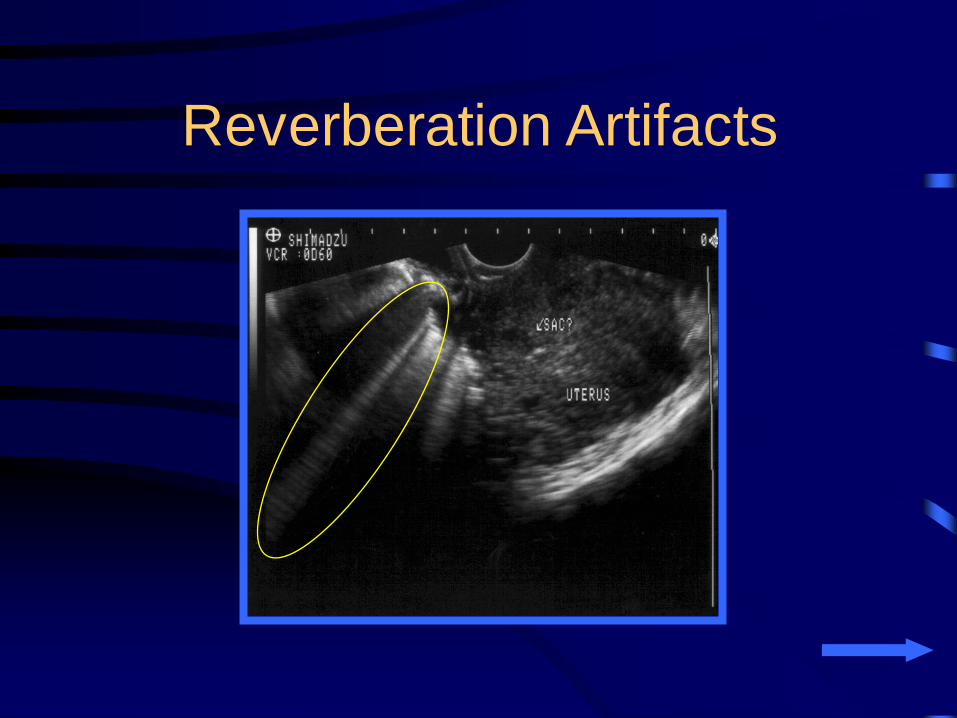
Reverberation Artifacts
• Several types
• Caused by the echo bouncing back and
forth between two or more highly
reflective surfaces
Reverberation Artifacts
• On the monitor parallel bands of
reverberation echoes are seen
• This causes a “comet-tail” pattern
• Common reflective layers
– Abdominal wall
– Foreign bodies
– Gas
Reverberation Artifacts
Reverberation Artifacts
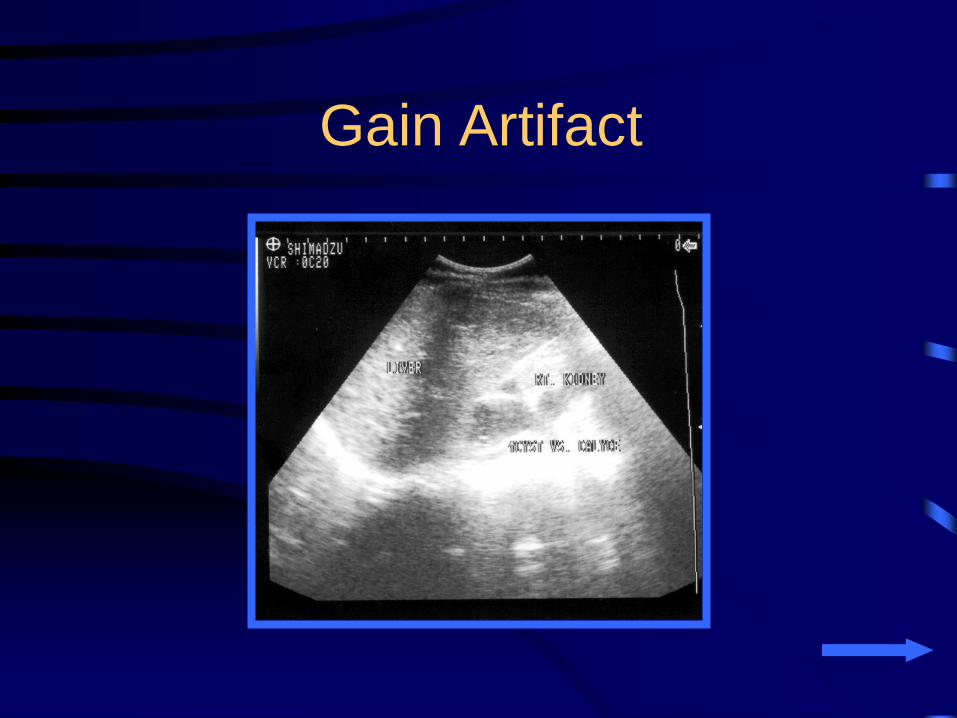
Gain Artifact
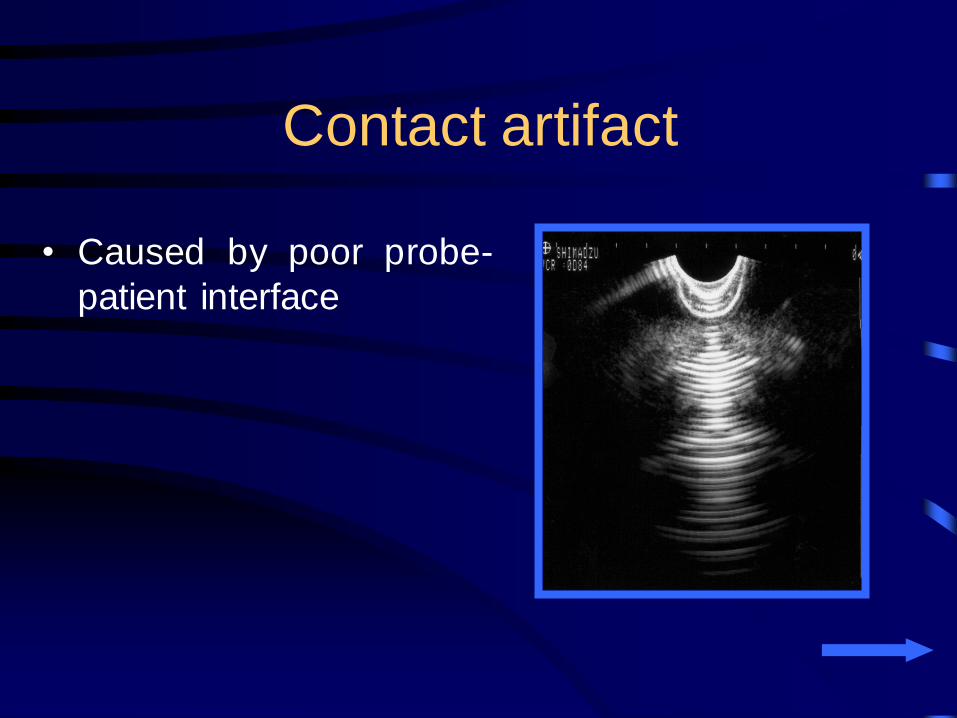
Contact artifact
• Caused by poor probe-
patient interface

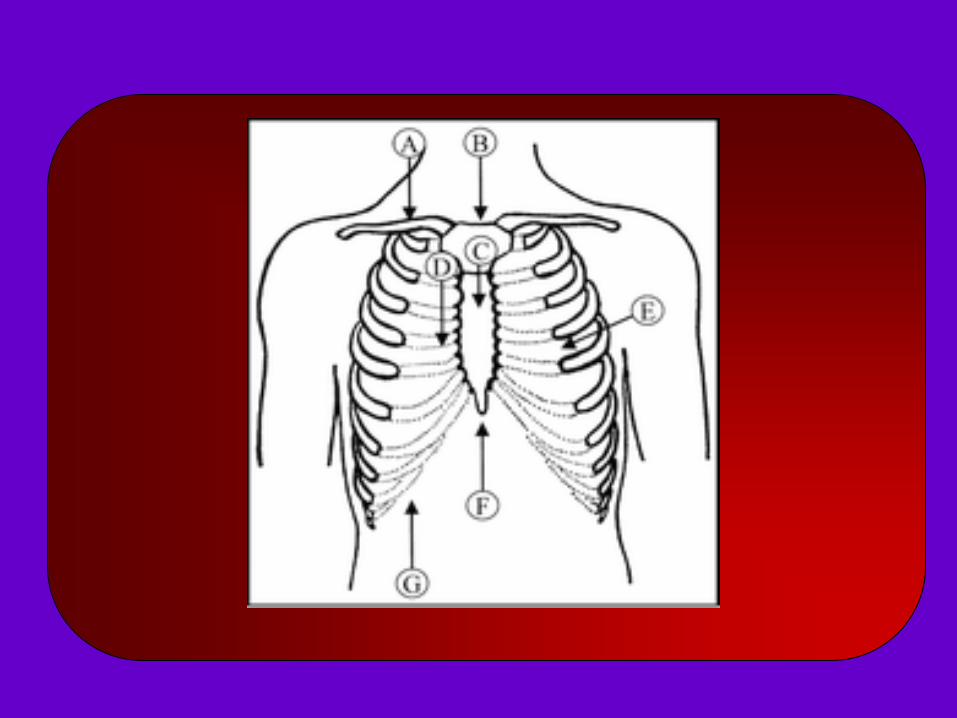
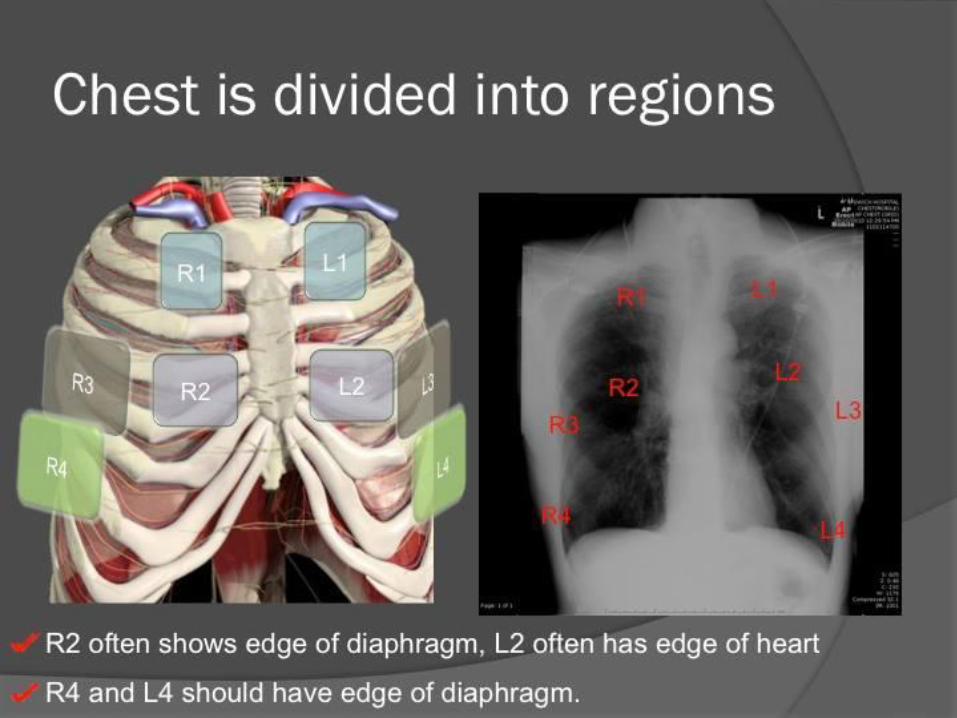
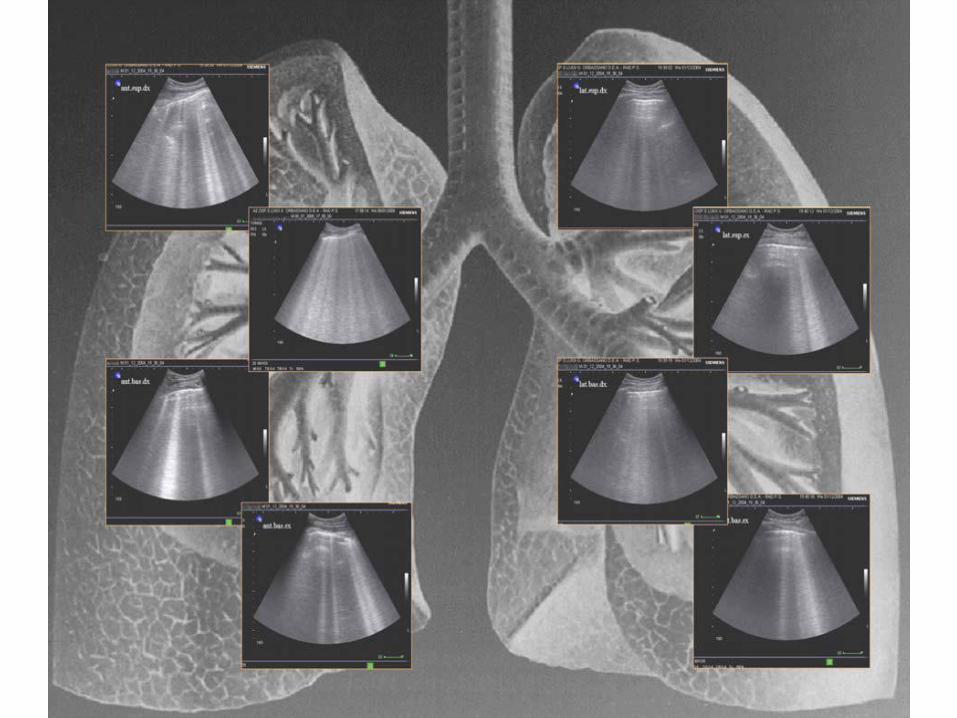
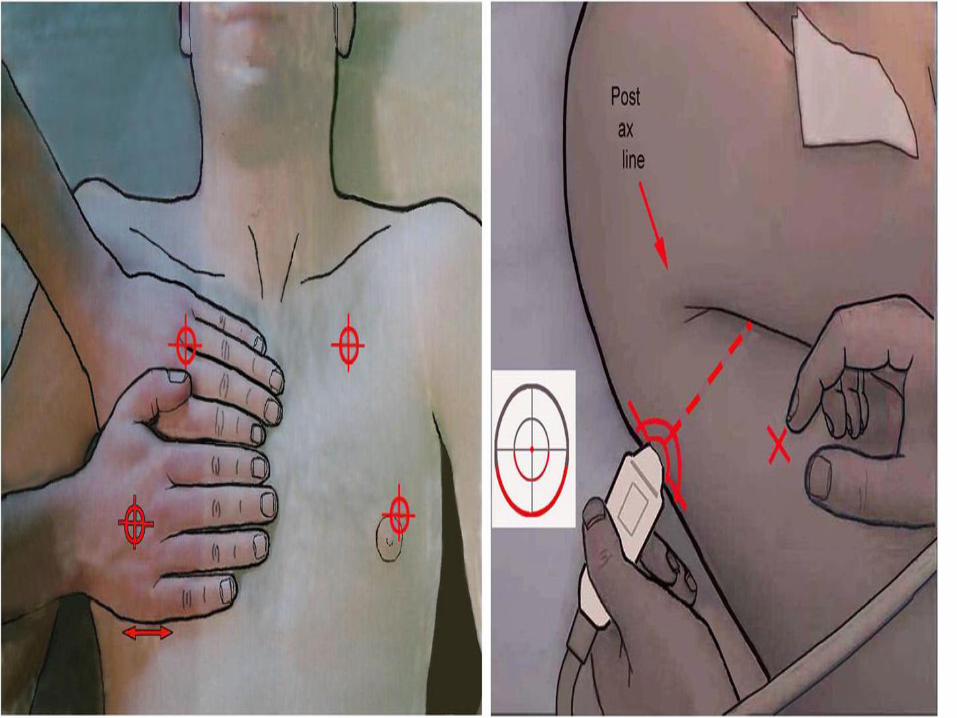
Scanning Positions for Chest Sonography
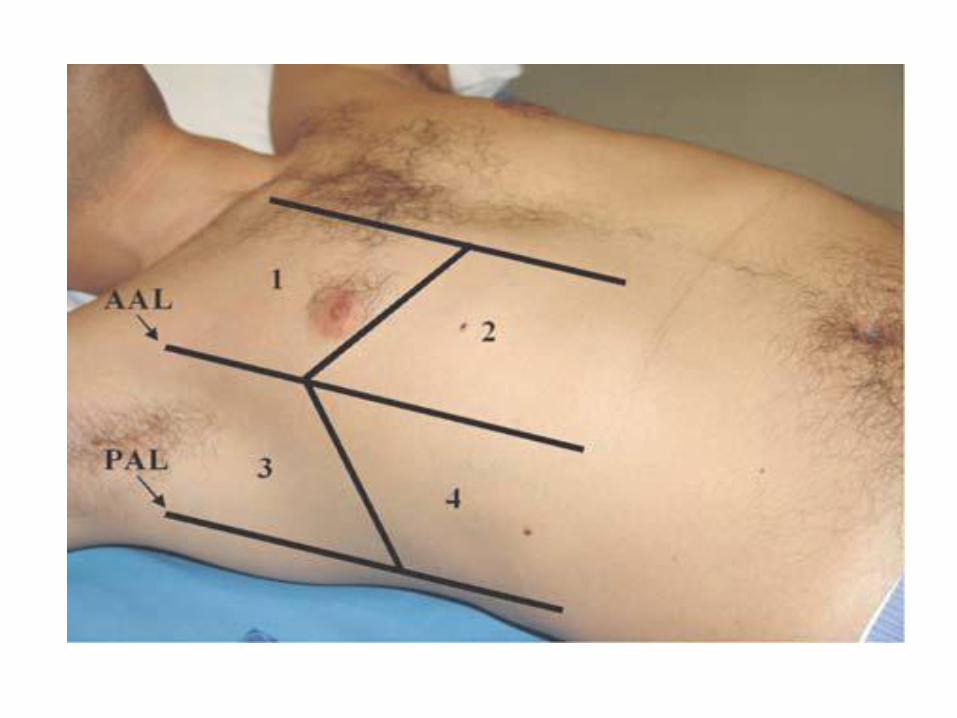
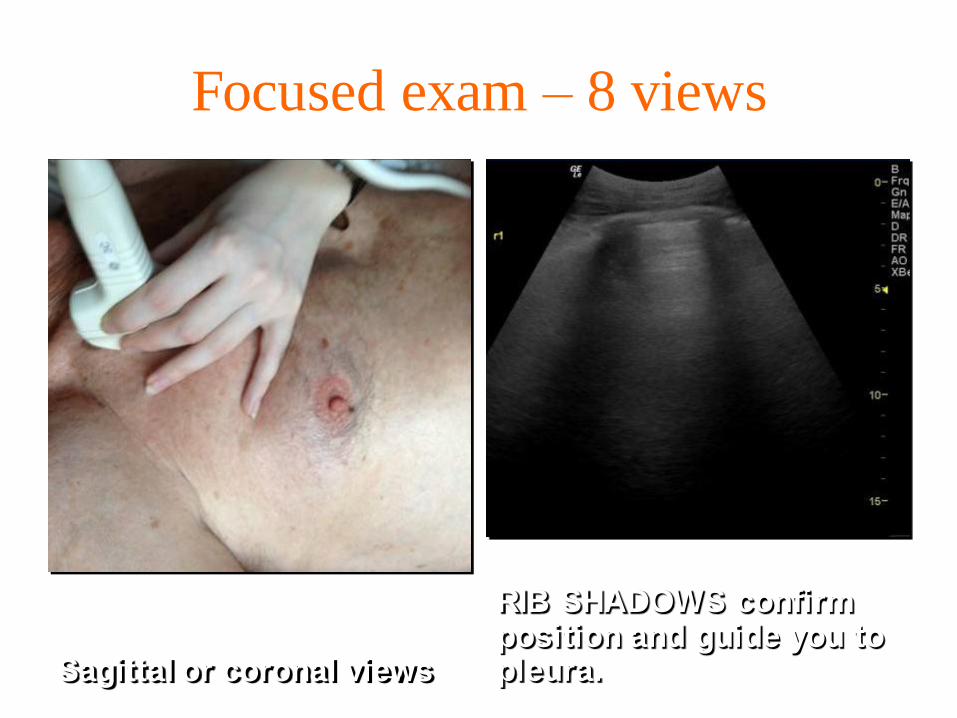
Focused exam – 8 views
Sagittal or coronal views
RIB SHADOWS confirm position and guide you to pleura.
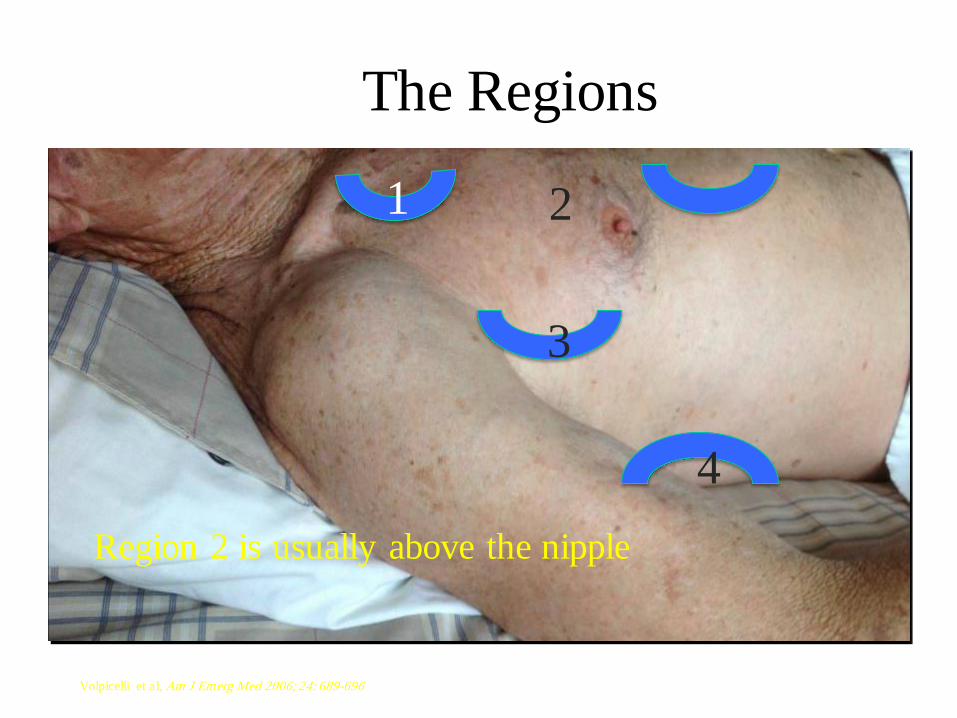
The Regions
1 2
3
4
Volpicelli et al, Am J Emerg Med 2006; 24: 689-696
Region 2 is usually above the nipple
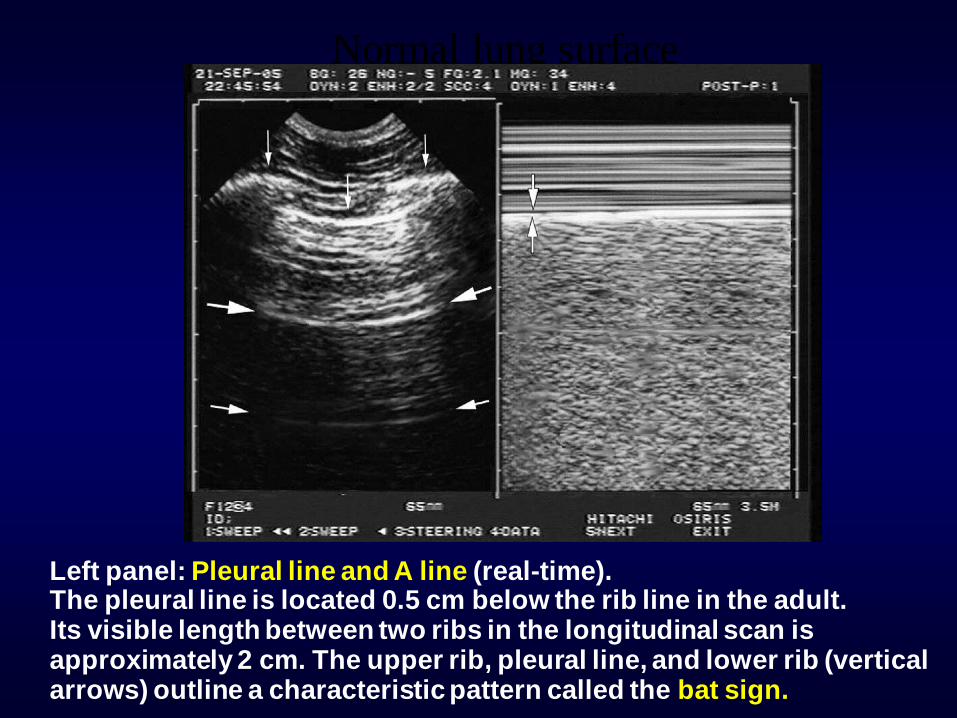
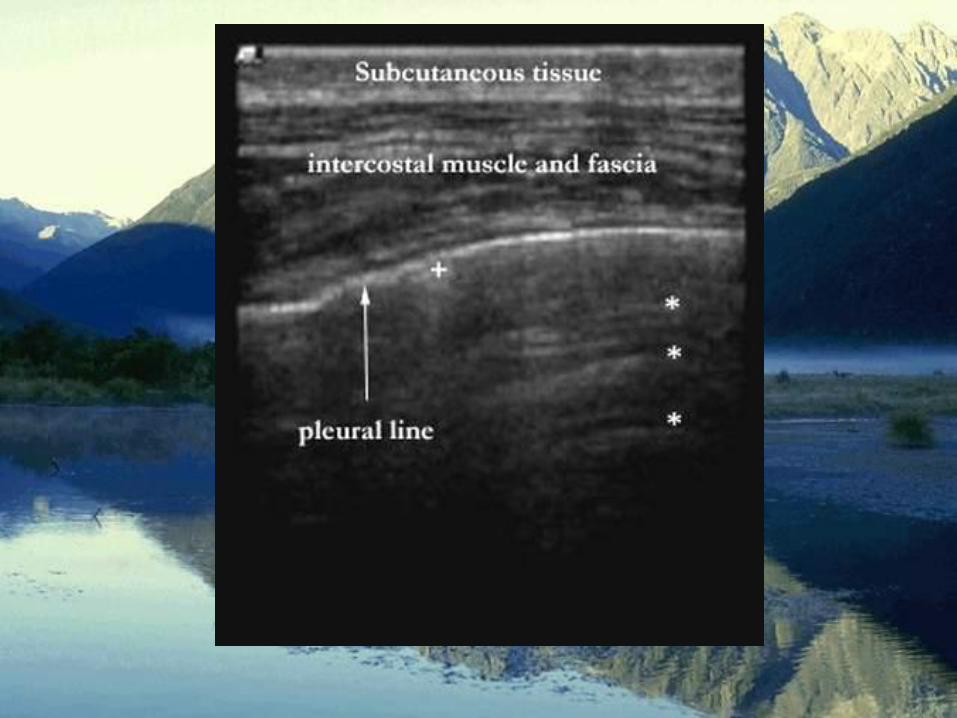
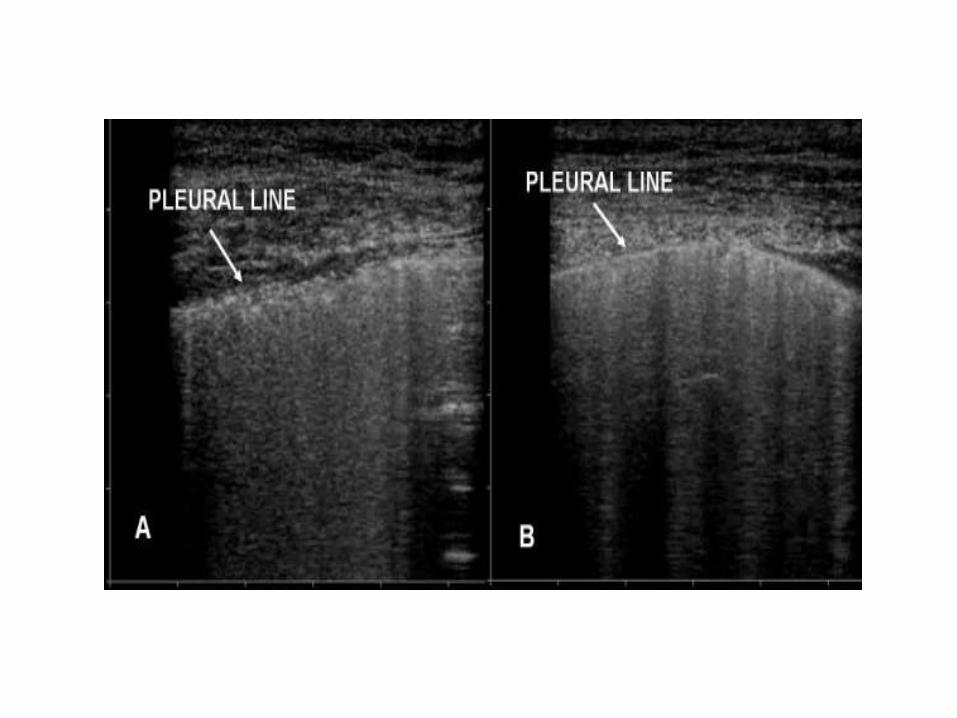
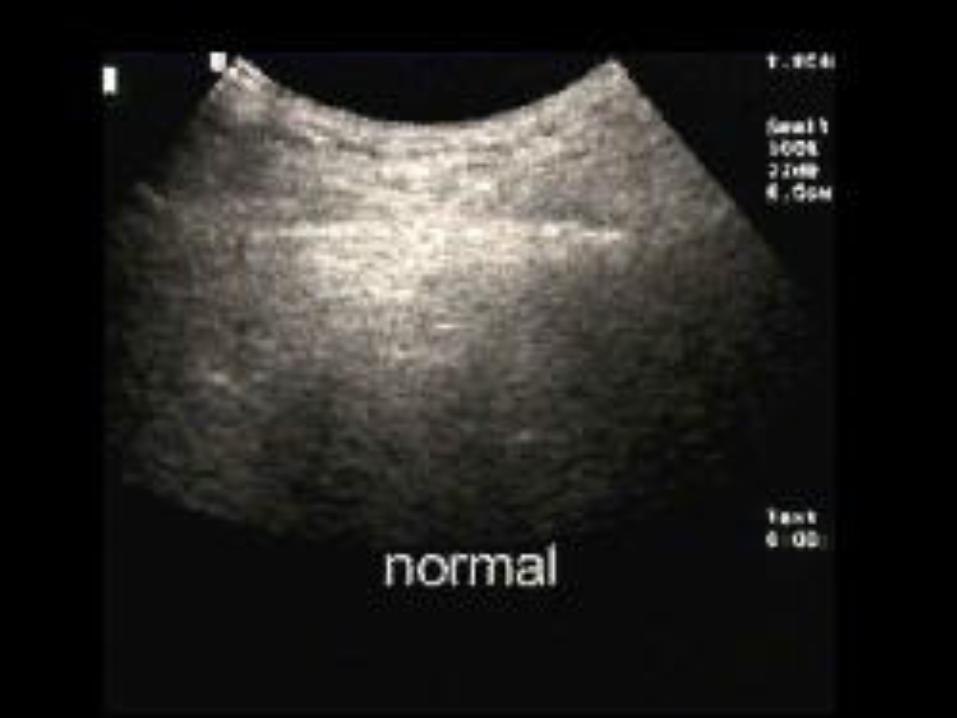
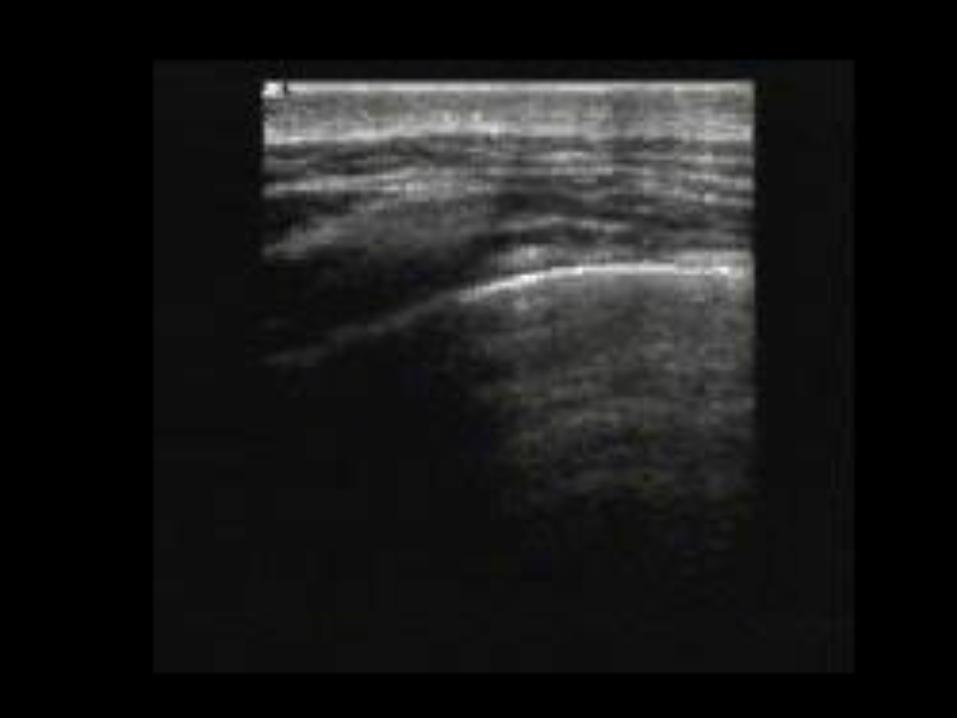
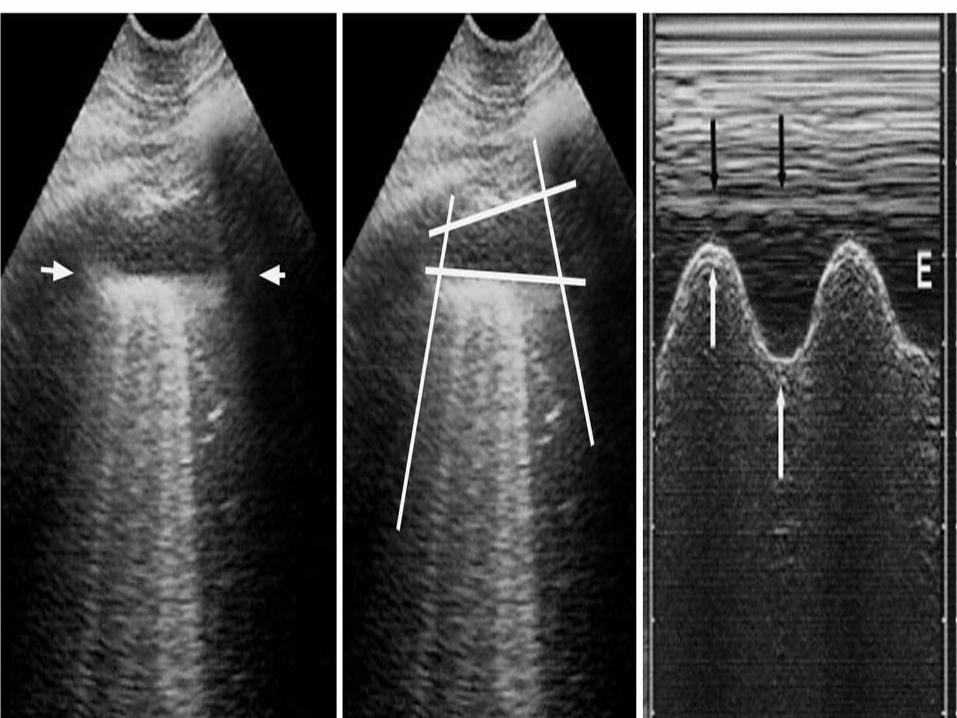
Normal lung surface
Left panel: Pleural line and A line (real-time). The pleural line is located 0.5 cm below the rib line in the adult. Its visible length between two ribs in the longitudinal scan is approximately 2 cm. The upper rib, pleural line, and lower rib (vertical arrows) outline a characteristic pattern called the bat sign.
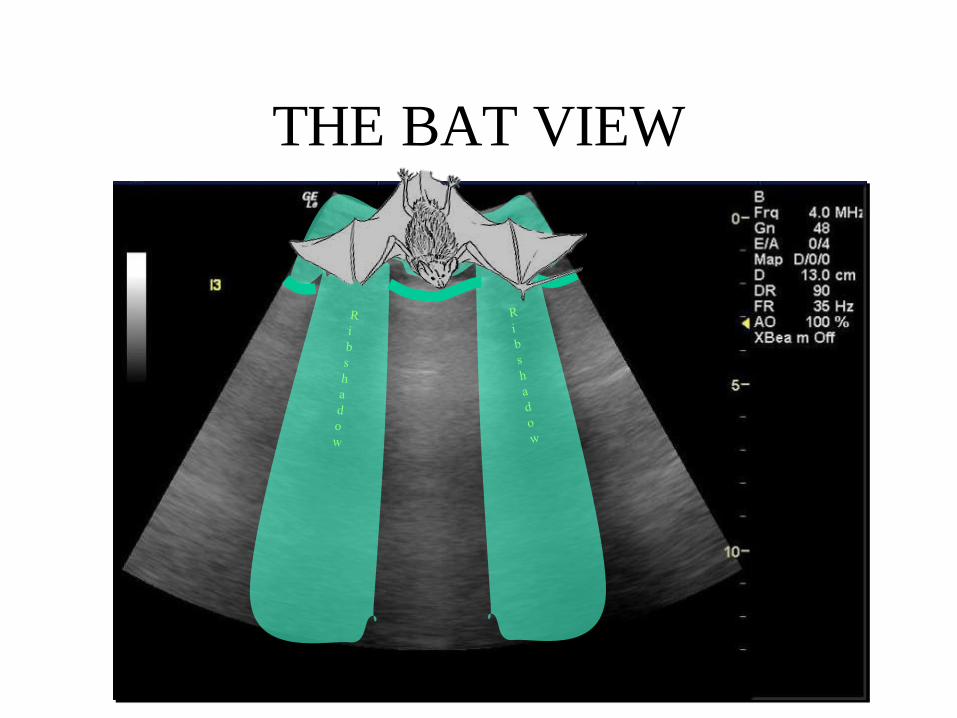
THE BAT VIEW
Chest wall
Pleural line
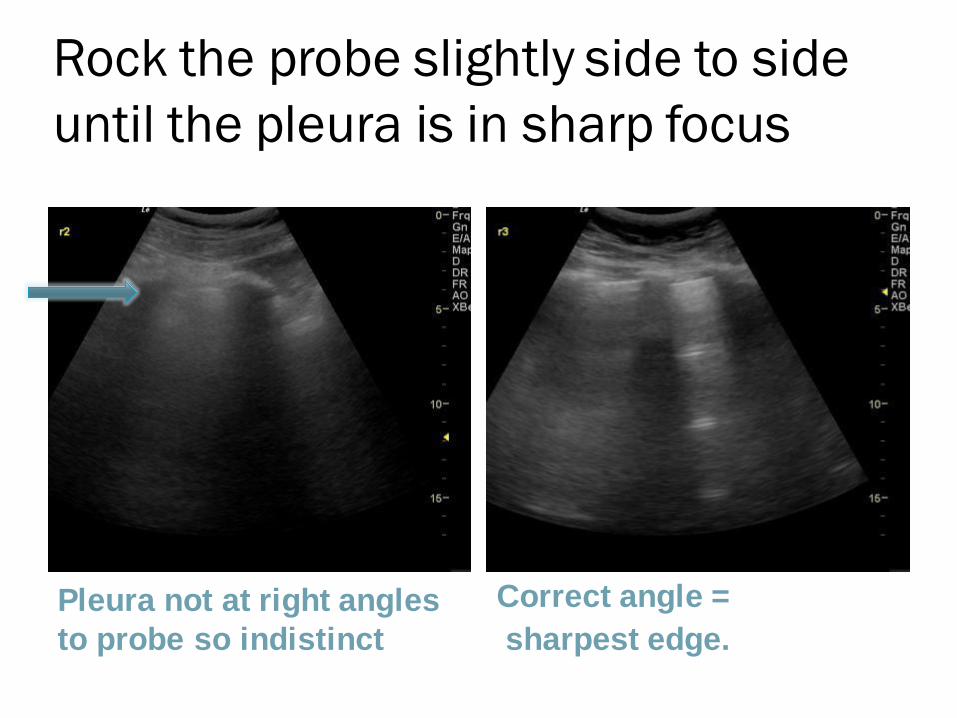
Rock the probe slightly side to side
until the pleura is in sharp focus
Pleura not at right angles
to probe so indistinct
Correct angle =
sharpest edge.
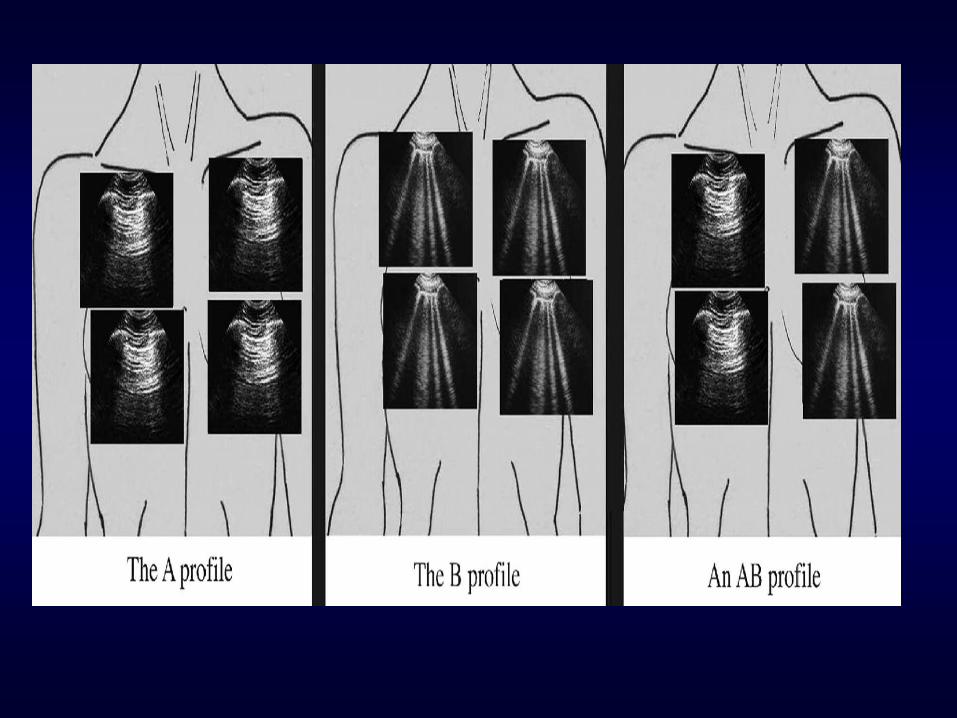
Interpretation
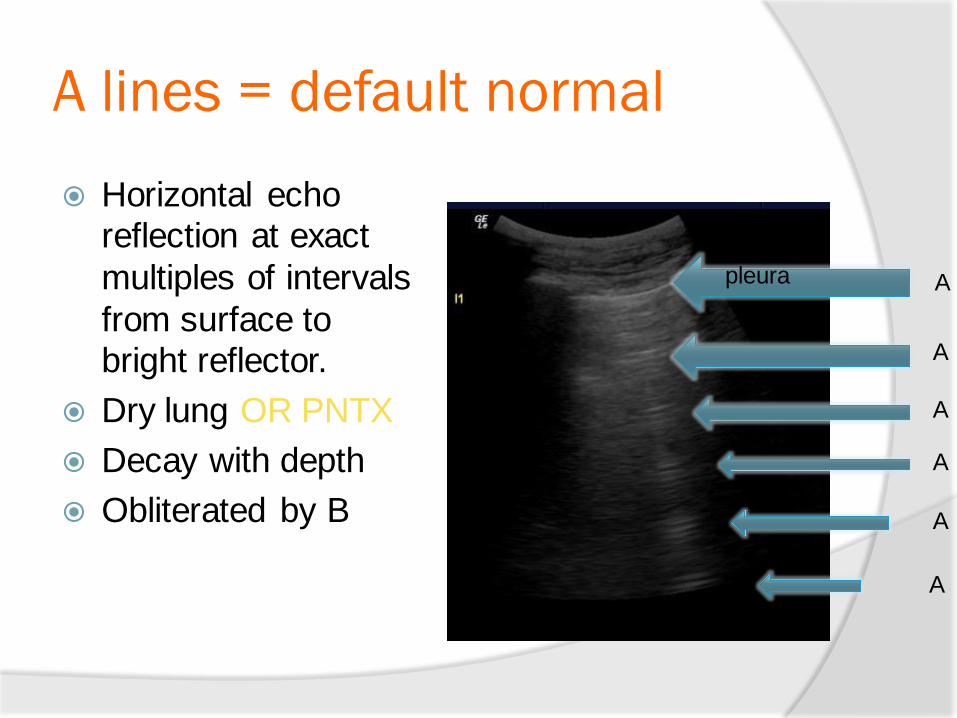
A lines = default normal
Horizontal echo reflection at exact
multiples of intervals
from surface to bright reflector.
Dry lung OR PNTX
Decay with depth
Obliterated by B
pleura A
A
A
A
A
A
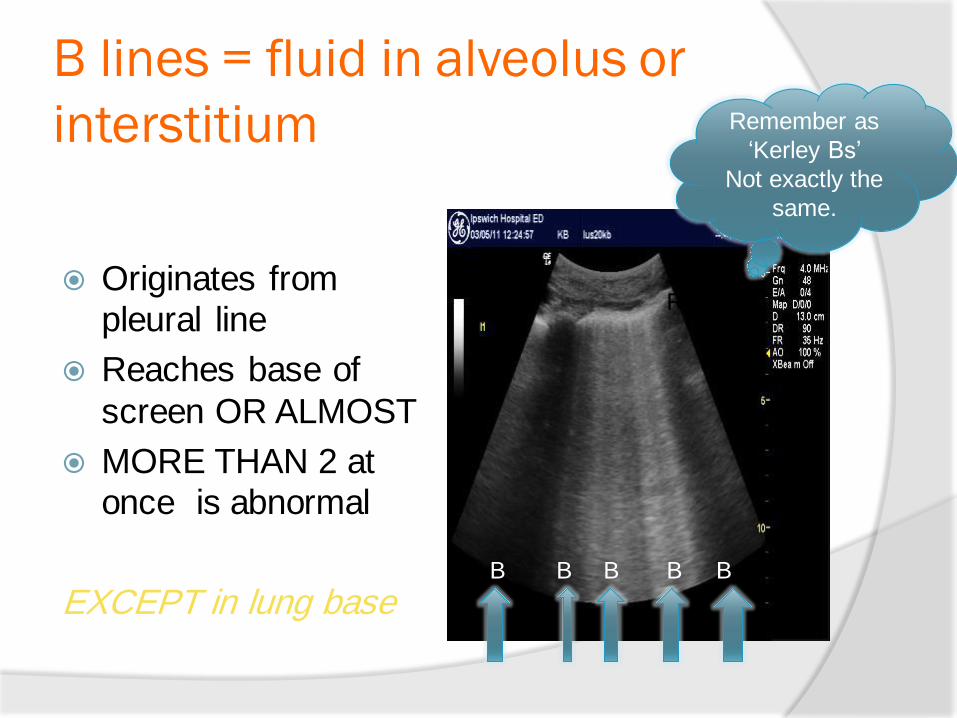
B lines = fluid in alveolus or
interstitium
Originates from pleural line
Reaches base of
screen OR ALMOST
MORE THAN 2 at once is abnormal
EXCEPT in lung base
Remember as
„Kerley Bs‟
Not exactly the
same.
RIB RIB
B B B B B
B Lines = Crackles
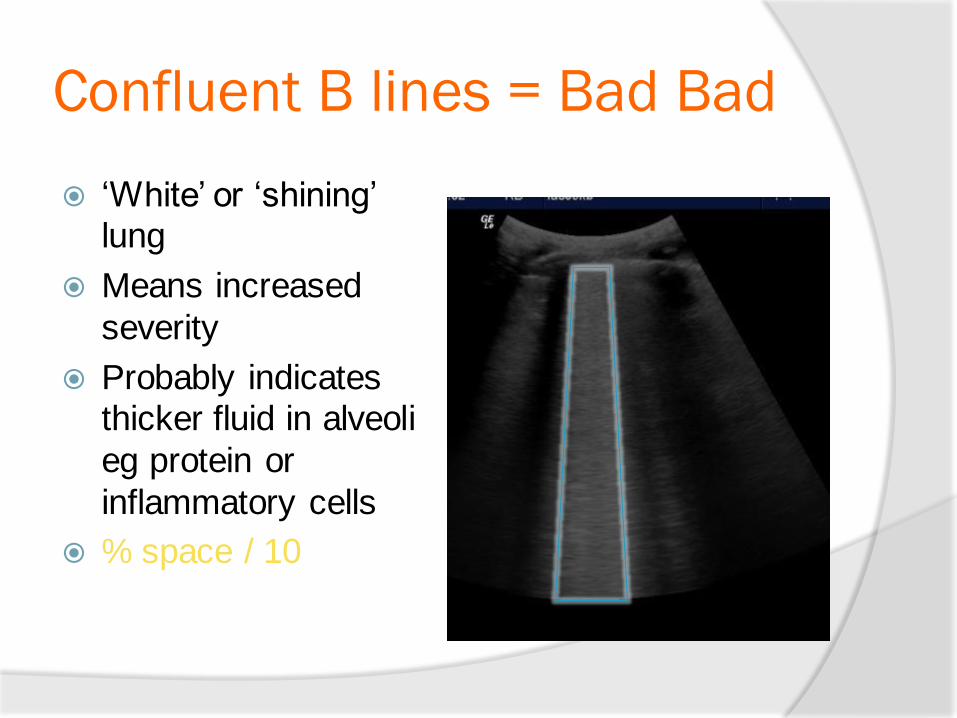
Confluent B lines = Bad Bad
„White‟ or „shining‟ lung
Means increased
severity
Probably indicates thicker fluid in alveoli
eg protein or
inflammatory cells
% space / 10
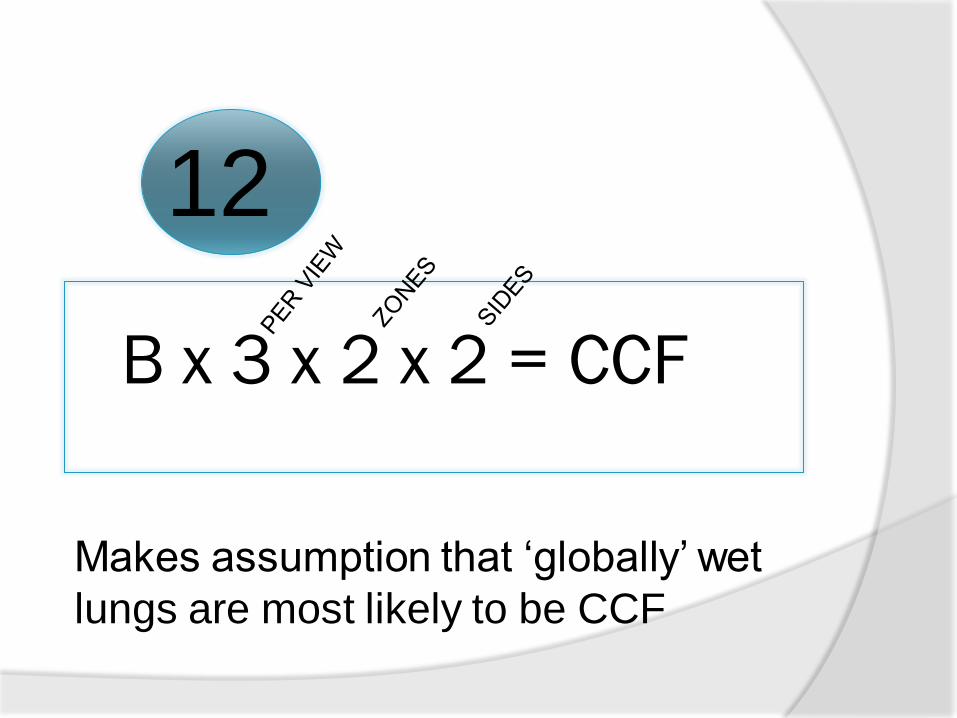
B x 3 x 2 x 2 = CCF
Makes assumption that „globally‟ wet
lungs are most likely to be CCF
12

Normal lung surface
Left panel: Pleural line and A line (real-time). The pleural line is located 0.5 cm below the rib line in the adult. Its visible length between two ribs in the longitudinal scan is approximately 2 cm. The upper rib, pleural line, and lower rib (vertical arrows) outline a characteristic pattern called the bat sign.

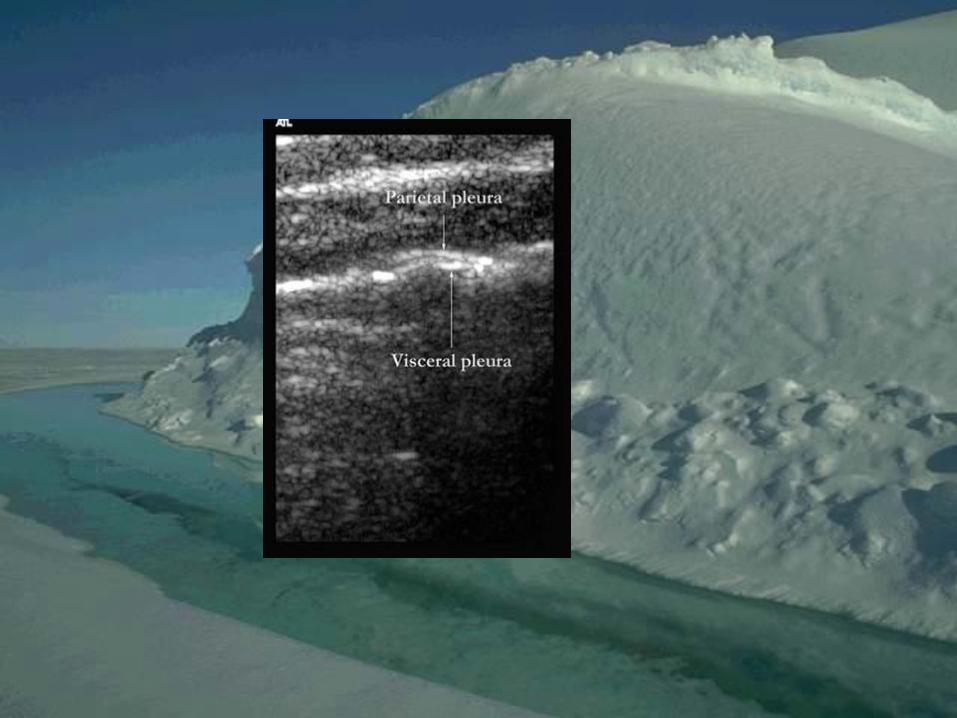
Normal Anatomy
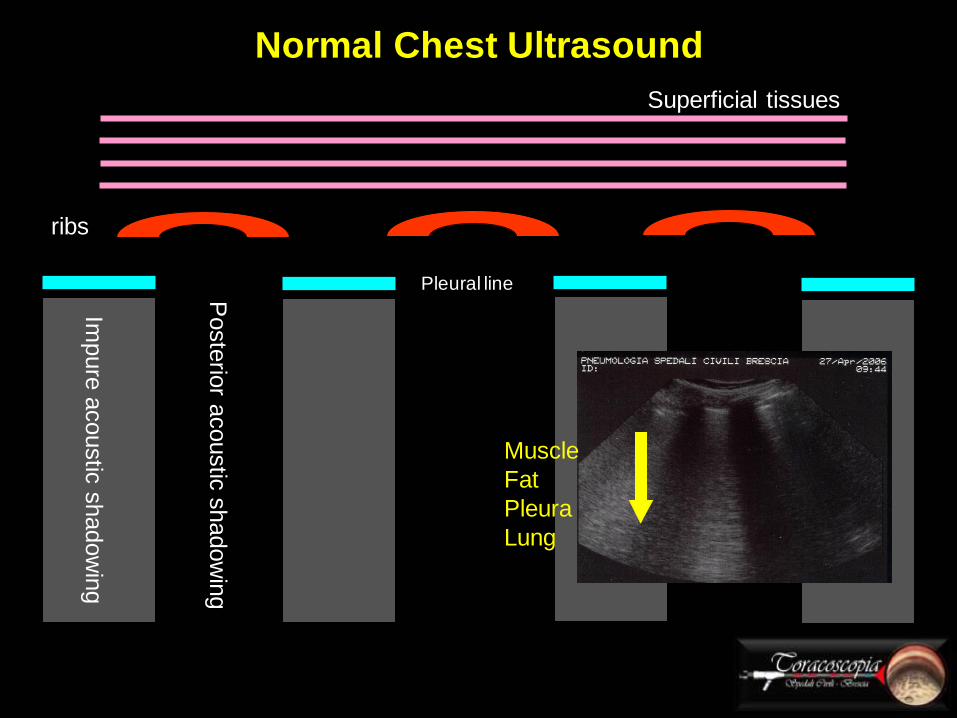
Normal Chest Ultrasound
Superficial tissues
ribs
Poste
rior a
coustic
shadow
ing
Impure
acoustic
shadow
ing
Pleural line
Muscle
Fat
Pleura
Lung
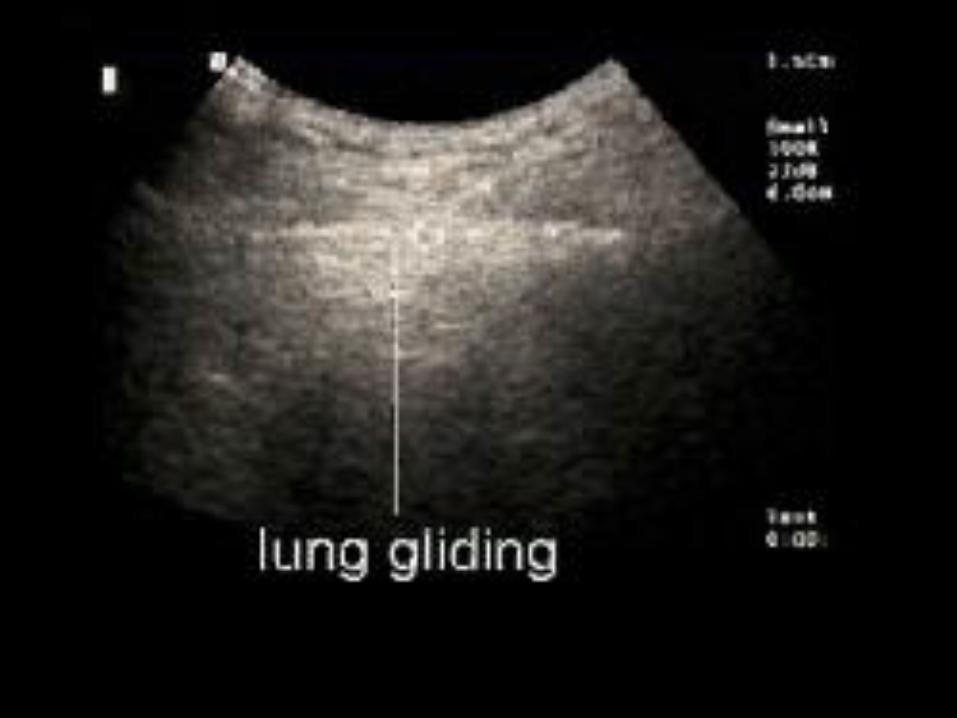
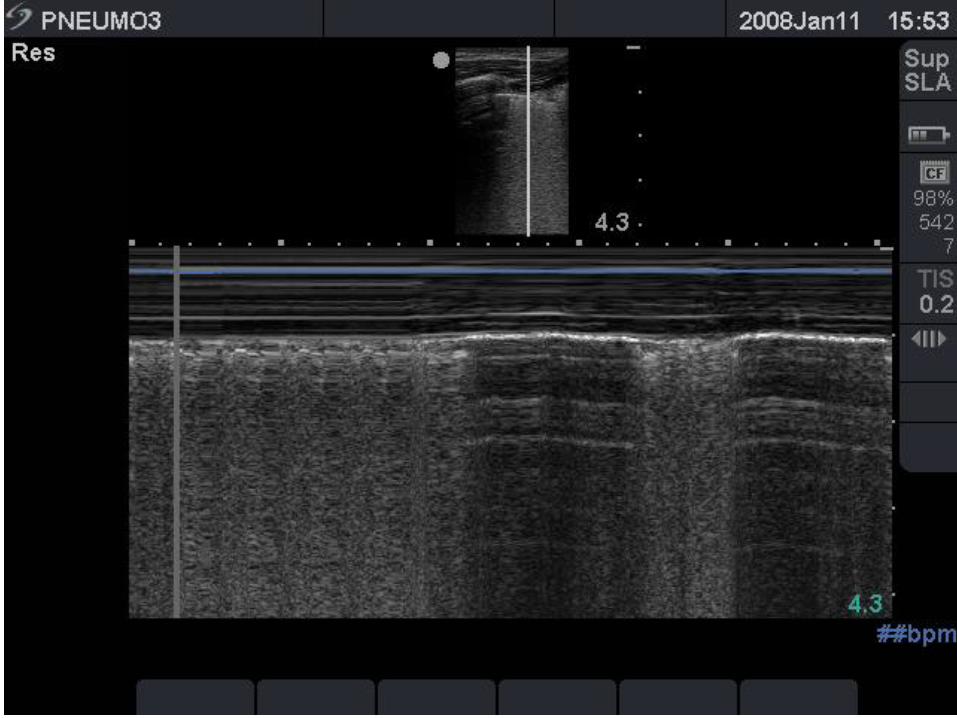
the "seashore sign" (Fig.3).
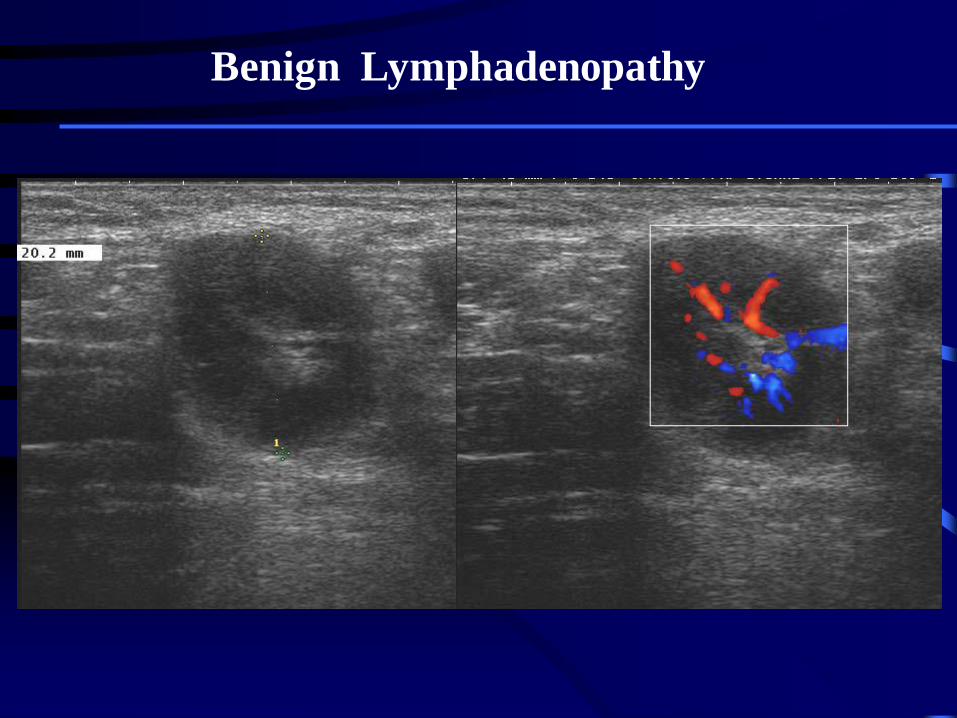
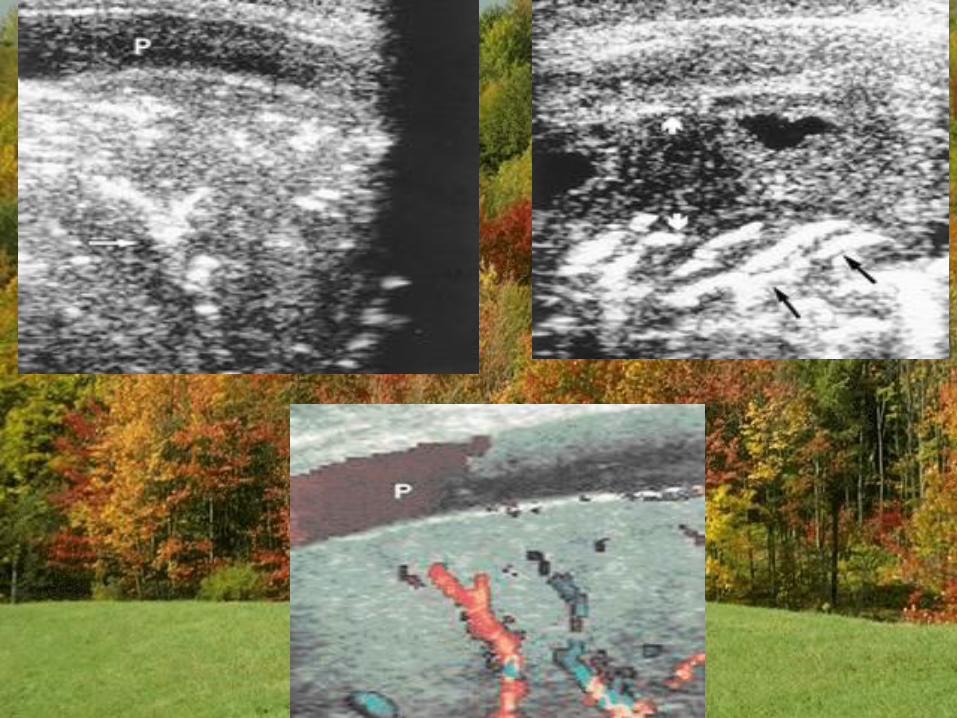
Benign Lymphadenopathy
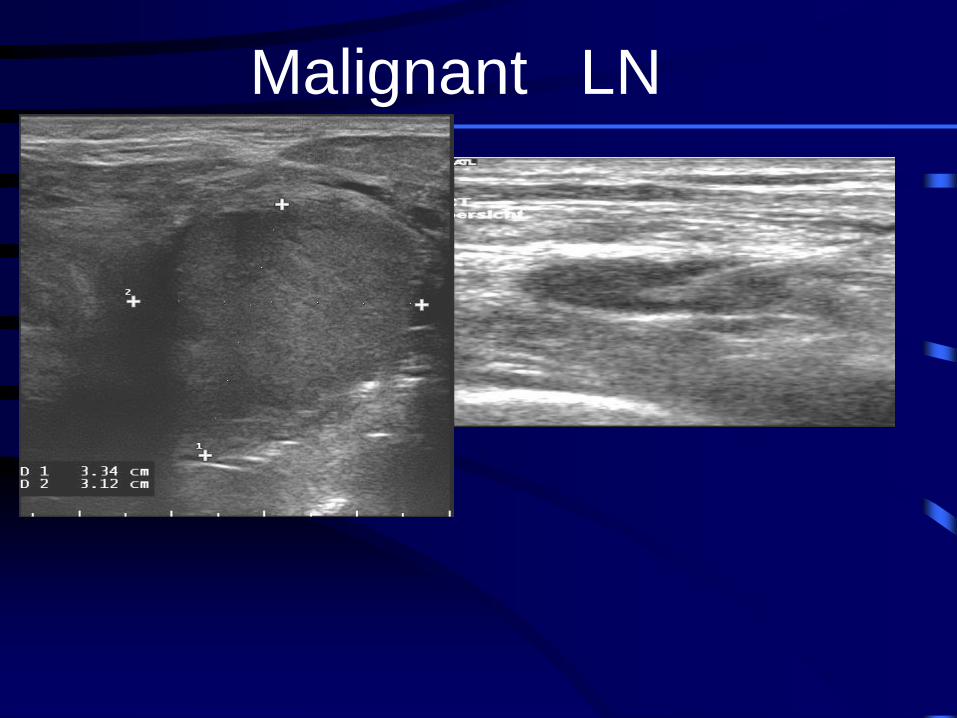
Malignant LN
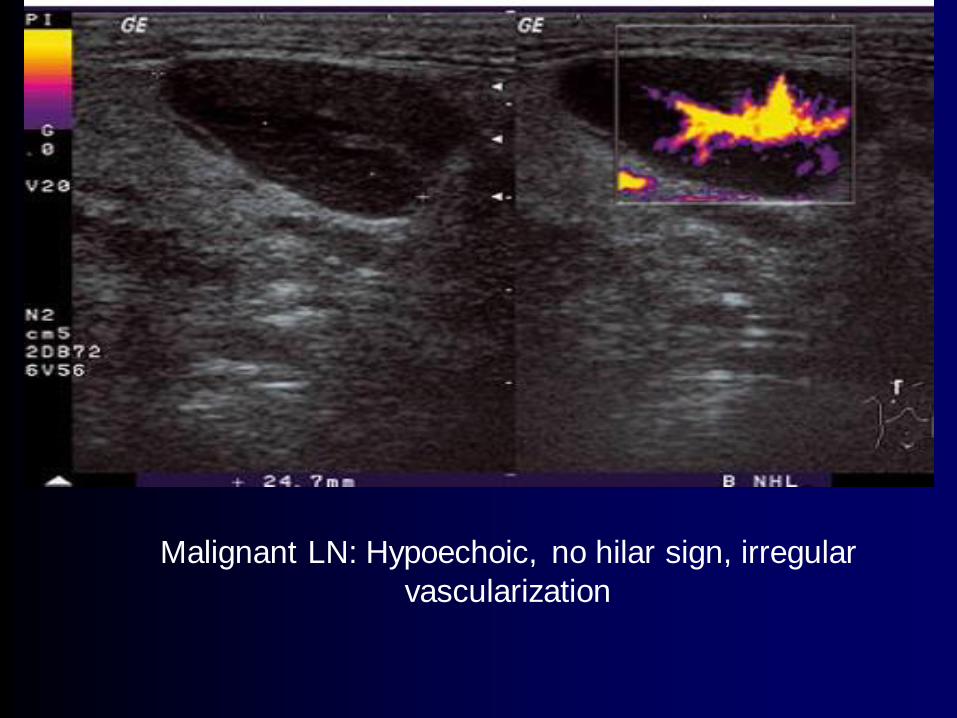
Malignant LN: Hypoechoic, no hilar sign, irregular
vascularization
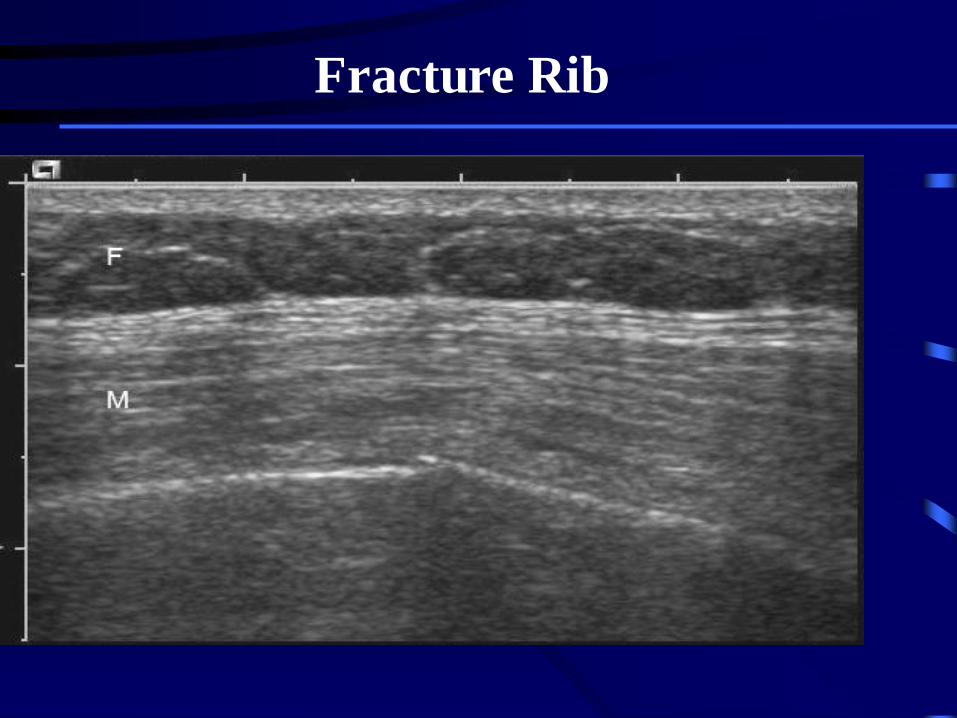
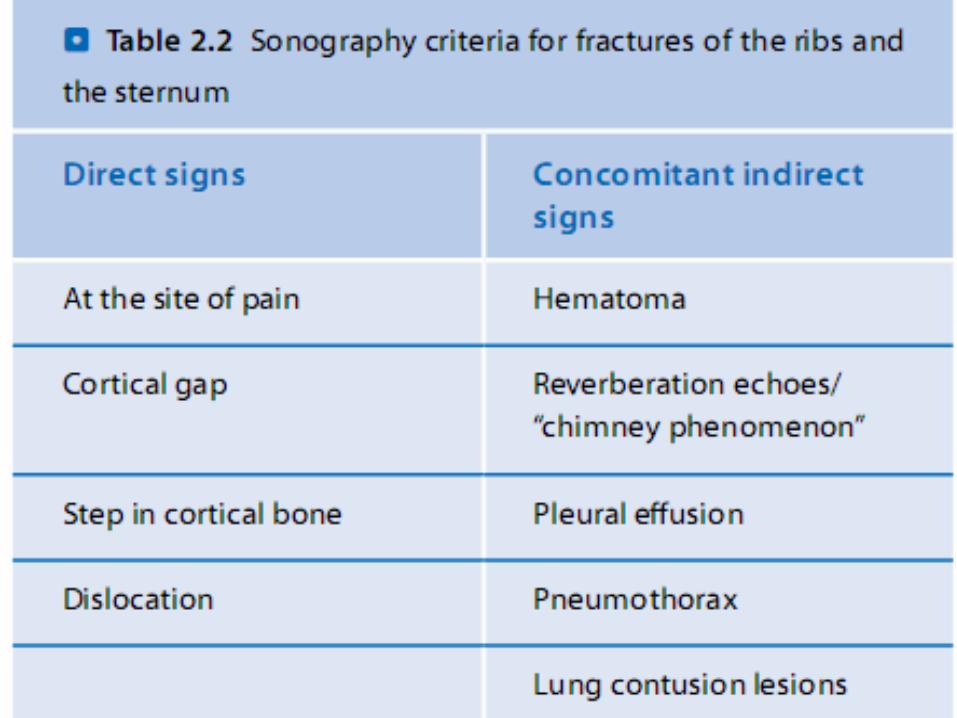
Fracture Rib
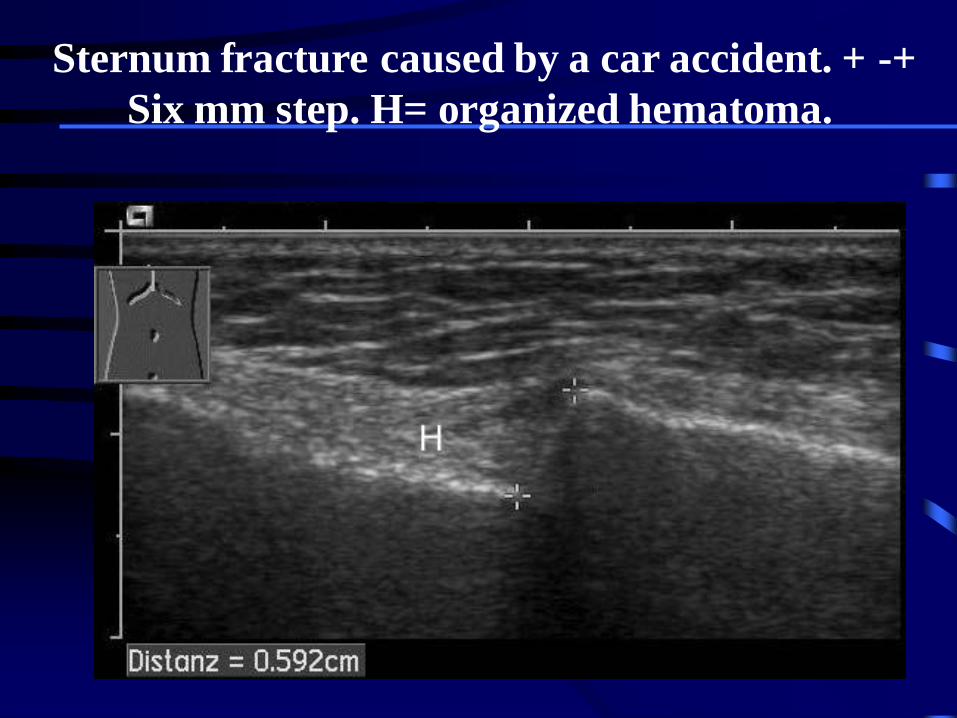
Sternum fracture caused by a car accident. + -+
Six mm step. H= organized hematoma.
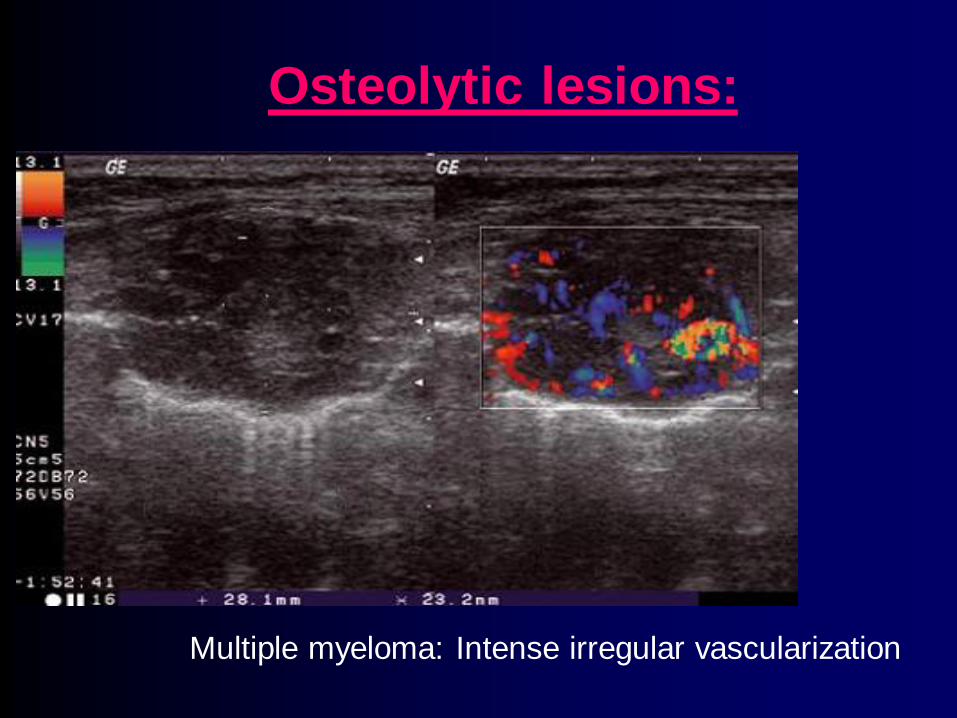
Osteolytic lesions:
Multiple myeloma: Intense irregular vascularization
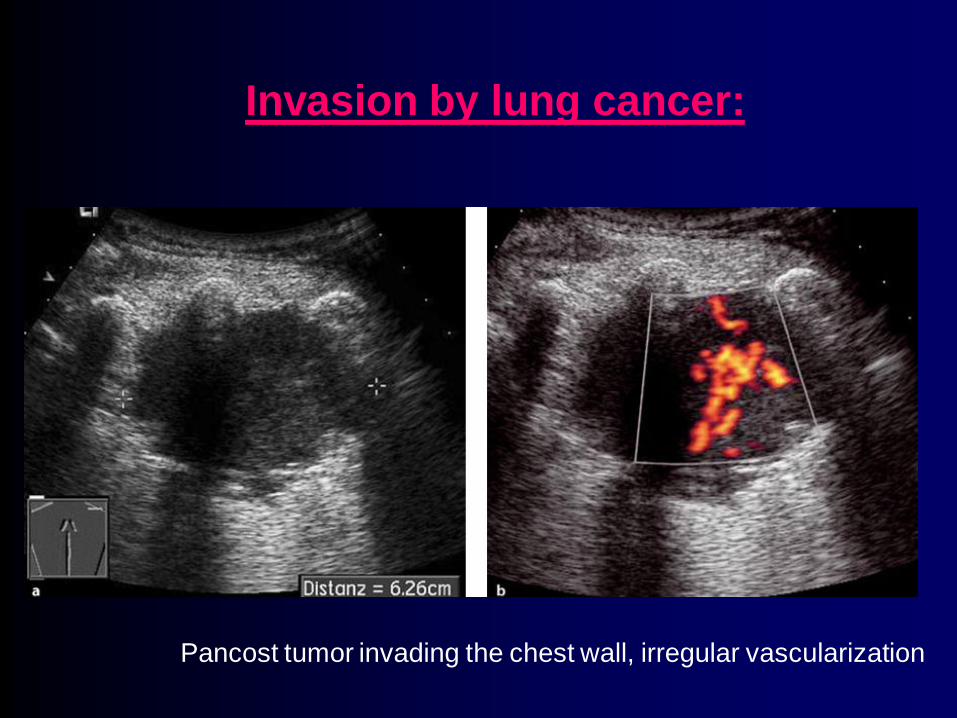
Invasion by lung cancer:
Pancost tumor invading the chest wall, irregular vascularization
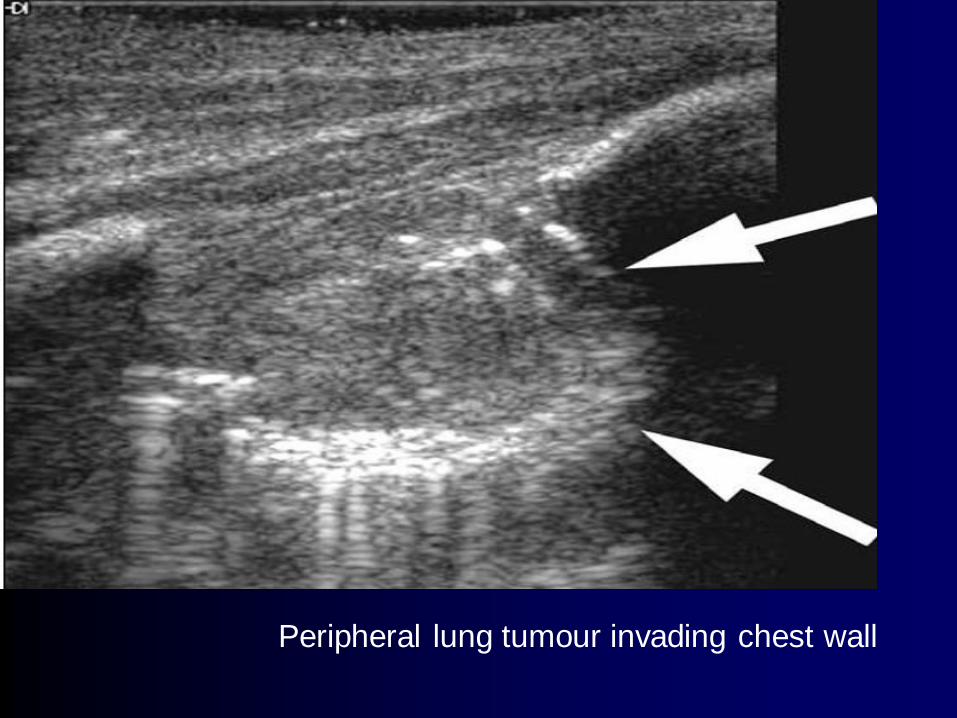
Peripheral lung tumour invading chest wall
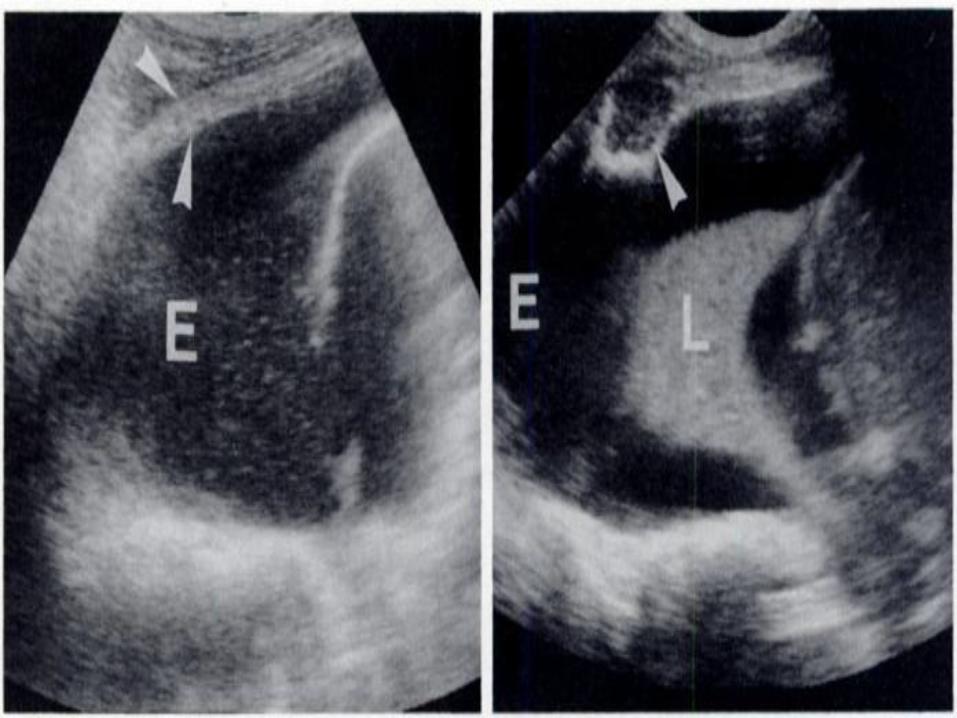
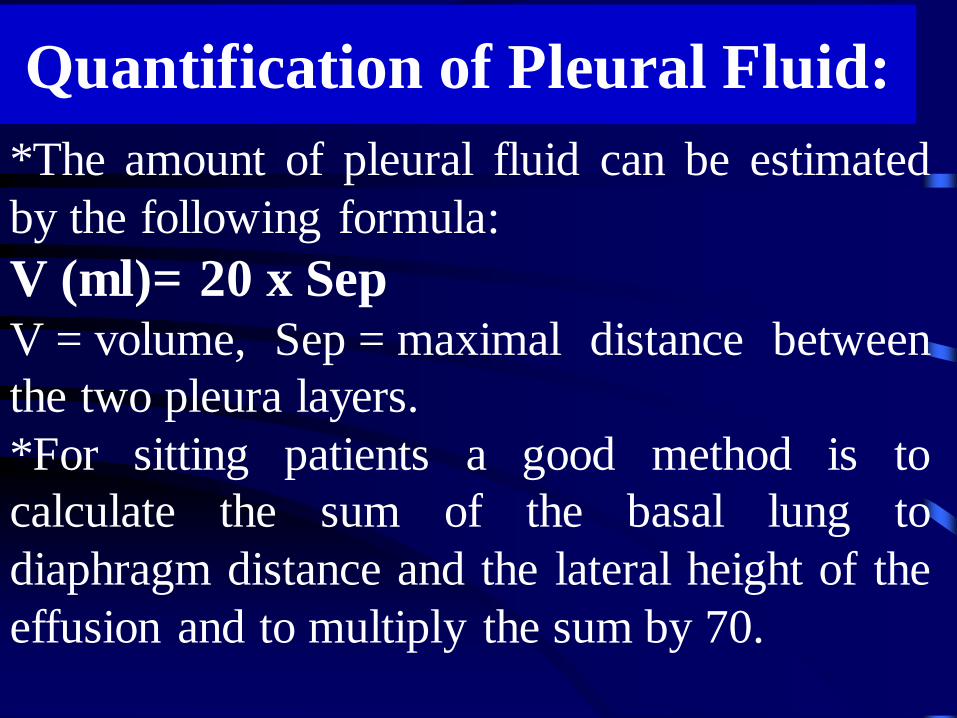
*The amount of pleural fluid can be estimated
by the following formula:
V (ml)= 20 x Sep V = volume, Sep = maximal distance between
the two pleura layers.
*For sitting patients a good method is to
calculate the sum of the basal lung to
diaphragm distance and the lateral height of the
effusion and to multiply the sum by 70.
Quantification of Pleural Fluid:


the "seashore sign" (Fig.3).
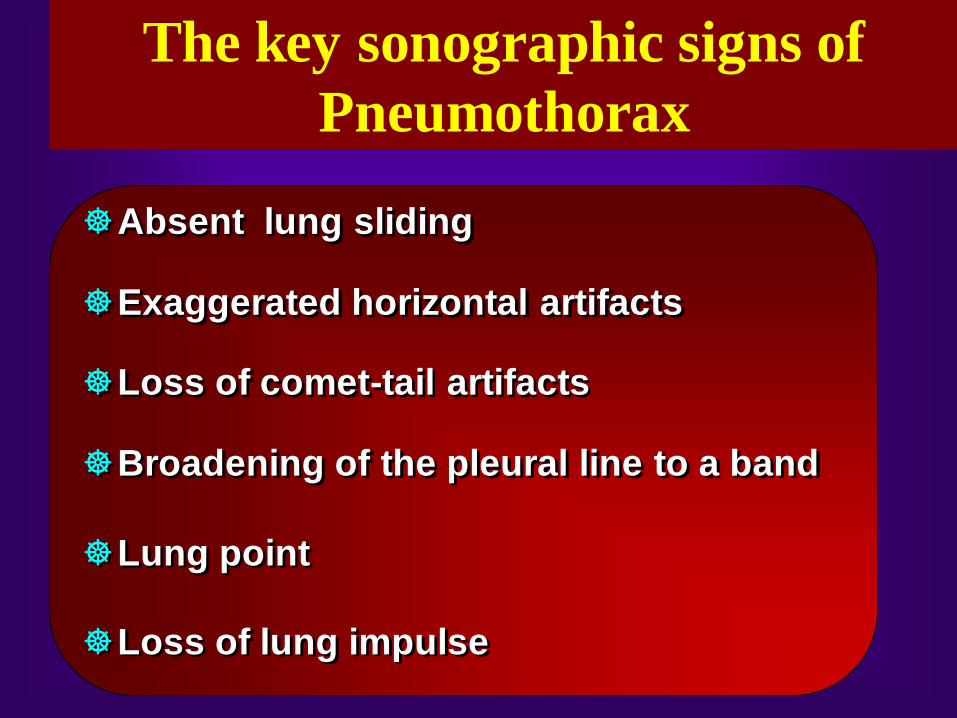
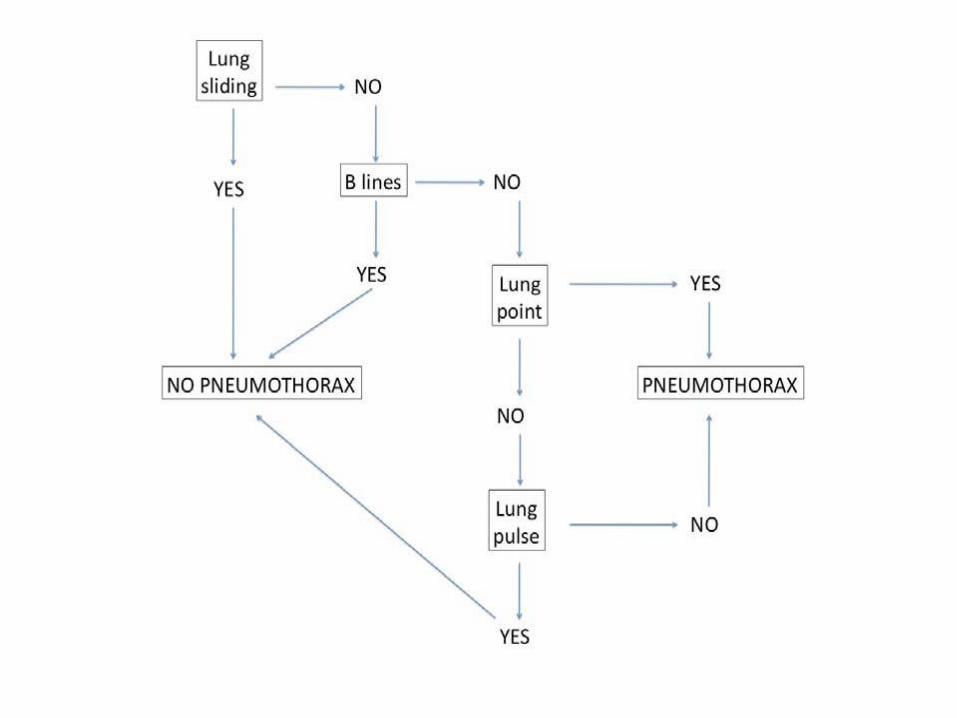
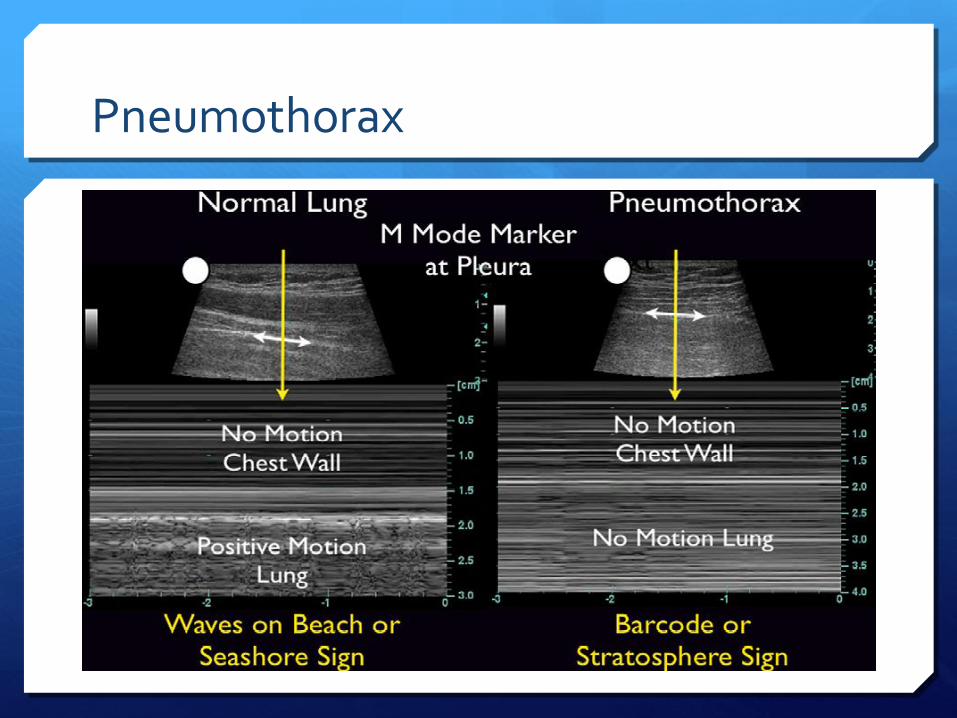
Absent lung sliding
Exaggerated horizontal artifacts
Loss of comet-tail artifacts
Broadening of the pleural line to a band
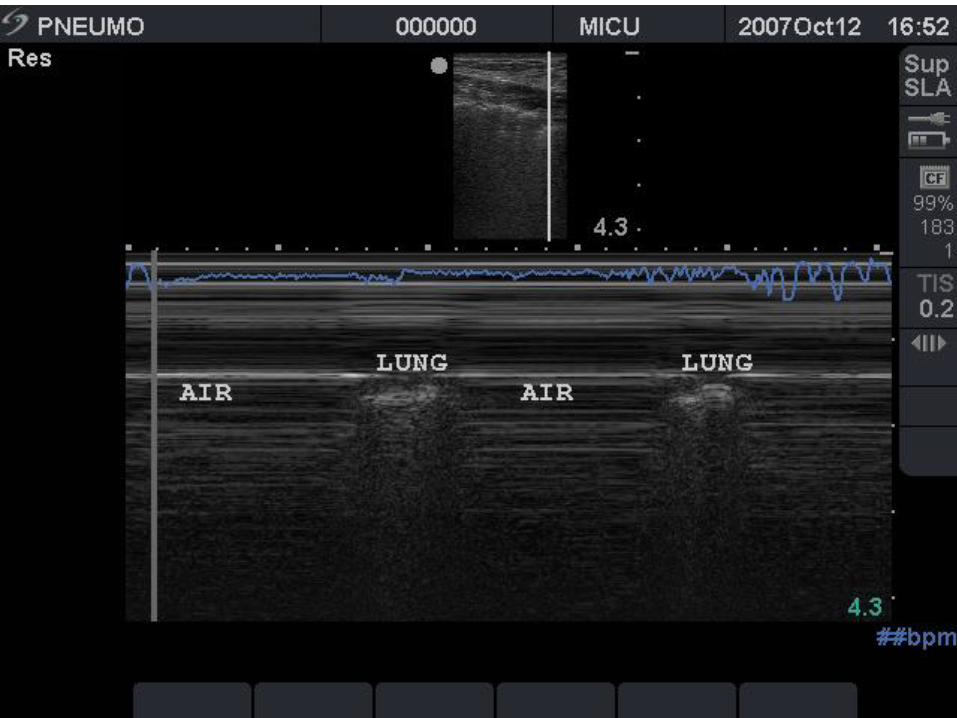
Lung point
Loss of lung impulse
The key sonographic signs of
Pneumothorax


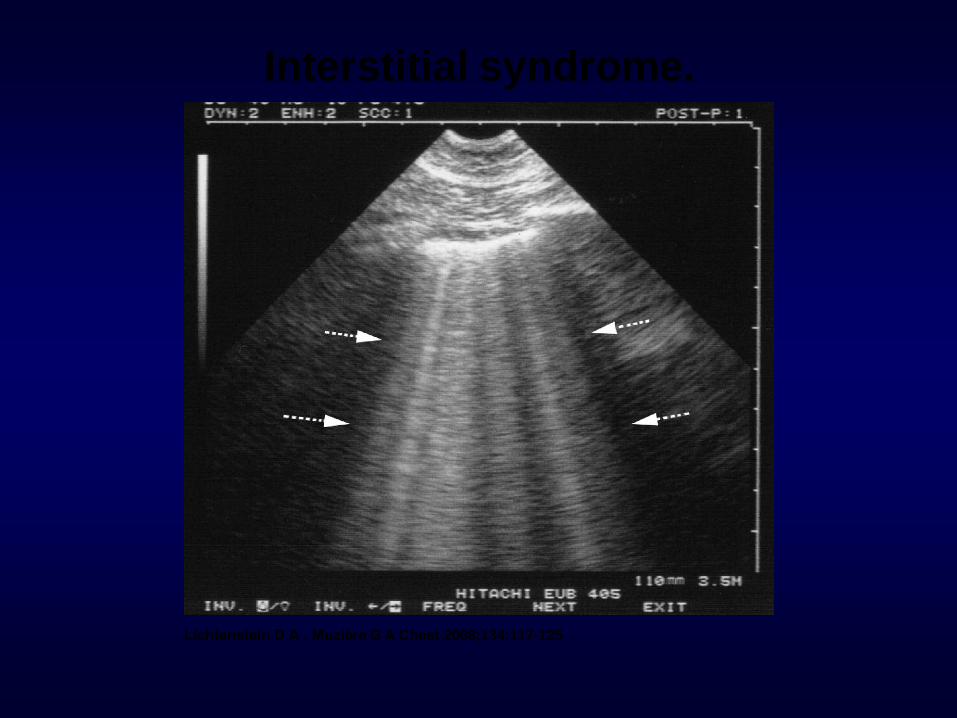
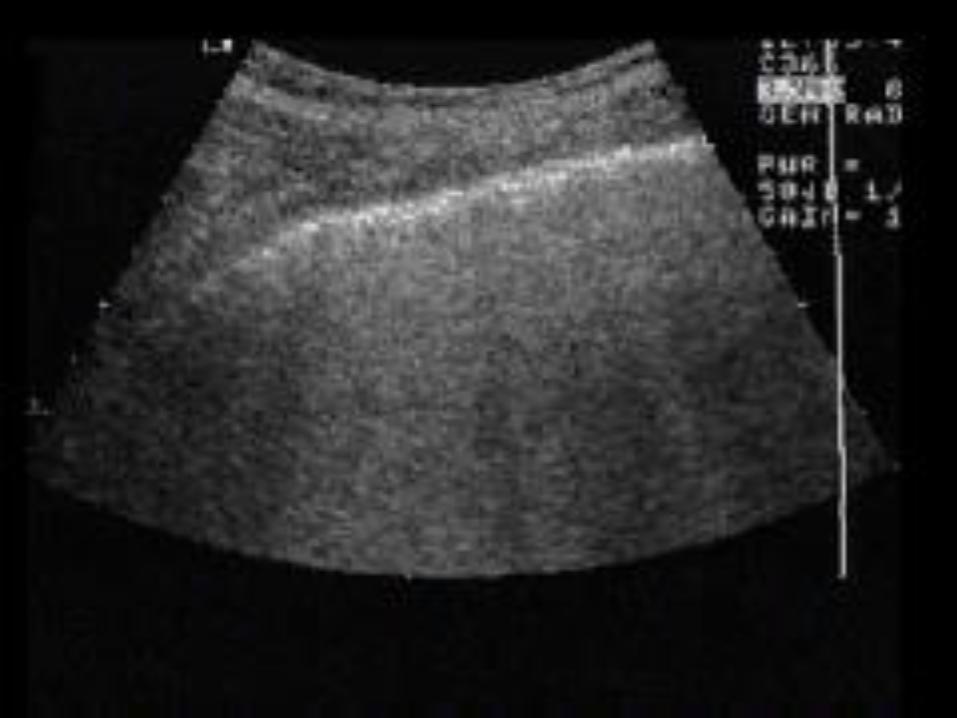
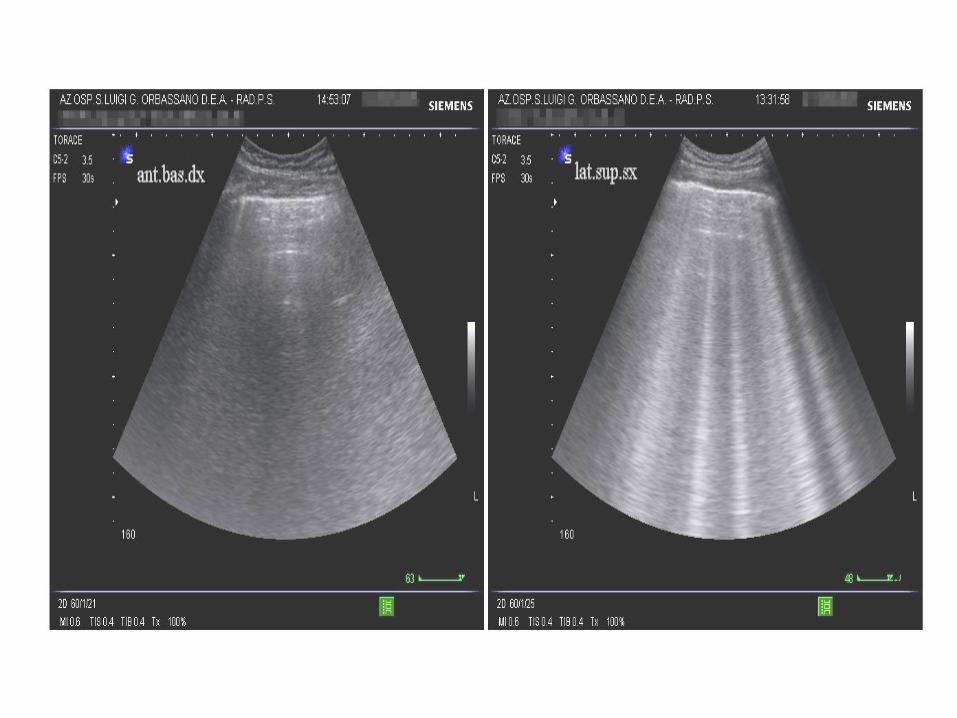
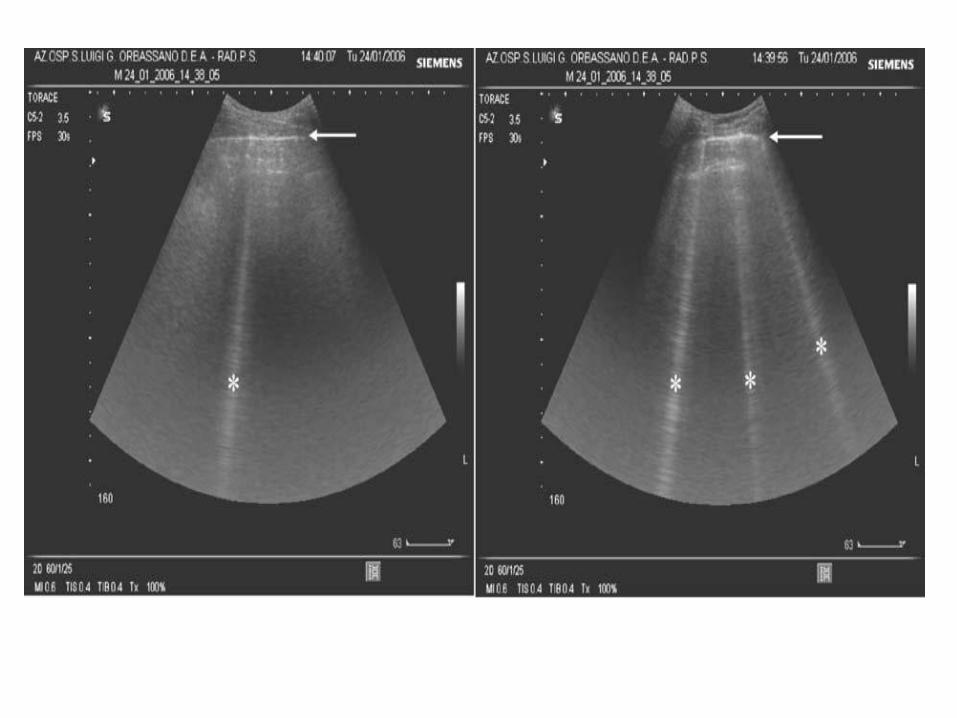
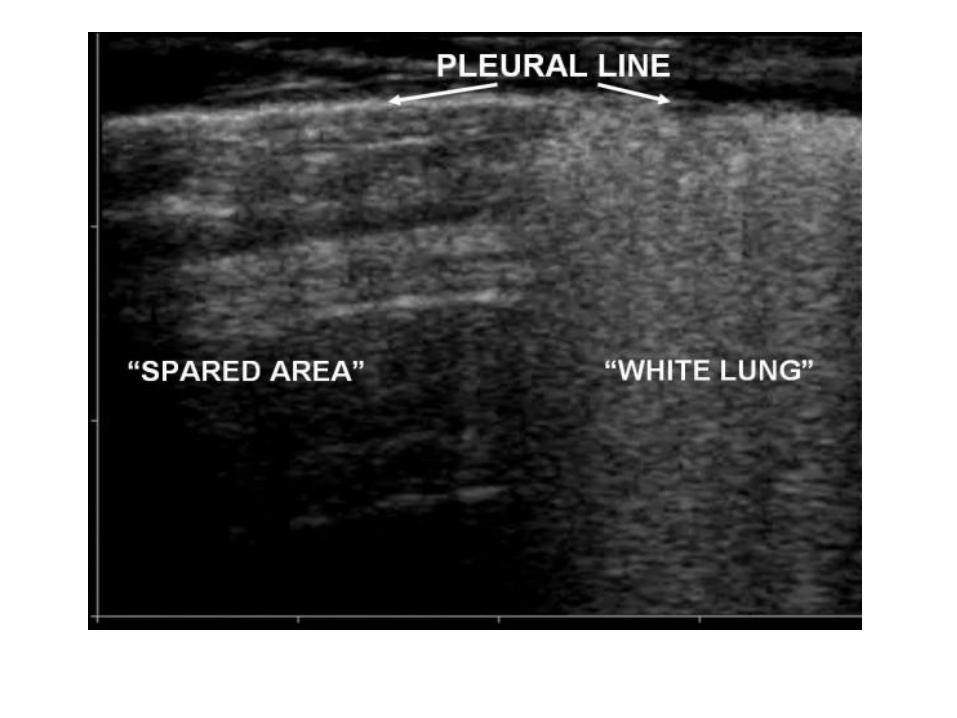
Interstitial syndrome.
Lichtenstein D A , Mezière G A Chest 2008;134:117-125
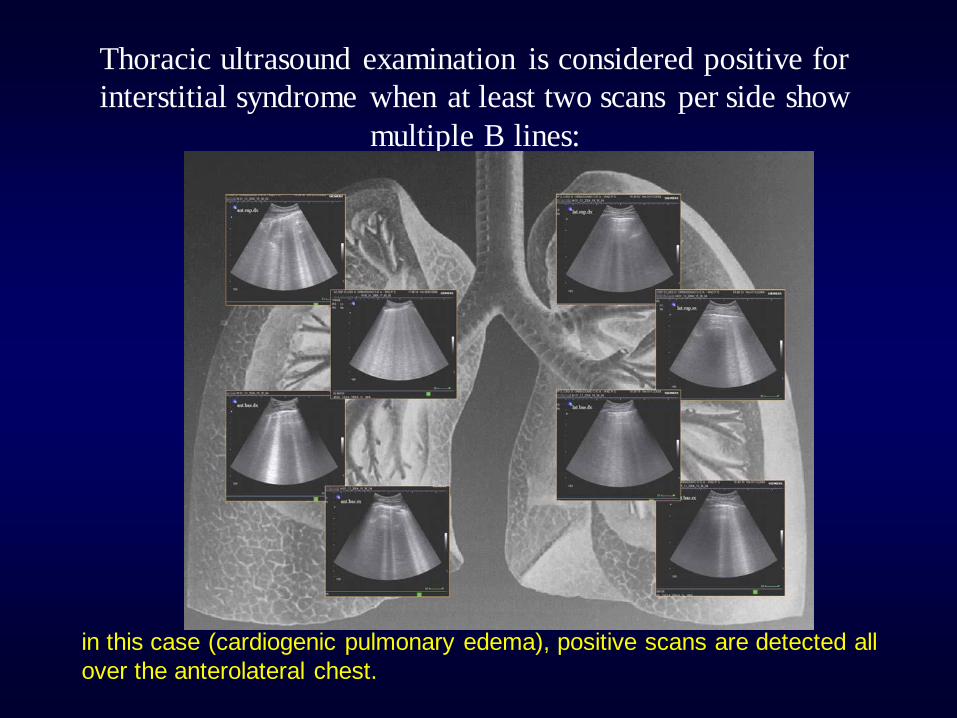
Thoracic ultrasound examination is considered positive for
interstitial syndrome when at least two scans per side show
multiple B lines:
in this case (cardiogenic pulmonary edema), positive scans are detected all
over the anterolateral chest.
Alveolar-interstitial syndrome
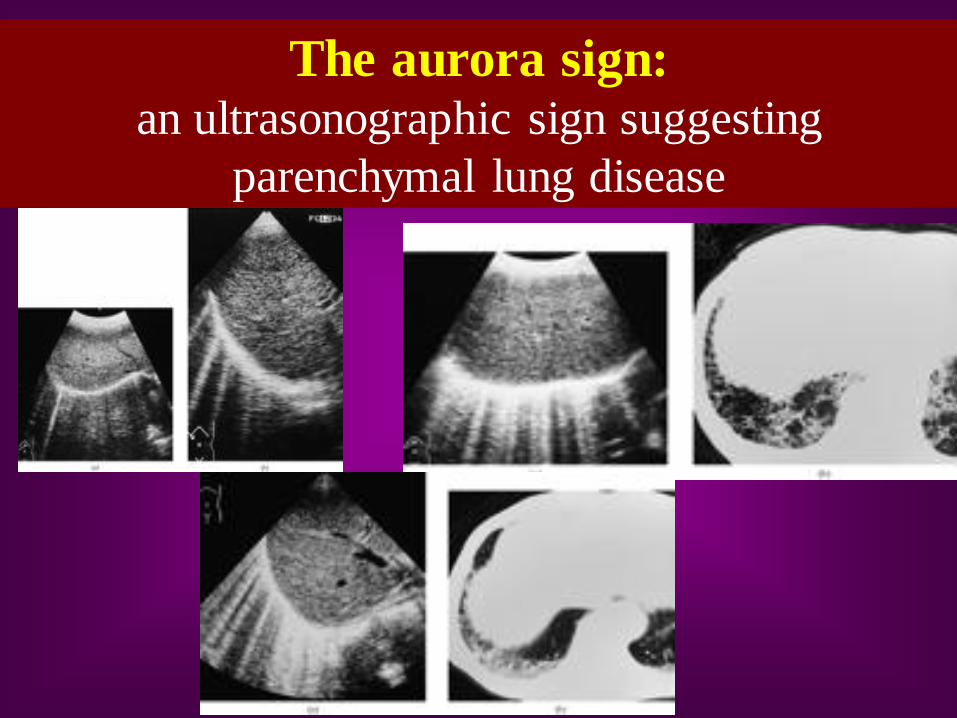
The aurora sign: an ultrasonographic sign suggesting
parenchymal lung disease
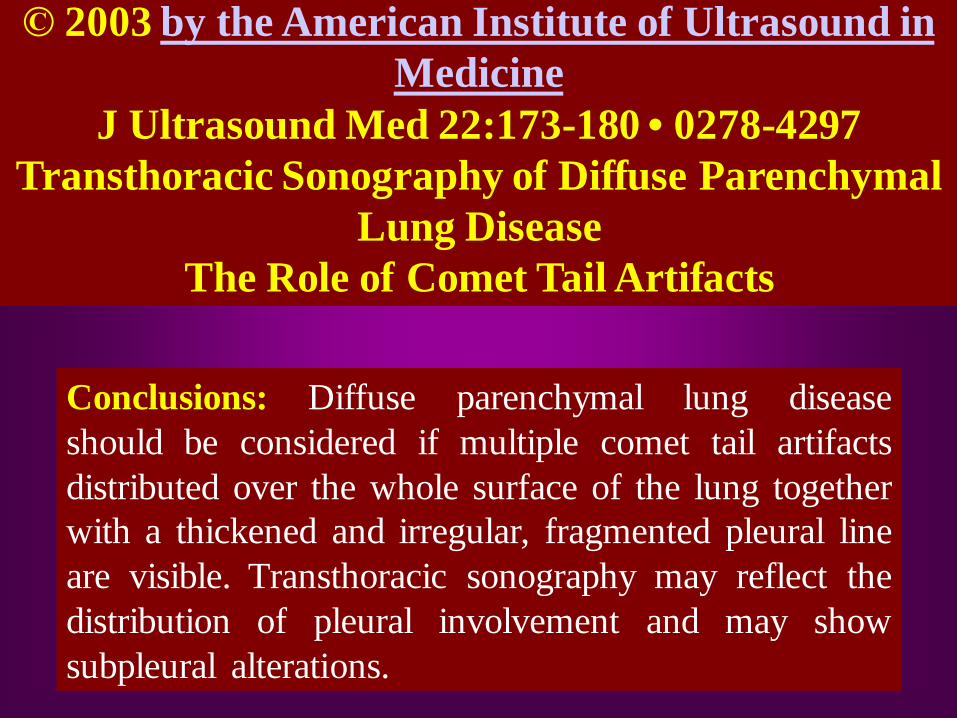
© 2003 by the American Institute of Ultrasound in
Medicine
J Ultrasound Med 22:173-180 • 0278-4297
Transthoracic Sonography of Diffuse Parenchymal
Lung Disease
The Role of Comet Tail Artifacts
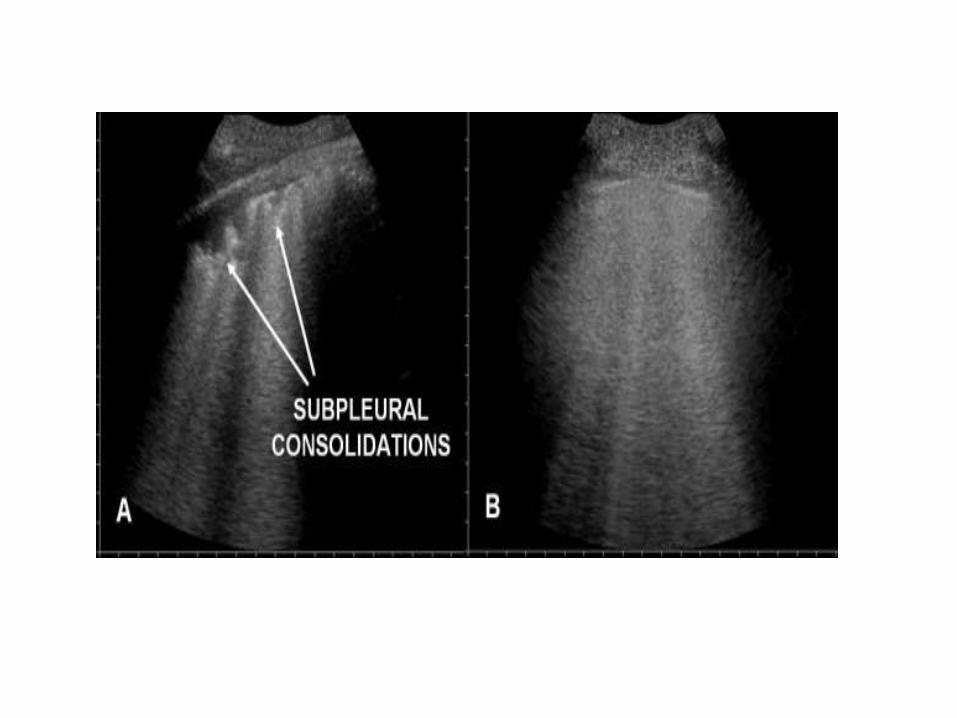
Conclusions: Diffuse parenchymal lung disease
should be considered if multiple comet tail artifacts
distributed over the whole surface of the lung together
with a thickened and irregular, fragmented pleural line
are visible. Transthoracic sonography may reflect the
distribution of pleural involvement and may show
subpleural alterations.
Am. J. Respir. Crit. Care Med.,
Volume 156, Number 5, November
1997, 1640-1646
The Comet-tail Artifact
An Ultrasound Sign of Alveolar-
Interstitial Syndrome
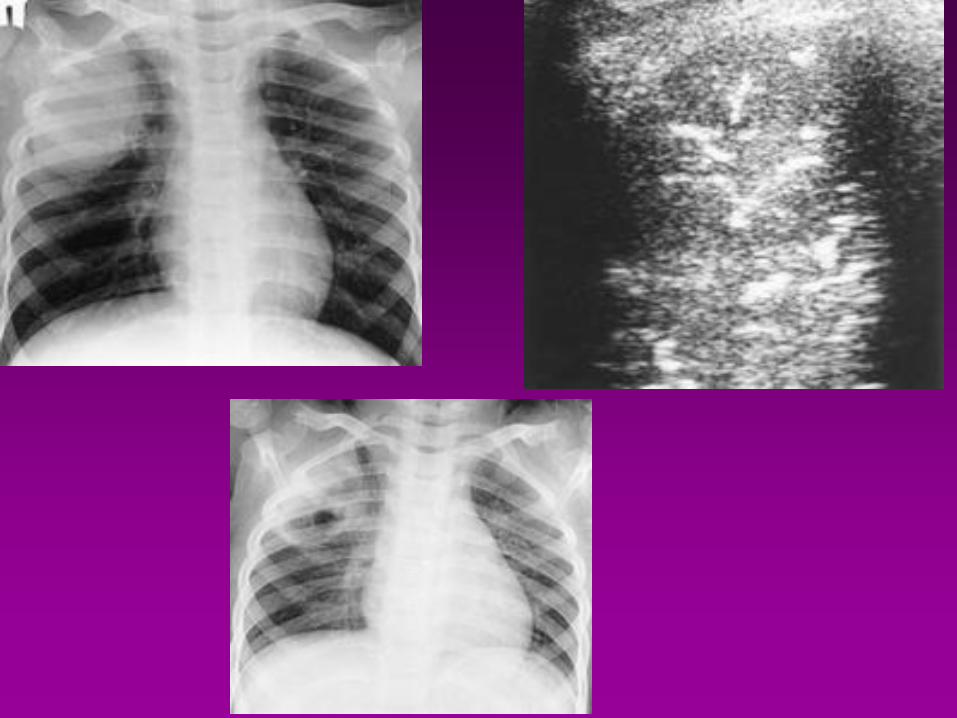
Pneumonia
• It is commonly visualized by TUS as a
hypoechoic consolidated area of varying size
and shape, with irregular borders.
• The echotexture can appear homogeneous or
inhomogeneous.
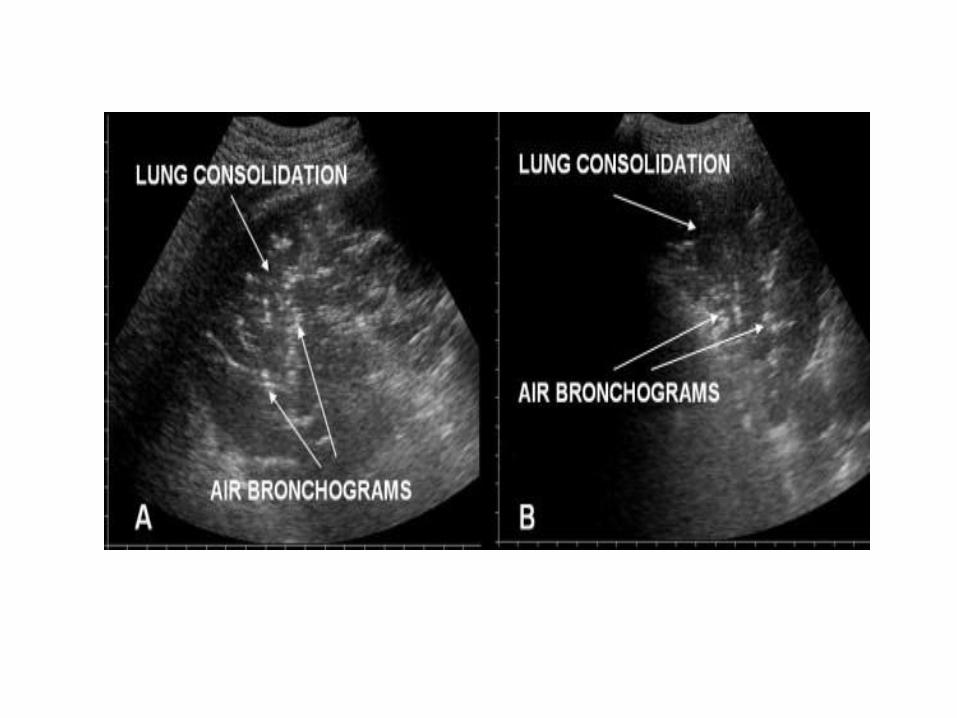
• The most common sonographic feature of
pneumonia is the air bronchogram, which is
characterized by lens-shape internal echoes
within the hypodense area or echogenic lines
and corresponds to air inclusions or air-filled
bronchioles and bronchi.
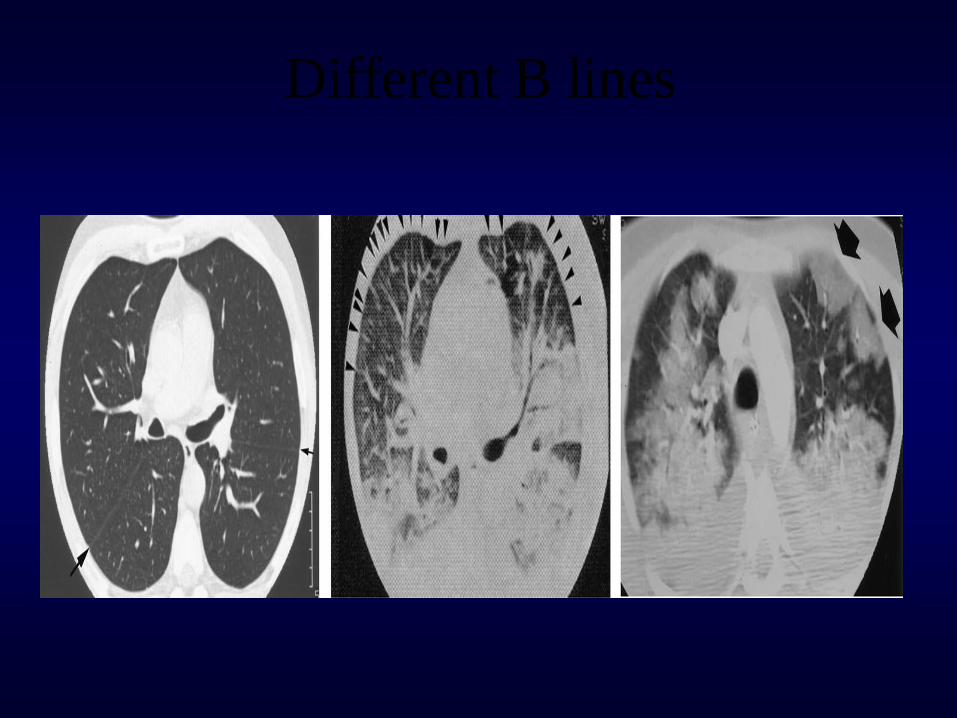
Different B lines
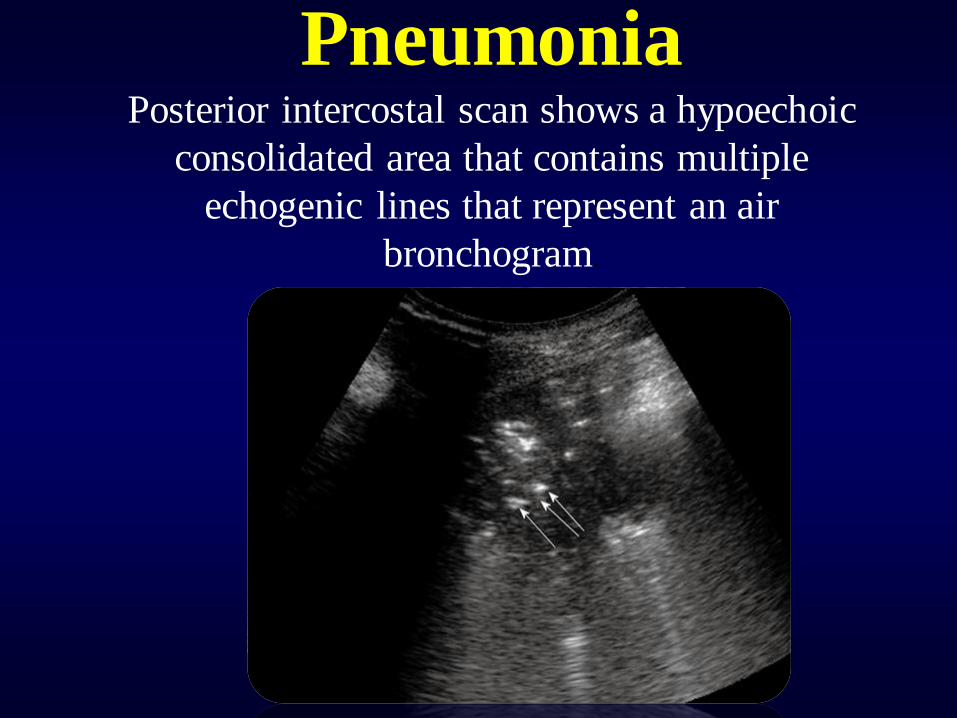
Pneumonia Posterior intercostal scan shows a hypoechoic
consolidated area that contains multiple
echogenic lines that represent an air
bronchogram.
Pneumonia; fluid bronchogram
• Conversely, the fluid
bronchogram is characterized
by anechoic or hypoechoic
tubular structures in the
bronchial tree.
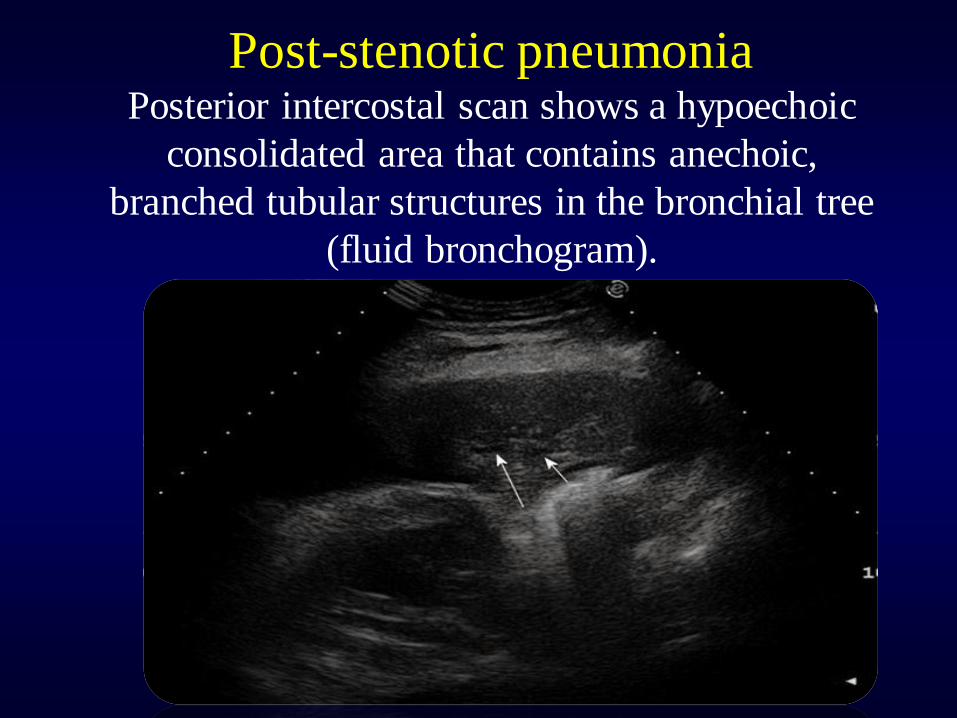
Post-stenotic pneumonia Posterior intercostal scan shows a hypoechoic
consolidated area that contains anechoic,
branched tubular structures in the bronchial tree
(fluid bronchogram).
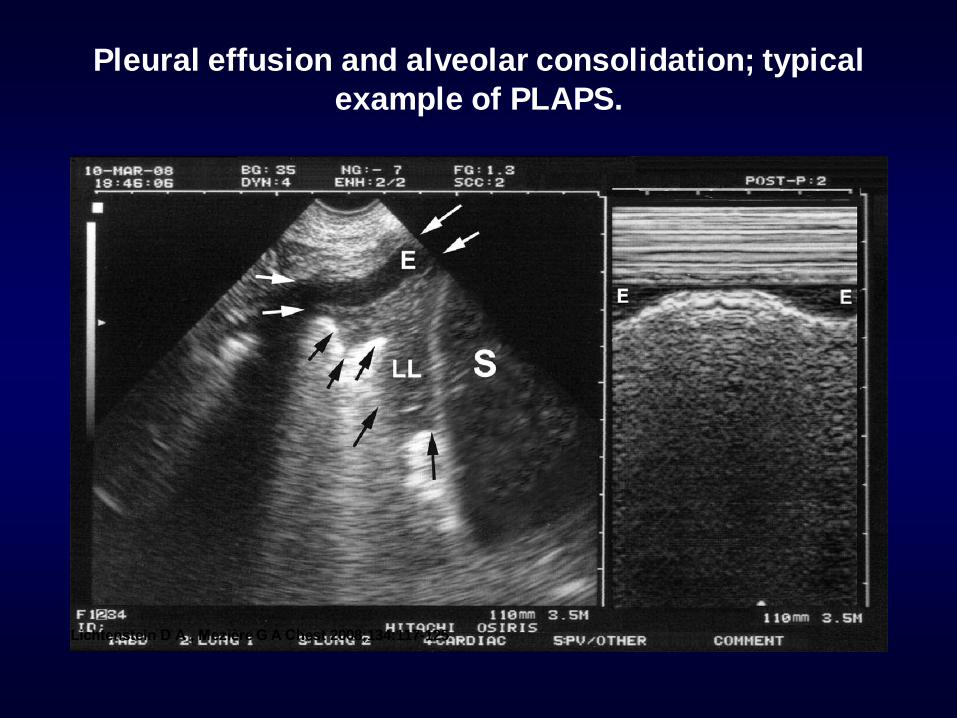
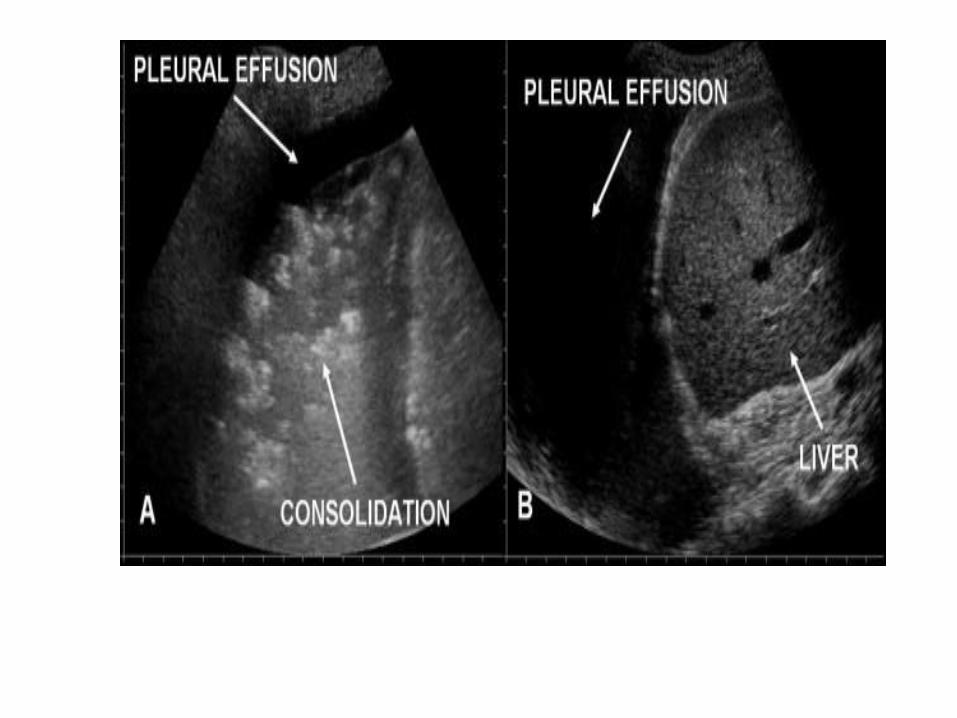
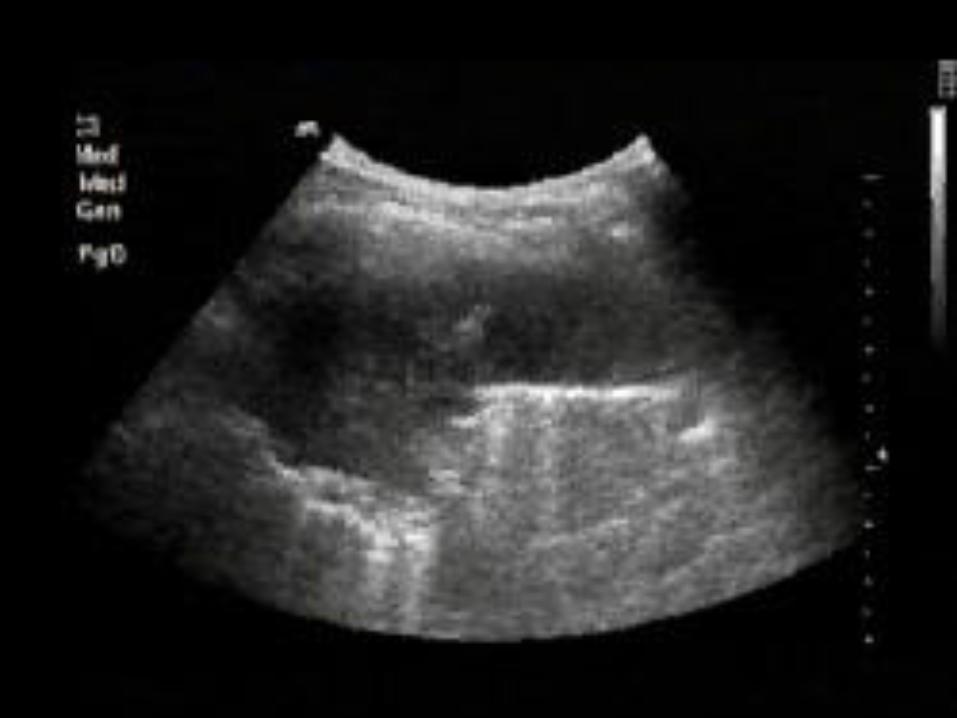
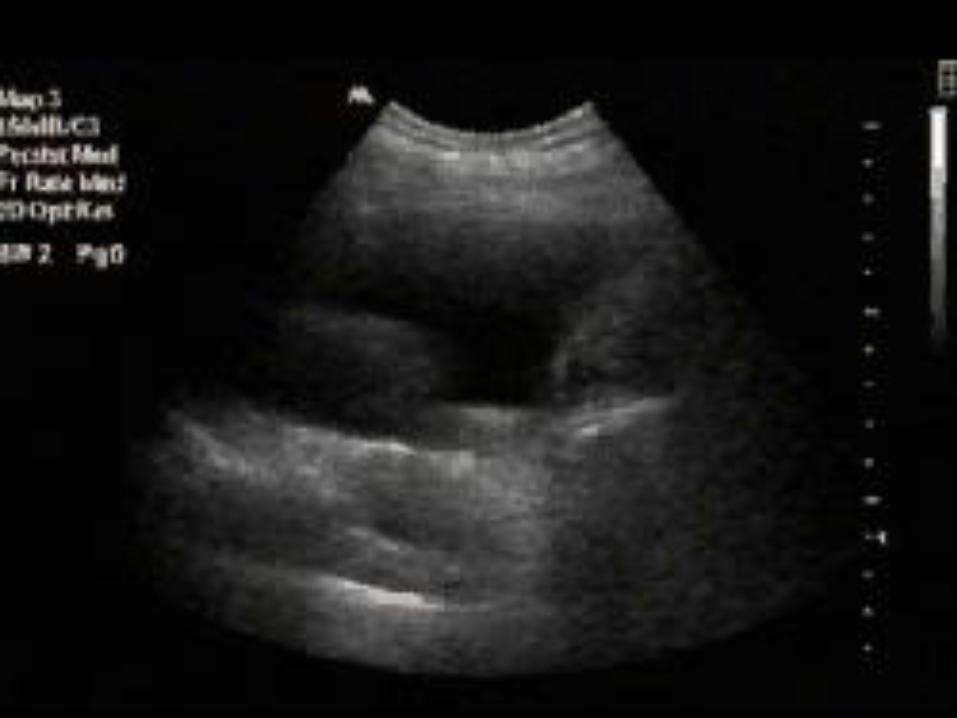
Pleural effusion and alveolar consolidation; typical
example of PLAPS.
Lichtenstein D A , Mezière G A Chest 2008;134:117-125
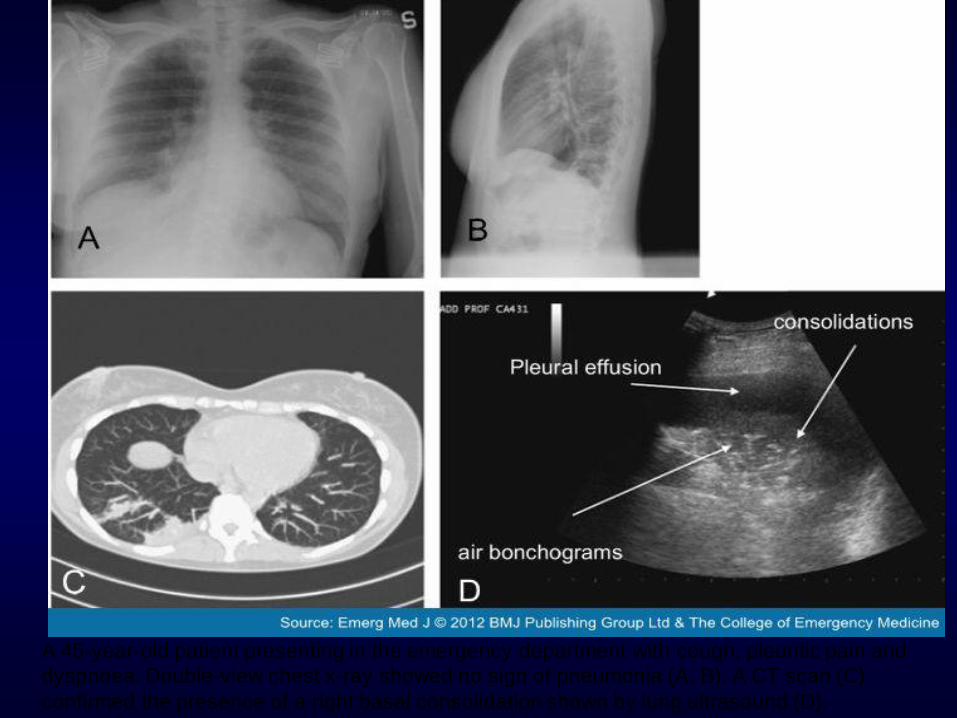
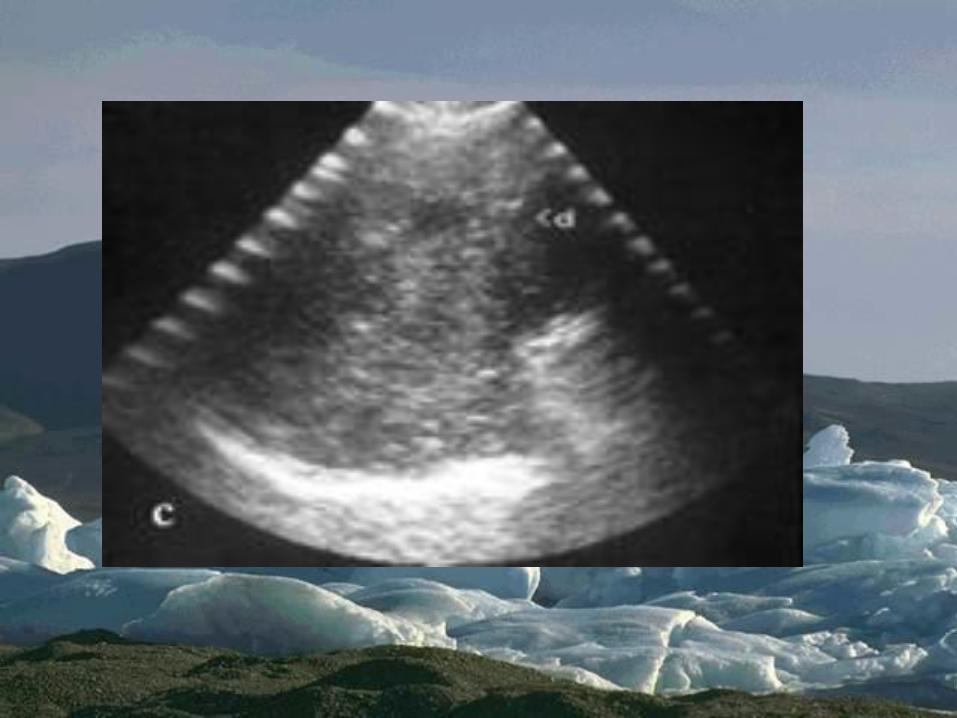
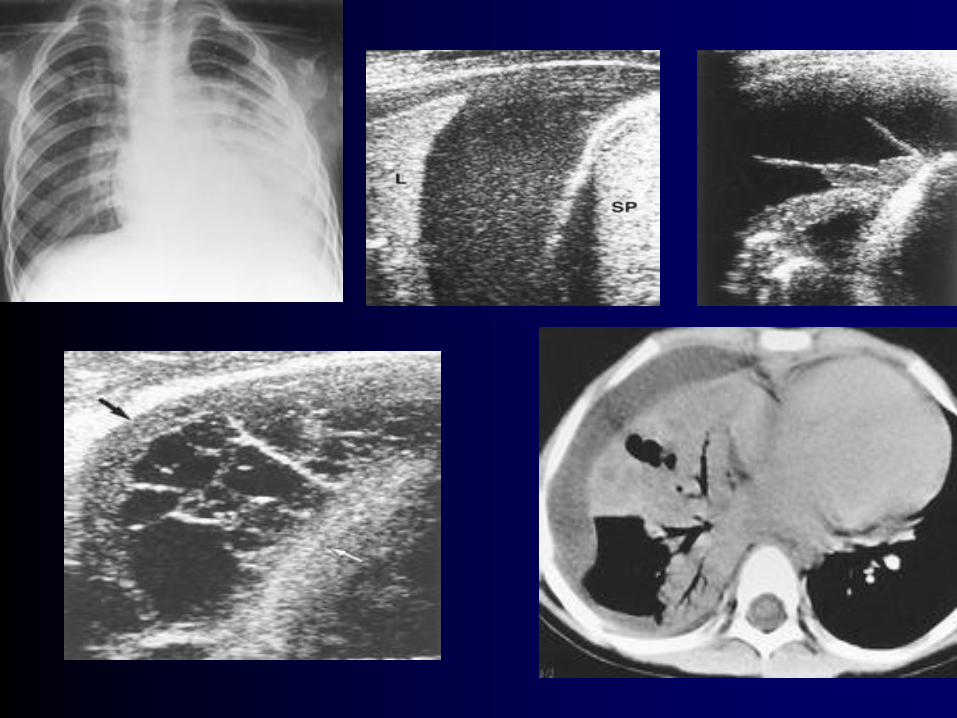
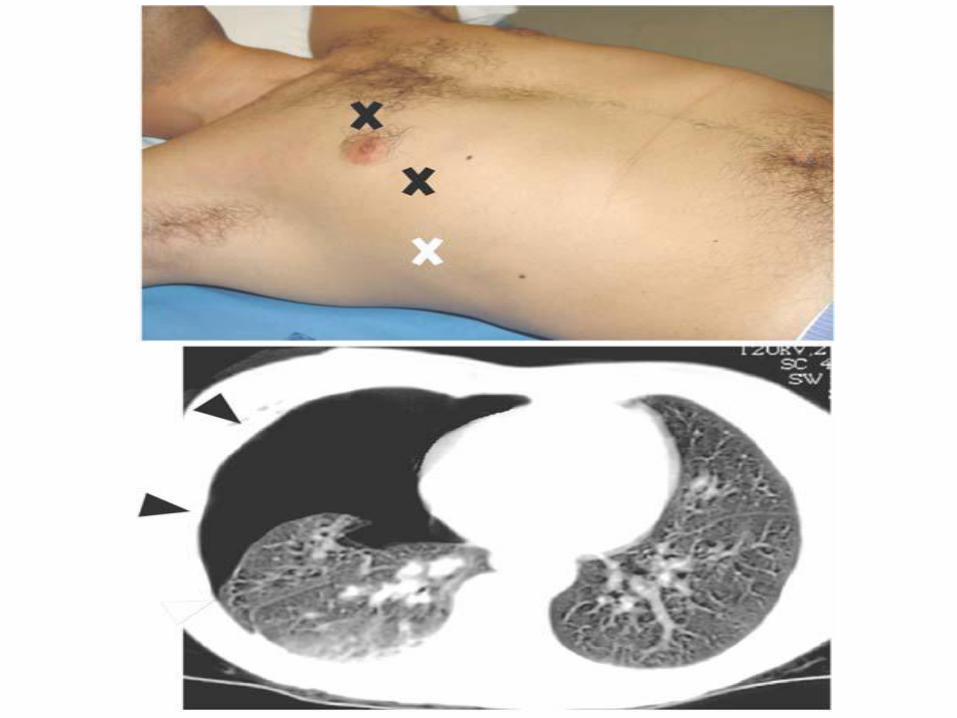
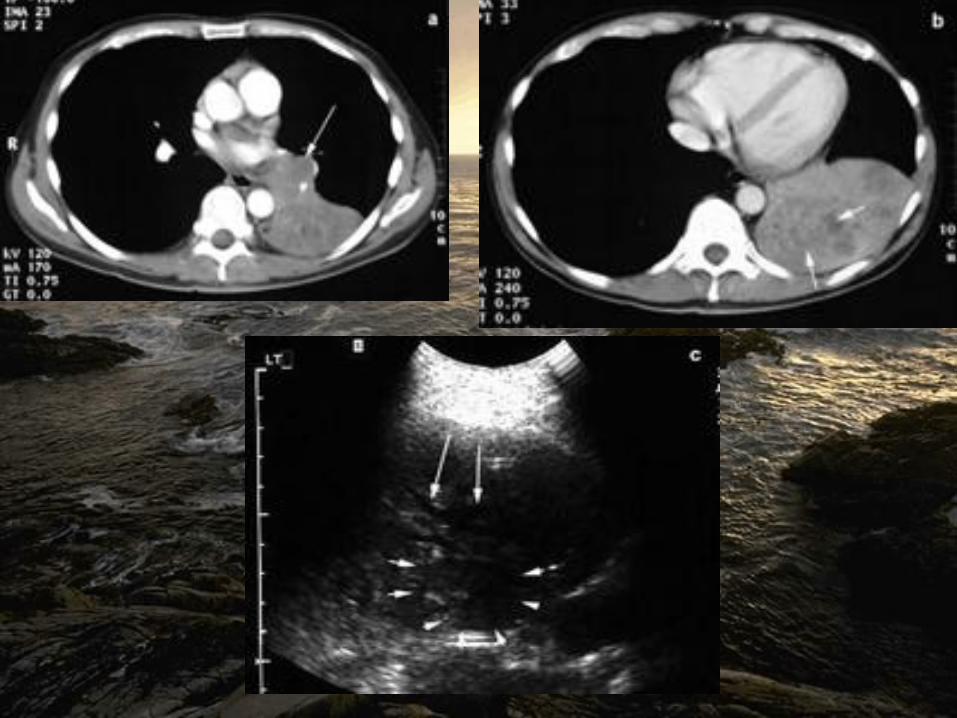
A 45-year-old patient presenting in the emergency department with cough, pleuritic pain and
dyspnoea. Double-view chest x-ray showed no sign of pneumonia (A, B). A CT scan (C)
confirmed the presence of a right basal consolidation shown by lung ultrasound (D).
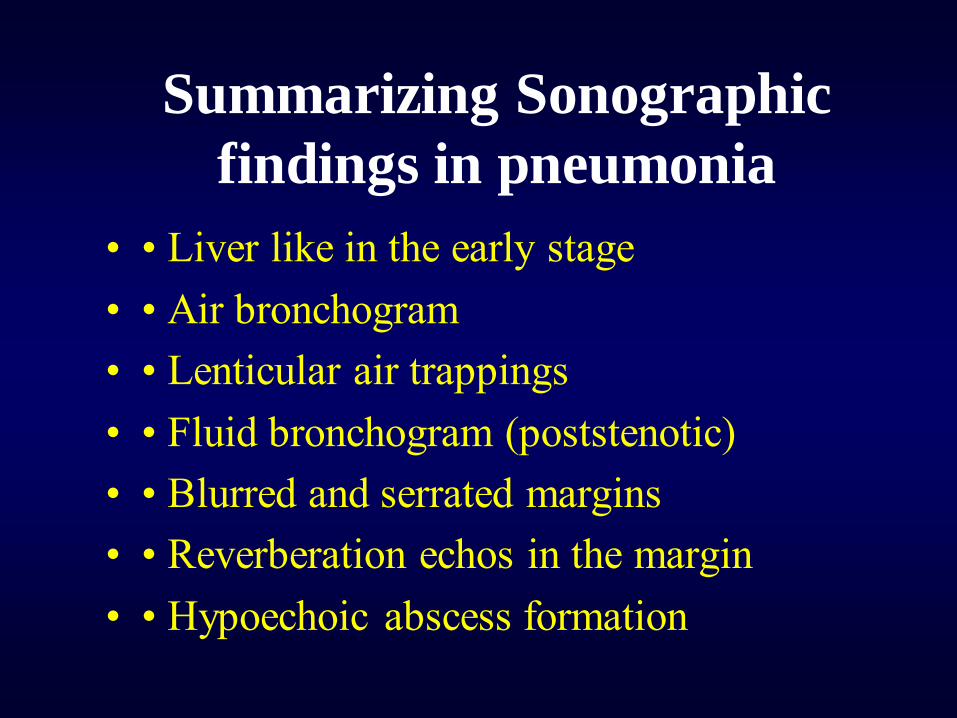
Summarizing Sonographic
findings in pneumonia
• • Liver like in the early stage
• • Air bronchogram
• • Lenticular air trappings
• • Fluid bronchogram (poststenotic)
• • Blurred and serrated margins
• • Reverberation echos in the margin
• • Hypoechoic abscess formation
Lung abscesses
• They typically appear as round or oval, largely
anechoic lesions.
• In the early stage, small abscesses are visible as
a pathological collection of fluid irregularly
settled in a consolidated, liver-like infiltrate.
• Depending on the capsule formation, the edge
of the abscess can be smooth and echodense.
• Microabscesses are often visible as anechoic
areas within the pneumonic consolidation.
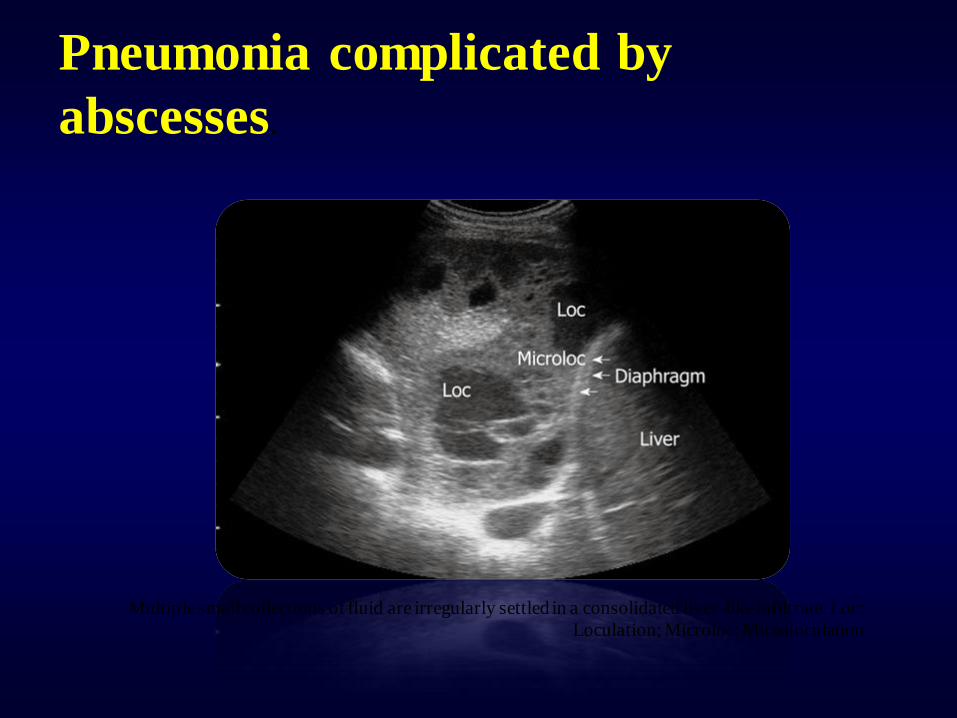
Pneumonia complicated by
abscesses.
Multiple small collections of fluid are irregularly settled in a consolidated liver-like infiltrate. Loc:
Loculation; Microloc: Microloculation
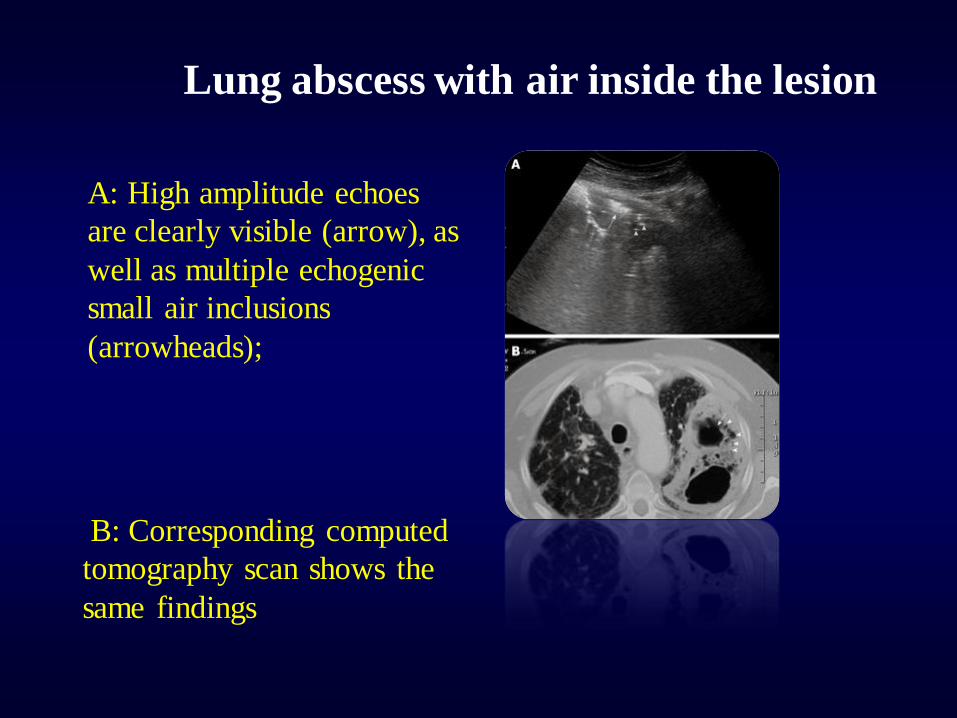
Lung abscess with air inside the lesion
A: High amplitude echoes
are clearly visible (arrow), as
well as multiple echogenic
small air inclusions
(arrowheads);
B: Corresponding computed
tomography scan shows the
same findings
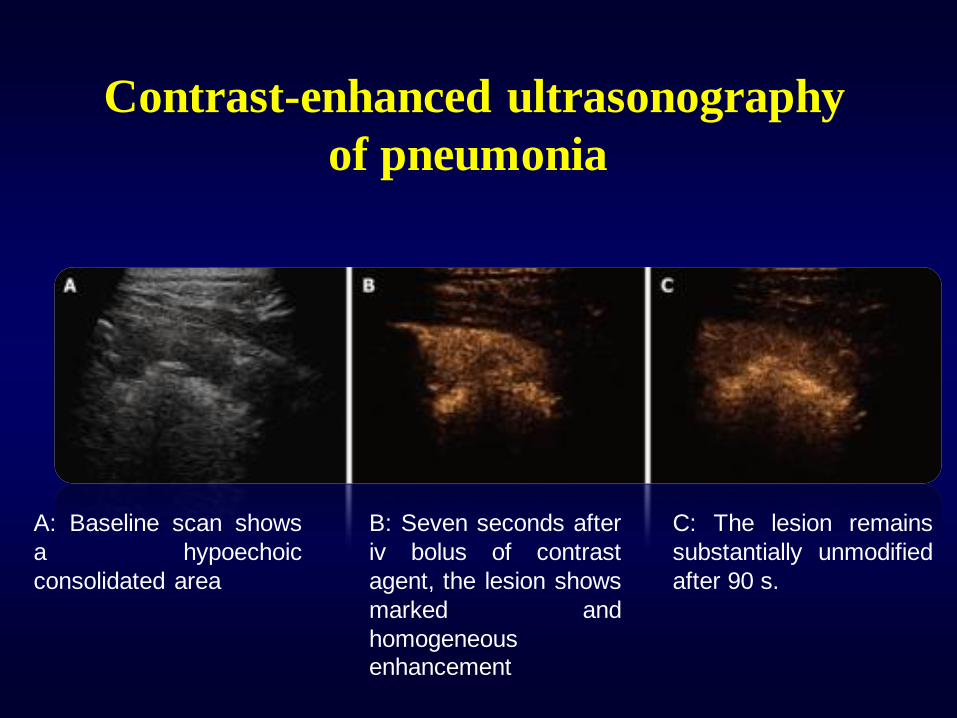
Contrast-enhanced ultrasonography
of pneumonia
A: Baseline scan shows
a hypoechoic
consolidated area
B: Seven seconds after
iv bolus of contrast
agent, the lesion shows
marked and
homogeneous enhancement
C: The lesion remains
substantially unmodified
after 90 s.
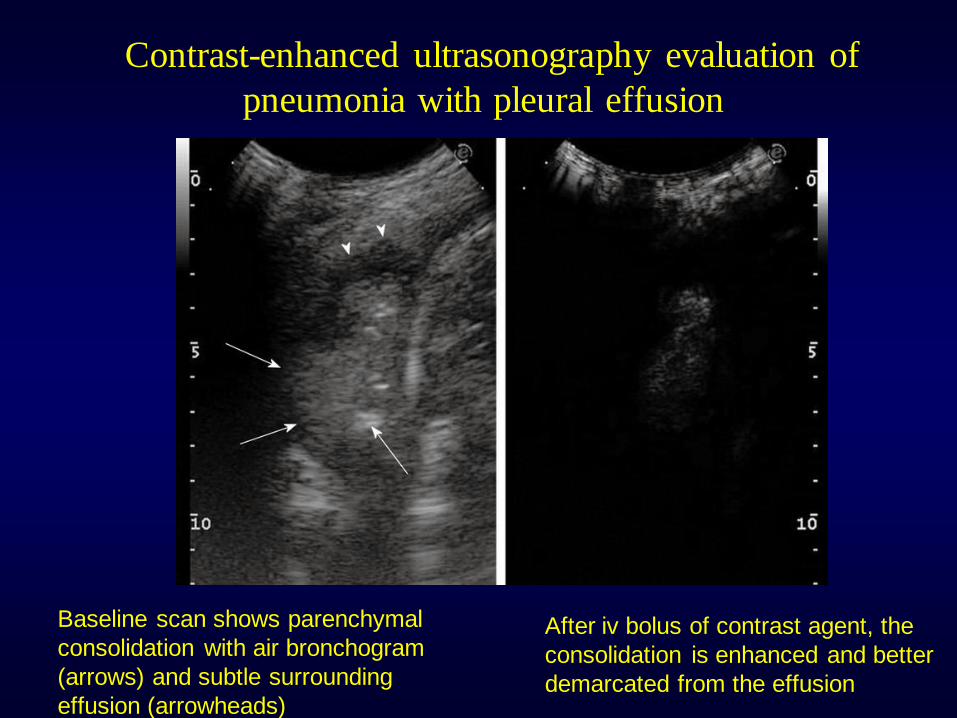
Contrast-enhanced ultrasonography evaluation of
pneumonia with pleural effusion.
Baseline scan shows parenchymal
consolidation with air bronchogram
(arrows) and subtle surrounding
effusion (arrowheads)
After iv bolus of contrast agent, the
consolidation is enhanced and better
demarcated from the effusion
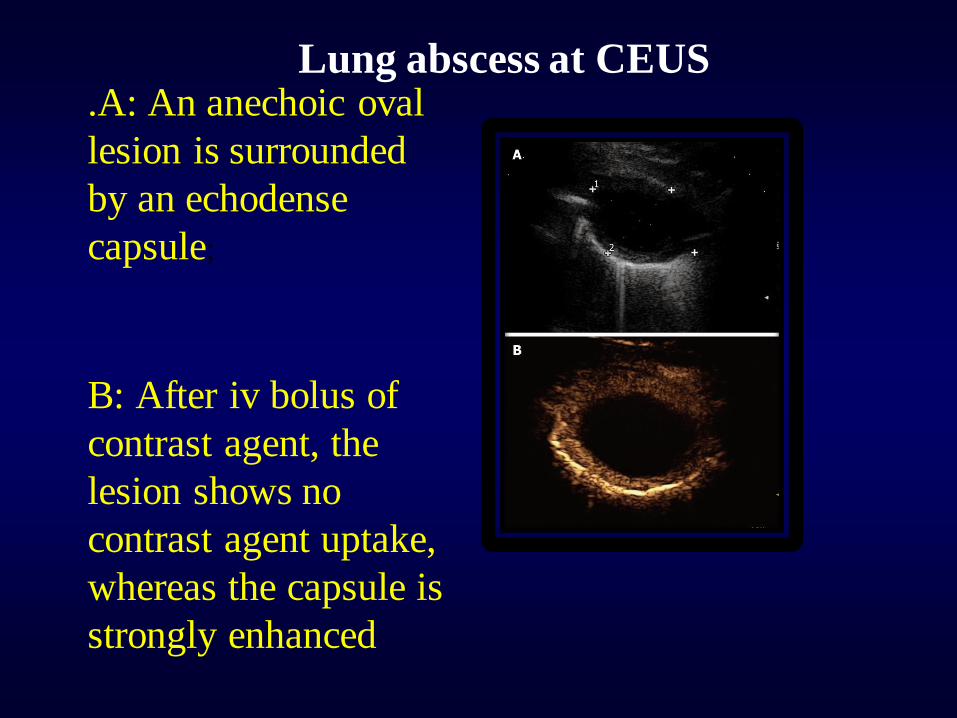
Lung abscess at CEUS .A: An anechoic oval
lesion is surrounded
by an echodense
capsule;
B: After iv bolus of
contrast agent, the
lesion shows no
contrast agent uptake,
whereas the capsule is
strongly enhanced
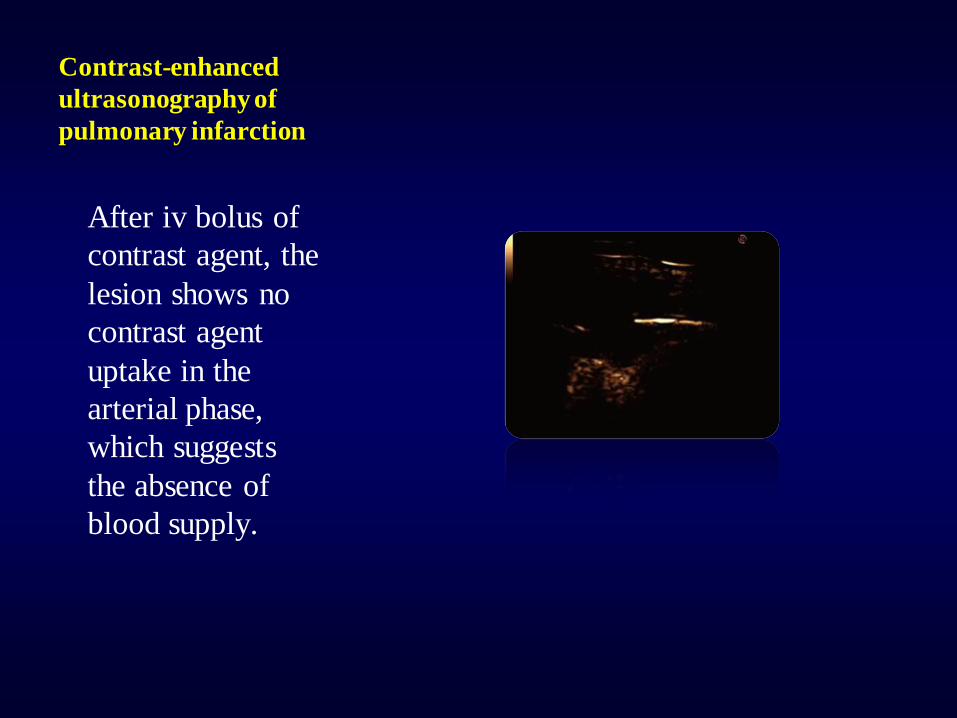
Contrast-enhanced
ultrasonography of
pulmonary infarction
After iv bolus of
contrast agent, the
lesion shows no
contrast agent
uptake in the
arterial phase,
which suggests
the absence of
blood supply.
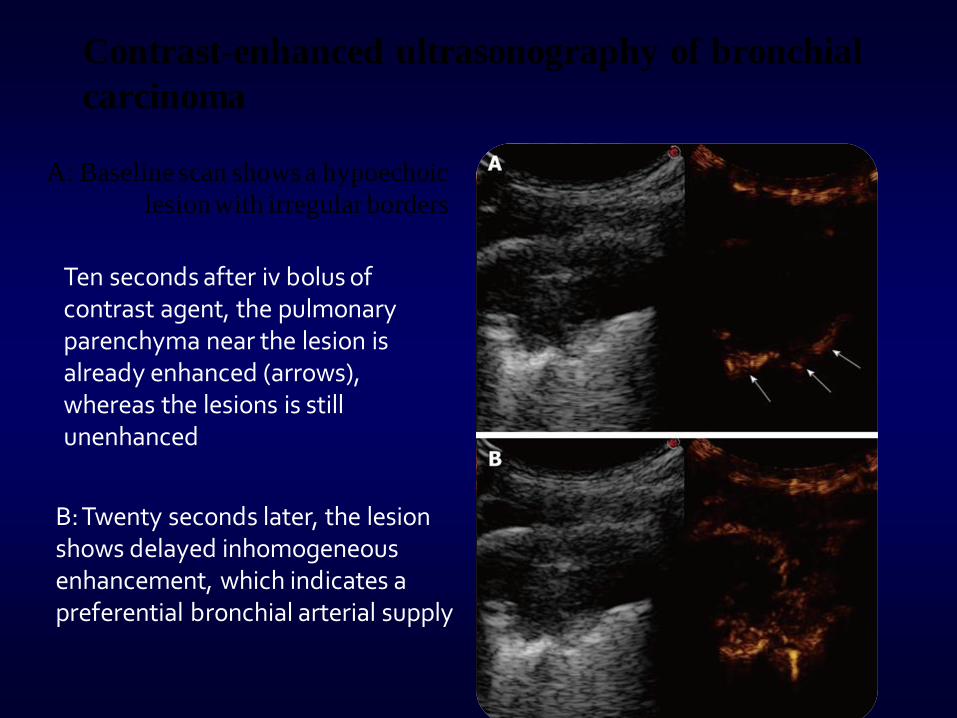
Contrast-enhanced ultrasonography of bronchial
carcinoma
A: Baseline scan shows a hypoechoic
lesion with irregular borders
Ten seconds after iv bolus of contrast agent, the pulmonary parenchyma near the lesion is already enhanced (arrows), whereas the lesions is still unenhanced
B: Twenty seconds later, the lesion shows delayed inhomogeneous enhancement, which indicates a preferential bronchial arterial supply
Pulmonary embolism (PE)
• The sensitivity of TUS for PE has been estimated to
range from 80% to 94%, the specificity from 84%
and 92%, and the overall accuracy from 82% to
91%.
• Although CTPA is undoubtedly the method of
choice to obtain a definitive diagnosis of PE, TUS
should be taken into consideration in some
circumstances, particularly in critically ill patients
who might not tolerate transport for other imaging
modalities, in cases of pregnancy, contrast agent
allergy, or renal failure.
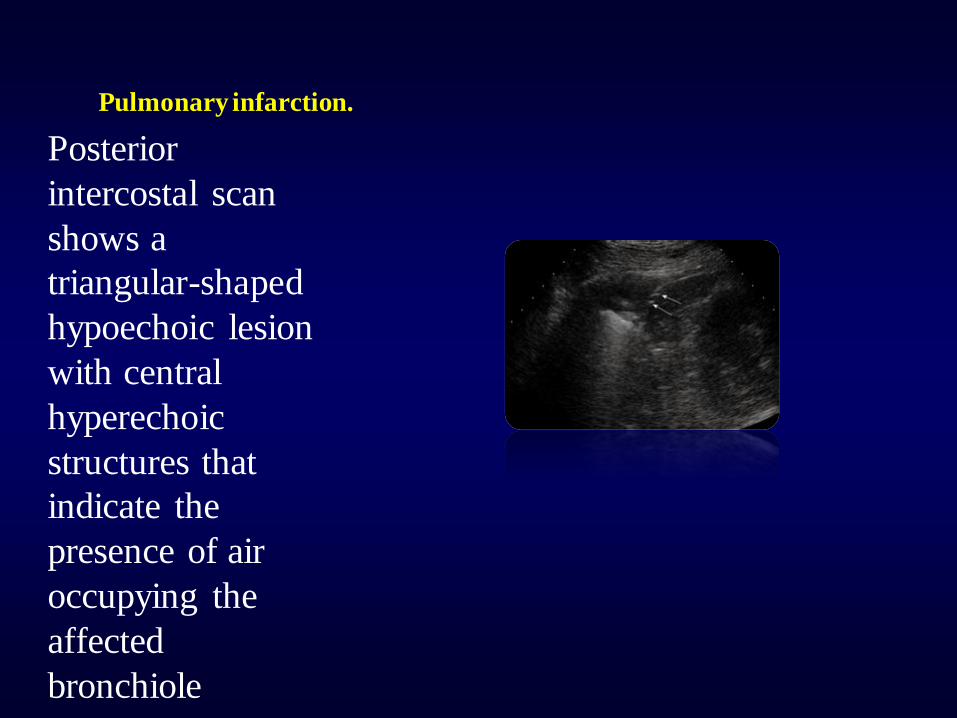
Pulmonary infarction.
Posterior
intercostal scan
shows a
triangular-shaped
hypoechoic lesion
with central
hyperechoic
structures that
indicate the
presence of air
occupying the
affected
bronchiole
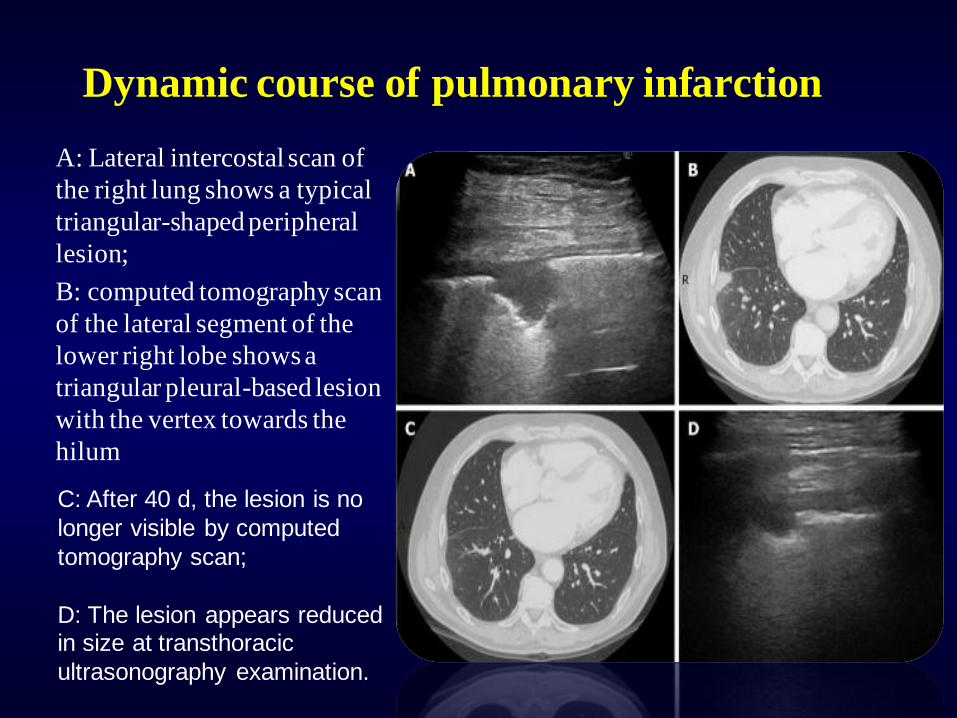
Dynamic course of pulmonary infarction
A: Lateral intercostal scan of
the right lung shows a typical
triangular-shaped peripheral
lesion;
B: computed tomography scan
of the lateral segment of the
lower right lobe shows a
triangular pleural-based lesion
with the vertex towards the
hilum
C: After 40 d, the lesion is no
longer visible by computed
tomography scan;
D: The lesion appears reduced in size at transthoracic
ultrasonography examination.
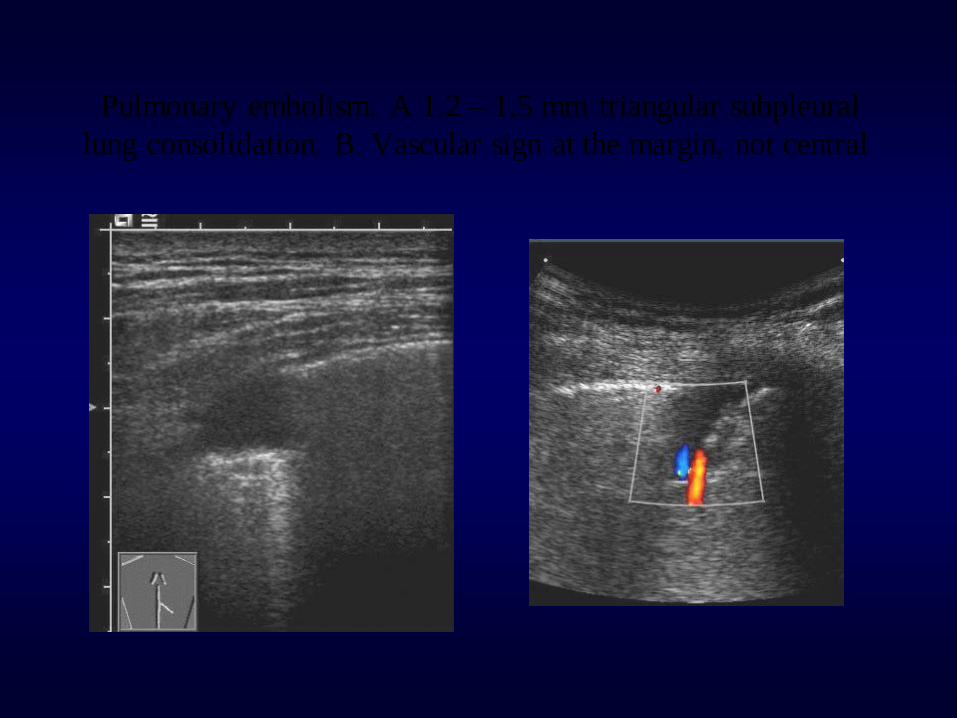
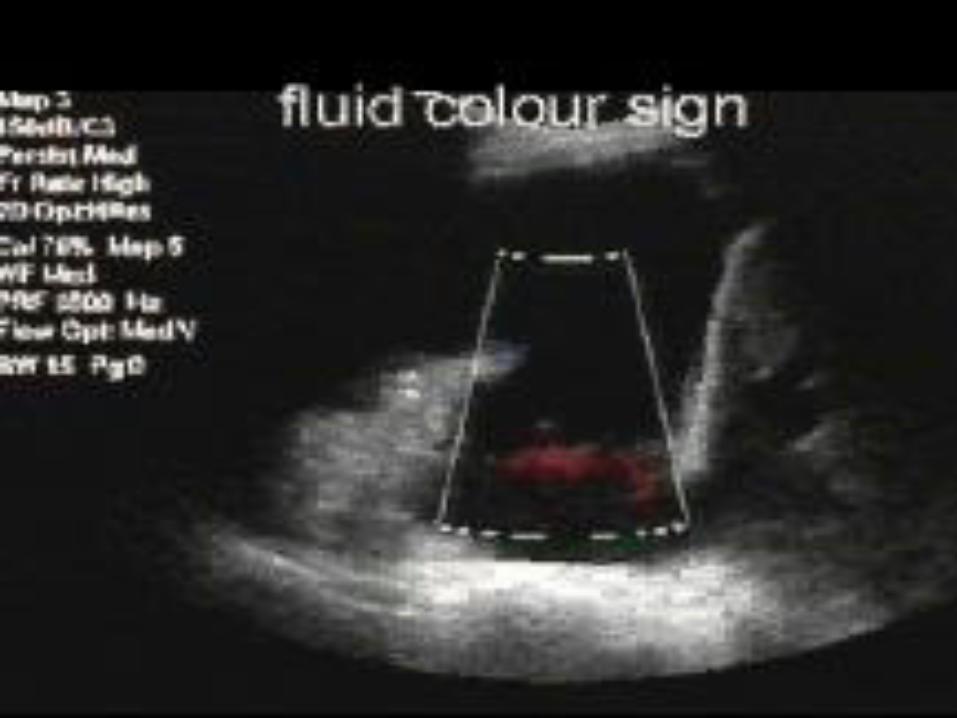
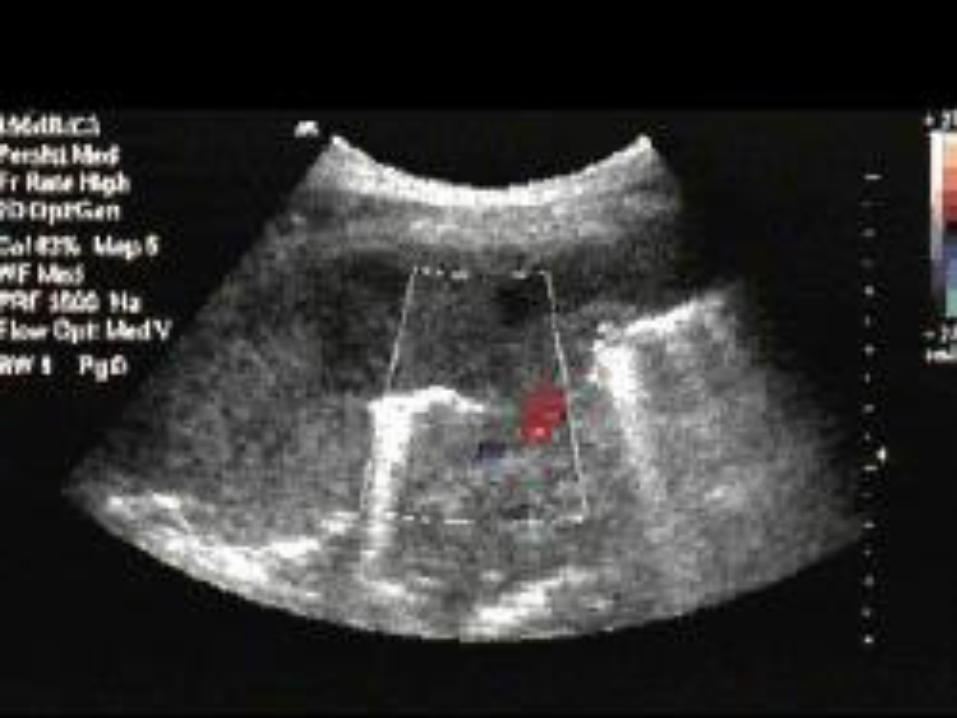
Pulmonary embolism. A 1.2 – 1.5 mm triangular subpleural
lung consolidation. B. Vascular sign at the margin, not central
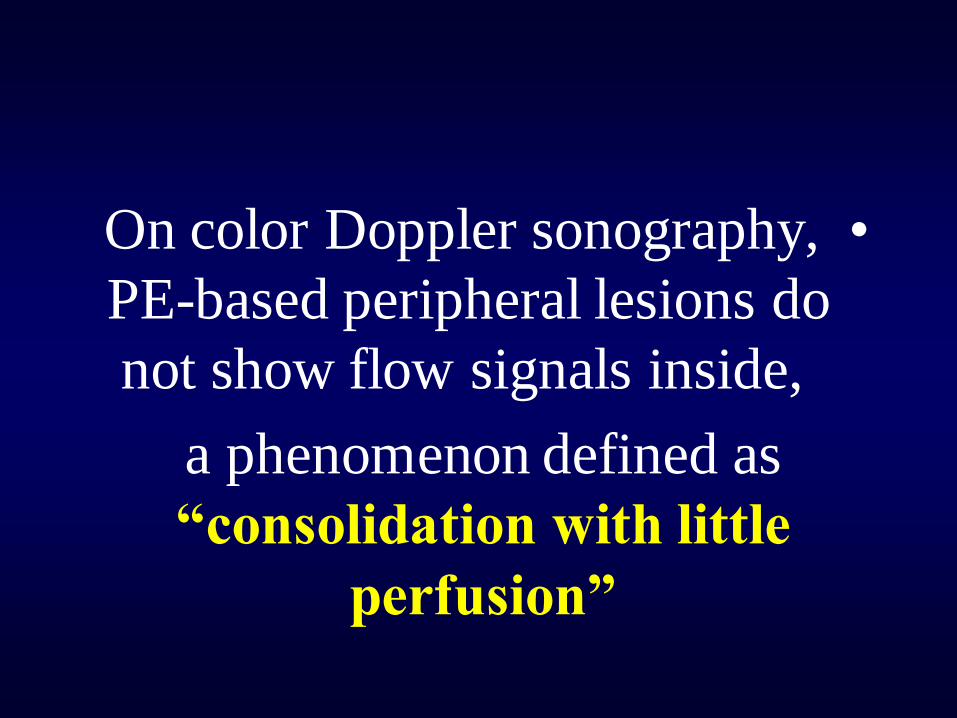
•On color Doppler sonography,
PE-based peripheral lesions do
not show flow signals inside,
a phenomenon defined as
“consolidation with little
perfusion”
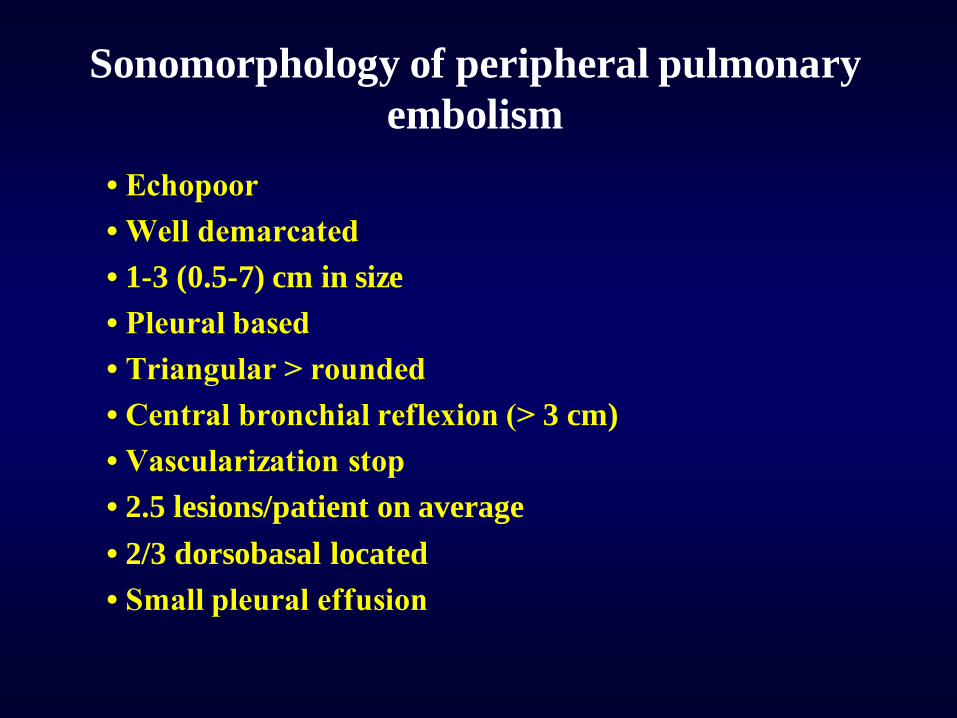
Sonomorphology of peripheral pulmonary
embolism
• Echopoor
• Well demarcated
• 1-3 (0.5-7) cm in size
• Pleural based
• Triangular > rounded
• Central bronchial reflexion (> 3 cm)
• Vascularization stop
• 2.5 lesions/patient on average
• 2/3 dorsobasal located
• Small pleural effusion
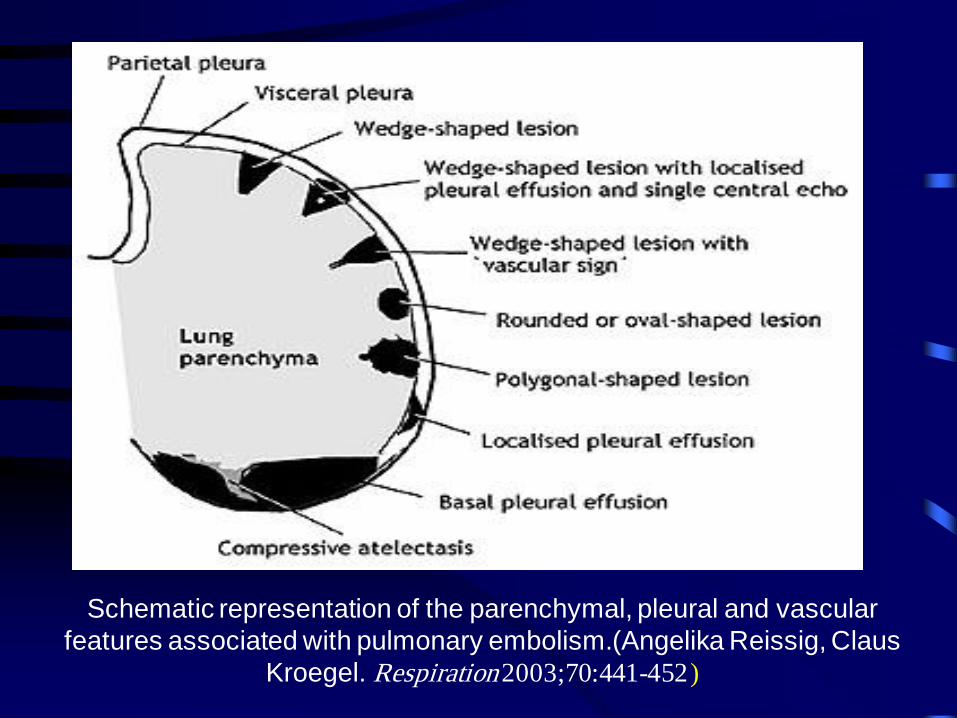
Schematic representation of the parenchymal, pleural and vascular
features associated with pulmonary embolism.(Angelika Reissig, Claus
Kroegel. Respiration 2003;70:441-452 )
The Late sign of atelectasis:
• The late sign appeared when the air inside the
consolidation was progressively absorbed, which
yielded a loss of volume of the lesion with the
typical static air bronchogram inside.
• Pleural effusion is almost always associated with
compression atelectasis and frequently with
obstructive atelectasis.
• In the case of compression atelectasis, the
effusion is typically larger compared to that
associated with obstructive atelectasis.
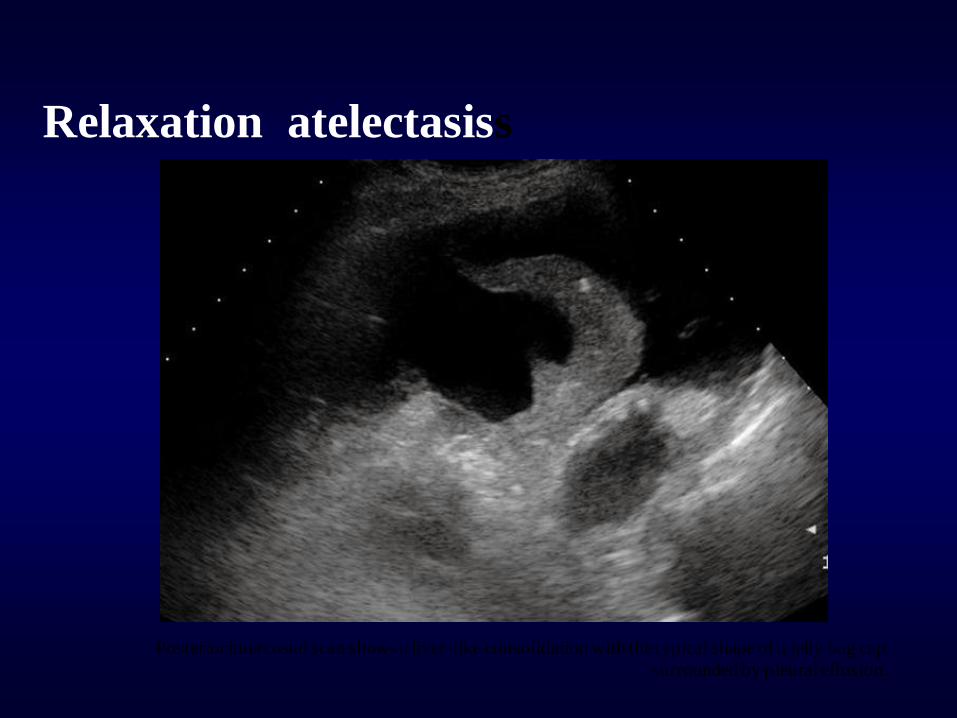
Relaxation atelectasiss
Posterior intercostal scan shows a liver-like consolidation with the typical shape of a jelly bag cap
surrounded by pleural effusion.
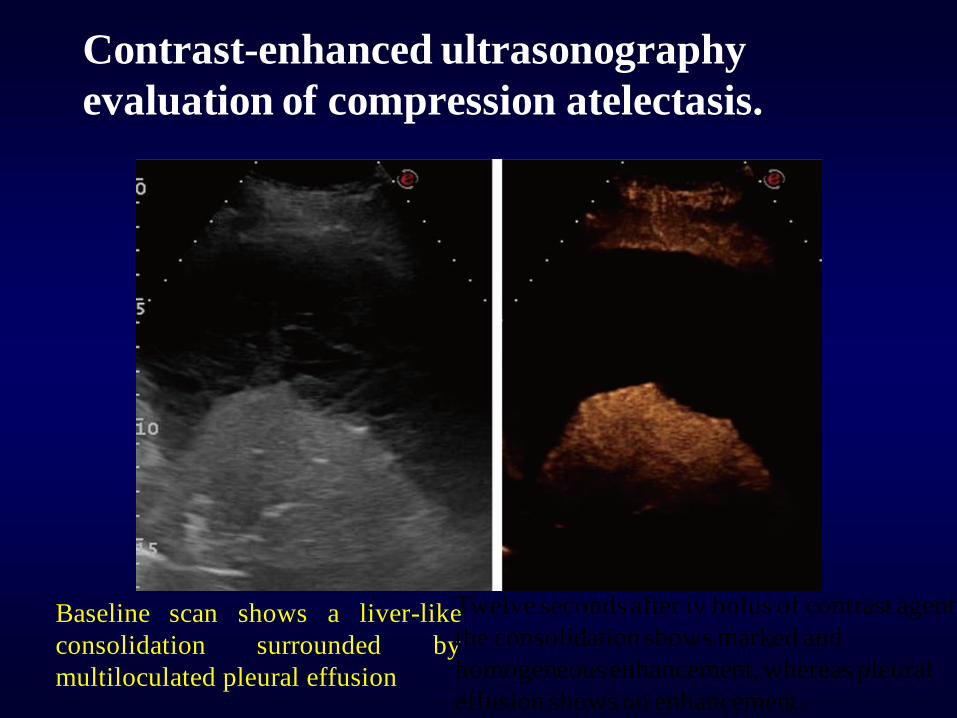
Contrast-enhanced ultrasonography
evaluation of compression atelectasis.
Baseline scan shows a liver-like
consolidation surrounded by
multiloculated pleural effusion
Twelve seconds after iv bolus of contrast agent,
the consolidation shows marked and
homogeneous enhancement, whereas pleural
effusion shows no enhancement.

Obstructive atelectasis
• It shows a liver-like and inhomogeneous
echotexture with secretion-filled bronchi (fluid
bronchogram) and variable shape.
• The real-time TUS visualization of
bronchograms during breathing movements can
often enable one to distinguish between
obstructive atelectasis and pneumonia.
• The presence of the dynamic air bronchogram
indicates pneumonia, while a static air
bronchogram suggests obstructive atelectasis.
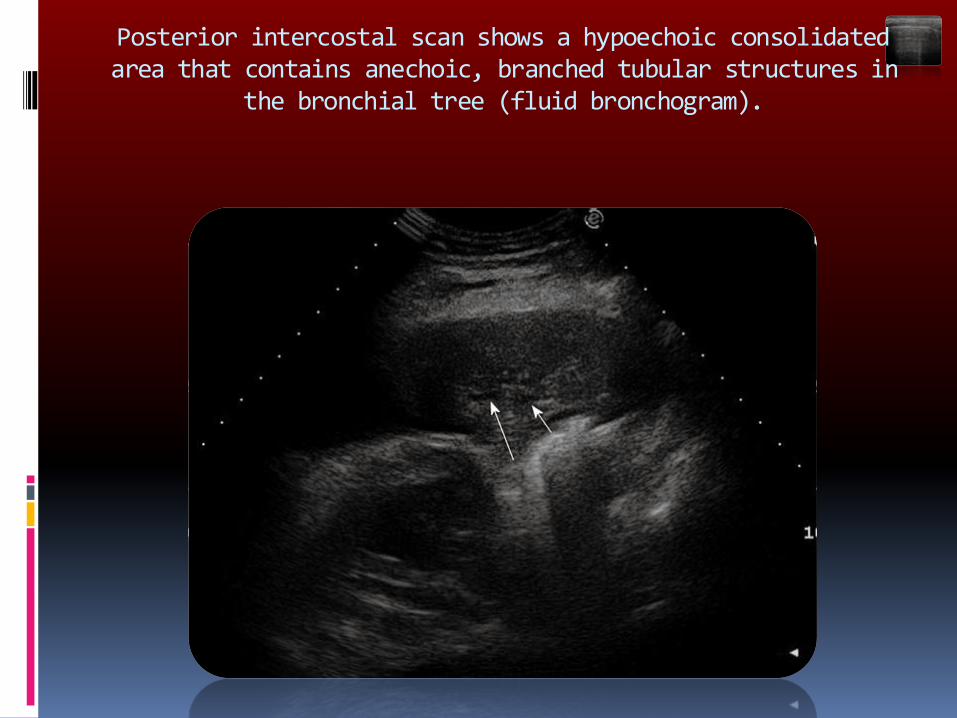
Posterior intercostal scan shows a hypoechoic consolidated area that contains anechoic, branched tubular structures in
the bronchial tree (fluid bronchogram).
CEUS in Peripheral bronchial carcinomas
CEUS can help to define better necrotic areas that are depicted as anechoic regions inside the enhanced viable tumor.
The infiltrative growth of solid tissue without regard to anatomical structures is characteristic of malignancy
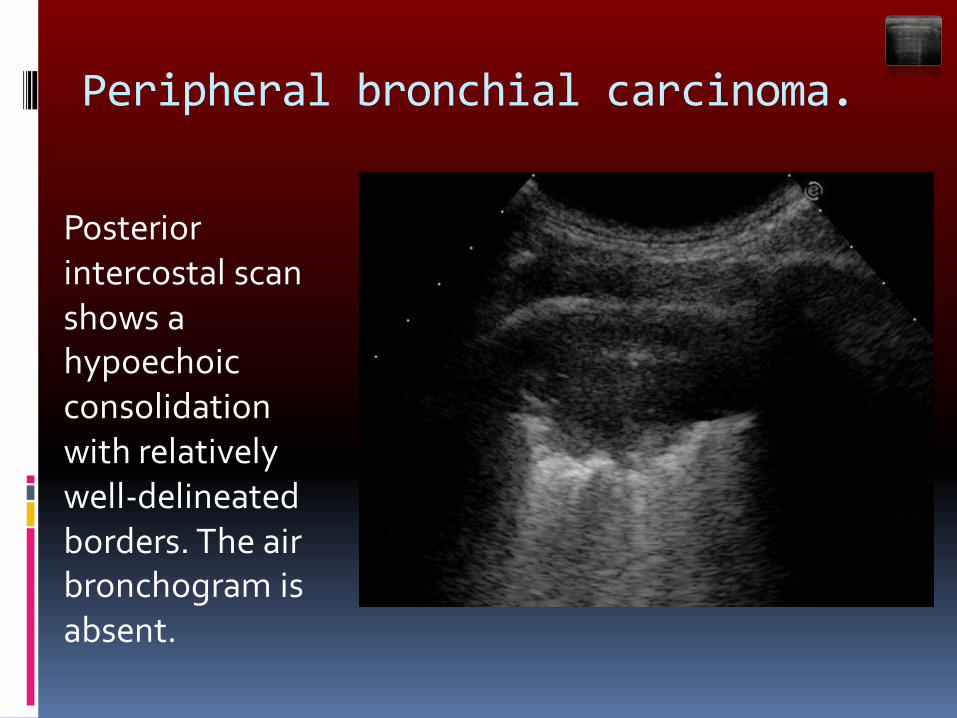
Peripheral bronchial carcinoma.
Posterior intercostal scan shows a hypoechoic consolidation with relatively well-delineated borders. The air bronchogram is absent.
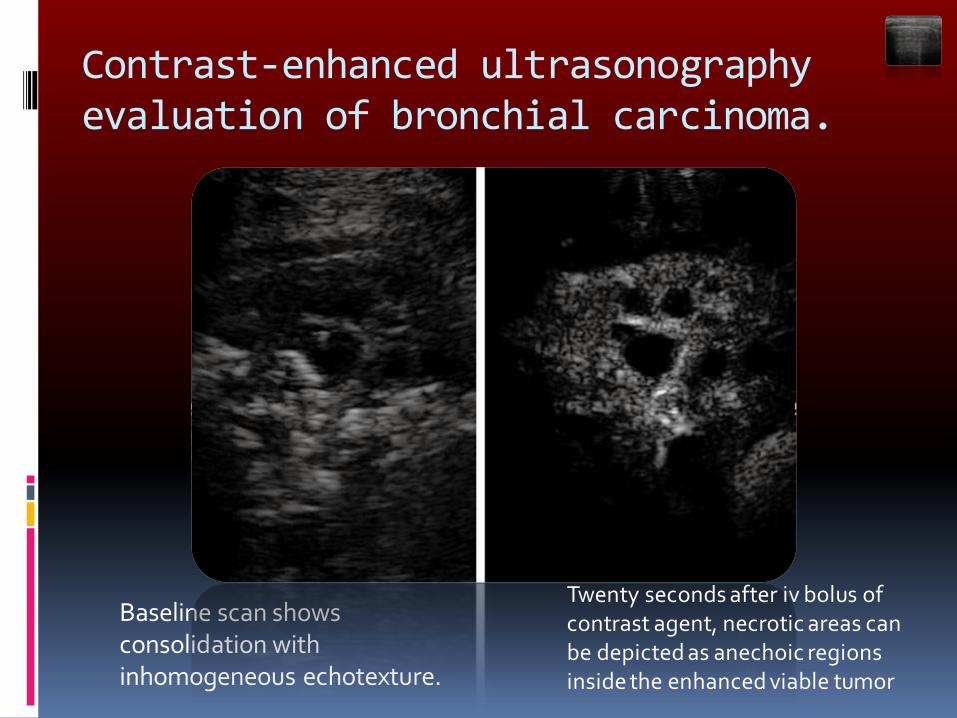
Contrast-enhanced ultrasonography evaluation of bronchial carcinoma.
Baseline scan shows consolidation with inhomogeneous echotexture.
Twenty seconds after iv bolus of contrast agent, necrotic areas can be depicted as anechoic regions inside the enhanced viable tumor
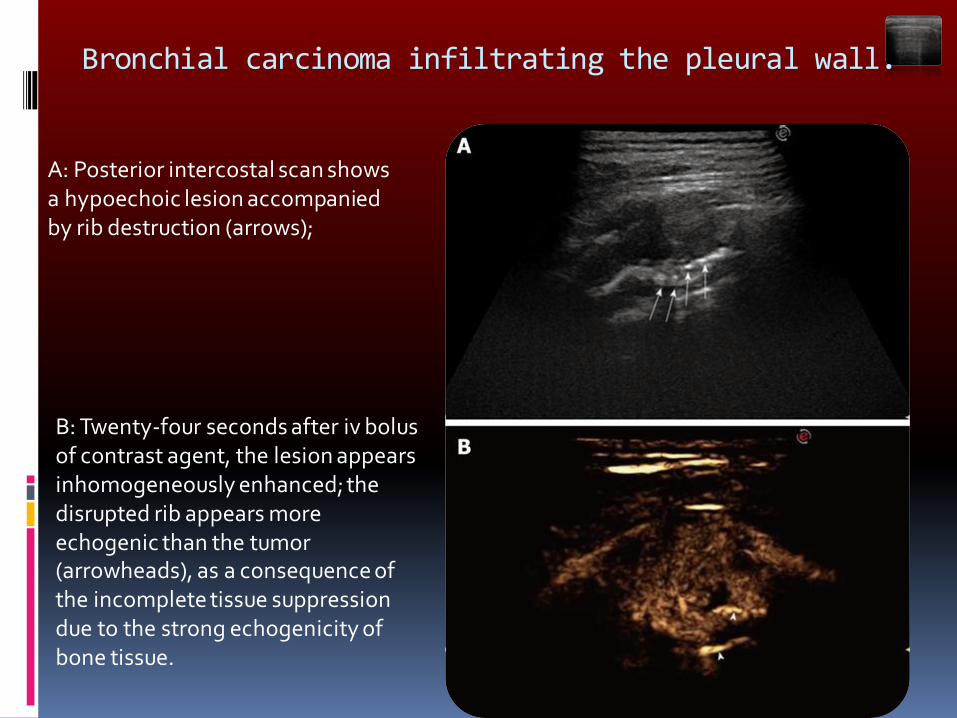
Bronchial carcinoma infiltrating the pleural wall.
A: Posterior intercostal scan shows a hypoechoic lesion accompanied by rib destruction (arrows);
B: Twenty-four seconds after iv bolus of contrast agent, the lesion appears inhomogeneously enhanced; the disrupted rib appears more echogenic than the tumor (arrowheads), as a consequence of the incomplete tissue suppression due to the strong echogenicity of bone tissue.
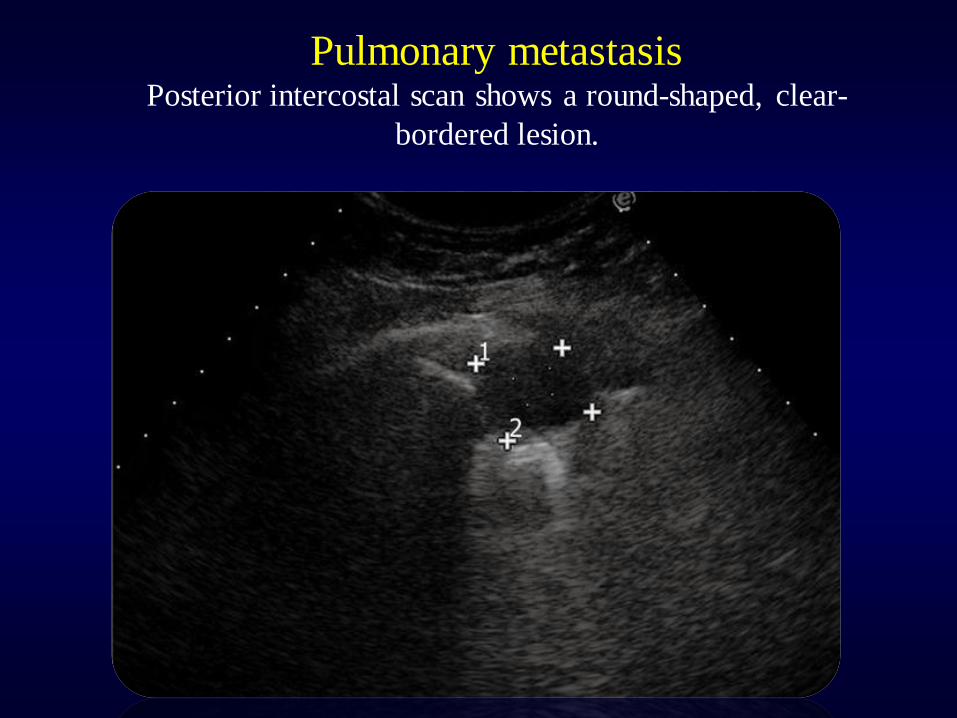
Pulmonary metastasis Posterior intercostal scan shows a round-shaped, clear-
bordered lesion.
Prof . Maha K Ghanem, MD, FCCP
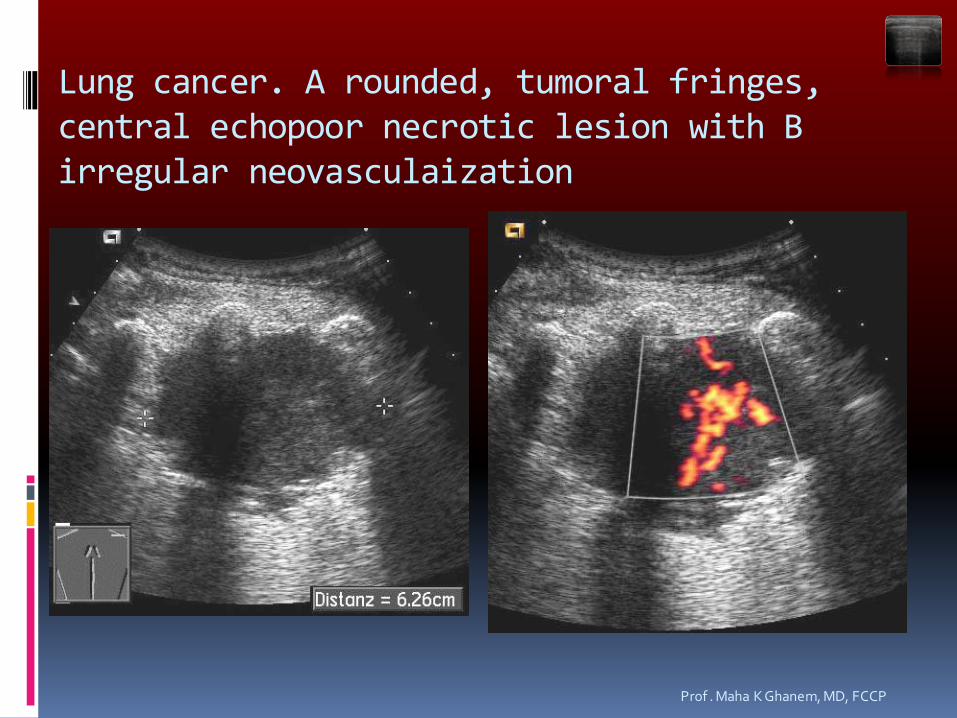
Lung cancer. A rounded, tumoral fringes, central echopoor necrotic lesion with B irregular neovasculaization
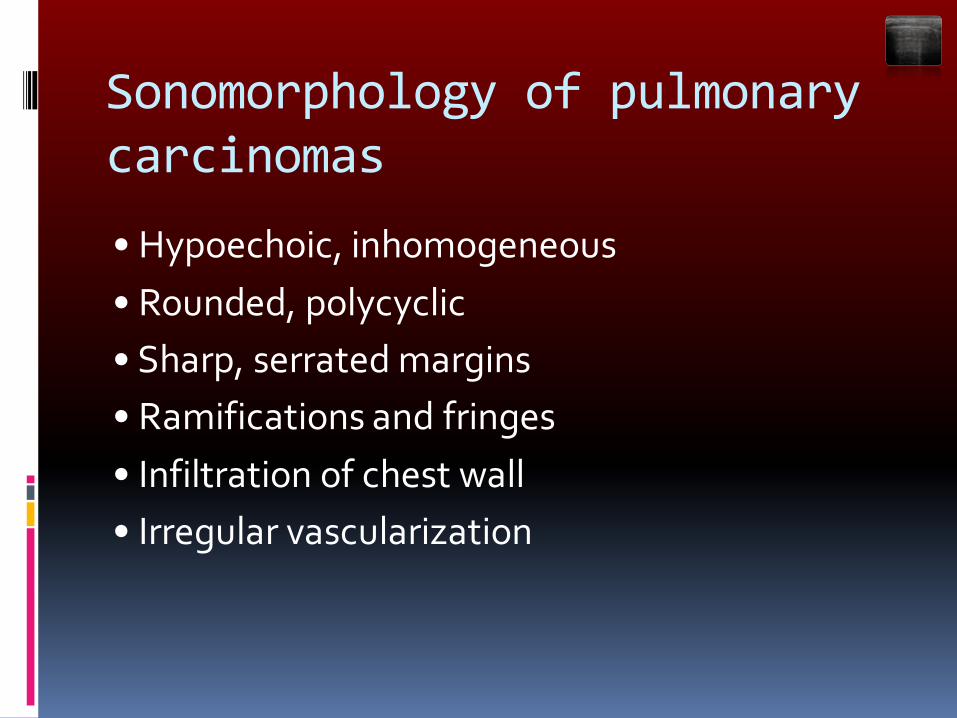
Sonomorphology of pulmonary carcinomas • Hypoechoic, inhomogeneous
• Rounded, polycyclic
• Sharp, serrated margins
• Ramifications and fringes
• Infiltration of chest wall
• Irregular vascularization

Us is increasingly used to guide interventional procedures of the chest including:
1- Interventional procedures of the pleural space.
* Thoracentesis and catheter drainage.
* Pleural biopsy.
2-Pulmonary interventional procedures
* Us guided lung biopsy (Lung cancer – Pneumonia).
* Drainage of lung abscesses.
3- Mediastinal intervention.
* Biopsy of mediastinal mass and lymph nodes.
4- Chest wall intervention.
* Biopsy of chest wall mass.

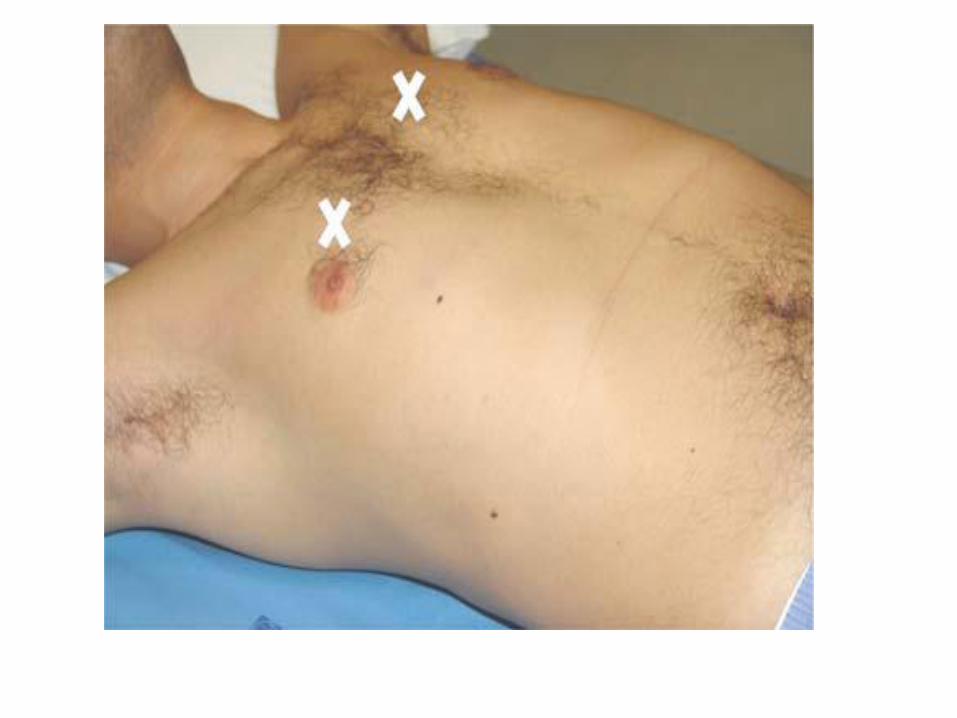
For performance of the US guided thoracic
intervention, the following are required:
1- The procedures could be performed on an out patient basis.
2- The procedures may be carried out in any room.
3- Special puncturing equipment should be available.
4- The patient must be informed of the course and risk of the procedure.
5- The coagulation status should be known.
6- Acknowledging preexisting finding (bronchoscopy – chest radiograph – CT).
7- The sonographic status of the thorax is evaluated.
The US guided procedure can be performed
with either of the following:
A) The free- hand technique after sonographic location.
B) The free- hand technique under sonographic observation.
C) The guided technique through applicator added to
the US probe.
D) The guided technique by special transducer probe with a notch in the middle allows the insertion of the needle in a fixed direction.
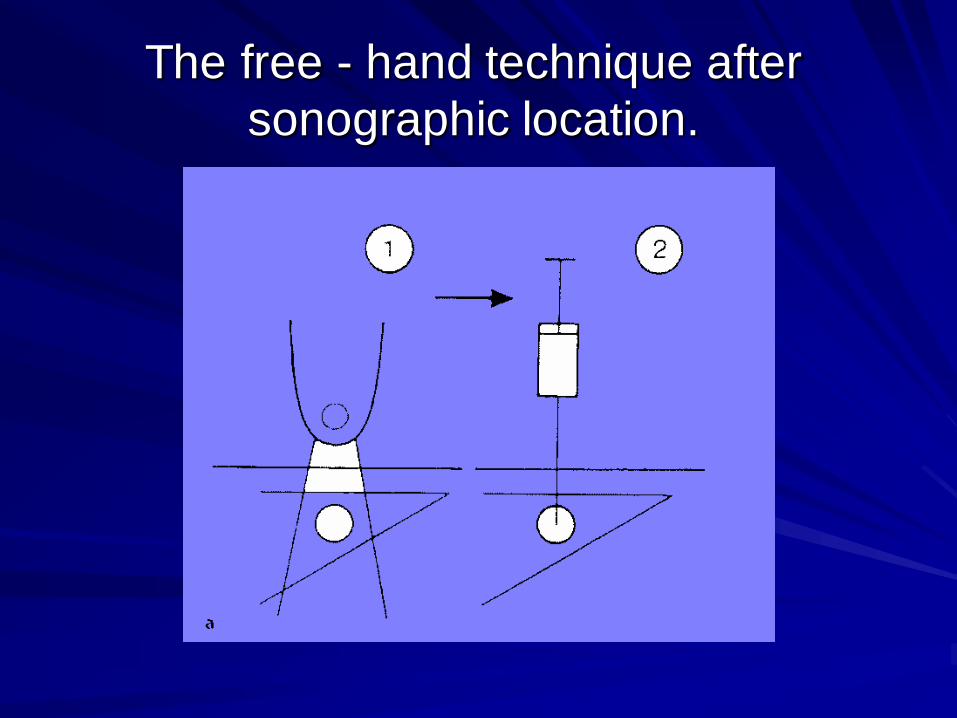
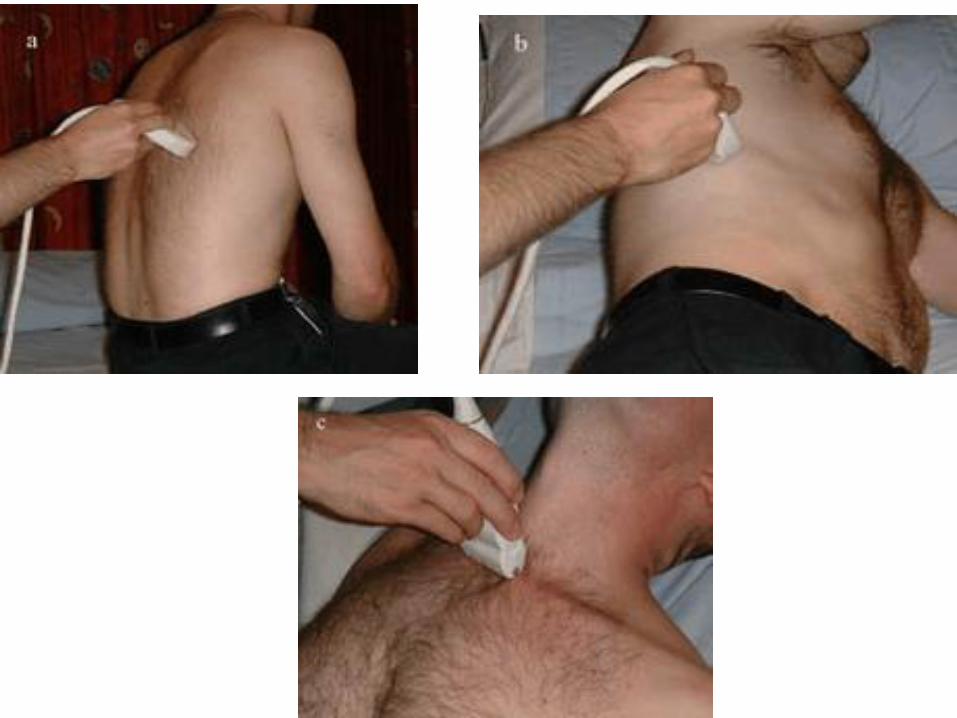
The free - hand technique after
sonographic location.
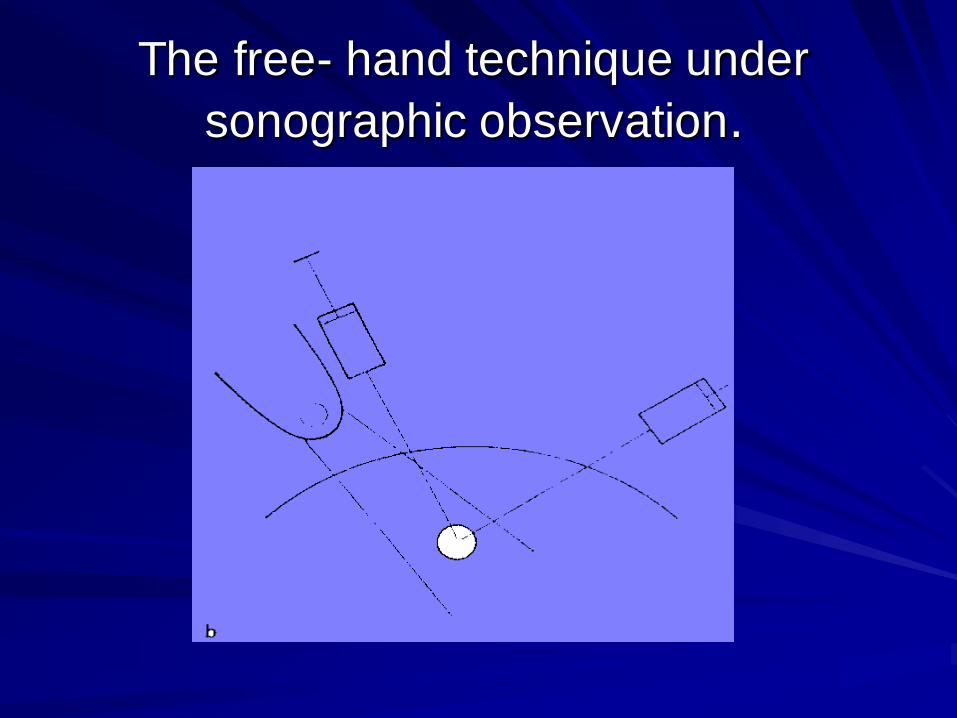
The free- hand technique under
sonographic observation.
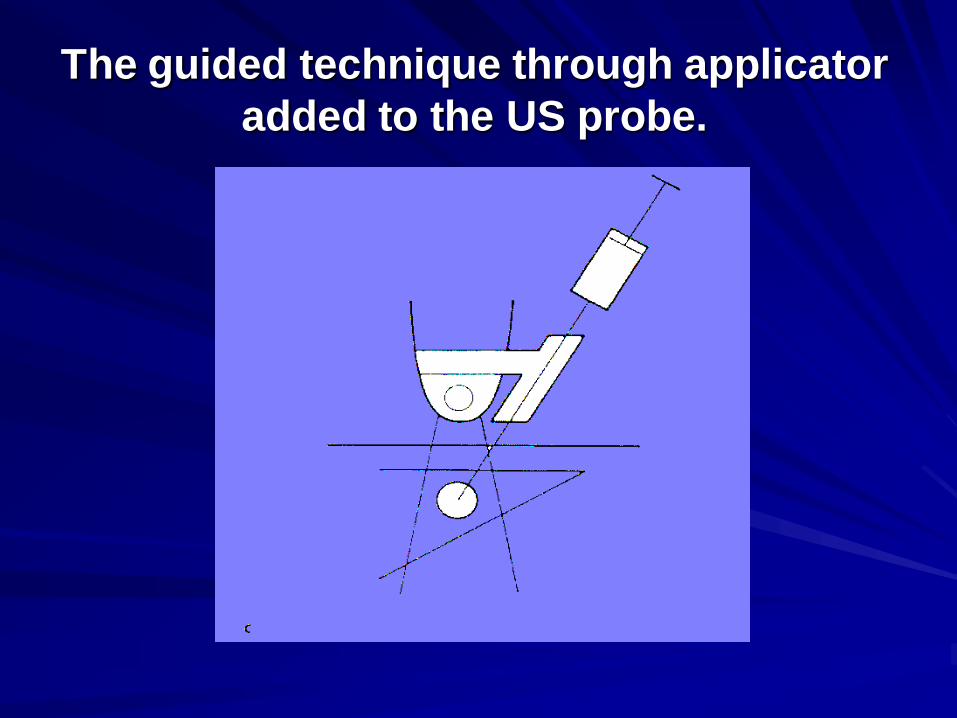
The guided technique through applicator
added to the US probe.
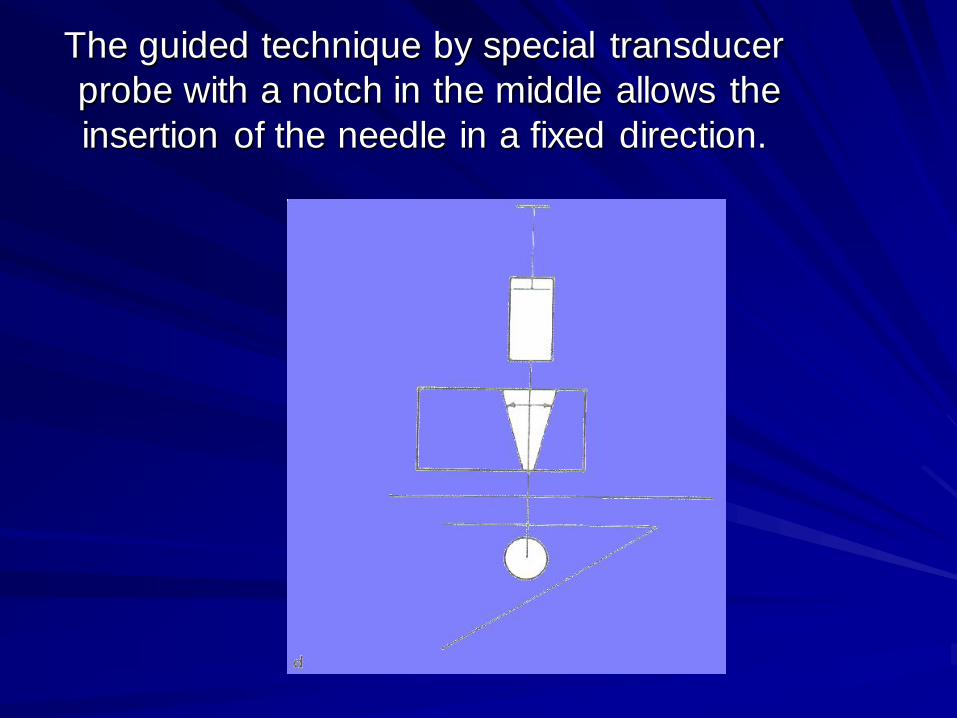
The guided technique by special transducer
probe with a notch in the middle allows the
insertion of the needle in a fixed direction.
Follow – up after intervention:
Three hours of surveillance after
intervention.
Sonographic check before discharge.
Instruction for patient (immediate return to
the hospital in case of symptoms).
Contraindications:
A) Absolute (severe blood coagulation disorders)
* International normalized ratio (INR) more than 1.8.
* Partial thromboplastin time (PTT) more the 50s.
* Platelet count below 50,000.
B) Relative
* Bullous pulmonary emphysema.
* pulmonary hypertension.
(N.B) when respiratory function is severely impaired or blood gas values are poor, the procedure should only be performed when the patients condition is expected to be improved by the therapeutic intervention.
Risks of US guided thoracic interventions:
* The rate of pneumothorax is 2.8 %; 1%
require drainage.
* Hemorrhage or hemoptysis is observed in
0-2 %.
* Tumor dissemination through the
procedure of puncture is very rare (Less
than 0.003 % of cases).
Advantages:
* Fast availability.
* Bedside application.
* Low rate of complications.
* Absence of radiation exposure.
* Low cost.
Limitations:
* If the space – occupying mass is hardly or not at all visible percutaneously on sonography.
* If the puncture channel is not safe.
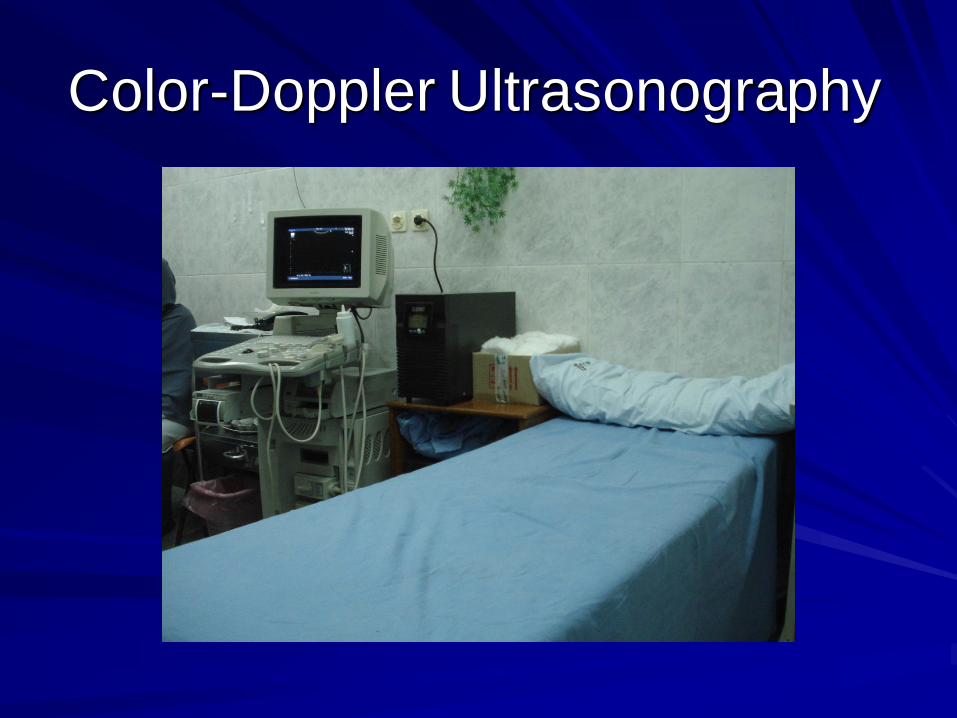
Color-Doppler Ultrasonography
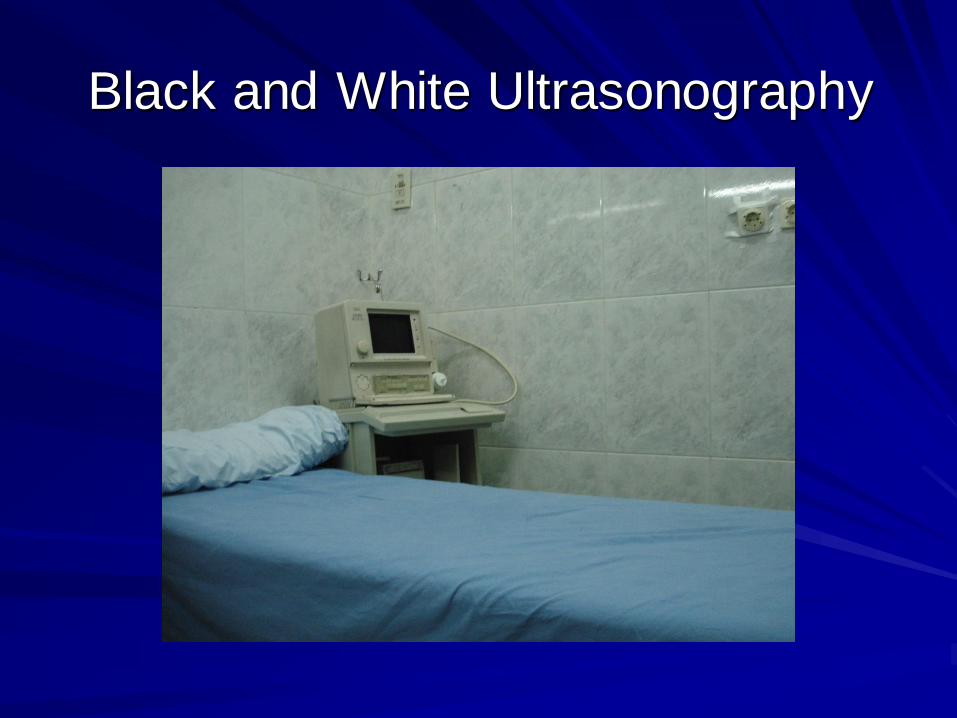
Black and White Ultrasonography
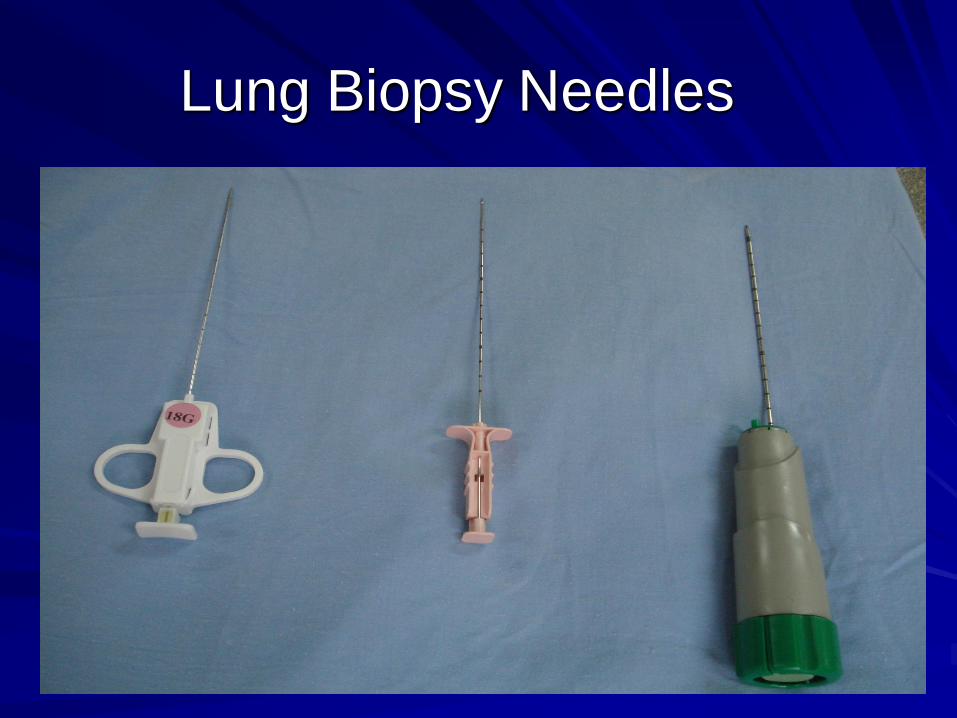
Lung Biopsy Needles
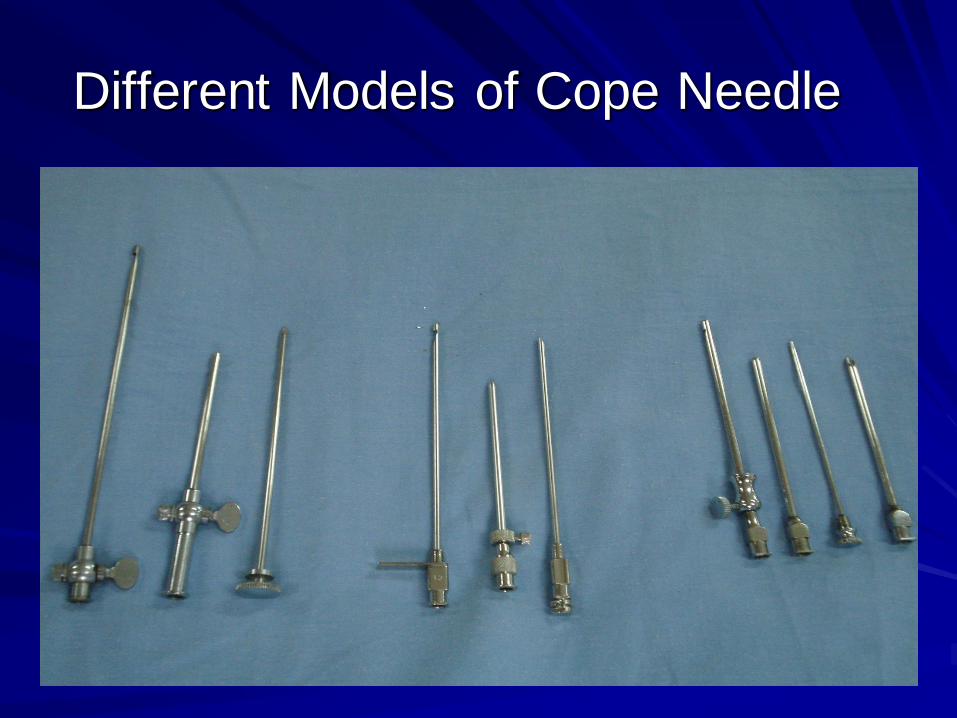
Different Models of Cope Needle
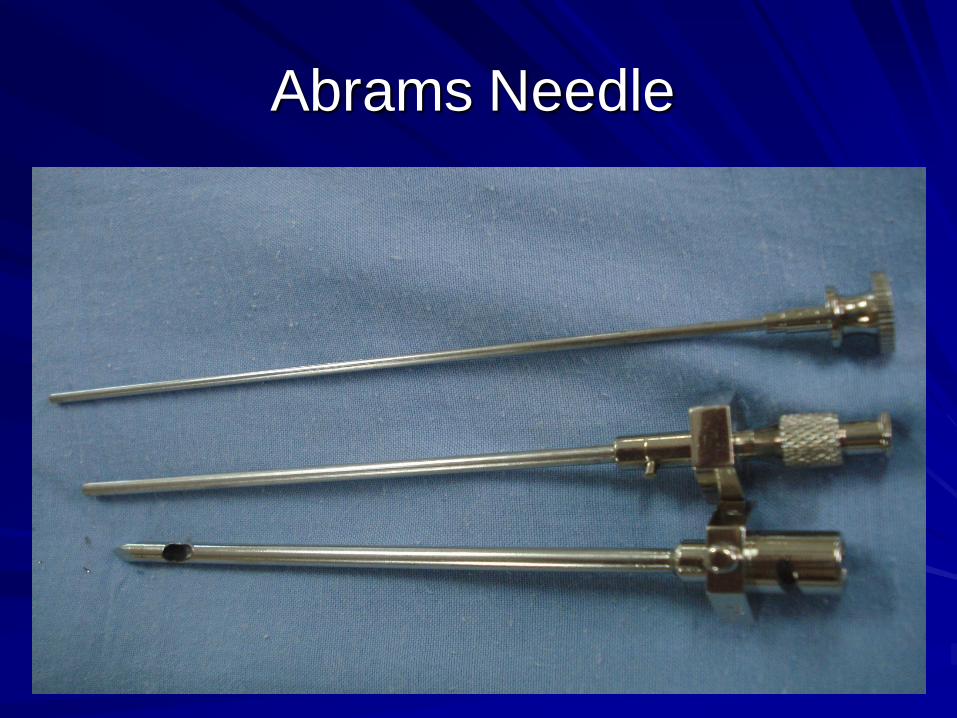
Abrams Needle
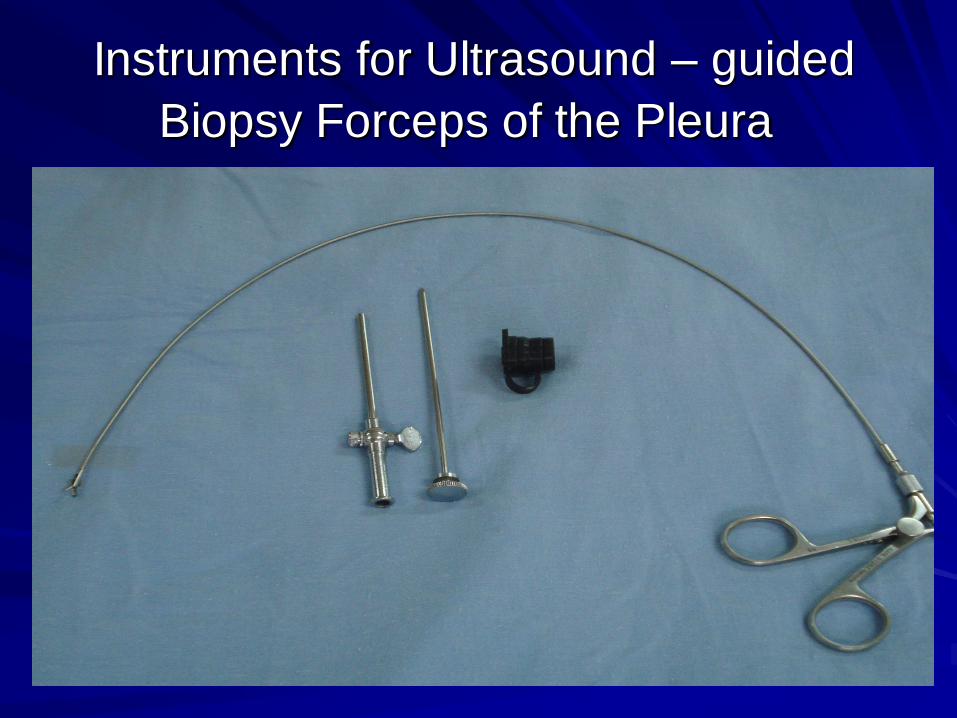
Instruments for Ultrasound – guided
Biopsy Forceps of the Pleura
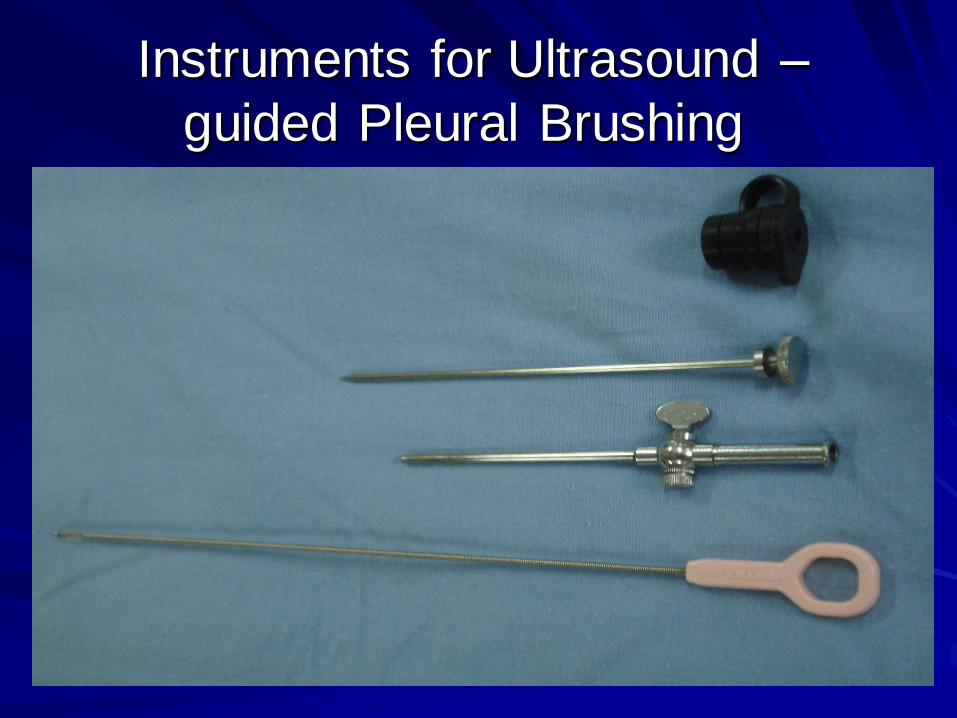
Instruments for Ultrasound –
guided Pleural Brushing

Different Models of Catheters for
Pleural Drainage
c
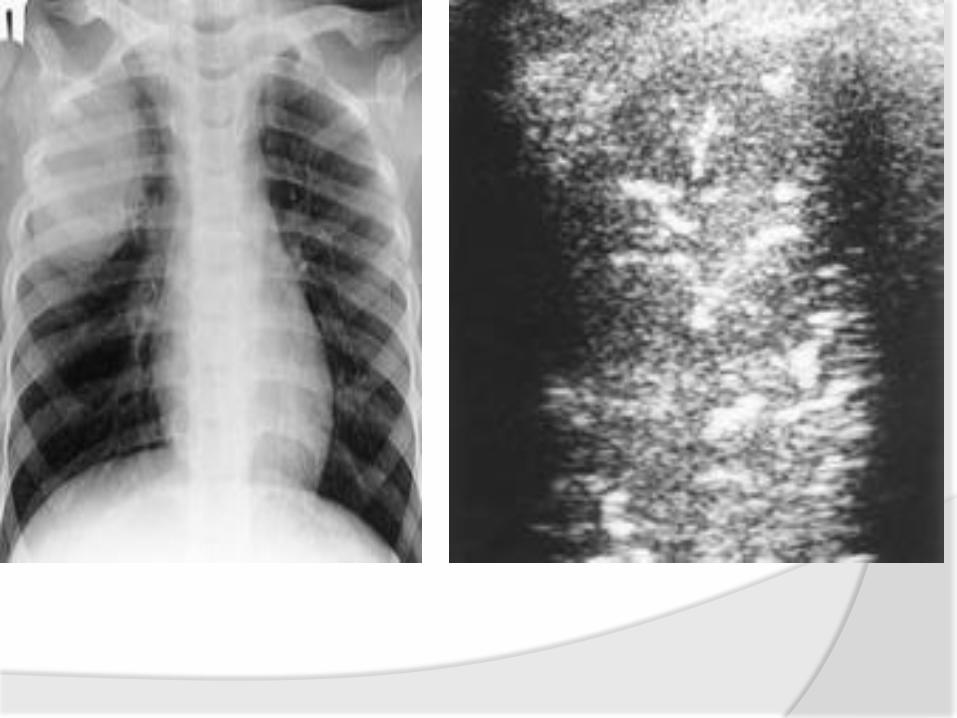
At the bedside, chest radiography remains the reference for lung imaging in
critically ill patients. However, radiographical images are often of
limited quality
• Movements of the chest wall
• Film cassette posterior to the thorax
• X-ray beam originating anteriorly, at a shorter distance than
recommended and not tangential to the diaphragmatic cupola .
Mistaken assessment
of :
c
• Pleural effusion
• Alveolar consolidation
• Alveolar-interstitial
syndrome
Bedside Chest Radiography in the Critically
ill
02 09 2012
Risk of transportation
Lung Computed Tomography in
the Critically ill
http://www.reapitie-
univparis6.aphp.fr 02 09 2012
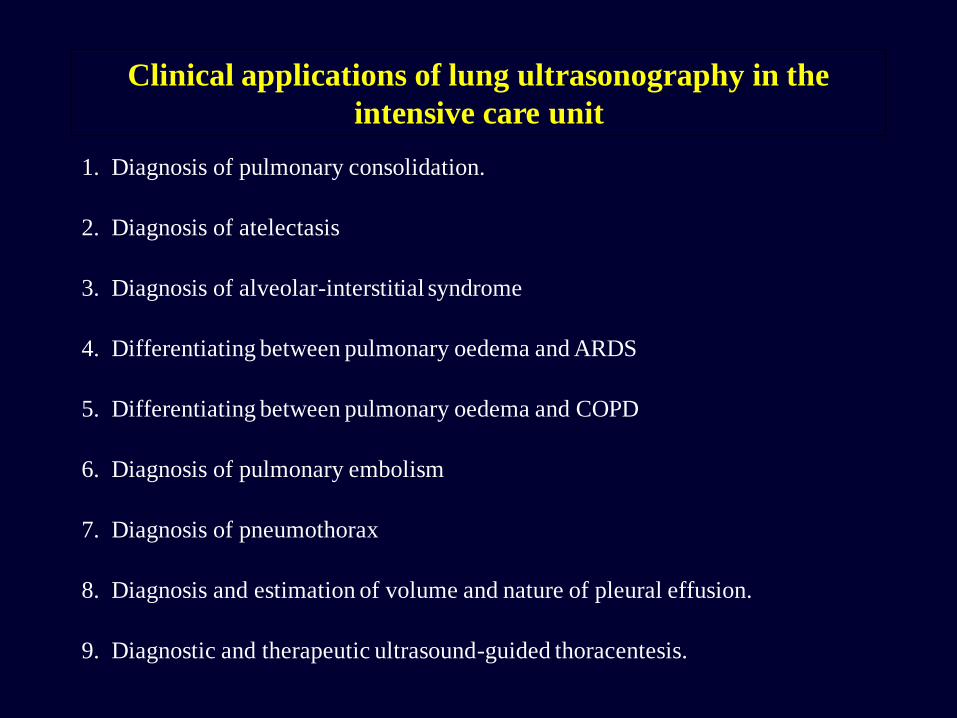
Clinical applications of lung ultrasonography in the
intensive care unit
1. Diagnosis of pulmonary consolidation.
2. Diagnosis of atelectasis
3. Diagnosis of alveolar-interstitial syndrome
4. Differentiating between pulmonary oedema and ARDS
5. Differentiating between pulmonary oedema and COPD
6. Diagnosis of pulmonary embolism
7. Diagnosis of pneumothorax
8. Diagnosis and estimation of volume and nature of pleural effusion.
9. Diagnostic and therapeutic ultrasound-guided thoracentesis.


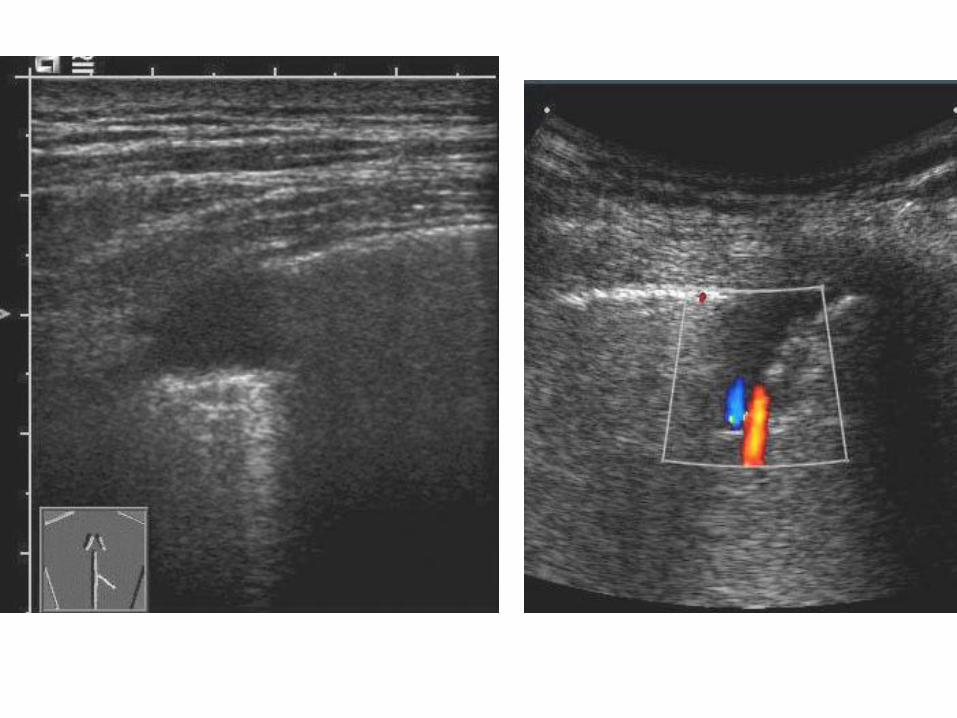
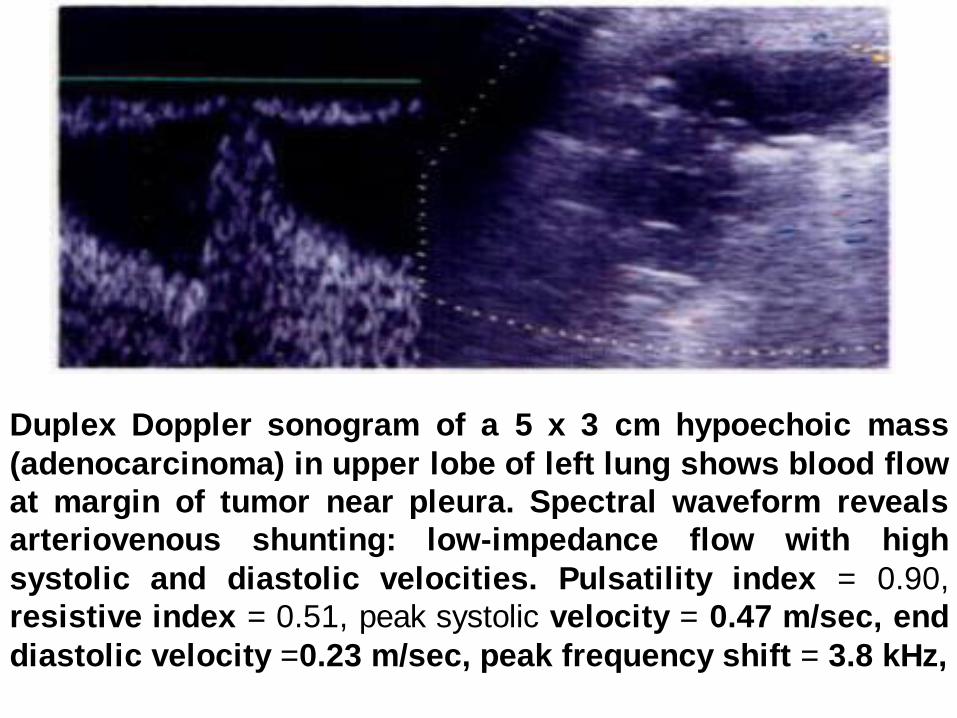
Duplex Doppler sonogram of a 5 x 3 cm hypoechoic mass
(adenocarcinoma) in upper lobe of left lung shows blood flow
at margin of tumor near pleura. Spectral waveform reveals
arteriovenous shunting: low-impedance flow with high
systolic and diastolic velocities. Pulsatility index = 0.90,
resistive index = 0.51, peak systolic velocity = 0.47 m/sec, end
diastolic velocity =0.23 m/sec, peak frequency shift = 3.8 kHz,
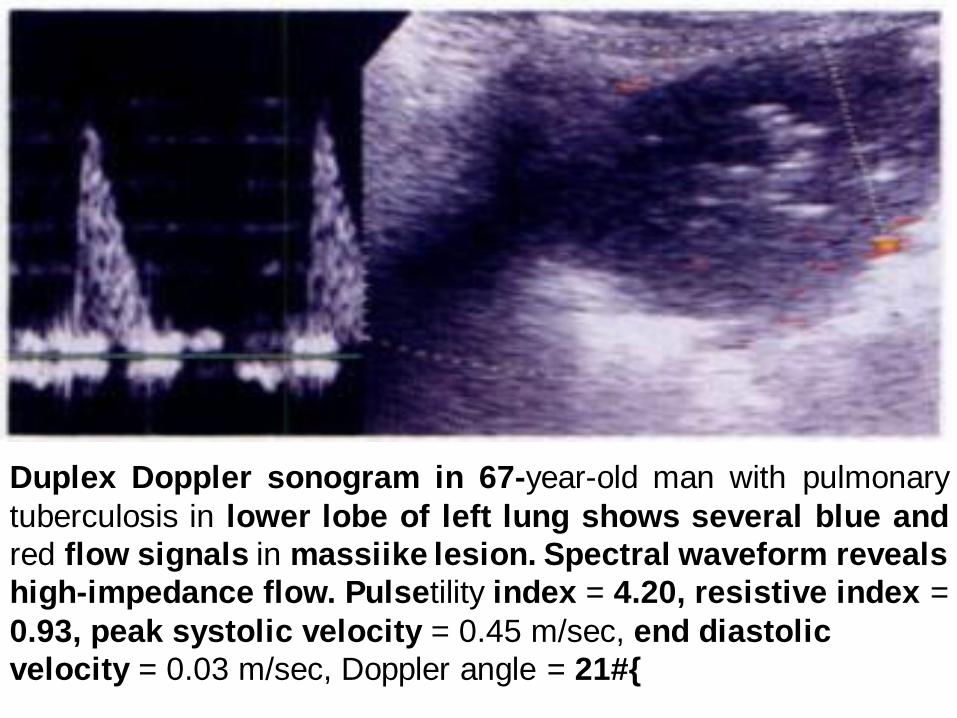
Duplex Doppler sonogram in 67-year-old man with pulmonary
tuberculosis in lower lobe of left lung shows several blue and
red flow signals in massiike lesion. Spectral waveform reveals
high-impedance flow. Pulsetility index = 4.20, resistive index =
0.93, peak systolic velocity = 0.45 m/sec, end diastolic
velocity = 0.03 m/sec, Doppler angle = 21#{
Hemodynamic assessment of circulatory
failure using lung ultrasound: FALLS-
protocol
Is ultrasound useful in shock?
Shock
Clinical situation where there is hypoperfusion of the cells and tissues
Background
Patients with shock have high mortality rates and these rates are correlated to the amount and duration of hypotension.
Diagnosis and initial care must be accurate and prompt to optimise patient outcomes.
Studies have demonstrated that initial integration of bedside ultrasound into the evaluation of the patient with shock results in a more accurate initial diagnosis with earlier definitive treatment.
Bedside USS allows direct visualisation of pathology or abnormal physiological states.
Remember…
Ultrasound is a tool to aid diagnosis, but it won’t tell you everything…
When using it we should always have a clinical question you would like it to answer
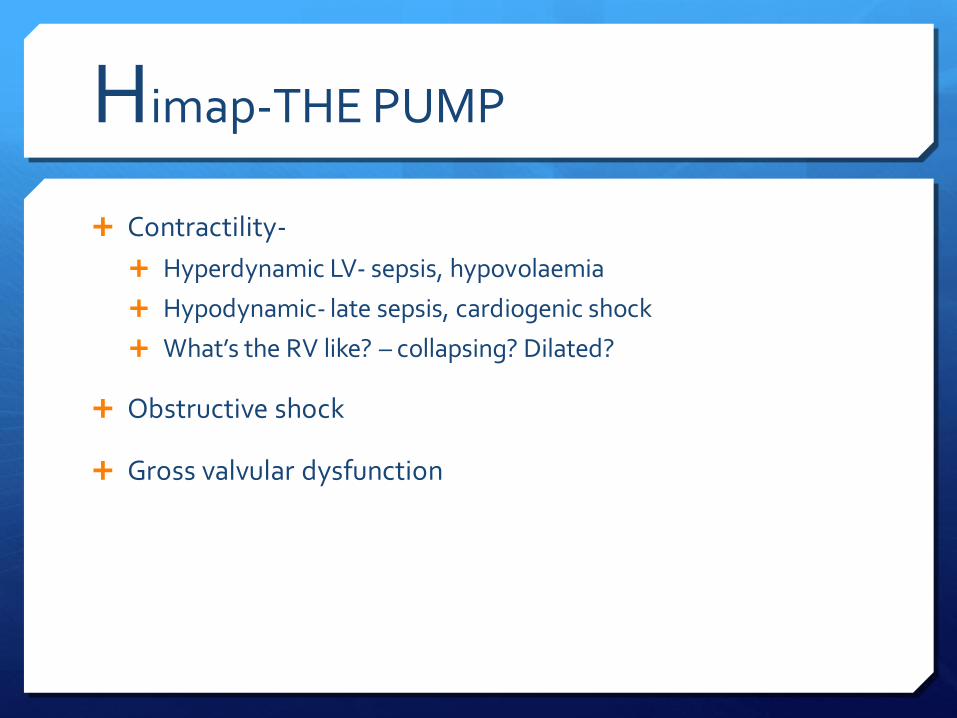
Himap-THE PUMP
Contractility-
Hyperdynamic LV- sepsis, hypovolaemia
Hypodynamic- late sepsis, cardiogenic shock
What’s the RV like? – collapsing? Dilated?
Obstructive shock
Gross valvular dysfunction
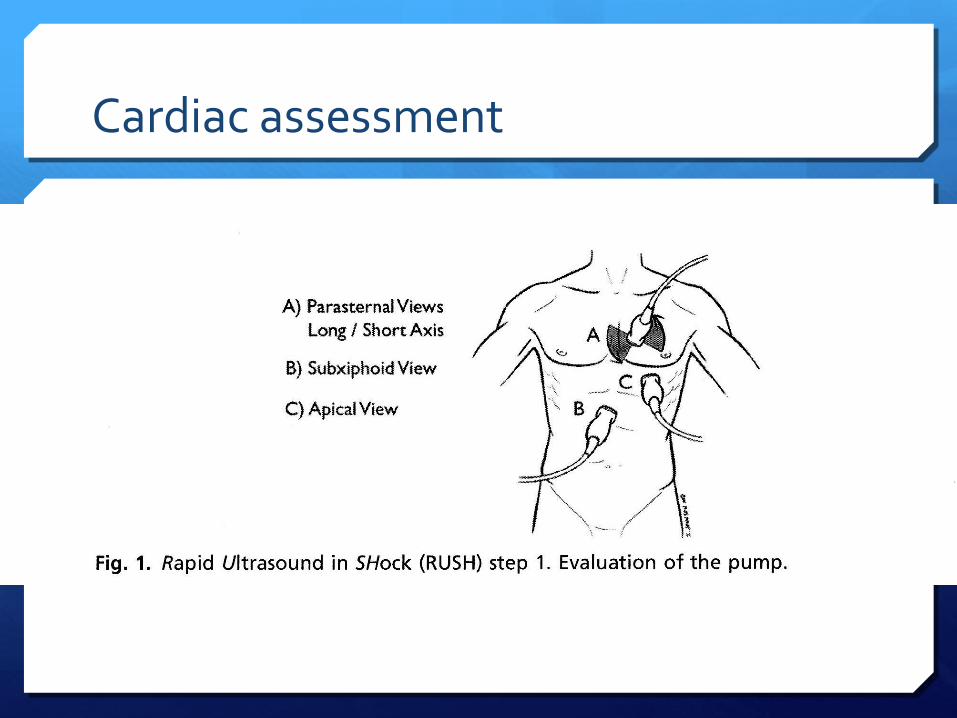
Cardiac assessment
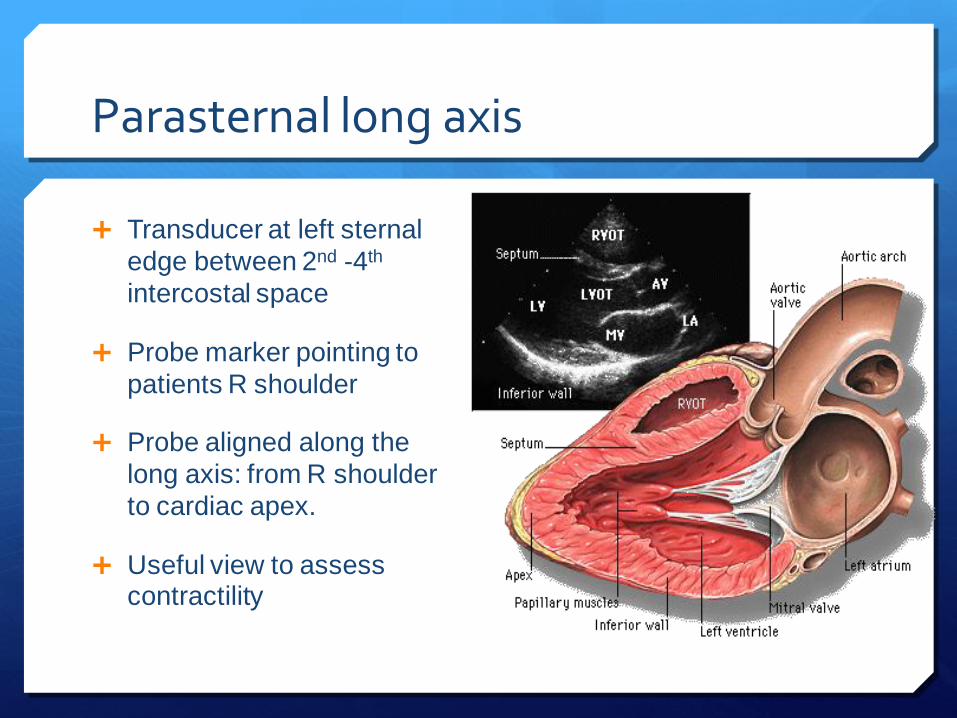
Parasternal long axis
Transducer at left sternal
edge between 2nd -4th
intercostal space
Probe marker pointing to
patients R shoulder
Probe aligned along the
long axis: from R shoulder
to cardiac apex.
Useful view to assess contractility
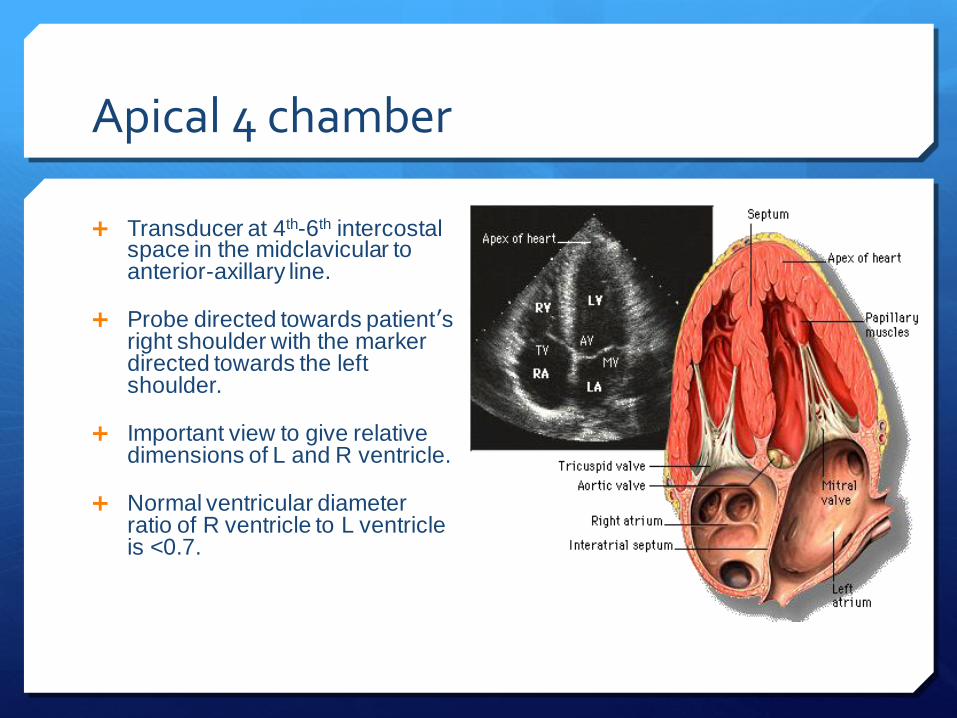
Apical 4 chamber
Transducer at 4th-6th intercostal space in the midclavicular to anterior-axillary line.
Probe directed towards patient’s right shoulder with the marker directed towards the left shoulder.
Important view to give relative dimensions of L and R ventricle.
Normal ventricular diameter ratio of R ventricle to L ventricle is <0.7.
Pericardial Tamponade
Remember tamponade is a clinical diagnosis based on patient’s haemodynamics and clinical picture.
Ultrasound may demonstrate early warning signs of tamponade before the patient becomes haemodynamically unstable.
Haemodynamic effects
Its PRESSURE NOT SIZE THAT COUNTS!
Rate of formation affects pressure-volume relationship and is therefore more important than volume of fluid.
Tamponade using ultrasound
A moderate-large effusion.
Right atrial collapse
Atrial contraction normal in atrial systole
Collapse throughout diastole or inversion is abnormal.
RV collapse during diastole when meant to be filling (‘scalloping’ seen)
Whats seen in the IVC…
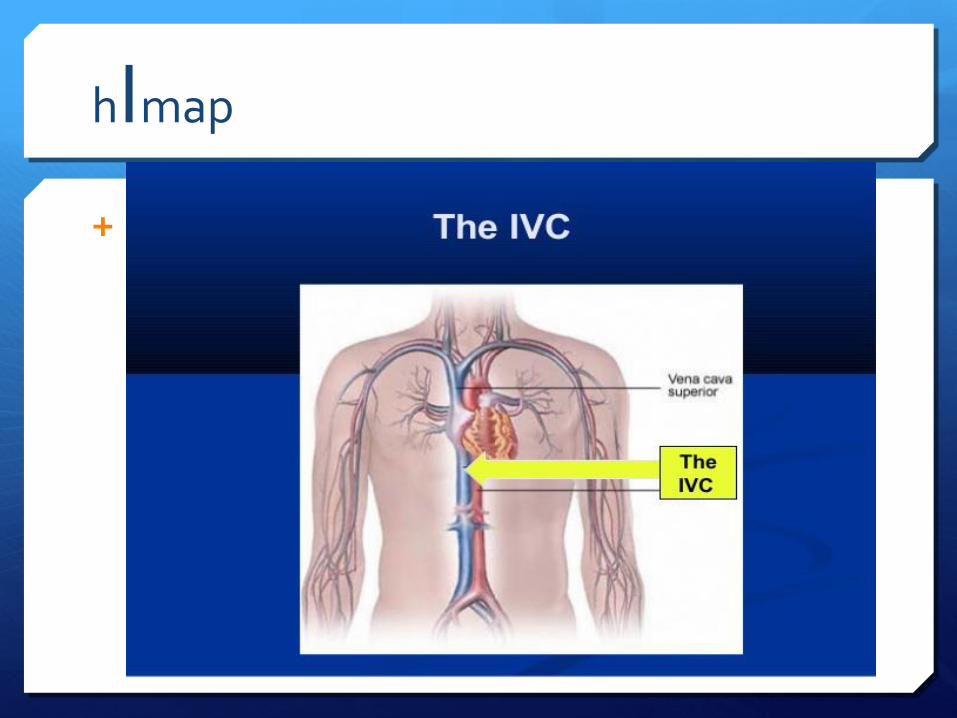
hImap
IVC
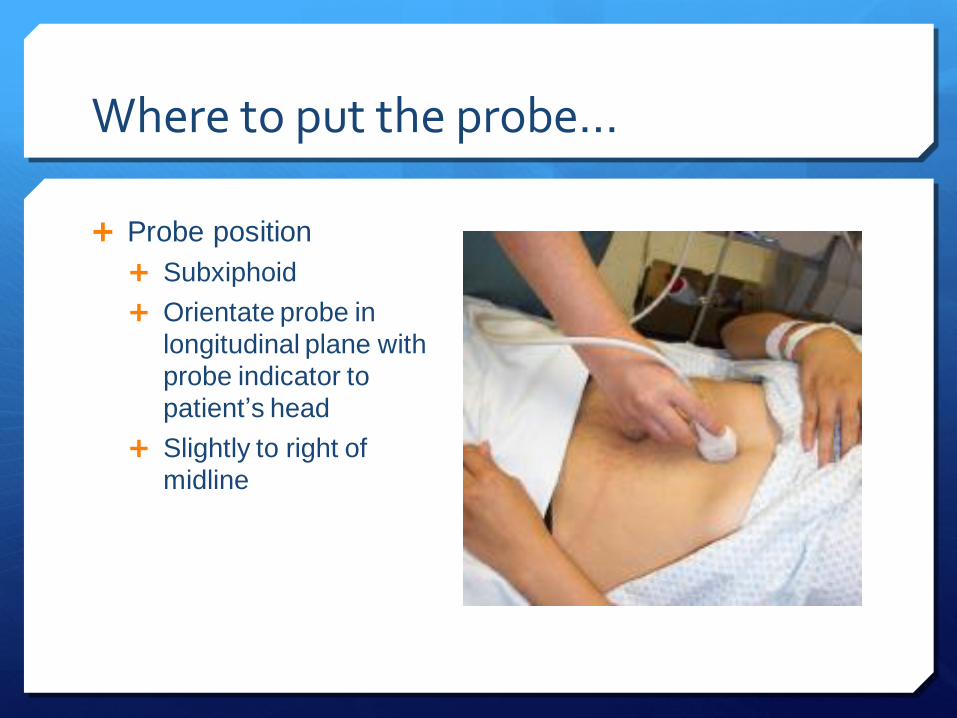
Where to put the probe…
Probe position
Subxiphoid
Orientate probe in
longitudinal plane with
probe indicator to
patient‟s head
Slightly to right of
midline
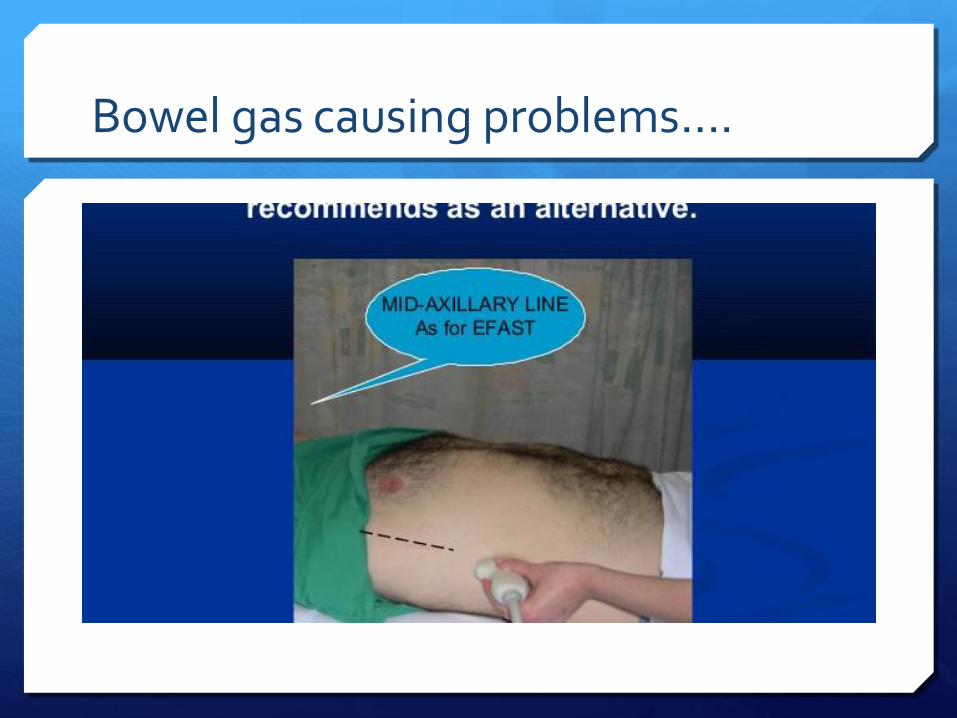
Bowel gas causing problems….
The FAST view…
Probe goes longitudinally in right mid axillary line with marker towards head.
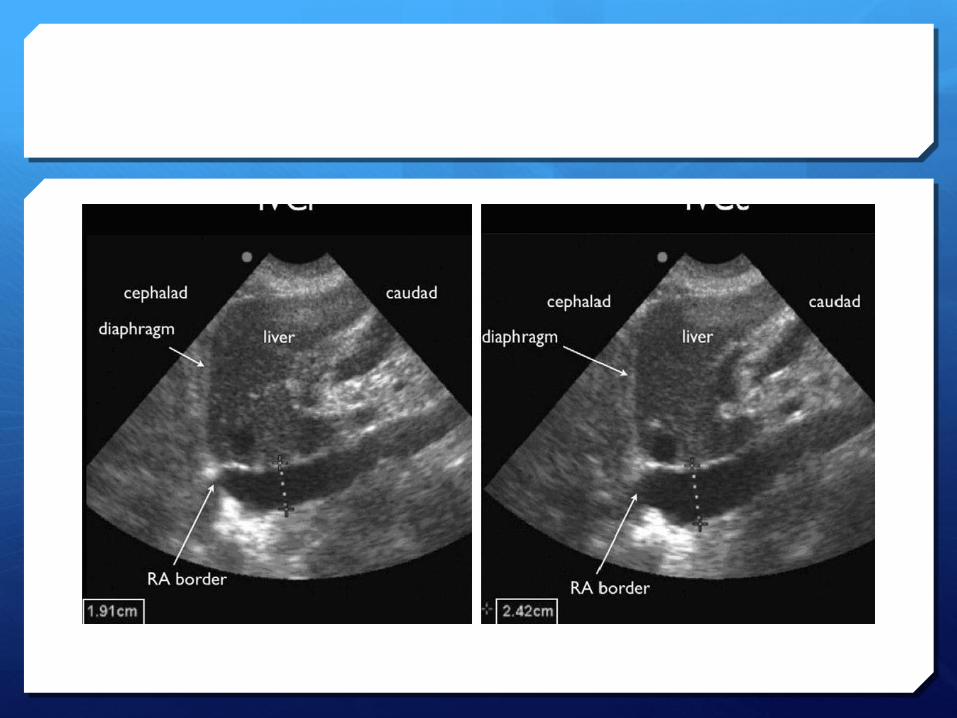
Look for IVC running longitudinally adjacent to the liver crossing the diaphragm
Track superiorly until it enters the RA confirms it’s the IVC not the aorta
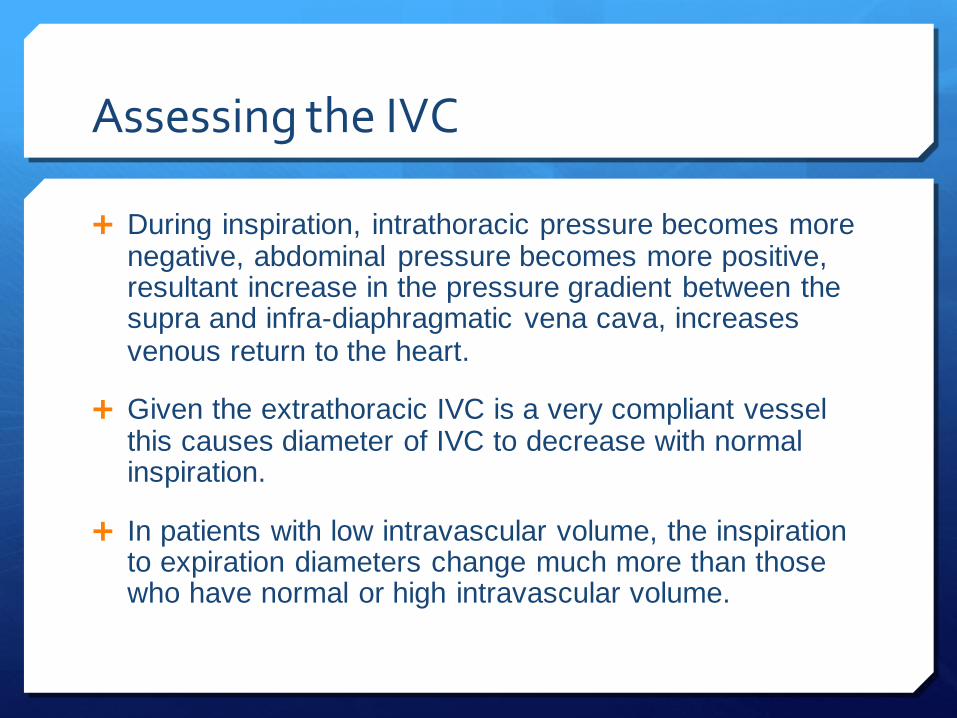
Assessing the IVC
During inspiration, intrathoracic pressure becomes more negative, abdominal pressure becomes more positive, resultant increase in the pressure gradient between the supra and infra-diaphragmatic vena cava, increases venous return to the heart.
Given the extrathoracic IVC is a very compliant vessel this causes diameter of IVC to decrease with normal inspiration.
In patients with low intravascular volume, the inspiration to expiration diameters change much more than those who have normal or high intravascular volume.
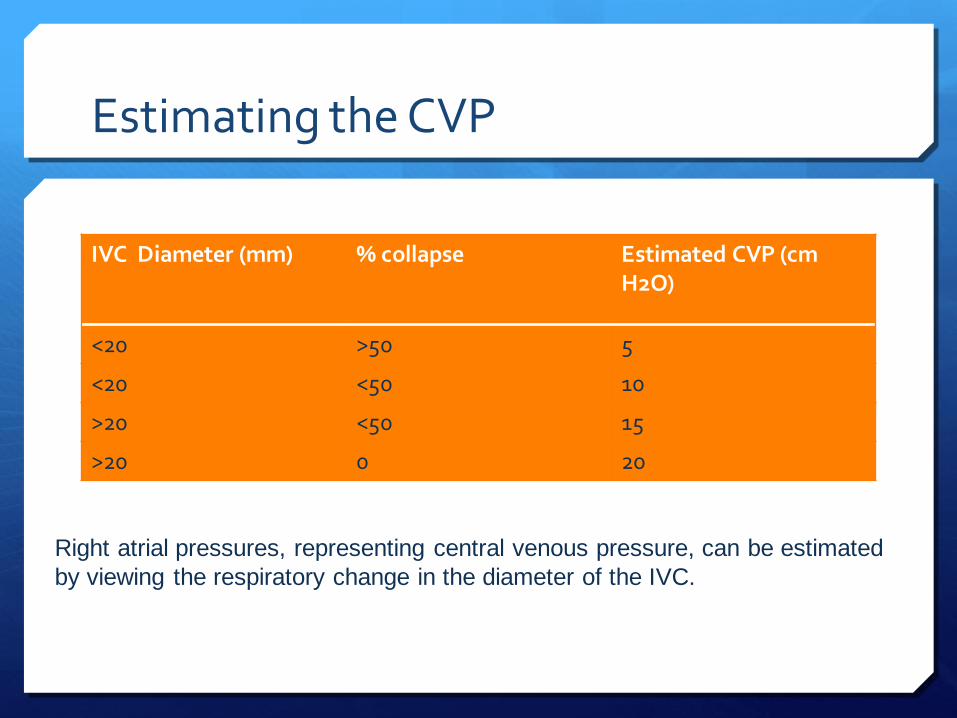
Estimating the CVP
IVC Diameter (mm) % collapse Estimated CVP (cm H2O)
<20 >50 5
<20 <50 10
>20 <50 15
>20 0 20
Right atrial pressures, representing central venous pressure, can be estimated
by viewing the respiratory change in the diameter of the IVC.
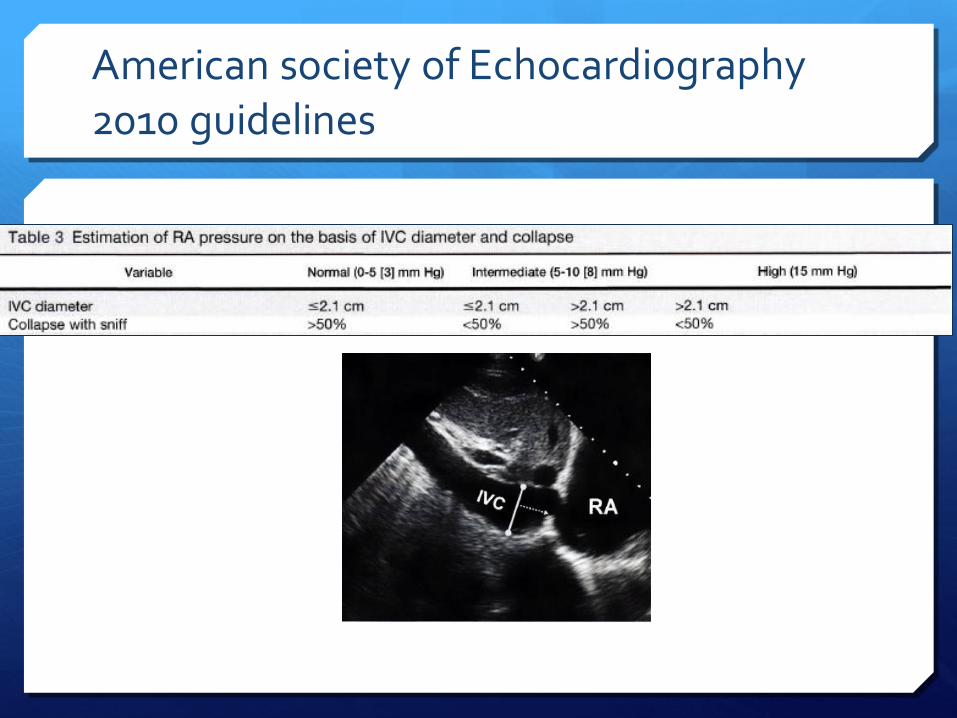
American society of Echocardiography 2010 guidelines
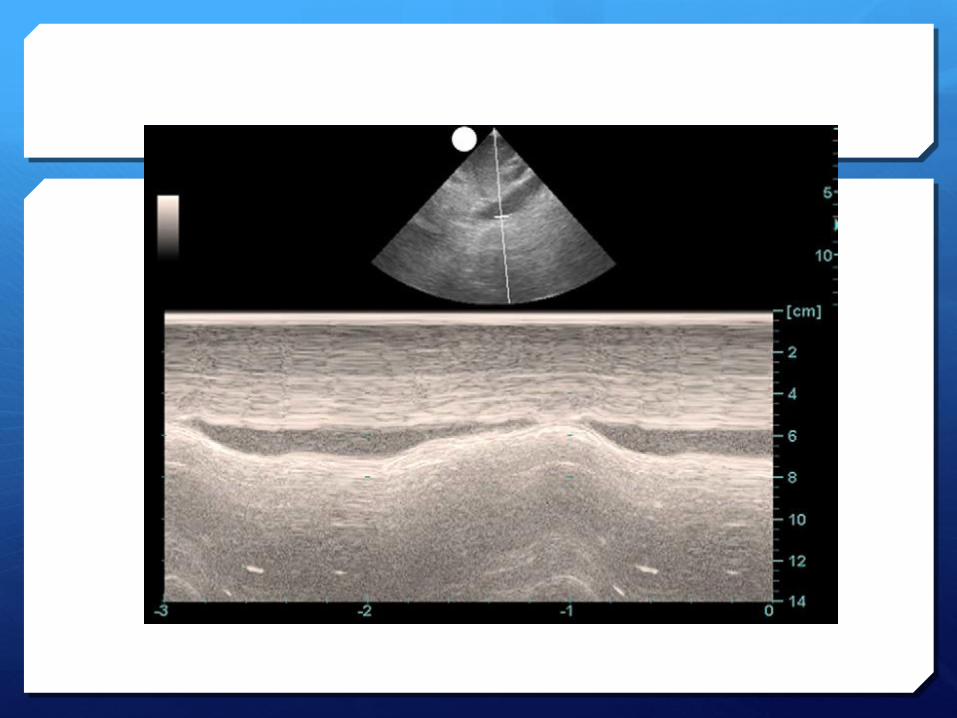
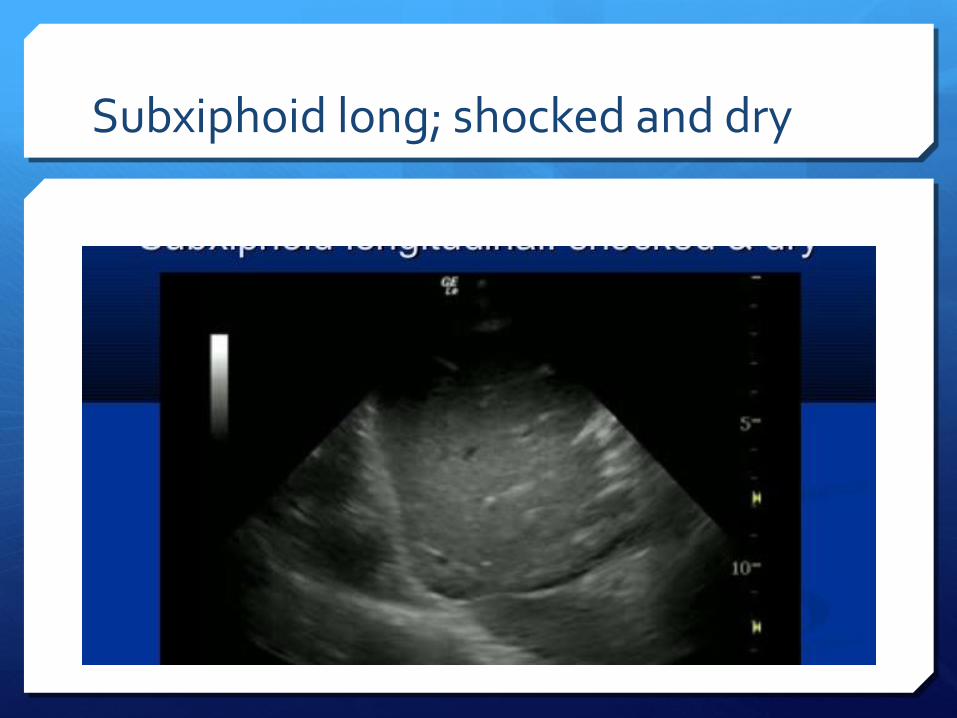
Subxiphoid long; shocked and dry
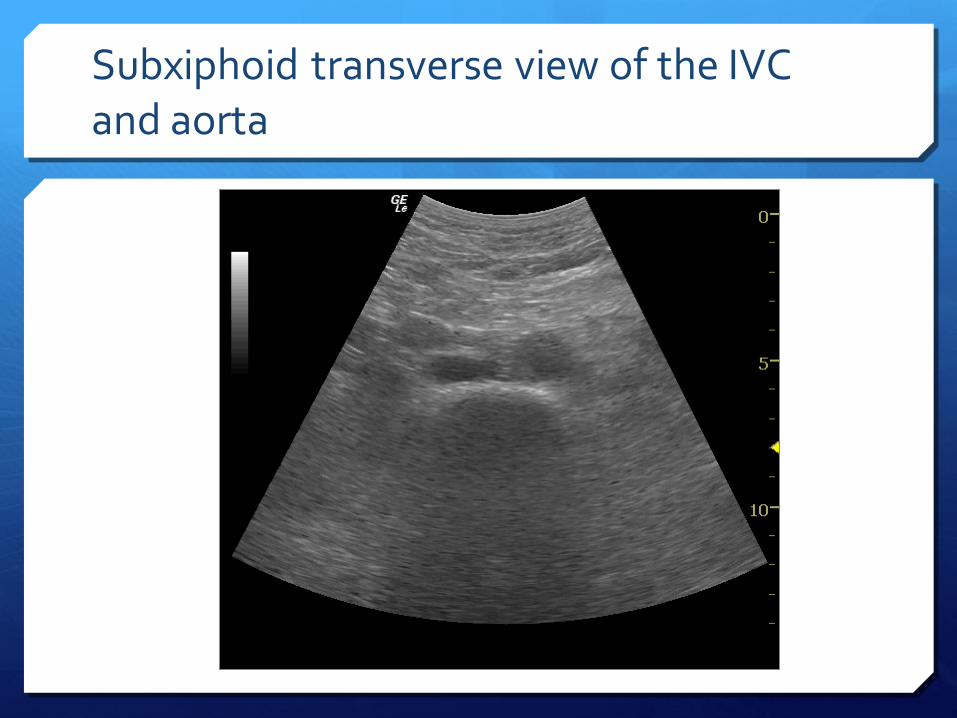
Subxiphoid transverse view of the IVC and aorta
Complicating the picture
Valvular disease
Pulmonary hypertension
Increased intraabdominal pressure
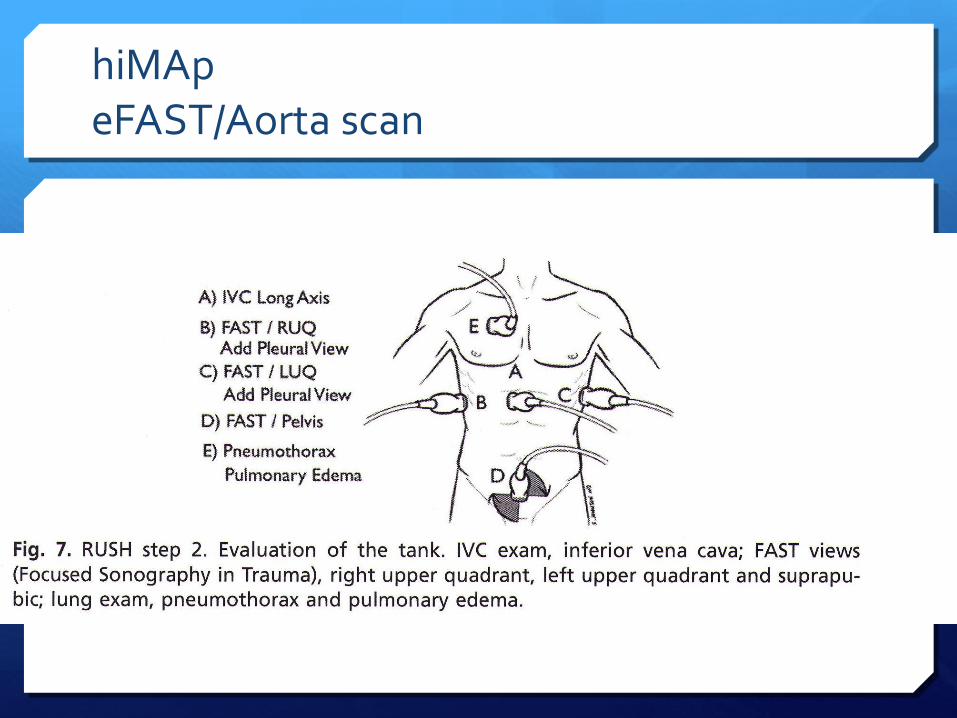
hiMAp eFAST/Aorta scan
himaP
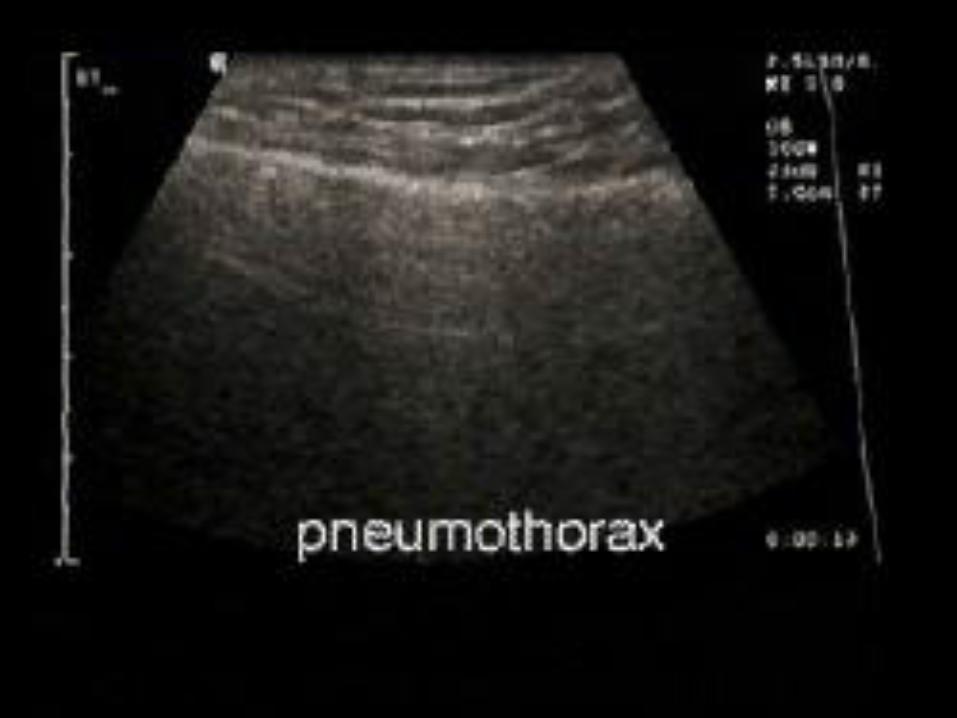
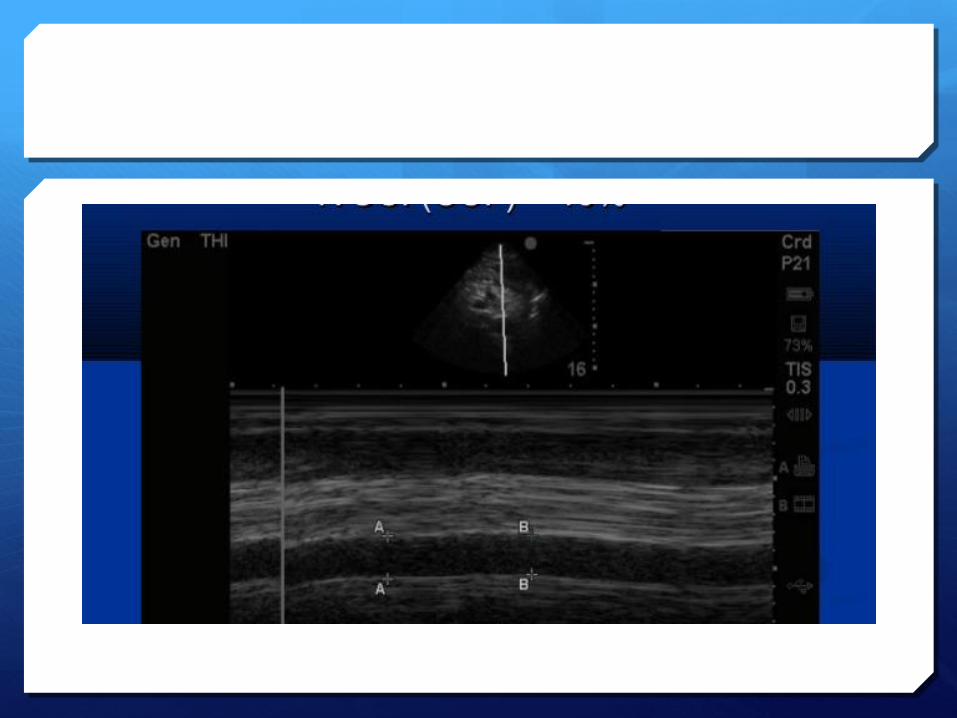
Multiple studies have shown ultrasound to be more sensitive than supine CXR for the detection of pneumothorax.
Sensitivities ranged from 86-100% with specificities from 92-100%.
Furthermore USS can be performed more rapidly at the bedside.
Detection with ultrasound relies on the fact that free air is lighter than normal aerated lung tissue, and thus will accumulate in the nondependent areas of the thoracic cavity. (ie anteriorly when patient is supine).
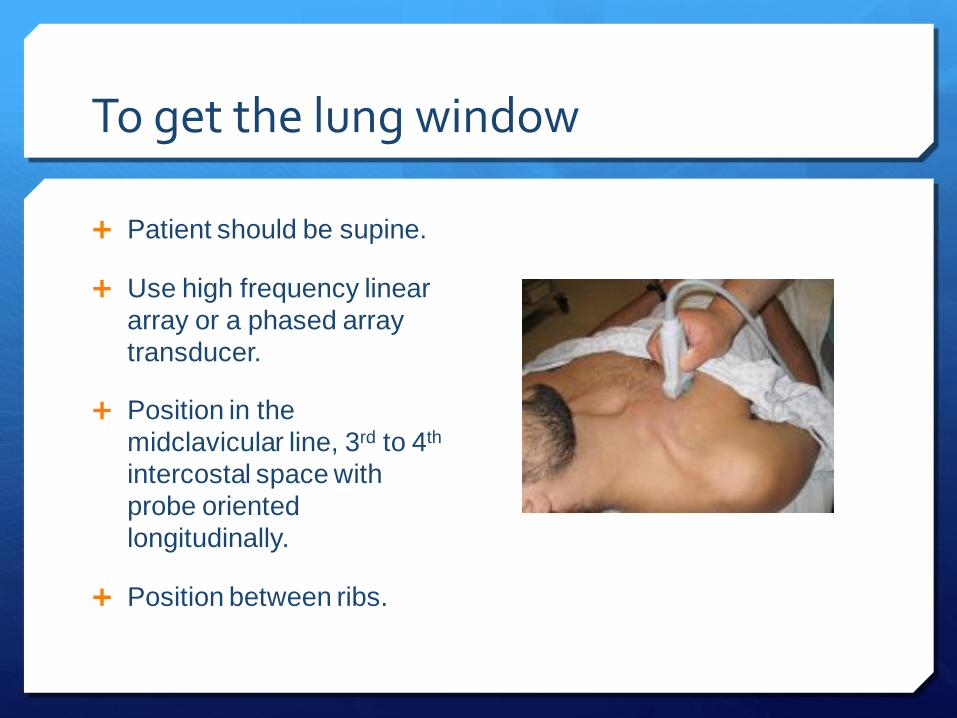
To get the lung window
Patient should be supine.
Use high frequency linear
array or a phased array
transducer.
Position in the
midclavicular line, 3rd to 4th
intercostal space with
probe oriented
longitudinally.
Position between ribs.
Pneumothorax
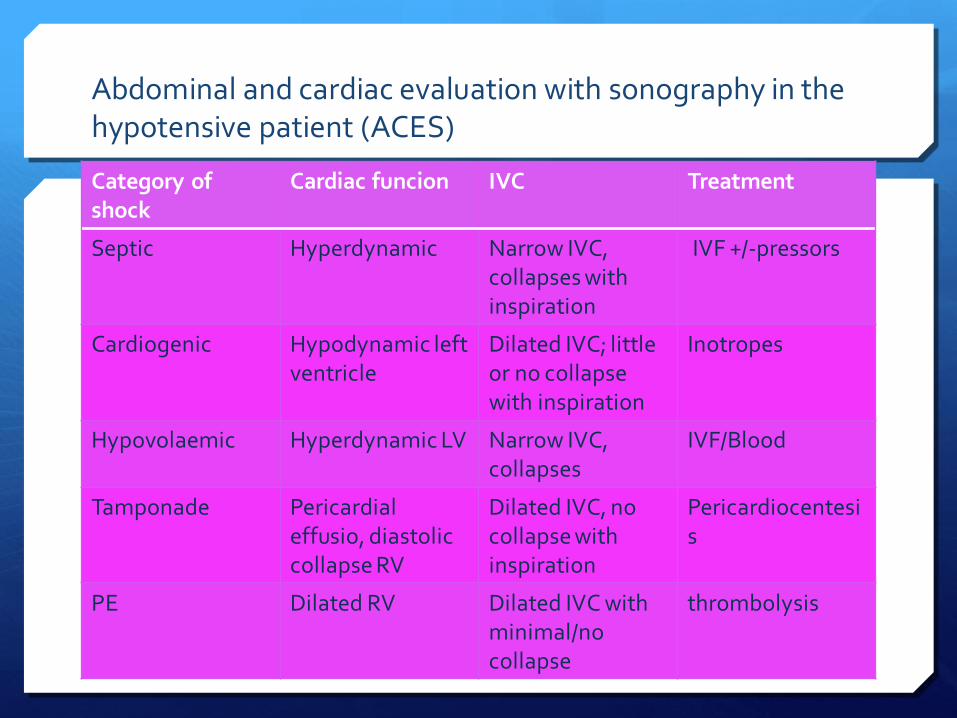
Abdominal and cardiac evaluation with sonography in the hypotensive patient (ACES)
Category of shock
Cardiac funcion IVC Treatment
Septic Hyperdynamic Narrow IVC, collapses with inspiration
IVF +/-pressors
Cardiogenic Hypodynamic left ventricle
Dilated IVC; little or no collapse with inspiration
Inotropes
Hypovolaemic Hyperdynamic LV Narrow IVC, collapses
IVF/Blood
Tamponade Pericardial effusio, diastolic collapse RV
Dilated IVC, no collapse with inspiration
Pericardiocentesis
PE Dilated RV Dilated IVC with minimal/no collapse
thrombolysis
(Chest. 2008; 133:836-837)
© 2008 American College of Chest
Physicians
Ultrasound: The Pulmonologist’s New
Best Friend
Momen M. Wahidi, MD, FCCP
Durham, NC
Director, Interventional Pulmonology, Duke
University Medical Center, Box 3683,
Durham, NC 27710