7-1
CHAPTER 7 POWER SUPPLY
7.1 Introduction
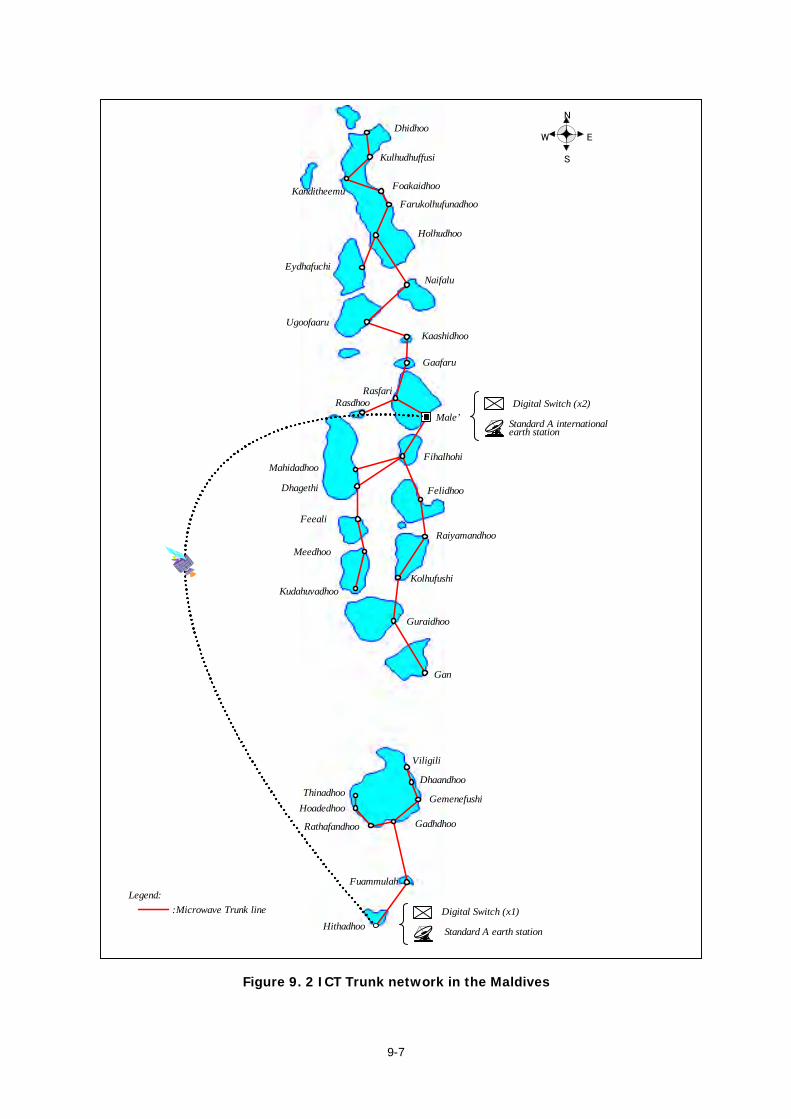
The tsunami of the 26th December, 2004 caused severe damage to the electrical infrastructure of
the country. It completely disrupted the power supply in at least 95 islands, which is about 48% of
all islands with electricity. However, by 6th January, 2006, almost 98% of inhabited islands have
their electricity supply temporarily recovered and restored.
In almost all the affected islands, the damage occurred to the underground distribution network
rather than generation facilities. Seawater deteriorated underground cables and cable joints in
terms of insulation. Although there is no official record, it is reported that more power
interruptions are caused by the damage to the distribution system.
On the other hand, most generators are operating in satisfactory conditions. Table 7.1 shows the
generators that have been procured and installed in Laamu Atoll by International Red Cross.
Table 7.1 Generators Procured by International Red Cross in Laamu Atoll Island Capacity Delivery date
Isdhoo 60kVA 2005/1/22 Isdhoo-Kalaidhoo 60kVA 2005/1/22 Maabaidhoo 60kVA 2005/1/22 Hithadhoo 80kVA 2005/2/27 Dhanbidhoo 80kVA 2005/2/27 Gan-Mukurimagu 150kVA 2005/2/27 Fonadhoo 80kVA 2005/2/27
The project aims to restore and rehabilitate the low voltage (400/230V) power distribution
systems in five islands (Isdhoo, Isdhoo-Kalaidhoo, Maabaidhoo, Gan-Mukurimagu and Maavah) in
Laamu Atoll, considering the extent of the tsunami damage and future sustainability of power
supply by the island committees.
7.2 Present Conditions
The people who live in the tsunami affected areas are currently suffering from frequent power
outages, because the temporary cables and distribution boxes are not appropriately designed in
consideration of existing load current. Power supply has already recovered in many affected
islands but only temporarily. Many cables are connected without jointing materials underground,
distribution boxes are substituted by plastic buckets and pet bottles. These improper installation
will result in frequent line fault and cause severe damage on the consumers equipment. Electricity
is being supplied by the Island Development Committees (IDCs), which lacks proper engineering
capabilities to assess and repair damaged power supply equipment.

7-2
As for generation facilities, it is noted that two or more generators cannot be operated at once in
many islands, because there is no synchronous panel (even though we introduce synchronous
panel, technicians from each Island Committee shall be trained well by on-the-job training).
7.3 Planning and Design Policies
It is said that most distribution systems are not in compliance with the regulation of Maldives
Electricity Bureau (MEB), which is the regulating authority and policy maker for generation,
distribution and utilization of electricity, including tariff setting in the whole country. The project
shall be planned and designed to rehabilitate power system to the level which could satisfy
technical standard established by the MEB.
At the same time, the distribution system should be restored within the shortest possible time,
considering the needs of electricity as a lifeline in outer islands.
7.4 Cost Evaluation
The estimated cost of the power supply project at the design stage was as follows:
Table 7.2 Project Cost Estimation
Source; JICA Study Team
Item BOQ Unit Unit Price(US$) Amount (US$)1.Low Voltage Cables
(1)Main Distribution Cables 4 core 120mm2 900 m 55.17 49,653
(2)Main Distribution Cables 4 core 70mm2 500 m 23.75 11,875
(3)Main Distribution Cables 4 core 50mm2 2100 m 16.82 35,322
(4)Main Distribution Cables 4 core 35mm2 6400 m 15.12 96,768
(5)Main Distribution Cables 4 core 25mm2 11300 m 12.92 145,996
(6)Branch Distribution Cables 4 core 16mm2 1250 m 9.75 12,188
(7)Branch Distribution Cables 2 core 6mm2 79750 m 1.41 112,448
2.Low voltage Distribution Box(1)Feeder Pillars 7 台 2000 14,000(2) 18MCBs 48 台 500 24,000(3) 12MCBs 109 台 450 49,050
3.Tools and Installation Materials 1 式 26400 26,400
Transportation From Male to each island 1 式 45300 45,300
Installation works Low voltage Distribution Box 1 式 90100 90,100
Total cost Without Consulting Service Fee 713,099
Equipment Cost
units
units
units
set
set
set

7-3
The tender price at the contract of the power supply projects were 62,742,197 Yen.
7.5 Construction and Implementation Plan 7.5.1 General
The supplier shall carry out the following works under the project.
(1) Supply of goods to the concerned island harbours in the project sites.
(2) Check of the goods after delivering them to the harbours.
(3) Delivery of the packing list of goods to the end user and obtain their signatures on it.
(4) Installation of all the distribution boxes in concrete frames.
(5) Supply of water pumps and of its fuel to remove water from cable trench before cable
installation.
(6) Installation of all the glands to the distribution boxes.
(7) Installation of all the cables from the glands.
(8) Connection of all the cables to the terminals and MCBs.
(9) Labeling of all the cables.
(10) Labeling of all the DBs.
(11) Connection of all the consumer cables to the consumer meter boards.
(12) Commissioning of the distribution network.
(13) Test of the distribution network in the presence of the authorities concerned.
(14) Obtaining all the necessary approvals for the distribution network by JICS.
(15) Handover of the distribution network to the MoAD after approval by JICS.
The supplier shall be reminded that 55 houses in Isdhoo-Kalaidhoo are subject to relocation to
proposed new residential plots as shown in Drawing E-07-01 of the tender specifications. Final
location shall be informed by the end user before awarding the contract.
Work responsibilities of the supplier and the recipient (Island Committee) are shown in following
Table 7.3.
Table 7. 3 Work Demarcation Between the Supplier and the End User Work Item Supplier Island Committee
(End-user) Remarks
Procurement of LV Cables ○ Procurement of Distribution Box ○ Transportation of all equipment from Male’ to the harbour
○
Transportation of all equipment from the harbour to the site
○
Proper storage and maintenance of equipment at the site
○
Preparation of site to install LV cables and ○

7-4
distribution boxes Installation of LV cables, including excavation and backfilling
○
De-watering of LV cable trench (Removing water from cable trench before installation of cable)
○
Supply of water pumps, supply pipes and their fuel for the above de-watering of LV cable trench
○
Connection of LV cables to distribution box ○ Pre-inspection of existing kWh meter boards and procurement of ELCBs, MCBs, earthings, kWh meters etc. in order to meet the MEB standard
○
Individual home (consumer) will be required to procure necessary equipment.
Installation of distribution box ○ Installation of distribution box concrete frame ○*) Acceptance test ○ ○
Note: *) Necessary cement shall be procured and transported to each island by the supplier.
7.5.2 Supply of the Goods
The goods to be procured under the project shall be of its best quality and the reliability of the
goods shall be maintained.
7.5.3 Factory Test and Inspection
The factory test and inspection of the goods to be procured under the project shall be carried out
by the supplier at the manufacturers’ factories and/or proper places to ensure that the goods
complies with the provisions of the contract.
Test and inspection items shall consist of the following:
‑ Quantity inspection
‑ Visual inspection
‑ Dimensions of the equipment and materials
The quantity inspection and visual inspection shall comprise the check of quantities and quality of
workmanship for the goods according to Schedule V Technical Specifications Sheet in Part V
Forms of Tender in Tender Documents. The supplier shall provide all necessary test equipment,
materials, special tools, consumable items, etc., for the factory test and inspection at his own
cost.
The supplier shall submit all the reports of the factory test and inspection to JICS for approval
with evidential photographs of the goods at the factory test and inspection.

7-5
7.5.4 Installation and Commissioning
The supplier shall install the distribution boxes and connect all the cables to the boxes in
accordance with the instruction given by JICS. The scope of work includes the followings at
least.
(1) Procurement and delivery of necessary cement for distribution box concrete frame to each
island harbour.
(2) Installation of the distribution boxes in the concrete frame with screws, wall plugs, etc.
(3) Meggar test of all the cables. (Phase to phase, phase to earth, phase to neutral etc.)
(4) Installation of the PVC glands inside the boxes.
(5) Preparing the cable insulation to insert the cables to the glands.
(6) Insertion of all the cables to the glands.
(7) Arrangement of all the cables from the bottom of the box inside the concrete frame.
(8) Installation of cables ties to the cables.
(9) Installation of cable tags at the cables below the box inside the concrete frame.
(10) Arrangement of all the main cables inside the box.
(11) Cut of the cables to connect to the cable terminal.
(12) Installation of lug sleeves to the cables
(13) Installation of lugs to the cables.
(14) Connection of the main cables to the terminal block.
(15) Arrangement of all the branch cables inside the box.
(16) Installation of cable ties to the cables in bunches.
(17) Installation of the numbering sleeves to the cables.
(18) Connection of the live wires to the MCBs.
(19) Connection of the neutral wires to the neutral links.
(20) Connection of the earth wire to the earth links.
(21) Labeling of the box.
(22) Cleaning inside the box very well.
(23) Other necessary works to install the box.
(24) Commissioning the box.
(25) Test of the voltage from the main terminals.
(26) Connection of all the consumer cables to the concerned consumer.
(27) Energizing the consumer meter board.
(28) Check of the voltage from the consumer meter boards at full load.
(29) Other necessary works to install and commission the distribution boxes and the cables.
During the installation and commissioning works, the supplier shall bear the following costs.
(1) Air transportation cost from Male’ to Kaddhoo
(2) Inland transportation in Laamu Atoll

7-6
(3) Ocean transportation in Laamu Atoll
(4) Ocean transportation from Male’ to Laamu Atoll
(5) Land transportation in Male’
(6) Food and accommodation in Male’ and in Laamu Atoll
(7) Laundry services in Male’ and in Laamu Atoll
(8) Medical services in Laamu Atoll as well as in Male’
(9) All other types of similar costs arising out of the work
7.5.5 Drawings
The supplier shall submit two (2) sets of the following drawings to JICS for approval.
Table 7.4 Submission Schedule of Drawings
No. Name of Drawings Date of Submission
1 Single line diagram of the distribution box 2 Dimensional drawings of the distribution box 3 Schematic diagram of the distribution box 4 Equipment layout of the distribution box 5 Detailed Equipment specifications and catalogues
for All types of LV cables Distribution box Accessories Tools
No later than thirty (30) days after awarding the contract
6 Factory test/inspection report Within seven (7) days after the test/inspection
7 As-built drawings of the distribution box 8 As-built drawings of the whole network drawn on
the scaled map 9 Installation completion report
At the completion of the installation work
“No.8 As- built drawings of the whole network drawn on the scaled map” shall include the name
of residence, meter board location of the residence, consumer cable route of each residence and
public facilities, main cable route indicating the cable sizes in meters, cross sectional drawings of
the cable trench etc. The map shall be drawn from AutoCAD as archive file and all the services
included in the map shall be drawn in separate layers.
“No.9 Installation completion report” shall have the following description and data.
‑ Statement that the goods have been supplied and site installation work and commissioning
has been completed, with the evidence of approval of the Acceptance Test Report.
‑ Description of the supplier’s activities up to the completion of the Project, including actual
time schedule.

7-7
‑ Statement that all the documents, drawings and manuals have been supplied with all records
of documentation and correspondence as evidence.
‑ Statement that clearing of the Project Sites has been completed with photographic evidence.
‑ Completion photographs showing the actual progress of the work.
As of December 2005, the above drawings from No.1 to No.5 have been submitted by the
Contractor, and approved by JICS and/or its Consultant.
7.5.6 Acceptance Test
The Acceptance Test shall be carried out by the supplier at the completion of the installation work
of the goods, in the presence of the all concerned parties including JICS.
The acceptance test shall consist of the following:
‑ Visual inspection
‑ Function and performance test
The visual inspection shall comprise a dimensional and system check, quantity check of the goods
supplied under the contract and the check of workmanship according to the approved drawings.
The function and performance test shall comprise the functional check and confirmation of
performance through the actual operation of the facilities in accordance with the provisions of the
contract. The supplier shall provide, at his own expense, all staff, equipment and materials, tools
including consumable items for the acceptance test.
7.5.7 Implementation Schedule
The implementation schedule of the Project is shown in the Table 7.5 as follows.

7-8
1 2 3 4 1 2 3 4 1 2 3 4 1 2 3 4 1 2 3 4 1 2 3 4 1 2 3 4
1 Request the contractor to revise the drawings
2Approve the revised drawings of the contractor andissue the approval letter to the contractor
3Submit the samples of the cables for the approvalby the contractor
4Approve the samples of the cables
5Submit the samples of the DBs for the approval bythe contractor
6 Approve the samples of the DBs
7
Visit all the islands and do the site surveys of thecable route
8
Prepare the final drawings of the distributionnetwork route map
9
Send an engineer from consultant side and anengineer from the contractor side to the 05 islandswith sample DBs to tell the IDC of the islands howto do the formwork of the distribution boxes andfabricate one template from each type of DB fromeach island.
10
Check the consumer KWH meterboard survey
progress by the IDC and report the status to MEB.
11
Complete all the existing consumer KWH
meterboard survey and send all the required
materials to the islands by the IDC.
12
Confirm with the MEB and MOAD regarding theconsumer KWH meterboards by JICS andconsultant.
13 Send the cement to the islands
14 Construct the distribution boxes concrete stands
15
Bring the cables, distribution boxes and other
accessories to Male' custom harbour.
16
Check all the cables, distribution boxes and other
accessories by the consultant from Male' custom
and give approval letter to the contractor to send
the materials to the islands.
17
Send the cables, distribution boxes and other
accessories to the concerned islands harobour
18 Install the cables by the IDC
19 Install the distribution boxes by the contractor
20 Connect the cables to the distribution boxes
21 Commission the distribution cable network
22
Connect the consumer KWH meter boards to the
new distribution network
23
Test the system and handover the network to the
client officially
Table 7.5 Implementation Schedule of the Project for Power Distribution System in Laamu Atoll2005 2006
Item Description
September MarchFebruaryJanuaryDecemberOctober November
Site supervisors to be at the sites.
7.6 Technical Specification of Equipment 7.6.1 Low Voltage (LV) Cables
(1) General Conditions
1) The supplier shall submit the results of type test certificates issued and approved by
reputable, independent testing laboratories. Such tests would be on random samples at the
discretion of the engineer and failure to meet the conditions of test could result in rejection
of a complete batch of cables.
When such tests are called, they shall comprise the following:
• Partial discharge test
• Bending test, plus discharge test
• Dielectric power factor as function of voltage and capacitance measurement, and as
a function of temperature
• Heating cycle test plus partial discharge test
• Voltage AC test
• Non-electrical tests as stated in IEC 60502.

7-9
2) Conductors
All conductors are manufactured to BS 6360 “Conductors in insulated cables and cords”.
3) Stranded copper
These shall have to be manufactured from plain annealed high conductivity copper.
4) Insulation
Conductors are insulated with PVC which is applied by extrusion to form a compact homogeneous
layer. All PVC compounds used comply with BS 6746 “PVC insulation and sheath of electric
cables”.
5) Fillers and beddings
The cable cores are laid up with fillers between the cores where necessary. Single core cables
have extruded PVC beddings, whilst multicore cables have at least two layers of suitable tape to
provide bedding for the armour.
6) Over sheath
All cables shall be provided with an extruded outer sheath of black PVC complying with the
requirements of BS 6746.
Core identification: Cable cores are identified as shown below.
Twin core: red, black
Four core: red, yellow, blue, black
7) Embossing and marking
The over sheath of each cable shall be embossed as follows
‑ Cable manufacturer name
‑ Length of cable in meters
‑ Cross sectional area of the cable
‑ Manufactured date.
‑ Voltage grade.
8) Voltage testing
All cores shall be spark tested during manufacture, and each completed cable is subjected to an
A.C. voltage test. Test voltages shall be in accordance with BS 6346.
(2) Conditions of the supplier
Before manufacturing the cables, the supplier shall send cables manufacturer’s details and cables

7-10
catalogues to JICS for approval. The details of the cables shall include all the characteristics of
the similar tables given in the technical specifications.
Before shipping the cables, the supplier shall submit a piece of 1,000 mm length from each type
of the cables, which is to be procured under the contract, to JICS’s Liaison Office in Maldives for
its approval. These sample cables shall be labeled with the following at least.
‑ CSA of the cable.
‑ Name of the manufacturer.
‑ Length of the cable.
‑ Name of the client embossed.
‑ Standard of the cables.
‑ Others if necessary.
(3) Conditions of the Cable Manufacturer
The cable manufacturer shall have achieved the BASEC (British Approval Service for Cables)
certificate or license.
7.6.2 Distribution Boxes
(1) General
The distribution boxes shall be GRP (Glass Reinforced Polyester) enclosed distribution boxes.
The boxes shall be designed to install the cables from the bottom entrance.
Before shipping the boxes, the supplier shall assemble one set of distribution box as a sample and
send the sample to JICS’s Liaison Office in Maldives for its approval. As JICS approves the
sample, the supplier can start assembling all the other boxed in accordance with the sample.
The sample submitted to JICS will not be returned to the supplier. If the sample is not approved,
the supplier shall also submit another sample to JICS until obtaining the approval.
Distribution boxes shall only be the high quality branded GRP enclosure including the following at
least:
‑ GRP enclosure IP65.
‑ Polyester enclosure, sealed enclosure IP65 made of Glass Reinforced Polyester (GRP).
‑ IP rating according to IEC 60529.
‑ Insulation class II according to IEC 60232.
‑ Body made up of one piece up to height 800mm.
‑ Canopies on both top and bottom.
‑ Plain door equipped with two or three locks with 8 mm triangular centres.

7-11
‑ Door easily removable for drilling gasket directly moulded on the door.
‑ 04 fixing bolts in the back of the enclosure for mounting plate fastening.
‑ Color: RAL 7032.
‑ Mounting Plates.
‑ Back plates.
‑ Modular chassis with the front cover.
‑ Depth adjustment slides for enclosure.
‑ Three pole three step fork insulated busbars.
‑ Insulated neutral links
‑ Insulated earth links
‑ Flexible cables to do the internal wiring of the boxes.
‑ Four pole terminal blocks.
(2) Accessories
All the accessories shall be provided by the supplier after submitting the samples of the
accessories mentioned in Schedule V Technical Specifications sheet in Part V Forms of Tender in
the Tender Documents, such as:
‑ Lugs from each type
‑ Glands from each type
‑ Lug sleeves from each type.
‑ Numbering sleeves from each type.
7.7 Recommendations Island Committees in the project sites shall be prepared for pre-inspection of existing kWh Meter
Boards and procurement of ELCBs, MCBs, earthings, kWh meters etc. in order to meet MEB
standard. Otherwise, those consumers who don’t meet MEB regulations will not be connected to
the grid.

8-1
CHAPTER 8 SEWERAGE SYSTEM
8.1 Introduction
Sanitation in most islands is affected partly by pour-flush latrines connected to sewerage system,
or to much lesser extent by defaecating holes made within the household compound. The
construction, operation and maintenance of septic tanks involves unhygienic works, thus the
system often suffer from poor performance due to bad maintenance. In many islands, sewerage
system is not well designed, often malfunction, and usually convey raw sewage directly into the
near-shore environment.
This situation can be easily understood by comparing the situation of two islands. The photo
below shows two islands; the one on the left is a normal inhabited island and one on the right is
a resort island. The inhabited island does not have a well designed sewerage system, whereas the
resort island has a well maintained one. The groundwater in the inhabited island is probably rich
in nutrients due to the inadequate sewerage system, and as a result has enhanced seagrass
growth, which is the dark patch seen along the shore of the inhabited island. On the other hand,
seagrass growth is not seen in the resort island probably due to less nutrients in the groundwater.
Seagrass is not harmful but is one visible indication of the groundwater situation.
Comparison of Two Islands With and Without Adequate Sewerage System
8.1.1 Tsunami Impact
The Tsunami of December 26th caused severe damages to the sewerage infrastructure of the
country. It totally devastated the groundwater situation in at least 95 islands, which is about 48%
of all the inhabited islands. According to the residents of Isdhoo Island, 2~3m high waves
advanced to the east seashore, then broke as 5m high waves and rushed through the middle of

8-2
the island from east to west, which was then followed by a 2nd wave. Unfortunately there are no
photos of Isdhoo Island, but one photo of Thaa Atoll shows vividly the devastating force of the
Tsunami event.
Tsunami in Thaa Atoll
In almost all the affected islands, similar impacts were recorded to the groundwater and
underground sewage facilities including home toilet. Tsunami brought up manholes of septic
tanks and scattered sludge and faecal matter, which has penetrated into the ground and
worsened the groundwater situation.
Latest sampling test in Isdhoo Island shows the deterioration of groundwater quality. Each test
showed coliform concentration of over 100 / 100ml (Table 8.1).
Table 8.1 Results of Groundwater Quality Survey
Result/100ml Sample ID
Sampling Location Date
Sampled Sampling Method
Type of Water Total Coliform Faecal Coliform
AO L.Isdhoo 1 2005.7.20 Well >100 >100AP L.Isdhoo 2 2005.7.20 Well >100 >100AQ L.Isdhoo 3 2005.7.20 Well >100 >100
8.1.2 Groundwater Structure
The groundwater in the Maldives islands has an unique structure, so called Lens Water. The land
consists of coral sand that accumulated on the porous coral rock, which extends to the edge of
coral reef. The annual average rainfall in the islands is approximately 2,000mm. Around 30% of
the rainwater penetrate into the ground and accumulate as groundwater. The weight of the fresh
water compresses the seawater into the porous coral rock. The seawater is then pressed

8-3
downward and sideward. A survey conducted by MWSA in 3 islands shows the situation of
groundwater, which is shown in Figure 8.1. The survey shows the importance of groundwater
conservation.
Reef
Lens Water
500,2000,6000,12000mm
10~50mm,500mm
L.Gan
L.GanReef
Inner reef Inner reef
Concept of Groundwater Figure 8.1 Schematic Diagram of Groundwater Structure in Maldives Island
8.2 Present Condition in Isdhoo Island
Aerial Photograph of Isdhoo Island
Like the other islands of Maldives, Isdhoo Island is low lying with ground levels generally less than
2m above sea level. In the Island there are two villages, Isdhoo area and Isdhoo-Kalaidhoo area.
In the above photo, the one in the north of the island is Isdhoo-Kalaidhoo area, and the one in the
south is Isdhoo area. Because Isdhoo-Kalaidhoo is surrounded by a wide reef flat, it is time
consuming to reach to the fishing grounds of the open sea. Instead the areas have become
farmers, thus Isdhoo-Kalaidhoo is an agricultural area. Due to the tsunami, their farmlands were
severely affected.

8-4
After changing the focus island from Fonadhoo to Isdhoo Island at the end of May 2005, through
the decision of GOM, the Study Team started the detail design study.
When the Study Team visited Isdhoo-Kalaidhoo village on May 25th with the basic design, the
Study Team faced with relocation problems. 42 households wanted to move their house in the
east coast to another area. But no plan is submitted yet. So, the Study Team had to finalize the
basic design with a tentative relocation plan. On July 21st, the Team received the draft design of
relocation plan from MPND. (Figure 8.2).
Figure 8.2 Relocation Plan of Ishdhoo/Kalaidhoo
On Sept.11th, MPND, MEEW and MOAD with the Study Team and British Red Cross (BRC) went
to Isdhoo/Kalaidhoo to explain about the revised draft design of relocation plan to the
householder. After this explanation the plan was finalized and according it, final sewerage design
had been completed (Figure 8.2).
42 houses will be built by BRC for 42 evacuees but due to delay of road construction work by
GOM, BRC has not yet started to build. Our project includes 42 Home Type Septic Tanks, pipe line
network and treatment system such as Mounted Leach Field, 2nd Septic Tank those will be
installed for these 42 houses. In case of delay, we should decide to change 42 home type septic
tank installation works to equipment supply project. So further discussion will be needed among

8-5
the party concerned to the project, MEEW, MPND, MOAD and BRC.
Figure 8.2’ Lay-out Plan of the Sewerage System in Ishdhoo/Kalaidhoo
8.3 Planning and Design Policies
Most sewage systems in the islands are not in compliance with the minimum requirement of
Maldives Water and Sanitation Authority (MWSA), which is the regulating authority and policy
maker for water distribution and sanitation of the country. The project shall be planned and
designed to the level satisfactory to the technical standard prepared by MWSA. At the same time,
the sanitation system should be constructed within the shortest possible time.
(1) Preservation of the Groundwater
The aim of the study is to design a sewerage system that is capable of protecting the
groundwater from further deterioration.
(2) Sustainability
The sewerage system must be designed as a sustainable system, having easy maintenance and
low running cost. To assure its sustainability, a new operating organization will be established in
the villages.
(3) Multi-step Differentiable Treatment System
To achieve high treatment performance of black water, the system combines 3 different treatment
methods into one system, which is composed of up-flow type septic tank, 2nd septic tank with
aeration chamber and dual soil treatment bed. For grey-water, slanted soil treatment system is
employed. The systems are described below:
8.3.1 Outline of the Project

8-6
There are two areas for the project in Isdhoo Island. One is Isdhoo-Kalaidhoo area located in the
southern part of the island, and the other is Isdhoo area located in the northern area. Between
the two areas, in the centre of the island, there is a health centre with 6 beds. The construction
office and workshop will be located in this area. The summary of the project is described in the
following Table 8.2.
Table 8.2 Summary of the Project
Site1: Isdhoo-Kalaidhoo Area
Site2: Isdhoo Area Site3: Health Centre Area
Home type septic tank 130pcs 184pcs
Communal type septic tank
No.1
1pcs 1pcs 1pc
Communal type septic tank
No.2
6pcs 7pcs
Conveyance sewer piping Covered above area Covered above area Covered above area
Intermediate pump station 14pcs 14pcs 1pc
2nd Septic tank with pump 7pcs 7pcs 1pc
Mounted Leach Field
(Double Soil Treatment Bed)
7pcs 7pcs 1pc
Drying Bed 2pcs 2pcs
Slanted soil treatment system 137pcs 190pcs 2pcs
Vacuum car 1pcs
The Project is to be implemented on the basis of the following policies:
(1) MWSA is the responsible organization for the implementation of the project in Isdhoo Island.
(2) The project is defined not only as a project for improvement of the sewage treatment
system, but as a project for contributing to the aqueous environment system as well as
improving the groundwater conditions of the island.
(3) The objective of the project is to establish sewerage treatment system and improve ground
water condition by means of replacing old septic-tanks and soak-pit system to new
multi-step treatment system.
(4) The major components of the project consist of constructing the following facilities and
thereby improving the situation of the sewage treatment system.

8-7
- Replacement of the existing deteriorated septic tanks to new one,
- Construction of sewerage conveyance piping network as a collecting system of sewage
water,
- Construction of pump station to convey sewage water,
- Construction of 2nd septic tank as an aeration chamber
- Construction of Mounted Leach Field that compose of double treatment system for sewage
water,
- Construction of drying bed for desludging system,
- Provision of maintenance and desludging system and equipment.
8.3.2 Multi-Step Treatment System
(1) Process of Multi-Step Treatment System
1st Step: Home type septic tank
Comprising of construction of the complete septic tank with two anaerobic chambers including
the up-flow filter filling with aggregate. Three manholes are to be set onto two anaerobic
chambers and up-flow chambers. Total volume of chambers is 1.5m3.
2nd Step: Mounted Leach Field (Primary Treatment Bed)
Comprising of a concrete retaining wall filled with sand, charcoal and gravel filter for soil
treatment bed that is separated into two parts by a wall. One part is primary treatment bed and
the other is secondary treatment bed. These two treatment beds are comprised of dual soil
treatment system. At first, about 60% of the collected effluent from septic tanks will be poured
into the primary treatment bed through the pump station submersible pump. Through the soil
bed, sewage water will be treated by aerobic bacteria and then flow out from the bottom of the
bed to the 2nd septic tank.
3rd Step: 2nd septic tank with pump
Comprising of a complete septic tank that has one aerobic chamber and pump pit with
submersible pump that suck treated water from pump pit and convey water to the secondary
mounted leach field for terminal treatment. In the 2nd septic tank, 40% of remaining collected
sewage water and the treated water will be mixed, and in the aerobic chamber of the 2nd septic
tank the mixed water will be treated again by aerobic bacteria. Using submersible pump of 2nd
septic tank, treated water will be pumped up to the Secondary treatment bed for tertiary
treatment.

8-8
4th Step: Mounted Leach Field (Secondary Treatment Bed)
Comprising of a concrete retaining wall filled with sand, charcoal and gravel filter for soil
treatment bed that is separated into two parts by wall. This part consists the secondary treatment
bed.
(2) Sewage Conveyance
Conveyance sewer piping – comprising of complete sewage water drainage system from septic
tank through the intermediate pump station to the soil treatment bed or through 2nd septic to the
Mount Leach Field.
Intermediate pump station – comprising of a complete pump pit with submersible pump that suck
sewage water from pump pit and convey water from intermediate pump station up to the
Mounted leach field or to 2nd septic tank through conveyance piping.
(3) Dry Bed and Desludging
Drying bed – comprising of in-let pit, drying bed and out-let pit. Drying bed is filled with coral sand
and coral rock filtration, and in the bottom of bed there will be geo-textile filtration. This bed will
be covered by transparent polycarbonate folded roof, which can be opened when collecting the
soil for fertilizer.
Vacuum car – 2.0ton Truck Vehicle with 1,600l Vacuum Car.
1) 2.0ton Truck Vehicle with flat deck
Length: 4,690mm, Width: 1,690mm, Engine: 2000cc
2) 1,600l Vacuum car with engine
Name: Vacuum car, Type: DV-1600B or equivalent,
Total Length: 3,000mm, Width: 1,390mm, Height: 1,645mm
Tank length: 1,950mm, Width: 1,070, Height: 1,070
Tank Volume: 1,600l, Weight: 500kg, Total Weight: 2,100kg
Vacuum Pump: -0.067Mpa(50cmHg), 0.06Mpa(0.6kg/cm2)
Pump Capacity: Sack 1,000l/min, Discharge 700l/min
Engine: 2.9~4.4kw (4PS~6PS)
Hose: Sacking hose 20m, Discharge hose 4m
(4) Grey-Water Treatment System
Slanted soil treatment system – comprising of three slanted plastic trays (1,000mm x 500mm),
cover box and out-let pit under the box. This system is only for high-loaded grey water that flow
out from kitchen basin and cloth washing basin. After treated water stay in the bottom out-let pit
once, the water flow out into existing permeable pit as grey water.

8-9
8.3.3 Treatment Flow of the System
Black Water Hi-Gray Water Lo-Gray Water(Kitchen, Washing) (Shower,Wash basin)(Toilet)
COD
NH4-N
NO3-N
PO4-P
TSS
29%(13%+16%)
45%(23%+22%)
1.5%(0.3%+1.2%)
45.6%(38%+7.6%)
13.7%(9.4%+4.3%)
14%(10%+4.0%)
10.6%(1.7%+2.5%+6.4%)
1.4%(0.1%+0.6%+0.7%)
51%(11%+15%+25%)
6.5%(1.3%+1.1%+4.1%)
8.5%(2.1%+1.3%+5.1%)
31%
44%
97%
3.8%
80%
77%
Volume
Treatment Slunted SoilSystem
Reformed Septic tankSoil Treatment system Treatment system No need
Made from drum can
Charcoal Processing Divice
P
1,000
Plastic tray with soil
600
500
Ground
Wooden Debris
Coconut Tree
Coconut Shell
Sludging
Home Septic Tank
(Upflow Type)
Pump Staion
Dry Bed for Sludge Treatment
Beach sand mixed with sawdust or charcoal
P
2nd Septic tank with Charcoal Filter
AIR
Charcoal
IN
Ground
1
2
3
STEP
STEP
STEP
2nd Mounted Leach Field
1st Mounted Leach Field
Charcoal
Charcoal
4STEP
BOD:250~700ppm
BOD:90~100ppm
BOD:90~100ppm BOD:90~100ppm
BOD:45~50ppm
BOD:63~70ppm
IN BOD:22~25ppm
OUT BOD:11~12.5ppm
BOD:22~25ppmOUT
41%(13%+16%+12%)
Figure 8.3 Schematic Diagram of the System

8-10
8.3.4 Improvement of the Items from 1st Report
(1) Home Type Septic Tank
SECTIONAL ELEVATIONSECTIONAL ELEVATION
Figure 8.4 Design of Home Type Septic Tank
This type of septic tank was introduced by Dr. Duncan Mara of Dundee University in Scotland. In
his publication “Sewage Treatment in Hot Climates”, Dr. Mara shows an example from India. The
septic tank reduced 70% of the initial BOD and changed a malodorous, highly turbid,
grey-to-yellow influent to an odorless, clear, light yellow effluent. In our experience in Cambodia,
this up-flow type septic tank can reduce 64~85% of BOD and is very easy to maintain.
Proto-type FRP Septic Tank
To enforce durability of leakage, we studied to redesign home-type and communal type septic

8-11
tank by FRP (Fiber reinforced plastic). Above photograph shows one proto-type made by FRP in
Sri Lanka work shop. According to inspection with MEEW, 2 design amendments will be done.
One is change of manhole design from square-type to round-type, second is volume of 1st room.
Totally 340 home-type septic tanks (138 for Isdhoo/Kalaidhoo and 202 for Isdhoo) will be
produced in the factory. These FRP septic tanks will reduce the difficulty of installation work in the
narrow space of household.
Proto-type FRP Junction Box
Also we tried to remake the Junction Box made by concrete to FRP because of reliability for
leakage. In concrete made junction box, week-point is in the connection with Vinyl Pipe, but if we
can use FRP junction box, connection with vinyl pipe is smooth and reliability of water proof ness
is very high. Above photograph shows one proto-type made by FRP in Sri Lanka work shop.
According to inspection with MEEW, smoothness of the bottom should be carefully secured.
654 FRP junction boxes produced in Sri Lankan factory will be reduced the difficulties of
installation work because of high ground water level.
○ Increasing number of home-type septic tank
Number
of Houses
Isdhoo/Kalaidhoo
Area except
Relocation Area
Isdhoo/Kalaidhoo
Relocation Area
Isdhoo
Area
Health
Center
Area
Total
Former 88 42 184 0 314
Additional 8 0 18 0 26
Total number 96 42 202 0 340

8-12
(2) Second Septic Tank with Aeration Chamber
GL GL
AEROBIC ROOM
INLETCORAL STONE 40 60MM
OUTLET
100C
100C
CHARCOAL FILTER
WITH VINYL NET
100C 100C 100C
OPEN SPACE
2nd Septic Tank with Aeration Chamber
Figure 8.5 Design of Second Septic Tank with Aeration Chamber
This type of treatment septic tank was introduced by Dr. Uichi Inoue, professor of Waseda
University in Japan in 1964. This system can reduce 65~74% of the BOD through the anaerobic
chamber of septic tank without using electrical power. The aeration chamber will be filled with
charcoal filter produced in the village as a bio-filter.
(3) Dual Treatment System
1.14ton/0.24ton=5minutes/dayP
P
16 HousesNo.1 Septic Tank
No.1 Soil Treatment Bed
Over 90% Treated Water to the Ground
96 Persons*10 Litters=960litter/day16houses*6Persons=96Persons
114Persons*10Litters=1,140litter/day
No.2 Soil Treatment Bed
19 Houses 60% 40%
Pump Station
19houses*6Persons=114Persons
0.24ton/minutes0.4kw 1Fase
5minutes*30days=150minutes/month150minutes=2.5hours/month2.5hours*0.4kw=1.0kwh5.5Rf/kwh*1.0kwh=5.5RF
Running cost
0.4kw 1Fase0.24ton/minutes2.1ton/0.24ton=8.75minutes/day8.75m*30days=262minutes/month262minutes=4.40hours/month4.4hours*0.4kw=1.76kwh5.5Rf/kwh*1.76kwh=9.68RF
5.5RF/month
Pump StationRunning cost9.68RF/month
No.2 Septic Tank1.14ton+0.96ton=2.1ton
Figure 8.6 Diagram of Dual Treatment System

8-13
SCALE 1:200
BLOCK PLAN
Figure 8.7 Design of Dual Treatment System
This system was introduced by Dr. Tomoaki Itayama, National Institute for Environmental Studies
in Japan, as the Two Step Soil Trench Treatment System. This system can reduce 98% of BOD.
In this system, Home Type Septic Tank (Figure 8.8), 2nd Septic Tank (Figure 8.9) and the above
mentioned Dual Treatment System are combined to form a Multi-step Treatment System. The
expected removal rate of BOD will be 90~99%. After completing all treatment process, effluent
will be discharged into the ground. Therefore, there will be no water loses, except loss through
vaporization during treatment process.
(4) Treatment of High-Grey Water
100 1,040 100
1,240
110
190
300
750
Cement Bric
200
250
150
150
Iron bar 6mm @200 t/t
247.5 247.5 247.5 247.5
20 1,000 20
100
150
100
100
50150
100
150
100
50150
100
100
100
No.1 Plastic tray with soil
No.2 Plastic tray with soil
No.3 Plastic tray with soil
Back Plate: Plastic
10 90 10
Outfall with SUS Net
10 90 10
109010
To small bore in the site
No.1 Plastic tray with soil
Bank: Plastic border h=50, t=10
Outfall with SUS Net
Face Cover: Plywood t=12 with Galvineized Steel Sheet t=0.5
Handles: SUS Ready made
100
20500
110
730
205490
5
500
Rail:L-30*30*3 S.O.P
Rail:L-30*30*3 S.O.P
10 90 1010 10
1090
1010
10
PI TV.P.50φ
Water Resistent Mortar Trowell
COVER PLATE: Water Proof Plywood covered with Galvanized Steel sheet t=0.5Handles: SUS Ready made
500
1,000
600
150
100
150
50
150
Pi t
To small bore in the site
Coral sand with sawdust
Plastic tray with soil Kitchen, Washmachine
Iron bar 6mm @200 t/t
Outfall with SUS Net
V.P.50φ
Water Resistent Mortar Trowell
100 1,040 100
100
540
100
(Slamted soil treatment System)High loaded Gray-water Treatment System
Figure 8.8 Treatment Method of High-grey Water

8-14
Slanted Soil Treatment System will be used to treat high-grey water from kitchen and washing by
the same method of multi-step soil treatment system. Three slanted plastic tray are installed
mutually as shown in the Figure 8.11, which is filled with soil or coral sand. The high grey-water
from the sink is poured into the top of the three piling treys. The water flows through the soil in
the tray and will be treated by aerobic bacteria, as well as anaerobic bacteria, which grows behind
the 3 bar setting of the tray. The process will be repeated three times. Dr. Itayama estimates a
reduction rate of BOD of over 99%. After treatment, effluent will be discharged to the ground
through existing penetrating hole.
(5) Desludging
To keep the septic tank functional, desludging of the septic tanks is necessary. However, people
will avoid such unhygienic work without any equipment or incentives. Therefore, an organization
should be established to conduct operation and maintenance of the sewerage system, including
desludging of septic tanks. In preparation of this situation, construction of drying bed and
procurement of desludging devices will be included in the project.
(6) Drying Bed
Dry Bed for Sewage Sudge
150
1,800
150
1,800
150
4,050
In Let Pit
Out Let Pit
350
150
800
100
1,300
150
10050
1201,000
150
150
Dry Bed with Polycarbonate Folded Roof
150 600 150 6,000 150 600 150
7,800
400 400 400 400 400 400 400 400 400 400 400 400 400
Rope or Wire
Polycarbonate Folded Roof
Coral Sand Filtration
Coral Rock FiltrationTerram geotexitile Filtration
100
200100
Rope or WireSUS Fuck
SUS Fuck SUS Fuck
0-100
Polycarbonate Folded Roof
Rope or Wire
V.P.100φ@400 with insect screen
V.P.100φ@400 with insect screen
0-100 adjust to roof curving
Cat Walk
Figure 8.9 Diagram of Drying Bed
The design of drying bed is shown in Figure 8.9. One unit consists of two drying beds filled with
coral sand and rock. The dimension of the bed is 6.0m x 1.8m. One bed can treat 2.5 ton sewage
sludge in one time. It takes 7 days to dry sludge completely. So, one unit can treat 4 house’s

8-15
sludge per 1 week, since the volume of home septic tank is 1.5 ton. That means one unit can treat
212 septic tanks per year. Therefore, Isdhoo area (202 household) and Isdhoo-Kalaidhoo area
(138 household) have one unit each. The roof on the beds is made of polycarbonate transparent
sheet to heat and dry beds. This roof also protects dry bed from rain. For convenience, when
someone needs to take out the soil, the roof can be easily removed.
(7) Vacuum Car
Vacuum car (vehicle with desludging machine and tank) was required from MWSA. But the Team
could not obtain any specification. The Team is looking for a suitable vacuum car in Sri Lanka.

8-16
8.3.5 Facility List
Table 8.3 Sewerage System Facility List of Site 1 Isdhoo-Kalaidhoo Area
(Except Relocation Area) Items Quantity Note
1 150φV.P. Pipe with connection, leveling 1/200 Refilling, Finishing of road surface
M Existing road: Sand compaction finish
2 100φV.P. M From toilet until main piping using 100φ
3 50φV.P. M From pump station to Reach Field 4 Junction box 150φ pc 5 Home type Septic Tank 1.5ton 88+8pc FRP type
6 Communal Septic Tank 2.5ton 7pcs FRP type
7 Connection work to existing pipe 0pc Recipient side matter 8 Communal Septic tank 25ton 1pc School 9 Connection work to existing pipe 0pc Recipient side matter 10 Sewage pump station with pit 20pc 11 Sewage pump
D40A-2, 220/250V, 50Hz, 3.5A, 1φ0.4kw 20pc DAVEY40 or equivalent Sewage
Pump 12 2nd Septic Tank with pump 5pc Aeration chamber with charcoal
filter 13 Mounted Leach Field
Dual Step Treatment Bed 5pc
14 Sludge Drying Bed with polycarbonate folded roof, 2 units
1unit
15 Slant soil treatment system 88+8pcs 1pc for 1facility except school Total number will be changed
according to increasing number of home-type septic tank
16 Connection work to existing pipe 0pc Recipient side matter 17 Electrical works 1unit Power supply from existing
distribution board to newly installed panel is recipient side matter
18 Vacuum car 0unit 19 Others 1unit

8-17
Table 8.4 Sewerage System Facility List of Site 1 Isdhoo-Kalaidhoo Relocation Area Items Quantity Note 1 150φV.P.
Pipe with connection, leveling 1/200 Refilling, Finishing of road surface
M Existing road: Sand compaction finish
2 100φV.P. M From toilet until main piping using 100φ
3 50φV.P. M From pump station to Reach Field 4 Junction box 150φ Pc 5 Home type Septic Tank 1.5ton 42pc FRP type
6 Communal Septic Tank 2.5ton 0pcs FRP type
7 Connection work to existing pipe 0pc Recipient matter 8 Communal Septic tank 25ton 0pc 9 Connection work to existing pipe 0pc Recipient matter 10 Sewage pump station with pit 4pc 11 Sewage pump
D40A-2, 220/250V, 50Hz, 3.5A, 1φ0.4kw 4pc DAVEY40 or equivalent Sewage Pump
12 2nd Septic Tank with pump 2pcs Aeration chamber with charcoal filter 13 Mounted Leach Field
Dual Step Treatment Bed 2pc
14 Sludge Drying Bed with polycarbonate folded roof, 2 units
0pc
15 Slant soil treatment system 42pcs 1pc for 1facility except school Total number will be changed according to increasing number of home-type septic tank
16 Connection work to existing pipe 0pc Recipient matter 17 Electrical works 1unit Power supply from existing distribution
board to newly installed panel is recipient side matter
18 Vacuum car 0unit 19 Others 1unit

8-18
Table 8.5 Sewerage System Facility List of Site 2 Isdhoo Area Items Quantity Note 1 150φV.P.
Pipe with connection, leveling 1/200 Refilling, Finishing of road surface
M Existing road: Sand compaction finish
2 150φV.P. M From toilet until main piping using 100φ
3 50φV.P. M From pump station to Reach Field 4 Junction box 150φ Pc 5 Home type Septic Tank 1.5ton 184+18pc FRP type
6 Communal Septic Tank 2.5ton 6pc FRP type
7 Connection work to existing pipe 0pc Recipient matter 8 Communal Septic tank 25ton 1pc School 9 Connection work to existing pipe 0pc Recipient matter 10 Sewage pump station with pit 24pc 11 Sewage pump
D40A-2, 220/250V, 50Hz, 3.5A, 1φ0.4kw 24pc DAVEY40 or equivalent Sewage
Pump 12 2nd Septic Tank with pump 7unit Aeration chamber with charcoal
filter 13 Mounted Leach Field
Dual Step Treatment Bed 7unit
14 Sludge Drying Bed with polycarbonate folded roof, 2 units
1pc
15 Slant soil treatment system 184+6pc 1pc for 1facility except school Total number will be changed according to increasing number of home-type septic tank
16 Connection work to existing pipe 0pc Recipient matter 17 Electrical works 1unit Power supply from existing
distribution board to newly installed panel is recipient side matter
Others 1unit

8-19
Table 8.6 Sewerage System Facility List of Site 3 Health Centre &
Temporary Office Area Items Quantity Note
1. 150φV.P. Pipe with connection, leveling 1/200 Refilling, Finishing of road surface
M Existing road: Sand compaction finish
2 100φV.P. M From toilet until main piping using 100φ
3 50φV.P. M From pump station to Reach Field 4 Junction box 150φ pc 5 Home type Septic Tank 1.5ton 0pc FRP type
6 Communal Septic Tank 2.5ton 1pcs FRP type
7 Connection work to existing pipe 0pc Recipient side matter 8 Communal Septic tank 25ton 0pc 9 Connection work to existing pipe 0pc Recipient side matter 10 Sewage pump station with pit 2pc 11 Sewage pump
D40A-2, 220/250V, 50Hz, 3.5A, 1φ0.4kw 2pc DAVEY40 or equivalent Sewage Pump
12 2nd Septic Tank with pump 1pc Aeration chamber with charcoal filter13 Mounted Leach Field
Dual Step Treatment Bed 1pc
14 Sludge Drying Bed with polycarbonate folded roof, 2 units
0pc
15 Slant soil treatment system 2pcs Total number will be changed according to increasing number of home-type septic tank
16 Connection work to existing pipe 0pc Recipient side matter 17 Electrical works 1unit 18 Vacuum car 1unit * 19 Others 1unit
* Vacuum car – 2.0ton Truck Vehicle with 1,600l Vacuum car.
1) 2.0ton Truck Vehicle with flat deck
Length: 4,690mm, Width: 1,690mm, Engine: 2000cc
2) 1,600l Vacuum car with engine
Name: Vacuum car, Type: DV-1600B or equivalent,
Total Length: 3,000mm, Width: 1,390mm, Height: 1,645mm
Tank length: 1,950mm, Width: 1,070, Height: 1,070
Tank Volume: 1,600l, Weight: 500kg, Total Weight: 2,100kg
Vacuum Pump: -0.067Mpa(50cmHg), 0.06Mpa(0.6kg/cm2)
Pump Capacity: Sack 1,000l/min, Discharge 700l/min
Engine: 2.9~4.4kw (4PS~6PS)
Hose: Sacking hose 20m, Discharge hose 4m

8-20
8.4 Cost Estimation
The estimated project cost of the sewerage system at the design stage is as shown in Table 8.7 ~
8.8
8.4.1 Isdhoo Area
Table 8.7 Cost Estimation of Isdhoo Area
Unit price (US$) Cost (US$) 1. 150φV.P. (10%loss included)
Pipe with connection, leveling 1/200 Refilling, Finishing of road surface
7,760m 25 194,000
2 150φV.P. (10%loss included) 275m 35 9,6253 50φV.P. (10%loss included) 1,250m 20 25,0004 Junction box 150φ 658pc 40 26,3205 FRP home type Septic Tank 1.5ton 184pc 750 138,000
6 FRP Communal Septic Tank 2.5ton 6pc 750 4,500
7 Connection work to existing pipe 0pc 100 08 Communal Septic tank 25ton 2pc 4,500 9,0009 Connection work to existing pipe 0pc 500 010 Sewage pump station with pit 24pc 850 20,40011 Sewage pump
D40A-2, 220/250V, 50Hz, 3.5A, 1φ0.4kw 24pc 400 9,600
12 2nd Septic Tank with pump 7 2,900 20,30013 Mounted Leach Field 14pc 11,000 154,00014 Sludge Drying Bed with polycarbonate folded
roof, 2 units 1pc 9,000 9,000
15 Slant soil treatment system 190pc 200 38,00016 Connection work to existing pipe 0pc 50 017 Electrical works 1 5,500 Others 1 65,000 Sub total 728,245 Contingencies 82,255 Site expense 80,000 TOTAL 890,500

8-21
8.4.2 Isdhoo-Kalaidhoo Area
Table 8.8 Cost Estimation of Isdhoo-Kalaidhoo Area
Unit price (US$) Cost (US$) 1. 150φV.P. (10%loss included)
Pipe with connection, leveling 1/200 Refilling, Finishing of road surface
6,920m 25 173,000
2 150φV.P. (10%loss included) 135m 35 4,7253 50φV.P. (10%loss included) 1,090m 20 21,8004 Junction box 150φ 602pc 40 24,0805 Home type Septic Tank 1.5ton 130pc 750 97,500
6 Communal Septic Tank 2.5ton 7pcs 750 5,250
7 Connection work to existing pipe 0pc 100 08 Communal Septic tank 25ton 2pc 2,500 5,0009 Connection work to existing pipe 0pc 500 010 Sewage pump station with pit 20pc 850 17,00011 Sewage pump 20pc 400 8,00012 2nd Septic Tank with pump 8pc 2,900 23,200 13 Mounted Leach Field 15pc 11,000 165,00014 Sludge Drying Bed 1pc 9,000 9,00015 Slant soil treatment system 137pcs 200 27,40016 Connection work to existing pipe 0pc 50 017 Electrical works 1 5,50018 Vacuum car 1unit 40,000 40,00019 Others 1 60,000 Sub total 686,455 Contingencies 68,045 Site expense 70,000 TOTAL 824,500
NOTE: This cost estimation does not include recent cost escalation.
The tender price at the contract were 210,000,000 Yen (or 1,750,000 US$).

8-22
8.4.3 Operation and Maintenance Cost
(1) Isdhoo Area
Running Cost (Power consumption and Pump replacement):
1) Power consumption
(5.5+9.68)/2*1.5=11.385Rf/pump/month
(24+0.5)*11.5=281.75Rf/month
281.75/month*12months*3years=10,143Rf---------A
2) Pump replace(3years each)
300USD*12.75Rf*24.5pumps=93,712.5Rf-----------B
A+B=103,855.5Rf/3years
103,855.5/3years/12month=2,884.875/month------(1)
Operation and Maintenance cost (Manpower and Desludging Equipment):
3) Manpower
3ps*2,000Rf=6,000Rf/month------------------------------C
4) Office running cost
1,000Rf/month-------------------------------------------------D
5) Replace of Desludging Equipment
360,000Rf/10years=36,000Rf/year=3,000Rf/month
3,000Rf/5*3Areas=1,800Rf/month--------------------------E
C+D+E=8,800Rf/month-------------------------------------(2)
Total Cost:
(1)+(2)=11,684Rf/month
Share of one house holder:
11,684Rf/186householder=62.817Rf
=About 63Rf/month
(2) Isdhoo-Kalaidhoo Area
Running Cost (Power consumption and Pump replacement):
1) Power consumption
(5.5+9.68)/2*1.5=11.385Rf/pump/month
(20+0.5)*11.5=235.75Rf/month
235.75/month*12months*3years=8,487Rf-----------A
2) Pump replace(3years each)
300USD*12.75Rf*20.5pumps=78,412.5Rf-----------B

8-23
A+B=86,899.5Rf/3years
86,899.5/3years/12month=2,413.875/month
Operation and Maintenance cost (Manpower and Desludging Equipment):
3) Manpower
2ps*2,000Rf=4,000Rf/month------------------------------C
4) Office running cost
800Rf/month----------------------------------------------------D
5) Replace of Desludging Equipment
360,000Rf/10years=36,000Rf/year=3,000Rf/month
3,000Rf/5*2Areas=1,200Rf/month--------------------------E
C+D+E=6,000Rf/month-------------------------------------(2)
Total Cost:
(1)+(2)=8,513Rf/month
Share of one house holder:
8,513Rf/130householder=65.48Rf
=About 66Rf/month
(3) Expected Income
For example, in Gan island, a farmer uses fertilizers of cow feces imported from India. It costs 1
US$ per 1 kg. The farmer grows vegetables using this fertilizer and sells the product to the resort
hotels in Maldives. According to the farmer the cost is well balanced. If the organization of the
new sewerage system can create new market in Isdhoo, they can sell the fertilizer made from
human feces. The calculated price is 2Rf/kg. It is 1/6 cheaper than Indian fertilizer.
Expected product of fertilizer in Drying Bed:
130+184=314 houses (Isdhoo+Isdhoo-Kalaidhoo)/2years
157 houses/year×300kg=47,100kg/year
47,100kg×2Rf=94,200Rf/year
Total Income=94,200/year
Total Outgo=87,000+102,000=189,000/year
Total Outgo-Total Income=189,000Rf-94,000Rf=95,000Rf/year
So, there is the possibility of reduction of the payment as below:
95,000Rf/(130+184)=302.55Rf/year par one householder
302.55Rf/12month=25.21Rf/month

8-24
8.5 Construction and Implementation Plan
The schedule of the pre-qualification. tendering and construction are as follows: 1) P/Q 2 August, 2005 2) Tender Opening 5 December, 2005 3) Award and Contract 9 November, 2005 4) Construction Period Mid-November 2005 to early July 2006
The tender and construction schedule will start in the middle of Oct. 2005 and should be
completed by the end of June 2006. Table 8.9 – 8.11 shows the Scope of Work and shares to be
born by the responsible organizations of GOM and Japan.
Table 8.9 Construction of Facilities
Item GOM Japan1 Construction of septic tank ○
2 Construction of sewer piping network ○
3 Construction of intermediate pump station ○
4 Construction of mounted leach field ○
5 Construction of 2nd septic tank with pump station ○
6 Demolish of existing septic tank if necessary ○ 7 Connection from existing toilet to installed septic tank ○ 8 Construction of new water treatment facility ○
9 Construction of sludge drying bed ○
10 Installation of pumps ○
11 Coordination during connection work between the existing pipes and newly installed pipes
○
Table 8.10 Provision of Equipment Item GOM Japan1 Equipment for water quality test ○
2 Equipment for sludge discharge ○
3 Equipment for water quality test ○
4 Equipment for charcoal production ○
Table 8.11 Others Item GOM Japan1 Acquisition of approval, permission or etc. from the Authorities;
Road crossing work Electricity work Any other work which require approval, permission etc.
○
2 Land acquisition for treatment facilities and temporary office ○ 3 Grass-cutting in the water treatment plant ○ 4 Construction of fence and its gate ○ 5 Coordination during water cutoff ○ 6 Information on buried facilities and attendance to excavation work ○ 7 Free water supply to pipe-flushing (washing) ○
8 Electrical work up to incoming panel (included) ○ 9 Trial excavation ○

8-25
10 Pipe-flushing work ○
11 Leak-detection tests of septic tanks and piping network ○
12 Charcoal production ○
8.6 Recommendations (1) To examine and select best construction measure for Septic tank
To examine FRP Up-flow Type Septic Tank (According to the comparison study with MEEW, FRP
type is better than concrete type in durability, water proof and workability, so we select FRP type
septic tank.)
To examine construction method of 2nd Septic Tank with depth over 2.5m to secure ground water
(To protect ground water we have changed the design the depth from 2.5m to 1.5m)
(2) Using debris of the devastated area for the construction of the system
To use it for Up-flow filter in Home Type Septic Tank
To use it for the retaining wall for Mounted Leach Field
To use it for the filtration of Mounted Leach Field
To use it gravel for the foundation of the facilities
(3) Using local labor for the construction stage of the project
To use them as worker in the construction
To use 3~6 persons as assistant manager on the project site
(Both Island Office has already select the member of the candidates)
(4) Using local made charcoal as the bio-filter for the system
To use local made charcoal as the bio-filter for the 2nd Septic Tank Aeration Chamber
To use it for the filtration of Mounted Leach Field and Drying Bed
To use it for the filtration for the other facilities
(Both Island Office promised to produce and offer charcoal to the contractor with appropriate
price)
(5) To promote charcoal using system in the village
To install charcoal processing device
To provide charcoal using chance
(6) Capacity Building of Operation and Maintenance
To learn how to work the system through construction stage
To learn how to maintain the system through construction stage
To learn how to maintain the system through and making operation manual
(7) Environmental Monitoring of the Groundwater
To use new organization for monitoring
(Sampling ground water from existing well and send sample to central office)
To install monitoring devices to central office in MEEW
(Ph meter, COD and BOD measurement equipment, CO2 incubator, microscope, etc)

9-1
CHAPTER 9 ALTERNATIVE COMMUNICATION AND NETWORK
9.1 Introduction
9.1.1 Background
The Maldives comprises a long, narrow chain of atolls that are located in the northern Indian
Ocean. This small nation extends approximately 800 km from the northernmost tip to the
southernmost tip and it contains about 1190 islands. The exclusive economic zone of the Maldives
covers about 859,000 km2. The capital is Male’, and from here the other island communities are
administered through a total of 20 local Atoll Offices. The island communities are widely dispersed,
so communications within the Maldives, and with the rest of the world, are totally dependent on
public telephone services. If the public telephone network is out of service, then communications
are not possible. This presents a very serious problem in emergency situations, such as tsunami
and typhoons.
On December 26, 2004 a major earthquake (M9.0), occurred in the Indian Ocean near the
Indonesian island of Sumatra. The resulting tsunami caused extensive damage in the Maldives,
including the telecommunications network. The Maldives telecommunications infrastructure is
based on a terrestrial microwave network backbone. This network consists of 37 nodes. The
tsunami disaster damaged 5 of these nodes and telecommunication services to 13 atolls
(comprising 168 separate islands) were disrupted.
Dhiraggu, which is the sole telecommunications operator in the Maldives, started work on
restoring the telephone network immediately after the tsunami. As a result, telecommunication
services were restored within 3 weeks. However, the Maldives government does not have an
alternative communications network that can be used when the pubic telephone network is
damaged. Moreover, when an aftershock related to the Sumatra earthquake occurred on March
29, 2005, it was reported that some telephone calls could not be made. This was due to line
congestion caused by the increased traffic resulting from emergency calls.
Based on the above circumstances, the government of the Maldives has decided to develop an
alternative communications network, which is not affected by disasters.
9.1.2 Objectives of the Study
The objectives of the study are to make an optimal development plan for an alternative
communications network, including a disaster warning system, to increase the comprehensive
natural disaster management capability of the Maldives. This study also incorporates the
experience and lessons learned from Japanese disaster prevention procedures.

9-2
The study includes:
1) Assessment of the current condition of telecommunications in the Maldives,
2) Analysis of the impact of the December 26 tsunami on telecommunications,
3) Formulation of a disaster prevention plan for the Maldives,
4) Preliminary design and cost estimation for an alternative communications
system,
5) Preparation of a preliminary implementation schedule for the system, and
6) Recommendations for the system implementation.
9.2 Telecommunications in the Maldives
9.2.1 Transformation of Telecommunication Services
The telecommunication service in the Maldives was officially started when a wireless telegraph
radio circuit was set up between the Maldives and Sri Lanka in 1943. Dedicated telephone
services were later introduced in the country in 1968 with the capacity of 20 lines via a manual
exchange.
The tourism industry of the Maldives started in 1972. Tourism boosted the demand of
international telecommunication services. As a result of the rapidly growing demand for both local
and international telecommunication, the first automatic telephone exchange, with the capacity
of 300 lines, was installed in Male’ in 1972. In 1973, the first international earth station (NEC
standard B) came into operation, giving the general public access to international
telecommunication services.
Major milestones in the history of the Maldives telecommunication services include the following:
1943 Telecommunications services officially started in the Maldives. 1967 Radio telephone service introduced to two atoll capitals. 1968 Public telephone service introduced into Male’. 1977 First Maldives earth station 1988 Telecommunications public enterprise, Dhivehi Raajjeyge Gulhun Private Limited
(Dhiraagu), established. 1991 Paging services introduced. 1993 Public card phone service launched. 1996 Internet services introduced. 1997 Dhiraagu Mobile Phone Service “DhiMobile” (with AMPS) introduced. 1998 Cyber Café opened in Male’. 1999 Telephone services to cover all inhabited islands. GSM mobile services commenced. 2000 International GSM roaming services launched
Internet dial-up access at up to 56 kbps introduced DhiMobile Data, Fax services introduced

9-3
2001 GSM coverage expanded to cover Baa and Lhaviyani atolls (all resorts and the main inhabited islands).
DhiMobile SMS service launched. DhiMobile VoiceMail service launched.
2002 DhiveNet Broadband with ADSL introduced.
9.2.2 Relevant organization
Responsibility for the formulation and promulgation of telecommunication policy in the Maldives
lies with the MTC, which discharges its responsibilities through the Telecommunications Authority
of Maldives (TAM). Under the TAM, there is an organization named Dhivehi Raajjeyge Gulhun
Private Limited (Dhiraagu) which operates the actual telecommunication services as a public
enterprise. The organization chart of relevant entities is shown in Figure 9.1.
Figure 9. 1 Organization Chart of the Maldives Telecommunication Sector
(as of June, 2005)
9.2.3 Telecommunication operator and services
Dhivehi Raajjeyge Gulhun Private Limited (Dhiraagu), which is the sole telecommunication
operator in the country, was founded and registered in 1998. Dhiraagu is a joint venture company
with 55% of its share owned by the government of the Maldives and 45% by Cable and Wireless
The President Office The People’s Majilis
Pubic Service Division
High Court
Human Rights Commissionof the Maldives
Ministry ofCommunication,
Science andTechnology
National Center forInformation Technology
TelecommunicationsAuthority of Maldives
Maldives Post Limited
Dhivehi RaajjeygeGulhun Private Limited
Other Ministries Other Ministries
Legend:
: Public enterprise

9-4
plc. of the United Kingdom. Dhiraagu provides fixed local and long distance telephone services,
international telephone services, GSM cellular mobile services, packet switch services and
Internet services as follows:
1) Fixed line services: local, long-distance, international
2) Public phone services: Smartcard based public card phone
3) Mobile services: GSM post-paid and pre-paid, Short Massage Service (SMS),
Voice Mail, Fax Mail
4) Internet or data services: Dial-up, ISDN, ADSL, Web hosting
5) Leased line services: local, national and international digital leased circuits
The following table provides the telecommunications indicators and telephone density in the
Maldives. It clearly shows that the availability of telephone lines in areas outside of Male’ is
much lower than within Male’, proving a considerable imbalance of telephone lines in the nation.
Table 9. 1 Telecommunications Indicators 1999-2003
1999 2000 2001 2002 2003 Growth rate(1999-2003)
Population 266,093*1 270,101 275,975*1 280,549*1 285,066*1 7%
Male’ - 74,008 - - - -
Other islands - 196,093 - - - -
Fixed telephone lines 22,179 24,432 27,242 28,651 30,056 36%
Male' 16,787 18,700 20,171 20,964 21,858 30%
Other inhabited islands 4,381 4,800 6,087 6,656 7,127 63%
Resorts 727 810 851 872 883 21%
Uninhabited islands 284 122 133 159 188 -34%
Pay Phones 579 577 723 769 854 47%
Male' and Villingili 104 133 150 158 146 40%
Other islands 475 444 573 611 708 49%
Mobile Phones 2,776 8,387 18,433 41,899 66,466 2,294%
Post-paid 2,776 8,387 11,537 12,274 13,277 378%
Pre-paid - - 6,896 29,625 53,189 -
Registered Internet subscribers
939 1,060 1,063 1,067 1,155 23%
Paging subscribers 2,682 2,608 1,824 781 272 -90%
Telex lines 47 46 43 38 38 -19%
Internet usage minutes (000's)
20,020 35,945 43,893 51,358 52,068 160%
Source: Statistical year book of Maldives (2004)
Note: Male’ includes Villingili, Aarah, Hulule’ & Hulhumale’, *1:Mid-year population (estimated)
The growth rate of the respective services for the five years from 1999 to 2003 was 36% for fixed
line telephones, 2,294% for mobile telephones and 160% for Internet usage time. While the

9-5
number of subscribers to fixed line telephones is increasing slowly, the number of subscribers to
mobile phones continues to increase rapidly. Since Dhiraagu started their pre-paid card mobile
phone services with the Short Message Service (SMS) function in 2001, the number of subscribers
has dramatically increased.
Table 9. 2 Fixed and Mobile Telephone Density (per 100 inhabitants) 1999-2003
1999 2000 2001 2002 2003
Fixed telephone density 8.34 9.05 9.87 10.21 10.54
Male' - 25.27 - - -
Other island - 2.92 - - -
Mobile telephone density 1.04 3.11 6.68 14.93 23.32
Fixed and mobile telephone density 9.38 12.15 16.55 25.15 33.86
Source: Statistical year book of Maldives (2004)
The World Bank classifies countries according to the GNI per capita. According to this
classification, the Maldives is a “Lower middle income” country (US$746-US$2,975). The
following table shows the telecommunications density in lower middle income countries of Asia
and Oceania in 2002. It is evident from this table that almost all the indices of the Maldives
exceed the average in Asia and Oceania.
Table 9. 3 Telecommunications Density in Lower Middle Income Countries
in Asia and Oceania (2002)
Country Internet
/100 inhabitants PC
/100 inhabitants
Fixed telephone
/100 inhabitants
Mobile telephone
/100 inhabitants
Fixed +Mobile/100 inhabitants
1 China 4.60 1.95 16.69 16.09 32.78
2 Turkey 7.28 4.01 28.12 34.75 62.87
3 Thailand 7.75 2.75 9.87 26.04 35.91
4 Philippines 2.50 2.13 4.17 17.77 21.94
5 Iran 1.53 6.87 19.95 3.23 23.18
6 Jordan 4.42 3.21 12.76 16.71 29.47
7 Sri Lanka 1.06 1.32 4.66 4.92 9.58
8 Kazakhstan 0.94 - 12.05 3.62 15.67
9 Syria 0.35 1.59 10.30 1.20 11.50
10 Fiji 2.75 5.00 11.23 10.78 22.01
11 Maldives 5.00 3.33 10.27 15.02 25.29
12 Turkmenistan 0.16 - 8.02 0.17 8.19
13 Vanuatu 2.75 0.10 3.36 0.17 3.53
14 Micronesia 5.00 - 8.67 0.00 8.67
15 Samoa 2.00 0.60 5.70 1.78 7.48
16 Tonga 2.90 1.50 11.31 3.39 14.70
17 Kiribati 2.00 1.00 4.21 0.58 4.79

9-6
18 Marshal Is. 0.90 3.00 7.67 0.90 8.57
Average 2.99 2.56 10.50 8.73 19.23
Source: ITU Statistical Year Book (2004)
9.2.4 ICT network
Figure 9.2 shows the information and
communications technology (ICT) trunk network in
the Maldives. The Maldives telecommunications
infrastructure is based on a terrestrial microwave
network backbone. This network consists of 37
nodes. To the north, the network extends from
Male’ to Dhidhdhoo, Haa Alif Atoll, and to the south,
it extends to Gan, Laamu Atoll. The southernmost
four atolls (Gaaf Alif, Gaaf Dhaalu, Gnaviyani and
Seenu atolls) are connected to Male’ via satellite
through Hithadhoo, Seenu Atoll. These four atolls
are connected to each other through a microwave
terrestrial network extending from Hithadhoo to
Gaafu Alifu and Gaafu Dhaalu atolls.
Most parts of the network are serially connected through a network of radio repeater stations.
The usual network protection with backup facilities, are provided at each of the critical nodes of
the network. These include duplication between radio and multiplex equipment and between
solar power and standby generators. However, due to the geography of the Maldives, there are
difficulties in securing route diversity.
Repeater station at Felidhoo
9-7
Figure 9. 2 ICT Trunk network in the Maldives
Dhidhoo
Kulhudhuffusi
Kanditheemu Foakaidhoo
Farukolhufunadhoo
Holhudhoo
Naifalu
Kaashidhoo
Gaafaru
Eydhafuchi
Rasdhoo
FihalhohiMahidadhoo
Dhagethi Felidhoo
Raiyamandhoo
Kolhufushi
Guraidhoo
Gan
Feeali
Meedhoo
Kudahuvadhoo
Ugoofaaru
Male’
Standard A earth station
Digital Switch (x1)
Standard A internationalearth station
Digital Switch (x2)
N
S
EW
Rasfari
Legend::Microwave Trunk line
Viligili
Dhaandhoo
Gemenefushi
Gadhdhoo
ThinadhooHoadedhoo
Rathafandhoo
Fuammulah
Hithadhoo

9-8
9.2.5 National ICT strategy
ICT national strategies in the Maldives are summarized in both the “Sixth National Development
Plan 2001 – 2005” and “Maldives Telecommunication Policy 2001 – 2005”. Since this year (2005)
is the last year of the 2001 – 2005 policy target, an evaluation of performance is required at the
end of the year. However, since a performance index was not specified in the plans, it is hard to
make an evaluation at present. These two plans are now being revised for a new target year
(2010).
(1) Six National Development Plan 2001 – 2005
In the Sixth National Development Plan (2001- 2005), which was prepared by the Ministry of
Planning and National Development, issues and policies with regard to ICT were identified are as
follows:
1) Issues
Dhiraagu’s current system of charging on the minute basis further inflates the cost to
be borne by the consumers and is a serious burden especially for businesses and other
institutions that make a large number of calls.
Presently, telecommunications services in the Maldives are largely concentrated in and
around the country’s capital. In Male’, one in every three persons has a telephone on
average, while the ratio in the other areas of the country is one in fifty. Mobile services
are limited to Male’, North and South Ari Atolls and to certain parts in Lhaviyani Atoll
and Baa Atoll. Similarly, Internet services are limited to Male’ and a few other islands.
This imbalance of access to telecommunications services needs to be urgently
remedied.
Telecommunications service fees charged in Male’ are lower than the fees charged in
the rest of the country. Line rental in Male’ is Rf.30 per month, while the same service
outside Male’ is Rf.3,450. Similarly, the phone installation cost in Male’ is Rf.1,720 while
charges elsewhere vary between Rf.2,990 to Rf.12,650. Such high fees make
telephones unaffordable for the majority of people living outside Male’. A significant
reduction in such disparity is essential to improve the quality of life and to encourage
and facilitate socio-economic development throughout the country.
The lack of clear ICT legislative and regulatory mechanisms in the nation has left
consumers at the mercy of the service provider. The service provider is also in a
position of uncertainty regarding policy and regulatory decisions and is reluctant to
invest in projects with long payback periods while attempting to maximize profit with

9-9
minimum investment. Comprehensive legislative and regulatory mechanisms are
therefore needed to improve the telecommunications sector.
Competition is extremely important to improve the quality of services and make
services more affordable. While most sectors of the Maldives have been opened up for
competition, Dhiraagu maintains a monopoly over most of the telecommunications
services. Therefore, opening up the telecommunications sector is necessary to meet
the goals of Vision 2020.
2) Policies
Make telecommunications services affordable to the public and business sectors at
large and reduce the regional disparity in the provision of telecommunication services
Improve the regulatory framework governing the telecommunication sector and
strengthen consumer rights and protection
Explore liberalization of the telecommunications sector by gradually opening up the
Internet and mobile service provisions for competition
Enhance and promote info-communications facilities and services in the Maldives
(2) Telecommunication Policy 2001 – 2005
In accordance with the national development plan, the MTC formulated telecommunications
policies for 2001 – 2005. The policies identify and address key issues in six major areas in order to
secure a sustainable development of telecommunication services.
1) Telecommunication charges in the Maldives
Policy: Reduce charges of all telecommunication services.
Reduce the disparity in telecommunication charges between Male’ and the rest of the
country
Lower the Internet charges
Reduce international call charges
Reduce leased line charges
Reduce chargeable units
Set a cost-related tariff for service provision
2) Telecommunication services outside the capital
Policy: Expand telecommunication services and reduce the disparity in service provision
between Male’ and other islands.
Provide country-wide telephone services on demand on an equal basis
Expand mobile telephone service to the whole country
Provide high speed Internet services across the country
Increase the capacity of international connections
9-10
3) Telecommunication regulatory structure
Policy: Provide necessary means and powers to the regulator through an appropriate
legislative framework to strengthen the telecommunications sector.
Strengthen the legislative framework of the telecommunications sector
Distance the regulator from the management of the telecommunications company
Enhance and strengthen the regulator
4) Competition in telecommunications services
Policy: Open the telecommunications sector and encourage competition therein.
Open telecommunications services for completion
Make necessary resources available for telecommunications operators
5) Government revenue from the telecommunications sector
Policy: Make the Government’s revenue from the telecommunications sector less
dependent on the profit of the sector.
Identify additional sources of revenue for the Government from the telecommunication
sector
6) Info-communication technology in the Maldives
Policy: Facilitate the use of info-communication technology in all areas of development.
Narrow the digital divide within the county
9.3 Impact of Tsunami
9.3.1 Damage by the December 26, 2004 Tsunami
Several telecommunication facilities were damaged by the tsunami that occurred on 26th
December, 2004. At around 09:25, the Dhiraagu remote network monitoring centre reported that
network nodes at Gaafaru (Kaaf Atoll), Raiymandhoo (Meemu Atoll), Meedhoo (Dhaalu Atoll), and
Gadhdhoo (Gaaf Dhaalu Atoll) had failed. The failure of these nodes resulted in the disruption of
all public telecommunication services to 13 atolls (163 inhabited islands). The stricken atolls in the
north were Haa Alif (HA), Haa Dhaalu (HDh), Shaviyani (Sh), Noonu (N), Raa (R), Baa (B) and
Lhaviyani (Lh), and in the south were Meemu (M), Dhaalu (Dh), Thaa (Th) and Laamu (L). In the
far south, Gaaf Alif (Ga) and Gaaf Dhaalu (GDh) were also affected.
The reasons why the telecommunication network was disrupted are presumed to be as follows:
1) Short circuit of equipment due to the tsunami, and
2) Both the commercial and the telecommunications station power supplies were disrupted.
In addition to the damage to the telecommunications nodes, many of the telephone booths were
also devastated by the tsunami.
Dhiraagu’s technical team reported major damage to the facilities when they visited the damaged

9-11
Gaafaru Equipment Room
Gadhdhoo site boundary destroyed
sites for repair work on 26th December. This damage is highlighted in the following photos:
(1) Gaafaru, Kaafu Atoll
The equipment room/hut was standing, but
the perimeter wall was destroyed. The power
generator and batteries were damaged due
to flooding caused by sea water. The radio
equipment was partly submerged, but has
now been repaired.
(2) Gadhdhoo, Gaaf Dhaalu Atoll
The equipment room/hut was standing, but
the perimeter wall was destroyed. The power
generator and batteries were damaged due to
flooding caused by sea water. The radio
equipment was submerged, but has now
been repaired.
(3) Raiymandhoo (Meemu Atoll)
The site suffered significant damage. The perimeter wall, solar panels and structure were
destroyed. The power and equipment room was directly hit by the tsunami. Equipment racks
were displaced and all power and radio equipment was completely destroyed.
Raiymandhoo building supporting pillars Raiymandhoo mast guy base

9-12
Kohufushi Generator
(4) Kolhufushi (Meemu Atoll)
The equipment room/hut was standing, but the
perimeter wall was destroyed. The power generator
and batteries were damaged due to flooding caused
by sea water. However, water did not reach the radio
equipment.
(5) Muli (Meemu Atoll)
No major problems were reported for the site. However, there was no commercial power.
(6) Meedhoo (Dhaalu Atoll)
The equipment room/hut was standing, but the perimeter wall was destroyed. The power
generator and battery were damaged due to flooding caused by sea water. The microwave
and mobile radio were equipment destroyed.
Raiymandhoo
Kolhufushi Booth
Raiymandhoo equipment shelter Raiymandhoo building

9-13
9.3.2 Restoration Work
Dhiraagu started the restoration work immediately after the tsunami, as is described below. A
Network Crisis Management Team was established, which coordinated its work with the
Telecommunication Authority of Maldives during the restoration process.
a) Within 24 hours, telephone services were restored to 9 of the 13 atolls that had been
disconnected.
b) Within 72 hours, telephone services had been restored to all the atolls.
• A total of 164 inhabited islands are normally connected to telephone services.
Except for 6 islands, which had no communications facilities, the other islands could
use VHF/CB radios to communicate with atoll offices where telephone services were
operational.
c) Mobile services were totally restored 12 days after the disaster.
d) Within 3 weeks, the telecommunications network was totally restored, except for
evacuated islands, to the same as the pre-tsunami situation.
As mentioned above, public telecommunication services have now been restored to the
pre-tsunami disaster service level.
9.4 Alternative Communication and Network Development
9.4.1 Necessity for an Alternative Communications and Network System
Based on previous studies, the necessity for an alternative communications and network system
are specified in the following sections. Communications in the Maldives is dependent on public
telephone services. Because of this, each island is not able to communicate with other places
when the public telephone network is out of service.
On 26th December, 2004 a major earthquake (M9.0), occurred in the Indian Ocean near Sumatra.
The resulting tsunami caused extensive damage in the Maldives. The Maldives
telecommunications infrastructure is based on a terrestrial microwave network backbone. This
network consists of 37 nodes. Due to the tsunami disaster, 5 nodes were damaged and
telecommunication services in 13 atolls (comprising 168 separate islands) were disrupted.
Dhiraggu, which is the sole telecommunications operator in the Maldives, started restoration work
immediately after the tsunami. As a result, telecommunication services were restored as follows:
i) within 24hrs, telephone services were restored to 9 out of 13 affected atolls
ii) within 72hrs, telephone services were restored to all atolls, but with limited operating
conditions
iii) within 3 weeks, telephone services were totally restored

9-14
The GOM does not have an alternative communications network that can be used when the pubic
telephone network is damaged. Moreover, when an aftershock related to the Sumatra earthquake
occurred on March 29, 2005, it was reported that some telephone calls could not be made. This
was due to line congestion caused by the increased traffic resulting from emergency calls.
Based on the above circumstances, it is concluded that an alternative communications network,
which is not affected by disasters, needs to be developed.
In addition to the above, the necessity for developing an alternative system was specified in
project code DRM005 of the National Recovery and Reconstruction Plan (NRRP) prepared by the
Ministry of Planning and National Development (MPND) in March, 2005.
9.4.2 Objective and Required System Functions
The objective of the system is to develop an alternative communications network, including early
an emergency early warning system, to increase the comprehensive natural disaster
management capability of the Maldives. In order to realize the above and maximize the project
benefit, the following components are required:
1) Development of a dedicated communications system, and
2) Development of emergency early warning system (for typhoons, tsunami, etc.).
To minimze operation and maintenance costs and balance the initial investment cost and
performance, the study team proposes 4 functions:
i) Multiplex radio system
ii) Digital HF radio system,
iii) Trunked line radio system
iv) VHF emergency early warning system.
The system concept is shown in Figure 9.3.
The dedicated communications system consists of a digital HF radio system, multiplex radio
system and VHF trunked line system, which are needed for the purpose of data and voice
communication. In addition, a VHF early warning system consisting of master equipment, remote
equipment, loudspeakers and VHF radio system is needed. Table 9.4 shows the general functions
required for each system.

9-15
Table 9. 4 General Required Function of Each System
Name of system Required function
1 Multiplex radio system Allow communication between related organizations in Male’. • Communication information: Voice and data (Fax, message)
2 Digital HF radio system Allow long distance communication between Male’ and atoll offices. • Communication information: Voice and data (Fax, message)
3 Trunked line radio system
Allow: 1) Communication between atoll offices and island offices, and 2) Mobile communication in atolls and island, including communication between administrative offices and vessels, such as local fishing boats (yatra-doni). In cooperation with Digital HF radio, island offices would communication with Male’ thorough atoll offices. • Communication Information: Voice and data (Fax, message)
4 VHF emergency early warning system
In cooperation with Digital HF radio, the VHF emergency early warning system will allow automatic and manual announcement of emergency evacuation warnings. The commands should be generated from Male’ or from either Atoll or Island offices. An interrupt function will allow the loud speaker system to be used for administrative communication to local residents when no emergency is imminent. • Communication Information: data (command) and voice.

9-16
Figure 9. 3 System Concept
Com
mun
ity&
inha
bita
nts
1. D
igita
l HF
com
mun
icat
ion
syst
em2.
Mul
tiple
x ra
dio
syst
em3.
VH
F tru
nked
radi
o sy
stem
incl
udin
g ha
ndy
radi
o4.
VH
F ra
dio
war
ning
syst
em
Rep
ublic
of M
aldi
ves
Alte
rnat
ive
com
mun
icat
ions
and
net
work
sys
tem
for d
isaste
r risk
man
agem
ent
Out
line
of fa
cilit
ies
Wea
ther
info
rmat
ion
syst
em(
GTS
・G
MS)
prov
ision
of i
nfor
mat
ion
Web
site
uplo
ad
Fax
E-M
ail
Publ
icne
twor
k
Indi
an O
cean
T sun
ami W
arni
ngC
ente
r
Ato
ll of
fice
Nat
iona
lD
isas
ter
Man
agem
ent
Cen
ter
Mi n
istry
of a
toll
Bur
eau
ofM
eteo
rolo
gy
Dig
ital H
Fra
dio
(Mas
ter)
Relat
ed o
rgan
s
Inter
net
TV
Radi
o br
oadc
ast
New
s pap
er
Mul
tiple
x R
adio
(Dat
a, V
oice
)
(In
Mal
e)
Dig
ital H
Fra
dio
(Rem
ote)
Radi
oRe
ceiv
er
Isla
nd o
ffice
(Dat
a, V
oice
)
(Voi
ce, D
ata)
PCFA
XPr
inte
r
TV
: Are
a of
pro
ject
Trun
ked
radi
o(H
andy
type
)
Mul
tiple
x R
adio
(Dat
a, V
oice
)
Voi
ce te
rmin
al
VH
F tu
nked
radi
o(M
aste
r)V
HF
radi
o w
arni
ng(M
aste
r)
VH
F tu
nked
radi
o(R
emot
e)V
HF
radi
o w
arni
ng(R
emot
e)(V
oice
)
FAX
Prin
ter
Prin
ter

9-17
9.4.3 Relevant organization and disaster prevention plan
In the Maldives there are currently no protocols for natural disaster prevention, such as
announcing evacuation orders. In contrast, Japan has long had such protocols. The first Japanese
Disaster Measures Basic Plan was prepared in 1963, and it is based on Japan’s Disaster Measure
Basic Law. Since it was first introduced, the Japanese plan has been revised, based on
experiences and lessons from disasters such as the Kobe earthquake, etc. This plan provides
fundamental guidelines for disaster prevention in Japan, and covers earthquakes, floods, tsunami,
volcanic disasters, snow disasters, marine disasters, aviation disasters, rail disasters, road
disasters, nuclear disaster, etc.
In the Japanese Disaster Measures Basic Plan, related organizations are classified into three levels,
as indicated in Figure 9.4 below:
1) National level
2) Regional level, and
3) Municipal level.
The organization of the national level is further classified into the appointed government
organizations and other appointed administrative organizations. Figure 9.5 shows the disaster
prevention organization network in Japan.
The appointed governmental agency consists of the Prime Minister’s Office, Cabinet Office,
Ministry of Public Works, Fire Defense Agency, Meteorological Agency, Coast Guard, etc. In
addition, the other appointed administrative organizations consist of independent administrative
agencies such as research institutes, public corporations having responsibility for roads, post and
telecommunications, and also broadcasting operators, power companies and telecommunications
operators, etc.
As for the regional level organization, there
are regional government and branch office
of national level organizations. Municipal
level organizations include fire stations
which perform rescue operations, hospitals,
schools, police stations and regional disaster
management organizations.
Disaster measure basic law
Disaster measure basicplan
(Prepared by nationalgovernment)
Local disaster preventionplan
(Prepared by regional & localgovernment)
Disaster preventionoperation plan
(Prepared by appointedgovernment organization
and institutions)
Figure 9. 3 Structure of disaster prevention plan

9-18
Figure 9. 4 Disaster Prevention Organization and Network Structure in Japan
9.4.4 Disaster Mitigation Information Flow in Japan
A comprehensive disaster prevention organization is not yet established in the Maldives, as
above-mentioned. In Japan, there are three phases in disaster prevention:
1) Prevention,
2) Disaster emergency measures, and
3) Disaster recovery.
The above process leads to mitigation of damage because the persons concerned take the best
measures in each phase. In addition to the above, disaster prevention needs to be implemented
integrally and systematically with the cooperation of the national government, regional
government, public institutions, and residents.
In Japan, disaster emergency measures are classified into three stages:
1) transmission of warnings in before the disaster,
Broadcasting
Inhabitants
Appointed public institution
Appointed governmentorganization
Office of Prime minister
Cabinet office
Ministry of public works
Fire defense agency
National police agency
Defense agency
Coast guard
Meteorological agency
Other appointedadministrative organizations
Fire station
Police station
Hospital
School
Self-disaster managementorganization
Other related organizations
Municipality
Regional office
Regional government
Regional police headquarter
Coast guard station
Meteorological station
Broadcasting operator
Other related organizations
Main unit of defense
Warning
Legend:: Central disaster prevention radio network: Fire disaster prevention radio network: Regional disaster prevention network: Municipal disaster prevention network: Other network

9-19
2) finding the situation immediately after disaster, and
3) emergency recovery, with the cooperation of all related parties.
The typical flow of information during disaster emergency measures in Japan is shown in Figures.
9.6 to 9.8 bellow:
Inhabitants & community
Ministry of public works
Meteorological agency
Broadcasting operator
Municipality
Regional government
Broadcast weatherinformation
Weather information - condition - warning
Instruction & recommendationof evacuation
Collection of rainfall,water level by theirequipment
Collection of weatherinformation
Provision of information
Provision of information
Figure 9. 4 Transmission of Warning
Municipality
Regional government
Collection of damages
Report of damage
Fire defense agency Other appointedgovernment organizations
Defense agency Coast guard
National police agency
Inhabitants & community
ReportReportReport
Report
ReportReport
InstructionInstruction
Instruction
Cabinet office
Office of Prime minister
Evaluation report
Otherappointed
administrativeorganizations
Figure 9. 4 Finding the Condition Immediately after a Disaster

9-20
9.4.5 Recommendation for a Disaster Prevention Plan in the Maldives
It is recommended that the Maldives set up a Disaster Prevention Plan. The Maldives plan could
be based on the Japanese plan, as this has been found to be very appropriate in Japan.
The target organization and information flow for a Disaster Prevention Plan in the Maldives needs
to be established. As a first step, in order to functionalize alternative communications and
network systems, it is desirable for the following organizations to participate in a system. This
suggestion is based on the experiences in Japan, and on the current situation of the Maldives:
1) Department of Meteorology (DOM)
2) National Disaster Management Center (NDMC)
3) Ministry of Atolls Development (MOAD)
4) Island Offices including Police Stations
5) Telecommunication Authority of Maldives (TAM)
Procedures for issuing warning announcements, and other major functions of the organizations
mentioned above, could be considered as follows:
Figure 9. 4 Emergency Recovery
Municipality
Regional government
Action
Report of action
Fire defense agency Other appointedgovernment organizations
Defense agency Coast guard
National police agency
Cabinet office
Inhabitants & community
Report
ReportReport
Office of Prime minister
Evaluation report
InstructionInstruction
Instruction
CoordinationCoordination
ActionAction
Action
Otherappointed
administrativeorganizations
Report
Action
Appointed administrativeorganizations

9-21
Table 9. 5 Major Function of Related Organizations Organization Major function
1) DOM • Collection and distribution of tsunami and weather information.
2) NDMC • Forecasting the potential disaster range. • Coordination with related national government organizations.• Formulating plans for disaster and emergency
countermeasures and recovery work. 3) MOAD • Issuing instructions and recommendations for evacuation.
• Coordination with related regional government organizations.• Preparation of condition and progress reporting of disaster
emergency countermeasures and recovery work. 4) Atoll Offices • Transmission of instructions and recommendations for
evacuation to the Island offices. • Collection of information of emergency countermeasure and
recovery operations in their administrative area. • Execution of emergency countermeasure and recovery work.
5) Island offices including Police station
• Transmission of instructions and recommendation for evacuation to residents.
• Collection of information on emergency countermeasures and recovery conditions in their administrative area.
• Execution of emergency countermeasure and recovery works.
6) Telecommunication Authority of Maldives
• Maintain alternative communications and network systems and ensure that they kept in good condition.
• Priority operation of the public communication equipment in case of an emergency.
The DOM will deal with the collection of tsunami and weather information from the Indian
Ocean Tsunami Warning Center and reception of weather information. The Department will
also distribute this information within the Maldives. In addition to this, the DOM will provide
the mass media (mainly radio and television stations) with primary information, such as a
current weather bulletins.
Based on tsunami information and a weather bulletins, the NDMC will evaluate the situation
and determine the possibility of a disaster occurring. The NDMC will inform the MOAD of the
result of their evaluation.
The MOAD will issue recommendations for evacuation via the Atoll Offices to the Island Offices
which have the possibility of being affected by a disaster.
The Atoll Offices will inform the potentially affected Island Offices, and the Island Office will
announce warnings to residents.
Potential information flows during the disaster emergency countermeasure phase are
presented in Figures. 3-9 to 3-11 bellow:

9-22
Figure 9. 4 Potential Flow of Information for Emergency Warnings
Inhabitants & community
National disaster center
Department of metrology
Broadcasting operatorMinistry of Atoll
Broadcast weatherinformation &evacuation information
Weather information - condition - warning
Collection of weatherinformation
Provision of information
Evaluated information
Tsunami warning fromIndian Ocean Tsunamiwarning center
Atoll office
Instruction & recommendationof evacuation
President’s Office
Distribution of warning
Warning announcement
Island office Policestaion
Figure 9. 4 Potential Flow of Information for Assessments Immediately after a Disaster
Inhabitants & community
National disaster center
Ministry of Atoll
Atoll office
President’s Office
Evaluation report
Ministry of defense andnational security service Other related organization
DhiragguSTELCO
etc.
Report
Report of damage
Collection of damage condition
Report Instruction Instruction
Report
InstructionReport Report
ReportReport
IDCIsland office Policestaion

9-23
9.4.6 Preliminary Radio Circuit Desk Top Design
In order to specify system performance requirements, a preliminary radio circuit desk top design
was carried out in this study. In this design, the following maters were considered:
1) Daily and annual variations in the stability of Digital HF radio communications.
2) Communication conditions for both a VHF early warning system and a VHF trunked line
system:
Permissible transmission loss, and
Available transmission distance and antenna height in relation to the quality of
communications (S/N: Signal to Noise ratio).
It is noted that this radio circuit is a desk top design that was prepared to clarify the system
outline. Therefore, the designed system needs to undergo radio wave propagation testing in the
detailed design stage.
(1) General Condition and Summary of Results
Table 3.3 below shows the general condition and result of the circuit design analysis.
Figure 9. 4 Potential Flow of Emergency Recovery
Inhabitants & community
National disaster center
Ministry of Atoll
Atoll office
President’s Office
Evaluation report
Ministry of defense andnational security service Other related organization
Report of action
Action
Report Instruction Instruction
Report
InstructionReport Report
Action
Coordination
Action
Action
CoordinationAction
DhiragguSTELCO
etc.
IDCReport
Island office Policestaion

9-24
Table 9. 6 General Condition and Summary of the Result
NOTES: N.A.: Not Applicable
Radio Transmission Span Distance Frequency Band
Output Power
Antenna Height Antenna Type & Gain
Permissible Transmission
Loss
Circuit Margin Judgment
(1) Digital HF Radio System • Male’-Fonadhoo 290km 3MHz –
30MHz 125kW N.A. Dipole : 3 – 5dBi Dipole : 0dBi
Refer to bellow N.A. OK, but 3 bands
are preferred
• Male’-Hithadhoo 500km 3MHz – 30MHz 125kW N.A.
Dipole : 3 – 5dBi Dipole : 0dBi
Refer to bellow N.A.
OK, but 3 band are preferred
(2) VHF Early Warning System
• Fonadhoo-Ishidhoo 32.7km 60MHz band 10W 40m Sleeve : 2.2dBi
3-ele Yagi : 8.2dBi 128.7dB 6.1dB OK
• Fonadhoo-Maabaidhoo 22.0km 60MHz
band 10W 40m Sleeve : 2.2dBi 3-ele Yagi : 8.2dBi 128.7dB 14.0dB OK
• Fonadhoo-Gan 10.3km 60MHz band 10W 40m Sleeve : 2.2dBi
3-ele Yagi : 8.2dBi 128.7dB 28.4dB OK
• Fonadhoo-Maavah 29.3km 60MHz band 10W 40m Sleeve : 2.2dBi
3-ele Yagi : 8.2dBi 128.7dB 8.3dB OK
(3) VHF Trunked Line System
• Fonadhoo-Ishidhoo 32.7km 150MHz
band 10W 40m 3-stage collinear :6dBi3-stage collinear :6dBi 132.5dB 3.2dB OK
• Fonadhoo-Maabaidhoo 22.0km 150MHz band 10W 40m 3-stage collinear :6dBi
3-stage collinear :6dBi 132.5dB 13.3dB OK
• Fonadhoo-Gan 10.3km 150MHz
band 10W 40m 3-stage collinear :6dBi3-stage collinear :6dBi 132.5dB 30.0dB OK
• Fonadhoo-Maavah 29.3km 150MHz band 10W 40m 3-stage collinear :6dBi
3-stage collinear :6dBi 132.5dB 6.2dB OK
9-24

9-25
(1) Daily and Annual Communication Stability of Digital HF Radios
In addition to the above, study was performed by following conditions.
Sun spot number (SSN): 10, 60, 100
Calculated month: Jan, Apr, Jul, Oct.
It is common to make a judgment value of 45dB or more for voice communication and 55dB
or more for data communication in the preliminary design stage. As a result of the
calculations, it was determined that in order to secure a stable radio circuit throughout the
day and year, it is desirable to secure three (3) HF radio channels respectively for each
frequency band (3MHz, 7 MHz, and 10 MHz). The worst case for each SSN class is shown
below and other results are attached in the Appendix.
(1) Male’-Fonadhoo (SSN:10)
1) Male-Fonadhoo (SNN:60)
Figure 9. 4 HF Radio Propagation Model (Jan, SSN:10)

9-26
(2) Male’-Fonadhoo (SSN:60)
(3) Male’-Fonadhoo (SSN:100)
Figure 9. 4 HF Radio Propagation Model (Jan, SNN:60)
Figure 9. 4 HF radio Propagation Model (Jan, SNN:100)

9-27
(4) Male’- Hithadhoo (SSN:10)
(5) Male’- Hithadhoo (SSN:60)
Figure 9. 4 HF Radio Propagation Model (Jan, SNN:10)
Figure 9. 4 HF Radio Propagation Model (Jul, SNN:60)

9-28
(6) Male’- Hithadhoo (SSN:100)
(2) VHF Early Warning System and VHF Trunked Line System
In accordance with standards applying to regional simultaneous communication systems in Japan,
the technical standard for telemetering and warning systems used by the Ministry of Land
Infrastructure and Communication Japan and technical standards of the Ministry of Internal
Affairs and Communications Japan, the permissible transmission loss, available transmission
distance and antenna height were studied.
Permissible transmission loss is calculated from conditions of the transmitter and receiver, receiver
characteristics, earth conditions, interference fading and reflection loss by ocean, etc. On the
other hands, available transmission distance and antenna height are calculated as follows:
Figure 9. 4 HF Radio Propagation Model (Jan, SNN:100)
Available transmiss iondistance and antenna height = Circuit margin >= 0
P e r m i s s i b l etransmission loss - Free space loss - Plane ground loss - Fading lossCircuit margin =

9-29
(1) Permissible Transmission Loss and Transmission Characteristics for VHF Early Warning System
i) Condition of Transmitter and Receiver Antenna Antenna feeder loss Other loss
Item Calculated value Frequency Output power Type Gain
Antenna height Type Length Attenuation Name Loss
Condition of Transmitter 39.8dBm 60.0MHz 10.0W 40.0dBm Sleeve 2.2dBi 40.0m 10D
(0.038dB/m) 50.0m 1.9dB Arrester 0.5dB
Condition of Receiver 5.8dB 3ele-Yagi 8.2dBi 40.0m 10D (0.038dB/m) 50.0m 1.9dB Arrester 0.5dB
ii) Receiver Characteristics
Item Calculated value Bandwidth Noise
figureExternal
noise Frequency deviation
Transmitter characteristics
Receiver characteristics
Receiving power
Receiving noise power
Radio frequency
S/N
S/N improvement
coefficient Internal noise -125.2dBm 12.0kHz 8.0dB
Receiver noise -120.1dBµV -121.7dBm
S/N improvement coefficient 9.1dB 12.0kHz 3.5kHz
Receiving power 45.6dBm 39.8dBm 5.8dB Radio frequency S/N 165.7dBm 45.5dBm -120.1dBm Standard S/N 174.8dBm 165.6dB 9.1dB
iii) Permissible Transmission Loss
Permissible transmission loss Standard S/N Criteria S/N Earth condition Interference
fading Reflection loss by
ocean 128.8dB 174.8dB 30.0dB 10.0dB 3.0dB 3.0dB
iv) Transmission Characteristics Distance km 5.0 7.5 10.0 12.5 15.0 17.5 20.0 22.5 25.0 27.5 30.0 32.5 35.0 37.5 40.0 42.5 45.0 47.5 50.0 Free space loss dB 81.9 85.5 88.0 89.9 91.5 92.8 94.0 95.0 95.9 96.7 97.5 98.2 98.8 99.4 100.0 100.5 101.0 101.5 101.9
Plane ground loss dB 1.9 5.4 7.9 9.9 11.4 12.8 13.9 15.0 15.9 16.7 17.5 18.2 18.8 19.4 20.0 20.5 21.0 21.4 21.9
Fading loss dB 3.5 3.8 4.0 4.3 4.5 4.8 5.0 5.3 5.5 5.8 6.0 6.3 6.5 6.8 7.0 7.3 7.5 7.8 8.0 Total loss dB 87.3 94.6 99.9 104.0 107.4 110.3 112.9 115.2 117.3 119.2 121.0 122.6 124.1 125.6 127.0 128.3 129.5 130.7 131.8 Circuit margin dB 41.5 34.2 28.9 24.8 21.4 18.4 15.9 13.6 11.5 9.6 7.8 6.2 4.7 3.2 1.8 0.5 -0.7 -1.9 -3.0
9-29

9-30
(2) Permissible transmission loss and transmission characteristics for VHF Trunked Line System
i) Condition of Transmitter and Receiver
Antenna Antenna feeder loss Other loss Item Calculated
value Frequency Output power Type Gain
Antenna height Type Length Attenuation Name Loss
Remarks
Condition of Transmitter
155.3dBµV 150.0MHz 10.0W 153.0dBµV 3stage-collinear 6.0dBi 40.0m 10D (0.064dB/m) 50.0m 3.2dB Arrester 0.5dB Diversity gain
Condition of Receiver 5.3dB 3stage-collinear 6.0dBi 40.0m 10D
(0.064dB/m) 50.0m 3.2dB Arrester 0.5dB 3.0dB
ii) Receiver Characteristics
Item Calculated value
Standard C/N
Maintenance margin C/I margin Bandwidth Noise figure External
noise Code gain
Required C/N 21.1dB 12.1dB 6.0dB 3.0dB
Thermal noise -122.0dBm 25.0kHz 8.0dB
Total Noise -4.0dBµV -119.0dBm
Required receiver input voltage 12.1dBµV 5.0dB
iii) Permissible Transmission Loss
Permissible transmission loss Condition of transmitter
Condition of receiver
Required receiver
input voltage
Earth condition
Interference fading
Reflection loss by ocean
132.5dB 155.3dB 5.3dB 12.1dB 10.0dB 3.0dB 3.0dB
iv) Transmission Characteristics Distance km 5.0 7.5 10.0 12.5 15.0 17.5 20.0 22.5 25.0 27.5 30.0 32.5 35.0 37.5 40.0 42.5 45.0 47.5 Free space loss dB 89.9 93.4 95.9 97.9 99.4 100.8 101.9 103.0 103.9 104.7 105.5 106.2 106.8 107.4 108.0 108.5 109.0 109.5 Plane ground loss dB 0.0 0.0 0.0 1.9 3.5 4.8 6.0 7.0 7.9 8.7 9.5 10.2 10.8 11.4 12.0 12.5 13.0 13.5
Fading loss dB 4.5 5.3 6.0 6.8 7.5 8.3 9.0 9.8 10.5 11.3 12.0 12.8 13.5 14.3 15.0 15.8 16.5 17.3 Total loss dB 94.4 98.7 101.9 106.5 110.4 113.8 116.9 119.7 122.3 124.7 127.0 129.1 131.1 133.1 135.0 136.8 138.5 140.2 Circuit margin dB 38.1 33.8 30.6 26.0 22.1 18.7 15.6 12.8 10.2 7.8 5.5 3.4 1.4 -0.6 -2.5 -4.3 -6.0 -7.7
9-30

9-31
9-31
(3) Available Transmission Distance and Antenna Height in Relation to the Quality of Communication (S/N: Signal to Nose ratio)
i) VHF Early Warning System
Item Circuit Margin
Antenna height 10m 19.7 12.4 7.1 3.0 -0.4 -3.4 -5.9 -8.2 -10.3 -12.2 -14.0 -15.6 -17.1 -18.6 -20.0 -21.3 -22.5 -23.7
Antenna height 20m 30.9 23.6 18.4 14.3 10.9 7.9 5.4 3.1 1.0 -0.9 -2.7 -4.3 -5.9 -7.3 -8.7 -10.0 -11.2 -12.4
Antenna height 30m 37.2 29.9 24.7 20.6 17.1 14.2 11.6 9.3 7.3 5.4 3.6 2.0 0.4 -1.0 -2.4 -3.7 -4.9 -6.1
Antenna height 40m 41.5 34.2 28.9 24.8 21.4 18.4 15.9 13.6 11.5 9.6 7.8 6.2 4.7 3.2 1.8 0.5 -0.7 -1.9 Antenna height 50m 44.6 37.3 32.0 27.9 24.5 21.6 19.0 16.7 14.6 12.7 11.0 9.3 7.8 6.3 5.0 3.6 2.4 1.2 Distance km 5.0 7.5 10.0 12.5 15.0 17.5 20.0 22.5 25.0 27.5 30.0 32.5 35.0 37.5 40.0 42.5 45.0 47.5
Permissible transmission distance by antenna height (60MHz)
0.05.0
10.015.0
20.0
25.030.0
35.040.0
45.050.0
5.0 7.5 10.0 12.5 15.0 17.5 20.0 22.5 25.0 27.5 30.0 32.5 35.0 37.5 40.0 42.5 45.0 47.5 50.0
km
dB
Antenna heigth 10m
Antenna heigth 20m
Antenna heigth 30m
Antenna heigth 40m
Antenna heigth 50m

9-32
ii) VHF Trunked Line System
Item Circuit Margin
Antenna height 10m 23.9 16.1 10.4 5.8 1.8 -1.6 -4.7 -7.5 -10.0 -12.4 -14.7 -16.8 -18.9 -20.8 -22.7 -24.5 -26.2 -27.9
Antenna height 20m 34.7 26.9 21.1 16.5 12.6 9.2 6.1 3.3 0.7 -1.7 -3.9 -6.1 -8.1 -10.1 -11.9 -13.7 -15.5 -17.2
Antenna height 30m 39.4 32.7 26.9 22.3 18.4 14.9 11.9 9.1 6.5 4.1 1.8 -0.3 -2.4 -4.3 -6.2 -8.0 -9.7 -11.4
Antenna height 40m 38.1 33.8 30.6 26.0 22.1 18.7 15.6 12.8 10.2 7.8 5.5 3.4 1.4 -0.6 -2.5 -4.3 -6.0 -7.7
Antenna height 50m 36.8 32.5 29.3 26.6 24.3 21.2 18.2 15.4 12.8 10.4 8.1 6.0 4.0 2.0 0.1 -1.7 -3.4 -5.1
Distance km 5.0 7.5 10.0 12.5 15.0 17.5 20.0 22.5 25.0 27.5 30.0 32.5 35.0 37.5 40.0 42.5 45.0 47.5
Permissible transmission distance by antenna height (150MHz)
0.0
5.0
10.0
15.0
20.0
25.0
30.0
35.0
40.0
45.0
5.0 7.5 10.0 12.5 15.0 17.5 20.0 22.5 25.0 27.5 30.0 32.5 35.0 37.5 40.0 42.5 45.0 47.5 50.0
km
dB
Antenna heigth 10m
Antenna heigth 20m
Antenna heigth 30m
Antenna heigth 40m
Antenna heigth 50m
9-32

9-33
9.4.7 System Configurations and Functions
(1) System configurations
After completing the desk top design, an overall conceptual system configuration was drawn
up. Figure 9.18 below illustrates this system outlook whereas the major components of each
system are shown in Table 9.7 below.
Table 9. 7 Major item of each system Item Male Atoll office Island office1. Digital HF radio system
1) 125W transmitter and receiver o o 2) Antenna system o o 3) Software for data communication o o 4) Printer & FAX o o 5) Personal computer o o 6) Isolation transformer o o 7) AC power supply and UPS o o
2. VHF trunked line system 1) Base radio station system o
• 10W radio system with antenna o
• Node, network and dispatcher control
system o
2) Fixed radio station system o • 10W radio system with antenna o • Printer & FAX o • Message terminal o
3) Portable radio terminal o o 4) AC power supply and UPS o o
3. VHF early warning system 1) Master station system o
• 10W transmitter and receiver o • Control equipment o • Antenna & Arrester o • AC power supply and UPS o
2) Speaker warning station system • 10W transmitter and receiver o • Remote controller o • Antenna system o • Loud speaker (30W) o • AC power supply and UPS o 4. Multiplex radio system
1) 8.2GHz digital multiplex radio system o 2) Antenna system o 3) Isolation transformer o 4) AC power supply and UPS o
4. Antenna tower 1) Antenna tower for Multiplex radio o 2) Antenna tower for VHF system o o 3) Antenna tower for Digital HF System o o

9-34
Figure 9. 5 Conceptual System Diagram
Atol
l Offi
ce
VH
F tru
nked
radi
o(1
50M
Hz b
and)
VH
F ra
dio
war
ning
(60M
Hz b
and)
Dig
ital H
F Ra
dio
Anten
na
Mas
ter E
quip
men
t for
the
radi
o wa
rnin
g sy
stem
Trun
ked
Radi
o(H
andy
type
)
Digi
tal H
FRa
dio
Cont
rolle
r
Switc
hing
Hub
Ant
enna
Ant
enna
Prin
ter
Mes
sage
Con
trolle
rPr
inte
rFAX
UPS
UPS
Engi
neG
ener
ator
Bure
au o
f Met
eoro
logy
Switc
hing
Hub
Min
istr
y of
Ato
ll
Dig
ital H
F Ra
dio
Anten
na Mul
tiple
x Ra
dio
Equi
pmen
t
Ant
enna
VoI
P Ph
one
Dig
ital H
FR
adio
Con
trolle
r
Prin
ter
UPS
Mul
tiple
x Ra
dio
Equi
pmen
tA
nten
na
VoI
P Ph
one
UPS
Mul
tiple
x Ra
dio
Equi
pmen
tA
nten
na
VoI
P Ph
one
UPS
Nat
iona
l Dis
aste
r Man
agem
ent C
ente
r
8.2G
Hz b
and
(Mul
tiple
x ra
dio)
Isla
nd O
ffice
Trun
ked
Radi
oEq
uipe
mnt
Loud
Spe
aker
War
ning
Pos
t
Rem
ote
Cont
rolle
r
Mes
sage
Cont
rolle
rPr
interFA
X
UPS
Engi
neG
ener
ator
Trun
ked
Radi
oTe
rmin
al
8.2G
Hz b
and
(Mul
tiple
x ra
dio)
Dig
ital H
F Ra
dio
(3-3
0GH
z)
VHF
trun
ked
radi
o(1
50M
Hz
band
)

9-35
(2) System functions
(1) Basic functions
i) Voice communications
Voice communication between the MOAD office and the atoll offices using the
digital HF radio system. In addition, voice communication via analogue HF radio
devices using single side band (SSB) modulation.
The trunked line system is used for voice communication between an atoll office
and its island offices. The trunked line system at island offices can also
communicate with the existing VHF radio devices.
All-out (atoll-wide), individual, group and prioritized communication modes from
an atoll office to its island offices.
Communication between portable radio terminals and an atoll office or island
offices.
Voice communication (VoIP) between the MOAD and the DOM or the NDMC via the
multiplex radio system.
ii) Message transfer
Message exchange between the MOAD and the atoll offices using digital HF radio
system terminals.
Message exchange between the MOAD and the DOM, and between the MOAD and
the NDMC using multiplex radio system terminals.
The MOAD can send emergency messages by selecting preset warnings or other
messages stored in the system terminal. The selected message will be transferred
to the atoll office, where it will automatically boot up the VHF early warning system
and thereby broadcast the message through the loud speakers installed in
individual Island offices. Concurrently, the transferred message can be displayed
on and printed out from the message terminals of the trunked line system installed
in each island office.
Messages can be exchanged between an atoll office and its Island offices through
the message terminals of the trunked line system.
Facsimile transmission between the MOAD and the atoll offices or island offices
using a facsimile machine which can be connected to the digital HF radio system.
Facsimile transmission between an atoll office and its island offices by adding a
facsimile machine to the trunked line radio system.
iii) Voice Announcements
Voice announcements from the microphone at an atoll office to the loud speakers
installed in its island offices via the Early Warning System. In addition to sending
warnings, other messages, chimes, music, etc. can also be broadcast.
An atoll office can select from atoll-wide all-out, emergency all-out, individual and
group broadcasting modes.
Emergency messages, including tsunami warnings, will be broadcast automatically
in the emergency all-out mode.

9-36
The island offices can announce voice message by using a remote controller with a
microphone.
iv) MOAD
The MOAD can select and send emergency messages, including tsunami warnings.
In addition, the MOAD can activate loud speakers in island offices to announce
evacuation messages (in the all-out, group or individual mode).
Message exchange with the atoll offices.
Voice communication with the atoll offices.
Facsimile transmission with the atoll offices and the island offices.
Voice communication (VoIP) and facsimile transmission with the DOM and the
NDMC.
v) DOM
Voice communication (VoIP) and facsimile transmission with the MOAD and the
NDMC.
vi) NDMC
Voice communication (VoIP) and facsimile transmission with the MOAD and the
DOM.
vii) Atoll offices
Voice communication and facsimile transmission with the MOAD and the other atoll
offices.
Voice communication with various other general analogue HF radio stations.
Voice communication with the island offices (in the all-out, group or individual
mode).
Voice communication with existing VHF radio devices.
Voice communication with portable radio terminals.
Message exchange with the Island offices.
Facsimile transmission between the island offices.
Voice announcement from the microphone to loud speakers installed in the island
offices. In addition to broadcasting preset warnings, other messages, chimes and
music, etc. will also be able to be broadcast.
Automated voice announcement of emergency messages, including tsunami
warnings, through the loud speaker system installed at the island offices.
viii) Island Offices
Voice communication with the atoll office and the other island offices.
Message exchange with the MOAD, the atoll office and the other island offices.
Facsimile transmission between the MOAD, the atoll office and the other island
offices.
Voice communication with potable radio terminals.
Voice announcement through loud speakers using a remote controller.
Voice communication with existing VHF radio devices.

9-37
9-37
2700
0
3600
48000
( )PlanN/S
Ministry of Atoll
7000
5500
Equi pment Room
( )Floor Layout
N/S
15
14
13
1
3
4
5
10
11
12
9
86
72
( )Elevation
N/S
18500
60°
Self SupportTower 20mH square
8.5GParabolic Anten na
Lightning rod
1480
0
▽G.L
60°
Broa db an dDipole An tenna
Lig htn ing ro d LE GEND
8. 5G multiplex Radio System
Po wer Su pply Sy ste m
Pe rson al C ompu ter with display unit
C oa xial Arr es ter
Sc an er
Printer
Vo IP Ph on e
8. 5G Mu ltiplex R adio Equip ment
Mulipl ex Ter min al Eq uip ment
Deh ydrator
AC/DC Con verte r
UPS with AVR
Isola tion Tr an sfo rmer
Fax
1
2
3
4
5
6
7
8
9
10
11
12
13
14
15 Power Dis trib ution B oard
Digital HF Radio System
125W HF Transceiver
Shield Cabinet
Figure 9. 5 Example of Typical Facility Layout (Male’)
Note: It can change into a small antennaaccording to the condit ions ofland.

9-38
9-38
19900
Atoll Office
HF Dipole An tenn a
Plan( N/S )
4700
5500
70 00
Eq uip me nt Ro om
( )Floor Layout
N/S
15
9
3
2
17
1
4
5
6
1416
7 813
12
11
10
18
19
3400
0 4000
0
1850
0
▽G.L
60°
HF Dip ole An ten na
Pa nzer Ma st 2 0mH
Self Supp ortTowe r 4 5mH Triangle
15 0 MHz 3 St ageC ollin ear Anten na
60 MHzSl eeve An ten na
15 0 MHz 3 Stag eC ollinea r Anten na
Lightning ro d
Elevation( )N/S
LE GEND
125 W HF Tra nsceiv er for Dat a
Sig nal Co nv erte r
Coa xial Ar res ter
Sc ane r
Printer
UPS with AVR
Isola tion Tr an sfo rm er
PC 1 Network Man ag em ent Server
TBS Tetra Ba se Sys te m
TNS Te tr a No de System
Coa xial Ar res ter x 2se t
PC2 Networ k Man ag eme nt Cli en t
PC3 Disp atch er
60 MHz Ana log Ra dio
Remo te controllerC oaxia l Arr este r
Perso nal Comp uter with disp la y un it
Scan er
1
2
3
4
5
6
7
8
9
10
11
12
13
14
15
16
17
18
19
Digital HF Radio System
60MHz Early Warning System
150MHz Turunked line system Power Supply System
Po wer Dist rib ution B oard
Figure 9. 6 Example of Typical Facility Layout (Atoll Office)

9-39
9-39
4300
0
3500
0
4600
3100
0
▽G.L
60°
Island Office
Loud Sp eak er
15 0 MHz Sle eve An tenn a
60 MHz Ya gi Anten na
15 0 MHz 3 St ageC ollin ear An ten na
Self Su pportTowe r 4 5mH Triangl e
15 0 MHz Yagi Ante nn a
Lig htning ro d
To Handy & Atoll Office
To Atoll Office
To Atoll Office
To Existing Analog Radio
( )Elevation
N/S
5500
70 00
7
13
12Eq uipm ent Ro om
1
11
4 6
2
5 8 9310
( )Floor Layout
N/S
LE GEND
2
3
4
7
C oaxial Arr este r
15 0MHz An alo g R adio
5
6
11
10
Po wer Distrib ution B oard
UPS with AVR
Isola tion Tr an sfo rm er
60 MHz An alog Ra dio with Co ntroller
Sp eak er Con tr ollerC oaxial Arr este r
Digital Tr unk ed R ad io
Sca ne r
Printer
Tr an sfer Switch
Pe rson al C ompu ter with display unit
8
9
12
13
1
150MHz Turunked line system
60MHz Early Warning System
Power Supply System
Figure 9. 6 E Example of Typical Facility Layout (Island Office)

9-40
9.5 Preliminary Cost Estimation
9.5.1 Alternatives
The Maldives is located in the northern Indian Ocean. The nation is made up of a long, narrow
chain of atolls comprising more than 1190 islands and extends approximately 800 km from the
northernmost tip to the southernmost tip. The exclusive economic zone of the Maldives covers
about 859,000 km2.
The project cost changes with the system development scale. From the viewpoint of geographical
conditions of the Maldives, cost estimates have been made according to the three alternative
development plans as described below.
(1) Alternative-1 (Digital HF for Priority Atolls and VHF Systems for Priority Islands)
Item Male’ Atoll Offices Island Offices
Digital HF radio system 1 MOAD
1 Fonadhoo NA
VHF trunked line system NA 1 Fonadhoo
5 Ishidhoo, Maabaidhoo, Gan, Fonadhoo, Maavah
VHF early warning system NA 1 Fonadhoo
5 Ishidhoo, Maabaidhoo, Gan, Fonadhoo, Maavah
Multiplex radio system 3 MOA, NDMC, DOM NA NA
(2) Alternative-2 (Digital HF for All Atolls and VHF Systems for Priority Islands)
Item Male’ Atoll Offices Island Offices
Digital HF radio system 1 MOAD
20 All Atoll offices NA
VHF trunked line system NA 1 Fonadhoo
5 Ishidhoo, Maabaidhoo, Gan, Fonadhoo, Maavah
VHF early warning system NA 1 Fonadhoo
5 Ishidhoo, Maabaidhoo, Gan, Fonadhoo, Maavah
Multiplex radio system 3 MOA, NDMC, DOM NA NA

9-41
(3) Alternative-3 (Digital HF for All atolls and VHF Systems for All Inhabited Islands)
Item Male’ Atoll Offices Island Offices
Digital HF radio system 1 MOAD
20 All Atoll offices NA
VHF trunked line system NA 20 All Atoll offices
200 All inhabited islands
VHF early warning system NA 20
All Atoll offices 200
All inhabited islands Multiplex radio system 3
MOA, NDMC, DOM NA NA
9.5.2 Cost Estimation
(1) Conditions of cost estimation
The following conditions have been taken in to account for the cost estimation:
Installation costs are included in each equipment cost.
Installation costs are estimated at 10% of the equipment cost.
Miscellaneous costs are estimated at 3% of the equipment cost.
Taxes, such as VAT, are not included in this cost estimation.
(2) Project cost
The cost for executing and completing the Project is estimated to be 616 million Yen for
Alternative-1, 342 million Yen for Alternative-2, and 7,323 million Yen for Alternative-3,
respectively. A summary of the cost estimation is presented in Table 9.8 below, and the cost
breakdown is given on the next page.
Table 9. 8 Summary of the Estimated Project Costs
Item Alternative-1 (Yen) Alternative-2 (Yen) Alternative-3 (Yen)
1. Digital HF Radio System 27,275,000 265,148,000 265,148,000
2. VHF Trunked Line System 149,390,000 149,390,000 3,175,055,000
3. VHF Early Warning System 14,245,000 14,245,000 416,738,000
4. Multiplex System 16,470,000 16,470,000 16,470,000
5. Antenna Towers 108,845,000 124,900,000 2,906,900,000
6. Project Management 25,298,000 45,612,000 542,425,000
Total 341,523,000 615,765,000 7,322,736,000

9-42
1. Alternative-1 2. Alternative-2 3. Alternative-3ITEM Q'ty Price (JPY) ITEM Q'ty Price (JPY) ITEM Q'ty Price (JPY)
1. DIGITAL HF RADIO SYSTEM 1. DIGITAL HF RADIO SYSTEM 1. DIGITAL HF RADIO SYSTEM 1) Base Station (Male) 1) Base Station (Male) 1) Base Station (Male)
1-1 125W HF Transmitter & Receiver 1 3,800,000 1-1 125W HF Transmitter & Receiver 1 3,800,000 1-1 125W HF Transmitter & Receiver 1 3,800,0001-2 Antenna system 1 4,480,000 1-2 Antenna system 1 4,480,000 1-2 Antenna system 1 4,480,0001-3 Communication controller with Software 1 4,300,000 1-3 Communication controller with Software 1 4,300,000 1-3 Communication controller with Software 1 4,300,0001-4 External devices 1 145,000 1-4 External devices 1 145,000 1-4 External devices 1 145,0001-5 UPS 1 1,000,000 1-5 UPS 1 1,000,000 1-5 UPS 1 1,000,0001-6 Isolation transformer 1 600,000 1-6 Isolation transformer 1 600,000 1-6 Isolation transformer 1 600,0001-7 Miscellaneous 430,000 1-7 Miscellaneous 430,000 1-7 Miscellaneous 430,000
Sub-Total 1-1) 14,755,000 Sub-Total 1-1) 14,755,000 Sub-Total 1-1) 14,755,000 2) Remote Station (Atoll Office) 2) Remote Station (Atoll Office) 2) Remote Station (Atoll Office)
2-1 125W HF Transmitter & Receiver 1 3,800,000 2-1 125W HF Transmitter & Receiver 20 76,000,000 2-1 125W HF Transmitter & Receiver 20 76,000,0002-2 Antenna system 1 2,310,000 2-2 Antenna system 20 46,200,000 2-2 Antenna system 20 46,200,0002-3 Communication controller with Software 1 4,300,000 2-3 Communication controller with Software 20 86,000,000 2-3 Communication controller with Software 20 86,000,0002-4 External devices 1 145,000 2-4 External devices 20 2,900,000 2-4 External devices 20 2,900,0002-5 AC power supply and UPS 1 1,000,000 2-5 AC power supply and UPS 20 20,000,000 2-5 AC power supply and UPS 20 20,000,0002-6 Isolation transformer 1 600,000 2-6 Isolation transformer 20 12,000,000 2-6 Isolation transformer 20 12,000,0002-7 Miscellaneous 365,000 2-7 Miscellaneous 7,293,000 2-7 Miscellaneous 7,293,000
Sub-Total 1-2) 12,520,000 Sub-Total 1-2) 250,393,000 Sub-Total 1-2) 250,393,000
2. VHF TRUNKED LINE SYSTEM 2. VHF TRUNKED LINE SYSTEM 2. VHF TRUNKED LINE SYSTEM 1) Base Station (Atoll Office) 1) Base Station (Atoll Office) 1) Base Station (Atoll Office)
1-1 10W Master Radio System 1 42,200,000 1-1 10W Master Radio System 1 42,200,000 1-1 10W Master Radio System 20 844,000,0001-2 Node System 1 67,000,000 1-2 Node System 1 67,000,000 1-2 Node System 20 1,340,000,0001-3 Network /Subscriber Management System 1 14,200,000 1-3 Network /Subscriber Management System 1 14,200,000 1-3 Network /Subscriber Management System 20 284,000,0001-4 Antenna system 1 3,250,000 1-4 Antenna system 1 3,250,000 1-4 Antenna system 20 65,000,0001-5 Line Dispatcher 1 9,214,000 1-5 Line Dispatcher 1 9,214,000 1-5 Line Dispatcher 20 184,280,0001-6 AC power supply and UPS 1 85,000 1-6 AC power supply and UPS 1 85,000 1-6 AC power supply and UPS 20 1,700,0001-7 Miscellaneous 4,078,000 1-7 Miscellaneous 4,078,000 1-7 Miscellaneous 81,569,000
Sub-Total 2-1) 140,027,000 Sub-Total 2-1) 140,027,000 Sub-Total 2-1) 2,800,549,000 2) Fixed Station (Island Office) 2) Fixed Station (Island Office) 2) Fixed Station (Island Office)
2-1 10W Subscriber Radio 5 1,000,000 2-1 10W Subscriber Radio 5 1,000,000 2-1 10W Subscriber Radio 200 40,000,0002-2 External devices 5 5,630,000 2-2 External devices 5 5,630,000 2-2 External devices 200 225,200,0002-3 Antenna system 5 225,000 2-3 Antenna system 5 225,000 2-3 Antenna system 200 9,000,0002-4 AC power supply and UPS 5 900,000 2-4 AC power supply and UPS 5 900,000 2-4 AC power supply and UPS 200 36,000,0002-5 Miscellaneous 233,000 2-5 Miscellaneous 233,000 2-5 Miscellaneous 9,306,000
Sub-Total 2-2) 7,988,000 Sub-Total 2-2) 7,988,000 Sub-Total 2-2) 319,506,000 3) Portable Station 3) Portable Station 3) Portable Station
3-1 Portable radio terminal 5 1,375,000 3-1 Portable radio terminal 5 1,375,000 3-1 Portable radio terminal 200 55,000,000Sub-Total 2-3) 1,375,000 Sub-Total 2-3) 1,375,000 Sub-Total 2-3) 55,000,000
3. VHF EARLY WARNING SYSTEM 3. VHF EARLY WARNING SYSTEM 3. VHF EARLY WARNING SYSTEM 1) Master station (Atoll Office) 1) Master station (Atoll Office) 1) Master station (Atoll Office)
1-1 10W Radio System with master controller 1 6,500,000 1-1 10W Radio System with master controller 1 6,500,000 1-1 10W Radio System with master controller 20 130,000,0001-2 Antenna system 1 350,000 1-2 Antenna system 1 350,000 1-2 Antenna system 20 7,000,0001-3 AC power supply and UPS 1 180,000 1-3 AC power supply and UPS 1 180,000 1-3 AC power supply and UPS 20 3,600,0001-4 Isolation transformer 1 400,000 1-4 Isolation transformer 1 400,000 1-4 Isolation transformer 20 8,000,0001-5 Miscellaneous 223,000 1-5 Miscellaneous 223,000 1-5 Miscellaneous 4,458,000
Sub-Total 3-1) 7,653,000 Sub-Total 3-1) 7,653,000 Sub-Total 3-1) 153,058,000 2) Speaker Warning Station (Island Office) 2) Speaker Warning Station (Island Office) 2) Speaker Warning Station (Island Office)
2-1 10W Radio System with remote controller 5 2,500,000 2-1 10W Radio System with remote controller 5 2,500,000 2-1 10W Radio System with remote controller 200 100,000,0002-2 Antenna system 5 450,000 2-2 Antenna system 5 450,000 2-2 Antenna system 200 18,000,0002-3 AC power supply and UPS 5 1,000,000 2-3 AC power supply and UPS 5 1,000,000 2-3 AC power supply and UPS 200 40,000,0002-4 Loudspeaker 5 450,000 2-4 Loudspeaker 5 450,000 2-4 Loudspeaker 200 18,000,0002-5 Isolation transformer 5 2,000,000 2-5 Isolation transformer 5 2,000,000 2-5 Isolation transformer 200 80,000,0002-6 Miscellaneous 192,000 2-6 Miscellaneous 192,000 2-6 Miscellaneous 7,680,000
Sub-Total 3-2) 6,592,000 Sub-Total 3-2) 6,592,000 Sub-Total 3-2) 263,680,000
4. MULTIPLEX RADIO SYSTEM 4. MULTIPLEX RADIO SYSTEM 4. MULTIPLEX RADIO SYSTEM1) 8.2GHz Multiplex radio 3 11,400,000 1) 8.2GHz Multiplex radio 3 11,400,000 1) 8.2GHz Multiplex radio 3 11,400,0002) Antenna system 3 540,000 2) Antenna system 3 540,000 2) Antenna system 3 540,0003) AC power supply and UPS 3 3,000,000 3) AC power supply and UPS 3 3,000,000 3) AC power supply and UPS 3 3,000,0004) Isolation transformer 3 1,050,000 4) Isolation transformer 3 1,050,000 4) Isolation transformer 3 1,050,0005) Miscellaneous 480,000 5) Miscellaneous 480,000 5) Miscellaneous 480,000
Sub-Total 4 16,470,000 Sub-Total 4 16,470,000 Sub-Total 4 16,470,000
5. ANTENNA TOWER 5. ANTENNA TOWER 5. ANTENNA TOWER
1) TOWER (20m Self Supporting Square Type) 3 30,000,000 1) TOWER
(20m Self Supporting Square Type) 3 30,000,000 1) TOWER(20m Self Supporting Square Type) 3 30,000,000
2) TOWER(45m Self Supporting Triangle Type ) 6 78,000,000 2) TOWER
(45m Self Supporting Triangle Type ) 6 78,000,000 2) TOWER(45m Self Supporting Triangle Type ) 220 2,860,000,000
3) TOWER (25m Panza Mast) 1 845,000 3) TOWER (25m Panza Mast) 20 16,900,000 3) TOWER (25m Panza Mast) 20 16,900,000
Sub-Total 5 108,845,000 Sub-Total 5 124,900,000 Sub-Total 5 2,906,900,000Total equipment cost 316,225,000 Total equipment cost 570,153,000 Total equipment cost 6,780,311,000
6. MANAGEMENT COST 6. MANAGEMENT COST 6. MANAGEMENT COST1) Project Management Cost 1 25,298,000 1) Project Management Cost 1 45,612,000 1) Project Management Cost 1 542,425,000
GROUND TOTAL (Alternative-1) 341,523,000 GROUND TOTAL (Alternative-1) 615,765,000 GROUND TOTAL (Alternative-1) 7,322,736,000

9-43
9.6 Preliminary Implementation Schedule
Table 9.9 below presents a preliminary schedule for implementing the project via the JBIC loan
scheme. The total implementation period for Alternative-1 is assumed to be 44 months from the
date of approval of the Project until the end of the Project. The number of months required for
each of major implementation process is estimated as follows:
1) 12 months for the selection of consultants.
2) 5 months for the detailed design and preparation of tender documents, including
concurrence of JBIC.
3) 5 months for the tender evaluation, including concurrence of JBIC.
4) 10 months for the system design, procurement, development, manufacturing,
installation and testing of both the software and hardware.
5) 2 months for training.
In addition to the above, the following actions and procedures need to be completed before the
contract is signed:
1) Tendering.
2) Pre-Qualification of contractors.
3) Construction contract negotiation.
4) Approval of the construction contract by JBIC.
For JBIC funding, the standard procedural times for loan project administration are prescribed as
follows:
1) Selection of Consulting Firms: 12 months
2) Construction/Procurement of Equipment: 23 months in total, as follows:
a. Pre-Qualification: 4 months
b. Preparation of Tender Documents: 3 months
c. Tender Period: 3 months
d. Evaluation of Tenders: 6 months
e. JBIC Concurrence for Tender Evaluation: 2 months
f. Contract Negotiation: 3 months
g. JBIC Concurrence for Contract: 1 month
h. Opening a Letter of Credit: 1 month

9-44
9-44
Table 9. 9 Preliminary Implementation Schedule
Months
1 2 3 4 5 6 7 8 9 10 11 12 13 14 15 16 17 18 19 20 21 22 23 24 25 26 27 28 29 30 31 32 33 34 35 36 37 38 39 40 41 42 43 44 45
Pledge
E/N
Signing L/A
Selection of Consultant
Consulting Services
Pre-Qualification (incl.JBIC's concurrence)
Preparation of Tender Documents(incl.JBIC's concurrence)
Tender Period
Tender Evaluation
JBIC's Concurrence of Tender Evaluation
Negotiation of Contract
JBIC's Concurrence of Contract
Signing on Construction Contract
L/C Opening, L/Com Effectuate
Contract Singing
System Design and Development
Hardware Procurement and Installation
System Testing
TrainingSyst
em d
evel
opm
ent
Description
Con
sulti
ng S
ervi
ce
Detailed Design

9-45
9.7 Recommendations
Communications in the Maldives is dependent on the public telephone service. Because of this,
each island is not able to communicate with other places when the public telephone network is
out of service. From the viewpoint of disaster prevention, it is concluded that an alternative
communications network, which is not affected by disasters, needs to be developed. However, in
order to improve the functionality of the system, the following actions are required in the medium
and long term:
(1) Improvement of related legal systems
In the Maldives, there are currently no protocols for natural disaster prevention. In order to
identify the organizations concerned, clarify their roles, functions and responsibilities, a national
disaster framework and related legal system are required. An outline of the Disaster Measures
Basic Law in Japan is shown below.
Table 9. 10 Outline of Disaster Measures Basic Law in Japan
Chapter 1 General Rules (Articles 1 to 10)
Chapter 2 Organizations Related to Disaster Prevention
Section 1 Central Disaster Prevention Council (Articles 11-13)
Section 2 Local Disaster Prevention Council (Articles 14-23)
Section 3 Emergency Center and Disaster Headquarters
(Articles 24-28.6)
Section 4 Dispatch of Personnel in Case of Emergency
(Articles 29-33)
Chapter 3 Disaster Prevention Plan (Articles 34-45)
Chapter 4 Disaster Prevention (Articles 46-49)
Chapter 5 Emergency Response Measures
Section 1 General Principles (Articles 50-53)
Section 2 Warnings and Other Communications (Articles 54-57)
Section 3 Proactive Measures and Evacuation (Articles 58-61)
Section 4 Response Measures (Articles 62-86)
Chapter 6 Post-disaster Recovery (Articles 87-90)
Chapter 7 Financial and Monetary Measures (Articles 91-104)
Chapter 8 Disasters and Emergencies (Articles 105-109.2)
Chapter 9 Miscellaneous Rules (Articles 110-112)
Chapter 10 Penalty Rules (Articles 113-117)
Additional Rules

9-46
(2) Establishment of organizational structures
Disaster prevention needs to be implemented integrally and systematically with the cooperation
of the national government, regional government, public institutions and residents.
Organizational structures and information flows have briefly been studied in this report. However,
based on the needs of the alternative communications system and related legal system, an actual
organizational structure at the national, regional and municipal levels needs to be established.
(3) Balance of demands and project objectives
There are several needs from several organizations that must be balanced to allow effective
communication between islands and atolls, and between atolls and capital Male’. The demands
vary even within each organization. The Study Team recognizes that these demands form the
present conditions and that almost all organizations are dependent on the public
telecommunication network for their own business. However, it is important to balance these
various demands and project objectives.
(4) Participation of related parties
In contrast to balancing demand and project objectives, it is effective to increase the number of
system users in order to maximize the project benefit. To identify potential users, further analysis
will be required of business procedures in related organizations at both atoll and island levels. For
example, in order to increase the number of tourists, enhancement of the disaster prevention
capability is required. Development of an alternative communication network is one of the
solutions. In this sense, tourist islands would be considered as candidates for the related parties.
(5) Detailed design
The Study has discussed the current situation in the telecommunications sector in the Maldives,
the impact of the 2004 tsunami, and the existing organizational structures relevant to disaster
prevention. Based on these analyses, the Study Team has proposed that an alternative
telecommunications system be developed. The proposal includes the necessity for development,
an outline of the required organizational structure, preliminary system design, cost estimation and
an implementation schedule. However, the system design that is described in this report is only
preliminary, as necessary for clarifying the project scale. In the project implementation stage,
detailed design work will be required.

10-1
CHAPTER 10 ENVIRONMENTAL CONSIDERATIONS
10.1 Introduction
This Chapter looks into the environmental aspect of the six infrastructure projects included in the
Study, which are multi-purpose building & island office, causeway, power supply, sewerage
system, island harbours and coastal protection. Each project has different development
characteristics, and varies significantly in the impact on the natural and social environment.
In accordance to the GOM environmental law “Environment Protection and Preservation Act (Law
no.: 4/93)”, all development projects will require an environmental approval from Ministry of
Environment, Energy and Water (MEEW) (former name: Ministry of Environment and
Construction (MEC)), and an IEE or EIA will be required for development projects with significant
environmental impacts (refer to Chapter 10.2 for more details on the environmental legislation of
GOM).
Within the six development projects, multi-purpose building & island office, causeway, power
supply and sewerage system are grant aid projects. For the grant aid projects an application form
was submitted to MEEW to obtain environmental approval, and IEE was requested for the
causeway and EIA for the sewerage projects as a condition of approval. After submission of
necessary documents all the grant aid projects have obtained environmental approval from
MEEW.
For the medium-term projects (island harbour and coastal protection), no application forms are
submitted to MEEW, since the projects are still in its preliminary stage. However, the Team has
conducted an original IEE for the island harbour, since certain level of environmental impacts can
be observed from the project.
Table 10.1 summarizes the status of environmental approval of each project.
Table 10.1 Status of Environmental Approval of each Project by MEEW Requirement of IEE or EIA Environmental approval of MEEW
Multi-purpose building & Island office
Not required Approval obtained
Causeways IEE required Approval obtained after submitting IEEPower supply Not required Approval obtained Sewage system EIA required Approval obtained after submitting EIAIsland harbours Not applied to MEEW yet, but IEE could
be required -
Coastal protection Not applied to MEEW -
In the following Chapters, only the island harbours, causeways and sewerage projects will be
focused, since the other projects have only negligible impact on the environment. A summary of
the submitted IEE of the causeway and EIA of the sewerage projects will be presented, together

10-2
with the original IEE conducted for the island harbours.
All the information contained in this Chapter is compiled through reference to literature, interview
surveys, aerial photos, field reconnaissance in May 2005 and simple field surveys.
10.2 Environmental Legislation in the Maldives 10.2.1 Environmental Regulations applied to Development Project
The basic environmental law in the Maldives is “Environment Protection and Preservation Act
(Law no.: 4/93)”. Under Clause 5 of this law, all development projects irrespective of its project
scale will require an environmental approval from the MEEW. For development projects with
potential environmental impact, an Initial Environmental Examination (IEE) or Environmental
Impact Assessment (EIA) will be requested as a condition of approval. The above approval
process will also apply to tsunami reconstruction projects, though the evaluation process of the
MEEW may be fasten due to the urgent nature of the projects.
10.2.2 Process of Obtaining the Environmental Approval
In order to obtain the Environmental Approval from MEEW, the project proponent must initially
submit a Screening Form, providing a brief description of the project and environmental impacts.
Based on the Screening Form, MEEW will determine whether an IEE or EIA is necessary.
Both IEE and EIA are usually composed of; description of the existing environmental condition,
environmental impact assessment, mitigation measures and monitoring plan. However, IEE
requires less information, no original research and less rigorous analysis compared to EIA.
In some cases MEEW may request an EIA when significant environmental impact is identified
after conducting the IEE. The basic procedure for obtaining Environmental Approval is also
described in the following flow chart (Figure 10.1).

10-3
Figure 10.1 Basic Procedure for Obtaining Environmental Approval

10-4
10.3 IEE of the Reconstruction of the 11 Island Harbours 10.3.1 Existing Status of the Island Harbours
Following is a brief description of the existing status of the island harbours, which is based on the
field reconnaissance conducted in May 2005.
In total, 11 island harbours were surveyed during the field reconnaissance of May 2005. All the
harbours are located facing the inner atoll. The harbours can be classified into two types of
harbour structure. The first type, which is most common, is constructed over a reef flat. Since
reef flats are shallow it has been excavated and dredged to create the channel and harbour area.
The photo below shows a typical harbour of this type.
Typical Harbour Constructed Over a Reef Flat
The second type of harbour is constructed inside a natural lagoon. This type of harbour usually
does not require a seawall or breakwater due to the sheltered nature of the lagoon. However, the
reef edge must be excavated and dredged to create the shipping channel. The photo below shows
a typical harbour of this type.
Typical Harbour Constructed Inside a Lagoon

10-5
Although many of the harbours were already damaged to a certain degree prior to the tsunami,
the tsunami has accelerated these damages. The main damages observed during the field
reconnaissance were, cracks and tilting of the quay wall, and collapsing of seawall and breakwater.
Also coastal erosion was observed along the coast of some harbours. Prompt reconstruction of
the harbours will be essential to sustain the harbour function and the safety of the users.
10.3.2 Existing Status of Natural and Social Environment around the Island Harbours
(1) Natural Environment around the Island Harbours
1) Geography
Islands in the atolls are built over a shallow reef flat (around 1m depth), which could sometimes
be exposed during low tide. The shallow reef flat continues until it reaches the reef edge, then
rapidly slopes down to greater depth at the reef slope. In some islands, a lagoon has developed
inside the reef flat.
2) Climate
Climate information is based on the meteorological data of Kaddhoo Airport in Laamu Atoll.
Monthly average temperature shows little fluctuation with the season, ranging between 28 to
29℃. Monthly mean relative humidity show little fluctuation with the season, ranging mostly
between 70 – 80%.
Laamu Atoll has relatively high amount of rainfall with an annual rainfall of around 2,000mm.
Generally rainfall is most abundant during October and November, sometimes exceeding 400mm.
Rainfall is usually least during February and March, often being below 100mm. The other months
are between 100 – 200mm.
Wind direction is strongly influenced by the two monsoon season. Easterly winds dominate during
the NE monsoon season (January – March) and westerly winds during SW monsoon season (May
– November). Wind direction is variable in between the two monsoon seasons. Wind speed is
quite variable with the season but generally strongest during the SW monsoon season.
3) Shoreline Erosion
Shoreline erosion is a serious problem in Maldives. Many of the coasts adjacent to the harbours
appeared to be significantly eroded. The photo below shows an eroded coast adjacent to the
harbour. Various factors may be the cause, such as global warming, tsunami, increase in severe
weather, reduction of sand supply due to less corals and so on.

10-6
Coastal Erosion Along the Coast Adjacent to the Harbour
(Photo taken in May 2005)
4) Seawater Quality
Seawater quality data of the island harbours were not available. However, obvious deterioration of
water quality was observed in many of the island harbours during the harbour survey in May
2005.
Water transparency inside the harbours were significantly lower compared to the outer harbour
area, which is an indication of water deterioration inside the harbour. As a general trend,
transparency was lower with harbours with long shipping channel. The main factor behind the
water quality deterioration is likely due to the restriction in water exchange between the inner and
outer harbour area.
Furthermore, large amounts of wastes such as dead fish, plastic bottles and various debris were
observed inside the harbours and along the coast as shown in the photo below;
Various Waste Observed in the Adjacent Coast of the Island Harbour
(Photo taken in May 2005)

10-7
5) Marine Ecosystem
Seagrass beds are often densely distributed in the shallow reef flats adjacent to the harbours. The
main species is Thalassia hemprichii. Figure 10.6 shows a photo of the Thalassia hemprichii bed
found near one of the harbour.
Thalassia hemprichii Bed Found Near One of the Harbour
(Photo taken in May 2005)
During the field reconnaissance, patches of corals were sometimes found inside the harbours and
channels, though at very low density. Furthermore, many of the observed corals appeared to be
dead, thus having very little conservation value.
In the Maldives, corals are usually most densely distributed along the reef edge, where the
shipping channel ends. Since, survey of this area could not be conducted further survey will be
required.
Sea turtles are known to nest in some of the islands of both Atolls. The main species are hawksbill
turtle (Eretmochelys imbricata) and green sea turtle (Chelonia mydas). Table 10.2 lists the islands
noted for sea turtle nesting. However, since the nesting sites are usually located in the sandy
beaches facing the outer atoll, the harbour reconstruction works will not affect the nesting sites.
Table 10.2 Sea Turtle Nesting Islands in Laamu and Thaa Atoll Laamu Atoll Thaa Atoll
Isdhoo Buruni Gan (Mathimaradhoo) Maagulhi Kaddhoo Dhonanfushi Gaadhoo Kanimeedhoo Veymandhoo Kinbidhoo Kakolhas Olhufushi Finolhu Olhufushi
Source: Marine Research Center

10-8
(2) Social Environment of the Islands
1) Demography
The following Table 10.3 shows the population of the islands where the Island harbours are
located. All islands have a population of less than 2,000.
Table 10.3 Population of the Islands where the Island Harbours are Located
(Year 2000) Laamu Atoll Isdhoo 1,432 Maabaidhoo 793 Fonadhoo 1,740 Maavah 1,351 Thaa Atoll Dhiyamigili 484 Guraidhoo 1,433 Thimarafushi 1,537 Veymandhoo 763 Kinbidhoo 833 Hirilandhoo 759
Source: Statistical Yearbook of Maldives 2004
2) Socio-economic Activities
Fisheries is the dominant socio-economic activity in most of the islands. The main targeted
species are tuna and skipjack, which are caught by pole and line in the offshore waters. Other
fisheries include reef fishery, bait fishery and sea cucumber fishery. In some harbours, cages for
baitfish, which are used for tuna and skipjack fishing where placed inside the harbour area.
In recent years, fish catch are often sold directly to international freezer vessels or to fish
processing factories such as in Maandhoo. Despite this trend, fishing landing activities where still
observed in many of the harbours. Also smoking and drying of fish where conducted in some of
the harbours, such as in Hirilandhoo of Thaa Atoll. Table 10.4 summarizes the number of fishing
households, fishing vessels and the maximum number of vessel call per day of each island.

10-9
Table 10.4 The Number of Fishing Households, Fishing Vessels and Maximum
Number of Vessel Calls per Day of each Island
Island No. of fishing
household (estimate)
No. of fishing vessels
Maximum no. of vessel calls per day*
Laamu Atoll Isdhoo 0 Data N/A Data N/A Maabaidhoo 50 13 40 Fonadhoo 10 2 35 Maavah 130 22 70 Thaa Atoll Dhiyamigili 55 23 55 Guraidhoo 45 30 Data N/A Thimarafushi 58 16 54 Veymandhoo 45 31 90 Kinbidhoo 39 10 40 Hirilandhoo 50 27 50
*:Includes transport vessels
Source: Based on interview survey of island office
Despite the relatively small scale of the harbours, frequency of vessel calls could be quite high.
Therefore, careful planning of reconstruction works must be made so to minimize obstruction to
the vessels movement.
Agriculture is conducted at a subsidiary level in some of the islands. Products include coconut,
mango, eggplant, chili, water melon, pumpkin, cucumber and so on.
3) Waste Management
During the field reconnaissance various wastes, such as plastic bottles, dead fish and debris
where observed inside the harbour area and along the adjacent coast. Clean-up of these waste
and awareness campaigns should be conducted in the future so to minimize uncontrolled waste
dumping.
10.3.3 Description of the Reconstruction Works
The main works required for the reconstruction of the island harbours are quay wall, quay wall
apron, seawall and breakwater repair and coastal protection. Initially dredging of harbour basin
was also considered. However, in accordance to the bathymetric survey conducted in May 2005,
the water depth of all the harbour basins were above the minimum acceptable depth (i.e. 8ft
above L.A.T). Therefore, dredging of harbour basin is considered unnecessary for all the harbours.
Table 10.5, shows the approximate length of repair required for the main harbour structures, and
coastal protection.

10-10
Table 10.5 Approximate Length of Repair Required for the Main Harbour Structures,
and the Required Length of Coastal Protection
Atoll Harbour Quay wall
(m) Quay wall apron (m)
Seawall (m)
Breakwater (m)
Coastal protection
(m) Laamu Isdhoo 10 (108)* 108 (108) 60 (168) 70 (70) - Isdhoo-Kalaidoo - 93 (93) - - 120 Maabaidhoo 96 (131) 131 (131) - - 110 Fonadhoo 82 (168) 168 (168) - 157 (285) 100 Maavah 123 (173) 173 (173) - - 50Thaa Dhiyamigili 192 (215) 27 (215) 52 (162) 600 (800) - Guraidhoo 25 (304) 224 (304) 70 (269) 85 (205) - Thimarafushi - 216 (216) - - - Veymandhoo - - - - - Kinbidhoo 54 (54) 54 (54) 8 (103) - - Hirilandhoo - 141 (141) - - -
*: Figures in the parenthesis indicate the approximate length of the existing structure
10.3.4 Potential Environmental Impacts
Since the scale of the reconstruction works are relatively small, adverse impacts on the natural
and social environment will generally be minor. However, the following impacts could still be
expected during the construction phase.
Impacts on the adjacent seagrass and corals through dispersion of sediments by harbour
repair works. Sediment dispersion will be most significant for harbours requiring seawall
repair, since construction of a temporary road will be required for backhoe mobilization.
Sediment dispersion will be insignificant for activities related to quay wall, breakwater and
coastal protection works.
Impacts to the harbours users, such as fishing vessels and transport vessels, through
temporal restriction in the use of quay wall and quay wall apron.
The magnitude of the above impacts will vary with the harbours due to the differences in the
construction scale and the local environment status. Table 10.6 summarizes how the above
impacts will affect each harbour through consideration of construction scale and harbour
characteristics.

10-11
Table 10.6 Magnitude of the Impacts of the Reconstruction Works in Respect to
Seagrass, Corals and Harbour Users Atoll Harbour Seagrass Corals Harbour users
Laamu Isdhoo C U C Isdhoo-Kalaidoo D D C Maabaidhoo D D B Fonadhoo D D B Maavah D D B Thaa Dhiyamigili C U B Guraidhoo U U C Thimarafushi D D C Veymandhoo D D D Kinbidhoo D D B Hirilandhoo D D C
A: Significant potential impact, B: Moderate potential impact, C: Small potential impact, D: No potential impact, U: Undecided (not enough information)
Impact on the seagrass should be limited to Isdhoo and Dhiyamigili, since these harbours require
seawall reconstruction. However, impact on seagrass will be further reduced for Isdhoo and
Dhiyamigili if construction of temporal road is unnecessary for the seawall repair. Although
Guraidhoo requires seawall reconstruction it appears that there are no seagrass near the harbour
according to the aerial photo. Kinbidhoo also requires seawall reconstruction but impact on
seagrass will be insignificant due to the short length of seawall reconstruction (8m). Impact on
the corals is possible for Isdhoo, Dhiyamigili and Guraidhoo. However, the distribution of corals
around these harbours is uncertain. Perhaps a coral survey should be conducted around these
harbours prior to construction.
The most significant concern during the harbour reconstruction is the impact on the harbour
users, especially with harbours requiring major quay wall reconstruction. Harbours that apply to
this category are Maabaidhoo, Fonadhoo, Maavah, Dhiyamigili and Kinbidhoo.
10.3.5 Mitigation Measures
In order to minimize the above identified impacts, employment of the following mitigation
measures are proposed:
Installation of silt protection curtain to minimize sediment dispersion during seawall
construction.
Maintenance of enough quay wall space for the harbour users. Careful planning of
construction works will be required, with full consultation with the harbour users.
Prior notice of the construction schedule to the harbour users.

10-12
10.3.6 Environmental Monitoring Plan
Environmental monitoring of the natural environment will not be a high priority for most harbours,
since the magnitude of the impacts on the natural environment are relatively minor. However, if
major coral communities are identified near the harbour, appropriate monitoring should be
conducted.
Since the most significant concern during the harbour reconstruction is the impact on the harbour
users, regular interview surveys should be conducted to the harbour users, so that their opinions
are constantly reflected back in the construction method.
10.4 IEE of the Reconstruction of the Two Causeways in Laamu Atoll 10.4.1 Existing Status of the Two Causeways
In this report, the causeway that connects Kaddhoo Island to Maandhoo Island is named as
Causeway No.1, and the other causeway that connects Kaddhoo Island to Fonadhoo Island as
Causeway No.2. Both causeways function as an important transport lifeline for these islands.
Table 10.7 shows the length and width of the two causeways prior to the tsunami. Almost the
entire half lane of Causeway No.2 has been scraped away through the tsunami. Damage to
Causeway 1 is slightly less but some sections have been scraped away significantly.
Table 10.7 The Length and Width of the Causeways Prior to the Tsunami Causeway No.1
(Maandhoo – Kaddhoo) Causeway No.2
(Kaddhoo – Fonadhoo) Length 270m 812m Width 13m (two lane) 13m (two lane)
Since some sections of the causeways are narrowed to one lane, vehicles must wait at a wide
section until the opposing vehicle passes. Furthermore, the existing sections of the causeways are
under rapid and continues erosion. Prompt reconstruction of the causeways is essential for the
local users.
10.4.2 Existing Status of Natural and Social Environment around the Causeways
(1) Natural Environment around the Causeways
1) Geography

10-13
The two causeways are built over a shallow reef flat (around 1m depth). Figure 10.2 shows the
geographical structure around the causeways. The west side of the causeway is slightly shallower
than the east side due to accumulation of sediments.
Figure 10.2 Geographical Structure around the Causeway
2) Climate
Refer to Chapter 10.3.2.
3) Oceanography
There was no reliable information source that describes the oceanographic characteristics around
the causeways. Therefore description of this section is mainly based on deduction and the field
reconnaissance of May 2005. Since the causeways are located over a reef flat, the adjacent water
depth is shallow. Interestingly, water depth of the west side was noticeably lower compared to
the east side. A combination of factors may be the cause, such as limitation in water exchange,
tidal time difference and the effect of the breaking waves on the reef edge of the east side (i.e.
the breaking waves have an effect of elevating the water level).
Deducing from the tidal chart of Male’, tides in the Laamu area is semi-diurnal (i.e. two high and
low tides per day). The tidal range is approximately 1m during spring tide. The current regime of
the causeway area is probably mainly governed by tidal and wind factors. Currents in the east
side may also be influenced by the breaking waves. During the field reconnaissance no obvious
strong currents were observed, except near the exit of the pipe culvert, which is inevitable since it
is the only water passage between the west and east side.
4) Shoreline Erosion
The shoreline adjacent to the causeways appeared to be under erosion. Various factors may be
the cause, such as global warming, tsunami, increase in severe weather, reduction of sand supply

10-14
due to less corals and so on. The causeway itself is also under continuous erosion, which is
enhanced by the damage caused by the tsunami.
5) Seawater Quality
Although there are no field measurements of seawater quality in the vicinity of the causeways,
obvious deterioration of water quality was observed near both causeways especially in the west
side where water exchange is more limited. Furthermore, due to the tsunami, scour pits have
been created on the west side, which has enhanced water stagnation. Combined with these
factors, anaerobic conditions have developed in some sections of the west side, which were made
obvious through the detection of hydrogen sulfide (H2S) odor during the field reconnaissance.
6) Marine Ecosystem
Seagrass beds are densely distributed in the shallow reef flats adjacent to the causeways as
shown in the photo below. The main species is Thalassia hemprichii.
Seagrass Bed Along the Causeway No.2
(The dense and dark patches are seagrass bed)
Patches of corals were sometimes observed near the causeway, though at very low density.
Furthermore, many of the observed corals appeared to be dead, thus having very little
conservation value. However, an accurate distribution of corals near the causeway is unknown.
(2) Social Environment of the Islands around the Causeways
1) Demography
The population of Gan and Fonadhoo Island is 2,244 and 1,740 respectively (as of year 2000).
2) Socio-economic Activities
Refer to Chapter 10.3.2.
3) Traffic Volume
There are no traffic count data for both causeways. However, data on the number of vehicles and

10-15
motorbikes in Gan and Fonadhoo Island was obtained through interview surveys at the Island
Office, which is shown in Table 10.8.
Table 10.8 Number of Vehicles and Motorbikes in Gan and Fonadhoo Island Vehicle Motorbike Total
Gan Island 13 25 38 Fonadhoo Island 15 44 59
Source: Interview survey at Gan and Fonadhoo Island Office in May 2005
Assuming that all the vehicles and motorbikes from both islands pass the causeway once per day,
the total traffic volume per day would approximately be 100. However, this figure could be a
conservative estimate since it does not include the vehicles and motorbikes of the Kaddhoo
Airport, fish factory in Mandhoo Island and the National Security Service (NSS) based in Kaddhoo
Island.
10.4.3 Description of the Reconstruction Works
Table 10.9 shows the specification of the major works of the causeway reconstruction. The type
of reconstruction work is similar with both causeways, though the scale of work is greater for
Causeway No.2, due to its longer length and greater damage from tsunami. In addition, an 18m
bridge will be newly installed for Causeway No.2.
Table 10.9 The Specification of the Major Works of the Reconstruction Works Causeway 1 Causeway 2
Excavation of the toe of the causeway
540m (270m x 2) 1,624m (812m x 2)
Dredging of sand for backfilling 2,850m3 8,700m3 Backfilling of core 4,050m3 12,180m3 Installation of geotextile sheet and armor rock
540m (270m x 2) 1,624m (812m x 2)
Pavement of road 270m 812m Coastal protection 150m 350m Installation of Water Passage 3 passage box culverts
(0.9m x 2.6m) 5 passage box culverts (0.9m x 2.6m) 18m bridge
10.4.4 Potential Environmental Impacts
Based on the analysis of the current environmental status and the content (scale, duration, etc.)
of the reconstruction projects, the following negative impacts have been identified for the
construction and post-construction phase. The type of impacts are similar for Causeway No.1 and
No.2, since the content of the construction activities are more or less similar. However, the
magnitude of the impacts will be slightly higher for Causeway No.2 due to the longer length.

10-16
(1) Construction Phase
Disturbance or partial loss of the adjacent seagrass bed and corals through excavation,
dredging and backfilling works,
Disturbance to the local vehicle and motorbike traffic through construction works,
Generation of various construction related waste,
(2) Post-Construction Phase
Deterioration of seawater and sediment quality through restriction of water exchange,
Possible alteration of adjacent seafloor and shoreline topography through the enhanced
water exchange capability of the causeway.
10.4.5 Mitigation Measures
In order to minimize the impacts on the environment various mitigation measures will be
employed such as:
Installation of silt protection curtain to minimize sediment dispersion,
Maintenance of safe access to the causeway during the entire course of the construction,
Installation of bridge and culverts to enhance water exchange,
Construction of coastal protection structure to prevent shoreline erosion,
Disposal of construction related waste in accordance to manner acceptable to the
Government of Maldives.
10.4.6 Environmental Monitoring Plan To confirm the effectiveness of the employed mitigation measures and the status of the
environment, environmental monitoring will be conducted for the following parameters. The
purpose of the monitoring is also described.
Seagrass: To confirm that the construction works do not lead to any loss or disturbance to the
adjacent seagrass bed.
Corals: To confirm that the construction works do not lead to any loss or disturbance to the
adjacent corals.
SS: To confirm that the construction activities are not dispersing significant amount of
sediments to the adjacent seagrass and corals.
Water exchange: To confirm the effectiveness of the culverts and bridge in enhancing water
exchange.
Water and sediment quality: To confirm the effectiveness of the culverts and bridge in
improving the deteriorated water and sediment quality near the causeway.
Seafloor / shoreline topography: To confirm how the new culverts and bridge affects the

10-17
seafloor and shoreline topography through alteration of the local current regime.
10.5 EIA of the Upgrading of the Sewerage System in Isdhoo Island 10.5.1 Existing Status of the Sewerage System
Wastewater treatment in Isdhoo Island is currently dependant on the septic tank and soak pit
system, which consist of small-scale sedimentation tanks and soak pits. However, these units are
often poorly constructed and maintained. For example the sedimentation tanks are made from
coral bricks or rocks, which are highly prone to leakage. Leakages from the septic tank migrate
freely through the porous island soil and contaminate the groundwater. Furthermore, some tanks
are too small to provide adequate retention time and settling, and as a result untreated sludge
discharge directly to the soak pit and from there, to the groundwater.
10.5.2 Existing Status of Natural and Social Environment of Isdhoo Island
(1) Natural Environment of Isdhoo Island
1) Geography
Ishdhoo Island is located in the northern tip of Laamu Atoll. The Island is surrounded by a shallow
reef flat with a natural lagoon in the southern side of the Island. As in all islands in Maldives the
terrain of Ishdoo Island is flat and low-lying. The Island is composed primarily of reef-derived
carbonate sediment that has been deposited through waves and currents.
The land area of the Island is approximately 293 hectares (MPND, 2005), which is the second
largest island in Laamu Atoll. There are two villages in the Island, namely Ishdhoo and
Ishdoo-Kalaidhoo. Isdhoo is located in the northern end of the island and Ishdoo-Kalaidhoo in the
southern end.
Aerial Photograph of Isdhoo Island
2) Climate
Refer to Chapter 10.3.2.

10-18
3) Groundwater Quality
Groundwater aquifers in the Maldives islands normally lie between 1 and 1.5 metres below the
soil surface. The proximity of the aquifers to the island surfaces makes them vulnerable to
pollution and contamination from human activities and saltwater intrusion (UNEP, 2005).
Table 10.10 shows the results of groundwater quality survey conducted in Isdhoo Island in July
2005. The groundwater samples were collected from 3 wells in Ishdoo-Kalaidhoo.
Table 10.10 Results of Groundwater Quality Survey in Isdhoo-Kalaidhoo
(conducted in July 2005)
Well 1 Well 2 Well 3 WHO guideline
values for drinking water
Chloride 940 mg/L 960 mg/L 1,100 mg/L < 250 mg/LNitrate 0.0 mg/L 44.27 mg/L 5.31 mg/L < 50 mg/LAmmonia 0.42 mg/L 9.0 mg/L 11.5 mg/L < 1.5 mg/LPhosphate 0.21 mg/L 0.71 mg/L 0.65 mg/L -Salinity 2,400 mg/L 2,100 mg/L 2,200 mg/L -COD 14 mg/L 17 mg/L 27 mg/L -Total coliform >100 / 100 ml >100 / 100 ml >100 / 100 ml 0Faecal coliform >100 / 100 ml >100 / 100 ml >100 / 100 ml 0
Source: JICA Study Team
The results of the groundwater quality survey are compared with the WHO guideline values of
drinking water and other sources. However, since groundwater in Isdhoo is not intended for
drinking water, drinking water values are used strictly for reference only. Chloride and ammonia
values are substantially above the WHO guideline value in most of the sampled wells. High
chloride values could be due to sewage leakage and saline intrusion. High ammonia values are
most likely to be from sewage leakage.
Salinity values are also high for all the wells, exceeding 2,000 mg/L. This salinity level is not
suitable for drinking even in emergency situations. The salinity values are also high for irrigation
purposes except for salt tolerant crops. Salt tolerant crops can tolerate up to around 4,000 mg/L
with special management (Waterwatch, 2002).
COD values are also high for all the wells, indicating high organic content. This again could be due
to the leakage from the sewerage. The total coliform and faecal coliform values are substantially
above acceptable levels in all locations, which is most likely to be from sewage leakage.
4) Terrestrial Ecosystem
Isdhoo Island is covered by thick vegetation especially in the mid to southern area of the Island.
Species composition tends to differ with the coastal area and the interior. Pioneering species tend
to habit the coastal area and longer-lived trees in the interior. The species range are limited and

10-19
mostly are abundant and widely distributed.
5) Marine Ecosystem
Inspection of aerial photograph shows dense distribution of seagrass bed in the shallow reef flat,
west and east side of the Island. Seagrass beds were also observed near the island harbours,
during the field reconnaissance of May 2005. The main species are probably Thalassia hemprichii, which is the most common species in Maldives.
Coral distribution around Isdhoo Island is uncertain.
Sea turtles are known to nest in Isdhoo Island, mainly on the beaches facing the outer atoll. The
main species are hawksbill turtle (Eretmochelys imbricata) and green turtle (Chelonia mydas). However, the nesting sites appear to be under threat from severe beach erosion and littering.
(3) Social Environment
1) Demography
The population of Isdhoo Island is 1,432 as of year 2000. It is the third most populated island in
Laamu Atoll. The ratio of sex is 688 males to 744 females (MPND, 2005). The number of
households in Isdhoo and Ishdoo-Kalaidhoo are 184 and 130 respectively.
2) Socio-economic Activities
Fisheries and agriculture is the dominant industry in Ishdoo. In Isdhoo-Kalaidhoo agriculture is
the dominant industry. Fishing is not conducted in Isdhoo-Kalaidhoo partly due to the large reef
flat area, which makes it hard to access to the outer sea. The new sewerage treatment system will
not have any affects on the agriculture lands.
3) Infrastructure
Table 10.11 lists the major infrastructure and facilities in Isdhoo Island. All these facilities will be
connected to the new sewerage system.
Table 10.11 Major Infrastructure and Facilities in Isdhoo Island Isdhoo Isdhoo-Kalaidhoo
School 1 1 Office 1 1 Mosque 4 2 Women’s centre 1 1 Power house 1 1 Health centre - 1 Island court 1 -
4) Waste Management

10-20
Isdhoo Island has a designated waste disposal site. The usual practice is then open burning at the
disposal site with little segregation.
10.5.3 Description of the Project
The new sewerage treatment system will be installed in the two villages in Isdhoo Island namely,
Isdhoo and Isdhoo-Kalaidhoo, and the Health Centre located in the mid-point of both villages. The
major characteristics or improvements of the new system are as follows:
Increase and improvement in the treatment process (i.e. 4 treatment steps for black water),
Wastewater from each households will be conveyed to a common treatment facility,
Installation of new leakage-proof septic tanks,
no discharge to the sea, and
no net loss of groundwater.
Construction of the new sewerage treatment system will involve the following major activities.
The construction period will be approximately 8 months, starting from around November 2005
and completed around the end of May 2006.
(1) Installation of new septic tanks
A new septic tank will be installed for each household in Isdhoo (184 households) and
Isdhoo-Kalaidhoo (130 households). Larger capacity septic tanks (communal type) will also be
installed in the community buildings such as schools, island office and mosque.
(2) Installation of sewerage conveyance piping network for sewage water collection
Installation of an extensive network of sewage piping will be required to convey the sewage water
from the home septic tanks for further treatment. The pipes will mainly be laid underground the
existing roads.
(3) Construction of pump station
Fourteen pump stations will be constructed in both Isdhoo and Isdhoo-Kalaidhoo to pump the
converged sewage to the 1st Mounted Leach Field. One pump station will also be constructed in
the Health Centre area.
(4) Construction of 2nd Septic Tank
Seven 2nd Septic Tanks will be constructed in both Isdhoo and Isdhoo-Kalaidhoo, and one in the
Health Centre area.
(5) Construction of Mounted Leach Field
Seven Mounted Leach Fields will be constructed in both Isdhoo and Isdhoo-Kalaidhoo, and one in
the Health Centre area.

10-21
(6) Construction of Drying Bed for Sludge Treatment
One drying bed each will be constructed for Isdhoo and Isdhoo-Kalaidhoo. The exact location is
uncertain at the moment but should be near the Health Centre area.
(7) Construction of work shop, workers camp and management office
The work shop, workers camp and management office will be constructed near the Health Centre
area.
The new sewerage treatment system will require regular maintenance to keep the system
functional and effective. An Operation Office will be established for this purpose. The location of
the office is planned near the Health Centre area.
The main maintenance activity of the Operation Office is visual inspection of pump station,
checking of clogging and regular desludging of the septic tanks, which will be conducted by
vacuum truck.
10.5.4 Potential Impacts
Based on the analysis of the current environmental status and the content (scale, duration, etc.)
of the projects, the following negative impacts have been identified for the construction and
operation phase. The type of impacts are similar for Isdhoo and Ishdoo-Kalaidhoo since the
content of the project are more or less similar.
(1) Construction Phase
1) Disturbance to the residents during installation of septic tank
There could be slight disturbance to the residents when installing the new septic tanks in their
respective households. However installation works are temporary (approximately 10 days) thus
impact will be negligible.
2) Disturbance to the traffic movement during installation of underground pipe
The excavation and pipe laying works involved in the pipe installation could disturb the vehicle
movement. Approximately 2m width of the road will be occupied by the construction works.
However, there are only 2 vehicles in Isdhoo Island and there are plenty of alternative passage
ways, thus impact will be negligible.
3) Risks to public safety
The excavated grounds (approximately 1m) could be a risk to the residents. For example
someone could fall into the excavated grounds, especially during night time.
4) Noise nuisance during excavation works

10-22
The road excavation works will generate noise and could become a nuisance to the nearby
residents. However, since the roads are unpaved and are relatively soft, excavation works can be
conducted by machinery with low noise level such as backhoe. Therefore impact will be negligible.
5) Seepage of groundwater during excavation works
During the excavation works, groundwater could seep into the excavated hole, which must be
pumped out. Inappropriate discharge of the pumped groundwater then could lead to the
decrease in groundwater level.
6) Clearance of vegetation
Some vegetation may have to be cleared where mounted leach field will be installed. The
dimension of one leach field is 25m x 12m.
7) Generation of various construction related waste
Certain amount of construction related waste, such as construction debris (e.g. left over pipes)
waste oil, domestic waste from workers and so on will be generated during the construction
phase. These wastes could have adverse impact on the environment and island, without
appropriate management.
(2) Operation Phase
1) Possible odor nuisance from the sludge dry beds and septic tanks
Certain level of odor will be emitted from the sludge dry beds and septic tanks and may cause
some nuisance to the residents
10.5.5 Environmental Mitigation Measures
Table 10.12 shows the mitigation measures to be employed for minimizing the potential
environmental impacts. Through strict enforcement of the mitigation measures, the impacts
should be minimized to a negligible or minor level.

10-23
Table 10.12 Mitigation Measures against the Potential Impacts Phase Potential impact Mitigation measures
Construction phase
Risks to public safety The contractor will employ appropriate safety measures.
Seepage of groundwater during excavation works
The pumped groundwater will be returned back to the groundwater through appropriate methods, so to prevent any net loss of groundwater.
Clearance of vegetation The location of the leach field will be carefully considered to minimize the loss of vegetation.
Generation of various construction related waste
All waste generated during construction will be disposed in a manner acceptable to the Government of Maldives.
Operation phase Possible odor nuisance from the sludge dry beds and septic tanks
The sludge dry bed will be located far from the residential area. Ventilation pipe will be installed in the septic tanks.
10.5.6 Proposed Environmental Monitoring Plan
Environmental monitoring is considered unnecessary during the construction phase of the new
sewerage treatment system, due to the minor or negligible level of the impacts.
However, regular environmental monitoring of the groundwater quality should be conducted
during the operation phase. The monitoring results will act as one indicator of the effectiveness of
the new sewerage treatment system in improving the Ishdoo Island groundwater quality. The
proposed monitoring scheme of the groundwater quality is shown in the Table 10.13.
Table 10.13 Proposed Monitoring Scheme of the Groundwater Quality Parameters Frequency Location
Chloride, Nitrate, Ammonia, Phosphate, Salinity, COD, Total coliform, Faecal coliform
Once each in SW monsoon and NE monsoon season
One location each in Isdhoo, Isdhoo-Kalaidhoo and Health Centre area
10.6 Recommendations
Following are some recommendations in regards to the island harbours, causeways and sewerage
projects.
(1) Island Harbours
Although reconstruction of the island harbours are extremely important for to maintain its
function and the safety of the harbour users, the harbour users will experience some
inconveniences during the reconstruction works, which may last for several months. To minimize
these inconveniences, the contractor must fully cooperate and listen to the opinions of the
harbour users and adjust their construction methods whenever possible. The harbour users must

10-24
also acknowledge the situation and cooperate as much as possible with the contractor.
During the field reconnaissance in May 2005, the Study Team has noticed various wastes such as
plastic bottles, dead fish and household garbage inside some of the harbours and along the coast.
Uncontrolled dumping of these wastes is aesthetically unpleasant and could also lead to water
pollution. Clean up of these wastes are strongly recommended and to prevent further littering,
awareness campaigns should be implemented towards the harbour users.
(2) Causeways
Reconstruction of the causeways is extremely important for the local people and industry, and
must be conducted as soon as possible. Despite its urgency, consideration to the natural and
social environment must also be taken since the scale of the reconstruction is large. Uncontrolled
construction activities could lead to devastating impacts on the local environment. Therefore, the
contractor is requested to implement appropriate mitigation measures and monitoring.
(3) Sewerage
Certain level of environmental impact is expected during the construction and operation phase,
such as noise, groundwater seepage, and odor and so on. Therefore appropriate environmental
mitigation measures should be employed, then all these impacts will become minor or negligible.
Maintenance during the operation phase is vital for the new sewerage treatment system to be
functional and effective. With appropriate management and maintenance the sanitary conditions
of the island and the local environment should gradually improve.
One of the major objectives of this project is to improve the contaminated local groundwater
quality. Therefore environmental monitoring of the groundwater quality is recommended during
the operation phase of the project.

11-1
CHAPTER 11 ECONOMIC AND FINANCIAL CONSIDERATIONS
11.1 Introduction
This chapter discusses medium to long-term consideration in terms of economic and financial
perspectives. The country must acknowledge its position to correctly draw the future course of
reconstruction and development strategy.
First, the economic situation will be compiled and analyzed, including the recovery of the major
economic sector, trade and fiscal balance, and debt position. Then, preliminary economic and
financial analysis will be conducted, based on which, recommendations will be made on the
proposed projects on the SAPROF list. Finally, general recommendations for further
reconstruction and development of the country will be made.
11.2 Present Conditions of Economy in the Maldives 11.2.1 Review of Macro Economic Performance
In general, the Maldives has enjoyed a high economic growth path in recent years under its
political stability. The 2003 GDP at the market price accounted for 8,382 million Rf. or 655 million
US $1.
The economy in the Maldives is composed of the primary (9.8% of the total GDP in 2003),
secondary (15.5%) and tertiary sectors (78.7%). The primary sector mainly comprises agriculture
(2.6% of the total GDP in 2003) and fisheries (6.6%). The secondary consists of manufacturing
(8.3%), electricity/water supply (3.6%), and construction (3.6%). The tertiary consists of
wholesale/retail (4.1%), tourism (32.7%), transport/communications (14.2%), financial services
(3.4%), real estate (7.5%), business services (2.9%), government administration (12.0%) and
education/health/social services (1.9%). Apparently, the engine of the country’s economy is
tourism, and the trickle down effect leads to a growth of other sectors such as construction,
wholesale and retail, and transport and telecommunications.
The annual GDP growth rate for the past several years were very high, and has never reached
zero or minus. The primary sector, fisheries and agriculture, however, has lost its weight in the
economy gradually. On the other hand, the secondary sector shows a steady increase in the share
of the economy. The tertiary sector has remained almost unchanged for the past several years.
These facts combined may indicate that the economy has been moving toward more
service-oriented economy and that more labour force has been absorbed in the service industries.
1 Ministry of Planning and National Development, Statistical Yearbook of Maldives 2004, pp.313-315.

11-2
The major export commodities are marine products, apparel and clothing. Marine products
include fresh and chilled tuna, frozen fish, dried tuna, and canned fish. The main destinations are
USA, Thailand, Sri Lanka, Japan, and UK. On the other hand, the country imports almost all
products from Singapore, Sri Lanka, India, Malaysia, UAE, etc.
Looking back to the immediate past of 2004 in comparison with 2003, the following observation
may be made.2
Macroeconomic developments in the domestic economy continued to accelerate during 2004.
According to estimates released in mid December 2004, a real economic growth accelerated to
8.8 % during 2004, after a growth of 8.4 % in 2003, largely owing to the growth in the tourism
and construction sectors.
The tourism sector is the major source of fiscal revenue and foreign exchange earnings into the
country. During 2004 the sector accounted for 34 % of GDP. The number of tourists who visited
the country registered more than 9 % increase at the end of 2004, totaling 616.7 thousand
tourists. Similarly, tourist bed nights also recorded an increase of 9 % during 2004. The total
number of beds in the tourist resorts was (on average) less by 58 beds against 2003, while the
number of resorts in the country remained at 87 as in the previous year. Meanwhile, the average
annual capacity utilization rate rose to 84 % in 2004 compared to 77.2 % in 2003.
The fisheries sector remains important to the country’s economy both in terms of employment
and exports. The value added to the sector is estimated to have registered 2 % in 2004, with the
total fish catch registering 148.5 thousand metric tones during the year. Meanwhile, earnings
from fish exports registered a 22 % increase in 2004, while the volume increased by 8 % with the
frozen tuna comprising 77 % of total fish export volume and registering 11 % growth during the
year. Meanwhile, the total volume of canned fish and dried fish exports (each accounting for
around 10 percent of total fish exports) increased by 2 %, while earnings from these products
increased by 10 % and 7 % registering 13.4 million US$ and 11.6 million US$ respectively.
The expansion in the tourism sector has meant that transport and communication activities have
increased significantly in recent years, with the sector contributing to about 15 % of GDP in 2004
and registering an annual growth of 13 % during the year. The construction sector also grew in
2004 by 28 % with developments by both the private and public sectors. The wholesale and retail
trade contributed to around 4 % of GDP and grew by 5.4 % in 2004 after a 4.3 % growth in 2003,
reflecting the positive developments in the tourism, fisheries and construction sectors.
2 The following is a summary of Overview of Economic Developments During 2004, based on the information as of 20th April 2005 by Maldives Monetary Authority (http://www.mma.gov.mv/red.php)

11-3
With reference to the domestic price developments, with the rise in oil prices as well as domestic
fish prices during the year, the inflation rate (measured in terms of changes in Consumer Price
Index, excluding food) stood at 3.9 % in 2004 following a negative 2.5 % in 2003.
The total employment in the economy stood at 86,245 according to the 2000 census, which was a
29 %t increase from the 1995 census. At the end of 2004, the total public-sector employment
stood at 26,242 and increased by about 8 % from 2003. In the private sector, demand continued
to be high in the labour market. While detailed employment statistics are not available on an
annual basis, expatriate employment data indicates that the number of foreign workers in the
country increased from an average of 32,459 workers in 2003 to 36,116 workers in 2004,
reflecting an 11 % increase during the period. Of such workers, 27 % were employed in the
tourism sector, 20 % in construction, 12% in the business activities sector, and 7 %uction
industry.
On the fiscal front, the overall budget deficit declined from 3 % of GDP in 2003 to 2 % of GDP
during 2004. The total revenue grew by 12 % during the year, reflecting the favorable economic
developments. Of the tax revenue the tourism tax increased by 15 % while the import duty
increased by 38 %. Meanwhile grants received during year 2004 continued the declining trend.
On the expenditure side, growth in total expenditure and net lending moderated to 5 percent in
2004, after registering a growth of 9 % in 2003. Current expenditure, accounting for 75 % of total
expenditure and net lending, grew at an annual rate of 13 % in 2004 while capital expenditure
declined by 9%, largely reflecting the winding down of some key infrastructure projects in 2003
including the first phase of the Hulhumalé Development project. About 51 % of current
expenditure and 36 % of capital expenditure during 2004 were spent on social services, while
economic services accounted for 6 % of current expenditure and 40 % of capital expenditure. The
budget deficit narrowed by 43 % during 2004 from 300.3 million Rf. in 2003 to 170.1 million Rf. in
2004. As in 2003, the deficit was financed entirely by foreign project assistance.
On the monetary accounts, total domestic credit of the banking system reached record high levels
during 2004 having increased by 32 %. This was largely due to the high growth in credit offered
to the private sector by commercial banks, which registered 58 % increase during the year
following a 7 % growth in 2003. Of the credit extended to the private sector, 58 % was extended
to tourism, 21 % to commerce and 7 % and 6 % to agriculture and fisheries sectors respectively.
Credit to the public sector, meanwhile, declined by 26 % during the year. With the favorable
developments in the economy, the net foreign assets of the banking system also registered an
improvement of 29 % with rapid increases in the foreign assets of the Maldives Monetary
Authority or MMA (27 %) as well as the commercial banks (30 percent). Consequently, the
dollarization ratio (ratio of foreign currency deposits to broad money) stood at 55.5 % at the end
of 2004 compared to 51 % at the end of 2003. As a result of these developments, total liquidity of
the banking system increased by 33 % during the year.

11-4
According to balance of payments estimates in December 2004, the current account deficit
worsened in 2004, largely on account of the estimated 31 % growth in merchandise imports while
merchandise exports increased by 13 % during the year. However, the net service inflows are
estimated to have increased by 22 % during 2004, with around 19 % growth in tourism receipts.
Owing to the large amount of remittances by the expatriate labour force working in the country
during the year, the transfer account continued to register a deficit. In the capital account, official
flows reflected a decline of 19 %t; however, with significant private sector investment activities
during the year, private capital flows are estimated to have increased during the year. The overall
balance of payments was positive in 2004 resulting in a strengthening of the gross international
reserve position during the year. However, given the large increase in imports, reserves in terms
of import cover was estimated to be equivalent to 3.8 months of imports at the end of December
2004, as opposed to 4.1 months at the end of December 2003.
As regards to the exchange rate, the Maldives continued to maintain a pegged exchange rate,
with the Rufiyaa pegged to the US dollar at a mid rate of 12.80 Rf. per US$, with a spread of 10
Laaris between the buying and selling rates. As a result, the Rufiyaa depreciated against most
foreign currencies during the year along with the weakening of the US dollar.
11.2.2 Social and Other Dimension
The Maldives can be regarded as a politically- and socially-stable country if compared with other
developing countries. And it has enjoyed its fruit of high economic growth for the past decades.
The government administration system is well organized and well coordinated among ministries
and organizations. The government ministry is rather small, due to the size of the country, but
efficient, and the staff is relatively young, well trained and well motivated. In fact, a consensus of
donors long dealing with the government officials is that the Maldives is ranked high in terms of
governance.
The country is active in the international arena with diplomatic relation to more than 130
countries. It became a member of UN at the time of independence in 1965. It became a member
of the World Bank and IMF in 1978, and a member of South Asian Association for Regional
Cooperation (SAARC) or an organization of regional cooperation in South Asia in 1985. It also
holds a membership of the Commonwealth, the Colombo Plan, the Asian Development Bank
(ADB), and the Islamic Development Bank (IDB).
In connection with UN, in December 2004 the country has been recommended to graduate from
the category of LDC or low developing countries with the transition period of three years3. This
implies that the country will rely on less grant and more loans from now on.
3 This was made before tsunami so there will be a discussion on this: delaying the implementation or not.

11-5
Socially, the country has several unique features.
The country has a long history so the people of the country have several origins, but
nowadays is considered as Maldivians in total.
The official language is Dhivehi, but English is widely spoken and used including the
government document.
The islands and the population are widely spread, so the economic and social gap between
the capital and the islands in the atoll, or the urban and the rural areas remains large since
the independence to date.
The country divides itself into two: the resident islands and the resort islands. The latter is
exclusively kept for international tourists, and the former for the nationals.
The Maldives may be regarded as a young country since more than one-third of the population is
between 16 and 35 years of age. Although the population growth rate has come down quickly to
1.9% in 2000, the government must find places for work and places to live for the young
generations, who are moving to the urban areas.
The Maldives has a high literacy rate and is very enthusiastic about higher education. Due to the
recent development of ICT (Information and Communication Technology), the people can gain
access to ICT devices such as cable and satellite TV, mobile telephone and internet. Exposure to
foreign contemporary culture and world daily news is changing the life style of younger
generations from traditional way of life and value of their parents to “internationalized” way.
At the moment the labour market has a large gap between demand and supply of labour force.
This gap is filled with foreign labour of more than 30,000 (2002). The occupation varies from
workers to professionals such as doctors and teachers. On the other hand, it is said that 30,000
young people after school will look for jobs for several years to come. But it is apparent they can
not immediately take over the jobs which foreign workers do, thus, it is feared that
unemployment or half-employment may become a social issue, which may have to be solved by
the entire government sector in the years to come.
11.2.3 Impact of Tsunami
The tsunami had a major macroeconomic impact, much of which will become gradually realised
over the year of 2005 and later. The immediate estimate said that 470 million US$ or more than
half of the GDP worth damage had been made4. This does not include indirect effects such as
decrease in tourist arrival. The anticipated effects in 2005 include: a significant weakening in
4 The Joint Need Assessment, The World Bank, ADB and UN, February 2005, and MPND, National Recovery and Reconstruction Plan, March 2005

11-6
economic performance, with low real GDP growth (estimated at from 5-6% to 1 %5), a larger
current account deficit, and a widening of the fiscal deficit. The employment has been adversely
affected by the tourism downturn, the loss of fishing vessels and equipment, etc.
Especially, tsunami hit the high season of tourism so that decrease in tourism must adversely
affect commerce, restaurants, transport, and telecommunications as well. Thus, some estimated
that a loss of tourism revenues and fisheries exports amount to 160 million US$.
On Impact to Poverty
The country is not categorized into HIPCs or highly indebted poor countries. The World Bank-led
PRSP or poverty reduction strategy paper was drafted in 1997 and the targets on the paper were
already met till today6. For instance, before tsunami, the share of the absolute poverty of 15 Rf.
and less per day was down from 43 % of the population in 1997 to 22% in 20047. This is mainly
due to the high economic growth of the past 25 years and the government policies toward the
atoll development.
Although we do not have concrete figures at hand, it is feared that the number of absolute
poverty has increased after tsunami, in particular in the atoll area. 39 islands were affected, 14
severely damaged, 100,000 affected in total, 12,000 people left the residential islands, and 8,500
left home and evacuated in the island. Apparently, tsunami hit more on people with poverty.
Recovery and reconstruction efforts are now being made toward islands people, hence, toward
this poverty group.
11.2.4 Future Course of the Economy
The impact of the tsunami on economic growth will depend largely on the evolution of the tourism.
As of July 2005, there are indications that tourist arrivals may be rebounding more quickly than
previously anticipated. Table 11.28 shows figures of tourist arrival, bed nights, bed capacity and
occupancy rate in comparison of 2004 and 2005.
The first six-month of the year 2005 recorded a little more than half of the arrival in compared
with the same period of 2004. However, it is worth noting that every new month was better than
the previous month in terms of number of arrivals. The same holds for bed nights for the resort.
And it holds for the occupancy rates for the resort as well. However, the bed capacity of the resort
has been down by 20%, and has not yet fully recovered. It is encouraging to find that the average
5 IMF, Maldives Use of Fund Resources---Request for Emergency Assistance, February 2005 6 Ministry of Finance and Treasury is responsible for this, and commented so. 7 Comment from the security and livelihood economist of the World Bank monitoring poverty situation. 8 In the Table2, the frontier arrival means arrival by air. The figures are classified into two: resorts and hotels. As figures show, the recovery of hotels is quicker than that of resorts since the donor teams visited and stayed in the hotel. The stay by donor teams may have contributed to the average stay of 8 days during the initial three-month or so.

11-7
duration of the stay is above 8 days in the first six-month of 2005, and is unchanged with 2004. In
fact, most of the resorts did not sustain damages, and themselves had already repaired many of
the damaged resorts to date. The government of Maldives expects bed night capacity to recover
to almost 100 % by the end of 2005. Moreover, provided that the tourists keep coming back and
the number of bed capacity at the resorts is constantly increasing, the tourism income will no
doubt increase and pull the growth of other sectors as well.
The government will have a constant revenue sources as ever and even there is some more room
for raising the bed tax from the present 8 US$ a day per head to higher rate in the coming future.
Possible risks
The largest bottleneck, if any, will be a shortage of manpower fitted to a particular vacancy, which
may be filled by the foreign skilled labour as is done at present.
In the short run, there will be a so-called reconstruction demand for the tsunami-hit infrastructure.
The consumer price may rise9, and more domestic labour is employed. However, after the
reconstruction stage of three to five years, there will be expected to have a backlash, though
small, not large, to the economy.
The declining demand for construction, commerce and transport sectors may incur a short-period
stagnation to the economy. Despite the after-reconstruction effect, the economy will show again
the positive growth due to the relatively large share of tourism to the economy in the years to
come.
9 IMF projected increase in CPI to become 6.8 % in 2005, but back to as usual as 2.8 % in 2006.

11-8
Table 11.1 Major Economic Indicators
Estimate1995 1996 1997 1998 1999 2000 2001 2002 2003 2004 2005 2006 2007 2008 2009 2010
Macro IndicatorsGDP(US$mil) 400.5 450.4 508.2 540.1 589.2 624.3 625.1 640.7 690.8 753.1 828.4
Real Growth Rate 7.8 9.1 10.4 9.8 7.2 4.8 3.4 6.5 8.4 9.0 1.0 9.0 6.0 6.5 7.0 7.0CPI (Inflation, %) 5.5 6.2 7.6 -1.4 3.0 -1.2 0.7 0.9 -2.9 6.4 6.8 2.8 2.5 2.5 2.5 2.5Interest Rate (%) 5.5 3.5 3.0 2.5
Exchange rate (Rf/$) 11.77 11.77 11.77 11.77 11.77 11.77 12.24 12.80 12.80 12.80GDP pc (US$) 1,800 1,989 2,071 2,214 2,300 2,265 2,284 2,423 2,603 2,779
Fiscal IndicatorsFiscal balance -25.5 -19.0 -6.9 -10.5 -23.9 -27.4 -29.7 -32.9 -36.5 -33.5
Revenues (US$mil) 119.7 133.2 155.0 164.0 189.1 201.5 206.1 212.1 239.2 254.7 Expenditures(US$mil) 145.2 152.2 161.9 174.5 212.9 228.9 235.8 245.0 275.7 288.2
BP IndicatorsTrade Balance (US$mil) -150.8 -185.6 -217.3 -215.9 -262.4 -233.3 -236.0 -212.4 -262.3 -368.8 -498.7 -467.9 -492.6 -487.1 -530.6 -581.7
Exports(US$mil) 85.0 79.9 89.7 95.6 91.5 108.7 110.2 132.3 151.9 172.7 131.0 Imports(US$mil) -235.8 -265.5 -307.0 -311.5 -353.9 -342.0 -346.3 -344.7 -414.3 -541.5 -609.8
Non-trade Balance(US$mil) 156.1 201.1 218.0 232.4 234.6 238.8 244.2 251.7 311.1 375.5 234.8 376.0 437.1 506.8 593.0 691.9Public Capital Balance(US$mil) 24.8 17.3 6.6 14.6 5.2 -1.9 7.8 26.8 33.8 27.2 40.0Private Capital Balance(US$mil) 33.6 41.0 42.9 42.9 42.9 25.6 24.3 33.9 56.8 71.6 80.0
Statistical Errors(US$mil) -24.9 -7.1 12.6 -6.6 23.6 19.9 5.2 14.9 15.5 16.0Overall Balance(US$mil) 15.3 43.7 27.4 29.1 -7.2 -7.9 -21.4 39.8 74.3 24.5 -67.8
GDP raitio Fiscal Deficit(%) 6.4 4.2 1.4 1.9 4.1 4.4 4.8 5.1 5.1 4.2Trade Deficit(%) 37.7 41.2 42.8 40.0 44.5 37.4 37.8 33.2 36.7 35.1
Foreign Currency Reserves(US$mil) 49.3 77.6 99.7 119.9 128.5 124.1 94.3 134.5 161.0 205.1 205.1 208.8 236.1 240.7 266.1 323.9Debts (DT)
External Debts (US$mil) 172.2 177.2 178.1 200.8 212.9 211.6 209.8 259.0 280.9 316.6 395.5 482.0 563.8 610.9 646.8 678.7 Medium/long term Debts(US$mil) 151.6 163.7 165.3 184.7 185.6 178.0 181.3 223.1 264.3
Public External Debt(US$mil) 127.8 132.3 135.2 144.0 143.7 139.4 141.3 164.7 184.3 External Commercial Debts(US$mil) 23.8 31.4 30.1 40.7 41.9 38.6 40.0 58.4 80.0
Short-term Debts(US$mil)) 20.6 13.5 12.8 16.1 27.3 33.6 28.3 35.9 16.6 Debt Service Ratio(%) 3.4 3.2 6.9 3.8 4.4 4.8 4.8 4.6 4.0 4.1 5.9 5.0 4.6 4.5 4.3 4.1 Increase in Debts(%) 2.9 0.5 12.7 6.0 -0.6 -0.9 23.6 8.5 7.5
Note: Figures of 2004 is an estimate and figures from 2005 onward is estimated by IMF.
Actual Projection
Source:Ministry of Finance and Treasury, Ministry of Planning and National Development、Maldives Monetary Authority
11-8

11-9
Table 11.2 Tourist Arrival after Tsunami
year January February March April May June Jan-Junetourist arrival total
2004 61,861 59,692 63,855 55,396 42,197 33,832 316,8332005 18,747 29,391 35,742 29,714 25,309 22,590 161,493
growth% -69.7 -50.8 -44.0 -46.4 -40.0 -33.2 -49.02004 542 79 2,857 152 9 19 3,6582005 793 724 843 281 12 25 2,678
growth% 46.3 816.5 -70.5 84.9 33.3 31.6 -26.8
bed nights total2004 508,856 481,891 501,334 454,443 345,775 270,056 2,562,3552005 125,919 228,722 297,864 250,832 213,420 180,148 1,296,905
growth% -75.3 -52.5 -40.6 -44.8 -38.3 -33.3 -49.42004 13,311 11,547 11,305 9,312 8,235 7,254 60,9642005 9,664 8,843 8,992 8,512 7,609 6,756 50,376
growth% -27.4 -23.4 -20.5 -8.6 -7.6 -6.9 -17.42004 522,167 493,438 512,639 463,755 354,010 277,310 2,623,3192005 135,583 237,565 306,856 259,344 221,029 186,904 1,347,281
growth% -74.0 -51.9 -40.1 -44.1 -37.6 -32.6 -48.6
bed capacity average2004 16,088 16,212 16,252 16,422 16,168 15,468 16,1022005 12,788 12,440 12,802 13,322 13,038 12,814 12,867
growth% -20.5 -23.3 -21.2 -18.9 -19.4 -17.2 -20.12004 670 670 636 636 636 636 6472005 636 636 636 636 636 636 636
growth% -5.1 -5.1 0.0 0.0 0.0 0.0 -1.82004 16,758 16,882 16,888 17,058 16,804 16,104 167492005 13,424 13,076 13,438 13,958 13,674 13,450 13503
growth% -19.9 -22.5 -20.4 -18.2 -18.6 -16.5 -19.4
occupancy rate(%) average2004 102 106.2 99.5 92.2 69 58.2 93.82005 31.8 63.4 75.1 62.8 52.8 46.9 57.2
change -70.2 -42.8 -24.4 -29.4 -16.2 -11.3 -36.62004 64.1 61.6 57.3 48.8 41.8 38 54.72005 49 47.9 45.6 44.6 38.6 35.4 45.1
change -15.1 -13.7 -11.7 -4.2 -3.2 -2.6 -9.62004 100.5 100.8 97.9 90.6 68 57.4 85.92005 32.6 64.9 73.7 61.9 52.1 46.3 55.3
change -67.9 -35.9 -24.2 -28.7 -15.9 -11.1 -30.6
2004 8.4 8.3 8 8.4 8.4 8.2 8.32005 7.2 8.1 8.6 8.7 8.7 8.3 8.3
change -1.2 -0.2 0.6 0.3 0.3 0.1 0.0Source: Statisitics Section, Ministry of Tourism, as of July 2005
resorts
hotels
total
average duration ofstay(days)
total
resorts
hotels
total
frontier arrival
surface arrival
resorts
hotels

11-10
11.3 Preliminary Economic and Financial Analysis 11.3.1 National Development Plan
At the on-going Sixth National Development Plan 2001-200510, the followings are in focus.
(1) Economy
In the economic sphere, diversification of the economy is the key. In the fisheries sector, fishing
efforts shall be made not only on traditional tuna/skipjack, but also on exotic reef fish species.
Maintaining the quality of fish products is another importance so that the time of transport catch
to the nearby landing site is critical. When establishing a fish processing plant, transport from the
catch to landings must be speedy. To promote local indigenous fishing, landing facilities like small
jetties and ports are no doubt important as well. To promote local agriculture, transport time
between suppliers and markets is very important. Likewise, to develop local food processing
industries, the means to transport the product to the major market is indispensable.
(2) Infrastructure
The country aims at a comprehensive sea and sky network connecting all atolls. Thus,
rehabilitating the transport facilities must contribute to fostering economic and social
development in growth centers, and must be in line with the on-going National Transport
Development Plan. At the Plan, a National Transport Master Plan is supposed to be formulated.
The Plan would include:
The development of a transport grid involving air, sea and land transport services
The development of international airports to integrate and sustain activities in the larger
national arena
The development of Male commercial harbor and the regional ports to cater to the
development needs of the country
The development of inter-island transport networks by air and sea with special emphasis on
realizing synergies
The development of sustainable and efficient intra-island transport networks, taking into
consideration the increasing demand for motor vehicles, sea-based vessels and pollution
The harmonization of transport system with the growth of the tourism sector
In line with this policy, the government would invite private sectors.
Develop the transport grid as a viable and profitable business venture with involving the
private sector. The approach is necessary to increase private sector participation in the
economy, promote economic diversification, and for the grid to be sustainable in the long
run.
10 MPND, Six National Development Plan 2001-2005, second edition (reprint), 2004

11-11
Develop the grid as a network of individual operators who can manage their own operations
by sea, air, land or mixed, to serve niche markets.
Water and sanitation is another importance at the infrastructure aspect. The Plan states to
provide adequate water supply, sanitation, and safe and environmentally sound management of
sewerage and solid waste disposal facilities to all islands with the strategies as follows.
Formulate a plan to provide safe water, sanitation, and waste disposal to all islands with
defined needs and priority actions.
Develop a national waste management strategy and facilitate its enforcement.
Encourage and facilitate private sector to become more involved in providing sanitation and
wastewater management services.
Promote the inclusions of sanitation issues not only in planning health services but also in
planning and provision of education, infrastructure development and construction activities.
Promote land use planning to protect fresh water aquifers.
Continue to raise awareness regarding personal hygiene and good sanitation practices,
including the safe use of latrines.
Continue to raise awareness on solid waste management
Promote use of cleaner technologies and encourage safe use and disposal of hazardous
materials.
Identify, and promote sustainable systems that are appropriate for small islands for water
production and distribution, sanitation and waste management.
Develop and enforce guidelines and operational procedures for sewerage projects.
(3) Social Aspect
Of course, the Vision 2020 pronounces equitable access of all the people to basic utilities and
services such as education, health care, potable drinking water, electricity and essential consumer
goods. In order to do so, the means of transport at minimum level covering all the atolls is
necessary. Providing all islands with the basic infrastructure for the development of social and
income generating activities is a must.
From July to October 2005, Ministry of Planning and National Development will review the
on-going Plan together with the ADB consultants, and based upon that and adding the tsunami
reconstruction, it will make a new Seventh National Development Plan 2006-2010 toward the end
of this year, 2005. It will not be an easy task to review the achievement of the planned targets
since the targets in the Sixth Plan are not quantified and the unexpected negative impact of
tsunami is given. However, considering that the poverty is more severe in atolls and that the atolls
were more hit by tsunami, it is certain that more weight shall be given to atoll development, social
and economic, at the coming Seventh Plan.
11.3.2 Atolls Situation

11-12
(1) Two Atolls before Tsunami
Laamu Atoll with a population of 11,588 (as of 2000 Census) has 12 inhabited islands11. Fonadhoo
Island with a population of 1,740 is the capital island, where there are diversity of industries such
as agriculture, business, masonry, retail shops, fast food shops and pharmacy. The largest island
is Gan, having a land area of 516.6 hectares and population of 2,244. Isdhoo Island with a
population of 1,432 is where sewerage system may be planned. The other islands have very
similar characteristics: small number of population with indigenous fishing. Lammu Atoll has an
airport in Kaddhoo, which connects to Male’ in 45 minutes flight.
Thaa Atoll has a population of 9,305. The capital island is Veymandhoo with a population of 763.
Agriculture, carpentry, small business and masonry are the main industry in this island. Vilufushi
Island with a population of 1,155, has a variety of industries such as shipping, rope making,
sewing, thatch weaving, carpentry, and masonry. Dhiyamigili Island with a population of 484 has
rope making, masonry, carpentry, shipping, and agriculture. Hirilandhoo Island with a population
of 759 has sewing, small business and boat building. Guraidhoo Island with a population of 1,433
has small business, shipping in addition to fishing. The other islands have more or less similar
characters: the economic activities are more or less centred around indigenous fishing.
The two Atolls seldom have employment in hotels and restaurants since they do not have any
resorts12. They are engaged in fishing (2 persons out of 10 labour force), community and social
services (2 out of 10) and manufacturing (1.5 out of 10).
In summary, these two Atolls show the character of typical non-resort atolls, though Laamu Atoll
has potentials for resorts. Also there is good room for fisheries and agriculture development
catering for the in-atoll resort. There may be a potential in Thaa Atoll as well. In fact these two
atolls are important in terms of development policy of the country. Vilufushi Island of Thaa Atoll is
a first priority –safe and host island. Gan of Laamu is a first priority -safe and host island.
During the course of the 6th National Development Plan, some progress was made to minimize
diseconomy of scale through resettlement of small communities in small islands to larger islands
that can provide public services at a reasonable cost. Although this task is admittedly politically
sensitive and has to be handled with considerable caution and care13, things must be going on in
a continuous manner. In this context, development of two atolls is among the top priorities.
(2) Tsunami Damage to Two Atolls14
Apparently, the area was one of the most extensively damaged by the tsunami. Thaa Atoll of
8,513 populations in mid-2004 recorded 16 deaths and 3 missing, and 563 damaged buildings. 11 Information obtained from the web site of Ministry of Atoll Development 12 The one resort will be open in 2005 at the Laamu Atoll. 13 MPND, 6th NDP 2001-2005, p.3 14 The information for this section is from the web site of Maldives Disaster Management Center, MDMC.

11-13
Laamu Atoll of 11,318 population recorded 22 deaths and 3 missing, and 285 damaged buildings.
At the national level of 270,101 populations, 82 deaths, 26 missing, and 3997 building damage
were recorded. Therefore, the share of Thaa Atoll on human casualty was 18% of the country,
and Laamu, 23%. The share of physical damage was 14% and 7%, respectively. So the two atolls
were among the most-hit atolls, especially in terms of human casualty.
Besides, 5 islands do not have unusable administration facilities in the Thaa, and 3 islands do not
have unusable administration facilities in the Laamu. In addition, two atolls have considerable
damages to the mosques, schools, health posts and beaches.
It is not an easy task to estimate the damage of the two atolls in terms of value. To obtain some
idea on the damage made to the two atolls, we have made make several assumptions.
The damage to house is relatively well compiled, which will be employed to get an extent of
the total damage in all sectors.
The total damage assessment of 197.9 million dollars, is based on the National Recovery and
Reconstruction Plan (NRRP) in March. However, the damage to tourism is not counted.
Indirect damage is not counted, either.
We also assume that the damage to all sector is proportional to that to housing sector, since
the community comprises not only from houses, but also roads, ports, schools, health posts,
water and sanitation facilities, fishing vessels, electric power generators, etc.
The damage is estimated at 42 million dollars for Laamu Atoll, and 28 million dollars for Thaa Atoll.
The percentage is 21.5 % and 14.2 %, respectively (refer to Table 11.3).

11-14
Table11.3 Damage Estimated by Atoll
Population (mid 2004)
Buildings damaged
Damage in percent
Gross damage in value
(million US$)
Order in damage
National 270,101 5,207 100% 197.9 Atolls Haa Alif 13,733 94 1.8% 3.57 Haa Dhaal 17,141 86 1.7% 3.27 Shaviyani 11,807 276 5.3% 10.49 6Noonu 10,044 206 4.0% 7.83 Raa 15,331 693 13.3% 26.34 3Baa 9,344 78 1.5% 2.96 Lhaviyani 8,158 77 1.5% 2.93 Kaaf 8,458 276 5.3% 10.49 6Alif Alif 4,995 93 1.8% 3.53 Alif Dhaal 7,063 27 0.5% 1.03 Vaavu 1,580 156 3.0% 5.93 Meemu 4,845 567 10.9% 21.55 5Faafu 3,864 0 0.0% 0.00 Dhaalu 4,939 569 10.9% 21.63 4Thaa 8,513 741 14.2% 28.16 2Laamu 11,318 1118 21.5% 42.49 1Gaaf Alif 8,187 123 2.4% 4.67 Gaaf Dhaal 10,505 27 0.5% 1.03 Gnaviyani 7,645 0 0.0% 0.00 Seenu 17,980 0 0.0% 0.00
Note: The Study Team estimated from data of MDMC as of April, and TRRF, as of March, 2005. Since there were no official
figures of damage value by atoll, we used the percent of building damages as that of the total damage in each atoll.
(3) Challenge after Reconstruction
Owing to the on-going reconstruction effort, re-building houses will be moving, and debris is
being removed from the residential center. Internally displaced people (IDP) will return to the
original places or move to new sites within several years.
However, in the long run, the area has a serious challenge, that is, how to sustain the
reconstruction and development by themselves. Thus, we may need a regional development plan,
which may include the following elements:
1. Development of near-by resorts, which can absorb the local workforce, and the resort can be
a major market for various local products.
2. Development of high-quality fisheries and agricultural products catering for such resorts.
3. Development of major industries includes fisheries, tourism, and agriculture, which may
sustain even after the tsunami recovery, not necessarily to depend on the public works.
The biggest issue of the Atolls is scarcity of employment opportunity. There are no major
industries to absorb the large numbers of young population except for the fish factories.

11-15
(4) Impact of the Proposed Projects
The economic impact of the proposed harbor projects in the Laamu and Thaa Atolls are as
follows:
1. The residents of each Atoll can commute to the public facilities, such as school or work places
at lower cost and less time.
2. The commodities can be transported in and out with much ease and less expenses.
3. The harbor will have more front landing space, thus the handling capacity will increase.
4. The fishing vessels will be more active by utilizing the rehabilitated harbor.
5. The external assistance, if continues, can be easily accessed to the damaged site.
6. The last but not the least, future disasters can be contained with the rehabilitated harbor and
other facilities.
The following indirect but positive effects to the atolls are worth consideration. With rehabilitated
infrastructure, two atolls, by making a full use of closeness to the Kadhoo airport, which is only a
45-minute flight from the capital Male’, may be able to further develop resorts and resort-related
sectors such as agriculture, handicrafts, etc.
In case of the sanitation projects in the Isdhoo Island in Laamu, the following direct and indirect
impacts can be expected:
1. The people can live in more hygienic living environment.
2. The surrounding natural environment will be kept clean.
3. This can be a model project for the entire country since the concern over sanitation surely
will have to be needed to tourism-led countries like Maldives in the future.
In case of sanitation, greater care for the operation and maintenance will be required compared
to the harbor reconstruction. Therefore institutional and organizational arrangement might be
necessary together with the so-called hard-infrastructure.
11.3.3 Project Selection Criteria for SAPROF
The SAPROF team has proposed a list of subprojects to be implemented with the counterpart of
the government.
The general criteria 15are as follows.
15 For this section, the following is a reference document: ADB, Report and Recommendation of the President to the Board of Directors on a Proposed Loan and Grant to the Republic of Maldives for the Tsunami Emergency Assistance Project, March 2005.

11-16
1. The subproject rehabilitates or restores damaged infrastructure and facilities caused by the
tsunami.
2. The subproject is technically feasible, cost-effective, and represents a least-cost alternative.
3. The subproject incorporates beneficiary consultation.
4. The subproject shall be completed within the reconstruction period of three years.
5. Another agency or the government does not finance the subproject.
6. The subproject is prioritized on the basis of their social and economic direct impact.
7. The subproject is in compliance with the government environmental requirements, and JBIC
environmental guidelines.
8. The subproject is not expected to involve any involuntary resettlement.
Moreover, the criteria to select sewerage projects are as follows.
1. Consultation with affected communities
2. Providing opportunities for local community participation in reconstruction works, and further
involvement in operation and maintenance
The criteria for the selection of the port projects are as follows.
1. Providing short-term reestablishment of public services
2. Contributing significantly to reconstruction operations
3. Contributing significantly to reestablishment of safety in economic operations including
fishing, maritime transport and tourism
4. Providing opportunities for local community participation in reconstruction works
11.3.4 Candidate Projects
The SAPROF team composed of port and sewerage engineers, has compiled in late June the list of
sewerage and port projects, which may be JBIC-financed16. The sewerage and port projects are
all in line with the criteria, and requested by the government as of May 2005.
Donor coordination
When selecting candidates, one more consideration is on donor coordination. The list proposes 13
harbor projects plus Male’, and 9 sewerage projects.
The list of harbors fills in the 5 gaps, implying that Japanese side has largely met the needs of
Maldivian side. Four projects are supposed to implement by Japan NPGA. According to Table 11.4
as of May 2005, a harbor project at the Hinnavaru is supposed to implement by UNDP. However, it
is reasonably assumed that the donor has been changed afterward. There are a few donors,
16 This list may be re-assessed in the future course of events by the government and JBIC headquarters.

11-17
which are committed to the sewerage sector.
From donor coordination points of view, it seems well coordinated to the islands of heavy damage.
For instance, at the Filladhoo Island, HA, UNICEF does primary school, GRC does health, the
government does housing, IFRC does water, and Japan does sewerage.

11-18
Table 11.4 Donor Projects by Atoll
SAPROF Atoll Island Primary School
Health Physical
Facilities (Rf)
Health Equipment and Furniture (Rf)
Health Consumables
(Rf)
Housing Repair
Housing Reconst.
Diesel. Plant
Water Collection/
Distribution Sewerage Jetty Harbour Livelihood
Community Centre
Island Office
S HA DHIDHDHOO - - - Japan NPGA / GoM
- IFRC - Gap
S HA Filladhoo UNICEF Gap (HP) GRC (HP) 269,532.91
GRC Japan NPGA / GoM
GoM UNICEF IFRC - -
S HA Baarah - - - Japan NPGA / GoM
GoM IFRC - -
S HDh Nolhivaranfaru UNICEF - - - GoM GoM IFRC Turkey - H HDh Makunudhoo - - - - - - - Gap H Sh Maaugoodhoo - - - - - - - -
S,H Sh F0NADHOO - - - - - - - Gap H N Lhohi - - - - - - - - S N MANADHOO - - - - - - - Gap H Lh Hinnavaru - - - Japan
NPGA / GoM
GoM Singapore Govt.
IFRC UNDP UNDP
H B Thulhaadhoo - - - - - UNICEF - Gap Gap S B EYDHAFUSHI Gap? Gap? Gap? UN
(ECHO) UN (ECHO) UNICEF IFRC UNDP UNDP
H K Maafushi UNICEF (E&T Centre)
GoM Gap WHO UN / GoM IFRC IFRC IFRC - Gap
H Th Hirilandhoo Gap (HP) Gap WHO - - - - Japan NPGA
H Th Guraidhoo - - - Japan NPGA / GoM
- UNICEF IFRC Japan NPGA
Japan NPGA
S ADh Maamigili - - - - - - - - S M Muli UNICEF GRC (RH)
19,968,222.92GRC GRC UN UN OXFAM IFRC - UNDP? HPL
Singapore?
H L Isdhoo-Kalaidhoo UNICEF Gap (HC) UNFPA UNFPA Japan NPGA / GoM
BRC UNICEF IFRC JNPGA - Japan NPGA
BRC
H L Kalhaidhoo UNICEF Gap (HP) Gap WHO - - NR/ New house - - H L Fonadhoo - - - Japan
NPGA / GoM
BRC IFRC JNPGA - Japan NPGA
BRC JNPGA
H GA Dhaandhoo UNICEF - - - Japan NPGA / GoM
UN UNICEF IFRC - Gap
Note: The original matrix was provided by MPND as of May 2005. The sector, which has blank column, is removed from the original table. The capital Male is removed as well. S stands for sewerage project, and H stands for harbor project of SAPROF.
11-18

11-19
11.3.5 Debt Sustainability
(1) Statistics
Statistics on external debt comprises medium to long-term government and government
guaranteed borrowings plus short-term borrowings of the banking sector. Total public and
publicly guaranteed external debt stock (disbursed and outstanding) remained at around 40
percent of GDP in both 2003 and 2004. In absolute levels this amounted to 289.5 million US$ in
2003 and had increased by 7 % to 310.1 million US$ at the end of 2004. Of this total, around
94 % was on medium and long-term debt. Borrowings from multilateral and bilateral sources
constituted two third of the medium to long-term external debt portfolio and grew by 4 % on
annual terms. The remaining 33 % comprised suppliers’ credits and commercial loans, which
increased by 11 % during 2004. Meanwhile, short-term debt, which reflects the foreign liabilities
of commercial banks, comprised over 7 % of the external debt stock and registered an increase of
22 % at the end of 2004. Disbursements of medium and long-term loans during 2004 stood at
47.6million US$, while amortization was recorded at 20.4 million US$, and interest payments
amounted to 5.7 million US$. Total debt service therefore totaled 26.1 million US$ in 2004,
equivalent to around 4 % of Maldives’ exports of goods and non-factor services17.
(2) Government Debt Practice and Monitoring Mechanism
Having stated above, the government practices borrowing money for the development projects
from the multilateral development banks such as ADB and the World Bank, and the short-term
loan from commercial banks, and the remaining gap is filled with the cash supply from MMA or
Maldives Monetary Authority18.
The debt balance is considerable as stated above, however, the repayment to the loan is well
managed with no record of the arrears so far. In addition, the Ministry of Finance and Treasury
(MFT) pronounce to the donor community that they are very cautious to the further increase in
loan portfolio. And ADB assisted in 2005 the capacity building of the debt management unit of
MFT to monitor by themselves the inflows of debt and the outflow of debt repayment for the
future.
The MFT has now the unit, which was trained by ADB-funded consultants to manage the debt
balance with the software of CS-DRMS19, or the Common Wealth Secretariat-debt record and
management system. In short, donors may put high credibility to the debt management of
Maldives.
(3) Debt service ratio (DSR)
17 This is a summary of Overview of Economic Developments During 2004, based on the information as of 20th April 2005 by Maldives Monetary Authority (http://www.mma.gov.mv/red.php) 18 MMA is the central bank with the authority of issuing the currency. 19 Common Wealth Debt Record and Management System, which is a software widely used to monitor the debt balance.

11-20
Usually, when looking at risk of lending loan to the other country, the typical indicator of assessing
risk of arrear or default is debt service ratio (DSR), that is defined as the amount of annual
repayment as numerator over the amount of foreign currency earnings of the year as denominator.
In case of Maldives, the denominator is the exports of tuna-products and others, plus the
revenues from tourism. In case of Maldives the denominator is very large compared to the
numerator. This implies that the country can easily repay the annual repayment to the creditors
Even if the country further borrows from the donors such as JBIC, the World Bank, ADB, and the
IDB, the DSR will not rise significantly.
(4) Risks
The repayment may encounter difficulty if a sudden negative change in macro economy, that is,
in revenues from exports and tourism occurs. And it is often said that a small country with open
economy is very susceptible to the sudden down turn in the world economy. However, the
recoverability of the small country is also high since the damage and population to be taken care
of is small. This seemed to be very much proved by the tsunami-incidence of this time.

11-21
Source: MOFT, etc.
Figure 11.1 Economic Growth
Source: MOFT, etc.
Figure 11.2 Fiscal and Trade Balance
Source: MOFT, etc.
Figure 11.3 Debt Position
Economic Growth 1995-2004
0
200
400
600
800
1000
1995 1996 1997 1998 1999 2000 2001 2002 2003 2004
GD
P(U
S$m
il)
0
2
4
6
8
10
12
real
gro
wth
rate
(%)
GDP Real Growth
Fiscal and Trade Balance1995-2004
0
100
200
300
400
500
1995 1996 1997 1998 1999 2000 2001 2002 2003 2004
(U
S$m
il))
revenue expenditure exports imports
Change in Debt Position, 1995 to2005
050
100150200250300350400450
1995 1996 1997 1998 1999 2000 2001 2002 2003 2004 2005
debt
bal
ance
(U
S$ m
illio
n
0%5%10%15%20%25%30%35%40%45%50%55%
rati
o t
o G
DPa
nd D
SR
External debt in totalRatio to GDP Debt Service Ratio

11-22
11.3.6 Financial and Economic Analysis
(1) Isdhoo Project
The sewerage project of the Isdhoo Island, Laam Atoll will be soon implemented on a Japanese
grant basis20. SAPROF team has compiled several candidates aside from Isdhoo. However, it is
uncertain at this moment of JBIC’s commitment on a particular project. Thus, in this section, we
attempt to conduct a sample study of a sewerage project in Maldives by utilizing the incoming
Isdhoo Island project. The project has the following economic and financial characteristics:
1. The capital cost is fully born by the donor, so the users have to bear only cost for anticipated
operation and maintenance costs.
2. According to the plan, the Island Development Committee (IDC) will manage the system,
and assign five persons to engage in daily maintenance.
3. Each household equally shares the running cost. The monthly sewerage fee to each
household is Rf. 64. Suppose the average expenditure of the low-income household is Rf.
3,500 per month, the fee amounts to 1.8% of the expenditure. This amount is not
considered to be very low, but affordable21.
4. Apparently, if the capital cost is counted, the project will have to charge Rf.245, or 19 US$ or
7% 22 of the average expenditure of the lowest income group to obtain around zero
percent of FIRR. The high fee rate is not realistic, thus the sustainability of the system will
not be guaranteed. This result reflects the difficulty of sewerage development in the rural
area, thus has low priority from the national economic point of view. Hence, the government
or the donor must bear the initial cost as is planned.
(2) General Discussion on Possible JBIC Projects
1) Sewerage projects
The list of sewerage projects and estimated costs are as follows (Table 11.5).
20 See the relevant chapter. 21 According to the social economic survey, which was conducted by the ADB technical assistance, 45% of the population
is willing to pay 2% of their income for improved sanitation.
22 Based on the same assumptions as those for SAPROF, EIRR is also calculated. To get a break-even, 6% of the expenditure is required.

11-23
Table 11.5 Project Cost of the Candidate Sewerage Projects by SAPROF Team (in US million)
Island Construction
cost Physical
contingencyEngineering
service Administration
costs Subtotal
1 Ha.Dhidhdhoo 1.908 0.191 0.286 0.057 2.442 2 Ha.Filladhoo 0.507 0.051 0.076 0.015 0.649 3 Ha.Baarah 0.992 0.099 0.149 0.030 1.270 4 Hdh.Nolhivaranfaru 0.472 0.047 0.071 0.014 0.604 5 Sh.Funadhoo 1.104 0.110 0.166 0.033 1.413 6 N.Manadhoo 1.351 0.135 0.203 0.041 1.729 7 B.Eydhafushi 1.399 0.140 0.210 0.042 1.791 8 Adh.Maamigili 1.960 0.196 0.294 0.059 2.509 9 M.Muli 0.596 0.060 0.089 0.018 0.763
Total 10.289 1.029 1.543 0.309 13.170
Project objectives
The objective of the above project is to improve living conditions and human well being in the
atolls of the Maldives. The project will improve sanitation practices in the future. The main
beneficiaries of the project will be the inhabitants of the islands.
General principles for financial and economic analysis
In general, the financial analysis of the project estimates the profit accruing to the operation
entity or the project participants. On the other hand, economic analysis will measure the effect of
the project on the national economy. The proposed project may be the case that it is focused on
an investment with unclear or longer-term benefits that are not easily identified. For example, the
monitoring of ground water quality over time and the impact to human health will not be easily
measured with no clear economic outcomes, but essential in the longer term for human health
and natural environment. The economic analysis will attempt to assess the overall impact of the
project on the economic welfare of all the member of the targeted society, and will measure the
positive and negative impacts of the project.
Economic and financial assumptions23
For this study, the following general assumptions are adapted.
All revenues, benefits and costs are expressed in mid 2005 prices.
The implementation period for the project is less than one year in 2005.
Inflation is not taken into account.
The project is analyzed for a period of 35 years or assumed project life.
The average 2005 official exchange rate of 12.75 Rf. per US$ 1.00 is employed in converting
foreign exchange costs to their local currency equivalent.
23 Asian Development Bank, Economic and Financial Analysis, Appendix14, RRP:MLB 33218, Report and Recommendation of the President to the Board of Directors on a Proposed Loan to the Republic of the Maldives for the Regional Development Project, Phase 2, Environmental, Infrastructure and Management, pp.55-71, April 2005. This report is a major reference for this section, unless otherwise noted.

11-24
Analysis is conducted in domestic price, expressed in Maldives Rufiyaa. Tradable goods and
services were converted into domestic prices by using the standard conversion factor or SCF,
which is estimated to be 0.924.
To simplify the calculation, all inputs for the initial construction and O&M are regarded as
imports, hence, the conversion factor is applied.
SAPROF team estimates the population covered by each in 2005.
Average household size in each is given by the 2000 Census.
The number of household is derived from dividing the population by the average household
size.
We take 35 Rf. as the monthly fee unit, which approximately represents 1% of the monthly
average expenditure of the lowest 20 % income of households. And we assume the
collection rate is 100% since the community members themselves operate the system.
Annual O&M cost is set at one percent, based on the Isdhoo case.
There is a wide range of economic and social benefit including aspects of environment, water
resources, health, institutional development, employment, direct and indirect, and gender.
However these aspects are not quantifiable or take too much time to collect, even not
impossible. The benefit is only measured by the amount of fees25. This is the limitation of this
analysis.
Results of financial and economic analysis
Since the project is on sewerage sector in the rural area, the financial analysis shows unfavorable
results. In order to obtain a break-even at FIRR, that is, avoid negative value of the project, the
project will have to charge at least a fee of 4% to 8% of the average expenditure of the
lowest-income household. This is very unrealistic. Moreover, for FIRR to get a level of opportunity
cost of capital in this country26, which is usually the decision making point of the project, the
project will have to charge double or triple of the above rate.
As for the economic analysis, although the cost of initial and O&M is lower with the conversion
factor, the figures derived do not change much with those of FIRR, perhaps due to the fact that
economic benefit, to be generated from the project, cannot be quantified (refer to Table 11.6).
Affordability and Sustainability
The social objective for tariff formulation is to ensure that all members of the community are able
to afford access to clean water supply and to waste water disposal services without excessive
burden on their expenditure. Thus, the tariff structure needs to be designed so that full
cooperation from the less-income household can be obtained.
In principle, to implement waste water services it is necessary to consider this in the context of 24 The simple estimate formula is as follows. SCF=(Import+Export)/((Import+Import Duty)+(Export- Export Duty)). We have computed it using 2004 data. 25 We do not compute so-called consumers’ surplus, either. 26 ADB estimates 12%, and the on going lending rate at private sector is 8-13% as of June 2005.

11-25
affordable tariffs not exceeding 5% of the household income for water supply, waste water
disposal, etc.
To measure the affordability or ability to pay, we focus on the bottom 20 % income group. Based
on the Year 2000 Census, we assume the monthly average expenditure/income of the lowest
income group as 3,500 Rf.27. Thus, 1% is 35 Rf., and 2% is 70 Rf.. Apparently, to make it
sustainable, the project will charge only annual O&M cost to the community. If so the community
may afford to pay for the cost28. With the simple calculation the fee ranges from 1.1% to 3.2% of
the average income of the lowest-income household. The community may be able to pay in case
of 1%, but not easy in case of 3%.
Table 11.6 Summary of Proposed Fees
Island Fee level to get
zero FIRR Fee level to get
zero EIRR Fee level to cover
O&M 1 Ha.Dhidhdhoo 5.0% 5.0% 1.3% 2 Ha.Filladhoo 4.0% 4.0% 1.1% 3 Ha.Baarah 6.0% 5.0% 1.4% 4 Hdh.Nolhivaranfaru 7.0% 6.0% 1.7% 5 Sh.Funadhoo 7.0% 7.0% 1.9% 6 N.Manadhoo 8.0% 8.0% 2.1% 7 B.Eydhafushi 6.0% 5.0% 1.4% 8 Adh.Maamigili 8.0% 7.0% 3.2% 9 M.Muli 7.0% 7.0% 2.1%
Reference L.Isdhoo 7.0% 6.0% 1.8%
Note: 0ne percent of the average income of the lowest-income household is assumed at Rf.35. This table indicates the
level of the burden to the household.
2) Economic Consideration for the Port Projects
Maritime transport sector29
The country has about 90 man-made harbors with quays, basins and breakwaters. And there are
natural harbors, jetties, and approach channels to access inner atolls to service the 200 inhabited
islands as well. However, most of the islands lack proper facilities. More than half of the inhabited
islands indicate inconveniences in access. The reasons are improper harbor facilities, lack of
jetties, difficulties with lagoons or entrance channels, and adverse weather conditions.
27 MPND, Household Income and Expenditure Survey 2002-2003, The median income per person per day at the survey
year is 23 Rf. and average expenditure of the lowest 20 % group is at 17 Rf. per person per day in the atoll. At the site
island of the Isdhoo, the average household size is estimated at 6.8. Combining the above two, we will get the average
household income of 4,692 Rf., and the average household expenditure of the lowest 20% quintile of 3,468 Rf. For simplify,
we assume Rf.3, 500 as the benchmark level for this analysis. 28 ADB and World Bank requires for a portion of the construction cost borne by the community, which ranges up to 20%. It is usually paid through labour participation in the work. 29 ADB, World Bank, UN, the Joint Tsunami Assessment, February, 2005

11-26
Damage to the sector
According to the initial quick assessment, 36 jetties are reported to have some damage, a total of
19,200 meter length of quay walls and sea walls/breakwater lengths need repair and a total
volume of 520,000 m3 of harbor basin and approach channel dredging is considered necessary
due to sedimentation. The total cost of the damages is estimated at 24.45 million US$. Out of this,
the cost of immediate needs program for the transport sector would be around 2 million US$. The
medium and longer-term needs are estimated to be at 22 million US$30.
Number of vessels
The number of vessels registered in 2003 is 10,578, in which the number of dhonis are 7,154 and
others vessels 3,434. The 14 proposed harbour projects cover 9 atolls, which in total register
6,511 vessels (3,961 dhonis and 2,550 others). This covers 62% of the total vessels in Maldives
(55% of the dhonis, and 74% of the non-dhonis).
The dhonis or small vessels are popular and extensively used in the country. They carry 20-30
passengers from one port to another with a low fare, or carry daily necessities, or carry
passengers and cargos together. Hence, the safe or safer port is indispensable for the passengers
and cargos.
Justification to the projects
The local port project does not necessarily fit to the economic and financial analysis due to the
simple fact that benefit, although exists, cannot be quantified. The investment to the listed
projects is a large amount, however, to rehabilitate and upgrade the island harbour is critical in
social and economic development in the medium to long term. Hence, It is worth implementing
those, one by one. But projects with apparent high benefit relative to the cost shall have high
priority.
Economic Efficiency
The other consideration on the port reconstruction or development is efficiency of the investment.
When calculating given figures of the investment and the population of each island, that, the
potential users of the port, on an average of 11 projects we will invest 304 US$ per person. The
most efficient one is, no doubt, on the capital island of Male’ (17 US$ investment per person),
while the worst one is on the Th. Dhiyamigili (5,556 US$ per person). From the public investment
point of view, the projects with high efficiency shall have priority on the listed projects, in the
meantime projects with less efficiency may find an alternative way of implementation.
30 Assuming that insurance cover 50% of the damages to the Male Commercial Harbor and the International Airport.

11-27
Table 11.7 Project Costs, Population and Economic Efficiency
Island Estimated cost in
million US$ Population
Investment per person in US$
1 Hdh.Makunudhoo 3.7 1,308 2,829 2 Sh.Funadhoo 5.55 1,334 4,160 3 N.Lhohi 1.9 714 2,661 4 Male 1.26 76,350 17 5 K.Maafusi 3.41 1,169 2,917 6 Th.Hirilandhoo 0.44 932 472 7 Th.Dhiyamigili 4.2 756 5,556 8 L.Isdhoo 0.32 1,103 290 9 L.Kalhaidhoo 0.44 1,103 399 10 L.Fonadhoo 3.75 1,708 2,196 11 Ga.Dhaandhoo 1.83 1,675 1,093 Total 26.8 88,152 304
Note: costs and population are estimated by SAPROF as of June 9, 2005. The SAPROF team proposed 14 harbors, and
estimated the costs of the above 11 harbors.

11-28
11.4 Recommendations 11.4.1 Macro Economic Perspective
The country enjoys long-lasting political stability and economic growth. Although small countries
like Maldives have many external factors to impact the economy, the country has a capability of
quick recovery, thanks to the smallness itself, which was just proved during the course of recovery
from this tsunami disaster.
In addition, the government shows good governance and strong grips on fiscal management.
That is, to contain the government deficit below the manageable level. And the annual trade
deficit, not small, is well offset by an inflow of tourism revenues.
As for the debt management, the MFT has a capable unit to monitor the repayment schedule so
that the risks of arrears are almost nil from the creditors’ point of view.
The public sector, like any other developing countries, may need further enhancement in terms of
quality and quantity of public servants. This is well recognized among donor communities. Thus,
technical assistance will be continuously received from major donors such as ADB, the World Bank,
and UN agencies. This effort of capacity development for the public sector can be another
guarantee to donors if they, either by loan or grant, would like to implement a particular project.
We will not disregard the risks. When looking at internal issues, the country may face two
development issues: one is a large disparity between the urban and the rural, or the capital and
the atolls; the other is a little hope for new industries to earn foreign currency and to absorb the
young work force. Thus, the government policies for development must be in line with these two
objectives. Hence, the donor assistance must be coordinated with this government direction of
pro-equality and pro-industry/pro-employment.
The key is a speed, however. When the progress is slow, or is regarded so by the public in general,
a social uneasiness may occur, as is often the case in developing countries.
11.4.2 On Projects The two areas, that is, the Laamu and Thaa Atolls will be among the top priority to rehabilitate the
social and economic infrastructure such as public buildings, harbors, jetties, and causeways, etc.
The damage to these two atolls is significantly large, and hinders the daily social and economic
activities of the atoll residents. Thus, it is worth to do the rehabilitation.
By rehabilitating the port facilities at these atolls, the sea transport among the islands will become
safer, and more relied-on, and the fishing activities will become more active. And in the long run,
function of disaster prevention will be strengthened with the ports rehabilitated.

11-29
The preliminary economic and financial assessment for a planned sewerage at the Isdhoo Island,
the Laam Atoll, clearly concludes that the project is sustainable at an affordable user fee since the
construction cost is on a grant basis.
There is a list of SAPROF-proposed projects in both sewerage and harbor sector. For the sewerage,
we tried to calculate the FIRR and EIRR, based upon the assumption for the Isdhoo project. The
derived figures with assumptions are very pessimistic due to the obvious reasons that these are
social, not economic, projects in the population-sparse area. This suggests that the burden on the
community be only limited to the operation and maintenance cost during the course of the project
life.
Although the amount of investment in total to these projects will not be very small (13.17 million
US$ at an estimate by SAPROF team), it is worth implementing them after the initial recovery
stage. These projects will be financed by an extremely concessional loan, and will be in line with
the National Development Plan.
As for the harbour projects, we are unable to derive any calculated figures, since a difficulty in
quantify meaningful economic benefit exists. This is inevitably associated with the local islands
harbours. Although the total cost is not small (26.8 million dollars at an estimate by SAPROF
team), it is worth implementing one by one after the initial recovery stage. The finance shall be
made at an extremely concessional terms. And the construction of maritime transport network is
a priority on the on-gong National Development Plan and the incoming new plan, and the
Transportation Master Plan of 2004 (not finalised yet), most likely.
11.4.3 Recommendations
Since both side, more or less, agreed to the candidate sewerage and houbour projects for JBIC
concessional loan, at the implementation stage, both side shall further study the implementation
scheme with sustainability for each subproject.
Besides, in the medium to long run, donors may assist the counter part agencies of the relevant
sector, if requested, to fine-tune the existing development strategies, the guidelines, the relevant
laws, and the regulations, or to draft these if not available, not to mention that donors shall
upgrade capacity of the relevant organizations
Although JBIC is concerned about two sectors only this time, the other sectors such as emergency
telecommunication are as crucial as well. Apparently, the government runs public finance very
well so that the fund for hardware may be from the government, in the meantime so-called
“software of the system” including the organizational structure and relevant laws, may be assisted
by experienced donors, if requested.

11-30
Aside from this, in the long run, atoll or/and island development plan, although seems to exist,
shall be revisited to make it more realistic in order to ease the two gaps hanging over the
Maldivian society: the gap between the capital and the islands, and that between the job
requirements and the young job-seekers.

12-1
Chapter 12 COMMUNITY BASED RECOVERY PROJECT (Demonstration
Project in Laamu Fonadhoo)
12.1 Outline of the Project A community based recovery project was proposed and designed by the series of discussions,
coordination and site surveys held on the preparation stage of the study. At the same time,
Fonadhoo Island, one of the most affected islands by the tsunami (fully destroyed; 49 houses,
partly destroyed; 197 houses) was selected as a target community.
There are two aspect of recovery planning, one is a mutual cooperation among governmental
relief, self-reliant and community empowerment, and the other one is combination cooperation
between rehabilitation of infrastructure and living environment. In deed it is highly effective to
have both aspects simultaneously regarding Japan’s disaster reconstruction experiences. Thus
this project focuses on enhancement of the community empowerment in the mutual cooperation
and takes responsibility of recovering living environment in the combined cooperation.
Figure 12.1 Diagram of Disaster Reconstruction Approach
Assistance in a community’s post-disaster efforts for recovery, rehabilitation and development is
most effective when administrative support from the government, self-reliant efforts by the
residents and mutual cooperation among local societies are adequately tied and coordinated. For
this purpose, the Study Team implemented a community based project which involves the
residents’ participation in recovery activities as a community-based initiative, in addition to
short-term recovery projects that covers rehabilitation of infrastructure and public buildings
implemented by the government, in order to enhance the country’s recovery and reconstruction
efforts.
Based on site surveys and discussions with the community in Fonadhoo Island, the project
Infrastructure recovery asGovernmental support 1) Causeway recovery 2) Electric power distribution recovery3) Rebuilding administrative premises4) Sewerage system
Livelihood recovery as communityempowerment support 1) Debris sorting and recycling debris 2) Building Tsunami platform and
memorial 3) Disaster prevention preparedness
This Project
+
Mutual Cooperation 1) Self-reliant 2) Community empowerment 3) Governmental support
Combined Cooperation 1) Rehabilitation of Infrastructure and
public facilities 2) Recovering living environment
Disaster Reconstruction Model (Japanese Experience)

12-2
component was planned, which covers three sub-projects namely 1) Clearance of disaster waste
and debris recycling, 2) Building evacuation platform and tsunami disaster memorial monument
3) Education of disaster prevention preparedness.
The component was planned based on these backgrounds;
1) Disaster waste, debris of destroyed houses and walls by tsunami, were spread in the
community and some clearance was done assisted by the government and NGOs right after the
tsunami, however, many of debris gatherings are still observed in the community even it has been
several months. An element of the debris is mainly mortar and coral rock.
Concerning geographical conditions of Maldives, it is quite limited resource for construction
materials and banning of coral mining so that most of the construction materials are imported
from neighbouring countries. Regarding destroyed houses and walls, most of them were built by
masonry structure with coral stone. Under these situations, recycling of debris is an effective use
of resources by the community participation and it can be capable work to be done by the
community.
2) In addition, the community has strongly requested to have evacuation platform due to that the
people could not find proper refuge when the second earthquake occurred on 28th March, 2005. It
is essential that building evacuation platform with the tsunami memorial in the community using
recycled blocks is indispensable. The platform with the memorial has a role of bequeathing the
disaster to next generation.
3) Moreover, it is not only facilitating physical aspects but also an enhancement of community
empowerment is highly concerned aspect, which is to enlighten the community in regard to the
disaster prevention and the preparedness for further natural disaster. Thus disaster prevention
education is vital for the community.
Consequently the project was planned with community participation and cash-for-work as an ad
hoc measures in order to precede groundwork for the community’s further reconstruction efforts
12.2 Framework of the Project (1) Project Title
The project was named as “Community Based Living Environment Recovery and Disaster Risk
Management Project” or “Community Based Recovery Project” in short, after dialogue among the
stakeholders in the central and local governments.
(2) Objectives
The objectives are as follows and the logical framework is illustrated in Figure 12.2.
Overall Goal:
To improve community empowerment towards natural disaster

12-3
Project Objectives:
i) To recover the living environment deteriorated by the tsunami disaster by the
community itself (clearance and recycling of debris resulting from the tsunami disaster)
ii) To provide groundwork for the community’s further reconstruction efforts
(construction of a platform to serve as an evacuation shelter as well as a memorial of the
disaster)
iii) To enlighten the community in regard to the disaster prevention and the preparedness
for natural calamity (education of disaster prevention)
(3) Project Description
1) Project Component
i) Clearance of disaster waste and debris recycling
ii) Building evacuation platform and tsunami disaster memorial monument
iii) Education of disaster prevention preparedness
To achieve the project objectives, the following activities are proposed.
Table 12.1 Main Activities on Demonstration Project No. Main Activities (1) Project awareness
and setting up block production yard
• Awareness of the Project • Setting up the Recovery and Disaster Risk Management Unit under
Island Office and CBOs in Fonadhoo • Setting up the concrete block production yard by the Team and
Community (2) Collection and
sorting out of debris and wastes
• Preparation of the list of sorting items and list of disposal place by joint inspection with the community and the Team
• Clearing and sorting out of debris and wastes by Community (3) Production of
recycled block • Preparation of the production manual of recycle concrete block based
on trial and errors by the Team • Procurement of necessary equipment and materials for construction
of concrete block by the Team • Training for production of the concrete block by the Team • Crushing coral rock by hand or machine by the Community • Mixing material based on the manual by the Community • Curing of concrete block by the Community
(4) Planning, design and construction of Tsunami monument and evacuation platform
• Confirmation of needs on Tsunami monument / evacuation platform by having dialog of the Team and Community
• Collection of the ideas and designs of the Tsunami monument from the pupils (Give the testimonials to the collected good ideas)
• Team and the Community and finalize the design of the monument • Draft design of Tsunami evacuation platform by the Team and Unit • Ratification workshop with the Team and Community to finalize the
plan and design of Tsunami monument / evacuation platform • Construction of Tsunami evacuation platform by the Community • Construction supervision by the Unit and Team
(5) Project monitoring • Monitoring and evaluation of efficiency, achievement, impact, rational, sustainability.
• Making opinion poll of the participants • Providing leaflet of the Project • Making documentary film

12-4
Figure 12.2 Logical Framework of the Community Based Recovery Project
Overall Goal: To improve community’s empowerment towards natural disaster
Project Objectives:1) to recover the living environment deteriorated by thetsunami by the community 2) to provide groundwork for the community’s further reconstruction efforts 3) to enlighten the community in regard to the disaster prevention and the preparedness for natural calamity
Output 1: Clearance of disaster waste and debris recycling Disaster wastes scattered in the community are cleared and useful debris (coral stone) are recycled to building block.
Output 2: Building evacuation platform and tsunami disaster memorial monument It can be an emergency refuge when natural disaster hit the island again. The monument bequeaths the disaster to next generation.
Output 3: Education of Disaster prevention preparedness The community’s disasterprevention capacity is improved through the disaster prevention preparedness.
Proj
ect’s
Out
com
e Pr
ojec
t
Activities: -Awareness meeting -Setting up implementation body -Collection and sorting -Making concrete block
Inputs:-Construction tools (unicycle, axe, etc.) and materials -Participants -Cash-for-work, etc
Activities:-Design motif competition by school children -Awarding ceremony with testimonials
Inputs:-Testimonials -Recycled block -Construction materials-Participants
Activities: -Experience of disaster prevention education -Tsunami prevention preparedness workshop-Workshop with WDC
Inputs: -Presentation materials-Disaster prevention preparedness song -Disaster prevention manual

12-5
2) Organization of the Implementation
The project implementing organization is shown in Figure 12.2.
Figure 12.3 Implementing Organization of the Project
3) Project Site
The project is implemented in Laamu Fonadhoo, which is the capital of Laamu Atoll, located at 1 ゚
50’ North and 73 ゚ 30’ East, 260 km south of Male’ with an area of 159.2 ha.
4) Project Duration
The project duration is six months from beginning of June until beginning of December 2005. 5) Project Beneficiaries
The project beneficiaries are the registered population in Fonadhoo of 1,740 with 262
households1. There are three wards in the island, namely Barrasil, Medhuavah and Kurigamu.
There is one island office in Fonadhoo and two island chiefs with three assistant island chiefs are
handling the administrative matters. Functioning committees are the Island Development
Committee (IDC) and Women’s Development Committee (WDC) with 16 and 22 members
nominated respectively.
1 Statistical Yearbook of Maldives 2004
Laamu Atoll OfficeFonadhoo Island Office
Recovery and Disaster Risk Management Unit
Island Chief + 6 member JICA
Community
1) Supervise2) Payment wage3) Mobilization
1) Participate to the block production and meeting
1) Technical Assistance2) Education of Disaster
prevention
1) Production Yard2) Material3) Equipment4) Labor Wage5) Technical Assistance6) Education of disaster
prevention7) Monitoring
1) Coordination2) Meeting3) Report
Central GovernmentMAD, MPND, MEC

12-6
12.3 Activities in the Project 12.3.1 Preparation of the Project
(1) Awareness to the Project
Meetings to make the project concept and objectives known as well as understood by the people
in Fonadhoo were held on 26th and 27th May, 2005 in the social centre in Medhuavah and the
community hall in Baraasil with cooperation of the Island Office and the Atoll Office. The
participants were 114 in the first meeting and 70 in the second meeting. It covered two thirds of
the households on the island. The participants in each meeting accepted the project concept,
objectives, implementing schedule and implementing organization.
(2) Establishment of the Implementing Organization
The project implementing organization called “Recovery and Disaster Risk Management Unit (the
Unit)” was organized under the Fonadhoo Island Office, IDC and WDC. The seven personnel were
nominated as members of the Unit, including two from the Island Office, three from the WDC,
one designated by the IDC and one from the private sector. In addition to the seven members, the
assistant principal of Laamu Atoll Education Centre joined the Unit as an advisor. The Unit made
administration, finance and technical sub-unit and defined the role of each member. The article of
the association for regulating operation of the Unit was prepared by the Unit and the Study Team.
Figure 12.4 Recovery and Disaster
Management Unit
Mr. Ahmed Yoosuf( 7834774)Mr. Ibrahim Mohamed( 7728521)
Mr. Mohamed Naseem( 7745610)Ms. Seneela Ali(in charge of Baraasil)( 7734235)
Mr. Ibrahim Rasheed(in charge of Kurigamu)( 7729575)Ms. Zuneyra Moosa( 7840546)
Mr. Mohamed Naif( 7732557)Ms. Asma Ramiz(in charge of Medhuavah)( 7728609)
Mr. Arun KumarAsst. Principal( 7738602)
Unit Leader
Advisor
TechnicalFinanceAdministration
The view of clearing of debris

12-7
12.3.2 Clearance of Disaster Waste and Debris Recycling
(1) Clearance of Disaster Wastes
41 debris clearing spots were identified in Fonadhoo after inspection of the Unit and the Study
Team and dialogues with the Unit and the islanders. The 41 spots are composed of 4 in the
Kurigamu ward, 8 in Baraasil and 29 in Medhuavah. After the on-site training, the clearing of
debris actually started on 5th June, 2005. The debris was cleared by wheel borrowers or pickups
and carried to the recycle block production yard. The clearing continued until 12th July, 2005.
During the six weeks following 5th June, debris were cleared in 33 points out of 41 and carried to
the recycle production yard 151 times by a two-ton pickup. The cleared debris was about 150 m3
equivalent to 250 tonnes.
(2) Sorting and Processing of Debris
After carried debris to the block production yard, debris was sorted and processed for recycling.
The sorting and processing activities started on 13th June, 2005 after on-site training by the Unit
and the Team. The sorting and processing of debris were carried out by axe based on the “Debris
Processing Manual” prepared by the Unit and the Team. The debris was mainly sorted to coral,
mortar and others.
(3) Production of Recycled Blocks
The recycle production yard was scheduled to locate in the southern part of Medhuavah ward.
Prior to commencement of the construction of the recycled block production yard, the site was
voluntarily cleared by the community. More than 20 persons in the community, mainly female,
spent two days for the clearing work. After clearing the site, construction of recycle block
production yard was started on 24th June, 2005 and completed in end of July 2005. During
construction of the recycle block production yard, the Unit and the Study Team conducted trial
mixing to determine a suitable ratio of the mixture.
Overall profile of completed block production yard
The site of block production yard (30mx30m) wascleared by the community under supervision of theisland chief.

12-8
After trial mixing of the block, the ratio by weight per batch (one mix) was fixed as follows:
- Cement: 50kg (1 bag)
- Fine Sand: 200kg (4 bags)
- Water: 25kg
- Recycled mortar including coral stone: 64kg
- Add 1kg coral stone for surfacing per block
The production was started on 14th August 2005 by participants from the community. The works
were carried out according to the production manual prepared by the Unit and the Study Team.
Twenty five (25) blocks per mix were produced in average. Production of three thousand (3,000)
blocks for using in the evacuation platform as the minimum target was accomplished in beginning
of September 2005. The production was continued until 8th December 2005 for using in other
purposes to be decided by the community. The total production was 18,575 blocks.
Competed blocks after removing the mold
Taking mixed mortar and proceed to pouring the mixtureto mold。
Compacting the poured mixture by stick
The community people are taking pleasure inincreasing the completed blocks as theiraccomplishment at the temporary stock yard.

12-9
12.3.3 Building Evacuation Platform and the Tsunami Memorial Monument
(1) Planning and Preparation
The draft plan and design of the tsunami monument and
platform were discussed among resource persons in
Fonadhoo. The Atoll Office, Island Office, IDC, WDC,
representative of each ward, NGOs, businessmen, the Unit
members and the Study Team members participated in the
meetings held on 13th June and 5th July, 2005, where the
location, shape, size and height of the monument/platform
was drafted to show to the community for their approval.
(2) Design
At the same time, drawings with a motif of the tsunami were gathered from the students in the
Laamu Atoll Education Centre. 230 students in grades 1 to 9 drew pictures of tsunami. The same
resource persons selected eight pictures from the 230 as the pictures to covey the tsunami
experience to the next generation. Selected pictures are printed on the tile and put on the wall as
a monument.
The ratification meetings for the tsunami monument and platform were held on 18th, 20th and 21st
July, 2005. The participants (totalling up to 270) generally accepted the proposed plan but raised
some comments on the location and stairs. Based on the comments, the Study Team requested
the community to have the Island Development Committee Meeting assess the comments on the
location of the tsunami monument and platform. After the assessment by the Committee, the
location was decided as the park in front of the harbour as proposed. The decision was made
considering the demonstration effect, distance from the jetty and each village and handiness in
case of emergency. In the meeting two persons pointed out that it would require two staircases to
evacuate the people smoothly. The Team agreed to estimate the cost and to make final decision.
The following is proposed as a final plan for the tsunami monument and platform.
Table 12.2 Proposed Design of Tsunami Monument and Evacuation Platform Location Park in front of the harbour, next to the new island office Size 42 m2 Shape Hexagon with steps, slider and storage on the ground floor Height 2.6 m plus 1.4 m parapet wall Monumental Facilities 8 tsunami tile pictures and 2 photos plus memorial plate in Devihi and
English. The important message from both Maldives side and Japan side are also indicated in the memorial plate.
Others Covered with the recycle blocks
(3) Construction
Construction of the platform and monument was started on 14th November 2005. The
construction is scheduled to complete in middle of January 2006.
The view of Tsunami Drawings

12-10
12.3.4 Education of Disaster Prevention
(1) Outline
This activity was done by JICA as a part of the community based recovery programme of JICA
Study, thus it is briefly explained in this report. This activity was proposed and discussed on the
Scope of Work meeting held in April 2005. Disaster Prevention Policy through community was
highly concerned by DER/MFA, MOAD and MPND, and the Minutes of Meeting, Part II
Reconstruction, described it and both side agreed on.
JICA sent two experts, one was for community self-sufficient support and the other one was for
disaster prevention education. These experts stayed in Maldives from 22 to 27 of July 2005. A
series of activities such as a presentation of experience of disaster prevention at Futto primary
school in Aichi, Japan, a workshop of disaster prevention based on disaster prevention manual
prepared by Kochi Prefecture, Japan, discussions among school students and teachers, Fonadhoo
Women’s Development Committee, etc., were held.
(2) The Schedule
Table 12.3 Schedule and Activities of JICA Expert for Disaster Prevention Education
Date Venue Activities
22 July 2005 (Fri) Male (Arrival) Atoll Chief, Island Chief, Women’s Committee
23 July 2005 (Sat) Male-Fonadhoo Kick off and awarding ceremony at Education Centre
24 July 2005 (Sun) Fonadhoo Presentation of Japan’s experience regarding disaster
prevention education
25 July 2005 (Mon) Fonadhoo Workshop of Disaster prevention in Fonadhoo Island,
Feedback meeting
26 July 2005 (Tue) Fonadhoo-Male Internal meeting
27 July 2005 (Wed) Male-Colombo Meeting with UNDP Maldives, the Study Team
28 July 2005 (Thu) Colombo Reporting to Embassy of Japan, JICA Sri Lanka
29 July 2005 (Fri) Colombo-Japan
(3) The Activities
The activities were done in the schedule at Fonadhoo Education Centre, which is largest society in
Fonadhoo Island. The scenes are shown in the following page.
1) Kick off and awarding (design competition for evacuation platform) ceremony
2) Presentation of Japan’s experience- Disaster prevention preparedness at the primary school
3) Workshop for disaster prevention education for students and teachers

12-11
4) Feedback meeting with the teachers

12-12
Coordination meeting with Atoll and Island Chiefs
Coordination meeting with the principal of Fonadhoo Education Centre
Meeting with Women’s Development Committee
Kick off and awarding (design competition) ceremony
Singing a song “O Ha Shi Mo” in Dhivehi Awarding ceremony of the design competition
Tsunami Disaster Prevention workshop Tsunami Disaster Prevention workshop (teachers)

12-13
12.3.5 Preparation of Documentary Video and Project Leaflet
A thirty minutes documentary video showing from the initial stage through completion of the
project was prepared and edited in both Devihi version and English version. Also, a project leaflet
was prepared for the public relations under reviewing by the authorities concerned.
12.4 Supervision of the Project
12.4.1 Meetings and Reports
The implementing organization, the Recovery and Disaster Risk Management Unit, held weekly
meetings with the Study Team to discuss the progress and problems in the activities. The Unit and
the Study Team prepared the activity reports showing updated situations of the project in weekly
basis. The accomplishments with the figure and photos of the activities were included in the each
report. The reports were kept in the Island Office for their record and sent to Laamu Atoll Office,
MOAD, MPND, NDMC and DER/MFA for their information.
12.4.2 Participation of the Community
The followings are a summary of the participants in the project.
Table 12.4 Summary of the Participants in the Project
Participants(Man-day)
Type of Work Baraasil Medhuavah Kurigamu Total
Clearance of disaster
wastes, sorting and
processing of debris
748 1,474 488 2,710
Production of recycled
Blocks
661 978 285 1,924
Management by the
Unit
129 376 0 505
Watchmen 140 280 0 420
TOTAL 1,678 3,108 773 5,559
Note; as of 18th January 2006.
12.4.3 Provision of Facilities, Equipment/tools and Materials
Facilities, equipment/tools and materials for the activities during the project implementation are
as follows:

12-14
Table 12.5 Provision of Facilities, Equipment/tools and Materials
Description Quantity Remarks
Facilities
Platform/Monument (W=12m, H=2.6m) 1 unit
Block Production Yard (30’x60’) 1 unit
Toilet, Generator Space and Storage (18.5’x26’) 1 unit
Equipment/Tools
Wheel Barrow 20 units
Mold (5”x6”x12”) 60 units
Shovel 40 nos.
Weight (60kg) 1 unit
Generator (7kw) 1 unit
Bucket 10 nos.
Trowel 15 nos.
Air Pump 1 unit
Clock 1 unit
Other consumable tools ---
12.4.4 Expenses for the Project Implementation
The costs for all activities in the project are shown below.
Table 12.6 Costs of the Project
Description Amount (Rf) Remarks
Lease of Equipment Concrete Mixer 10,500 Welding Machine 16,500 2 ton Pickup 56,345
Subtotal 83,345 Salary of Local Staff Salary 35,000
Subtotal 35,000 Labour Wages Clearance of Disaster Waste and Debris Recycling 713,650 Cash-for-work to the
community Construction of production yard 50,000 Construction of platform/monument 702,990 Construction of Toilet 75,700
Subtotal 1,542,340

12-15
Materials Block production for Platform/Monument 382,148 Construction of production yard 127,992 Construction of Toilet 95,382 Others 32,343
Subtotal 637,865 Transportation of Equipment/Tools and Materials Materials for block production for Platform/Monument
196,800
Materials for construction of production yard 32,295 Generator 1,000 Materials for Construction of Toilet 12,389
Subtotal 242,484 Insurance for the Activities Insurance 44,000
Subtotal 44,000 Workshop and Training Workshop and training 56,786
Subtotal 56,786 Purchase of Equipment Generator 78,619
Subtotal 78,619
TOTAL 2,720,439 Note: Expenses are calculated based on the figures available on 10th February, 2006.
12.5 Monitoring of the Project The project was designed for emergency relief towards Tsunami disaster in Laamu Fohandoo
Island as a community’s participatory project, and three components were included namely 1)
clearing of disaster wastes and debris recycling, 2) building the Tsunami memorial and evacuation
platform, and 3) disaster prevention preparedness. Third activity was carried out by JICA
headquarters in collaboration with Japan’s NGO and primary school teacher in Japan, while other
two activities were done by the Study Team.
Upon termination of the project, the final monitoring was carried out with focus group interview
and questionnaire survey (total 13 samples collected) in Laam Fonadhoo Island. DAC’s project
evaluation criteria (relevance, effectiveness, efficiency, impact, sustainability) that are also
commonly used on JICA activities were applied to examine the project.
The project was commenced beginning of May 2005 and was terminated the middle of January
2006 in line with the schedule. In total approximately 5,559 man-day participated during the
project period and cash-for-work generated approximately 1 million MRf. cash income to the

12-16
community. A total number of recycled block produced was approximately 38,400 blocks and JICA
supplied necessary construction equipments and materials for clearing disaster waste and debris
recycling, building Tsunami platform, which is 2.39 million MRf. including cash-for-work budget.
The summary of cash-for-work is tabulated below.
Table 12.7 Summary of Cash-for-work(Debris sorting and recycling)
in Fonadhoo Island
Item Value Remarks
Population 1,740 Statistics year 2000
Number of households 262 Statistics year 2000
Average household size 6.6 Persons/household
Total Labour force 799Excluding foreign employee and employment
outside of the island
Total project cost 2,388,994 JICA’s finance
Total cash-for-work (MRf.) 1,010,500 JICA’s finance
Income amount per capita (MRf.) 581 Total cash-for-work/ population
Income per labour force (MRf.) 1,265 Total labour force / disbursed amount per labour
force
Income per household (MRf.) 3,857Disbursed amount per person / Number of
households
Total man-day of cash-for-work 5,559 Total man-day of cash-for-work
Total duration of participated
person by labour force (days) 7 Total Person-day / total labour force
Total project input per capita 1,373Total project cost / population
Source: JICA Study Team, MPND, Fonadhoo Island Office on December, 2005.
(1) Project’s priority and needs (relevance) and effectiveness of the activities which
leads the objectives
The project was finally implemented as the first recovery project in Fonadhoo Island as well as
infrastructure recovery projects in Laam Atoll by Japanese Government except foods and goods
donation by donors. The project covered one of the most damaged atolls and there was an
administrative need as emergency recovery both in community and governmental levels.
The project brought emergency relief to the community partially especially cash-for-work
generated additional household income to recover or repair damaged house or household goods
by themselves. In addition, the project enhanced community’s administrative empowerment
towards natural disaster throughout the series of project activities such as establishment of
implementation body, coordination among the community, implementation of activities, and so on.
Thus, it pledges relevance with higher effectiveness of the project.

12-17
(2) Efficiency of timing, cost, and casual relationship among the project factors
It can be enumerated that the implementation body in addition to the inputs and the activity
executed as it is a plan at first (There was partially a delay by changeable weather) was promptly
set up based on an administrative office of the island and the existing community organization,
and the talent arrangement was done appropriately as a contribution factor.
Moreover, it is one of effective contribution factors to carry out a transparent way that is to
advance at first, and to have built an excellent interpersonal relationship based on the trust upon
counterpart activities with the Study Team.
The monitoring was appropriately executed, and both parties have acted while sharing the target
of the project as a partner. In the approach of technical support, the prototype of recycled block
was made and it examined whether application was possible by the locale. in addition to that it
examined a verification of strength as architectural materials, production quality by community
workers, etc. Thus balance of the theory and practice was kept by having executed it after these
technical supports made.
And, it was effective to attempt smooth recovery support by being able to do practicing guidance
to the community through the project.
Moreover, it was high effectiveness that it was smoothly able to execute the project from planning
to implementation stages consistently by the way of JICA Study Team operating directory.
Consequently it was able to meet needs of emergency support promptly.
(3) Impact and sustainability of the project
The community had the initiative and acted from the establishment of the implementation body to
the execution of the activities. This experience was accumulated in the community, and held the
possibility of voluntarily developing it in the future.
It is recognized that the community based recovery project by the community participation
accomplished the purpose for which it was originally intended enough. The participant received
extraordinary income as a value of work by the project. And, the income generated by the project
will become the foundation stone of reconstruction towards Tsunami damages.
In summary, the community learnt management know-how by the project and the process of
manufacture of the recycling block was learnt. Construction equipments for producing recycle
block, the yard, built platform and memorial granted to the project will be transferred to the
community as it is. The community has an enough ability to manage these and use effectively

12-18
through the social empowerment generated by the project.


![[Note] Chapter 1 - Linear DC Power Supply](https://static.cupdf.com/doc/110x72/553299b255034687698b4651/note-chapter-1-linear-dc-power-supply.jpg)