129
CHAPTER 5
DATA ANALYSIS AND INTERPRETATION
This chapter discusses the results and interpretations of the statistical analysis done on the
data collected with the help of questionnaire in the research study. This chapter consists
of seven sub sections. Section 5.1 discusses the development of telecom sector in India
and customer retention problems in Indian mobile telecom sector. It also discusses the
key determinants of customer retention in mobile telecom sector and various customer
retention strategies adopted by telecom operators in India. Section 5.2 discusses the
demographic profile of the respondents. Section 5.3 provide the description of the
research instrument (questionnaire) and its testing of the reliability and validity of various
constructs used in the questionnaire in order to identify key determinants of customer
retention in mobile telecom sector in India. Section 5.4 discusses the results of
confirmatory factor analysis of all the constructs taken together. This section also
analyses the various aspects of convergent and discriminant validity of the constructs.
Section 5.5 analyses the results of different hypothesis considered in the research study,
analyzing the cause and effect relationship between different constructs related to
customer retention in mobile telecom sector, section 5.6 analyses the overall combined
SEM model and explain the relationship between various determinants of customer
retention. In the end, section 5.7 analyses the data collected from telecom company
representatives.
5.1 Developments in Indian Telecom Sector
Indian telecom sector can be characterized by its diversity. Service organizations ranging
from small telecom service providers to large corporations exist throughout the Indian
telecom business world. Competitive pressures and global economy affect services and
related businesses and cause those businesses to seek unique ways of differentiating their
services. The willingness and ability of managers in service firms to respond to dramatic
changes affecting the service economy will determine whether their own organizations
survive and prosper or suffer, where they throw their hands up in frustration giving in to
their more agile and adaptive competitors . With the tremendous changes in Indian

130
telecom service sector, including an expansion and intensification of competition and
increasing customer sensitivity, the issue of customer retention has assumed significant
importance.
This study is intended for executives in telecommunication firms facing intense
competition & customer retention challenges. As the telecommunication industry has
grown and matured, it has driven service providers to fight even harder for customer
wins. Results from this study will contribute to a greater understanding of customer
retention both to practitioners and academicians. In the light of the centrality of customer
retention from all stand points, this research aims to investigate its various dimensions in
the Indian mobile telecommunication services context.
5.1.2 Key Determinants of Customer Retention
Retaining customers in highly competitive business environment is critical for any
company’s survival because a lost customer represents more than the loss of the next sale.
The company loses the future profits from that customers’ lifetime of purchases. Also,
keeping customers makes the cost of selling to existing customers lower than the cost of
selling to new customers. Therefore, acquisition should be secondary to retaining
customers and enhancing relationships with them (McCarthy, 1997). That is, because
according to Levy (2008), new customers are more difficult to find and reach, they buy 10%
less than the existing customers, and they are less engaged in the buying process and
relationship with retailers in general. Meanwhile, according to Eibenet al. (1998), existing
customers tend to buy more, which in turn generates more profit through more cash flow.
In addition, repeat customers were tested and shown to be less price-sensitive, they
provide positive word of mouth, and they generate a fall in transaction costs, all of
which increase firms’ sales and profits, leading to sales referrals (Stahl et al., 2003).
Key determinants of customer retention are as follows:
I Satisfaction and Customer Retention
Businesses in the relationship marketing sector have tended to view any future sales
opportunities as depending primarily on relationship quality and satisfaction (Crosby et al.,
1990); these are the key tools for increasing customer retention (Sweeney and Swait,

131
2008).
Satisfaction is defined by Engel et al. (1995) as “a post-consumption evaluation that a
chosen alternative at least meets or exceeds expectations”, while Ranaweera and Prabhu
(2003) defined it as “an evaluation of an emotion, reflecting the degree to which the
customer believes the service provider evokes positive feelings”. Therefore, satisfaction
occurs with the enhancement of a customer’s feelings when he or she compares his/her
perception of the performance of products and services in relation to his/her desires and
expectations (Spreng et al., 1996).
II Trust and Customer Retention
Trust has many definitions in the relationship marketing literature. Moorman et al. (1993)
defined trust as “a willingness to rely on an exchange partner in whom one has confidence”.
Also, Morgan and Hunt (1994) have described trust as “the perception of confidence in the
exchange partner's reliability and integrity”. Evans et al. (2006) presented a number of
concepts that are employed to explain and describe successful relationships; one of these
concepts is trust. The author argues that trust is the basis for relationship exchange and the
glue that holds a relationship together.
One of the study examples that investigated the relationship between trust and customer
retention was conducted by Teichert and Rost (2003). The authors measured the
effects of trust and involvement on customer retention, assuming general customer
satisfaction. They found that trust serves as a strong trigger for enhancing customer
retention, and involvement is revealed to play a prominent role in explaining both trust
creation and customer retention. They also concluded that trust is a major constituent
element of relational customer retention, supported in different measures by affective and
cognitive involvements.
III Commitment and Customer Retention
Commitment is considered one of the major elements of successful relationship marketing.
Consequently, there is no successful relationship without commitment from both parties,
especially if the relationship requirements and conditions have been agreed and written
between them. This view is validated by many scholars (Too et al., 2001; Bansal et al., 2004;

132
Sanchez and Iniesta, 2004; Hess and Story, 2005) who have examined the effect of
commitment on customer retention.
Commitment in the relationship marketing research field is defined by Dwyer et al. (1987) as
“an implicit or explicit pledge of relational continuity between exchange partners”.
Likewise, Moorman et al. (1992), argue that commitment is essential to customer retention
and describe it as “an enduring desire to maintain a valued relationship”. Morgan and Hunt
(1994), consider this phrase to be a relational commandment and define
commitment as:
“an exchange partner believing that ongoing relationship with another is so important as to warrant
maximum effort at maintaining it; that is , the committed party believes the relationship is worth
working on to ensure that it endures indefinitely”.
IV Service Quality and Customer Retention
Service quality has gained a great deal of attention from researchers, managers, and
practitioners during the past few decades. Many scholars have studied the effect of service
quality on customer retention (Oliver, 1980; Lehtinen and Lehtinen, 1982; Ennew and Binks,
1996; Ranaweera and Neely, 2003; Venelis and Ghauri, 2004). Their findings reveal that
there is a direct correlation between service quality and customer behavioural intentions and
retention. Service has many dimensions, definitions, and techniques which may affect
its way of production, consumption, and delivery.
V Switching Barriers and Customer Retention
The switching barrier refers to the difficulty of switching to another provider that is
encountered by a customer who is dissatisfied with the existing service, or to the
financial, social and psychological burden felt by a customer when switching to a new
carrier (Fornell, 1992). Therefore, the higher the switching barrier, the more a customer is
forced to remain with his or her existing carrier. According to previous studies, the
switching barrier is made up of switching cost, the attractiveness of alternatives, and
interpersonal relationships. These three switching barriers are summarized below:

133
(A) Switching cost
The switching cost is a main factor having effect on the customer retention. As the
switching cost increases, risk and burden on consumers are increased in the customer side
and dependency on the service provider gets increased as a result [Jones et al., 2000;
Morgan & Hunt, 1994]. In other words, the more consumers recognize the switching
cost, the higher retention rate even though customers have dissatisfaction on the service.
(B) The interpersonal relationship
The long term interpersonal relationship between the company and customers offers a lot
of benefits to the customers: social benefits such as fellowship and personal recognition,
psychological benefits such as reducing anxiety and credit, economic benefits such as
discount and time-saving, and finally customization benefits such as customer
management etc [Berry, 1995; Peterson 1995]. Therefore the interpersonal relationship
between the company and the customers can be an important factor as a switching
barrier. The continuous interpersonal relationship becomes a relationship-specific asset
which acquires customer to pay cost to be out of the relationship and therefore protects
customer from being apart from the relationship with the company.
(C) The attractiveness of alternatives
When consumers does not think that they have various alternatives or the service level,
distinguished image of the alternatives is better than the current service provider, the
possibility of the customers switching the service provider is very low [Anderson &
Narus, 1990; Jones et al., 2000]. Therefore, the attractiveness of the alternatives would be
a component building the switching barrier.
5.1.3 Strategies for Customer Retention
An important distinction can be made between strategies that lock the customer in by
penalizing their exit from a relationship, and strategies that reward a customer for
remaining in a relationship. The former are generally considered negative and the latter
positive customer retention strategies. Negative customer retention strategies impose high
switching costs on customers, discouraging their defection. The customer retention
strategies which are in practice in mobile telecom sector are as follows:

134
(a) Customer Delight: It is very difficult to build long-term relationships with
customers if their needs and expectations are not understood and well met. It is
a fundamental precept of modern customer management that companies should
understand customers, and then acquire and deploy resources to ensure their
satisfaction and retention. This is why CRM is grounded on detailed customer-
related knowledge. Customers that you are not able to serve well may be better
served by your competitors.
(b) Add Customer-Perceived Value: The second major positive customer retention
strategy is to add customer- perceived value. Companies can explore ways to create
additional value for customers. The idea is to add value for customers without
creating additional costs for the company. If costs are incurred then the value-adds
may be expected to recover those costs. For example, a customer club may be
expected to generate a revenue stream from its membership. There are three
common forms of value-adding programme: loyalty schemes, customer clubs and
sales promotions.
(c) Loyalty Schemes: Loyalty schemes reward customers for their patronage. Loyalty
schemes or programmes can be defined as follows:
„A loyalty programme is a scheme that offers delayed or immediate incremental
rewards to customers for their cumulative patronage‟.
The more a customer spends, the higher the reward. Loyalty schemes have a long
history. In 1844, in the UK, the Rochdale Pioneers developed a cooperative retailing
operation that distributed surpluses back to members in the form of a dividend. The
surpluses were proportionate to customer spendings. S&H Pink Stamps and Green
Shield stamps were collected in the 1950s and 1960s, and redeemed for gifts selected
from catalogues.
(d) Customer Clubs: Customer clubs have been established by many organizations.
A customer club can be defined as follows:
A customer club is a company-run membership organization that offers a range of value-

135
adding benefits exclusively to members. The initial costs of establishing a club can be
quite high, but thereafter most clubs are expected to cover their operating expenses
and, preferably, return a profit. Research suggests that customer clubs are successful at
promoting customer retention.
(e) Sales Promotions: Whereas loyalty schemes and clubs are relatively durable, sales
promotions offer only temporary enhancements to customer value. Sales promotions,
Retention-oriented sales promotions encourage the customer to repeat purchase, so
the form they take is different.
(f) Bonding: The next customer retention strategy is customer bonding. B2B
researchers have identified many different forms of bond between customers and
suppliers. These include interpersonal bonds, technology bonds (as in EDI), legal
bonds and process bonds. These different forms can be split into two major
categories: social and structural.
(g) Build Customer Engagement: The final positive strategy for building customer
retention is to build customer engagement. Various studies have indicated that
customer satisfaction is not enough to ensure customer longevity. For example,
Reichheld reports that 65 to 85 per cent of recently defected customers claimed
to be satisfied with their previous suppliers. Another study reports that one in ten
customers who said they were completely satisfied, scoring ten out of ten on a
customer satisfaction scale, defected to a rival brand the following year. Having
satisfied customers is, increasingly, no more than a basic requirement of being in the
game.
136
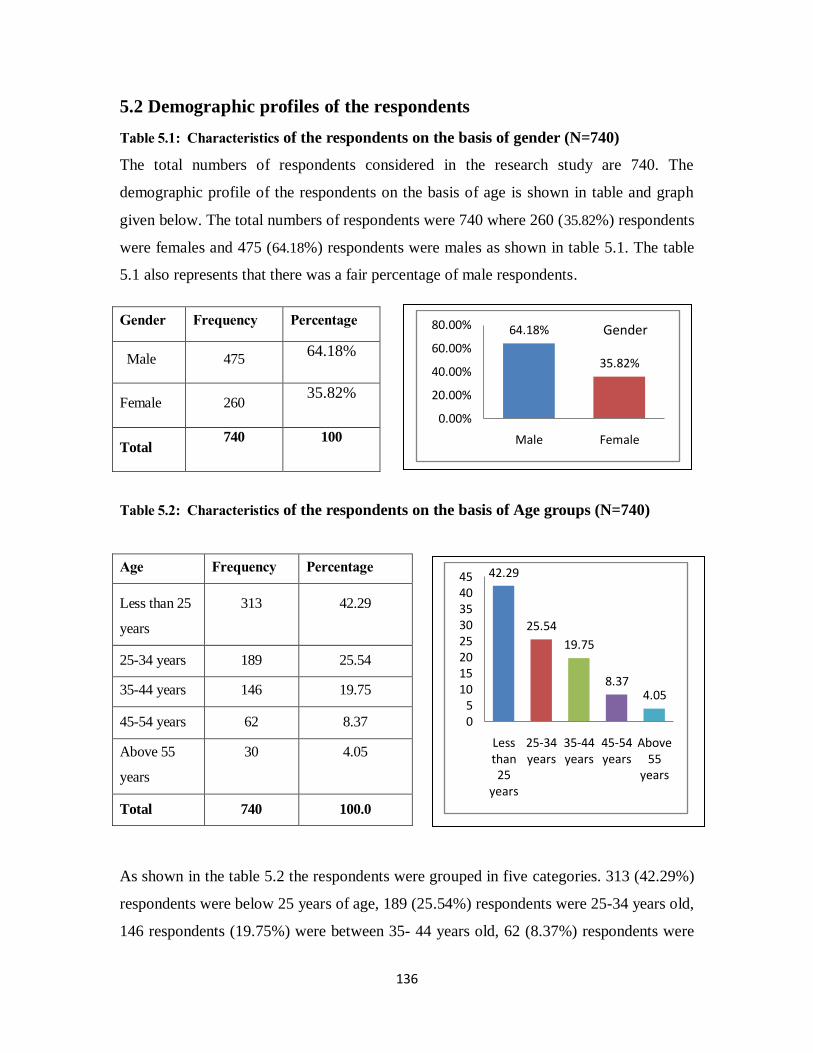
5.2 Demographic profiles of the respondents
Table 5.1: Characteristics of the respondents on the basis of gender (N=740)
The total numbers of respondents considered in the research study are 740. The
demographic profile of the respondents on the basis of age is shown in table and graph
given below. The total numbers of respondents were 740 where 260 (35.82%) respondents
were females and 475 (64.18%) respondents were males as shown in table 5.1. The table
5.1 also represents that there was a fair percentage of male respondents.
Gender Frequency Percentage
Male 475 64.18%
Female 260 35.82%
Total 720 100 740 100
Table 5.2: Characteristics of the respondents on the basis of Age groups (N=740)
Age Frequency Percentage
Less than 25
years
313 42.29
25-34 years 189 25.54
35-44 years 146 19.75
45-54 years 62 8.37
Above 55
years
30 4.05
Total 740 100.0
As shown in the table 5.2 the respondents were grouped in five categories. 313 (42.29%)
respondents were below 25 years of age, 189 (25.54%) respondents were 25-34 years old,
146 respondents (19.75%) were between 35- 44 years old, 62 (8.37%) respondents were
42.29
25.54
19.75
8.374.05
05
1015202530354045
Less than 25
years
25-34 years
35-44 years
45-54 years
Above 55
years
64.18%
35.82%
0.00%
20.00%
40.00%
60.00%
80.00%
Male Female
Gender

137
between 45-54 years old and only 30 (4.05%) respondents were those above 55 years The
graph also indicates that there was a fair representation of young respondents.
Table 5. 3: Characteristics of the respondents on the basis of location or residential
status (N=740)
The total numbers of respondents were 740, where 333 respondents were those from rural
background and 407 respondents from urban areas as shown in table 5.3. The graphical
representation is also provided herewith.
Region Frequency Percentage
Rural 333 45.00%
Urban 407 55.00%
Total 740 100.00%
Table 5.4: Characteristics of the respondents on the basis of educational qualification
(N=740)
Education Frequency Percentage
Below Secondary Level 13 1.75%
Secondary –Sr. Secondary level 45 6.08%
Bachelors Degree 324 43.78%
Master Degree (PG) 138 18.64%
Others 220 29.72%
Total 740 100
45%
55%
0%
10%
20%
30%
40%
50%
60%
Rural Urban
Location

138
As shown in table 5.4, respondents were from different educational backgrounds. In t
The sample surveyed 13 (1.75%) respondents were studied up to below tenth standard, 45
(6.08%) respondents were studied up to secondary to senior secondary level.
It was also observed that out of 740 only 324 (43.78%) respondents were graduates, 138
(18.64%) respondents were post graduates and 220 (29.72%) respondents were having
other type of educational qualifications like diploma, professional qualification. The
graph also represents that there was a fair percentage of graduate respondents.
Table 5.5: Characteristics of the respondents on the basis of monthly income (N=740)
Monthly
Income
Frequency Percentage
Up to Rs 10000 263 35.54%
Rs. 10001 to
25000
84 11.35%
Rs 25001 to
40000
223 30.15%
RS. 40001 to
65000
135 18.24%
Rs. 65001 and
above
35 4.72%
Total 740 100.0
1.75%6.08%
43.78%
18.64%
29.72%
0.00%5.00%
10.00%15.00%20.00%25.00%30.00%35.00%40.00%45.00%50.00%
Below Secondary Level
Secondary level Bachelor degree Master Degree (PG)
Others
Education
35.54%
11.35%
30.15%
18.24%
4.72%
0.00%
5.00%
10.00%
15.00%
20.00%
25.00%
30.00%
35.00%
40.00%
Up to Rs
10000
Rs. 10001
to 25000
Rs 25001
to 40000
RS. 40001
to 65000
Rs. 65001
and above
Income

139
On the basis of monthly income groups of the telecom subscribers it was observed that
263 (35.54%) respondents were those earning less than Rs.10000 monthly, 84 (11.35%)
respondents were those earning between Rs. 10001-25000, 223 (30.15%) respondents
were those earning between Rs. 25001-40000, 135 (18.24%) respondents were those
earning between 40001-65000, and only 35 (4.72%) were earning Rs.65001 and above as
shown in table 5.5.
Table 5.6: Characteristics of the respondents on the basis of their occupation (N=740)
Occupation Frequency Percent
Agriculture 72 9.72%
Self Employed-Shop 80 10.81%
Self Employed-Other 120 16.23%
Business Owner 125 16.89%
Service Professionals Pvt. 109 14.72%
Govt. Employees 108 14.59%
Student 96 12.97%
Retired 30 4.05%
Total 740 100
9.72%10.81%
16.23% 16.89%
14.72% 14.59%12.97%
4.05%
0.00%
2.00%
4.00%
6.00%
8.00%
10.00%
12.00%
14.00%
16.00%
18.00%

140
As shown in table 5.6, respondents were surveyed from different occupational
backgrounds. Seventy two (9.72%) respondents were farmers, 80 (10.81%) respondents
were shop owners, 120 (16.23%) respondents were self employed, 125 (16.89%)
respondents were business owners, 109 (14.72%) respondents were serving in private
sector, 108 (14.59%) were government employees, 96 (12.97%) respondents were
students, 30 (4.05%) respondents were retired persons. The graph also represents that
there was a fair percentage of service professionals followed by government employees
in the sample size.
Table 5.7: Characteristics of the respondents on the basis of their current telecom
Service Provider (N=740)
Company Frequency Percentage
BSNL 215 29.05
AIRTEL 276 37.29
Reliance 98 13.26
VODAFONE 151 20.40
Total 740 100.0
The table 5.7 shows that in the sample surveyed 215 (29.05%) respondents were using
telecom services of BSNL, 276 (37.29%) of AIRTEL, 98 (13.26%) of Reliance and 151
(20.40%) opted the telecom services of VODAFONE. It is clear that majority of the
customers who undertook the survey use telecom services of AIRTEL and the least
preferred service provider is Reliance.
29.05%
37.29%
13.26%
20.40%
0.00%5.00%
10.00%15.00%20.00%25.00%30.00%35.00%40.00%

141
Table 5.8: Characteristics of the respondents on the basis of the type of mobile
connection subscribed (N=740)
Type of
Mobile
connection
Frequency
ncy
Percent
Percen
Percent
Post paid 122 16.48%
Pre Paid 618 83.51%
Total 740 100.00%
It was also observed that out of 740 only 122 (16.48%) respondents had subscribed to
postpaid mobile services and 618 (83.51%) subscribed for pre paid mobile services. The
graph also represents that there was a high percentage of prepaid telecom subscribers.
Table 5.9: Characteristics of the respondents on the basis of their history of relationship
with current service provider (N=740)
Duration of
Relationship with
service providers
Frequency Percentage
N
Less than 2 years 310 41.89
2 to less than 3 years 183 24.72
3 o less than 4 years 115 15.54
4 to less than 5 years 76 10.29
Above 5 years 56 7.56
Total 740 100.0
16.48%
83.51%
0.00%
20.00%
40.00%
60.00%
80.00%
100.00%
Post Paid Prepaid
41.89%
24.72%
15.54%10.29%
7.56%
0.00%5.00%
10.00%15.00%20.00%25.00%30.00%35.00%40.00%45.00%
Less than 2 years
2 to less
than 3 years
3 o less
than 4 years
4 to less
than 5 years
Above 5
years
142
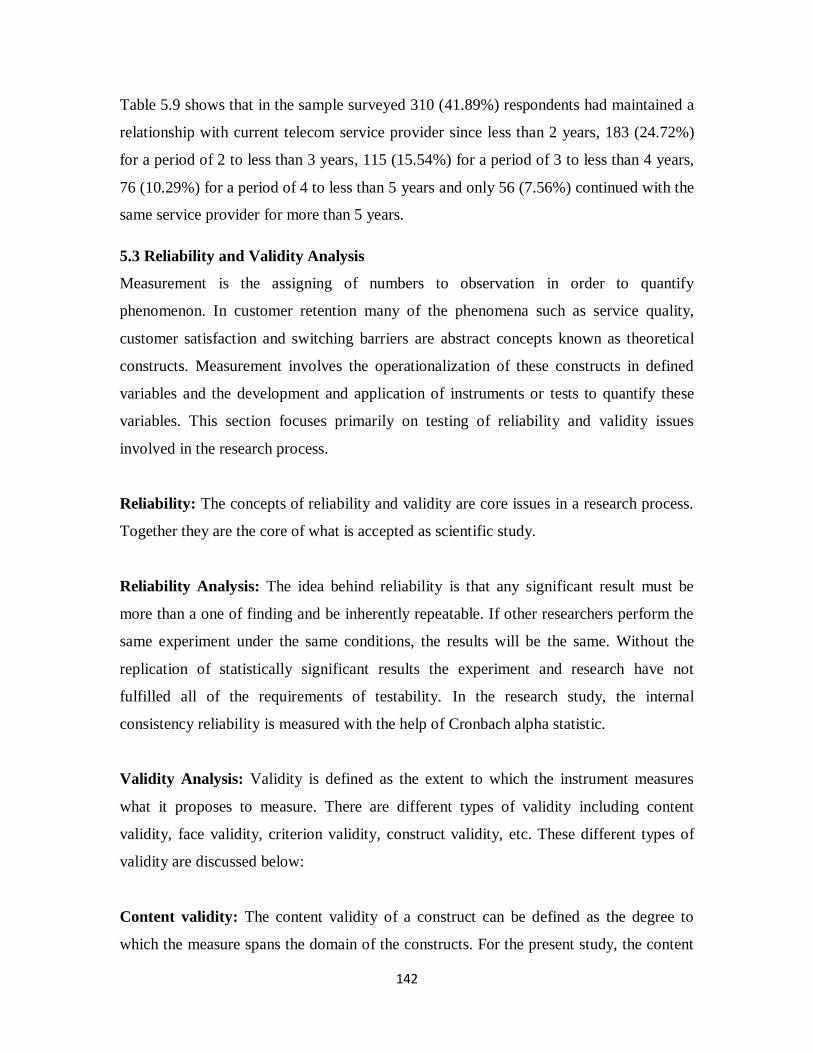
Table 5.9 shows that in the sample surveyed 310 (41.89%) respondents had maintained a
relationship with current telecom service provider since less than 2 years, 183 (24.72%)
for a period of 2 to less than 3 years, 115 (15.54%) for a period of 3 to less than 4 years,
76 (10.29%) for a period of 4 to less than 5 years and only 56 (7.56%) continued with the
same service provider for more than 5 years.
5.3 Reliability and Validity Analysis
Measurement is the assigning of numbers to observation in order to quantify
phenomenon. In customer retention many of the phenomena such as service quality,
customer satisfaction and switching barriers are abstract concepts known as theoretical
constructs. Measurement involves the operationalization of these constructs in defined
variables and the development and application of instruments or tests to quantify these
variables. This section focuses primarily on testing of reliability and validity issues
involved in the research process.
Reliability: The concepts of reliability and validity are core issues in a research process.
Together they are the core of what is accepted as scientific study.
Reliability Analysis: The idea behind reliability is that any significant result must be
more than a one of finding and be inherently repeatable. If other researchers perform the
same experiment under the same conditions, the results will be the same. Without the
replication of statistically significant results the experiment and research have not
fulfilled all of the requirements of testability. In the research study, the internal
consistency reliability is measured with the help of Cronbach alpha statistic.
Validity Analysis: Validity is defined as the extent to which the instrument measures
what it proposes to measure. There are different types of validity including content
validity, face validity, criterion validity, construct validity, etc. These different types of
validity are discussed below:
Content validity: The content validity of a construct can be defined as the degree to
which the measure spans the domain of the constructs. For the present study, the content
143
validity of the instrument was ensured as customer retention dimensions and items were
identified from the literature and were thoroughly reviewed by professionals and
academicians. The best practice to ensure the content validity is to show the set of
possible variables in the construct to five academicians as well as five industry experts.
After analyzing the advice received from these experts, the constructs along with the set
of variables is finalized. In this way the issue of content validity is resolved.
Construct validity: It involves the assessment of the degree to which an
operationalization correctly measures its targeted variables. Establishing construct
validity involves the empirical assessment of uni-dimensionality, reliability and validity
(convergent and discriminant validity). In the present study, in order to check for uni-
dimensionality, a measurement model was specified for each construct and CFA is run
for all the constructs taken together. Individual items in the model are examined to see
how closely they represent the same construct. A comparative fit index (CFI) of 0.80 or
above for the model implies that there is a strong evidence of uni-dimensionality. The
CFI values obtained for all the seven dimensions in the scale are equal to or above 0.80 as
shown in the respective constructs.
Convergent validity: Convergent and Divergent validity are ways to assess the construct
validity of a measurement procedure. Convergent validity helps to establish construct
validity when the researcher used two different measurement procedures and research
methods in the research study to collect data about a construct. The discriminant validity
helps to establish construct validity by demonstrating that the construct is different from
other constructs. Convergent validity is the degree to which multiple methods of
measuring a variable provide the same results whereas discriminant validity is the degree
to which measures of different latent variables are unique. Discriminant validity is
ensured if a measure does not correlate very highly with other measures from which it is
supposed to differ.
Discriminant validity: It is the degree to which the measures of different latent
variables are unique. Discriminant validity is ensured if a measure does not correlate very

144
highly with other measures from which it is supposed to differ. For assessing
discriminant validity, two chi-square comparison models were considered. The two
comparison models are referred as Model 1 and Model 2. The comparison of chi-square
statistic for Model 1 and Model 2 provides support for discriminant validity.
Criterion-related validity: It is established when a criterion, external to the
measurement instrument is correlated with the factor structure. A construct can be
defined as the latent variable which cannot or difficult to be measured directly from the
respondents. Hence a set of variables is to be included in the construct for its
measurement. Before finalizing the set of variables in the construct the content validity is
to be assured. After ascertaining the content validity the next issue was to analyze the
validity of each individual construct. The construct validity consists of convergent
validity, discriminant validity and face validity. The convergent validity can be tested
with help of factor loadings of each individual variable to the construct. The high Factor
loadings indicate convergent validity and since high factor loadings indicate that the
variable is highly explained by the construct, it will not be explained by any other
construct which indicates the presence of discriminant validity. The description of
various constructs, the set of variables in each construct and their mean, standard
deviation, composite reliability and average variance explained are shown below:-
First Construct: Tangibility
Second Construct: Reliability
Third Construct: Responsiveness
Fourth Construct: Assurance
Fifth Construct: Empathy
Sixth Construct: Network Quality
Seventh Construct: Convenience
Eight construct: Satisfaction from technical factors
Ninth construct: Satisfaction from value added services
Tenth construct: Satisfaction from convenience
Eleventh construct: Interpersonal Relationship
Twelfth construct: Switching Cost

145
Thirteenth construct: Attractiveness of Alternatives
Fourteenth construct: Customer retention
5.3 Perceived Service Quality: Table 5.10: Mean, S.D., Cronbach Alpha, Average
Variance Extracted and Composite reliability of the variables in different construct
considered in the study
Construct Included Measured Variable Mean
(S.D.) Cronbach
Alpha
Average
Variance
Extracted
(AVE)
Composite
Reliability
(CR)
Tangibility Up to date Equipment 3.33 .964 .894 .682 .895
Visually appealing Physical facilities 3.28 .829
Service staff appear neat & well
dressed 3.26 .979
Physical facilities match with
telecom services 3.33 .953
Reliability Keep Promise 3.32 .754 .914 .672 .911
Sympathetic & reassuring 3.25 .855
Dependable 3.02 .944
Provide service at promised time 3.19 .807
Keep records accurately 3.17 .853
Responsiveness Exactly tell when service will be
performed 2.24 .926
.857 .616 ..863
Not realistic to expect prompt
service form staff 2.32 .872
Don’t always have to willing to help
customers 2.47 .870
Ok if staff is too busy to respond 2.37 .962
Assurance Able to trust on customer service
staff 2.67 .864
.877 .717 .910
Feel safe in my transaction 2.73 .962
Customer service staff should be
polite 2.84 .937
Should get adequate support 2.98 .955
Empathy Individual attention should not be
expected 2.06 .993
.881 .691 .916

146
Can't be expected to give customer
personal attention 2.27 .962
Unrealistic to expect to know
customer needs 2.20 .953
Unrealistic to expect convenient
hours 2.03 .857
Network
Quality
Sufficient geographic coverage 2.33 .964 .922 .703 .921
pre mature termination free call 3.56 .922
Voice clarity 3.59 .983
Call connected during first attempt 3.65 .967
Able to make call at peak hours 3.50 .996
Convenience Convenient business hours 3.46 .993 .881 .940 .984
Mechanism of easy lodging of
queries/complaints 3.41 .993
Flexibility in payment of bills 3.33 .816
Simple application formalities 3.35 .877
Satisfaction: Table 5.11: Mean, S.D., Cronbach Alpha, Average Variance Extracted and
Composite reliability of the variables in different construct considered in the study
Construct Included Measured Variable Mean
(S.D.) Cronbach
Alpha
Average
Variance
Extracted
(AVE)
Composite
Reliability
(CR)
Technical
Factors
Network Connectivity 3.9400 .99687 .892 0.681
0.894
Coverage 3.7200 .93765
Roaming Facility 3.8300 .99393
Voice Clarity 3.7000 .96922
Value Added
Services
Tariff/call rate 3.9600 .98391 .901 0.693
0.900
Value added service 3.6500 .95743
Transparency in billing 3.7600 .93333
Sales promotion offers 3.8700 .95078
Convenience Ease of availability of Recharge 3.8700 .96035 .889 0.673
0.890
Customer care service 3.4100 .94538
Advertisement 3.7500 .96719
Dealer network 3.6400 .95896

147
Switching Barriers: Table 5.12: Mean, S.D., Cronbach Alpha, Average Variance Extracted and
Composite reliability of the variables in different construct considered in the study
Construct Included Measured Variable Mean
(S.D.) Cronbach
Alpha
Average
Variance
Extracted
(AVE)
Composite
Reliability
(CR)
Interpersonal
Relationship
Bond with telecom operator 3.630 .91691 .959 .771 .959
Personal Friendship with
telecom operator 3.4700 .95867
Comfortable 3.7200 1.11083
Miss the operator if switch 3.7000 .96922
Lose a friendly & comfortable
relationship if change 3.6500 .98391
Like public image of operator 3.3800 .95743
Caring 3.4900 .93333
Switching Cost Switching is hassle 3.5900 .95078 .896 .638 .898
Cost a lots of money 3.2300 .96922
Cost of lots of time 3.2900 .88317
Lots of Efforts to switch 3.3300 .96415
Prices of other operator are
higher 3.2800 .93778
Attractiveness
of Alternatives
Don’t care about the brand 3.6300 .90626 .882 .523 .884
Trust on telecom operator 3.3600 .82612
Likely to switch 3.2500 .87887
Hate spending time in finding
new operator 3.1700
.81938
Not certain about the quality of
services other operator will
provide
3.3700
.93430
Risk in switching 3.3800 .87384
Feel uncertain 3.0700 .67632

148
5.3.1 Construct Validity
5.3.1 (a) Tangibility: The first construct defined as the “Tangibility” is shown below
in figure 5.1. This construct is designed to analyses the tangibles include the appearance
of physical facilities, equipment, personnel and communication material in mobile
telecom services. This construct consists of four measured variables defined as below:
Up to date equipment,
Physical facilities are visually appealing
Service staff appears neat & clean
Physical facilities matching with telecom services
The condition of the physical surroundings is tangible evidence of the care and attention
to details exhibited by the service provider. When a customer uses mobile phone services
of a telecom company, tangibles may affect the perception of that customer with
reference to the mobile services provided by the service provider. These attributes are
measurable in nature and express the defined construct. In order to analyze the structure
of the construct and measured variables, the construct analysis is done in the research
study. The construct “Tangibility” along with the measured variables is shown in figure
5.1. The regression weights of each measured variable are estimated and shown in table
5.13. The results indicate that all the regression weights are high (greater than 0.5) and
significant. Hence the convergent validity of the construct is ensured and can be
concluded that the construct significantly explains the variables. The standardized
regression weights as well as the multiple squared correlations of the individual variables
are shown in table. The standardized regression weights indicate comparative influence
of the construct to its variables. The high value of the standardized regression weights
indicates the higher influence of the construct to the variable. The squared multiple
correlations indicate the percentage of variance of the measured variable that can be
explained with the help of the variations in the construct.
The results as shown in table 5.13 indicate that the tangibility is highly influenced by the
variable “physical facilities matching with telecom services”. This is due to the fact that
when a customer is going to use the telecom services provided by a telecom company, he

149
may give more weight to the physical facilities provided by that company. The next most
influencing measured variable for the construct tangibility is “Service staff appears neat
& clean”. The least influence (but statistically significant) of the construct is on the
variable “Physical facilities are visually appealing”. The squared multiple correlations of
the measured variable “physical facilities matching with telecom services” indicate that
the 75.5 percent of the variance of the variable is explained by the construct.
Figure 5.1: Tangibility
Table 5.13: Tangibility
Measured
Variables Construct
Standardized
Regression
Estimate
Unstandardized
Regression
Estimate
S.E. C.R. P
Squared
Multiple
Correlation
Up to date
equipments <---
Tangibility
.793 1.00
.628
Physical
facilities are
visually
appealing
<--- .782 .956 .115 8.290 *** .611
Service staff
appears neat
& clean
<--- .855 .999 .108 9.224 *** .730

150
Measured
Variables Construct
Standardized
Regression
Estimate
Unstandardized
Regression
Estimate
S.E. C.R. P
Squared
Multiple
Correlation
Physical
facilities
matching
with telecom
services
<--- .869 1.07 .114 9.385 *** .755
5.3.1(b) Reliability: The second construct defined as the “Reliability” is shown below
in figure 5.2. This construct is designed to analyses the reliability of mobile telecom
services offered by selected telecom operators. This construct consists of five measured
variables defined as below:
Keep Promises,
Sympathetic & reassuring
Dependable
Provide service at promised time
Keep records accurately
Reliability is the ability to perform the promised service dependably and accurately.
Reliable service performance means that the service is accomplished on time, every time,
in the same manner, and without errors. Reliability extends into the back office, as well
as where accuracy in billing and records keeping is expected. When a customer uses
mobile phone services of a telecom company, reliability offered by that service affects
the perception of that customer with reference to the mobile services provided by the
service providers. These attributes are measurable in nature and express the defined
construct. In order to analyze the structure of the construct and measured variables, the
construct analysis is done in the research study. The construct “Reliability” along with
the measured variables is shown in the figure 5.2. The regression weights of each
measured variable are estimated and shown in table 5.14. The results indicate that all the
regression weights are high (greater than 0.5) and significant. Hence the convergent
validity of the construct is ensured and can be concluded that the construct significantly
explains the variables. The standardized regression weights as well as the multiple

151
squared correlations of the individual variables are shown in table .The standardized
regression weights indicate comparative influence of the construct to its variables. The
high value of the standardized regression weights indicates the higher influence of the
construct to the variable. The squared multiple correlations indicate the percentage of
variance of the measured variable that can be explained with the help of the variations in
the construct.
The results as shown in table 5.14 indicate that the perceived reliability is highly
influenced by the variable “Provide service at promised time”. This is due to the fact that
when a customer is going to use mobile telecom services, he/she will definitely evaluate
the reliability of that service provider whether the service is accomplished on promised
time or not. The next most influencing measured variable for the construct reliability is
“Sympathetic & reassuring”. The least influence (but statistically significant) of the
construct is on the variable “Keep records accurately”. The squared multiple correlation
of the measured variable “Provide service at promised time” indicates that the 73.1
percent of the variance of the variable is explained by the construct.

152
Figure 5.2: Reliability
Table 5.14: Reliability
Measured
Variables Construct
Standardized
Regression
Estimate
Unstandardized
Regression
Estimate
S.E. C.R. P
Squared
Multiple
Correlation
Keep
Promises <---
Reliability
.846 1.00
.716
Sympathetic
& reassuring <--- .840 1.004 .98 10.216
*** .706
Dependable <--- .798 .854 .90 9.445 ***
.637
Provide
service at
promised
time
<--- .855 .970 .92 10.447
***
.731
Keep records
accurately <--- .783 .877 .95 9.184
*** .614
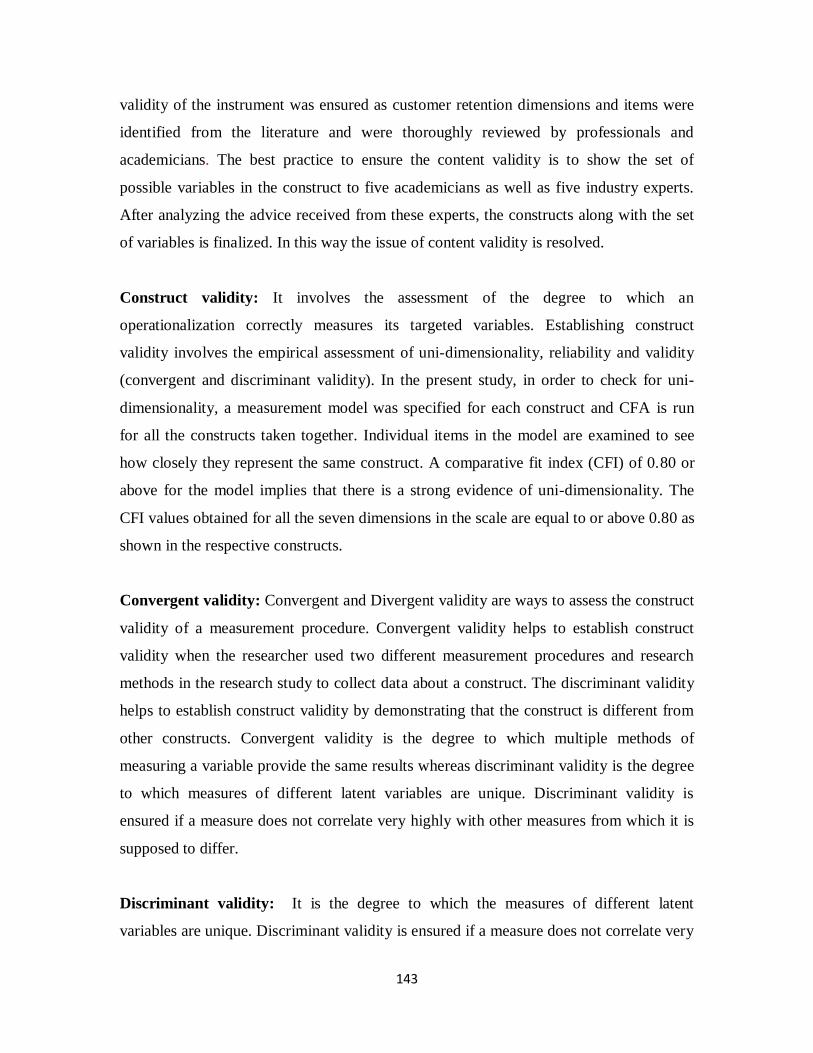
5.3.1 (c) Responsiveness: The third construct defined as the “Responsiveness” is
shown below in figure 4.2. This construct is designed to analyses responsiveness of
mobile telecom services offered by selected telecom operators. This construct consists of
five measured variables defined as below:
Exactly tell when service will be performed,
Not realistic to expect prompt service form staff
Don’t always willing to help customers
Provide service at promised time
Ok if staff is too busy to respond
Responsiveness is the willingness of the firms’ staff to help customers and provide
prompt service. These attributes are measurable in nature and express the defined

153
construct. In order to analyze the structure of the construct and measured variables, the
construct analysis is done in the research study. The construct “Responsiveness” along
with the measured variables is shown in the figure 5.3. The regression weights of each
measured variable are estimated and shown in table. The results indicate that all the
regression weights are high (greater than 0.5) and significant. Hence the convergent
validity of the construct is ensured and can be concluded that the construct significantly
explains the variables. The standardized regression weights as well as the multiple
squared correlations of the individual variables are shown in table .The standardized
regression weights indicate comparative influence of the construct to its variables. The
high value of the standardized regression weights indicates the higher influence of the
construct to the variable. The squared multiple correlations indicate the percentage of
variance of the measured variable that can be explained with the help of the variations in
the construct.
The results as shown in table 5.15 indicate that the perceived responsiveness is highly
influenced by the variable “Exactly tell when service will be performed”. This is due to
the fact that when a customer is going to use mobile telecom services, he/she would
definitely like to assure about the time of execution of service. The next most influencing
measured variable for the construct reliability is “Not realistic to expect prompt service
form staff”. The least influence (but statistically significant) of the construct is on the
variable “don't always willing to help customers”. The squared multiple correlation of the
measured variable “Exactly tells when service will be performed” indicates that the 80.1
percent of the variance of the variable is explained by the construct.
154
Figure 5.3: Responsiveness
Table 5.15: Responsiveness
Measured
Variables Construct
Standardized
Regression
Estimate
Unstandardized
Regression
Estimate
S.E. C.R. P
Squared
Multiple
Correlation
Exactly tell
when service
will be
performed
<---
Responsiveness
.912 1.000
.801
Not realistic
to expect
prompt
service form
staff
<--- .838 .960 .095 10.132 ***
.703
don't always
willing to
help
customers
<--- .711 .661 .081 8.116 ***
.506
Ok if staff is
too busy to
respond
<-- .662 .783 .107 7.342 ***
.438
155
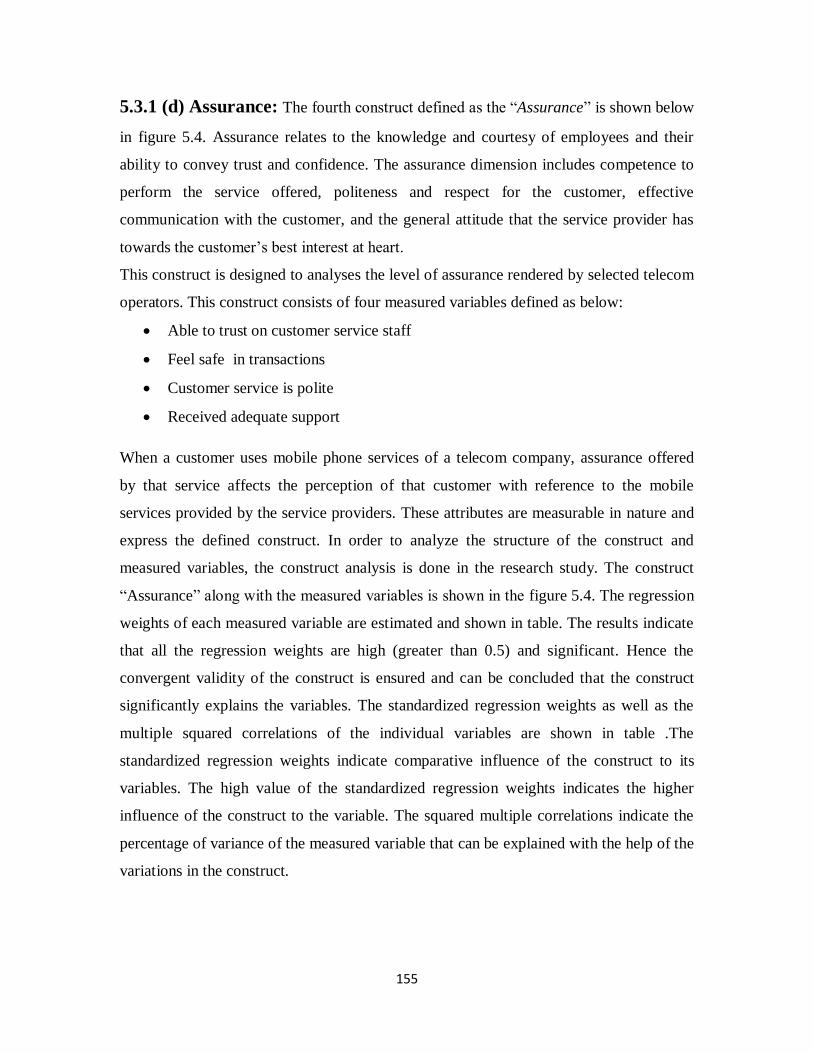
5.3.1 (d) Assurance: The fourth construct defined as the “Assurance” is shown below
in figure 5.4. Assurance relates to the knowledge and courtesy of employees and their
ability to convey trust and confidence. The assurance dimension includes competence to
perform the service offered, politeness and respect for the customer, effective
communication with the customer, and the general attitude that the service provider has
towards the customer’s best interest at heart.
This construct is designed to analyses the level of assurance rendered by selected telecom
operators. This construct consists of four measured variables defined as below:
Able to trust on customer service staff
Feel safe in transactions
Customer service is polite
Received adequate support
When a customer uses mobile phone services of a telecom company, assurance offered
by that service affects the perception of that customer with reference to the mobile
services provided by the service providers. These attributes are measurable in nature and
express the defined construct. In order to analyze the structure of the construct and
measured variables, the construct analysis is done in the research study. The construct
“Assurance” along with the measured variables is shown in the figure 5.4. The regression
weights of each measured variable are estimated and shown in table. The results indicate
that all the regression weights are high (greater than 0.5) and significant. Hence the
convergent validity of the construct is ensured and can be concluded that the construct
significantly explains the variables. The standardized regression weights as well as the
multiple squared correlations of the individual variables are shown in table .The
standardized regression weights indicate comparative influence of the construct to its
variables. The high value of the standardized regression weights indicates the higher
influence of the construct to the variable. The squared multiple correlations indicate the
percentage of variance of the measured variable that can be explained with the help of the
variations in the construct.

156
The results as shown in table 5.16 indicate that the assurance is highly influenced by the
variable “Customer service is polite”. This is due to the fact that when a customer is
going to use mobile telecom services, he/she will definitely evaluate whether the service
is politely rendered to him. The next most influencing measured variable for the construct
reliability is “Feel safe in transactions”. The least influence (but statistically significant)
of the construct is on the variable “Able to trust on customer service staff”. The squared
multiple correlation of the measured variable “Provide service at promised time”
indicates that the 70.4 percent of the variance of the variable is explained by the
construct.
Figure 5.4: Assurance
Table 5.16: Assurance
Measured
Variables Construct
Standardized
Regression
Estimate
Unstandardize
d Regression
Estimate
S.E
.
C.R
. P
Squared
Multiple
Correlation
Able to trust on
customer service
staff
<--- Assurance
.725 1.000
.526
157
Measured
Variables Construct
Standardized
Regression
Estimate
Unstandardize
d Regression
Estimate
S.E
.
C.R
. P
Squared
Multiple
Correlation
Feel safe in
transactions <--- .827 1.041 .135 7.723 ***
.685
Customer service
is polite <--- .839 1.229 .157 7.811 ***
.704
Received
adequate support <-- .820 1.219 .159 7.659 ***
.672
5.3.1 (e) Empathy: The fifth construct defined as the “Empathy” is shown below in
figure 5.5 This construct is designed to analyses the level of empathy perceived by
mobile telecom customers with reference to the service provided by selected telecom
operators. Empathy is the provision of caring, individualized attention to customers.
Empathy includes approachability, sense of security, and the efforts to understand the
customers’ needs. This construct consists of five measured variables defined as below:
Get individual attention,
Personal attention to customer
Know customer needs
Customer benefit from heart
Convenient business hours
When a customer uses mobile telecom services of a telecom company, empathy
perceived by customer with reference to the mobile services provided by the service
providers will play a key role in determining the perceived level of service quality. These
attributes are measurable in nature and express the defined construct. In order to analyze
the structure of the construct and measured variables, the construct analysis is done in the
research study. The construct “Empathy” along with the measured variables is shown in
the figure 5.5. The regression weights of each measured variable are estimated and shown
in table. The results indicate that all the regression weights are high (greater than 0.5) and
significant. Hence the convergent validity of the construct is ensured and can be
concluded that the construct significantly explains the variables. The standardized

158
regression weights as well as the multiple squared correlations of the individual variables
are shown in table .The standardized regression weights indicate comparative influence
of the construct to its variables. The high value of the standardized regression weights
indicates the higher influence of the construct to the variable. The squared multiple
correlations indicate the percentage of variance of the measured variable that can be
explained with the help of the variations in the construct.
The results as shown in table 5.17 indicate that the empathy is highly influenced by the
variable “Know customer needs”. This is due to the fact that when a customer is going to
use mobile telecom services, he/she will definitely evaluate whether the service is
designed according to his needs. The next most influencing measured variable for the
construct reliability is “Customer benefit from heart”. The least influence (but statistically
significant) of the construct is on the variable “Convenient hours”. The squared multiple
correlations of the measured variable “Know customer needs” indicate that the 75 percent
of the variance of the variable is explained by the construct.
Figure 5.5: Empathy

159
Table 5.17: Empathy
Measured
Variables Construct
Standardized
Regression
Estimate
Unstandardized
Regression
Estimate
S.E. C.R. P
Squared
Multiple
Correlation
Get individual
attention <---
Empathy
.757 1.000
.573
Personal
attention to
customer
<--- .725 .929 .129 7.199 ***
.526
Know
customer
needs
<--- .866 1.099 .127 8.676
*** .750
Customer
benefit from
heart
<--- .833 1.120 .134 8.364
*** .695
Convenient
hours <--- .695 .985 .143 6.873 ***
.484
5.3.1(f) Network Quality: The sixth construct defined as the “Network quality” is
shown below in figure 5.6. This construct is designed to analyses the level of network
quality perceived by mobile telecommunication customers. This construct consists of
five measured variables defined as below:
Sufficient geographical Coverage,
Provides termination free calls
Voice clarity
Call connected in first attempt
Able to make call at peak hours
Network quality is an indicator of mobile network performance in terms of voice quality,
call drip rate, network coverage and network congestion. In the context of cellular
mobile, communication network quality is a very important dimension. It is the capability
of a mobile network to provide services and to fulfill user’s expectations. These attributes
of network quality are measurable in nature and express the defined construct. In order to

160
analyze the structure of the construct and measured variables, the construct analysis is
done in the research study. The construct “network quality” along with the measured
variables is shown in the figure 5.6. The regression weights of each measured variable are
estimated and shown in table 5.18. The results indicate that all the regression weights are
high (greater than 0.5) and significant. Hence the convergent validity of the construct is
ensured and can be concluded that the construct significantly explains the variables. The
standardized regression weights as well as the multiple squared correlations of the
individual variables are shown in table .The standardized regression weights indicate
comparative influence of the construct to its variables. The high value of the standardized
regression weights indicates the higher influence of the construct to the variable. The
squared multiple correlations indicate the percentage of variance of the measured variable
that can be explained with the help of the variations in the construct.
The results as shown in table 5.18 indicate that the network quality is highly influenced
by the variable “voice clarity”. This is due to the fact that when a customer makes a call
on mobile then voice clarity is of immense importance for him, if some disturbance is
there during conversation on mobile phone that means network quality is poor.
Customers always give more weight-age to network quality provided by their service
provider. The next most influencing measured variable for the construct network quality
is “provides termination free calls”. This is natural as the termination free calls by the
telecom service provider provide satisfaction to the customers. The next influencing
measured variable for the construct network quality is “Sufficient geographic Coverage”
The least influence (but statistically significant) of the construct is on the variable “Able
to make call at peak hours”.

161
Figure 5.6: Network Quality
Table 5.18: Network Quality
Measured
Variables Construct
Standardized
Regression
Estimate
Unstandardized
Regression
Estimate
S.E. C.R. P
Squared
Multiple
Correlation
Sufficient
geographical
Coverage
<---
Network
Quality
.895 1.000
.498
Provides
termination free
calls
<--- .908 1.243 .142 8.728 ***
.825
Voice clarity
.952 1.283 .141 9.084 *** .906
call connected in
first attempt <--- .858 1.189 .144 8.263 ***
.736
Able to make call
at peak hours <-- .776 1.016 .136 7.481 ***
.602

162
5.3.1 (g) Convenience: The seventh construct defined as the “convenience” is shown
below in figure 5.7. This construct is designed to analyses the flexible and comfortable
facilities to suit the customers’ needs. This construct consists of four measured variables
defined as below:
Has convenient business hours,
Easy mechanism of queries and complaint lodging
Has flexibility in bills payment
Application formalities are simple
In mobile telecom services the convenience construct may depend upon various
attributes. These attributes are measurable in nature and express the defined construct. In
order to analyze the structure of the construct and measured variables, the construct
analysis is done in the research study. The construct “convenience” along with the
measured variables is shown in the figure 5.7. The regression weights of each measured
variable are estimated and shown in table 5.19. The results indicate that all the regression
weights are high (greater than 0.5) and significant. Hence the convergent validity of the
construct is ensured and can be concluded that the construct significantly explains the
variables. The standardized regression weights as well as the multiple squared
correlations of the individual variables are shown in table 5.19 .The standardized
regression weights indicate comparative influence of the construct to its variables. The
high value of the standardized regression weights indicates the higher influence of the
construct to the variable. The squared multiple correlations indicate the percentage of
variance of the measured variable that can be explained with the help of the variations in
the construct.
The results as shown in table 5.19 indicate that the convenience is highly influenced by
the variable “Has convenient business hours”. This is due to the fact that when a
customer is going to use mobile telecom services, he may have some expectation about
convenient business hours. The next most influencing measured variable for the construct
convenience is “Easy mechanism of queries and complaint lodging”. This is natural as
the customer always wants the service provider to listen to his complaints and queries
effectively and efficiently. The next influencing measured variable for the construct

163
convenience is “Application formalities are simple”. The customer always expect to have
simple formalities with reference to application and if wants to make some change in
tariff plans etc. The least influence (but statistically significant) of the construct is on the
variable “Has flexibility in bills payment”. The squared multiple correlation of the
measured variable “Has convenient business hours” indicate that the 81.5 percent of the
variance of the variable is explained by the construct.
Figure 5.7: Convenience
Table 5.19: Convenience
Measured
Variables Construct
Standardized
Regression
Estimate
Unstandardized
Regression
Estimate
S.E. C.R. P
Squared
Multiple
Correlation
Has convenient
business hours <---
Convenience
.903 1.000
.815
Easy
mechanism of
queries and
complaint
lodging
<--- .846 .859 .081 10.565 ***
.716
Has flexibility
in bills <--- .714 .674 .082 8.250 ***
.511

164
Measured
Variables Construct
Standardized
Regression
Estimate
Unstandardized
Regression
Estimate
S.E. C.R. P
Squared
Multiple
Correlation
payment
Application
formalities are
simple
<-- .748 .748 .085 8.836 ***
.560
5.3.1 (h) Interpersonal Relationship: The eighth construct defined as the “Interpersonal
Relationship” is shown below in figure 5.8. This construct is designed to analyses the
level of interpersonal relationship between customer and telecom service provider that
works as barrier in customer switching. This construct consists of seven measured
variables defined as below:
Bond with telecom operator,
Personal Friendship with telecom operator
Comfortable
Miss the operator if switch
Lose a friendly & comfortable relationship if change
Like public image of operator
My telecom operator is Caring
Interpersonal relationship means a psychological and social relationship that manifests
itself as care, trust, intimacy and communication (Gremler, 1995). The interpersonal
relationship built through recurrent interactions between a telecom operator and a
customer can strengthen the bond between them and finally lead to a long-term
relationship. Telecom companies are not alone in desiring a sustained relationship. These
attributes are measurable in nature and express the defined construct. In order to analyze
the structure of the construct and measured variables, the construct analysis is done in the
research study. The construct “Interpersonal relationship” along with the measured
variables is shown in figure 5.8. The regression weights of each measured variable are
estimated and shown in table 5.20. The results indicate that all the regression weights are
high (greater than 0.5) and significant. Hence the convergent validity of the construct is

165
ensured and can be concluded that the construct significantly explains the variables. The
standardized regression weights as well as the multiple squared correlations of the
individual variables are shown in table .The standardized regression weights indicate
comparative influence of the construct to its variables. The high value of the standardized
regression weights indicates the higher influence of the construct to the variable. The
squared multiple correlations indicate the percentage of variance of the measured variable
that can be explained with the help of the variations in the construct.
The results as shown in table 5.20 indicate that the interpersonal relationship is highly
influenced by the variable “Bond with telecom operator”. This is due to the fact that if
there is bond between customer and telecom operator, it will lead to sustained
relationship. The next most influencing measured variable for the construct Perceived
cost is “Miss the operator if switch”. This is natural as the sustained relationships offers a
lot of benefits to the customers, such as social benefits (reducing anxiety), economic
benefits (discount, time saving) and customization that commit themselves to establishing
relationships with a telecom operator that provide superior value benefits and create a
panic in the customer’s mind to miss the same if switch. The next influencing measured
variable for the construct interpersonal relationship is “ Comfortable”. When
customers are comfortable with service provider it will lead to building interpersonal
relationship. The next influencing measured variable for the construct interpersonal
relationship is “Personal Friendship with telecom operator”. With the passage of time if
customer is comfortable with the telecom service provider then personal friendship may
get developed between customer & telecom operator. The next influencing measured
variable for the construct interpersonal relationship is “Lose a friendly & comfortable
relationship if change”. Customer may have panic in his mind to lose a friendly &
comfortable relationship if switch to another telecom operator. The least influence (but
statistically significant) of the construct is on the variable “My telecom operator is
Caring”. The squared multiple correlation of the measured variable “Bond with telecom
operator” indicates that the 94.6 percent of the variance of the variable is explained by
the construct.

166
Figure 5.8: Interpersonal Relationship
Table 5.20: Interpersonal Relationship
Measured
Variables Construct
Standardized
Regression
Estimate
Unstandardized
Regression
Estimate
S.E. C.R. P
Squared
Multiple
Correlation
Bond with
telecom operator
Interpersonal
Relationship
.972 1.000
.946
Personal
Friendship with
telecom operator
.884 .901 .054 16.727 ***
.782
Comfortable
<- .905 .884 .048 18.365 ***
.819
Miss the operator if
switch <--- .915 .912 .047 19.268 ***
.837
Lose a friendly &
comfortable
relationship if
change
<--- .868 .857 .055 15.677 ***
.753
Like public image <--- .818 .829 .063 13.123 ***
.669
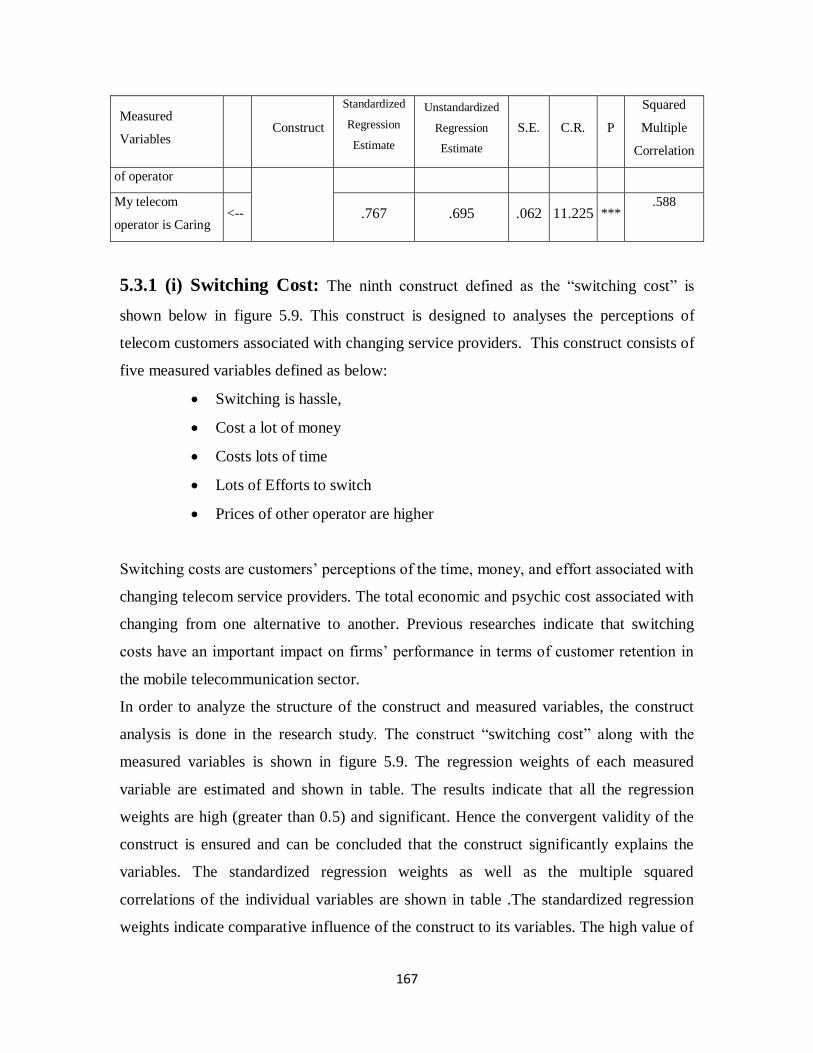
167
Measured
Variables Construct
Standardized
Regression
Estimate
Unstandardized
Regression
Estimate
S.E. C.R. P
Squared
Multiple
Correlation
of operator
My telecom
operator is Caring <-- .767 .695 .062 11.225 ***
.588
5.3.1 (i) Switching Cost: The ninth construct defined as the “switching cost” is
shown below in figure 5.9. This construct is designed to analyses the perceptions of
telecom customers associated with changing service providers. This construct consists of
five measured variables defined as below:
Switching is hassle,
Cost a lot of money
Costs lots of time
Lots of Efforts to switch
Prices of other operator are higher
Switching costs are customers’ perceptions of the time, money, and effort associated with
changing telecom service providers. The total economic and psychic cost associated with
changing from one alternative to another. Previous researches indicate that switching
costs have an important impact on firms’ performance in terms of customer retention in
the mobile telecommunication sector.
In order to analyze the structure of the construct and measured variables, the construct
analysis is done in the research study. The construct “switching cost” along with the
measured variables is shown in figure 5.9. The regression weights of each measured
variable are estimated and shown in table. The results indicate that all the regression
weights are high (greater than 0.5) and significant. Hence the convergent validity of the
construct is ensured and can be concluded that the construct significantly explains the
variables. The standardized regression weights as well as the multiple squared
correlations of the individual variables are shown in table .The standardized regression
weights indicate comparative influence of the construct to its variables. The high value of

168
the standardized regression weights indicates the higher influence of the construct to the
variable. The squared multiple correlations indicate the percentage of variance of the
measured variable that can be explained with the help of the variations in the construct.
The results as shown in table 5.21 indicate that the switching cost is highly influenced by
the variable “Costs lots of time”. This is due to the fact that when a customer is planning
to move to another telecom service provider may think that it will cost a lot of time to
him. The next most influencing measured variable for the construct switching cost is
“Switching is hassle”. Customers may feel that switching from one telecom service
provider to another is a hassle. The next influencing measured variable for the construct
switching cost is “Lots of Efforts to switch”. Customer may perceive that switching for
one service provider to another will require lots of effort and due to this they may cancel
to postpone the plan of switching.
The least influence (but statistically significant) of the construct is on the variable “Cost a
lot of money”. Monetary cost associated with switching has been considered by the
consumer least important in case of telecom services. The squared multiple correlation of
the measured variable “Cost of lot of time” indicates that the 70.3 percent of the variance
of the variable is explained by the construct.

169
Figure 5.9: Switching Cost
Table 5.21: Switching Cost
Measured
Variables Construct
Standardized
Regression
Estimate
Unstandardized
Regression
Estimate
S.E. C.R. P
Squared
Multiple
Correlation
Switching is
hassle <---
Switching
Cost
.824 1.000
.678
Cost a lot of
money <--- .736 1.012 .126 8.015 ***
.541
Costs lots of
time <--- .839 1.262 .132 9.542 ***
.703
Lots of
Efforts to
switch
<--- .818 1.108 .120 9.234 ***
.669
Prices of
other
operator are
higher
<-- .773 1.118 .131 8.550 ***
.597

170
5.3.1 (j) Attractiveness of alternatives: The tenth construct defined as the
“Attractiveness of alternatives” is shown below in figure 5.10. This construct is designed
to analyze the perceptions of telecom customers regarding the extent to which viable
competing alternatives are available in the market. Several researches have shown that
when viable alternatives are lacking, the probability of terminating an existing
relationship decreases (Jones et al., 2008).This construct consists of seven measured
variables defined as below:
Don’t care about the brand,
Trust on telecom operator
Likely to switch
Hate spending time in finding new operator
Uncertain about the quality of services if switch
Risk in switching
Feel uncertain
Attractiveness of alternatives means the reputation, image and service quality of the
replacing telecom operator, which are expected to be superior or more suitable than those
of the existing telecom operator. These attributes are measurable in nature and express
the defined construct. In order to analyze the structure of the construct and measured
variables, the construct analysis is done in the research study. The construct
“Attractiveness of alternatives” along with the measured variables is shown in the figure
5.10. The regression weights of each measured variable are estimated and shown in table
5.22. The results indicate that all the regression weights are high (greater than 0.5) and
significant. Hence the convergent validity of the construct is ensured and can be
concluded that the construct significantly explains the variables. The standardized
regression weights as well as the multiple squared correlations of the individual variables
are shown in table .The standardized regression weights indicate comparative influence
of the construct to its variables. The high value of the standardized regression weights
indicates the higher influence of the construct to the variable. The squared multiple
correlations indicate the percentage of variance of the measured variable that can be
explained with the help of the variations in the construct.

171
The results as shown in table 5.22 indicate that the attractiveness of alternatives is highly
influenced by the variable “Hate spending time in finding new operator”. Telecom
customers may hate to spend time to search for new telecom operator this practice will
become a switching barrier. The next most influencing measured variable for the
construct attractiveness of alternatives is “Likely to switch”. This is natural because as
and when telecom customers feel strong attractiveness of other alternatives, they may be
like to switch. The customer is having the habit of comparing the cost of the service with
the value derived from the service.
The next influencing measured variable for the construct attractiveness of alternatives is
“Feel uncertain”. When customers feel uncertain about remaining with the same telecom
service provider, it may be due to attractiveness of alternatives. The least influence (but
statistically significant) of the construct is on the variable “Risk in switching”. The
squared multiple correlation of the measured variable “Hate spending time in finding new
operator” indicates that the 64.3 percent of the variance of the variable is explained by
the construct.
Figure 5.10: Attractiveness of Alternatives

172
Table 5.22: Attractiveness of Alternatives
Measured
Variables Construct
Standardized
Regression
Estimate
Unstandardized
Regression
Estimate
S.E. C.R. P
Squared
Multiple
Correlation
Don’t care
about the
brand
<---
Attractiveness
of alternatives
.716 1.000
.512
Trust on
telecom
operator
<--- .703 1.218 .186 6.551 ***
.495
Likely to
switch <--- .723 1.190 .177 6.732 ***
.523
Hate spending
time in
finding new
operator
<--- .802 1.384 .186 7.423 ***
.643
Uncertain
about the
quality of
services if
switch
<--- .742 1.287 .187 6.902 ***
.551
Risk in
switching <--- .648 1.203 .199 6.045 ***
.420
Feel uncertain <--- .718 1.190 .178 6.682 *** .515
5.3.1 (k) Customer Satisfaction from technical factors : The eleventh construct
defined as the “Customer satisfaction with technical factors” is shown below in figure 5.11. This
construct is designed to analyze the satisfaction level of telecom customers about the technical
factors included in the telecom services. Four items were used to measure customer satisfaction
with technical factors. This construct consists of four measured variables defined as below:
Network Connectivity,
Coverage
Roaming Facility
Voice Clarity

173
Customer satisfaction constitutes a cardinal indicator of assessing the success of any business
organization. Satisfied customers are assets that ensure a regular cash flow for the business
organization in future. Customer satisfaction from technical factors is an experience-based
assessment made by the customer of how far his own expectations about the individual
characteristics or the overall technical functionality of the service obtained from the provider has
been fulfilled. These attributes are measurable in nature and express the defined construct. In
order to analyze the structure of the construct and measured variables, the construct analysis is
done in the research study. The construct “Customer satisfaction with technical factors” along
with the measured variables is shown in figure 5.11. The regression weights of each measured
variable are estimated and shown in table 5.23. The results indicate that all the regression weights
are high (greater than 0.5) and significant. Hence the convergent validity of the construct is
ensured and can be concluded that the construct significantly explains the variables. The
standardized regression weights as well as the multiple squared correlations of the individual
variables are shown in table .The standardized regression weights indicate comparative influence
of the construct to its variables. The high value of the standardized regression weights indicates
the higher influence of the construct to the variable. The squared multiple correlations indicate
the percentage of variance of the measured variable that can be explained with the help of the
variations in the construct.
The results as shown in table 5.23 indicate that the customer satisfaction from technical
factors is highly influenced by the variable “Network Connectivity”. This is due to the
fact that in telecom services, network connectivity is a major concern of consumers.
Network connectivity is a technical aspect of telecom service & if it is good, customers
may feel satisfied.
The next most influencing measured variable for the construct customer satisfaction from
technical factors is “Coverage”. In telecom service coverage has always been an important
consideration by consumers. Telecom customers generally prefer those telecom services which
provide wide coverage and it is also a matter of deciding the satisfaction level of the customers.
The next influencing measured variable for the construct customer satisfaction from technical
factors is “Roaming Facility”. For those customers who travel a lot, roaming facility is always
an important concern. The least influence (but statistically significant) of the construct is on the
variable “Voice Clarity”. The squared multiple correlation of the measured variable “Network
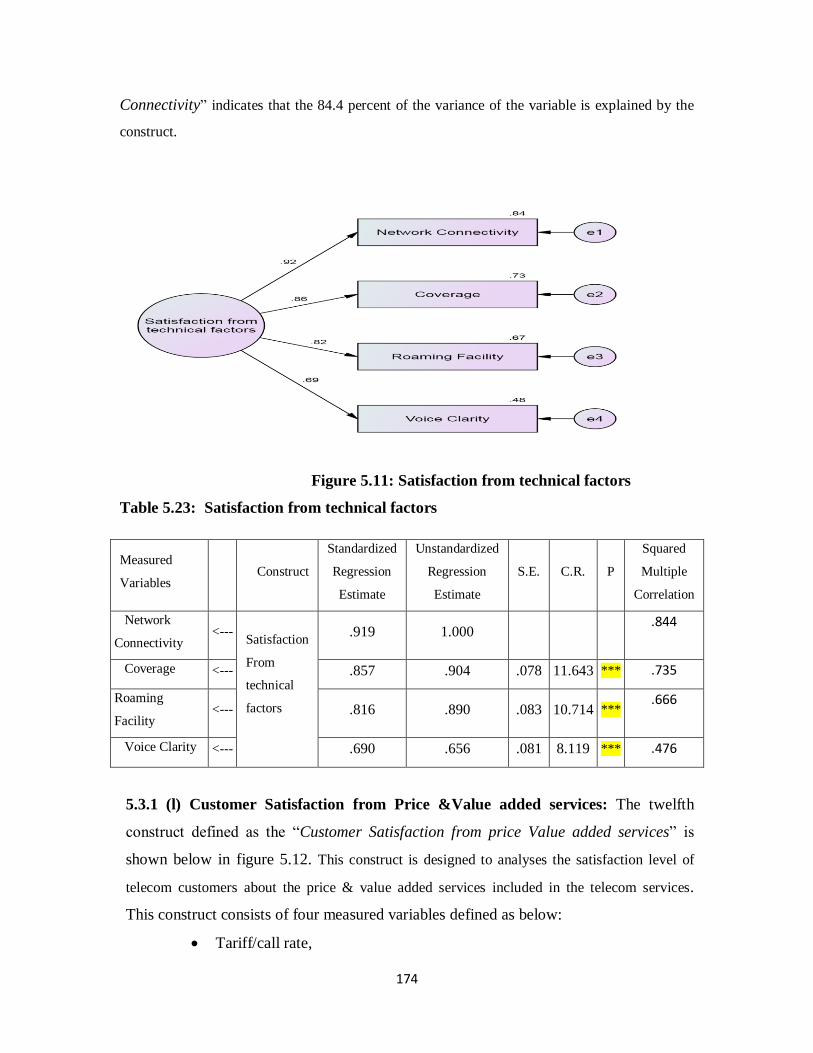
174
Connectivity” indicates that the 84.4 percent of the variance of the variable is explained by the
construct.
Figure 5.11: Satisfaction from technical factors
Table 5.23: Satisfaction from technical factors
Measured
Variables Construct
Standardized
Regression
Estimate
Unstandardized
Regression
Estimate
S.E. C.R. P
Squared
Multiple
Correlation
Network
Connectivity <---
Satisfaction
From
technical
factors
.919 1.000
.844
Coverage <--- .857 .904 .078 11.643 *** .735
Roaming
Facility <--- .816 .890 .083 10.714 ***
.666
Voice Clarity <--- .690 .656 .081 8.119 *** .476
5.3.1 (l) Customer Satisfaction from Price &Value added services: The twelfth
construct defined as the “Customer Satisfaction from price Value added services” is
shown below in figure 5.12. This construct is designed to analyses the satisfaction level of
telecom customers about the price & value added services included in the telecom services.
This construct consists of four measured variables defined as below:
Tariff/call rate,

175
Value added service
Transparency in billing
Sales promotion offers
Customer satisfaction from price & value added services is an experience-based assessment made
by the customer of how far his own expectations about the individual characteristics or the overall
price & value added of the service obtained from the provider have been fulfilled.
The attributes like price and value added services are measurable in nature and express
the defined construct. In order to analyze the structure of the construct and measured
variables, the construct analysis is done in the research study. The construct “Customer
Satisfaction from price & value added services” along with the measured variables is
shown in figure 5.12. The regression weights of each measured variable are estimated
and shown in table 5.24. The results indicate that all the regression weights are high
(greater than 0.5) and significant. Hence the convergent validity of the construct is
ensured and can be concluded that the construct significantly explains the variables. The
standardized regression weights as well as the multiple squared correlations of the
individual variables are shown in table 5.24 .The standardized regression weights indicate
comparative influence of the construct to its variables. The high value of the standardized
regression weights indicates the higher influence of the construct to the variable. The
squared multiple correlations indicate the percentage of variance of the measured variable
that can be explained with the help of the variations in the construct.
The results as shown in table 5.24 indicate that the customer satisfaction from price &
value added services are highly influenced by the variable “Sales promotion offers”. This
is due to the fact that when a customer is going to buy a telecom service, he may have
some influence from the sales promotion offers. The next most influencing measured
variable for the construct is “Tariff/call rate”. Tariff/call rate plays a very important role
in deciding the satisfaction level of customers with reference to the price and value added
service delivered by the telecom service. The next influencing measured variable for the
construct customer satisfaction from price & value added service is “Value added
service”. The customer is having the habit of comparing the cost of the service with the
value added service delivered by the service. The least influence (but statistically

176
significant) of the construct is on the variable “Transparency in billing”. Transparency in
billing may be less important in case of prepaid mobile telecom customers and more
important in case of post paid telecom customers. The squared multiple correlation of the
measured variable “Sales promotion offers” indicates that the 77.6 percent of the variance
of the variable is explained by the construct.
Figure 5.12: Price and value added services
Table 5.24 Customer Satisfaction with price & value added services
Measured
Variables Construct
Standardized
Regression
Estimate
Unstandardized
Regression
Estimate
S.E. C.R. P
Squared
Multiple
Correlation
Tariff/call rate <---
Value
added
services
.860 1.000
.740
Value added
service <--- .826 .934 .093 10.040 ***
.682
Transparency in
billing <--- .768 .847 .094 8.987 ***
.590
Sales promotion
offers .881 1.094 .099 11.006 ***
.776

177
5.3.1 (m) Customer Satisfactionfrom convenience factor: The thirteenth construct
defined as the “customer satisfaction from convenience” is shown below in figure 5.13.
This construct is designed to analyses the customer satisfaction level from the
convenience factor in telecom services. This construct consists of four measured
variables defined as below:
Ease of availability of Recharge,
Customer care service
Advertisement
Dealer network
Customer satisfaction from convenience is an experience-based assessment made by the customer
of how far his own expectations about the individual characteristics or the overall convenience &
customer care etc. of the service obtained from the provider have been fulfilled.
The attributes like convenience & customer care etc. are measurable in nature and express
the defined construct. In order to analyze the structure of the construct and measured
variables, the construct analysis is done in the research study. The construct “Customer
Satisfaction from convenience” along with the measured variables is shown in figure
5.13. The regression weights of each measured variable are estimated and shown in table
5.25. The results indicate that all the regression weights are high (greater than 0.5) and
significant. Hence the convergent validity of the construct is ensured and can be
concluded that the construct significantly explains the variables. The standardized
regression weights as well as the multiple squared correlations of the individual variables
are shown in table 5.25.The standardized regression weights indicate comparative
influence of the construct to its variables. The high value of the standardized regression
weights indicates the higher influence of the construct to the variable. The squared
multiple correlations indicate the percentage of variance of the measured variable that can
be explained with the help of the variations in the construct.
The results as shown in table 5.25 indicate that the customer satisfaction from
convenience is highly influenced by the variable “Ease of availability of Recharge”. This
is due to the fact that in telecom services a customer has to recharge frequently and for
the same easy availability of recharge facility is of high concern always. The next most

178
influencing measured variable for the construct is “Dealer network”. The next
influencing measured variable for the construct customer satisfaction from convenience is
“Advertisement”. Now a day’s customers are dependent on advertisement for information
about any product or service. So if customers are getting relevant information about
telecom services via advertisement, it is a matter of convenience for customers. The least
influence (but statistically significant) of the construct is on the variable “Customer care
service”. Transparency in billing may be less important in case of prepaid mobile telecom
customers and more important in case of post paid telecom customers. The squared
multiple correlation of the measured variable “Ease of availability of Recharge” indicate
that the 87.6 percent of the variance of the variable is explained by the construct.
Figure 5.13: Customer Satisfaction from convenience

179
Table 5.25: Customer Satisfaction from convenience
Measured
Variables Construct
Standardized
Regression
Estimate
Unstandardized
Regression
Estimate
S.E. C.R. P
Squared
Multiple
Correlation
Ease of
availability of
Recharge
<---
Convenience
.936 1.000
.876
Customer care
service <--- .718 .757 .085 8.853 ***
.516
Advertisement <--- .719 .773 .087 8.866 *** .517
Dealer network .888 .859 .067 12.865 *** .789
5.3.1 (n) Customer Retention: The fourteenth construct defined as the “Customer
retention” is shown below in figure 5.14. This construct is designed to analyses the
retention decision taken by the customer. This construct consists of eight measured
variables defined as below:
My operator would be my first choice
Plan to continue relationship
Recommend the operator
Encourage friends & relatives
Loyal to my operator
Said positive things about my operator
Relationship is important for me
My operator is first choice
Customer retention is the future propensity of the customers to stay with their service
provider Customer retention reflect from various behavior of customer like when
customer encourage friends and relatives to do business with the same operator to which
the customer is loyal.
The attributes like plan to continue relationship, recommend the operator, operator is
first choice and encourage friends and relatives are measurable in nature and express the

180
defined construct. In order to analyze the structure of the construct and measured
variables, the construct analysis is done in the research study. The construct “Customer
Retention” along with the measured variables is shown in the figure 5.14. The regression
weights of each measured variable are estimated and shown in table 5.26. The results
indicate that all the regression weights are high (greater than 0.5) and significant. Hence
the convergent validity of the construct is ensured and can be concluded that the construct
significantly explains the variables. The standardized regression weights as well as the
multiple squared correlations of the individual variables are shown in table 5.26. The
standardized regression weights indicate comparative influence of the construct to its
variables. The high value of the standardized regression weights indicates the higher
influence of the construct to the variable. The squared multiple correlations indicate the
percentage of variance of the measured variable that can be explained with the help of the
variations in the construct.
The results as shown in table 5.26 indicate that the customer retention is highly
influenced by the variable “My operator would be my first choice”. This is due to the fact
that in telecom services when a customer considers his telecom operator his first choice
that shows his loyalty towards the service provider. The next most influencing measured
variable for the construct is “Said positive things about my operator”. The next
influencing measured variable for the construct customer retention is “Plan to continue
relationship”. If a customer decides to continue with the same service provider that
means retention is there and telecom companies’ retention strategies are successful. The
least influence (but statistically significant) of the construct is on the variable
“Relationship is important for me”.. The squared multiple correlation of the measured
variable “My operator would be my first choice” indicates that the 98.9 percent of the
variance of the variable is explained by the construct.

181
Figure 5.14: Customer Retention
Table 5.26: Customer Retention
Measured
Variables Construct
Standardized
Regression
Estimate
Unstandardized
Regression
Estimate
S.E. C.R. P
Squared
Multiple
Correlation
My operator would
be
my first choice
<---
Customer
Retention
.994 1.000
.989
Plan to continue
relationship <--- .935 .886 .035 24.974 ***
.874
Recommend the
operator <--- .908 .833 .047 17.633 ***
.767
Encourage friends
& relatives <--- .913 .868 .040 21.481 ***
.833

182
Measured
Variables Construct
Standardized
Regression
Estimate
Unstandardized
Regression
Estimate
S.E. C.R. P
Squared
Multiple
Correlation
Loyal to my
operator <--- .926 .877 .038 23.370 ***
.857
Said positive
things
about my operator
<--- .940 .886 .034 26.065 ***
.884
Relationship is
important for me <--- .876 .842 .040 20.910 ***
.825
My operator is first
choice <--- .923 .920 .040 23.014 ***
.853
5.4 Confirmatory factor analysis (CFA)
Confirmatory factor analysis (CFA) provides enhanced control for assessing unidimensionality
(i.e., the extent to which items on a factor measure one single construct) than exploratory factor
analysis (EFA) and is more in line with the overall process of construct validation. In this
research study, confirmatory factor analysis model is run through AMOS software. Confirmatory
Factor Analysis is a statistical technique used to verify the factor structure of a set of observed
variables. Confirmatory Factor Analysis (CFA) allows the researcher to test the hypothesis that a
relationship between observed variable and the underlying latent construct exists. The researcher
uses the knowledge of the theory, empirical research or both, postulates the relationship pattern a
priori and then tests the hypothesis statistically.
Confirmatory Factor Analysis could occur with the development of measurement
instruments such as satisfaction scales, attitude or customer service questionnaires. In this
research a blueprint is developed, questions written, appropriate scales were determined.
The research instrument was used after conducting spade work and pilot survey, data
collected and Confirmatory Factor Analysis completed. Confirmatory Factor Analysis
allows the researcher to test the hypothesis that a relationship between the observed
variables and their underlying latent construct (s) exists.

183
5.4.1 Perceived service quality: Perceived service quality is an overall evaluation of a
specific service firm that results from comparing the firms’ performance with the
customers’ general expectations of how the firm should perform in that industry. In this
research study seven dimensions of service quality (Tangibility, Reliability, Assurance,
Responsiveness, Empathy, Network Quality, and Convenience) has been included.
CFA is applied on various dimensions of perceived service quality in order to test the
construct validity [convergent and discriminant validity]. Results of the CFA are shown
below with the help of table and diagram.

184
Figure 5.15: CFA of Perceived Service Quality
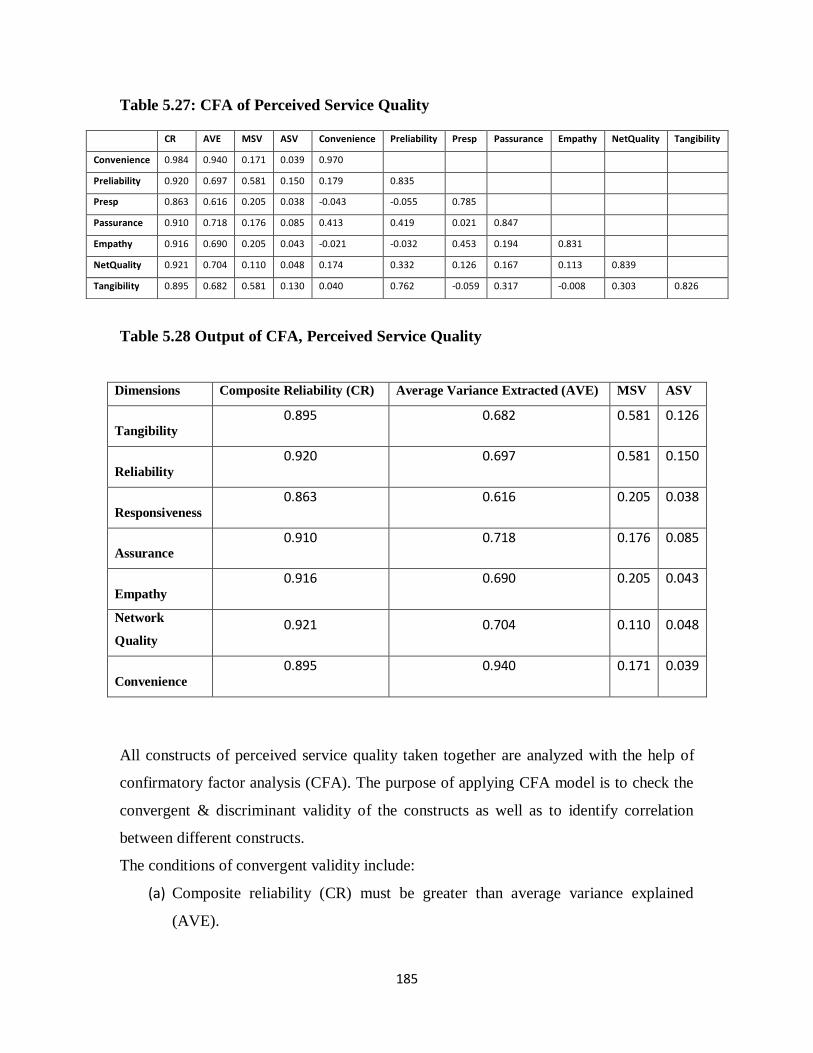
185
Table 5.27: CFA of Perceived Service Quality
Table 5.28 Output of CFA, Perceived Service Quality
Dimensions Composite Reliability (CR) Average Variance Extracted (AVE) MSV ASV
Tangibility
0.895 0.682 0.581 0.126
Reliability
0.920 0.697 0.581 0.150
Responsiveness
0.863 0.616 0.205 0.038
Assurance
0.910 0.718 0.176 0.085
Empathy
0.916 0.690 0.205 0.043
Network
Quality
0.921 0.704 0.110 0.048
Convenience
0.895 0.940 0.171 0.039
All constructs of perceived service quality taken together are analyzed with the help of
confirmatory factor analysis (CFA). The purpose of applying CFA model is to check the
convergent & discriminant validity of the constructs as well as to identify correlation
between different constructs.
The conditions of convergent validity include:
(a) Composite reliability (CR) must be greater than average variance explained
(AVE).
CR AVE MSV ASV Convenience Preliability Presp Passurance Empathy NetQuality Tangibility
Convenience 0.984 0.940 0.171 0.039 0.970
Preliability 0.920 0.697 0.581 0.150 0.179 0.835
Presp 0.863 0.616 0.205 0.038 -0.043 -0.055 0.785
Passurance 0.910 0.718 0.176 0.085 0.413 0.419 0.021 0.847
Empathy 0.916 0.690 0.205 0.043 -0.021 -0.032 0.453 0.194 0.831
NetQuality 0.921 0.704 0.110 0.048 0.174 0.332 0.126 0.167 0.113 0.839
Tangibility 0.895 0.682 0.581 0.130 0.040 0.762 -0.059 0.317 -0.008 0.303 0.826

186
(b) Individual Composite reliability (CR) of the constructs should be greater than .5.
(c) The individual average variance explained (AVE) should be greater than .5.
The results of CFA as shown in table 5.27 & 5.28 reveal that all above mentioned
conditions of convergent validity are fulfilled. Hence, it can be concluded that the
constructs are valid in terms of convergent validity.
In addition to this the different conditions of discriminant validity are as follows:
(a) Average variance explained (AVE) should be greater than MSV.
(b) AVE should be greater than ASV.
(c) AVE should be greater than .5
The results of CFA as shown in table 5.27 reveal that all above mentioned conditions of
discriminant validity are fulfilled. Hence, it can be concluded that the constructs are valid
in terms of convergent validity.
5.4.2 Customer Satisfaction
Customer satisfaction refers to the assessment of all interactions with product or service
from a provider, relative to the expectations. It seems logical that a highly satisfied
customer would be retained customer. In this research study the efforts are made to
analyze the impact of customer satisfaction in mobile telecom sector on customer
retention. CFA is applied on the various dimensions of customer satisfaction in order to
test the construct validity [convergent and discriminant validity]. Results of the CFA are
shown below with the help of table and diagram.

187
Figure 5.16: CFA of Customer Satisfaction
All constructs of customer satisfaction taken together analyzed with the help of
confirmatory factor analysis (CFA). The purpose of applying CFA model is to check the
convergent & discriminant validity of the constructs as well as to identify correlation
between different constructs.
The conditions of convergent validity include:
(d) Composite reliability (CR) must be greater than average variance explained
(AVE).
(e) Individual Composite reliability (CR) of the constructs should be greater than .5.
(f) The individual average variance explained (AVE) should be greater than .5.
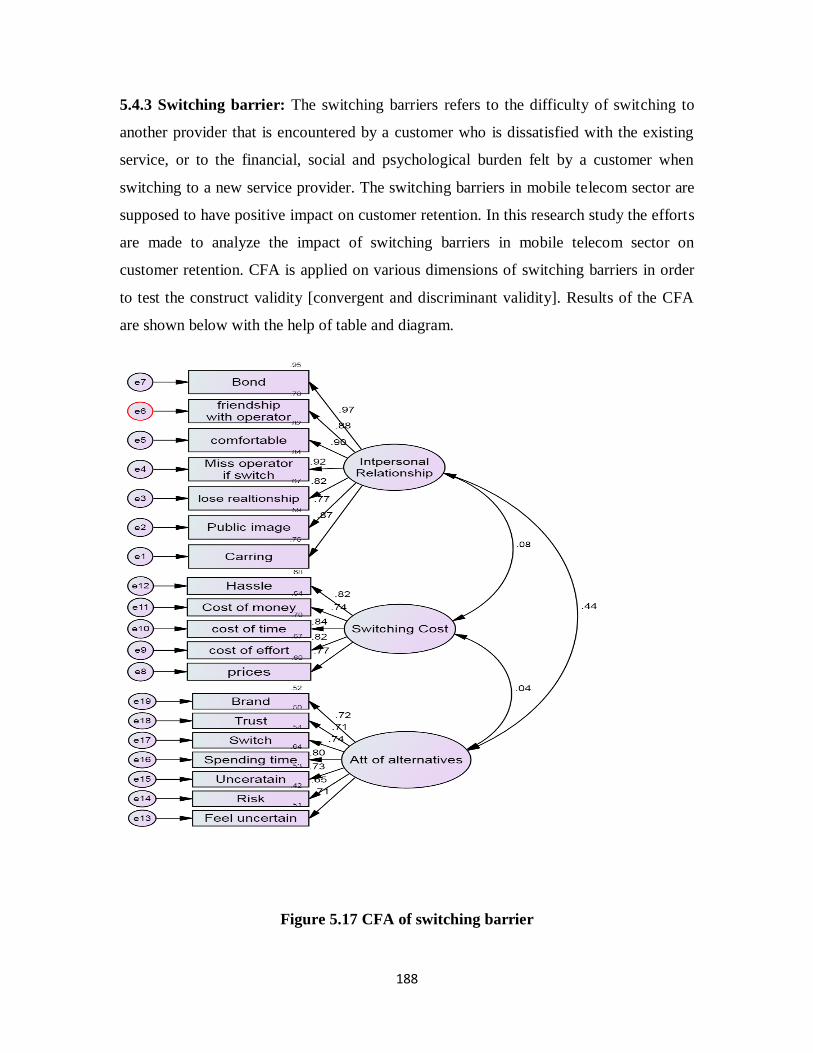
188
5.4.3 Switching barrier: The switching barriers refers to the difficulty of switching to
another provider that is encountered by a customer who is dissatisfied with the existing
service, or to the financial, social and psychological burden felt by a customer when
switching to a new service provider. The switching barriers in mobile telecom sector are
supposed to have positive impact on customer retention. In this research study the efforts
are made to analyze the impact of switching barriers in mobile telecom sector on
customer retention. CFA is applied on various dimensions of switching barriers in order
to test the construct validity [convergent and discriminant validity]. Results of the CFA
are shown below with the help of table and diagram.
Figure 5.17 CFA of switching barrier

189
Table 5.29: Output of CFA, switching barriers
CR AVE MSV ASV
Interpersonal
Relationship Switching cost AOA
Interpersonal
Relationship 0.959 0.771 0.196 0.102 0.878
Switching cost 0.898 0.638 0.007 0.004 0.083 0.799
AOA 0.884 0.523 0.196 0.099 0.443 0.044 0.723
All constructs of switching barriers taken together are analyzed with the help of
confirmatory factor analysis (CFA). The purpose of applying CFA model is to check the
convergent & discriminant validity of the constructs as well as to identify correlation
between different constructs.
The conditions of convergent validity include:
(g) Composite reliability (CR) must be greater than average variance explained
(AVE).
(h) Individual Composite reliability (CR) of the constructs should be greater than .5.
(i) The individual average variance explained (AVE) should be greater than .5.
The results of CFA as shown in table 5.30 reveal that all above mentioned conditions of
convergent validity are fulfilled. Hence, it can be concluded that the constructs are valid
in terms of convergent validity.
In addition to this the different conditions of discriminant validity are as follows:
(a) Average variance explained (AVE) should be greater than MSV.
(b) AVE should be greater than ASV.
(c) AVE should be greater than .5
The results of CFA as shown in table 5.30 reveal that all above mentioned conditions of
discriminant validity is fulfilled. Hence, it can be concluded that the constructs are valid
in terms of convergent validity.

190
5.5 Hypothesis Testing
5.5.1: Individual cause and effect relationship between various determinants on
customer retention.
(a) Impact of perceived service quality on customer retention.
According to Parasuraman, Berry and Zethaml (1988), Perceived service quality is the
result of the customers’ comparison of expected service quality with the service received.
The perceived service quality in mobile telecom sector is supposed to have positive
impact on customer retention. In this research study the efforts are made to analyze the
impact of perceived service quality in mobile telecom sector on customer retention. The
following hypothesis is tested with the help of structural equation modeling (SEM).
Figure 5.17 represents the theoretical hypothesis to be tested.
Figure 5.18: Service quality and customer retention

191
Table 5.30: Relationship between Service quality and customer retention
Exogenous
Construct
Endogenous
Construct
Standardized
Regression
Coefficient
Unstandardized
Regression
Coefficient
CR P Value Squared
multiple
correlation
Service
Quality
Customer
Retention
.849 3.444 5.033 .000
.721
Table 5.31 Model fit index Service quality and customer retention
Fitness of Model Index CFI NFI RFI RMSEA LO 90 Hi 90
Value .969 .920 .904 .076 .051 .100
H1: The perceived service quality in mobile telecom sector has a significant positive
impact on customer retention.
The results of the above mentioned hypothesis is shown in table 5.31. The results indicate
that the structured regression rate of the relationship between perceived service quality
and customer retention is .849 and is found to be significant (p=.000) . Hence, with the
95% confidence level the null hypothesis of no cause and effect relationship cannot be
accepted. Hence, it can be concluded that the perceived quality of services in mobile
telecom sector have a positive significant impact on customer retention. Kangis and
Zhang (2000) explored the link between service quality and customer retention in
banking. Their findings showed that service quality had an effect on customer retention
through doing business with the bank.
The goodness of fit indicators such as CFI (.969 ), GFI (.845), NFI (.920), AGFI (.788),
RMSEA (.076) indicate that the tested structural equation model is have a significant fit.

192
(b) The customer satisfaction in mobile telecom sector has a significant
positive impact on customer retention.
Customer satisfaction refers to the assessment of all interactions with product or service
from a provider, relative to expectations. It seems logical that a highly satisfied customer
would be a retained customer. The customer satisfaction in mobile telecom sector is
supposed to have positive impact on customer retention. In this research study the efforts
made analyze the impact of customer satisfaction in mobile telecom sector on customer
retention. The following hypothesis is tested with the help of structural equation
modeling (SEM). The figure 5.18 represented the theoretical hypothesis to be tested.
H2: The customer satisfaction in mobile telecom sector has a significant positive impact
on customer retention.
Figure 5.19: Customer satisfaction and customer retention

193
Table 5.32 Relationship between customer satisfaction and customer retention
Exogenous
Construct
Endogenous
Construct
Standardized
Regression
Coefficient
Unstandardized
Regression
Coefficient
CR P Value Squared
multiple
correlation
Customer
Satisfaction
Customer
Retention
.865 1.842 14.440 .000
.748
Table 5.33: Model fit relationship between customer satisfaction and customer
retention
Fitness of Model Index CFI NFI RFI RMSEA LO 90 Hi 90
Value .998 .976 .969 .031 .037 .077
The results of the above mentioned hypothesis is shown in table 5.33. The results indicate
that the structured regression rate of the relationship between customer satisfaction and
customer retention is .865 and is found to be significant (p=.000) . Hence, with the 95%
confidence level the null hypothesis of no cause and effect relationship cannot be
accepted. Hence, it can be concluded that the customer satisfaction in mobile telecom
sector have a positive significant impact on customer retention. Johnson et al (2001) also
found same in his study concerned with mobile telecommunication services that satisfied
customer are retained customers.
The goodness of fit indicators such as CFI (.998 ), GFI (.916), NFI (.976), AGFI (.870),
RMSEA (.031) indicate that the tested structural equation model is have a significant fit.
(C) Impact of switching barriers on customer retention.
The switching barriers refers to the difficulty of switching to another provider that is
encountered by a customer who is dissatisfied with the existing service, or to the
financial, social and psychological burden felt by a customer when switching to a new

194
service provider. The switching barriers in mobile telecom sector are supposed to have
positive impact on customer retention. In this research study the efforts are made to
analyze the impact of switching barriers in mobile telecom sector on customer retention.
The following hypothesis is tested with the help of structural equation modeling (SEM).
The figure 5.19 represented the theoretical hypothesis to be tested.
H3: The switching barrier in mobile telecom sector has a significant positive impact on
customer retention.
The results of the above mentioned hypothesis is shown in table 5.35. The results indicate
that the structured regression rate of the relationship between switching barrier and
customer retention is .704 and is found to be significant (p=.000) . Hence, with the 95%
confidence level the null hypothesis of no cause and effect relationship cannot be
accepted. Hence, it can be concluded that the switching barriers in mobile telecom sector
have a positive significant impact on customer retention.
Figure 5.20: Switching barriers and customer retention

195
Table 5.34 Relationship between switching barriers and customer retention
Exogenous
Construct
Endogenous
Construct
Standardized
Regression
Coefficient
Unstandardized
Regression
Coefficient
CR P Value Squared
multiple
correlation
Switching
barriers
Customer
Retention
.704 1.451 6.556 .000
.495
Table 5.35: Model fit of relationship between switching barriers and customer
retention
Fitness of Model Index CFI NFI RFI RMSEA LO 90 Hi 90
Value .985 .956 .944 .071 .030 .105
5.5.2: Difference between service quality expectations and perceived service quality
levels in mobile telecommunications services.
In Indian mobile telecom sector the companies offer different type of services to the
customers. The customers using telecom services get the knowledge about services
through advertisements, friends and relatives and other sources. When a customer is
going to buy mobile telecom services he or she is having certain expectations about the
services. After buying the services, the customer evaluates the actual performance of the
telecom service. The comparison of expected and perceived performance of the telecom
service providers will results into the level of satisfaction and the attitude for staying with
the service. In this research study an effort is made to analyze the perception of the
customers with respect to the expected quality of service as well as the perception about
service quality of the telecom services. Independent sample T-test is applied to analyze
the difference between expected and perceived service quality. The Independent sample
T-test is used to test the null hypothesis, “There is no significant difference between
expected & perceived service quality”. The various determinants of service quality were

196
included in the questionnaire and respondents were asked to rate these statements in the
scale of 1 to 5, where 1 means strongly agree and 5 means strongly disagree.
H04: There is no significant difference between service quality expectation levels and
customers’ service quality perception for mobile telecommunication customers.
The results of independent sample T-test are shown in table 5.37 to table 5.43.
(1) Tangibility: The results of independent sample t-test on various statements of
tangibility are shown in table 5.37.
Table 5.36: Independent Sample t Test w.r.t. expected and perceived tangibility.
Variables Group Mean
(S.D.)
t-statistic
(P-value)
Remarks
Up to date
Equipment
Expectation 3.98
(1.128) 5.039
(.000)
Null Hypothesis
rejected
Perception 3.33
(1.164)
Visually appealing
Physical facilities
Expectation 3.95
(.999) 4.995
(.000)
Null Hypothesis
rejected
Perception 3.28
(1.129)
Service staff
appear neat & well
dressed
Expectation 3.73
(1.072 3.146
(.002)
Null Hypothesis
rejected
Perception 3.26
(1.079)
Physical facilities
match with telecom
services
Expectation 3.87
(.939) 4.160
(.000)
Null Hypothesis
rejected
Perception 3.33
(1.138)
The results of the independent sample t-test (as shown above), the probability value of t-
statistic is less than 5% level of significance. Therefore, with 95% confidence level the
null hypothesis of no significant difference between expected and perceived tangibility
aspect of service quality cannot be accepted. Hence, it can be concluded that the expected
and perceived tangibility aspect of service quality in telecom sector are significantly
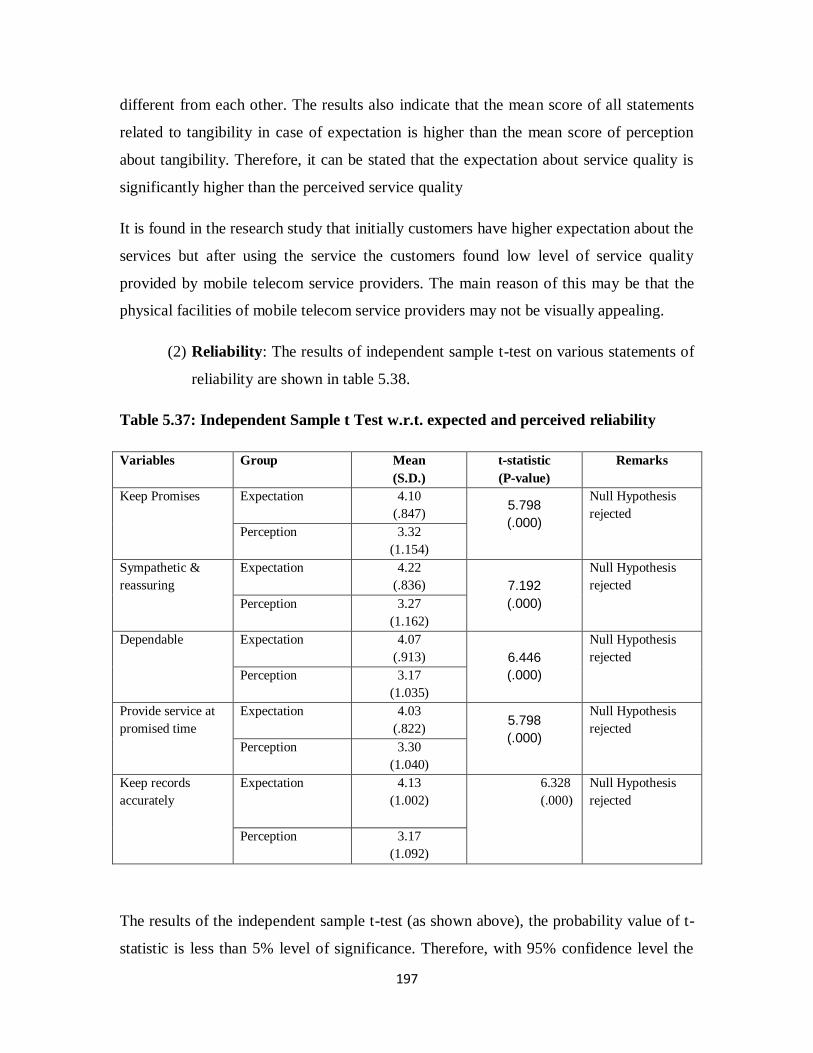
197
different from each other. The results also indicate that the mean score of all statements
related to tangibility in case of expectation is higher than the mean score of perception
about tangibility. Therefore, it can be stated that the expectation about service quality is
significantly higher than the perceived service quality
It is found in the research study that initially customers have higher expectation about the
services but after using the service the customers found low level of service quality
provided by mobile telecom service providers. The main reason of this may be that the
physical facilities of mobile telecom service providers may not be visually appealing.
(2) Reliability: The results of independent sample t-test on various statements of
reliability are shown in table 5.38.
Table 5.37: Independent Sample t Test w.r.t. expected and perceived reliability
Variables Group Mean
(S.D.)
t-statistic
(P-value)
Remarks
Keep Promises Expectation 4.10
(.847) 5.798
(.000)
Null Hypothesis
rejected Perception 3.32
(1.154)
Sympathetic &
reassuring
Expectation 4.22
(.836) 7.192
(.000)
Null Hypothesis
rejected
Perception 3.27
(1.162)
Dependable Expectation 4.07
(.913) 6.446
(.000)
Null Hypothesis
rejected Perception 3.17
(1.035)
Provide service at
promised time
Expectation 4.03
(.822) 5.798
(.000)
Null Hypothesis
rejected
Perception 3.30
(1.040)
Keep records
accurately
Expectation 4.13
(1.002)
6.328
(.000)
Null Hypothesis
rejected
Perception 3.17
(1.092)
The results of the independent sample t-test (as shown above), the probability value of t-
statistic is less than 5% level of significance. Therefore, with 95% confidence level the

198
null hypothesis of no significant difference between expected and perceived reliability
aspect of service quality cannot be accepted. Hence, it can be concluded that the expected
and perceived reliability aspect of service quality in telecom sector are significantly
different from each other. The results also indicate that the mean score of all statements
related to tangibility in case of expectation is higher than the mean score of perception
about tangibility. Therefore, it can be stated that the expectation about service quality is
significantly higher than the perceived service quality It is found in the research study
that initially customers have higher expectation about the reliability aspect of services but
after using the service the customers found low level of perceived reliability provided by
mobile telecom service providers. The main reason of this may be that the customers may
not consider the mobile telecom operator so much reliable.
(3) Responsiveness: The results of independent sample t-test on various
statements of responsiveness are shown in table 5.39.
Table 5.38: Independent Sample t Test w.r.t. expected and perceived responsiveness.
Variables Group Mean
(S.D.)
t-statistic
(P-value)
Remarks
Exactly tell when
service will be
performed
Expectation 2.69
(1.270)
3.342
(.001)
Null Hypothesis
rejected Perception 2.27
(1.061)
Not realistic to
expect prompt
service form staff
Expectation 2.61
(1.270) 2.085
(.040)
Null Hypothesis
rejected Perception 2.31
(1.061)
Don’t always have
to willing to help
customers
Expectation 2.85
(1.067) 3.071
(.003)
Null Hypothesis
rejected Perception 2.45
(.903)
Ok if staff is too
busy to respond Expectation 2.80
(1.054) 3.171
(.002)
Null Hypothesis
rejected Perception 2.41
(1.026)
The results of the independent sample t-test (as shown above), the probability value of t-
statistic is less than 5% level of significance. Therefore, with 95% confidence level the
null hypothesis of no significant difference between expected and perceived

199
responsiveness aspect of service quality cannot be accepted. Hence, it can be concluded
that the expected and perceived tangibility aspect of service quality in telecom sector are
significantly different from each other. The results also indicate that the mean score of all
statements related to responsiveness in case of expectation is higher than the mean score
of perception about responsiveness. Therefore, it can be stated that the expectation about
service quality is significantly higher than the perceived service quality.
It is found in the research study that initially customers have higher expectation about the
services but after using the service the customers found low level of service quality
provided by mobile telecom service providers. The main reason of this may be that the
customer may not be getting prompt service from customer service staff and uncertain
about the expected help from the service staff.
(4) Assurance: The results of independent sample t-test on various statements of
assurance are shown in table 5.40.
Table 5.39: Independent Sample t Test w.r.t. expected and perceived assurance.
Variables Group Mean
(S.D.)
t-statistic
(P-value)
Remarks
Able to trust on
customer service
staff
Expectation 4.12 (.795)
3.342 (.001)
Null Hypothesis
rejected Perception 2.80
(1.195)
Feel safe in my
transaction Expectation 4.05
(.821) 2.085 (.040)
Null Hypothesis
rejected Perception 2.77
(1.090)
Customer service staff should be
polite
Expectation 3.90 (.823) 3.071
(.003)
Null Hypothesis rejected
Perception 2.89 (1.230
Should get
adequate support Expectation 4.01
(.847) 3.171 (.002)
Null Hypothesis
rejected Perception 2.91
(1.232)
The results of the independent sample t-test (as shown above), the probability value of t-
statistic is less than 5% level of significance. Therefore, with 95% confidence level the
null hypothesis of no significant difference between expected and perceived assurance
aspect of service quality cannot be accepted. Hence, it can be concluded that the expected

200
and perceived assurance aspect of service quality in telecom sector are significantly
different from each other. The results also indicate that the mean score of all statements
related to assurance in case of expectation is higher than the mean score of perception
about assurance. Therefore, it can be stated that the expectation about service quality is
significantly higher than the perceived service quality
It is found in the research study that initially customers have higher expectation about the
services but after using the service the customers found low level of service quality
provided by mobile telecom service providers. The main reason of this may be that the
customer may not feel safe in transaction with service provider and getting adequate
support from the service staff.
(5) Empathy: The results of independent sample t-test on various statements of
empathy are shown in table 5.41.
Table 5.40: Independent Sample t Test w.r.t. expected and perceived empathy.
Variables Group Mean
(S.D.)
t-statistic
(P-value)
Remarks
Individual attention
should not be
expected
Expectation 2.53
(.893)
3.187
(.002)
Null Hypothesis
rejected Perception 2.17
(.962)
Can't be expected
to give customer
personal attention
Expectation 2.41
(1.120) 2.789
(.003)
Null Hypothesis
rejected Perception 2.17
(1.090)
Unrealistic to
expect to know
customer needs
Expectation 2.51
(.833) 2.519
(.013)
Null Hypothesis
rejected Perception 2.19
(1.002)
Unrealistic to
expect to the firm
to have its interests
at heart
Expectation 2.76
(.847) 4.785
(.000)
Null Hypothesis
rejected Perception 2.19
(1.012)
Unrealistic to
expect convenient
hours
Expectation 2.56
(.897) 3.213
(.002)
Null Hypothesis
rejected Perception 2.19
(1.010)

201
The results of the independent sample t-test (as shown above), the probability value of t-
statistic is less than 5% level of significance. Therefore, with 95% confidence level the
null hypothesis of no significant difference between expected and perceived empathy
aspect of service quality cannot be accepted. Hence, it can be concluded that the expected
and perceived empathy aspect of service quality in telecom sector are significantly
different from each other. The results also indicate that the mean score of all statements
related to empathy in case of expectation is higher than the mean score of perception
about tangibility. Therefore, it can be stated that the expectation about service quality is
significantly higher than the perceived service quality.
It is found in the research study that initially customers have higher expectation about the
services but after using the service the customers found low level of service quality
provided by mobile telecom service providers. The main reason of this may be that the
telecom service providers are not giving individual attention to customers & not offering
convenient business hours.
(6) Network Quality: The results of independent sample t-test on various
statements of network quality are shown in table 5.42.

202
Table 5.41: Independent Sample t Test w.r.t. expected and perceived network
quality.
Variables Group Mean
(S.D.)
t-statistic
(P-value)
Remarks
Sufficient
geographic
coverage
Expectation 3.68
(1.043)
-.075
(.941)
Null Hypothesis
accepted
Perception 3.69
(1.134)
pre mature
termination free
call
Expectation 3.72
(.965) 1.038
(.302)
Null Hypothesis
accepted
Perception 3.59
(1.083)
Voice clarity Expectation 3.73
(.983) .674
(.502)
Null Hypothesis
accepted
Perception 3.65
(1.067)
Call connected
during first attempt
Expectation 3.73
(1.043) 1.974
(.051)
Null Hypothesis
accepted
Perception 3.48
(1.096)
Able to make call
at peak hours
Expectation 3.75
(1.086) 1.459
(.148)
Null Hypothesis
accepted
Perception 3.57
(1.018)
The results of the independent sample t-test (as shown above) indicate that the probability
value of t-statistic is more than 5 percent level of significance. Therefore, with 95 percent
confidence level the null hypothesis of no significant difference between expected and
perceived tangibility aspect of service quality can be accepted. Hence, it can be
concluded that the expected and perceived network quality aspect of service quality in
telecom sector are not significantly different from each other. The results also indicate
that the mean score of all statements related to network quality in case of expectation and
perception are almost same. Therefore, it can be stated that the expectation about network
quality is similar to the perceived network quality.

203
It is found in the research study that customers’ expectations of network quality are
fulfilled. The main reason of this may be that due to advancement of technology the
telecom service providers are able to provide good network quality to customers.
(7) Convenience: The results of independent sample t-test on various statements of
convenience are shown in table 5.43.
Table 5.42: Independent Sample t Test w.r.t. expected and perceived convenience.
Variables Group Mean
(S.D.)
t-statistic
(P-value)
Remarks
Convenient business
hours
Expectation 3.66
(1.139)
1.788
(.077)
Null Hypothesis
accepted
Perception 3.39
(1.286)
Mechanism of easy
lodging of
queries/complaints
Expectation 3.68
(1.127) 1.964
(.52)
Null Hypothesis
accepted
Perception 3.38
(1.293)
Flexibility in
payment of bills
Expectation 3.56
(.988) .918
(.361)
Null Hypothesis
accepted
Perception 3.42
(1.296)
Simple application
formalities
Expectation 3.63
(.981) 1.248
(.215)
Null Hypothesis
accepted
Perception 3.44
(1.290)
The results of the independent sample t-test (as shown above), the probability value of t-
statistic is more than 5% level of significance. Therefore, with 95% confidence level the
null hypothesis of no significant difference between expected and perceived tangibility
aspect of service quality can be accepted. Hence, it can be concluded that the expected
and perceived convenience aspect of service quality in telecom sector are not
significantly different from each other. The results also indicate that the mean score of all

204
statements related to convenience in case of expectation and perception are almost same.
Therefore, it can be stated that the expectation about convenience is similar to the
perceived convenience in mobile telecom services.
It is found in the research study that customers’ expectations of convenience are fulfilled.
The main reason of this may be attributed to the convenient business hours and simple
application formalities.
5.6 Determinants of customer retention in mobile telecommunication
sector
In order to retain customers more effectively, companies must understand its clients, as well
as the forces inspiring them to stay with the current provider and not to switch.
Several studies have considered the impact of customer relationship management
tools and metrics on retention rates, varying from measuring satisfaction levels to
returns on loyalty programs. The construct of customer retention focuses on repeat
patronage. It is different from, while still closely related to, purchasing behaviour and brand
loyalty. In retention the marketers is seen as having more active role in the relationship. The
trigger is some element in the relationship between the provider and the purchaser, causing
customer retention. This extends beyond satisfaction, quality, and other constructs. There
are a variety of motivators of customer retention such as customer satisfaction and
switching costs, CRM, marketing strategies and customer acquisition.
In this research study the efforts are made to understand the determinants of customer
retention in mobile telecommunication sector and impact of these determinants on
customer retention. The theoretical proposed model representing the interrelationship is
shown in figure 5.20. The proposed model is tested using structural equation modeling
(SEM) technique using the software AMOS 20. The results of the SEM analysis are
shown in table 5.37.

205
Figure 5.21: Model of Determinants of customer retention
Table 5.43: Determinants of customer retention
Endogenous Exogenous
Construct
Standardized
Regression
Coefficient
Unstandardized
Regression
Coefficient
CR P Value Squared
multiple
correlation
Customer
retention
Perceived
Service
Quality
.362 1.453 3.062 .002
.837
.673
.594
Customer
Satisfaction
.457 .973 5.091 .000
Switching
Barriers
.291 .494 2.578 .003

206
Table 5.44: Model fit, Determinants of customer retention
Fitness of Model Index CFI NFI RFI RMSEA LO 90 Hi 90
Value .970 .903 .888 .063 .043 .081
The results indicate that the structured regression rate of the relationship between
perceived service quality and customer retention is .362 and is found to be significant
(p=.002) . Hence, with the 95% confidence level perceived service quality and customer
retention is related with each other. Hence, it can be concluded that the perceived service
quality in mobile telecom sector has a positive significant impact on customer retention
and can be considered an important determinant of customer retention.
The result also indicate that structured regression rate of the relationship between
customer satisfaction and customer retention is .457 and is found to be significant
(p=.000). Hence, with the 95% confidence level customer satisfaction and customer
retention are related to each other. In addition it can be concluded that the customer
satisfaction in mobile telecom sector has a positive significant impact on customer
retention and can be considered an important determinant of customer retention.
The results also indicate that structured regression rate of the relationship between
switching barriers and customer retention is .291 and is found to be significant (p=.003).
Hence, with the 95% confidence level switching barriers and customer retention are
related to each other. In addition it can be concluded that the customer satisfaction in
mobile telecom sector has a positive significant impact on customer retention and can be
considered an important determinant of customer retention.
The goodness of fit indicators such as CFI (.970 ), GFI (.806), NFI (.903), AGFI (.754),
RMSEA (.063) indicate that the tested structural equation model is have a significant fit.

207
ANALYSIS OF DATA COLLECTED FROM TELECOM
SERVICE PROVIDERS
5.7: Analysis of data collected from telecom service providers
The data of telecom service providers has been collected from the executives at the touch
points, officials dealing with customer care services, relationship managers, sales
personnel and collection executives etc. Data was collected from the head office, web
world offices, touch points and sales offices of selected telecom operators by personally
& by post administering questionnaire to the executives.
5.7.1: Demographic profiles of the respondents (Telecom Operators)
Table 5.45: Characteristics of the respondents on the basis of Telecom Company they
represent
Company Frequency Percentage
BSNL 26 32.50%
AIRTEL 18 22.50%
Reliance 20 25%
VODAFONE 16 20.00%
Total 80 100.0
The total numbers of respondents (company executives) considered in the research study
are 80. The demographic profile of the respondents on the basis of company they
represent is shown in table and graph shown above. The total numbers of respondents
were 80 where 26 (32.50%) respondents were representatives of BSNL, 18 (22.50%)
respondents were representing AIRTEL, 20 (25%) respondents were Reliance and 16
(20%) were representing VODAFONE as shown in table 5.46.
32.50% 22.50
%25% 20.00
%
0.00%5.00%
10.00%15.00%20.00%25.00%30.00%35.00%

208
Table 5.46: Characteristics of the respondents on the basis of their primary job
function
Job
Function
Frequency Percentage
IT 8 10%
Sales &
marketing 28 35%
Operations 10 12.50%
Finance 6 7.50%
HRM 12 15%
Customer
Care 16 20%
Total 80 100
As shown in the table 5.47, 8 (10%) respondents were performing IT related
responsibilities, 28 (35%) respondents were in sales and marketing department, 10
(12.50%) respondents were in operations, 6 (7.50%) respondents in finance area, 12
(15%) were in HRM, and 16 (20%) were attached with customer care division.
Table 5.47: Characteristics of the respondents on the basis of their primary job level
Job Function Frequency Percentage
CEO 8 10
Deptt. Head 22 27.5
Team
Leader 16 20
manager 8 10
Technical
Management 8 10
Customer
Care 18 22.5
Total 80 100
10%
35%
12.50%7.50%
15%20%
0%5%
10%15%20%25%30%35%40%
10%
27.50%
20%
10% 10%
22.50%
0%
5%
10%
15%
20%
25%
30%
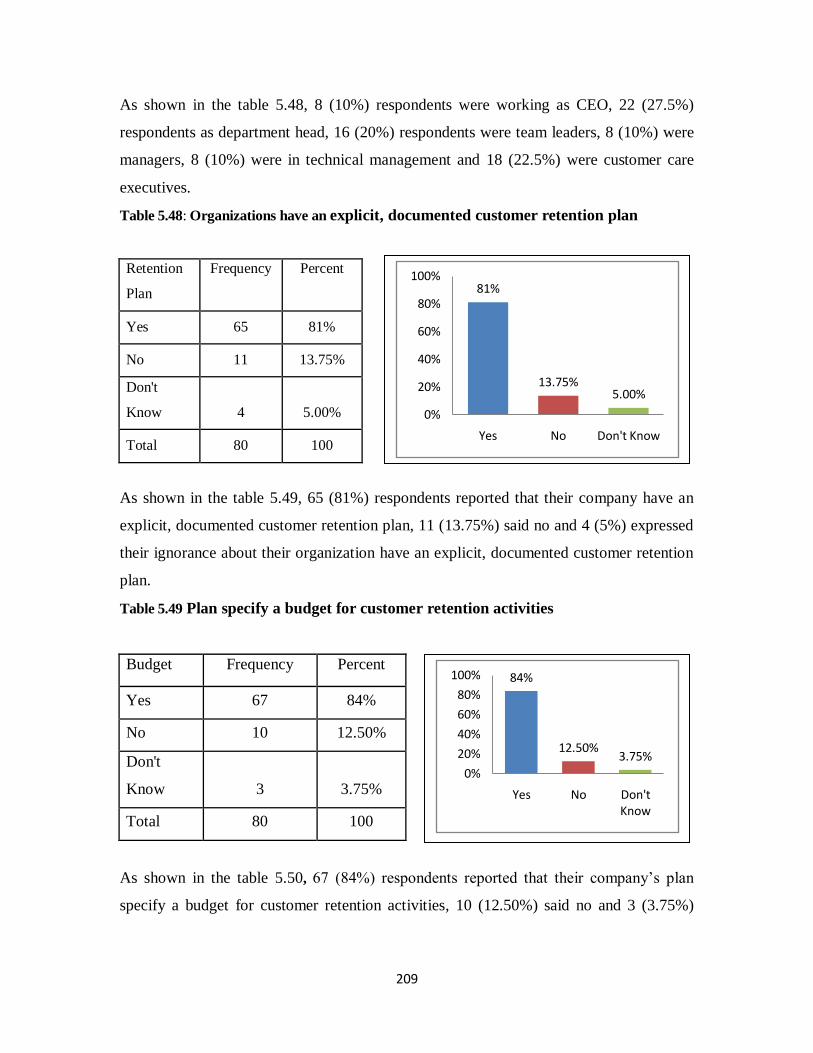
209
As shown in the table 5.48, 8 (10%) respondents were working as CEO, 22 (27.5%)
respondents as department head, 16 (20%) respondents were team leaders, 8 (10%) were
managers, 8 (10%) were in technical management and 18 (22.5%) were customer care
executives.
Table 5.48: Organizations have an explicit, documented customer retention plan
Retention
Plan
Frequency Percent
Yes 65 81%
No 11 13.75%
Don't
Know 4 5.00%
Total 80 100
As shown in the table 5.49, 65 (81%) respondents reported that their company have an
explicit, documented customer retention plan, 11 (13.75%) said no and 4 (5%) expressed
their ignorance about their organization have an explicit, documented customer retention
plan.
Table 5.49 Plan specify a budget for customer retention activities
Budget Frequency Percent
Yes 67 84%
No 10 12.50%
Don't
Know 3 3.75%
Total 80 100
As shown in the table 5.50, 67 (84%) respondents reported that their company’s plan
specify a budget for customer retention activities, 10 (12.50%) said no and 3 (3.75%)
81%
13.75%5.00%
0%
20%
40%
60%
80%
100%
Yes No Don't Know
84%
12.50%3.75%
0%
20%
40%
60%
80%
100%
Yes No Don't Know

210
expressed their ignorance about their organization’s plan specified a budget for customer
retention activities.
Table 5.50: Nomination of person or group to be responsible for customer retention
Nominated
Person
Frequency Percent
Yes 69 86%
No 7 9%
Don't Know 4 5%
Total 80 100
As shown in the table 5.51, 69 (86%) respondents reported that their company nominated
a particular person or group to be responsible for customer retention, 7 (9%) said no and
4 (5%) expressed their ignorance about their organization’s plan specified a budget for
customer retention activities.
Table 5.51: Formal model to identify customers who might take some or all of their
business elsewhere in the future
Model to
identify
Frequency Percent
Yes 60 75%
No 13 16%
Don't Know 7 9%
Total 80 100
60 (75%) respondents reported that their company used a formal model to identify
customers who might take some or all of their business elsewhere in the future, 13 (16%)
said no and 7 (9%) expressed their ignorance about their organization’s used any forma l
86%
9% 5%
0%
20%
40%
60%
80%
100%
Yes No Don't Know
75%
16%9%
0%
20%
40%
60%
80%
Yes No Don't Know

211
model to identify customers who might take some or all of their business elsewhere in the
future.
Table 5.52: Clues or signals which indicate customers might be likely to take some or
all of their business elsewhere in the future
Signals for
shifting
Frequency Percent
Yes 63 79%
No 10 13%
Don't Know 7 9%
Total 80 100
63 (79%) respondents reported that their company look for clues or signals which
indicate customers might be likely to take some or all of their business elsewhere in the
future, 10 (13%) said no and 7 (9%) expressed their ignorance about their organization
look for clues or signals which indicate customers might be likely to take some or all of
their business elsewhere in the future.
Table 5.53: Organizations have a documented process for handling customer
complaints
complaint
handling
Frequency Percent
Yes 65 81%
No 7 9%
Don't Know 8 10%
Total 80 100
79%
13% 9%
0%
20%
40%
60%
80%
100%
Yes No Don't Know
81%
9% 10%
0%10%20%30%40%50%60%70%80%90%
Yes No Don't Know

212
As shown in the table 5.53, 65 (81%) respondents reported that their company have a
documented process for handling customer complaints, 7 (9%) said no and 8 (10%)
expressed their ignorance about their organization have a documented process for
handling customer complaints.
5.5 Hypothesis Testing
5.5.1: Individual cause and effect relationship between various activities of customer
retention and customer retention expectation achieved.
(a) Impact of having an explicit, documented customer retention plan on customer
retention.
Hypotheses 5: Telecom operators those excel at customer retention have an
explicit, documented customer retention plan.
This study investigates the impact of having explicit, documented customer retention plan
on customer retention. There are indications that well designed and implemented
customer retention plan can have a positive effect on customer retention. In this study an
effort is made to find out if the presence of an explicit, documented customer retention
plan was a factor, with a greater or lesser impact on customer retention outcomes than
other customer retention strategies. Kendall’s tau was used to measure the hypothesized
relationship. Below table 5.55 shows the result of the application of Kendall’s tau
correlation.

213
Table 5.54: Documented customer retention plan & extent to customer retained
Correlations
Documented
Retention Plan
Extent to
customer
retained
Kendall's tau_b
Documented Retention
Plan
Correlation
Coefficient 1.000 .136
Sig. (2-tailed) . .187
N 80 80
Extent to customer
retained
Correlation
Coefficient 136 1.000
Sig. (2-tailed) .187 .
N 80 80
Spearman's rho
Documented Retention
Plan
Correlation
Coefficient 1.000 .147
Sig. (2-tailed) . .193
N 80 80
Extent to customer
retained
Correlation
Coefficient .147 1.000
Sig. (2-tailed) .193 .
N 80 80
**. Correlation is significant at the 0.01 level (2-tailed).
The results of the Kendall’s tau correlation indicate that there is no statistically
significant relationship correlation between having a retention plan and exceeding
customer retention expectations (p> 0.05). Hypothesis 5 is therefore cannot be accepted.
It is found in the research study that in mobile telecom sector presence of an explicit,
documented customer retention plan was not a factor, with a greater or lesser impact on
customer retention outcomes.
(b) Impact of having a budget dedicated to customer retention activities on customer
retention.
Hypotheses 6: Telecom operators those excel at customer retention have a budget
dedicated to customer retention activities.

214
This study investigates the impact of have a budget dedicated to customer retention
activities on customer retention. It is expected that dedicating a budget for customer
retention activities may increase outcome of customer retention. In this study an effort is
made to find out that to have a budget for customer retention activities was a factor, with
a greater or lesser impact on customer retention outcomes. Kendall’s tau was used to
measure the hypothesized relationship. Below table 5.56 shows the result of the
application of Kendall’s tau correlation:
Table 5.55: Budget dedicated to retention extent to customer retained
Correlations
budget for
Retention
Extent to
customer
retained
Kendall's tau_b
budget for Retention
Correlation Coefficient 1.000 .136
Sig. (2-tailed) . .188
N 80 80
Extent to customer
retained
Correlation Coefficient .136 1.000
Sig. (2-tailed) .188 .
N 80 80
Spearman's rho
budget for Retention
Correlation Coefficient 1.000 .148
Sig. (2-tailed) . .190
N 80 80
Extent to customer
retained
Correlation Coefficient .148 1.000
Sig. (2-tailed) .190 .
N 80 80
**. Correlation is significant at the 0.01 level (2-tailed).
The results of the Kendall’s tau correlation indicate that there is no statistically
significant relationship correlation between having a budget and exceeding customer
retention expectations (p> 0.05). Hypothesis 6 is therefore cannot be accepted.
(C) Impact of nominated a particular person or group to be responsible for customer
retention on outcome of customer retention.

215
Hypotheses 7: Telecom operators those excel at customer retention have nominated a
particular person or group to be responsible for customer retention.
This study investigates the impact of nominated a particular person or group to be
responsible for customer retention on the outcome of customer retention activities. It is
expected that nominated a particular person or group responsible for customer retention
may increase outcome of customer retention. In this study an effort is made to find out to
nominate a particular person or group to be responsible for customer retention activities
was a factor, with a greater or lesser impact on customer retention outcomes. Kendall’s
tau was used to measure the hypothesized relationship. Below table 5.57 shows the result
of the application of Kendall’s tau correlation:
Table 5.56: Nominated a person responsible for retention & extent to customer retained
Correlations
person of
gropup
responsible for
retention
Extent to
customer
retained
Kendall's tau_b
Person or group
responsible for retention
Correlation Coefficient 1.000 .100
Sig. (2-tailed) . .334
N 80 80
Extent to customer
retained
Correlation Coefficient .100 1.000
Sig. (2-tailed) .334 .
N 80 80
Spearman's rho
Person or group
responsible for retention
Correlation Coefficient 1.000 .109
Sig. (2-tailed) . .336
N 80 80
Extent to customer
retained
Correlation Coefficient .109 1.000
Sig. (2-tailed) .336 .
N 80 80
**. Correlation is significant at the 0.01 level (2-tailed).

216
The results of the Kendall’s tau correlation indicate that there is no statistically
significant relationship exists between nominated a particular person or group to be
responsible for customer retention and exceeding customer retention expectations (p>
0.05). Hypothesis 7 is therefore cannot be accepted.
(D) Impact of having a documented process for handling customer complaints on
customer retention.
This study investigates the impact of documented complaint-handling processes on
customer retention. There are indications that well designed and implemented complaint
–handling processes can have a positive effect on customer retention. Indeed, customers
who complain and are well recovered can be more satisfied and less likely to switch than
customers who had no cause for complaint at all. In this study an effort is made to find
out if the presence of a documented complaint –handling process was a factor, with a
greater or lesser impact on customer retention outcomes than other customer retention
strategies.
Kendall’s tau was used to measure the hypothesized relationship. Below table 5.57 shows
the result of the application of Kendall’s tau correlation
Hypotheses 8: Telecom operators that excel at customer retention have a documented
process for handling customer complaints.

217
Table 5.57: Documented process for handling customer complaints & extent to customer
retained
Correlations
Documented
Process for
complaint
Handling
Extent to
customer
retained
Kendall's tau_b
Documented Process for
complaint Handling
Correlation Coefficient 1.000 .560**
Sig. (2-tailed) . .000
N 80 80
Extent to customer
retained
Correlation Coefficient .560**
1.000
Sig. (2-tailed) .000 .
N 80 80
Spearman's rho
Documented Process for
complaint Handling
Correlation Coefficient 1.000 .608**
Sig. (2-tailed) . .000
N 80 80
Extent to customer
retained
Correlation Coefficient .608**
1.000
Sig. (2-tailed) .000 .
N 80 80
**. Correlation is significant at the 0.01 level (2-tailed).
The results of the Kendall’s tau correlation indicate that the probability value (p=.000) is
less than 5% level of significance. Therefore, with 95% confidence level the alternate
hypothesis of a positive correlation between exceeding customer retention expectations
and the presence of a documented complaint handling process is supported. Therefore, it
can be stated telecom operators that excel at customer retention have a documented
process for handling customer complaints.
It is found in the research study that telecom organizations can improve customer
retention by having a documented complaint handling process. The main reason of this
may be that when the customer’s complaints are well taken will have a head-start in
identifying systemic or repetitive problems that affect the bottom line and, and therefore,
have an advantage in developing solutions to those problems.