1
Chapter 1
Regeneration of giant sequoia (Sequoiadendron giganteum) in
experimental gaps: Implications for restoration of a long-lived pioneer
species
Abstract
To inform giant sequoia restoration treatment options, I assessed the responses of
different phases of giant sequoia regeneration (germination, survival, and growth) to
experimental gaps within a native giant sequoia grove. Twenty gaps were created,
ranging in size from 0.04 to 0.5 ha. Following gap creation, I sowed seeds and planted
seedlings along north-south transects across gaps. Transects were planted on paired ash
and bare soil substrates to find the effect of an ash substrate on regeneration. The
relationship between gap size and 2nd year seedling growth was best modeled with an
asymptotic curve for both ash and soil substrate seedlings. Seedling growth increased
with gap size until about 0.2 ha, where increases in growth diminished sharply. Within
gaps, an ash substrate and placement near central positions encouraged increased seedling
growth. Reliance on natural germination of sewed seeds for seedling establishment
proved difficult. Once established, planted seedlings survived at similar levels in all gap
sizes with only slightly elevated levels of mortality near north edges of gaps. Long-lived
pioneer species such as giant sequoia require restoration treatments that involve relatively
intense disturbances to facilitate cohort establishment and recruitment.

2
Introduction
Recovery from the greatly altered conditions of fire-dependent ecosystems will
depend on near-term management decisions that seek to actively restore desired
conditions (Covington 2000). Such restorative treatments proposed within native giant
sequoia (Sequoiadendron giganteum (Lindl.) Buchholz) groves are often aimed at
promoting the initiation of a new cohort of giant sequoia that will eventually recruit into
the canopy. When contrasted against the frequency of cohort initiation events during the
past two millennia, it is clear that the modern era of fire suppression has resulted in a
“missing cohort” that would have otherwise become established during the past century
(Stephenson 1994). Given its extreme longevity, the current giant sequoia population can
easily absorb a century of missing regeneration without long term impacts but the
consequences of continued regeneration failures will increase dramatically with time. The
demographic evidence that suggests the need for restoration treatments is boosted by
support generated from the great social values placed on this species’ exceptional cultural
significance and monumental stature. Cohort initiation thus appears to be a justifiable
objective both ecologically and socially. In practice, however, treating a forest in order to
promote the establishment of a long-lived pioneer species such as giant sequoia presents
a unique challenge to comparably short-lived scientists and managers. A significantly
intense disturbance that may be perceived as destructive must be part of the treatment, the
ultimate success of which will not be assessed for centuries.
Restoration efforts in giant sequoia groves are further challenged by the fact that a
variety of stakeholder interests seek to influence agency decisions about management

3
(Rigg 2001). In addition, as with natural resource management regimes in general,
treatments must meet objectives with efficient use of limited resources and with minimal
conflict to competing objectives. The challenges inherent to proactive restoration projects
should not preclude their implementation, however, for the ecological risks of no action
far outweigh the risks of acting with uncertainty (Covington 2000). Long-term
uncertainty, which will always be present to some degree, can be reduced over time with
an active adaptive management approach (sensu Walters and Holling 1990) that
gradually improves treatment efficacy. In the short-term, high-intensity treatments that
are necessary to begin the restoration process can presently benefit from experiments that
target areas of ecological uncertainty and that are specifically designed to assess
treatment options. It is within this framework of reliance on both rigorous research
projects as well as practical, long-term management experiments that species restoration
treatments should move forward with calculated haste.
A logical first step in species restoration is understanding the life-history of the
species being restored and the ecological obstacle to it perpetuating itself. Long-lived
pioneer species such as giant sequoia are unique in that they seem to avoid the tradeoff
between rapid growth and longevity that is typically observed in coexisting tree species
(Huston and Smith 1987). Among its associated conifer species, it is both the longest
lived (Stephenson 2000) and the fastest growing as a juvenile under high-resource
conditions (York et al. 2003). Even under low resource conditions, it has a marked
capacity to survive (This dissertation, Chapter 3). Examples of long-lived pioneer species
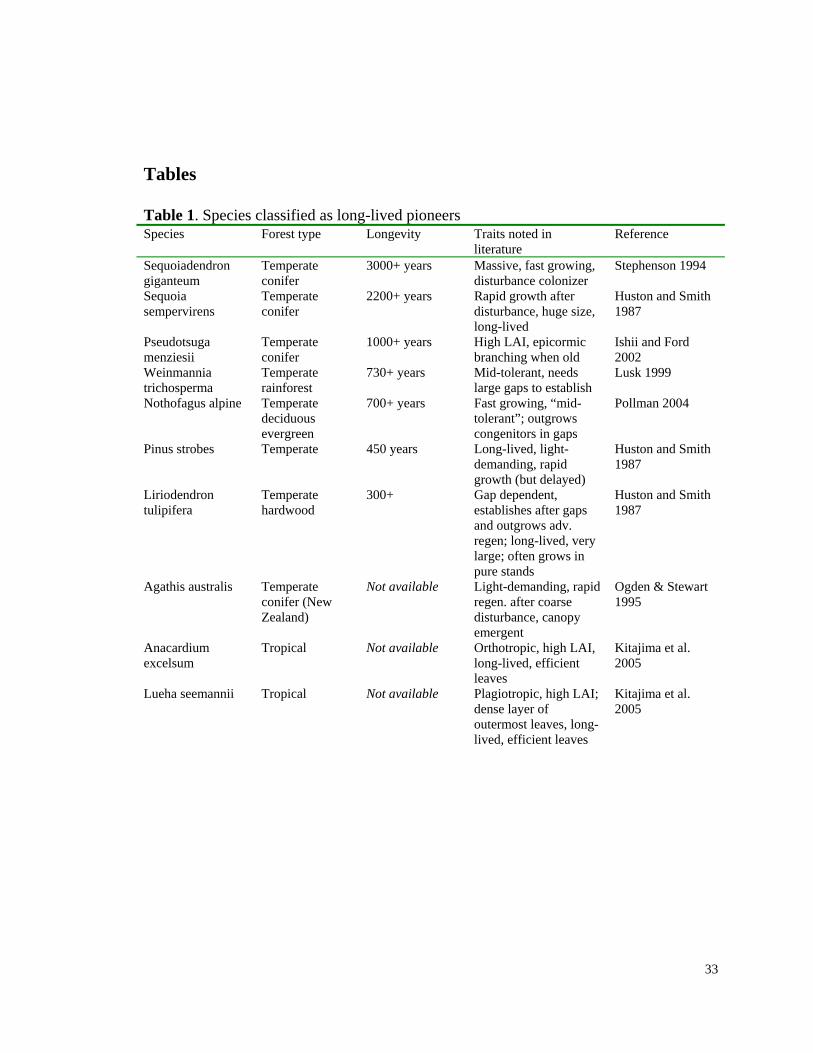
such as giant sequoia can be found the world over (Table 1). By growing fast and living
long, these species’ life-histories would seem to confer a striking competitive advantage.

4
However, they invariably have an Achilles heel that limits their range and density. In the
case of giant sequoia, it is constrained by the limited conditions under which successful
regeneration can occur (Rundel 1972, Harvey and Shellhammer 1991). It is somewhere
within the regeneration process- from seed to physiologically self-sufficient seedling-
where giant sequoia populations become bottlenecked. Successful restoration treatments
will therefore be those that focus on creating conditions that promote the successful
establishment of seedlings that are capable of recruitment into the canopy.
As with most tree species, giant sequoia is disturbance dependent- requiring the
creation of canopy gaps to emerge into the canopy. Given that discrete canopy gaps are
needed for giant sequoia regeneration, the most important area of current uncertainty is in
the specific relationship between gap size and regeneration. Understanding within-gap
patterns of regeneration is also important since they drive gap-level patterns and within-
gap treatments can influence these outcomes. This information is needed, regardless of
whether restoration treatments are implemented with fire or mechanical means. In
creating canopy gaps with a restoration treatment, a number of potential factors that
influence giant sequoia regeneration can be controlled both between and within gaps. The
size of the gap (York 2004), the substrate quality (Harvey and Shellhammer 1991), and
within-gap position of regenerating seedlings (Demetry 1995) are all influences that can
be altered by the choice or priority of treatment options. Partitioning out their relative
importance in terms of influencing germination, survival, and early growth is the main
intent of this study.
This research was designed as an experimental gap study, relying on control of
field conditions to reduce the high variability often found within and between naturally

5
occurring gaps (e.g. Lawton and Putz 1988). I necessarily use artificial creation of gaps to
control gap size, and artificial regeneration techniques of direct seeding and seedling
planting in order to control the spatial arrangement of regeneration. My aim was to
primarily describe functional relationships between gap size and giant sequoia
germination, survival, and early growth. Secondarily, I describe within-gap influences of
substrate and position on those same components of regeneration. To best inform
restoration efforts, I rely on information-theoretic model selection procedures to analyze
the data and to rank the different factors of giant sequoia regeneration based on strength
of evidence. The study is designed to give specific insight into giant sequoia restoration,
and to discuss a general approach to understanding and conserving long-lived pioneer
species.
Methods
Study area
The study was conducted at Whitaker’s Forest Research Station (WFRS) in the
southern Sierra Nevada Mountain range of California. WFRS is within the Redwood
Mountain giant sequoia grove, about 5 km to the south of the Grant Grove visitors center
in Kings Canyon National Park. Gaps were installed across a 100 ha area between
elevations of 1615 and 1830m. Aspects in the study area are mainly west-facing, on
moderate slopes of 15-30%. Soils are of granitic origin, generally deep (>2m) but with
some rock outcrops. Precipitation in the area is variable from year to year, averaging 107
cm per year and ranging from 40 to 160cm during the last 30 years at Grant Grove, 6.4

6
kilometers to the north of WFRS (NOAA 2005). Much of the precipitation (>80%)
comes from winter snows and spring rains, while summers are relatively dry.
The first timber harvesting activity in the area took place during the 1870’s. This
harvest removed many of the larger sugar pines (Pinus lambertiana Dougl), and some of
the emergent giant sequoias (Metcalf 1940). The giant sequoia individuals currently in
the mature canopy layer (excluding the emerging ancient trees) belong to a single cohort.
Age-reconstructions of numerous individuals in the field suggests that this cohort
established after the 1870’s logging event.
A second harvest in 1946 removed about 42% of the standing volume from trees
that were greater than about 90cm diameter at breast height (Metcalf 1951). As was
typical of the time, the harvest targeted the larger trees and was distributed extensively
throughout the area. Despite the amount of volume removed, the disturbance did not
result in the initiation of a cohort of giant sequoia. Even the smallest giant sequoia
individuals found in a reconnaissance of the study area before treatments were installed
were reconstructed to originate from the first logging activity in the 1870’s. The failure
for a cohort to initiate after this second disturbance is likely a result of the diffuse nature
of the tree removal and the lack of any post-harvest treatments that created a mineral soil
substrate. As is common throughout grove areas, no giant sequoias less than 100 years
old could be found in the study area prior to the treatment.
Vegetation at WFRS is dominated by a Sierran mixed conifer forest type (Laacke
and Fiske 1983) with the addition of giant sequoia. The canopy structure is distinctly
two-tiered, with an emergent upper tier of approximately 1.5 large giant sequoia trees per
hectare that are estimated to be over 1000 years old. The second tier forms the main
7
canopy of mature individuals, most of which originated from the 1870’s harvest. Tree
species in the second tier of the canopy include (in order of basal area dominance) giant
sequoia, incense cedar (Calocedrus decurrens (Torr.) Florin), white fir (Abies concolor
(Gord. & Glend.) Lindl.), sugar pine, and ponderosa pine (Pinus ponderosa (Dougl. ex
Laws.). Basal area density of the main canopy, estimated from 87 permanent plots
throughout the study area, averages 65 m2/ha (WFRS on-line data, 2005). Trees in the
main canopy receiving full light from above (i.e. codominant) have grown in stature to
27-34m in 50 years. As is typical in areas of this forest type not disturbed by fire or
intense anthropogenic disturbances, regenerating trees in subcanopy size classes are
dominated by white fir and incense-cedar.
Experimental treatments and data collection
Treatments were designed to test the possible influences that restoration
treatments can have on the process of giant sequoia regeneration. Gap size, within-gap
position, and substrate treatments were installed during summers of 2001 and 2002.
Twenty circular gaps ranging in size from 0.04 to 0.4 ha were created. Expressed relative
to canopy height, the ratio of gap diameter to canopy height for this range is 0.75 for the
smallest gap and 2.11 for the largest gaps. Prior to gap creation, the gaps were measured
on the ground to provide 5 replicates of 4 size classes (0.05, 0.1, 0.2, and 0.4 ha). Circular
boundaries for the gaps were identified by locating a center point and measuring the
appropriate horizontal radial distance to gap edge in each cardinal direction with a tape.
Larger gaps (0.2 and 0.4 ha) required measurements to inter-cardinal directions as well.
The identified gap edges were then connected with flagging to form a circle. All trees
within the flagged areas were felled towards gap centers to avoid damage to surrounding

8
trees. As expected, the post treatment gap sizes were slightly different than the measured
pretreatment sizes because the canopy drip-lines forming gap edges are often variable
(i.e. the geometries of gap drip-lines are different than the bole-lines). Gap sizes used for
analysis were estimated from measurements of diameters between canopy driplines along
south-north transects of each gap and assuming circularity. Post treatment gap sizes
deviated from target gap sizes by as much as 50%, with no obvious bias for gaps
becoming larger or smaller than the target size (10 were bigger and 10 were smaller than
the target size). The size range was chosen in order to replicate the speculated range of
gap sizes that typically occurred under a pre-fire suppression era disturbance regime. I
inferred this size range from reconstruction studies and descriptions of modern prescribed
fire effects on gap size (Bonnicksen and Stone 1981, Bonnicksen and Stone 1982,
Stephenson 1994, Demetry 1995). Some fire-created gaps created before the modern era
of fire suppression were undoubtedly larger than the 0.4 ha maximum used in this study
(e.g. Swetnam 1993), but the available reconstruction studies suggest that most gaps were
less than 0.4 ha in size.
Trees within gap boundaries were cut with chainsaws and skidded out with
tractors. Post-harvest debris was piled into windrows 5 meters wide and extending along
the south-to-north equators of gaps. During the fall after the harvest, the windrows were
burned during conditions that facilitated near-complete consumption of debris. The
substrate treatment was placed along the south to north transects in order to overlap with
the steepest gradients in above and below ground resources. Giant sequoia seeds were
sewn at spots every 3 meters along the transects and extending 12 meters into the matrix
on the south and north edges. One transect was placed on the ash substrate treatment,

9
while a paired transect was sewn on the adjacent bare mineral soil substrate. Ash-soil
pairings only occur beneath the gap between drip-lines since no debris was burned
beneath the canopy matrix. Seeds were collected from emergent ancient trees throughout
the study area. They were screened to increase viability, which averaged 74%
(determined by x-ray of a sample). At each seed spot, 5 seeds were sewn thus ensuring
the probability of at least one viable seed per spot at greater than 99%. Seeds were soaked
in running water for 48 hours and then sewn at each spot in early spring of 2004. Sewing
was repeated at every other spot in the fall for germination in spring of 2005.
Seedlings of giant sequoia were raised from the same source of seeds used for the
seed sewing treatment. They were raised in containers for 1 year in a nursery before
planting. Similarly to the seed-sewing treatment, seedlings were planted every 3m along
north-south transects in a paired ash and soil substrate design. Transects extended 12
meters into the matrix on both sides of the gap, where only soil substrates were planted.
Seedlings were double-planted at each planting spot. One year after planting, spots where
both trees had died were replanted with another seedling. This pulse-style planting
treatment was done in order to increase the probability of at least one seedling eventually
becoming established and to provide a mortality index, where from 0 to 3 seedlings died
at each spot over two years.
The regeneration process was divided into three logical stages that could be
measured in terms of their response to gap size and within-gap treatments. Seed
germination was monitored in early summer of 2004 and again in 2005 to measure spring
germination frequency following the two sewing treatments. Each seed spot was visited
and tallied by presence or absence of at least one germinant. Planted seedling mortality

10
was assessed at the end of each of the first two growing seasons after planting. Seedlings
were presumed to be dead when no green foliage was present. Early seedling growth was
assessed by direct measurement of all seedlings’ basal diameter and height after the first
and second growing seasons.
Data Analysis
Analytical Approach. I relied on an information-theoretic approach to analyze the data.
Restoration efforts that install treatments based on expectations built by predictable but
variable ecological relationships are by nature well-suited to be informed by analyses that
test multiple hypotheses (models) of simple functional relationships. In the case of giant
sequoia restoration, understanding the general relationship between gap size and
regeneration can help predict how restoration treatments that create different gap sizes
might influence regeneration. Rather than testing whether or not any relationship exists, a
model selection procedure that ranks candidate models and gives relative strengths of
evidence provides an instructive assessment of what kind of relationship might be
superior given the data. Further, penalizing for model complexity increases the
probability that the relationship will hold true given widespread restoration
implementation outside of the study area’s domain. Model selection can also be used to
rank the relative importance that individual predictor variables have in influencing the
response variables. Restoration efforts can then be designed to prioritize treatments in
order to most efficiently achieve objectives with available resources. Analysis was
performed at two levels, corresponding with the experimental design. First, I considered
between-gap effects on the responses of seed germination, seedling mortality, and
seedling growth to gap size and substrate. Second, I focused on within-gap patterns of
11
regeneration, quantifying the relative influences of position, substrate, and their
interactions. For the analysis, I used only the seeds and seedling measurements that were
located beneath the gaps (between drip-lines). The matrix spots were excluded for this
analysis since they did not have ash substrate treatments and therefore created an
unbalanced design (and because restoration treatments are unlikely to be applied outside
of gaps).
Gap size influence. The predictor variable is gap size. I used only those gaps that had
complete ash substrate treatments (n=18), so that I could do separate model fitting for
paired ash and soil substrates. The response variables are gap-level means for
germination, mortality, and relative seedling growth in height and diameter. Germination
is expressed as the percent of seed spots in the gap that had at least one germinant present
following either of the two sewing treatments. Relative growth for each seedling
surviving through the second year was calculated by dividing the second year growth
increment in height or diameter by the measurement taken after the first year. Relative
second year growth is used in this case in order to remove the variability due to initial
size differences and nursery effects and to reduce variability in the gap size-seedling
growth relationship caused by non-gap size influences.
Mortality is expressed by deriving a mortality index for each planting spot, and
then averaging index values across all planting spots per gap. Where both seedlings were
dead after the first year, another seedling was planted. After the second growing season,
each seedling was given a 0 value if still alive and a 1 value if dead.. The possible
mortality index values per spot were 0 out of 2 seedlings dead (0), 1 out of 3 dead (0.33),

12
1 out of 2 dead (0.50), 2 out of 3 dead (0.67), or 3 out of 3 dead (1.00). Gap level
averages are therefore a measure of mortality incidence for the whole gap over two years.
The intent of the analysis is to describe functional relationships between gap size
and indicators of regeneration, plus any alteration of that relationship as a function of ash
substrate. I identified a set of a priori candidate models describing potential relationships,
then used model selection to rank the models and quantify the strengths of evidence. The
models were used to fit each regeneration variable (germination, mortality, and growth)
to gap size for ash and soil substrate treatments separately. Only treatments that had
paired ash and soil substrates were used to calculate averages. The candidate set was
made up of three simple models- linear, quadratic, and asymptotic. Each model
represents a different functional relationship and implies a distinct relevance for
restoration. A sloping linear relationship between gap size and the regeneration variable
would imply a monotonic relationship, and that either the smallest or the largest gap size
(depending on whether the slope was positive or negative) could most influence the given
regeneration variable in a restoration setting. A quadratic equation would imply a certain
maxima within the size range considered, where beyond a gap size threshold the effect
declines. An asymptotic fit would imply that the response variable increases with gap
size, but then returns diminish and the effect levels off. An asymptotic relationship was
described with a simple 2-parameter Michaelis-Menton equation, with one parameter
equal to the asymptote and the other controlling the slope of the lower portion of the
curve before the asymptote is reached.

13
To rank the models according to goodness of fit while penalizing for model
complexity I used a modified Akaike’s information criterion (AIC) derived by Sugiura
(1978):
1)1(22)log(
−−+
++=KnKKK
nRSSnAICi ,
where AIC is the bias-corrected criterion for model alternative i, RSS is the residual sum
of squares of the model’s regression, n is the sample size, and K is the number of
parameters. The modified AIC incorporates a bias-correction term to account for small
sample:parameter ratios among the alternatives. The model alternatives have ratios of
18:2 for the asymptotic and linear functions, and 18:3 for the quadratic and sigmoidal
functions. To evaluate candidate models in relation to the highest ranked model, the AIC
values are transformed to Akaike weights and normalized to sum to one. The weights are
interpreted as the likelihood that within the limits of the data and the set of alternatives,
the given model is the most appropriate choice. The application of AIC for statistical
inference in ecological studies is described in detail by Anderson et al. (2000) and
Johnson and Omland (2004).
Post model selection analysis depended on which of the three possible outcomes
occurred:
Outcome #1: For both ash and soil seedlings, the same model is selected and
parameters are significant (slope parameter 95% confidence intervals do not include
zero).

14
Post selection analysis: Compare the parameters of the selected model between
the two groups. If confidence intervals overlap, then functionally they are the same
(given this data set). Redo the analysis with the two treatments grouped together to
increase precision in the final gap size–regeneration relationship.
Outcome #2: A different model is selected for the two treatment groups and
parameters are significant (Confidence intervals of slope parameter do not include zero).
Post selection analysis: None. The ash substrate changed the functional
relationship. The model selection ranks and evidence ratios are the result.
Outcome #3: Model ambivalence. It is difficult to distinguish performance
between models.
Post selection analysis: Explore the reason for the ambivalence. The reason could
be either a general lack of any relationship between gap size and the response variable, or
a failure to distinguish between models because of data variability and small sample size.
If no difference between ash and soil patterns exists, group them together to increase
precision of the response variable and hence increase the power of model selection to
distinguish between models.
Within-gap influences. Within gaps, patterns of regeneration variables were assessed as
influenced by treatment factors of substrate, orientation (south v. north half), and
proximity to matrix (i.e. gap edge). These factors represent all possible positions along
the resource gradients that developed as a result of gap creation. It was necessary to
separate out orientation and proximity to matrix as variables (as opposed to a single
measurement of distance across gap from edge to edge), since stark differences in
resource availability can occur on the south versus north sides (Canham et al. 1990, York

15
et al. 2003). In other words, I do not expect a linear gradient in resource availability
across gaps from edge to edge.
In this case, the experimental unit is reduced to each planting or sewing spot. For
germination, the response variable is presence or absence of a germinant during either of
the two years following sewing treatments. Germination frequency was too low to
perform separate analyses by year. Mortality is expressed as an ordinal-ranked variable,
depending on how many seedlings died at each spot. The index values for each spot rank
degree of mortality incidence, but are not scaled continuously because some spots had a
third seedling planted during the second year, while others had two seedlings planted
only the first year. Instead of relative growth, I used absolute seedling size as a response
variable since this part of the analysis is designed to find specific effects of treatments on
the magnitude of seedling size (as opposed to non-linear functional relationships with the
gap level analysis). Where both seedlings were present after two years, they were
averaged. Seedling size was estimated by multiplying basal diameter by height (cm3). I
used only seeds and seedlings planted within gap drip-lines, and that had paired ash and
soil substrate treatments (n=365 seedling spots and 442 seed spots). Variances in the
response variables are partitioned among the treatment parameters with models that are
appropriate given the type of data. I used a logistic regression for germination, an ordinal
regression for mortality, and a generalized linear model for seedling size. Seedling size
was natural log transformed, and mortality was arcsine-square root transformed. Means
and confidence intervals are back-transformed when reported.
The overall influence of each treatment was assessed by evaluating the
uncertainties that resulted from building the models with a set of candidate models. The

16
candidate models were made up of different combinations of parameters that could
potentially explain regeneration with the treatments (Table 2). Inference is based
primarily on the relative importance value for each parameter. Importance value is
calculated as the sum of all Akaike weights for the models in which the given variable
appears (Burnham and Anderson 2002). Because of the particular reliance on importance
values for making inferences in this case, it is necessary to have each parameter
represented equally across the candidate set. I therefore confined the candidate set to
include the individual variables of substrate, proximity, and orientation (north v. south
half) plus the three possible 2-way interactions between these variables. Global models
for all three individual variables and interactions are also included. This gives each
individual and interaction parameter representation in two of the candidate models. More
combinations are possible (for example a three-way interaction), but this would result in
model imbalance. Including all possible models would give parameter balance but would
dilute the power of model selection by having too many models (Burnham and Anderson
2002). With the given set of candidate models, a variety of complexity and restoration
implications are represented (Table 2). Calculation of AIC values from the residual sum
of squares of the generalized linear model was performed similarly to the equation above,
except without the small sample correction. For the germination and mortality
regressions, AIC is derived from the uncertainty indicated by the log-likelihood of the
whole model, which replaces the RSS in the above equation (Anderson et al. 2000)
Results
Gap size influence

17
Seedling growth. The asymptotic relationship was ranked highest for both soil and ash
substrate seedlings with moderate support (Table 3). Seedlings in the ash bed grew at a
faster rate than seedlings in the soil substrate, but the ash substrate did not change the
relationship between gap size and growth as interpreted by the overlapping confidence
intervals for the models’ parameters. When all seedlings within gaps are combined to
increase the per gap precision (and increase the sample size by two gaps), the asymptotic
fit is the best model with strong support (asymptotic AIC weight = 0.81, quadratic AIC =
0.18, linear AIC <0.01). Height growth increased sharply with the smaller gap sizes and
approaches saturation around 0.2 ha (Fig. 1A). This gap size corresponds to a gap
diameter to canopy height ratio of 1.5.
As with height growth, the asymptotic relationship between gap size and basal
diameter growth was ranked highest for both substrates, with relatively strong support
(Table 3). The ash bed did not change the relationship between gap size and diameter
growth as interpreted by the overlapping confidence intervals for the models’ parameters.
When all seedlings within gaps are combined to increase precision, the asymptotic fit is
again the best model with strong support (asymptotic AIC weight = 0.76, quadratic =
0.18, linear = 0.07). As with height growth, the effect of gap size saturated by around 0.2
ha (Fig. 1B)
Seed germination. For both ash and soil substrates, a linear relationship between gap
size and % germination rate was the selected model (Table 3). There was, however,
ambivalence between the linear and asymptotic models. Ambivalence is a result of the
weak overall effect of any relationship between gap size and germination. This is
indicated by the fact that the confidence intervals for the linear fit slopes include zero

18
(they therefore overlap with each other as well). When ash and soil substrates are
combined together to improve the precision and power of detecting a gap size effect,
there is still ambivalence between the linear and asymptotic models. The linear fit does
reveal a weak but consistent negative effect of gap size on germination (95% CI of slope
= -0.88 to -0.12 % per gap). The larger gaps therefore tended to have slightly lower
germination rates.
Seedling mortality. As with the germination results, the model selection did not
distinguish between linear and asymptotic fits, and the selected models’ slope parameters
had confidence intervals that included zero (ash and soil model slope parameter
confidence intervals therefore overlap). When seedlings from the ash and soil substrates
are combined together, the ambivalence remains and no effect of gap size on seedling
mortality index can be detected (slope CI = -0.29 to 0.72 per gap).
Within-gap influences
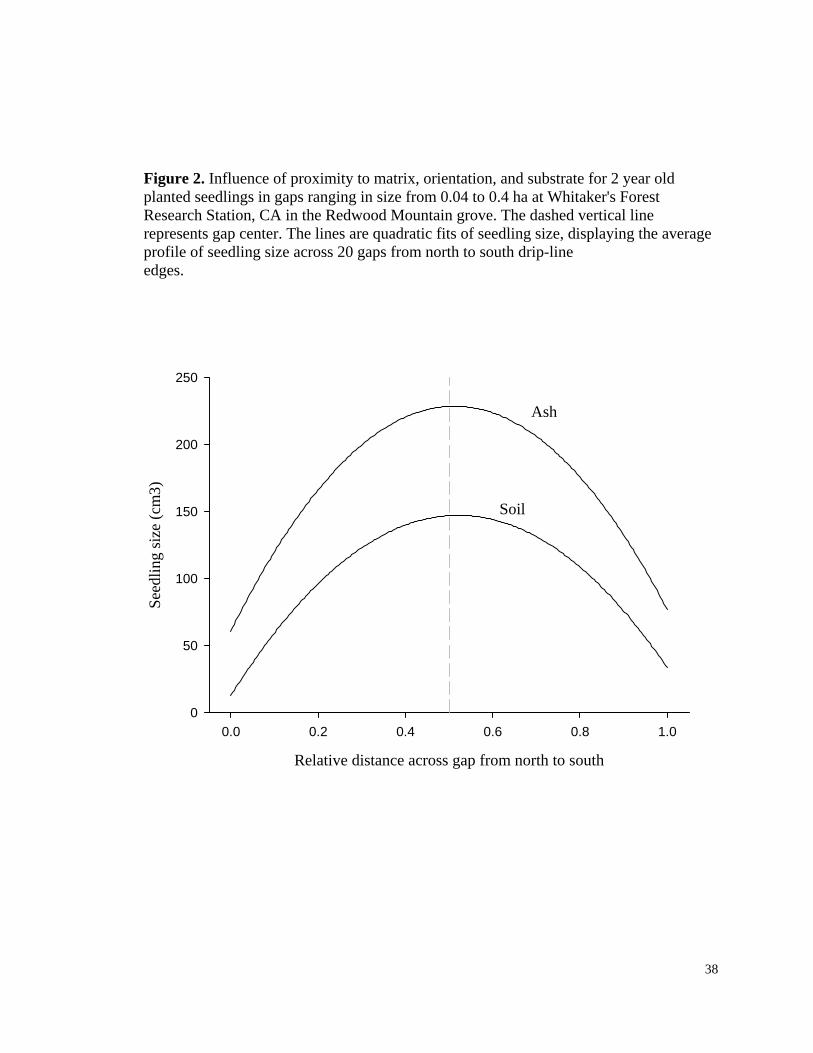
Seedling size. The highest ranked model included all variables influencing seedling
growth without interactions, although the second ranked model with all possible
interactions also had considerable support (Table 4). Most of the cumulative support
(85%) is encompassed by these two models. The importance values, which measure the
relative importance of each variable by summing the AIC weights across the models in
which each variable appears, are 0.56 for all three single variables of substrate, matrix
proximity, and orientation (essentially the AIC weight of the highest ranked model).
Increasing distance from matrix, presence of an ash substrate, and placement on the south
half had positive effects on seedling size (Fig. 2). The interactions had lower importance
values than the individual variables. The substrate*proximity variable had the highest

19
value of 0.44, while the substrate*orientation and proximity*orientation interactions each
had the lowest importance values of 0.29.
Seed germination. Despite the use of screened seeds and applying the sewing treatment
over two years, very few of the sewed seeds germinated. Only 50 of the 442 seed spots
that had paired ash and soil substrate treatments had at least one germinant. The lack of
germination contributed to a lack of resolution of a superior model among the candidates.
The logistic regression was best fit with a simple 1 parameter regression with proximity
as a predictor of germination (Table 4). Proximity also had the greatest importance value
among the variables. The other single-parameter models and the simple additive models
also had support. Because of the overall low germination frequency, the actual effect of
within gap treatments was only slight. Germination tended to occur at distances farther
away from the matrix. Spots with germinants present had a mean relative distance from
the matrix of 0.54 (CI95%= 0.46-0.62), while spots without germinants had a relative
distance of 0.45 (CI95%= 0.42-0.48). The ash bed substrate had a slightly higher
germination frequency (14.0%) compared to the soil substrate (8.6%). Similarly, north v.
south placement had only a slight effect. Germination occurred at 13.5% of the south half
seed spots and 9.4% of the north half seed spots.
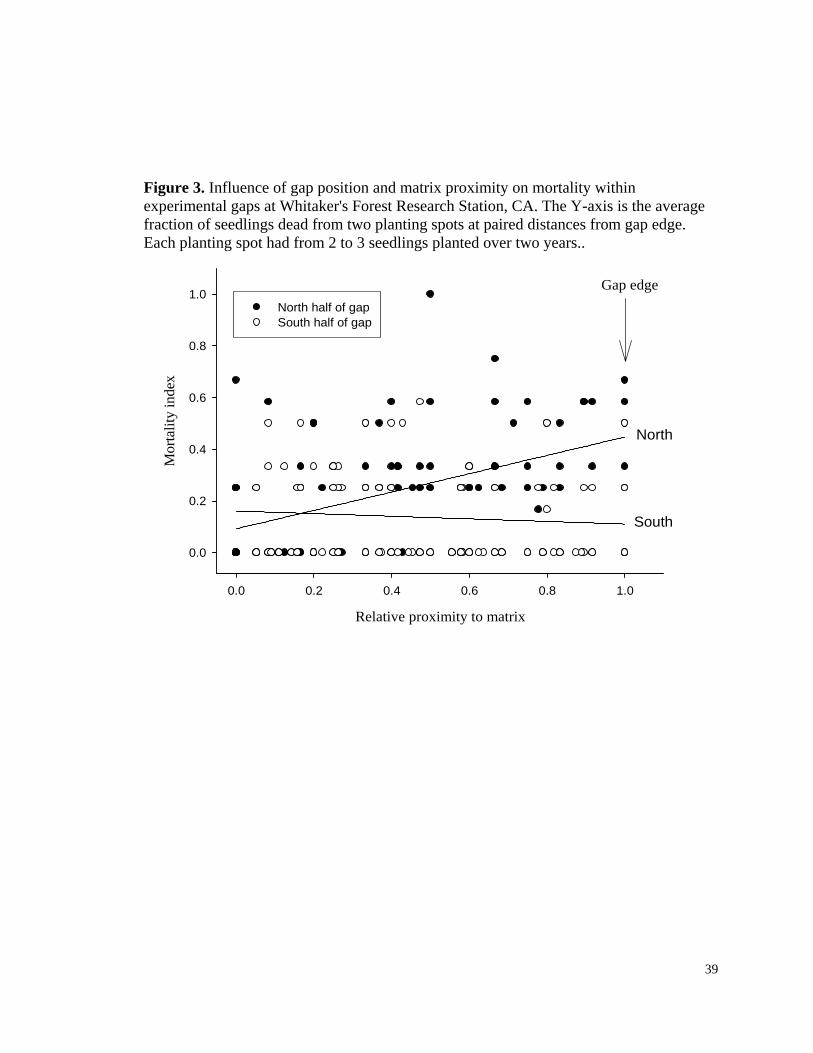
Seedling mortality. The proximity by orientation interaction was the highest ranked
model, with strong support (Table 4). The proximity by orientation interaction was
especially important as indicated by the importance value and the fact that it was in the
two highest ranked models that together accounted for >96% of the cumulative AIC
weights. Mortality is constant along the southern halves of the gaps, and increases with
proximity to matrix along the north halves (Fig. 3). On average (back-transformed),

20
mortality at each planting spot was 46% (CI= 42-49) for north row seedlings and 36%
(CI=33-40) for south row seedlings. These are considered index values of mortality
because of the method of replanting over two years.
Discussion
Factors of gap size, substrate, and position within gap all influenced the process of giant
sequoia regeneration. The relative influences that each of the factors have on
germination, survival, and growth can help prioritize restoration treatments in order to
increase the chance of successfully meeting restoration goals.
Gap size effects
After two years, gap size had a profound influence on seedling growth, resulting
in faster growing seedlings with increasing gap size. However, the influence diminished
markedly above about 0.2 ha (Fig. 1). The effect of gap size on germination and mortality
was comparatively weak. If germination frequency indeed tends to decline slightly with
larger gaps as it did in this study (possibly because of increased seed desiccation), the
benefit of larger gaps from increased growth would likely far outweigh the negative
effect of reduced germination. Mortality of planted seedlings was relatively low for all
gap sizes, even the smallest gaps. The contrast between mortality and growth results
emphasizes the importance of distinguishing between the different traits that make up a
species’ shade tolerance. In agreement with other work (This dissertation, Chapter 3),
giant sequoia individuals were relatively insensitive to resource availability in terms of
survival. Yet they responded markedly in terms of growth. If establishment of a surviving
cohort without regard to the cohort’s growth is the restoration objective, then gap size

21
appears to have little impact. Gap presence, however, did influence survival. In a
companion study, seedlings were planted beneath the matrix forest next to these gaps.
Seedlings beneath the canopy had 52% mortality, while seedlings planted beneath gaps
had 25% mortality. Mortality would likely be even higher if the beneath-canopy
seedlings were not planted directly adjacent to canopy gaps.
The asympototic gap size-growth relationship with giant sequoia seedlings was
also found in a study done outside of grove boundaries (York et al. 2004, This
dissertation, Chapter 2). The asymptotic functional relationship appears to be common in
temperate studies that have defined gap size-growth relationships for other species (e.g.
Minkler and Woerhide 1965, Coates 2000, Webster and Lorimer 2002). Studies that have
described monotonic relationships (e.g. McDonald and Abbot 1994, Gray and Spies
1996) either did not consider an asymptotic relationship as a possibility, or simply
considered a gap size range below the given threshold point where the gap size effect
diminishes. Because of canopy heterogeneity and density variability between study areas,
it is difficult to generalize about an average diameter:canopy height ratio where the
asymptote occurs. The range that can best be inferred from the studies cited above is
between 0.2 and 2. Additional studies are needed to define a more precise range and to
detect any differences in the asymptote due to differences in resource gradient patterns
between forest types. Defining gap size as a continuous variable, rather than categorizing
gaps by “big” or “small,” will also aid in comparisons between studies and forest types.
Ash substrate effects
Prescribed fires have been a cornerstone treatment for restoration efforts in native
grove areas managed by the National Park Service since 1969, and will likely continue

22
into the future (Manley et al. 2001). In order to preserve the experimental control of gap
size and shape that was necessary for this study, machines- not fires- were used to create
the gaps. Whether or not agencies should use mechanical treatments in addition to
prescribed fire has been thoroughly debated (Stephenson 1999). As the debate continues,
disturbances of various sources and phenomena continue to impact giant sequoia groves.
A number of gap-causing agents can result in either ash or soil substrates, at least one of
which is necessary for giant sequoia germination (Stark 1968). Large windthrows,
surface water movement that transports litter, and mechanical treatments such as logging
or scarification by hand can all result in mineral soil substrates. An attempt to retain this
study’s relevance to gaps created by fire or other means was made by creating the ash
substrates as a direct comparison to the adjacent mineral soil substrates.
As with the only other experimental assessment of giant sequoia regeneration
within artificial gaps (Stephens et al. 1999), seed germination in this study was low. In
their study, Stephens et al.’s (1999) attempts at promoting regeneration using site
preparation methods produced very little seedlings even after methodically burning debris
piles beneath target trees with the intention of heating crowns to release seed. The lack of
germination in that case was attributed to the particularly dry year, although no estimate
of seed supply was done to verify that there was seed release. In this study, the first
season that seeds and seedlings were planted was a relatively dry year (76.6cm, 28%
below average; NOAA 2005), and the second season when planting and sewing was
repeated was a relatively wet year (164.5cm, 54% above average; NOAA 2005). My
concerted effort to use direct seeding as a method of regeneration did not prove to be
practical as a restoration treatment. Even after sewing stratified seeds over multiple years

23
encompassing two different levels of moisture and on two different substrates, it is not
likely that the treatment resulted in a population of germinants dense enough to lead to
successful establishment of a mature cohort within this gap regime. Systematic surveys
for natural regeneration within these gaps (York, unpublished data) have so far not
detected any natural regeneration, supporting the possibility that the solitary act of
creating gaps mechanically without any subsequent artificial regeneration treatment may
not be sufficient for initiating a cohort of giant sequoia.
The density of seeds sewed in this study is far less than would be expected
following an intense prescribed fire, where concentrations as high as 7500/m2 have been
reported (Hartesveldt and Harvey 1967). The sheer quantity of seeds released during and
after an intense fire is difficult to simulate with an artificial sewing treatment. Although
the cost of sewing is much less than the cost of planting seedlings, the former appears to
be much less reliable for cohort restoration when not using a fire to create the canopy
gap. Giant sequoia seedlings have been planted at large scales beyond grove boundaries
with high success, including within gap-based silvicultural regimes where giant sequoia
survival in one case was higher than for five other native Sierran species (This
dissertation, Chapter 2). Based on similar premises, the benefits of planting seedlings
were also noted by Stephens et al. (1999), who planted seedlings within the Mt. Home
grove but had much higher mortality than so far observed in this study (personal
observation).
While the ash substrate did not influence the functional relationship between gap
size and seedling growth, survival, or germination at the gap level, it did influence
individual seedling size within gaps considerably (Fig. 2). The main effect of the ash

24
treatment was to increase seedling growth in all positions, with a pronounced effect in
gap centers. The possibility that the ash substrate (and associated increases in nutrient
availability or increased wettability) might change the tolerance of giant sequoia
seedlings to low-resource environments by increasing the capacity for growth or survival
was in general not supported. Support would have come from a large effect of ash
substrate on seedling growth or survival at gap edges (low resource availability)
compared to at gap centers (high resource availability). Instead, the ash substrate
increased growth at all positions along the resource gradient and was relatively
ineffective in influencing germination and survival.
While restoration treatments do not require ash substrates for survival and growth
of seedlings, rapid growth appears to be facilitated in all gap environments and sizes by
an ash substrate. Whether this early surge in growth will result in actual “catching up” by
this cohort to the missing cohort that would have established without fire suppression can
only be verified by tracking these individuals over time. Subtle differences in juvenile
performance often determine a tree’s success in completing its life cycle (Knapp and
Canham 2000, Landis and Peart 2005), and I have observed positive effects of ash
substrate on giant sequoia size 16 years after planting (unpublished data). It is therefore
possible that the ash substrate will at least reduce the amount of time that will pass before
mature, seed-bearing trees develop, potentially offering a competitive advantage for later
emergence into the canopy.
The question of whether rapid seedling growth should be an objective of
restoration in the case of giant sequoia is an important consideration that could
profoundly influence the design of restoration treatments. For example, rapid growth

25
compared to associated species following the 1870’s disturbance led to the present
structural and compositional dominance by giant sequoia in the upper canopy of the study
area. Because of giant sequoias’ dominance, there is no shortage of nearby replacement
trees for the ancient trees that now exist. Hence rapid growth was at least a contributor to
the current positioning of probable replacement trees. There are, however, numerous
giant sequoia individuals in the mid-story that did not outgrow neighbor trees. They
persist as a suppressed bank of potential trees that could possibly recruit into the upper
canopy following a disturbance. Given the capacity for giant sequoia saplings to release
following suppression (Chapter 3), the long-term dynamics of giant sequoia in terms of
recruitment probability from these mid-story positions needs further study. As one of the
fastest and largest growing species (Stephenson 2000) in the mixed conifer forest (if not
the world), growth might also be a relevant consideration for projects seeking long-term
storage of atmospheric carbon.
Gap position effect
As expected, growth was in general greater near the resource-rich gap centers.
The slight skew of higher seedling growth towards the south sides of gaps was surprising,
given a similar study north of grove boundaries that found growth after 3 years to be
heavily skewed towards north sides (York et al. 2003). Light penetration into the south
edges of the gaps may have been greater in this study because of a patchier canopy
caused by the emergent giant sequoia individuals. Alternatively, high levels of
evaporative stress near northern edges in this study may have been more influential
because of climatic differences between study periods or because of this study location’s
slightly lower latitude (2 degrees difference). As resource gradients in these gaps are

26
measured in the future, insights into the causes of these edge effects will help explain
observed growth patterns.
The origin of the mature giant sequoia trees dominating the primary canopy layer
in this study area can all be traced to a single cohort establishing immediately following
the logging/burning event during the 1870’s. Patches of ancient trees elsewhere can
similarly be reconstructed to originate from intense fires that created canopy gaps >0.03
ha (Stephenson 1994). In this study, I attempted to apply treatments that were similar to
those past cohort-initiating events in terms of gap size and tree mortality intensity.
Because of the role of fire in releasing and promoting germination, and because of some
research suggesting a beneficial effect of burn piles on regeneration (Harvey and
Shellhammer 1991), I expected germination to be more abundant on ash bed substrates
near the central portions of gaps. While germination was indeed higher in these areas, the
effect was only slight.
Relying on natural seed germination likely requires a much larger intensity of
seed input, both in terms of density and frequency. Because seeds have to be sewn in the
fall season, it is impossible to predict the germination conditions during the following
spring. It may be necessary to either accept high variability in germination success
following restoration treatments from year to year (including complete failures), or apply
sewing treatments across multiple years. Although I observed some seeds that germinated
two years after sewing, overwintering is not common enough to rely on for opportunistic
establishment during adequate conditions (Harvey et al. 1980).
Most mortality of seedlings occurred on the north sides of gaps, increasing with
proximity to the north edge. As observed in other studies (Rundel 1972, Harvey et al.

27
1980), the dominant cause of mortality was undoubtedly desiccation, as no signs of other
damaging agents were noted. The desiccation was likely a result of greater levels of
evaporative stress from peaks in radiation intensity occurring north of gap center (York et
al. 2003). The blackened ash substrate likely resulted in increased surface temperatures
and vapor pressure deficits, but did not result in greater mortality. The benefit of the ash
substrate in terms of growth (Fig. 2) may be off-setting any negative influence of above-
ground heating on survival.
In this gap regime, a cohort of surviving seedlings was best established by
planting seedlings within gaps at slightly higher densities near north edges to offset
higher levels of mortality. A subset of rapidly growing seedlings was promoted by
preparing an ash substrate and by planting seedlings near gap centers. Depending on
objectives (establishment, survival, and/or growth), restoration treatments can be
designed using these results to increase the probability of success. Because of variability
between sites and seasons, these results are not likely to hold true in every instance.
Restoration programs should identify areas of uncertainty in the degree to which this
research might be locally applicable, and then test uncertainties through an adaptive
management approach as presented by Walters and Holling (1990).
Long-lived pioneer species restoration
The long-lived pioneer concept has been used in various forest types to classify a
type of species- those that colonize rapidly following large disturbances and then persist-
into a unique successional category (e.g. Lusk 1999, Finegan and Delgado 2000, Ogden
et al. 2005). Although susceptible to the pitfalls of any categorization, long-lived pioneer
might indeed be a useful integrative concept since it provides an exception to the

28
colonizer-competitor tradeoff typically observed between fast-growing and long-lived
species (Loehle 1988, Tilman 1994). As demonstrated by Ford and Ishii (2001), however,
to become integrative the concept first needs to be strengthened by progressively
assessing similarities between potential long-lived species from different systems, and by
exploring biological causalities for why they exist.
Emergence to a dominant canopy position following disturbance is a common and
necessary trait of long-lived pioneers that allows for long-term persistence. Because the
probability of establishing an emergent position is typically correlated with rapid early
growth (Wright et al. 2000, Landis and Peart 2005), it follows that long-lived pioneers
share rapid growth under high-resource environments as a common attribute (but see
Lusk 1999 for a possible exception). While a generally positive relationship between
growth and gap size applies for most tree species, the specific details of the relationship
might reveal a distinguishing characteristic of long-lived pioneer species. The two more-
commonly studied species referred to as long-lived pioneers (Sequoiadendron
giaganteum: Ishii and Ford 2002, Pseudotsuga menziesii in the Pacifc Northwest: Ogden
et al. 2005) are both relatively sensitive to gap size and have asymptotic relationships that
saturate at distinctly large gap sizes (Fig 1, Gray and Spies 1996). This attribute is
consistent with the “dependence” of these long-lived pioneers on moderate or intense
disturbances that create large canopy gaps (Spies et al. 1990, Stephenson 1994).
Certainly, whether this is an additional similarity between long-lived pioneers that will
boost its usefulness as an integrative concept needs to be explored with other species.
Potentially, the quantification of a species’ particular saturation point at which gap size
no longer results in additional growth may provide a useful descriptive metric of species
29
life-histories that also has obvious management application. This saturation point may be
considered the population analog to the saturation point or light compensation point for
photosynthesis in individuals.
The question of why the long-lived pioneer life history exists for giant sequoia is
related to the particular disturbance regime that it is associated with. Large, infrequent
disturbances (i.e. catastrophic) are usually assumed to be non-adaptive since they occur
less frequently than the longevity of most organisms. For the longest-lived organisms that
either have a life-span that is similar or slightly shorter than the return interval of the
disturbance, however, large disturbances may be an adaptive force that selects for
longevity (Pollmann 2004). For giant sequoia, adaptations for persisting through
numerous low- and moderate-intensity disturbances (e.g. rapid growth, serotiny, thick
bark) facilitate survival until a disturbance with enough intensity creates a canopy gap big
enough for regeneration and recruitment. Hence, while giant sequoia is adapted to a low-
intensity, high-frequency surface fire regime (Kilgore and Taylor 1971), it is also adapted
to the very infrequent high-intensity fires that have occurred in its range (Swetnam 1993).
Intense fires occurred more frequently than the 2000+ year lifespan of giant sequoia
(Stephenson and Demetry 1995). For long-lived pioneer species, intense disturbances are
likely to be a key component in their persistence.
Treatments that restore or mimic the intensity of disturbances that facilitate
regeneration of long-lived pioneers can be expected to meet great public scrutiny. Intense
fires in giant sequoia groves, for example, are a visually destructive process that often
conflicts with local air quality standards. Despite these social and logistical challenges of
restoring intense disturbances, they may be particularly effective at meeting restoration

30
goals (Fule et al. 2004). Relict conifer species such as giant sequoia (e.g. Sequoia
sempervirens and Wollemia nobilis) are at a practical advantage because public support is
easily garnered for such unique and attractive species (Briggs 2000). Justifications for
careful treatment installations can also benefit from experiments that quantify responses
of ecological variables to ranges of environmental conditions and specifically test a range
of treatment options.
References Anderson, D. R., K. P. Burnham, and W. L. Thompson. 2000. Null hypothesis testing: problems,
prevalence, and an alternative. Journal of Wildlife Management 64:912-923. Bonnicksen, T., and E. C. Stone. 1982. Reconstruction of a Presettlement Giant Sequoia Mixed Conifer
Forest Community Using the Aggregation Approach. Ecology 63:1134-1148. Bonnicksen, T. M., and E. C. Stone. 1981. The Giant Sequoia Mixed Conifer Forest Community
Characterized through Pattern Analysis as a Mosaic of Aggregations. Forest Ecology & Management 3:307-328.
Briggs, B. G. 2000. What is significant: The Wollemi pine or the southern rushes? Annals of the Missouri Botanical Garden 87:72-80.
Burnham, K. P., and D. R. Anderson. 2002. Model selection and multimodel inference: A practical information-theoretic approach, second edition edition. Springer-Verlag, New York.
Canham, C. D., J. S. Denslow, W. J. Platt, J. R. Runkle, T. A. Spies, and P. S. White. 1990. Light Regimes beneath Closed Canopies and Tree-Fall Gaps in Temperate and Tropical Forests. Canadian Journal of Forest Research 20:620-631.
Coates, K. D. 2000. Conifer seedling response to northern temperate forest gaps. Forest Ecology and Management 127:249-269.
Covington, W. W. 2000. Helping western forests heal. Nature 408:135-136. Demetry, A. 1995. Regeneration patterns within canopy gaps in a giant sequoia-mixed conifer forest:
Implications for forest restoration. Masters thesis. Northern Arizona University, Flaggstaff, AZ. Finegan, B., and D. Delgado. 2000. Structural and floristic heterogeneity in a 30-year-old Costa Rican rain
forest restored on pasture through natural secondary succession. Restoration Ecology 8:380-393. Ford, E. D., and H. Ishii. 2001. The method of synthesis in ecology. Oikos 93:153-160. Fule, P. Z., A. E. Cocke, T. A. Heinlein, and W. W. Covington. 2004. Effets of an intenst prescribed forest
fire: Is it ecological restoration. Restoration Ecology 12:220-230. Gray, A. N., and T. A. Spies. 1996. Gap size, within-gap position and canopy structure effects on conifer
seedling establishment. Journal of Ecology 84:635-645. Harvey, H. T., H. S. Shellhammer, and R. E. Stecker. 1980. USA National Park Service Scientific
Monograph Series No. 12. Giant Sequoia Ecology Fire and Reproduction. in U S National Park Service Scientific Monograph Series. 1980. XXII+182P.
Harvey, T. H., and H. S. Shellhammer. 1991. Survivorship and growth of giant sequoia (Sequoidendron giganteum (Lindl.)Buchh.) seedlings after fire. Madrono 38:14-20.
Huston, M., and T. Smith. 1987. Plant succession: Life history and competition. The American Naturalist 130:168-198.
Ishii, H., and E. D. Ford. 2002. Persistence of Pseudotsuga menziesii (Douglas-fir) in temperate coniferous forests of the Pacific Northwest Coast, USA. Folia Geobotanica 37:63-69.
Johnson, J. B., and K. S. Omland. 2004. Model selection in ecology and evolution. Trends in ecology and evolution 19:101-108.
Kilgore, B. M., and D. Taylor. 1971. Fire history of a sequoia-mixed conifer forest. Ecology 60:129-142.

31
Knapp, L. B., and C. D. Canham. 2000. Invasion of an old-growth forest in New York by Ailanthus altissima: Sapling growth and recruitment in canopy gaps. Journal of the Torrey Botanical Society 127:307-315.
Laacke, R. J., and J. N. Fiske. 1983. Sierra Nevada mixed conifers. Pages 445 in R. M. Burns, editor. Silvicultural systems for the major forest types of the United States. USDA For. Serv. Agric. Handb.
Landis, C. H., and D. R. Peart. 2005. Early performance predicts canopy attainment across life-histories in sub-alpine forest trees. Ecology 86:63-72.
Lawton, R. O., and F. E. Putz. 1988. Natural Disturbance and Gap-Phase Regeneration in a Wind-Exposed Tropical Cloud Forest. Ecology 69:764-777.
Loehle, C. 1988. Tree life history strategies: the role of defenses. Canadian Journal of Forest Research 18:209-222.
Lusk, C. H. 1999. Long-lived light-demanding emergents in southern temperate forests: The case of Weinmannia trichosperma (Cunoniaceae) in Chile. Plant Ecology 140:111-115.
Manley, J., M. Keifer, N. Stephenson, and W. Kaage. 2001. Restoring fire to wilderness: Sequoia and Kings Canyon National Parks. Fire Management Today 61:24-28.
McDonald, P. M., and C. S. Abbot. 1994. Seedfall, regeneration, and seedling development in group-selection openings. USDA Forest Service Research Paper PSW-421:p. 13.
Metcalf, W. 1940. Progress at Whitaker's forest. Forestry Notes, UC-USDA Co-operative Extension:4 pp. ---. 1951. Studies conducted at Whitaker's Forest, Tulare County. Pages Personal letter to Office of the
Director, College of Agriculture in. Bancroft Library Archives, Berkeley, CA. Minkler, L. S., and J. D. Woerhide. 1965. Reproduction of hardwoods: 10 years after cutting as affected by
site and opening size. Journal of Forestry 63:103-107. National Oceanic and Atmospehric Administration [database on the internet]. Accessed 2006 Feb 15.
Available at www.wrh.noaa.gov/hnx/coop/grantgro.htm. Ogden, J., R. A. Fordham, M. Horrocks, S. Pilkington, and R. G. Serra. 2005. Long-term dynamics of long-
lived conifer Libocedrus bidwillii after a volcanic eruption 2000 years ago. Journal of Vegetation Science 16:321-330.
Pollmann, W. 2004. Regeneration dynamics and life history differences in southern Chilean Nothofagus forests: a synthesis. Plant Ecology 174:353-369.
Rigg, C. M. 2001. Orchestrating ecosystem management: Challenges and lessons from Sequoia National Forest. Conservation Biology 15:78-90.
Rundel, P. W. 1972. Habitat Restriction in Giant Sequoia-G the Environmental Control of Grove Boundaries. American Midland Naturalist 87:81-99.
Spies, T. A., J. F. Franklin, and M. Klopsch. 1990. Canopy Gaps in Douglas-Fir Forests of the Cascade Mountains USA. Canadian Journal of Forest Research 20:649-658.
Stark, N. 1968. Seed ecology of Sequoiadendron giganteum. Madrono 19:267-276. Stephens, S. L., D. J. Dulitz, and R. E. Martin. 1999. Giant sequoia regeneration in group selection
openings in the southern Sierra Nevada. Forest Ecology & Management 120:89-95. Stephenson, N. L. 1994. Long-term dynamics of giant sequoia populations: Implications for managing a
pioneer species. USDA For. Serv. Gen. Tech. Rep. PSW-151:56-63. ---. 1999. Reference conditions for giant sequoia forest restoration: Structure, process, and precision.
Ecological Applications 9:1253-1265. ---. 2000. Estimated ages of some large giant sequoias: General sherman keeps getting younger. Madrono
47:61-67. Stephenson, N. L., and A. Demetry. 1995. Estimating ages of giant sequoias. Canadian Journal of Forest
Research 25:223-233. Sugiura, N. 1978. Further analysis of the data by Akaike's information criterion and the finite corrections.
Communications in Statistics, Theory and Methods A7:13-26. Swetnam, T. W. 1993. Fire history and climate change in giant sequoia groves. Science (Washington D C)
262:885-889. Tilman, D. 1994. Competition and biodiversity in spatially structured habitats. Ecology (Tempe) 75:2-16. Walters, C. J., and C. S. Holling. 1990. Large-scale management experiments and learning by doing.
Ecology 71:2060-2068. Webster, C. R., and C. G. Lorimer. 2002. Single-tree versus group selection in hemlock-hardwood forests:
are smaller openings less productive? Canadian Journal of Forest Research 32:591-604.

32
Whitaker's Forest Resarch Station [on-line database]. Accessed 2005 Sept. Available at http://ecology.cnr.berkeley.edu/properties/
Wright, E. F., C. D. Canham, and K. D. Coates. 2000. Effects of suppression and release on sapling growth for 11 tree species of northern British Columbia. Canadian Journal of Forest Research 30:1571-1580.
York, R. A., J. J. Battles, and R. C. Heald. 2003. Edge effects in mixed conifer group selection openings: Tree height response to resource gradients. Forest Ecology & Management 179:107-121.
York, R. A., R. C. Heald, J. J. Battles, and J. D. York. 2004. Group selection management in conifer forests: relationships between opening size and tree growth. Canadian Journal of Forest Research 34:630-641.
33
Tables Table 1. Species classified as long-lived pioneers Species Forest type Longevity Traits noted in
literature Reference
Sequoiadendron giganteum
Temperate conifer
3000+ years Massive, fast growing, disturbance colonizer
Stephenson 1994
Sequoia sempervirens
Temperate conifer
2200+ years Rapid growth after disturbance, huge size, long-lived
Huston and Smith 1987
Pseudotsuga menziesii
Temperate conifer
1000+ years High LAI, epicormic branching when old
Ishii and Ford 2002
Weinmannia trichosperma
Temperate rainforest
730+ years Mid-tolerant, needs large gaps to establish
Lusk 1999
Nothofagus alpine Temperate deciduous evergreen
700+ years Fast growing, “mid-tolerant”; outgrows congenitors in gaps
Pollman 2004
Pinus strobes Temperate 450 years Long-lived, light-demanding, rapid growth (but delayed)
Huston and Smith 1987
Liriodendron tulipifera
Temperate hardwood
300+ Gap dependent, establishes after gaps and outgrows adv. regen; long-lived, very large; often grows in pure stands
Huston and Smith 1987
Agathis australis Temperate conifer (New Zealand)
Not available Light-demanding, rapid regen. after coarse disturbance, canopy emergent
Ogden & Stewart 1995
Anacardium excelsum
Tropical Not available Orthotropic, high LAI, long-lived, efficient leaves
Kitajima et al. 2005
Lueha seemannii Tropical Not available Plagiotropic, high LAI; dense layer of outermost leaves, long-lived, efficient leaves
Kitajima et al. 2005

34
Table 2. Candidate models for evaluating within-gap influences on regeneration and their implications for restoration Model* Restoration implication S (Substrate) Treatments that alter the substrate will have the most
influence regeneration P (Proximity to matrix) Treatments that alter the proximity of regeneration to the
matrix forest will be most influential O (Orientation) Treatments that alter the placement of regeneration either
on the south or north half of gaps will be most influential P+O+S All three variables vary independently and are important
influences on regeneration; P+S+P*S The combination of substrate and proximity is of primary
importance O+S+S*O The combination of substrate and orientation is of
primary importance P+O+P*O The combination of proximity and orientation is of
primary importance P+O+S+S*O+P*S+P*O All possible combinations of substrate, proximity, and
orientation are important *Note that all additive combinations are not considered.

35
Table 3. Model selection results for the relationship between gap size and regeneration indicators. Model ranks Ki AICi Wi Evidence
ratios 95% likelihood confidence interval of slope parameter
Height Growth Soil 1. Asymptotic 2 -43.07 0.63 0.02-0.19 2. Quadratic 3 -41.58 0.30 2.10 3. Linear 2 -38.65 0.07 9.13 Ash 1. Asymptotic 2 -48.93 0.78 0.03-0.15 2. Quadratic 3 -45.93 0.17 4.50 3. Linear 2 -43.26 0.05 17.06 Diameter Growth Soil 1. Asymptotic 2 -42.77 0.67 0.03-0.32 2. Quadratic 3 -40.41 0.21 3.26 3. Linear 2 -39.34 0.12 5.58 Ash 1. Asymptotic 2 -44.55 0.76 0.02-0.15 2. Quadratic 3 -40.76 0.11 6.65 3. Linear 2 -40.98 0.13 5.95 Seed Germination Soil 1. Linear 2 -77.21 0.57 -0.77- 0.08 2. Asymptotic 2 -75.90 0.29 1.93 3. Quadratic 3 -74.41 0.14 4.07 Ash 1. Linear 2 -74.81 0.44 -0.90- 0.01 2. Asymptotic 2 -74.74 0.43 1.04 3. Quadratic 3 -72.28 0.13 3.54 Seedling Mortality Soil 1. Linear 2 -59.00 0.45 -0.77 - 0.08 2. Asymptotic 2 -58.70 0.39 1.16 3. Quadratic 3 -56.84 0.15 2.95 Ash 1. Asymptotic 2 -64.71 0.43 -0.03 - 0.28 2. Linear 2 -64.36 0.36 1.19 3. Quadratic 3 -63.33 0.21 1.99

36
Table 4. Model ranks and importance values of within-gap influences on regeneration indicators. The highest ranked models that sum to >95% of the normalized AIC weights are reported. S = substrate (ash or soil), P = proximity to edge, O = orientation from gap center (south or north) Model AICw Evidence
ratio Cumulative weight
Importance value of variables
Seedling size S=0.56, P=0.56, O=0.56, S*P=0.44, S*O=0.29, P*O=0.29
1. S+P+O 0.56 0.56 2. S+P+O+S*P+S*O+P*O 0.29 1.95 0.85 3. S+P+S*P 0.15 3.84 >0.99 Seed germination P=0.45, S=0.35, O=0.29, P*S=0.11,
P*O=0.07, O*S=0.5 1. P 0.30 0.30 2. S 0.19 1.55 0.50 3. S+P+O 0.15 2.00 0.65 4. O 0.13 2.25 0.78 5. S+P+S*P 0.10 3.05 0.88 6. P+O+P*O 0.07 4.59 0.95 Seedling mortality P*O=0.97, O*S=0.22, P*S=0.22,
O=0.03, P=0.02, S=0.02 1. P+O+P*O 0.75 0.75 2. S+P+O+S*P+S*O+P*O 0.22 3.44 0.97

37
Figures Figure 1. Effect of gap size on relative growth of seedligns during the second year after planting. The model-selected asymptotic fit is used to describe the relationship. A. relative height growth. B. relative basal diameter growth. Seedlings were planted along south-north transects at Whitaker's Forest Research Station, CA within the Redwood Mountain Grove.
0.0 0.1 0.2 0.3 0.4
Rel
ativ
e he
ight
gro
wth
0.0
0.2
0.4
0.6
0.8
1.0
1.2
Gap size (ha)
0.0 0.1 0.2 0.3 0.4
Rel
ativ
e ba
sal d
iam
eter
gro
wth
0.0
0.2
0.4
0.6
0.8
1.0
1.2
A.
B.
38
Figure 2. Influence of proximity to matrix, orientation, and substrate for 2 year old planted seedlings in gaps ranging in size from 0.04 to 0.4 ha at Whitaker's Forest Research Station, CA in the Redwood Mountain grove. The dashed vertical line represents gap center. The lines are quadratic fits of seedling size, displaying the average profile of seedling size across 20 gaps from north to south drip-line edges.
Relative distance across gap from north to south
0.0 0.2 0.4 0.6 0.8 1.0
Seed
ling
size
(cm
3)
0
50
100
150
200
250
Ash
Soil
39
Figure 3. Influence of gap position and matrix proximity on mortality within experimental gaps at Whitaker's Forest Research Station, CA. The Y-axis is the average fraction of seedlings dead from two planting spots at paired distances from gap edge. Each planting spot had from 2 to 3 seedlings planted over two years..
Relative proximity to matrix
0.0 0.2 0.4 0.6 0.8 1.0
Mor
talit
y in
dex
0.0
0.2
0.4
0.6
0.8
1.0North half of gapSouth half of gap
North
South
Gap edge

40


![RESTORING NATURAL FIRE TO THE SEQUOIA-MIXED CONIFER ... · In the giant sequoia (Sequoiadendron giganteum [Lindl.] Buchh.) dominated forests of Sequoia, Kings Canyon, and Yosemite](https://static.cupdf.com/doc/110x72/5f3ba4adf7f45d4c1518b5ef/restoring-natural-fire-to-the-sequoia-mixed-conifer-in-the-giant-sequoia-sequoiadendron.jpg)


![REFERENCE CONDITIONS FOR GIANT SEQUOIA FOREST … · (Sequoiadendron giganteum [Lindley] Buchholz)–mixed conifer ecosystems of the Sierra Nevada, California. Dissertion. University](https://static.cupdf.com/doc/110x72/5c65ccbe09d3f20f218b5081/reference-conditions-for-giant-sequoia-forest-sequoiadendron-giganteum-lindley.jpg)