June 28 – 1 JulyECMWF Workshop on Assimilation of high
spectral resolution sounders in NWPSlide 1
Challenges in Satellite Data Monitoring at ECMWF
Gerald van der GrijnECMWF
Meteorological Operations Section
Thanks to the following persons who contributed in one way or the other to this presentation:
Jean-Noël Thépaut, Tony McNally, Graeme Kelly, Jonathan Smith
June 28 – 1 JulyECMWF Workshop on Assimilation of high
spectral resolution sounders in NWPSlide 2
Overview
• Why is there a challenge?» Summary of satellite data usage at ECMWF» Importance of satellite data
• How is this challenge tackled?» Summary of monitoring products» Some Examples
• Future plans
June 28 – 1 JulyECMWF Workshop on Assimilation of high
spectral resolution sounders in NWPSlide 3
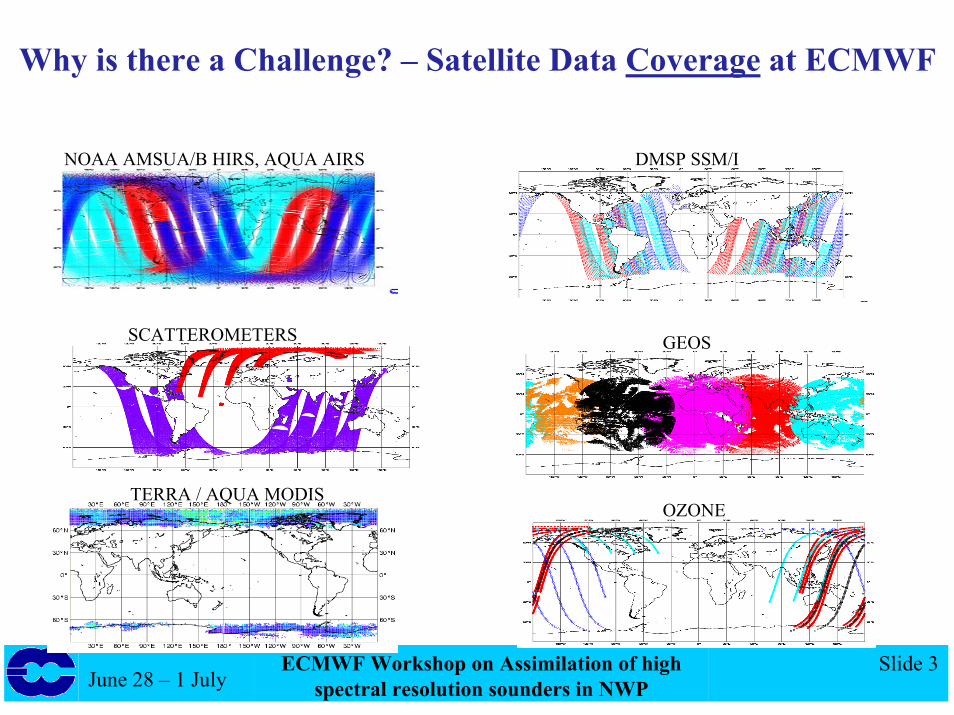
NOAA AMSUA/B HIRS, AQUA AIRS DMSP SSM/I
Why is there a Challenge? – Satellite Data Coverage at ECMWF
SCATTEROMETERS GEOS
TERRA / AQUA MODISOZONE
June 28 – 1 JulyECMWF Workshop on Assimilation of high
spectral resolution sounders in NWPSlide 4
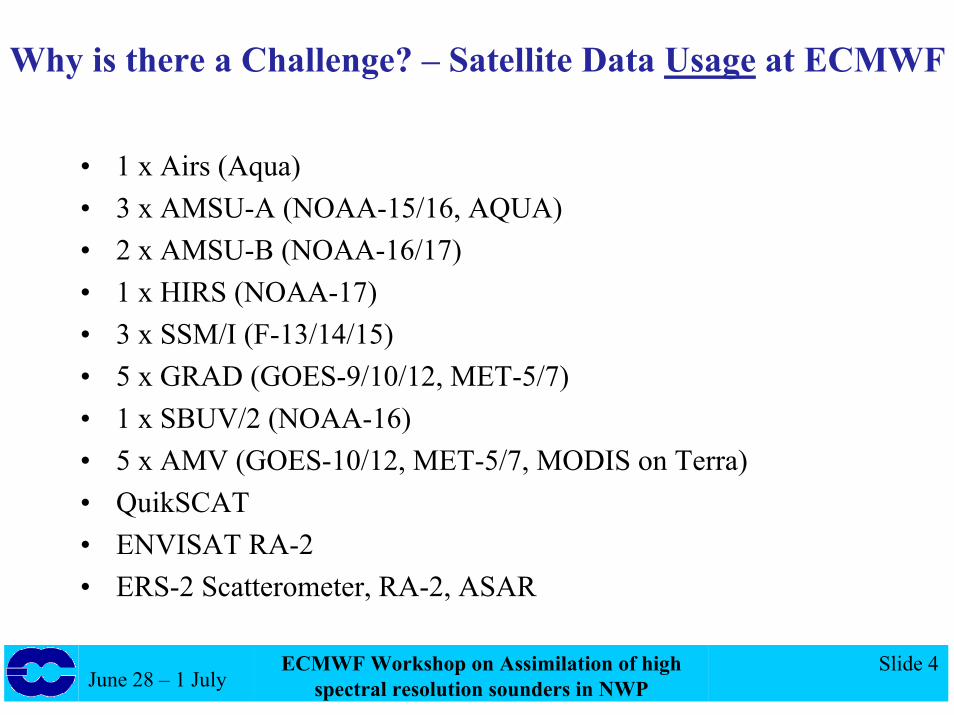
Why is there a Challenge? – Satellite Data Usage at ECMWF
• 1 x Airs (Aqua)• 3 x AMSU-A (NOAA-15/16, AQUA)• 2 x AMSU-B (NOAA-16/17)• 1 x HIRS (NOAA-17)• 3 x SSM/I (F-13/14/15)• 5 x GRAD (GOES-9/10/12, MET-5/7)• 1 x SBUV/2 (NOAA-16)• 5 x AMV (GOES-10/12, MET-5/7, MODIS on Terra)• QuikSCAT• ENVISAT RA-2• ERS-2 Scatterometer, RA-2, ASAR
June 28 – 1 JulyECMWF Workshop on Assimilation of high
spectral resolution sounders in NWPSlide 5
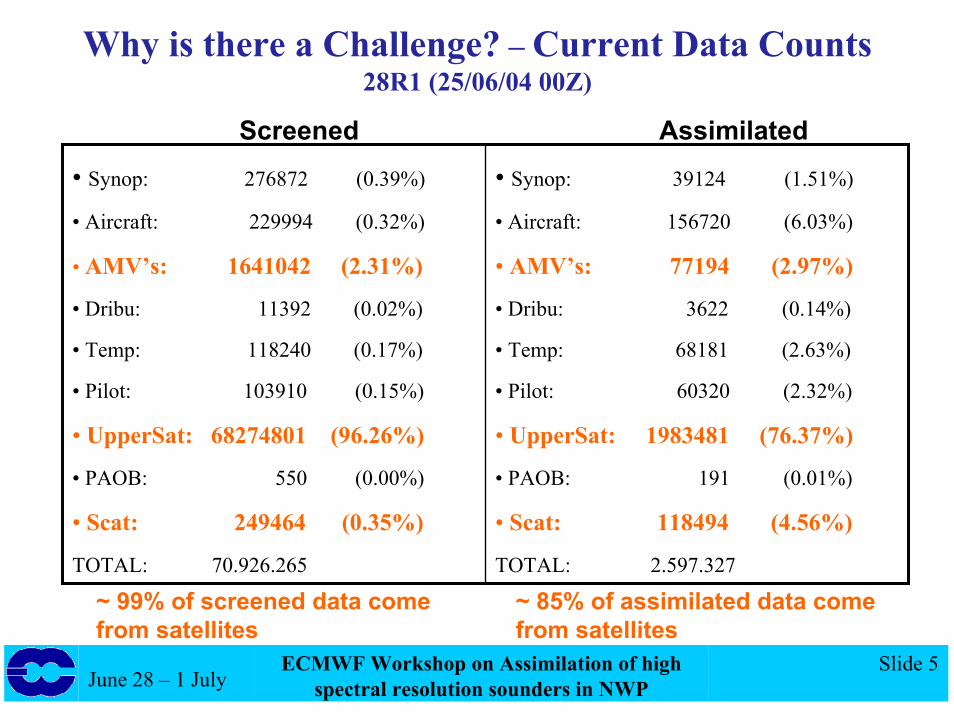
Why is there a Challenge? – Current Data Counts28R1 (25/06/04 00Z)
• Synop: 39124 (1.51%)
• Aircraft: 156720 (6.03%)
• AMV’s: 77194 (2.97%)
• Dribu: 3622 (0.14%)
• Temp: 68181 (2.63%)
• Pilot: 60320 (2.32%)
• UpperSat: 1983481 (76.37%)
• PAOB: 191 (0.01%)
• Scat: 118494 (4.56%)
TOTAL: 2.597.327
• Synop: 276872 (0.39%)
• Aircraft: 229994 (0.32%)
• AMV’s: 1641042 (2.31%)
• Dribu: 11392 (0.02%)
• Temp: 118240 (0.17%)
• Pilot: 103910 (0.15%)
• UpperSat: 68274801 (96.26%)
• PAOB: 550 (0.00%)
• Scat: 249464 (0.35%)
TOTAL: 70.926.265
Screened Assimilated
~ 99% of screened data come from satellites
~ 85% of assimilated data come from satellites
June 28 – 1 JulyECMWF Workshop on Assimilation of high
spectral resolution sounders in NWPSlide 6
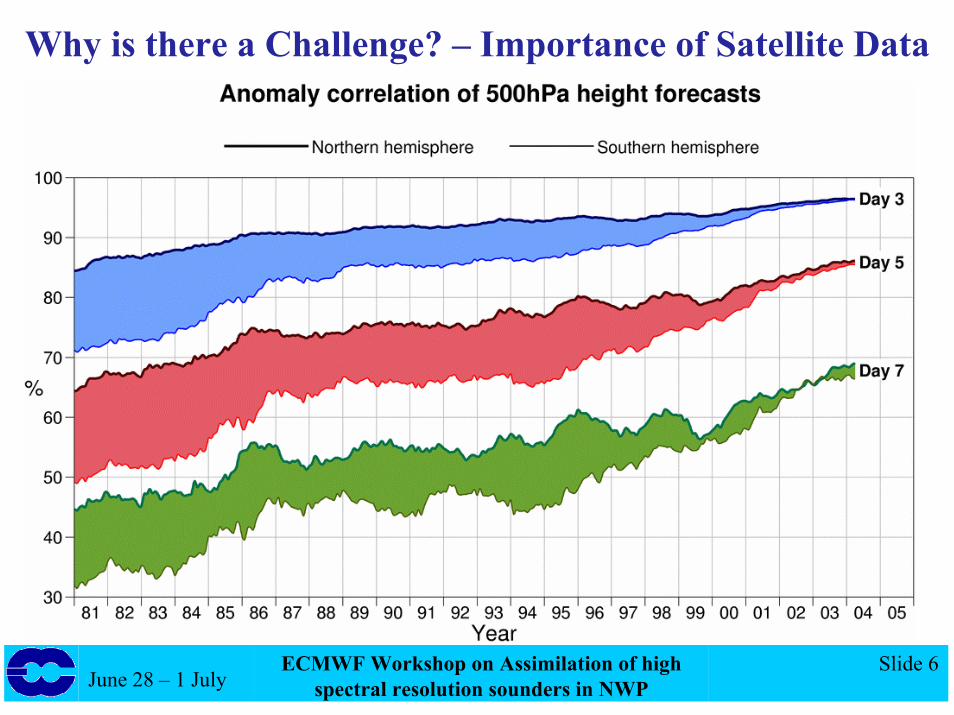
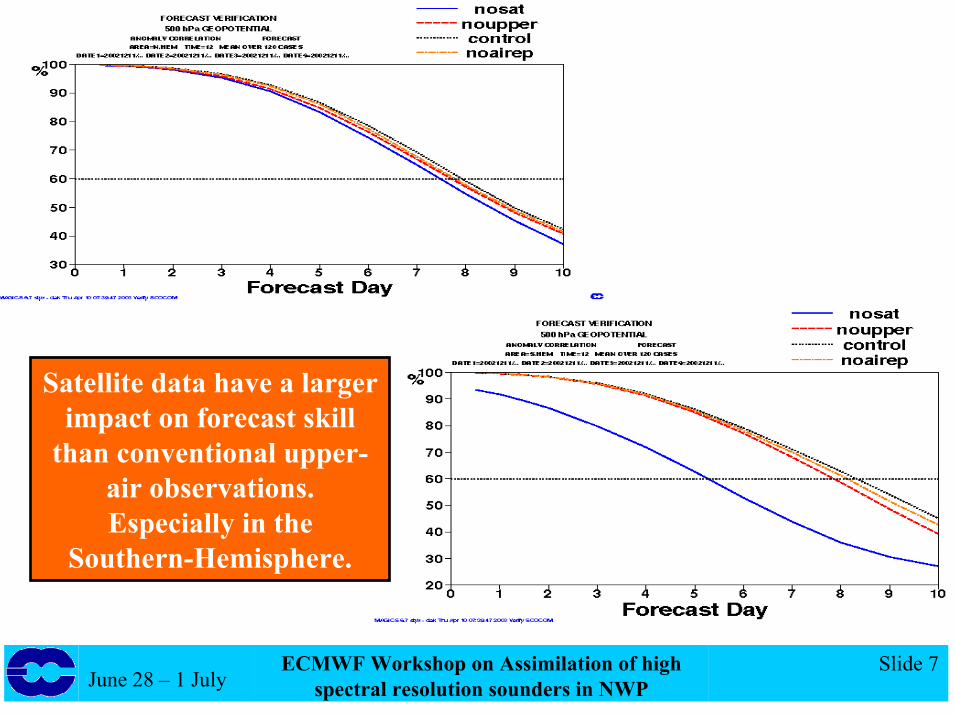
Why is there a Challenge? – Importance of Satellite Data
June 28 – 1 JulyECMWF Workshop on Assimilation of high
spectral resolution sounders in NWPSlide 7
Satellite data have a larger impact on forecast skill
than conventional upper-air observations. Especially in the
Southern-Hemisphere.
June 28 – 1 JulyECMWF Workshop on Assimilation of high
spectral resolution sounders in NWPSlide 8
Why is there a Challenge?
• Satellite data represent by far the largest volume of data (and associated computing cost) used in the ECMWF data assimilation system.
• Satellite data have progressively become an essential part of the observing system used at ECMWF. Satellite data have recently caught up with radiosondes in terms of forecast skill impact over NH.
• Satellite data monitoring is essential in order to safeguard the qualityof the observations used and to detect any systematic errors in the ECMWF forecast system.
• The usage of future hyper-spectral instruments (e.g. IASI on METOP) will increase the importance of a (semi-) automatic satellite data monitoring.
June 28 – 1 JulyECMWF Workshop on Assimilation of high
spectral resolution sounders in NWPSlide 9
Overview
• Why is there a challenge?» Summary of satellite data usage at ECMWF» Importance of satellite data
• How is this challenge tackled?» Non-Real time monitoring» Some examples
• Future plans
June 28 – 1 JulyECMWF Workshop on Assimilation of high
spectral resolution sounders in NWPSlide 10
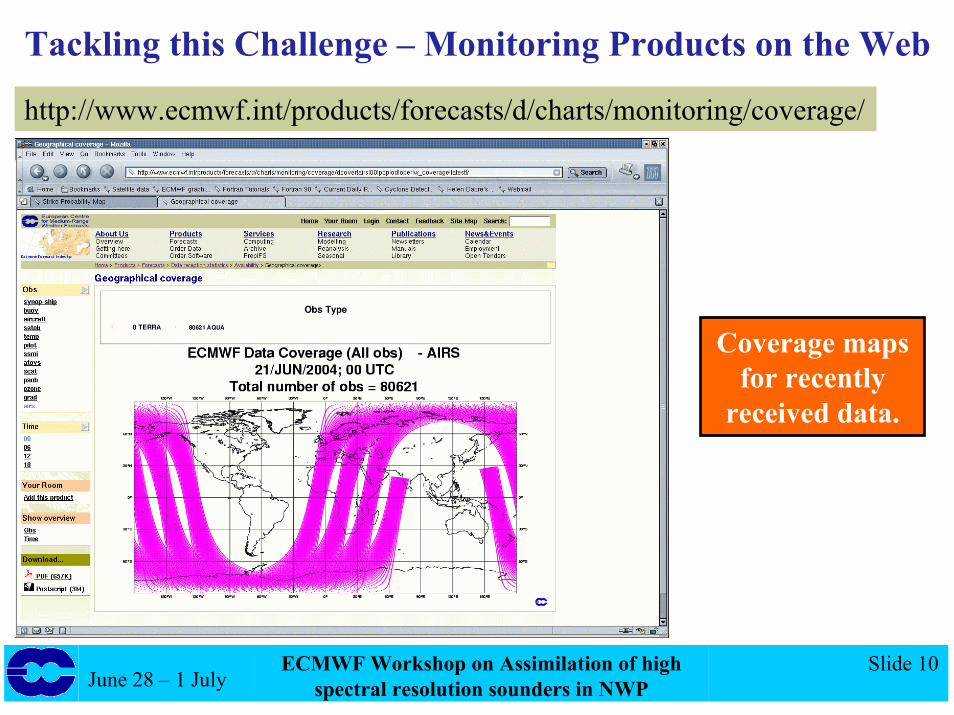
Tackling this Challenge – Monitoring Products on the Web
http://www.ecmwf.int/products/forecasts/d/charts/monitoring/coverage/
Coverage maps for recently
received data.
June 28 – 1 JulyECMWF Workshop on Assimilation of high
spectral resolution sounders in NWPSlide 11
Tackling this Challenge – Monitoring Products on the Web
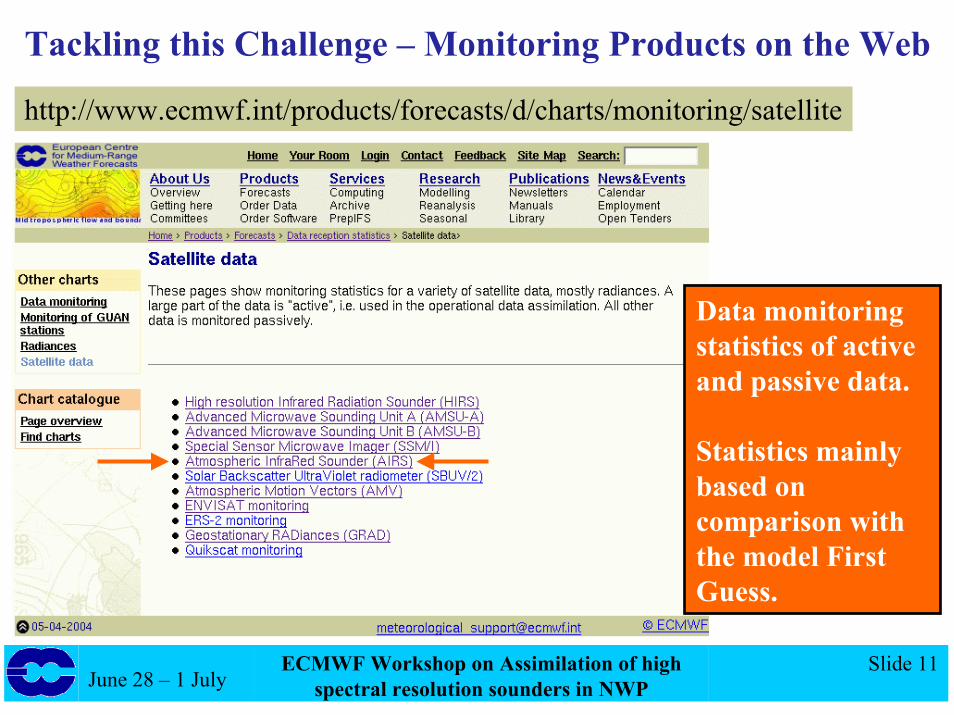
http://www.ecmwf.int/products/forecasts/d/charts/monitoring/satellite
Data monitoring statistics of active and passive data.
Statistics mainly based on comparison with the model First Guess.
June 28 – 1 JulyECMWF Workshop on Assimilation of high
spectral resolution sounders in NWPSlide 12
Tackling this Challenge – Monitoring Products on the Web15
mic
ron
band
O3
band
H20
ban
dsh
ortw
ave
band
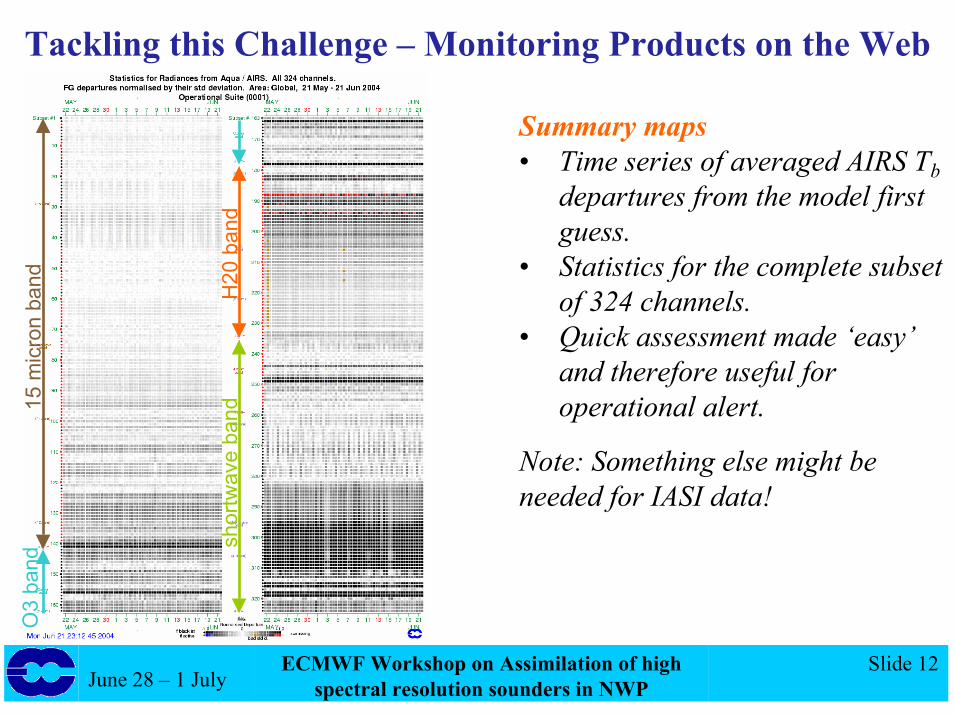
Summary maps• Time series of averaged AIRS Tb
departures from the model first guess.
• Statistics for the complete subset of 324 channels.
• Quick assessment made ‘easy’ and therefore useful for operational alert.
Note: Something else might be needed for IASI data!
June 28 – 1 JulyECMWF Workshop on Assimilation of high
spectral resolution sounders in NWPSlide 13
Tackling this Challenge – Monitoring Products on the Web
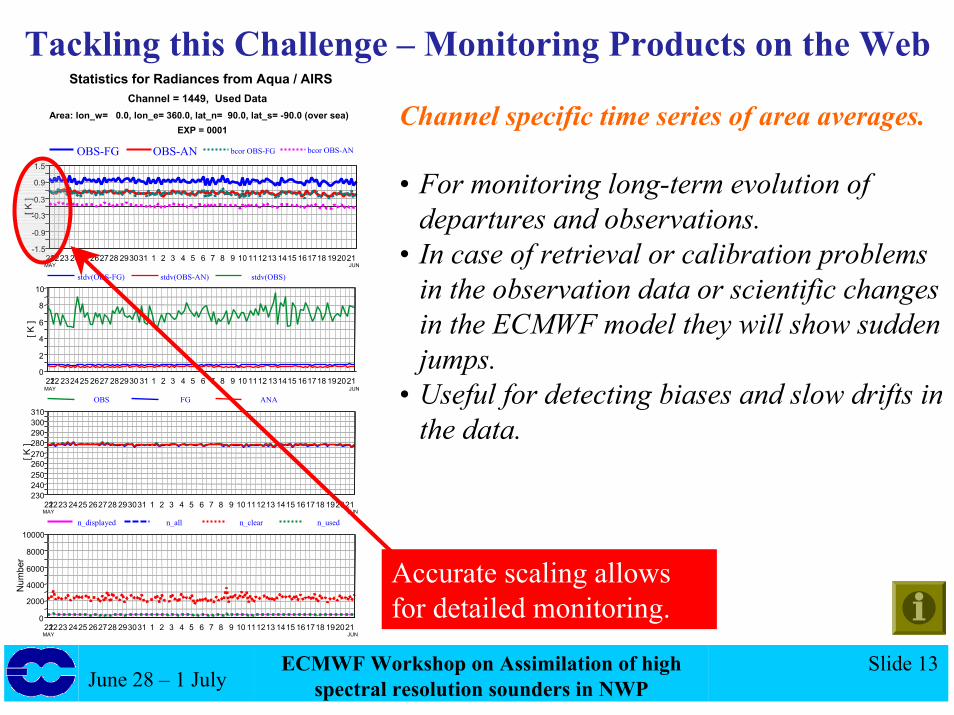
Channel specific time series of area averages.
• For monitoring long-term evolution of departures and observations.
• In case of retrieval or calibration problems in the observation data or scientific changes in the ECMWF model they will show sudden jumps.
• Useful for detecting biases and slow drifts in the data.
EXP = 0001Area: lon_w= 0.0, lon_e= 360.0, lat_n= 90.0, lat_s= -90.0 (over sea)
Channel = 1449, Used DataStatistics for Radiances from Aqua / AIRS
21MAY
2223 2425 262728 293031 1 2 3 4 5 6 7 8 9 10 111213 1415 161718 192021JUN
-1.5
-0.9
-0.3
0.3
0.9
1.5
[ K ]
OBS-FG OBS-AN bcor OBS-FG bcor OBS-AN
21MAY
22 232425 2627 282930 31 1 2 3 4 5 6 7 8 9 10 1112 131415 161718 192021JUN
0
2
4
6
8
10
[ K ]
stdv(OBS-FG) stdv(OBS-AN) stdv(OBS)
21MAY
2223 2425 262728 293031 1 2 3 4 5 6 7 8 9 10 111213 1415 161718 192021JUN
230240250260270280290300310
[ K ]
OBS FG ANA
21MAY
2223 2425 262728 293031 1 2 3 4 5 6 7 8 9 10 111213 1415 161718 192021JUN
0
2000
4000
6000
8000
10000
Num
ber
n_displayed n_all n_clear n_used
Accurate scaling allows for detailed monitoring.
June 28 – 1 JulyECMWF Workshop on Assimilation of high
spectral resolution sounders in NWPSlide 14
Tackling this Challenge – Monitoring Products on the Web
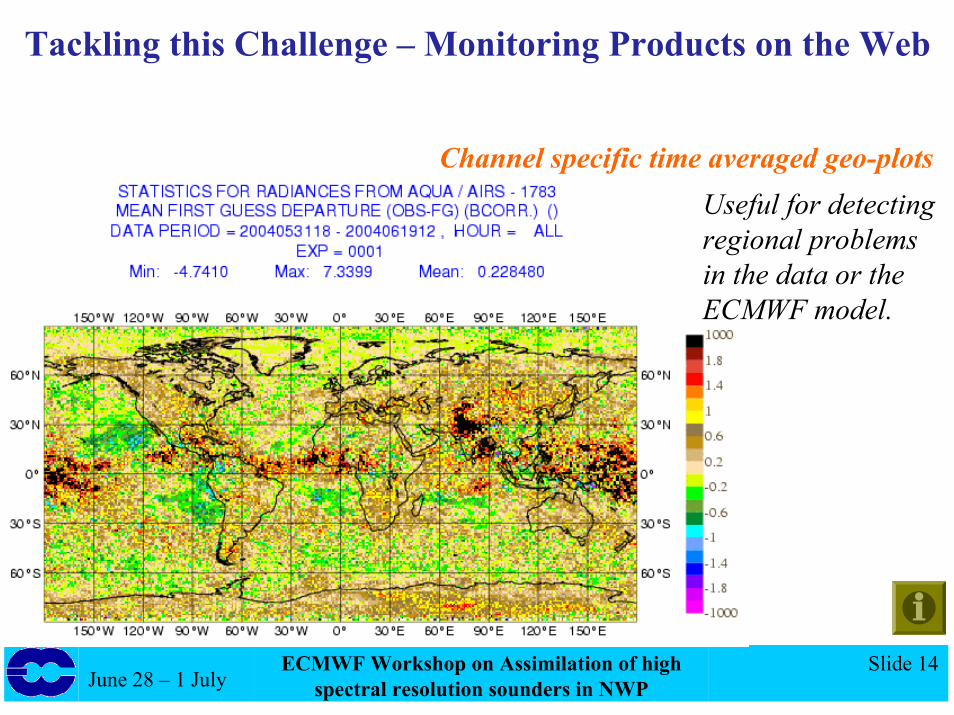
Useful for detecting regional problems in the data or the ECMWF model.
Channel specific time averaged geo-plots
June 28 – 1 JulyECMWF Workshop on Assimilation of high
spectral resolution sounders in NWPSlide 15
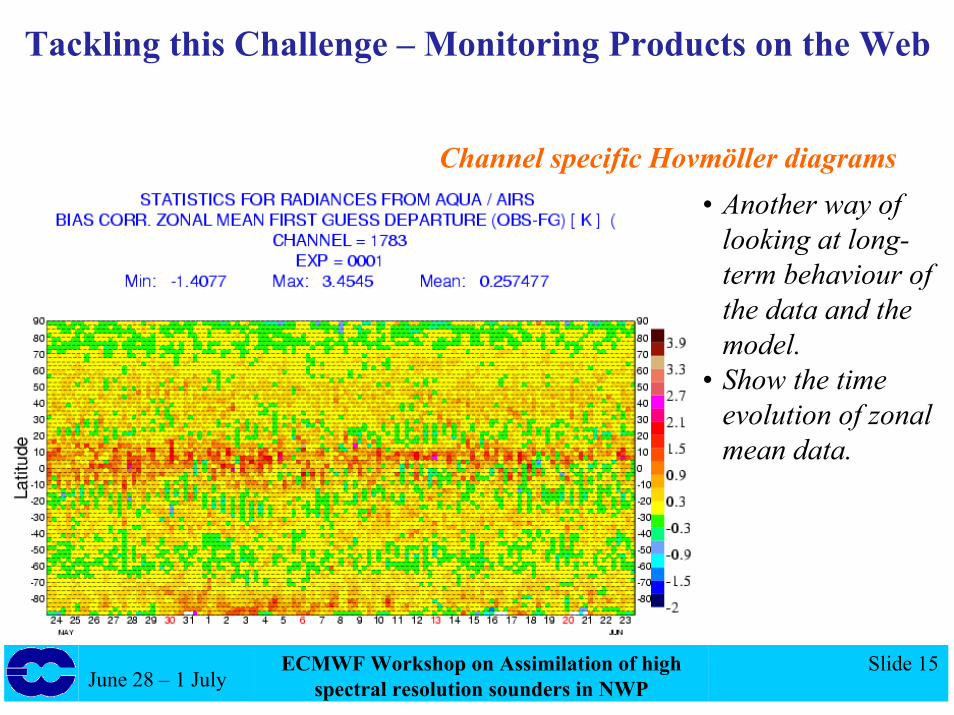
Tackling this Challenge – Monitoring Products on the Web
Channel specific Hovmöller diagrams• Another way of
looking at long-term behaviour of the data and the model.
• Show the time evolution of zonal mean data.
June 28 – 1 JulyECMWF Workshop on Assimilation of high
spectral resolution sounders in NWPSlide 16
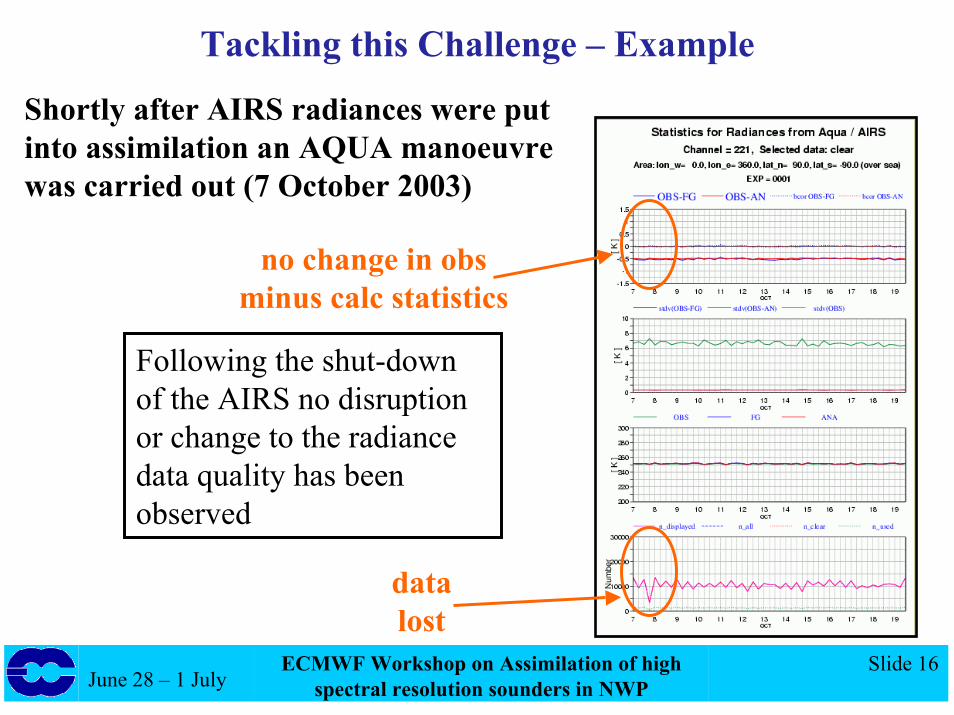
Tackling this Challenge – Example
Shortly after AIRS radiances were putinto assimilation an AQUA manoeuvrewas carried out (7 October 2003)
datalost
no change in obs minus calc statistics
Following the shut-down of the AIRS no disruption or change to the radiance data quality has been observed
June 28 – 1 JulyECMWF Workshop on Assimilation of high
spectral resolution sounders in NWPSlide 17
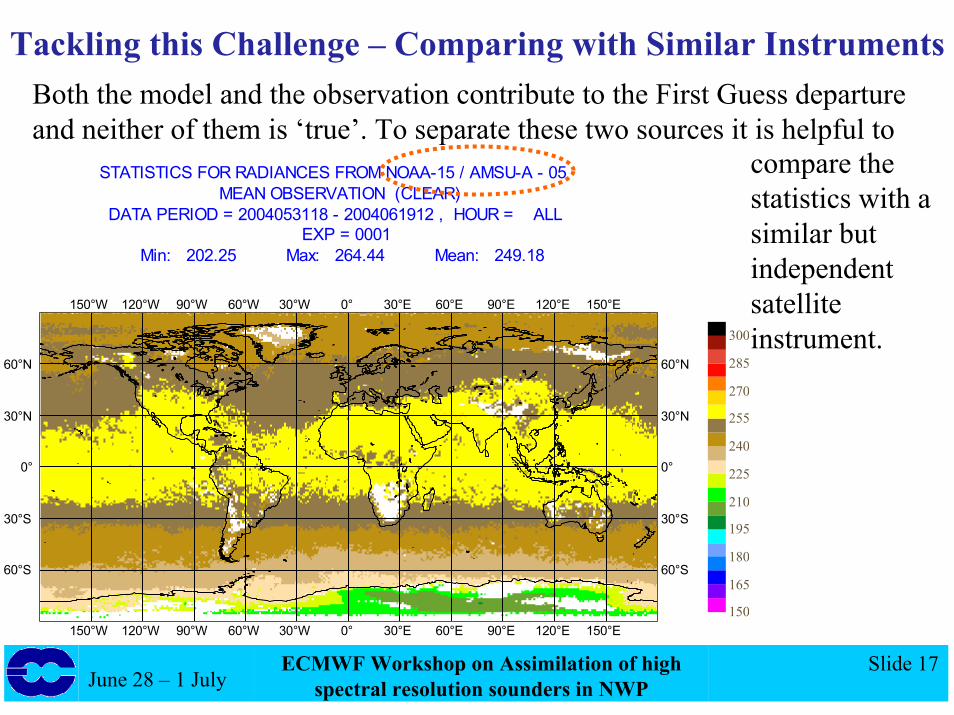
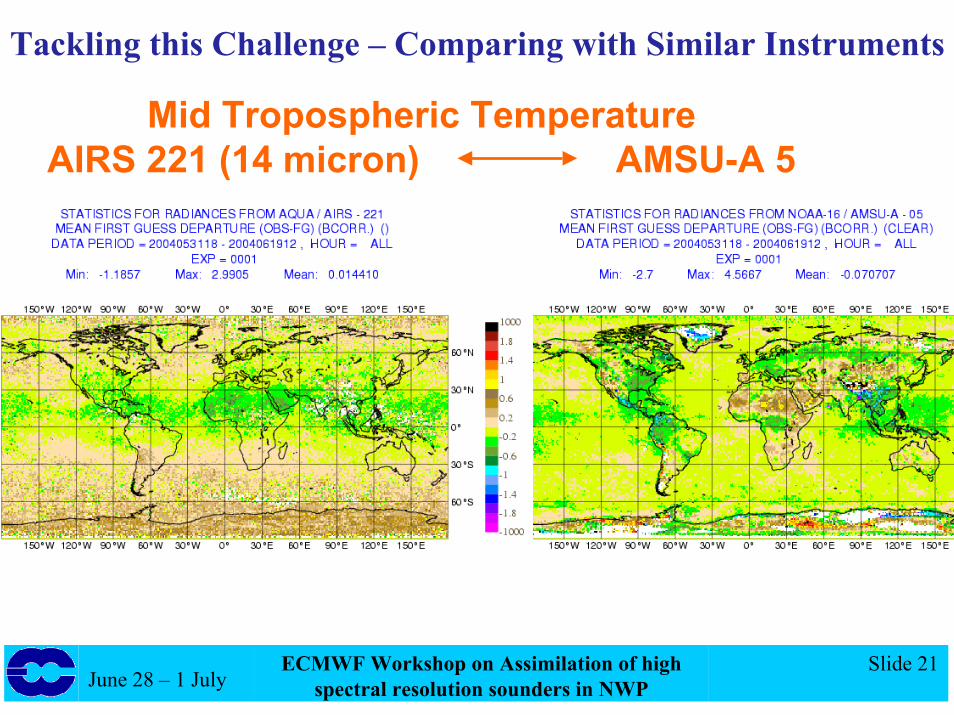
Tackling this Challenge – Comparing with Similar InstrumentsBoth the model and the observation contribute to the First Guess departure and neither of them is ‘true’. To separate these two sources it is helpful to
Min: 202.25 Max: 264.44 Mean: 249.18EXP = 0001
DATA PERIOD = 2004053118 - 2004061912 , HOUR = ALLMEAN OBSERVATION (CLEAR)
STATISTICS FOR RADIANCES FROM NOAA-15 / AMSU-A - 05
60°S60°S
30°S 30°S
0°0°
30°N 30°N
60°N60°N
150°W
150°W 120°W
120°W 90°W
90°W 60°W
60°W 30°W
30°W 0°
0° 30°E
30°E 60°E
60°E 90°E
90°E 120°E
120°E 150°E
150°E150
165
180
195
210
225
240
255
270
285
300
compare the statistics with a similar but independent satellite instrument.

June 28 – 1 JulyECMWF Workshop on Assimilation of high
spectral resolution sounders in NWPSlide 18
Tackling this Challenge – Comparing with Similar InstrumentsBoth the model and the observation contribute to the First Guess departure and neither of them is ‘true’. To separate these two sources it is helpful to
compare the statistics with a similar but independent satellite instrument.
Min: 202.6 Max: 268.2 Mean: 248.58EXP = 0001
DATA PERIOD = 2004053118 - 2004061912 , HOUR = ALLMEAN OBSERVATION (CLEAR)
STATISTICS FOR RADIANCES FROM NOAA-16 / AMSU-A - 05
60°S60°S
30°S 30°S
0°0°
30°N 30°N
60°N60°N
150°W
150°W 120°W
120°W 90°W
90°W 60°W
60°W 30°W
30°W 0°
0° 30°E
30°E 60°E
60°E 90°E
90°E 120°E
120°E 150°E
150°E150
165
180
195
210
225
240
255
270
285
300

June 28 – 1 JulyECMWF Workshop on Assimilation of high
spectral resolution sounders in NWPSlide 19
Tackling this Challenge – Comparing with Similar InstrumentsBoth the model and the observation contribute to the First Guess departure and neither of them is ‘true’. To separate these two sources it is helpful to
compare the statistics with a similar but independent satellite instrument.
Min: 201.48 Max: 269.6 Mean: 248.06EXP = 0001
DATA PERIOD = 2004053118 - 2004061912 , HOUR = ALLMEAN OBSERVATION (CLEAR)
STATISTICS FOR RADIANCES FROM AQUA / AMSU-A - 05
60°S60°S
30°S 30°S
0°0°
30°N 30°N
60°N60°N
150°W
150°W 120°W
120°W 90°W
90°W 60°W
60°W 30°W
30°W 0°
0° 30°E
30°E 60°E
60°E 90°E
90°E 120°E
120°E 150°E
150°E150
165
180
195
210
225
240
255
270
285
300
June 28 – 1 JulyECMWF Workshop on Assimilation of high
spectral resolution sounders in NWPSlide 20
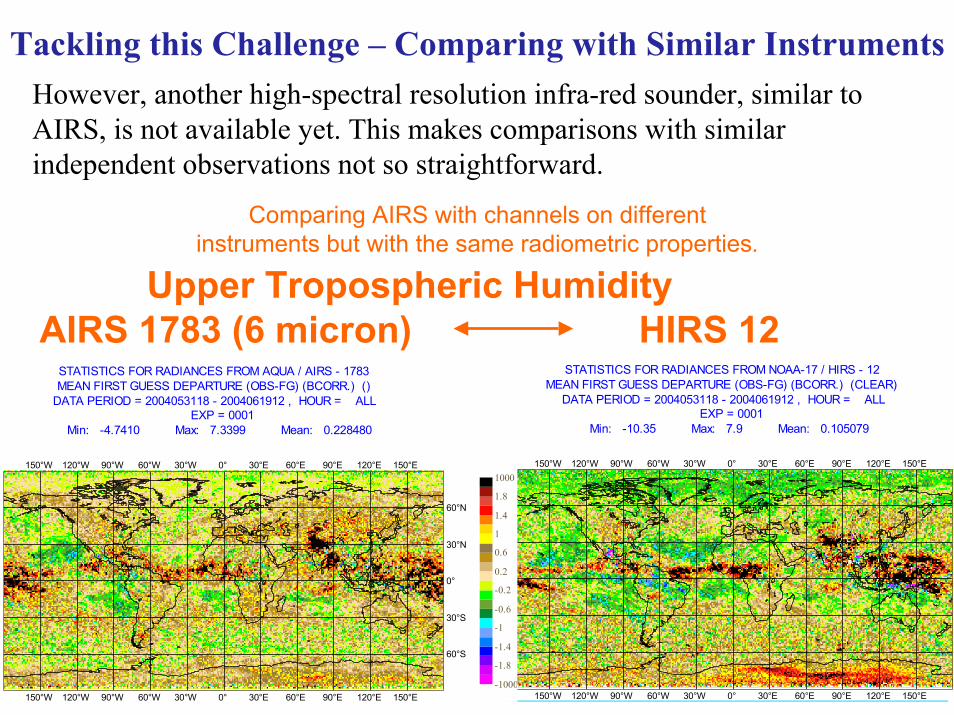
Tackling this Challenge – Comparing with Similar InstrumentsHowever, another high-spectral resolution infra-red sounder, similar to AIRS, is not available yet. This makes comparisons with similar independent observations not so straightforward.
Comparing AIRS with channels on different instruments but with the same radiometric properties.
Upper Tropospheric HumidityAIRS 1783 (6 micron) HIRS 12
Min: 211.2 Max: 251.16 Mean: 234.39EXP = 0001
DATA PERIOD = 2004053118 - 2004061912 , HOUR = ALLMEAN OBSERVATION (CLEAR)
STATISTICS FOR RADIANCES FROM NOAA-17 / HIRS - 12
660°S
30°S 3
00°
30°N 3
660°N
150°W
150°W 120°W
120°W 90°W
90°W 60°W
60°W 30°W
30°W 0°
0° 30°E
30°E 60°E
60°E 90°E
90°E 120°E
120°E 150°E
150°E
Min: 215.23 Max: 254.8 Mean: 233.99EXP = 0001
DATA PERIOD = 2004053118 - 2004061912 , HOUR = ALLMEAN OBSERVATION ()
STATISTICS FOR RADIANCES FROM AQUA / AIRS - 1783
60°S
30°S
0°
30°N
60°N
150°W
150°W 120°W
120°W 90°W
90°W 60°W
60°W 30°W
30°W 0°
0° 30°E
30°E 60°E
60°E 90°E
90°E 120°E
120°E 150°E
150°E150
165
180
195
210
225
240
255
270
285
300
Min: -10.35 Max: 7.9 Mean: 0.105079EXP = 0001
DATA PERIOD = 2004053118 - 2004061912 , HOUR = ALLMEAN FIRST GUESS DEPARTURE (OBS-FG) (BCORR.) (CLEAR)
STATISTICS FOR RADIANCES FROM NOAA-17 / HIRS - 12
660°S
30°S 3
00°
30°N 3
660°N
150°W
150°W 120°W
120°W 90°W
90°W 60°W
60°W 30°W
30°W 0°
0° 30°E
30°E 60°E
60°E 90°E
90°E 120°E
120°E 150°E
150°E
Min: -4.7410 Max: 7.3399 Mean: 0.228480EXP = 0001
DATA PERIOD = 2004053118 - 2004061912 , HOUR = ALLMEAN FIRST GUESS DEPARTURE (OBS-FG) (BCORR.) ()STATISTICS FOR RADIANCES FROM AQUA / AIRS - 1783
60°S
30°S
0°
30°N
60°N
150°W
150°W 120°W
120°W 90°W
90°W 60°W
60°W 30°W
30°W 0°
0° 30°E
30°E 60°E
60°E 90°E
90°E 120°E
120°E 150°E
150°E-1000
-1.8
-1.4
-1
-0.6
-0.2
0.2
0.6
1
1.4
1.8
1000
June 28 – 1 JulyECMWF Workshop on Assimilation of high
spectral resolution sounders in NWPSlide 21
Tackling this Challenge – Comparing with Similar Instruments
Mid Tropospheric TemperatureAIRS 221 (14 micron) AMSU-A 5
June 28 – 1 JulyECMWF Workshop on Assimilation of high
spectral resolution sounders in NWPSlide 22
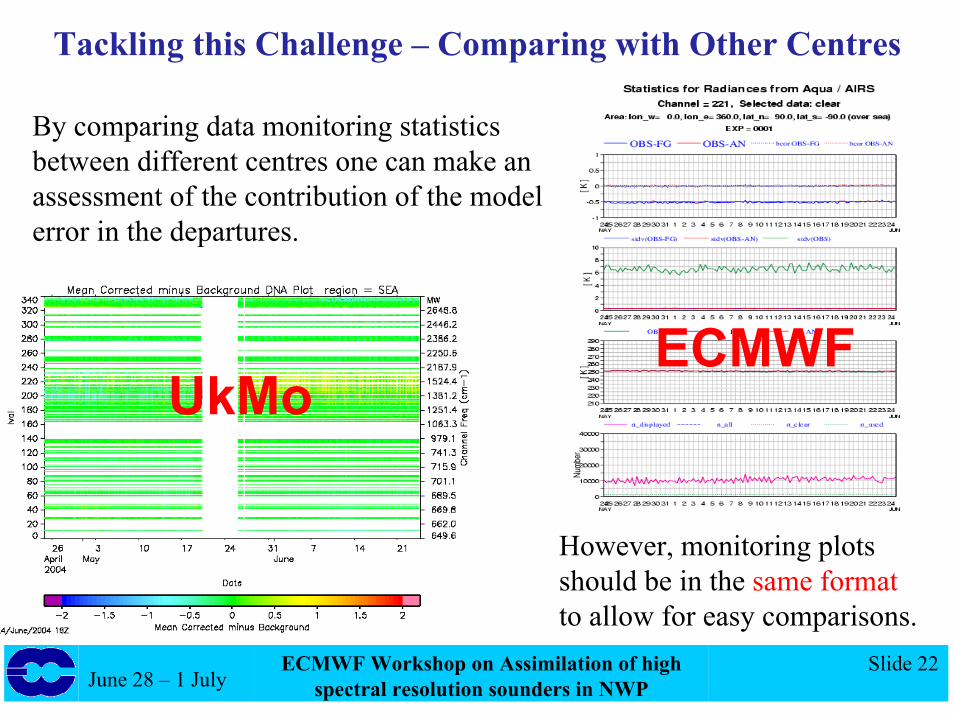
Tackling this Challenge – Comparing with Other Centres
UkMoECMWF
By comparing data monitoring statistics between different centres one can make an assessment of the contribution of the model error in the departures.
However, monitoring plots should be in the same formatto allow for easy comparisons.

June 28 – 1 JulyECMWF Workshop on Assimilation of high
spectral resolution sounders in NWPSlide 23
Overview
• Why is there a challenge?» Summary of satellite data usage at ECMWF» Importance of satellite data
• How is this challenge tackled?» Non-Real time monitoring» Some examples
• Future plans
June 28 – 1 JulyECMWF Workshop on Assimilation of high
spectral resolution sounders in NWPSlide 24
Future Plans – Automatic Alerts
More high-spectral resolution instruments are planned in the near future. As a result, thousands of more channels will be available for assimilation in NWP systems.
An automatic monitoring system will be essential to safeguard the quality of these data and to monitor the impact on the model.

June 28 – 1 JulyECMWF Workshop on Assimilation of high
spectral resolution sounders in NWPSlide 25
Future Plans – Automatic Alerts
Summary maps already provide semi-automatic alerts.
Large departure Sudden change in
standard deviation
June 28 – 1 JulyECMWF Workshop on Assimilation of high
spectral resolution sounders in NWPSlide 26
Future Plans – Automatic Alerts
JAN4 7 10 13 16 19 22 25 28 31
FEB3 6 9 12 15 18 21 24 27 1
MAR4 7 10 13 16 19 22 25
0
10000
20000
30000N
umbe
rn_displayed n_all n_clear n_used
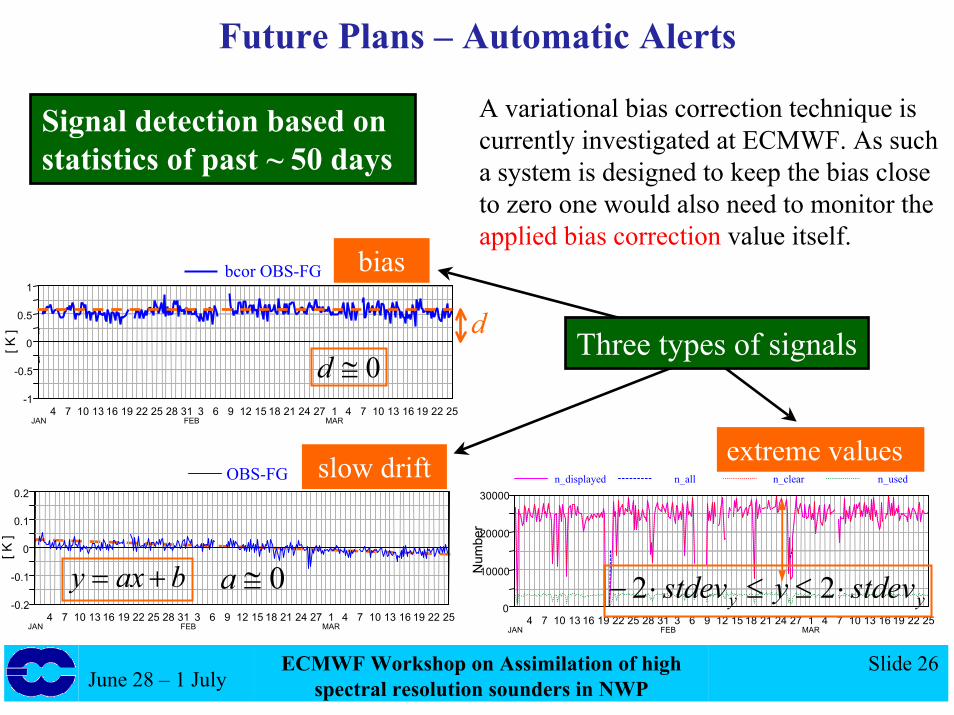
extreme values
yy stdevystdev ⋅≤≤⋅− 22
JAN4 7 10 13 16 19 22 25 28 31
FEB3 6 9 12 15 18 21 24 27 1
MAR4 7 10 13 16 19 22 25
-1
-0.5
0
0.5
1
[ K ]
bcor OBS-FG bias
d0≅d
JAN4 7 10 13 16 19 22 25 28 31
FEB3 6 9 12 15 18 21 24 27 1
MAR4 7 10 13 16 19 22 25
-0.2
-0.1
0
0.1
0.2
[ K ]
OBS-FG slow drift
baxy += 0≅a
A variational bias correction technique is currently investigated at ECMWF. As such a system is designed to keep the bias close to zero one would also need to monitor the applied bias correction value itself.
Three types of signals
Signal detection based on statistics of past ~ 50 days