CENTRE FOR ECONOMIC RESEARCH
WORKING PAPER SERIES
2005
You Take the High Road and I’ll Take the Low Road: Economic Success and Wellbeing in the Longer Run
Cormac Ó Gráda, University College Dublin
WP05/10
June 2005
DEPARTMENT OF ECONOMICS UNIVERSITY COLLEGE DUBLIN
BELFIELD DUBLIN 4

You Take the High Road and I’ll Take the Low Road:
Economic Success and Wellbeing in the Longer Run1
Cormac Ó Gráda (email: [email protected])
Since the outset economics has been concerned with what Adam
Smith called the ‘wealth of nations’ – although today we differentiate more
clearly between ‘wealth’ and ‘income’ than Smith did. Economic historians
in turn seek to explain differences and changes over time in the ‘income of
nations’. Explanations are plentiful, and there are many ways too of
measuring the differences and changes. Although GDP per head remains
the most popular measure and the one with the widest geographical and
chronological reach, anthropometric measures such as body mass index,
mean adult height, and birth weight, and survey data on life satisfaction
offer alternative perspectives on wellbeing (compare Easterlin 2003; Offer
2002; Fogel 2004: 36).2
The focus of this paper is not on explaining growth, but on the output
and welfare implications of the different routes from ‘there’ to ‘here’ taken by
two pairs of economies. The case studies concern [i] Ireland and Italy
during the second half of the twentieth century; and [ii] the United Provinces
of the Netherlands and Great Britain between the sixteenth and nineteenth
centuries. Both case studies concern alternative growth paths involving
initial divergence or ‘forging ahead’ by one country followed by the other
catching up. In effect, Italy and Britain describe the counterfactual paths
1

not taken by Ireland and the Netherlands, respectively. In the case of
Ireland and Italy, both economies set out at roughly the same point in terms
of productivity in mid-century. Between the 1950s and the 1980s Italy
forged ahead, only to be caught up by a late surge from Ireland in the
1990s. In the Anglo-Dutch case, it was the Netherlands that opened up a
lead during the Dutch Golden Age (c. 1580-1670) only to be tagged by
industrializing Britain more than a century later. The paper is about the
measurement and some welfare implications of the different paths travelled.
1.1. Ireland and Italy
1987 was the year of much-vaunted il sorpasso, when the aggregate
output of the Italian economy, albeit briefly, overtook that of Great Britain
(Maddison 2001: Tables C1-b and C1-c).3 For Ireland 1999, when GDP per
head overtook that of the United Kingdom, marked a similar defining
moment. In 1998 Irish GDP per head also overtook that of Italy. By the
mid-2000s Ireland was well ahead of the UK in terms of GDP per head and
even further ahead of Northern Ireland, traditionally the more developed
region of the island.
During the 1990s much was made of the dynamism of the Irish
economy, and outside observers focused on what the Celtic Tiger might
teach other economies about rapid growth. It seemed as if the Irish had just
unlocked the secret to fast, sustained economic growth. The celebratory
commentary on that era from far and near (e.g. Gray 1997), and the
eagerness elsewhere to learn from Ireland, might seem to imply that the
2
Celtic Tiger’s growth compensated for the earlier delay: the main thing is
that Ireland got there eventually. Ó Gráda and O’Rourke (2000) suggest
otherwise: they argue that Ireland’s route of under-achievement followed by
convergence and even overshooting exacted a heavy price in economic
welfare.
If a shift in economic policy was a precondition for the economic boom
that began in the late 1980s and made Ireland ‘Europe’s star-performing
economy’, by the same token earlier underperformance can be blamed
largely on policy failure. Inward-looking economic policies, including tariff
protection and restrictions on capital imports, were mainly responsible for
the stagnation of the 1950s. The opening up of the economy in the late
1950s yielded results in the following decade, but the gains were negated by
the disastrous policy response to the second oil crisis of the late 1970s.
That response sought to match the impact of the price shock through fiscal
expansion, with the result that public expenditure rose to levels that by the
early 1980s threatened national bankruptcy. There followed a period of
fiscal rectitude and high unemployment. The public debt/GDP ratio peaked
at 129% in 1986; in that same year the unemployment rate was 18%, and it
would remain above ten per cent for another decade.
Between 1987 and 2000 the economy grew at an annual rate of 7%,
faster than any other OECD economy. Even today Irish economic growth
continues to exceed the OECD and EU averages. This suggests that there is
more to the achievement of the Irish economy than ‘catch-up’ or belated
convergence. However, compensation for underperformance since mid-
century is a crucial part of the story. Two features of economic growth in
3

this period support this view. First, when adjusted for the effects of transfer
pricing, productivity growth in the 1990s was ‘within the range exhibited by
other countries and by Ireland itself in earlier periods’ (Honohan and Walsh
2002: 45-46). Second, when the spare capacity that had accumulated since
the early 1980s had been mopped up, the rate of economic growth slowed
down, although it still remained considerably above the EU average.
The course of the Irish economy since 1950 – initial under-
performance, mitigated by rapid advance from the late 1980s on – prompts
an analysis of the last half century or so of Irish economic history as a unit.4
Although dwarfing Ireland in terms of both population and output5, Italy
offers a useful comparative perspective, since both economies were
backward by west European standards in mid-century, with GDPs per head
barely half those of the United Kingdom, Sweden, or Denmark.6 Of course,
these two economies differed in obvious ways that conditioned their very
different trajectories. In geographic terms, Italy is located in the heart of
Europe while Ireland is on the periphery. At the outset Italy benefited from
generous doses of Marshall Aid and from the stimulus of European
economic integration. Ireland’s gains from European integration and foreign
largesse would come toward the end of the century, at a time when the
tyranny of distance mattered much less than in mid-century.
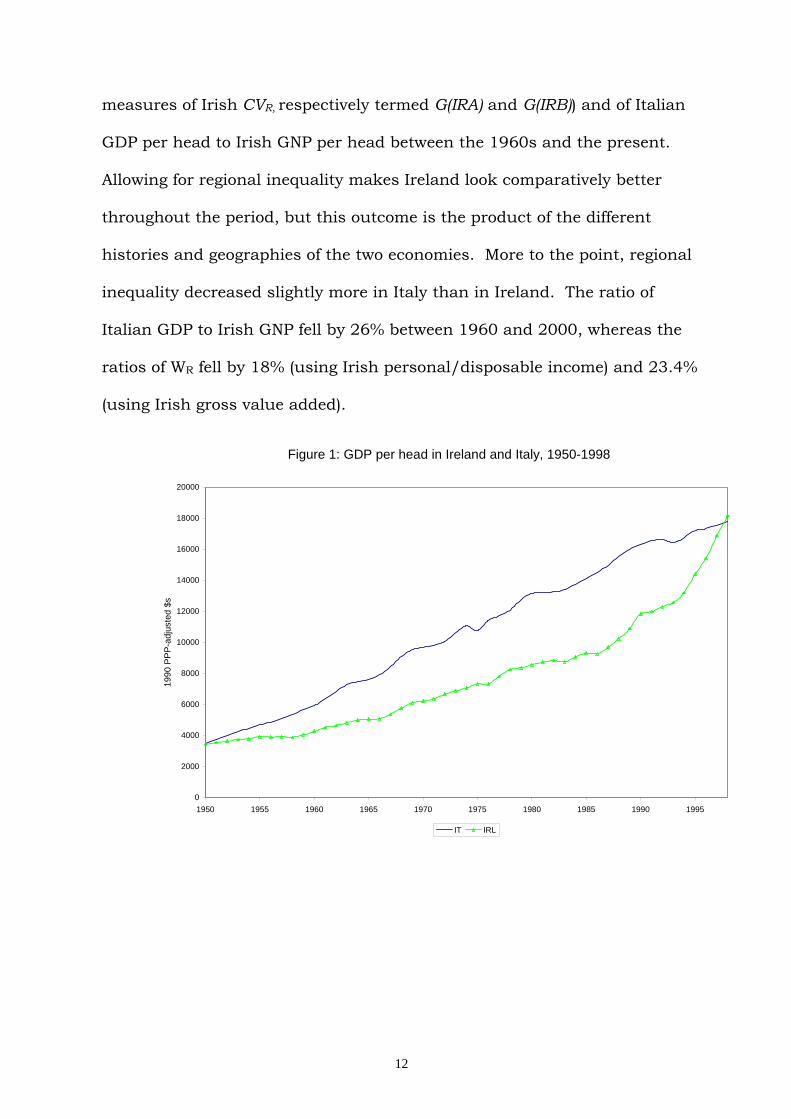
In the 1950s and 1960s real Irish GDP per head fell way behind
Italian; the gap narrowed thereafter, but it took the hectic growth of the
Celtic Tiger era to bridge it once more. The contrasting growth paths of the
two economies are described in Tables 1 and 2 and in Figures 1 and 2. In
Italy GDP per head grew steadily until near the end of the period, while the
4

rate of growth of population fell from 0.6% in the 1950s and 1960s to close
to zero today. In Ireland, the rate of GDP growth per head accelerated over
the half century, even during the years of gloom and doom in the 1980s.
Short-run movements in the two economies were poorly correlated: while
the 1950s are deemed Ireland’s ‘lost decade’, in Italy they were years of
‘economic miracle’, and while Italy was enjoying its ‘splendid eighties’,
Ireland was digging its way out of a deep economic crisis.7 Short-term
population movements differed too. While Italian population growth
decelerated over the half-century, Irish population growth was subject to
wide fluctuations. The half-century included two stretches of decline when
emigration was substantial and a time in the late 1960s and 1970s when
population grew by over one per cent annually.
Imagine for a moment that statistical artefact, the average citizen,
faced with the choice of either the Italian or Irish route to affluence in 1950.
The cumulative difference in income (which we take to be a proxy for
consumption) to 1998 – i.e. the value of the wedge in Figure 1 – is 42 times
Irish 1950 GDP per head or eight times 1998 GDP per head. Alternatively,
had Ireland followed the Italian road, Irish GDP per head would have been
forty per cent higher on average in the interim. Discounting forward at two
per cent gives ratios of 24 times Irish 1950 GDP per head and 4.6 times
1998 GDP per head, and discounting forward at three per cent gives ones of
19 and 3.6. Discounting or no discounting, the cost of slower growth in the
early phases was clearly ‘big’.
Whether discounting is appropriate here is rather a moot point.
Discounting is equivalent to treating all those who lived in the country for
5

part or whole of the period in question as if they were represented by a lone
individual with no thought for the next generation and with ‘no family or
friends interested in his (her) survival’ (Williamson 1984: 158). Whatever
about the validity of such an analogy for periods of a few decades, the
historical record usually refers to longer spells, necessarily involving
successive cohorts of individuals. In analysing the period 1600-1800, for
example, there is no reason why the average individual living in 1620-50
should be valued more than the average individual living in 1720-50. A
second reason for not discounting is time inconsistency: those same young
people who tend to heavily discount the future in retrospect regret what
seemed like careless over-spending (van den Berg 2002).
Pair-wise GDP comparisons are usually misleading when Ireland is
involved, since they ignore the significant (though now stabilising) gap
between Irish GDP and GNP, due to transfer pricing and the repatriation of
royalties and profits by foreign multinationals. In mid-century this gap was
insignificant but by the mid-1980s Irish GDP was only 90% of GNP, and
today it is only 85%. Thus while Irish GDP per head overtook Italian in
1997/8 – the gap between Irish GNP per head and Italian GDP per had was
not closed until 2001.8 Thus repeating the above calculation, but using
Italian GDP per head and Irish GNP per head between 1950 and 2000 (when
the latter overtook the former), yields a cumulative wedge one-fifth bigger
than that using both Italian and Irish GDP per head.
1.2. Demographic Considerations
6

So far our focus has been on measures of output per head. In
assessing economic performance account should also be taken of extensive
growth, i.e. allowance should be made for any major differences in the rates
of population growth. Economic historians tend to focus on measures of
intensive growth such as GDP per head or the real wage; but surely the
scale of extensive growth matters too. Throughout most of history,
maintaining living standards while population grew meant keeping the
Malthusian wolf away from the door.
In what follows, when comparing economic welfare and performance I
shall simply add the rate of population growth to that in GDP per head. An
Economy A in which GDP per head doubles over a given period while
population remains the same is deemed to perform as well as an Economy B
where GDP per head fails to grow but population doubles. In other words,
this means comparing growth rates in real GDP.
As Figure 2 shows, although the population growth rates in Ireland
and Italy over the period as a whole were similar, short-term trends were
very different. In the 1950s and 1960s, in particular, the gaps in rates of
population growth were considerable, with negative implications for Ireland’s
relative economic performance. The wedge between population-growth
augmented GDPs was nearly ten times 1998 Irish GDP per head (as opposed
to eight times when population is not taken into account).
In assessing the two growth paths, the influence of improvements in
life expectancy should also be factored in. In 1950 Irish males stood to live
1.4 years longer than their Italian peers, and Irish females 0.4 years longer.
Half a century later the gap was reversed, with Italian males expected to
7
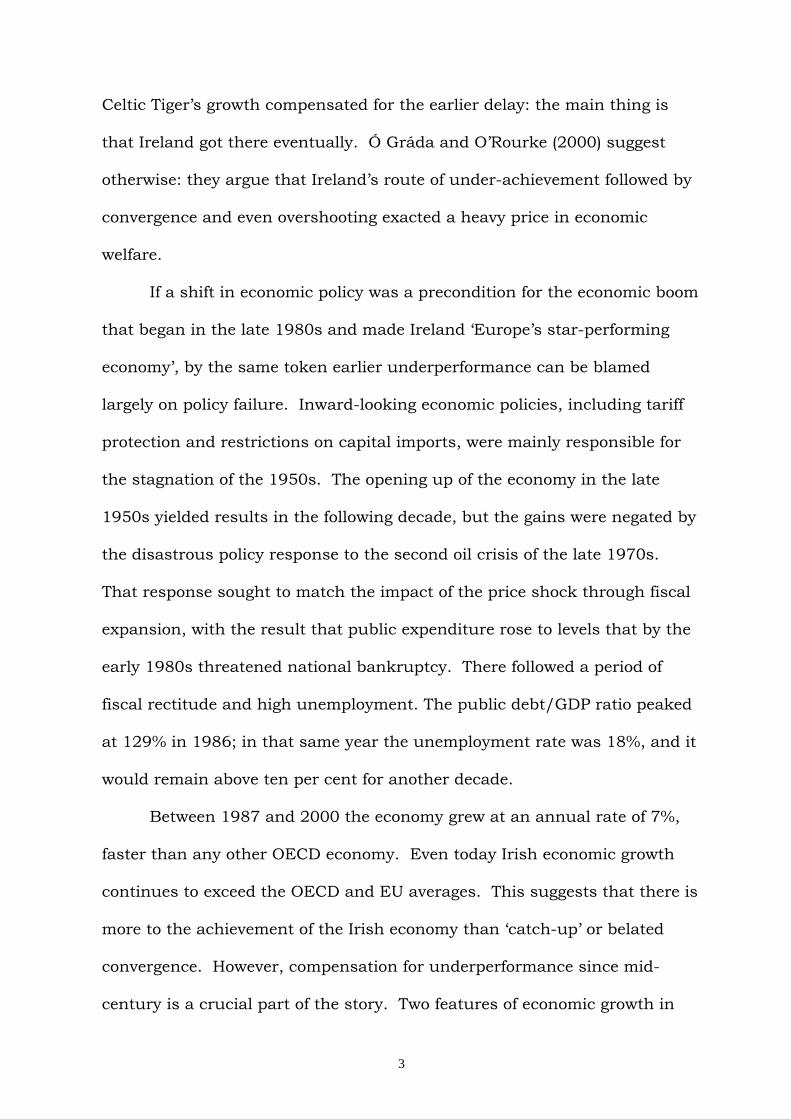
outlive Irishmen by 1.2 years, and Italian females to outlive Irishwomen by
1.9 years (see Figure 3). Thus allowing for differences in the changes in the
expectation of life at age zero, or e(0), between 1950 and 2000 would
marginally increase Italy’s advantage. The timing of the catch-up obviously
matters. Italian women overtook Irishwomen in the mid-1950s, while Italian
men overtook Irishmen a decade or so later. Here we work with the average.
In ‘British mortality and the value of life’, Jeff Williamson, building on
a classic paper by Dan Usher (1973), explained how to factor in increasing
life expectancy in assessments of the economic performance of
industrializing Britain. Usher’s widely used measure reduces to the
expression:
GĈ = GC + (1/β).GL
where GĈ represents growth rate of Ĉ, the ‘true’ standard of living after
taking the change in life expectancy into account, GC the growth rate of GDP
per head, β the elasticity of utility with respect to GDP per head, and GL the
change in life expectancy. In this simple model the role of β is pivotal; in his
study of Britain c. 1780-1930 Williamson worked with values of β = 0.25 to
0.45. An even simpler but serviceable way of dealing with the issue is that
proposed by Lichtenberg (2003).9 He defines expected individual lifetime
wellbeing (EILW) as YA.eA, where YA is average income and eA is expectation
of life at birth in Economy A. Relative EILW at a point in time then is
measured as: [YA.eA ]/[ YB.eB ]. This amounts to assuming that the marginal
utility from additions to Y and e is constant. In effect Lichtenberg’s measure
8

of ‘true’ change implies β = 1, so it yields a lower return on improved life
expectancy than the Usher-Williamson measure, which assumes β < 1.
For Ireland-Italy, I compare U = ΣYi.ēi , where Yi is GDP per head in
year i and ēi is life expectancy in year i relative to life expectancy in 1950.
Figure 4 combines the data that produced Figures 1 and 3; it describes the
gap between GDP per head (GAP) and GDP per head augmented by an index
of life expectancy (GAP*). For the purposes of Figure 4 the index is set at
unity in 1950. Adding up over the entire period, GAP* is 17.9% greater than
GAP. 10 Here I follow Williamson and others in assuming that the
improvements in life expectancy in this period were mainly due to
exogenous factors such as improvements in medical technology and public
health (Williamson 1984: 162-5). Taking into account demographic factors
just reinforces the point that the extra consumption that Italy gained by
being the early starter was considerable.
1.3. Did Inequality Matter?
In Ireland the affluence of the recent past has not brought a reduction
in income inequality. To what extent might differences in income inequality
trends in Ireland and Italy affect the above comparisons? International
comparisons of income distribution are a minefield (Atkinson and Brandolini
2001). Broadly comparable Irish and Italian data are available from the
early 1970s on, however (Nolan and Smeeding 2004; Brandolini 2004).11
Table 3 compares household level data from 1973 to 2000. It suggests that
9

income inequality in Italy was considerably greater in the 1970s than in
Ireland, but that the gap closed quickly thereafter, and that by turn of the
century inequality in Ireland was marginally greater.12
These data can be used to estimate an abbreviated social welfare
index for each economy over the 1973-2000 period. The social welfare index
defined as WS = µ(1-G), where µ is mean income and G the Gini coefficient
(Sen 1976).13 The ratios of resultant WS, and of Italian GDP per head to
Irish GNP per head, are plotted in Figure 5. They imply that Italy lost less
ground to Ireland in ‘social welfare’ terms (as captured by WS) than in
income terms between 1973 and 2000. It bears noting, however, that both
Ireland and Italy were characterised by high income inequality relative to
other Western European countries throughout this period (e.g. Nolan and
Smeeding 2004).
Table 1. Ireland vs. Italy 1950-1998
IRELAND ITALY Year GDP per head
(1990 intl $) Population (1,000s)
GDP per head (1990 intl $)
Population (1,000s)
1950 3,446 2,969 3,502 47,105 1973 6,867 3,073 10,643 54,751 1990 11,825 3,506 16,320 56,719 1998 18,183 3,705 17,759 57,592
Source: Maddison (2001: Tables A1-a, AI-c); Eurostat
Table 2. GDP per head and population: Italy and Ireland (annual growth rates)
GDP per head Population GDP Period Italy Ireland Italy Ireland Italy Ireland 1950-9 4.8 1.6 0.6 -0.4 5.4 1.2 1960-9 4.8 3.5 0.6 0.3 5.4 3.8 1970-9 2.7 3.0 0.5 1.3 3.2 4.3 1980-9 2.0 2.4 0.0 0.3 2.0 2.7
10

1990-8 0.9 4.8 0.2 0.6 1.1 5.4 1950-98 3.4 3.5 0.4 0.5 3.7 3.9
Table 3. Gini Index for Ireland and Italy, 1973-2000 Year Italy Ireland 1973 42 36.7 1980 37 36.0 1987 34.4 35.2 1994/5 36.3 36.2 2000 36.0 37.5
Source: see text.
Trends in the regional variation of incomes are also worth considering.
In Italy the gap between richer and poorer regions was greater throughout
than in Ireland. The long-standing backwardness of the Mezzogiorno is an
important factor here.14 In both economies there is evidence of considerable
convergence between provinces or regions during the 1960s and 1970s, and
of marking time in the 1980s and 1990s. In Italy the coefficient of variation
of regional GDP per head across Italy’s twenty provinces fell from 0.35 in the
early 1960s to 0.27 in the late 1970s, but it was still 0.25 at the turn of the
century.15 Data are available on gross value added per head in Irish regions
since 1973, and on personal income or disposable income per head since
1960.16 Throughout, not surprisingly, the regional variation in disposable
income was less than that in value added.
Let us define a pseudo-abbreviated social welfare function WR = µ(1-
CVR), where µ is mean income/output per head and CVR the coefficient of
variation of regional income/output per head. Figure 6 describes the two
ratios of Italian to Irish WR (using both disposable income and value added
11
measures of Irish CVR, respectively termed G(IRA) and G(IRB)) and of Italian
GDP per head to Irish GNP per head between the 1960s and the present.
Allowing for regional inequality makes Ireland look comparatively better
throughout the period, but this outcome is the product of the different
histories and geographies of the two economies. More to the point, regional
inequality decreased slightly more in Italy than in Ireland. The ratio of
Italian GDP to Irish GNP fell by 26% between 1960 and 2000, whereas the
ratios of WR fell by 18% (using Irish personal/disposable income) and 23.4%
(using Irish gross value added).
Figure 1: GDP per head in Ireland and Italy, 1950-1998
0
2000
4000
6000
8000
10000
12000
14000
16000
18000
20000
1950 1955 1960 1965 1970 1975 1980 1985 1990 1995
1990
PPP
-adj
uste
d $s
IT IRL
12

Figure 2. Population in Ireland and Italy, 1950-1998
90
95
100
105
110
115
120
125
130
1950 1955 1960 1965 1970 1975 1980 1985 1990 1995
1950
=100
ITPOP IRPOP
Figure 3. e(0) in Italy and Ireland, 1950-2000
83
81
79
77
631
65
67
69
71
73
75ars
950 1955 1960 1965 1970 1975 1980 1985
IRL(f)IRL(m)IT(f)IT(m)
ye
1990 1995 2000
13

Table 4. THE GAP BETWEEN IRISH AND ITALIAN GDP, 1950-1998
0
1000
2000
3000
4000
5000
6000
7000
1950 1955 1960 1965 1970 1975 1980 1985 1990 1995
1990
Intl
$
GAP GAP*
Note: for the derivation of GAP* see text.
Figure 5. Relative Output and 'Social Welfare', Ireland and Italy 1973-2000
0.9
1
1.1
1.2
1.3
1.4
1.5
1.6
1.7
1.8
1.9
1973 1978 1983 1988 1993 1998
GDP(IT)/GND(IRL) SWF(IT)/SWF(IRL)
14

Figure 6. Relative Y and G: Italy and Ireland, 1960-2000
0.8
0.9
1
1.1
1.2
1.3
1.4
1.5
1.6
1.7
1.8
1960 1965 1970 1975 1980 1985 1990 1995 2000
Y(IT)/Y(IRL) G(IT)/G(IRA) G(IT)/G(IRB)
2.1. The Dutch Republic and Great Britain
For much of the seventeenth century the most significant commercial
and military rivalry in Europe was that between Great Britain and the Dutch
Republic. The rivalry resulted in a series of vicious, mainly naval wars
between 1652 and 1684. Although in the long run Britain’s beggar-my-
neighbour commercial policies prevailed over the Dutch, for decades
travellers to Holland and those who formed British public opinion marvelled
at Dutch ingenuity and success. A well-informed contemporary, Sir William
Temple, noted that the Dutch Republic’s ‘prodigious growth in Riches,
Beauty, extent of Commerce, and number of Inhabitants’ had made it ‘the
Envy of Some, the fear of others, and the Wonder of all their Neighbours’
15

(Temple 1673: Preface). Political arithmetician Gregory King’s national
accounts imply that by the end of the Golden Age the Dutch Republic was
the richest economy in Europe (de Vries 1974: 242-3). The population of
Amsterdam, a city of thirty thousand souls in 1550, surged to 175,000 by
1650, making it the fourth city in Europe by the latter date (after London,
Paris, and Naples) (de Vries 1984: 271). Historians such as Simon Schama
and Jonathan Israel have celebrated Dutch ‘precocity’ and ‘primacy in world
trade’ during the Golden Age (c. 1580-1670) (Schama 1987; Israel 1989).
The ability of a small nation − the Netherlands contained only 1.5 million
people in 1600, compared to Britain’s six million and France’s 18.5 million −
to thrive on a thin natural resource base was the envy of its rivals.
Three decades ago Jan de Vries described the economy of the Golden
Age era as ‘high-level traditionalist’, which by the eighteenth century had
sunk ‘into a complacent stagnation’. Jan Luiten Van Zanden supports this
assessment; he recently dubbed the growth of the Golden Age era ‘pre-
modern’ because it failed to generate significant gains in living standards
and could not sustain itself in the long run. Others, however, have stressed
Dutch breakthroughs in the realms of agriculture, financial institutions,
shipping, and public finance. More recently, de Vries and Ad van der
Woude have described the early modern Dutch economy as the first to
experience ‘modern economic growth’ (de Vries 1976: 251, 252; Soltow and
van Zanden 1998: 31; de Vries and van der Woude 1997; see too Goldstone
2002).
Either way, for all its earlier successes the Dutch economy was widely
deemed a failure by the early nineteenth century. Joel Mokyr in his
16
pioneering comparative study of the Low Countries offers an overview of ‘the
non-event of [Dutch] economic stagnation’ in the early nineteenth century
(1976: 84). Some historians link Dutch ‘failure’ relative to industrialising
Britain or, indeed, to Belgium to its own earlier success. They blame the
institutional sclerosis of a high wage economy encumbered by a generous
social welfare regime, unable to cope with competition from poorer
latecomers, especially Belgium and Great Britain (de Vries 1973; Mokyr
1976; de Vries and van der Woude 1997; van Zanden 2002a, 2002b; van
Zanden and van Riel 2004). The historiography of the post-Golden Age
economy is sombre in tone. And according to Angus Maddison’s national
account estimates (on which more below) Dutch GDP rose only by 7%
between 1700 and 1820, while Belgium’s doubled and the United Kingdom’s
more than trebled. Over the same period, Dutch GDP per head fell.
In the late seventeenth century Gregory King reckoned that Dutch
national income exceeded that of England by ten to fifteen per cent. This gap
is much less than that allowed by Angus Maddison, who implies that for
over three centuries the Dutch enjoyed higher GDP per head than anywhere
else, and that in 1700 Dutch GDP per head was 1.7 times the United
Kingdom level (de Vries 1974: 242-3; Maddison 2000: Table B-21).
Maddison’s data imply that the Dutch and British economies had roughly
the same GDP per head c. 1500. Then the Netherlands forged ahead of its
great rival, only to lose ground from the late seventeenth-century on, and to
be overtaken c. 1800. This, and the sense that the Netherlands paid a price
for being an ‘early starter’, suggests the case for taking a longer perspective
17
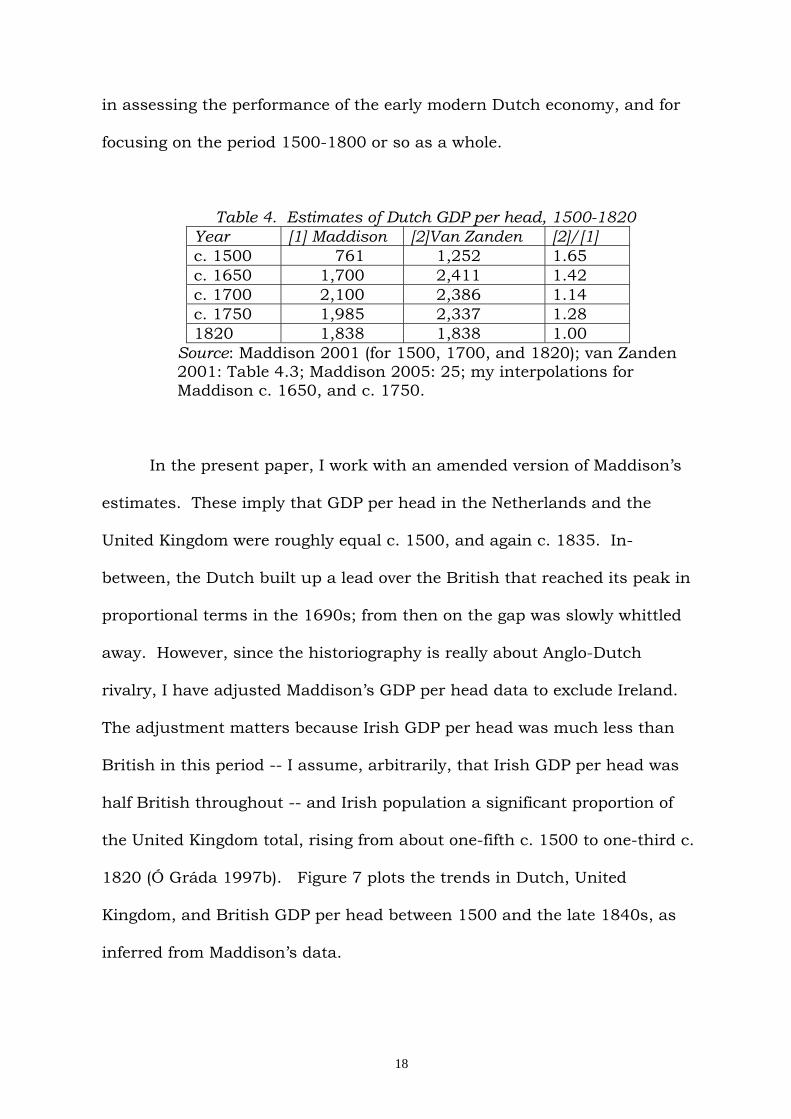
in assessing the performance of the early modern Dutch economy, and for
focusing on the period 1500-1800 or so as a whole.
Table 4. Estimates of Dutch GDP per head, 1500-1820 Year [1] Maddison [2]Van Zanden [2]/[1] c. 1500 761 1,252 1.65 c. 1650 1,700 2,411 1.42 c. 1700 2,100 2,386 1.14 c. 1750 1,985 2,337 1.28 1820 1,838 1,838 1.00
Source: Maddison 2001 (for 1500, 1700, and 1820); van Zanden 2001: Table 4.3; Maddison 2005: 25; my interpolations for Maddison c. 1650, and c. 1750.
In the present paper, I work with an amended version of Maddison’s
estimates. These imply that GDP per head in the Netherlands and the
United Kingdom were roughly equal c. 1500, and again c. 1835. In-
between, the Dutch built up a lead over the British that reached its peak in
proportional terms in the 1690s; from then on the gap was slowly whittled
away. However, since the historiography is really about Anglo-Dutch
rivalry, I have adjusted Maddison’s GDP per head data to exclude Ireland.
The adjustment matters because Irish GDP per head was much less than
British in this period -- I assume, arbitrarily, that Irish GDP per head was
half British throughout -- and Irish population a significant proportion of
the United Kingdom total, rising from about one-fifth c. 1500 to one-third c.
1820 (Ó Gráda 1997b). Figure 7 plots the trends in Dutch, United
Kingdom, and British GDP per head between 1500 and the late 1840s, as
inferred from Maddison’s data.
18

Jan Luiten van Zanden’s reconstructions of Dutch GDP imply a very
different trajectory before c. 1820. Whereas Maddison’s numbers imply only
a small Dutch advantage over the United Kingdom c. 1500, van Zanden’s
imply a Dutch advantage of nearly three-fifths. And while Maddison
reckons that real GDP per head in the Netherlands rose by 140% between
1500 and 1820, van Zanden’s best guess is that the rise was about one-
third that (Maddison 2001 Table B-21; van Zanden 2001; compare Federico
2002). The contrasting Maddison and van Zanden trajectories are
summarized in Table 4. Meanwhile Jan de Vries and Ad van der Woude
(1997: 709-710) refuse to ‘venture an estimate’ of the growth rate of the
Dutch economy before the 1660s, but nonetheless they are confident that
income per capita rose, pointing to significant productivity increases in
agriculture, services, and shipping, the big rise in energy consumption in
the previous two centuries or so. It is enough to point out here that if Van
Zanden’s estimate for 1500 is correct, then the Anglo-Dutch gap would have
opened up earlier and all the following calculations will be underestimates of
the gap.
By Maddison’s reckoning Dutch GDP per head overtook British GDP
per head in the mid-1510s and maintained its edge until mid-1790s. How
much was the extra Dutch output worth? Between 1514/5 and 1794/5 the
average gap was one-fifth of Dutch GDP per head. Alternatively, adding
together the annual gaps yields a wedge equivalent to 52 times 1795 GDP
per head! It would take a long time before faster British growth ‘recouped’
the accumulated Dutch advantage. By 1850 only about 12% of the
accumulated gap in annual GDPs per head had been ‘recouped’. Six
19

decades or so later, only three-fifths of the gap had been made up. Since
Britain’s population grew faster than Dutch over the period, allowing for
differences in population growth attenuates the Dutch advantage somewhat,
to 39 times 1795 GDP per head. In Figure 8, the nl(*) schedule tracks
Dutch GNP per head, weighted by an index that sets Dutch population
relative to British in 1500 at unity. Here the British subsequently ‘recoup’
more quickly, by 1858.
Figure 7. Economic Growth in NL, GB, and UK 1500-1910
500
1000
1500
2000
2500
3000
3500
4000
4500
5000
5500
1500 1550 1600 1650 1700 1750 1800 1850 1900
1990
intl
$ pe
r hea
d
nl gb nl(*) uk
Source: see text
Table 5. Population and GDP per head, the Netherlands, France and Great Britain Population (1,000) GDP per head (1990 international $) Year NL GB FR NL GB FR
20

1500 950 3,142 15,000 754 795 727 1600 1,500 5,700 18,500 1,368 1,060 841 1700 1,900 6,640 21,471 2,110 1,408 986 1820 2,355 14,139 31,246 1,821 2,048 1,230
Source: NL and FR are taken from Maddison 2001, Tables B-10 and B-21. For GB see text.
2.2. Allowing for urbanisation.
The Dutch economy’s precocity was founded on the productivity of its
agriculture and the strength of its commercial sector and its cities, but as
Wrigley et al. (1997: 204) warn, ‘the severity of the urban penalty should not
be underestimated’. Figure 8 describes urbanisation rates (where ‘urban’
includes towns and cities of ten thousand or more) in the Netherlands,
Great Britain, and France c. 1500-1900. Dutch urbanisation rates,
unparalleled in early modern Europe, imposed a toll in terms of morbidity
and life expectancy. Although it remains unclear whether the nutritional
status of urban populations generally was inferior to that of their rural
cousins, we know for sure that they suffered from congestion, poor
sanitation, adulterated food, and endemic diseases (Riley 2001: 161-3).
Urbanites everywhere were also smaller in stature. Many rich citizens,
aware of the increased mortality risk, left the cities for their rural retreats
during the summer. The poor did not have that choice.
In 1673 England’s former ambassador at the Hague, Sir William
Temple, described the Dutch ‘as generally not so long-liv’d as in better Airs;
and begin to decay early, both men and women, especially in Amsterdam’.
Temple singled out ‘Diseases of the Climate [which] all hot and dry
21
Summers bring…that are infectious among them, especially into Amsterdam
and Leyden’ (Temple 1673: 161). Alas, in demographic terms, the pre-1800
Netherlands remains somewhat of a ‘statistical dark age’. How Amsterdam
achieved its remarkable population growth in the century or so after 1580
remains somewhat of a mystery. The high proportions of widowed
household heads in Dutch towns and cities and the Dutch obsession with
cleanliness in the Golden Age era are consistent with the presumption that
mortality was high in a congested, damp environment (van Strien 1993:
212-3, 231n95; van de Woude 1972: 311-13; Schama 1987: 375-84).17
However, hard evidence on immigration, on mortality, and the main causes
of death are lacking. Their absence has prompted some ‘controlled
conjectures’ (de Vries 1985: 664; van der Woude 1983: 197-209; de Vries
and van der Woude 1997; van Leeuwen and Oeppen 1997).
An important contribution by George Alter reports life expectancies at
birth of 25.3 years for the lives of nominees in the Amsterdam life annuities
of 1586-90 and 30.0 years for those of 1672-74 (Alter 1983: 33). The
disappearance of plague was the main cause of the improvement between
the two dates.18 Plainly, the social rank of the annuitants and their
residence in Amsterdam are factors: these were prosperous people living in a
port city. Although some claim that because infectious disease did not
discriminate between rich and poor, mortality differed less by class in early
modern Europe than later,19 evidence cited below suggests that Alter’s
estimates should be taken very much as an upper bound of life expectancy
in the Netherlands at the time. The low life expectancies yielded by the
trickle of evidence from local studies are corroborative. Dirk Noordam, for
22

instance, reports a strikingly low life expectancy of 26.5 years in the
Maasland region (south Netherlands) in 1730-59, while Richard Paping
found life expectancies of just over thirty years in five Catholic populations
living in the northern clay lands around Groningen in 1731-70 (Noordam
1986; Paping 1988).
The paucity of Dutch data means that the evidence from urban
communities in neighbouring countries is also worth considering. Data
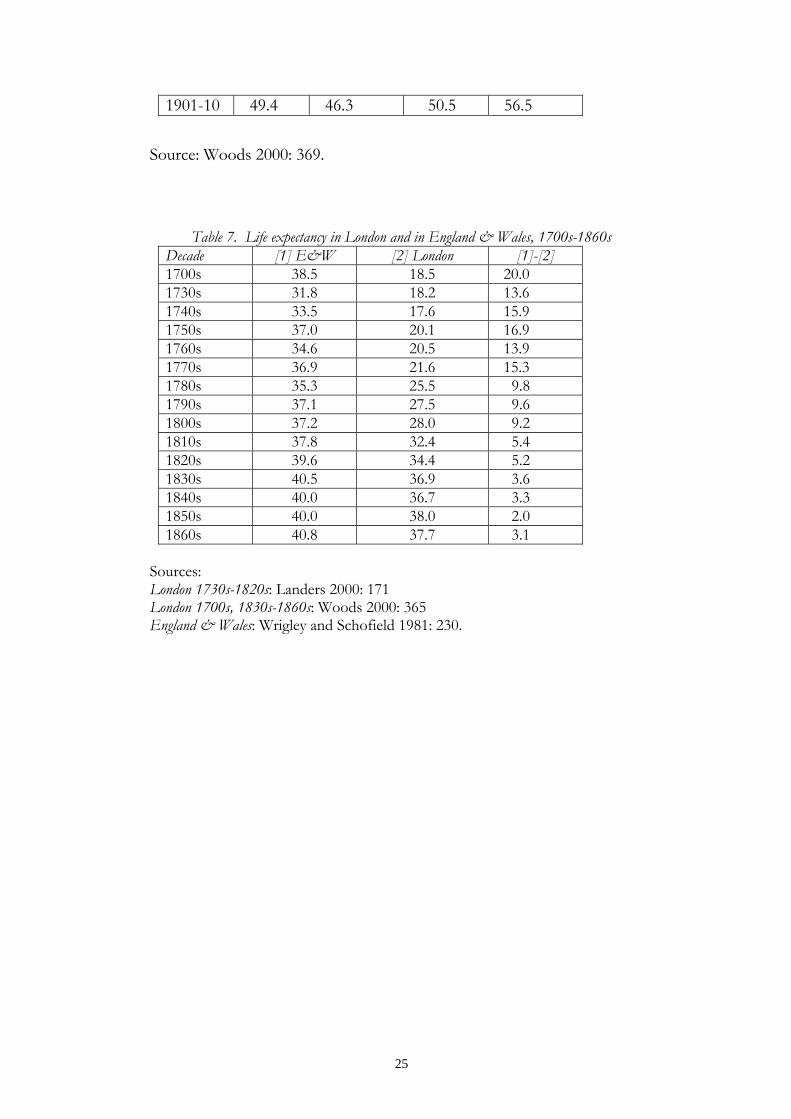
from England, reported in Tables 6 and 7 below, imply that the urban
penalty in terms of life expectancy must have been substantial before 1800
(Woods 2001; see too Szreter and Mooney 1998). The shifting rural
premium in London is of particular interest. Table 7 implies a huge gap
between the average life span in London and in England as a whole in the
early eighteenth century.20 Thereafter the gap dwindled almost without
interruption (though at an accelerating rate towards the end of the
nineteenth century).
Presumably social class affected mortality too. It is also interesting to
compare life expectancy of Londoners in general with that of London
Quakers, a largely middle-class group. The average Quaker might expect to
live 28.8 years in 1650-99, 24 years in 1700-49, 29.8 years in 1750-99, and
35.5 years in 1800-49 (Landers 1993: 158). This implies a gap of 6-7 years
between the Quakers and the population of London as a whole in the
eighteenth century, although London Quakers still died younger than rural
Englishmen and Englishwomen. Alfred Perrenoud’s findings for
seventeenth-century Geneva reveal just as steep a class gradient as in
23

London. In 1650-84, the life expectancy of Genevan workers, male and
female together, was 20.5 years; that of the middle class was 26.0 years,
and that of the elite 36.8 years (cited in de Vries 1984: 184; see Perrenoud
1975).21 In the light of such data, Alter’s estimates for Amsterdam
annuitants’ middle-class nominees entail very short lives indeed for the
inhabitants of Amsterdam. A six-year gap between the middle-class and the
population as a whole would indicate life expectancies in the cities of less
than twenty years in the 1580s and 23-25 years in the 1670s.
Given the high rate of Dutch urbanization at a time when the urban
mortality disadvantage was very striking indeed, it is surely not farfetched to
assume that urbanization reduced the average lifespan in the Netherlands
by an average of three years below British levels during the longue durée
analyzed here. In Table 8 I report the implications of factoring in the value
of life for β = 0.45 and β = 1. Even β = 1 reduces the cumulative gains built
up between 1515 and 1795 considerably; assuming β = 0.45 erodes all the
Dutch advantage, once differential population growth is also allowed for.
Table 6. e(0) in England and Wales
Decade London Large towns Small towns Rural
1751-60 20.1 --- 27.5 41.3 1801-10 35.0 32.0 34.2 42.2 1821-30 36.9 32.7 36.2 43.3 1841-50 36.7 32.0 36.0 43.5 1861-70 37.7 33.0 38.0 46.5 1881-80 42.6 39.0 44.0 51.0
24
1901-10 49.4 46.3 50.5 56.5
Source: Woods 2000: 369.
Table 7. Life expectancy in London and in England & Wales, 1700s-1860s Decade [1] E&W [2] London [1]-[2] 1700s 38.5 18.5 20.0 1730s 31.8 18.2 13.6 1740s 33.5 17.6 15.9 1750s 37.0 20.1 16.9 1760s 34.6 20.5 13.9 1770s 36.9 21.6 15.3 1780s 35.3 25.5 9.8 1790s 37.1 27.5 9.6 1800s 37.2 28.0 9.2 1810s 37.8 32.4 5.4 1820s 39.6 34.4 5.2 1830s 40.5 36.9 3.6 1840s 40.0 36.7 3.3 1850s 40.0 38.0 2.0 1860s 40.8 37.7 3.1
Sources: London 1730s-1820s: Landers 2000: 171 London 1700s, 1830s-1860s: Woods 2000: 365 England & Wales: Wrigley and Schofield 1981: 230.
25
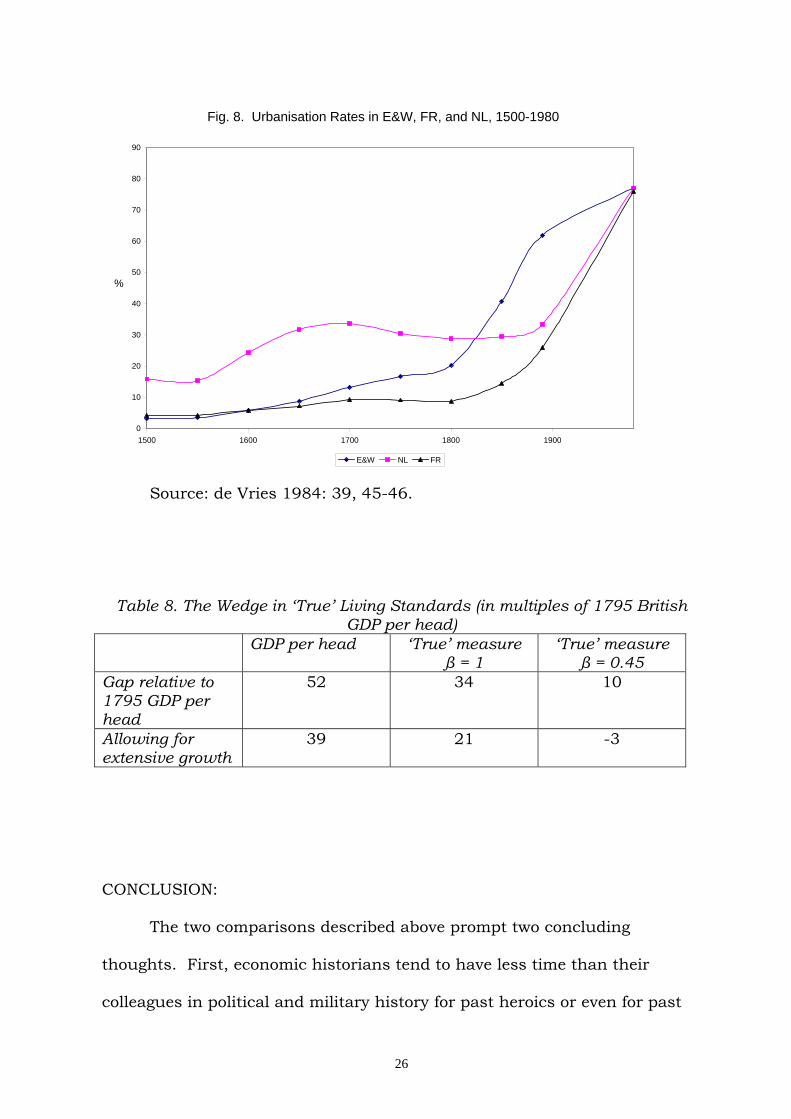
Fig. 8. Urbanisation Rates in E&W, FR, and NL, 1500-1980
90
80
70
60
50%
40
30
20
10
01500 1600 1700 1800 1900
FRNLE&W Source: de Vries 1984: 39, 45-46.
Table 8. The Wedge in ‘True’ Living Standards (in multiples of 1795 British GDP per head)
GDP per head ‘True’ measure β = 1
‘True’ measure β = 0.45
Gap relative to 1795 GDP per head
52 34 10
Allowing for extensive growth
39 21 -3
CONCLUSION:
The two comparisons described above prompt two concluding
thoughts. First, economic historians tend to have less time than their
colleagues in political and military history for past heroics or even for past
26
genius. They are used to their entrepreneurs being replaceable, to social
savings being ‘small’, and to economic growth during the Industrial
Revolution being ‘modest’. Their answers to ‘how big is big?’ are conditioned
by a belief in Harberger triangles and a confidence that inputs, both animate
and inanimate, are highly substitutable. Against such a historiographical
tradition, the ‘savings’ or ‘costs’ of the alternative routes described in this
paper are very significant. When the Irish route to the present is evaluated
against the Italian, the cost of policy ‘failures’ in the 1950s and 1970s was
indeed ‘big’22; just as the benefits of Dutch economic precociousness in the
sixteenth and seventeenth centuries, even when set against later
retardation, were considerable.
Second, the very present-centred focus on the Irish economy in the
late 1990s and early 2000s has led many observers to believe that the Irish
had somehow discovered secrets to rapid economic growth which were
readily transferable elsewhere. Yet much of the post-1987 growth was of the
catch-up kind, compensation for decades of underperformance. As for
Dutch retardation in the late eighteenth and early nineteenth centuries, it
was a case of mutatis mutandis. This study is thus also a plea for a more
historical perspective.
27

APPENDIX 1. DUTCH AND ENGLISH WAGES
In the debate about incomes in the early modern Netherlands and
Britain, wage data only muddy the waters further. Recent estimates by Bob
Allen (2001), shown in Figure A1, suggest that building labourers (BL) and
building craftsmen (BC) in London (L, representing England) were better
paid than their counterparts in Amsterdam (A, representing the
Netherlands) in the first half of the sixteenth century, but that they lost
their lead thereafter and did not regain it for a century or more. Allen’s data
also suggest that real wages in Amsterdam were about one-fifth higher in
1750-99 than they had been in 1550-49, while in London they were about
the same in both periods. Meticulous research by John Munro (2001), from
which Table A1 below is taken, corroborates Allen’s findings for the early
sixteenth century. It reveals that wage earners in England c. 1500 had the
edge over wage earners in the Antwerp region – generally conceded to be as
economically advanced as Holland at this time – but that they lost it during
the following few decades. Such data are not so readily squared with van
Zanden’s claim that Dutch GDP per head was 1.58 times British c. 1500,
nor with the assertion that ‘real wages declined a lot between 1500 and
1800’ (van Zanden 2001; 2002: 154); but they are not so easily reconciled
either with the almost three-fold rise in GDP per head indicated by
Maddison over the same period. Van Zanden concedes that English GDP
per head in 1650 was unlikely to be ‘only about half the Dutch level’ (2001:
78-9).
28

Fig. A1. REAL WAGES IN AMSTERDAM AND LONDON, 1500/49-1850/99
20
18
16
14
0
2
4
6
8
10
12aReal W
1500 1550 1600 1650 1700
ge
BL(L)BL(A)BC(L)BC(A)
1750 1800 1850
Source: Allen 2001
Table A1. Wages in Southern England and Belgium c. 1500-1540
Item (Quantity per daily wage)
England 1501-05 Antwerp 1501-05 Ratio (England/Antwerp)
Wine (litres) 3.47 2.92 1.19 Herrings (no.) 43.32 48.45 0.89 Peas (litres) 40.27 19.70 2.05 Wheat (litres) 22.25 19.84 1.12 Sugar (kilos) 0.94 1.02 0.92 Item (Quantity per daily wage)
England 1536-40 Antwerp 1536-40 Ratio (England/Antwerp)
Wine (litres) 2.64 3.49 0.76 Herrings (no.) 38.17 45.48 0.84 Peas (litres) 30.50 21.38 1.43 Wheat (litres) 21.90 17.15 1.28 Sugar (kilos) 0.39 0.74 0.52
Source: Munro (2001: Table 16)
29

REFERENCES: Allen, R.C. 2001. 'The Great Divergence in European Wages and Prices from the Middle Ages to the First World War', Explorations in Economic History, 38.. Alter, George. 1983. ‘Plague and the Amsterdam annuitant: a new look at life annuities as a source for historical demography’, Population Studies, 37(1): 23-41. Atkinson, A.B. and Andrea Brandolini. 2001. ‘Promises and pitfalls in the use of ‘secondary’ datasets: income inequality in OECD countries as a case study’. Journal of Economic Literature. XXXIX(3): 771-799. Barca. Fabrizio. 2001. ‘New Trends and the Policy Shift in the Italian Mezzogiorno’. Daedalus, 130(2): 93–113. Brandolini, Andrea. 1999. ‘The distribution of personal income in post-war Italy: source description, data quality and the time pattern of income inequality’, Banca d’Italia Discussion Paper No. 350. http://www.bancaditalia.it/ricerca/consultazioni/temidi/td99/tema_350_99.pdf Brandolini, Andrea. 2004. ‘Income inequality and poverty in Italy: a statistical compendium’, unpublished. Becker, Gary S., Thomas J. Philipson, and Rodrigo R. Soares. 2003. ‘The quality and quantity of life and the evolution of world inequality’. NBER Working Paper No. 9765, June. Boyle, J.G., T. McCarthy and J. Walsh. 1999. ‘Regional income differentials and the issue of regional equalisation in Ireland’. Journal of the Statistical and Social Inquiry Society of Ireland. 28(I): 157-96. De Long, Brad and Shleifer, Andrei. 1993. ‘Princes and merchants: European city growth before the Industrial Revolution’. Journal of Law and Economics. 36:671-702. De Vries, Jan. 1973. The Dutch Rural Economy in the Golden Age, New Haven: Yale University Press. De Vries, Jan. 1984. European Urbanization 1500-1850. London: Methuen. De Vries, Jan. 1985. ‘The population and economy of the preindustrial Netherlands’, Journal of Interdisciplinary History, 15(4): 661-82. De Vries, Jan and Ad van der Woude. 1997. The First Modern Economy: Success, Failure, and Perseverance of the Dutch Economy, Cambridge: Cambridge University Press. G. Di Vaio, G. 2004. ‘Economic changes and public policies in the Mezzogiorno during the 1990s: an assessment’, Economia Società e Istituzioni, Vol. XVI, No. 1, April: 77-115.
30

Drukker, J.W. and V. Tassenaar. 1997. ‘Paradoxes of modernisation and material wellbeing in the Netherlands during the 19th century’. In R.H. Steckel and R. Floud (eds.), Health and Welfare during Industrialisation. Chicago: University of Chicago Press, pp. 331-379. Easterlin, Richard A.: 2003. ‘Explaining happiness’. Proceedings of the National Academy of Sciences, 100(19), (September 16), pp. 11176-11183. Federico, Giovanni. 2002. ‘The world economy 0-200 AD: a review article’. European Review of Economic History. 6:111-121. Fogel, R.W. 2004. The Escape from Hunger and Premature Death, 1700-2100. Cambridge: Cambridge University Press. Geary, P.T. 1977. ‘Wages, prices, income, and wealth’, in N. Gibson and J. Spencer (eds.). Economic Activity in Ireland: A Study of Two Open Economies. Dublin: G&M, pp. 149-89. Goldstone, Jack L. 2004. 'Efflorescences and economic growth in world history’, Journal of World History, 13(2): 323-389. Gordon, R.J. 2004. ‘Two centuries of economic growth: Europe chasing the American frontier’, NBER Working Paper No. 10,662. August. Gray, A. (ed.). 1997. International Perspectives on the Irish Economy. Dublin: Indecon Economic Consultants. Harris, Walter. 1699. A Description of the King’s Royal Gardens at Loo. Together with a Short Account of Holland. London: Roberts. Hoffman, Philip, David S. Jacks, Patricia A. Levin, and Peter H. Lindert. 2002. ‘Real inequality in Europe since 1500’. Journal of Economic History, 62:322-355. Honohan, Patrick and Brendan M. Walsh. 2002. ‘Catching Up with the Leaders: the Irish Hare’, Brookings Papers on Economic Activity, 1-57. Hughes, Charles (ed.). 1903. Shakespeare’s Europe: Unpublished Chapters of Fynes Moryson’s Itinerary. London: Sherratt & Hughes. Israel, Jonathan I., 1989. Dutch Primacy in World Trade, 1585-1740. Oxford: Clarendon Press.
Landers, John. 1993. Death and the Metropolis: Studies in the Demographic History of London 1670-1830, Cambridge: Cambridge University Press. Leunig, Tim and Hans Joachim Voth. 2002. ‘'Height and the high life: what future for a tall story?', in P. David and M. Thomas (eds.), The Economic Future in Historical Perspective. London: British Academy. Lichtenberg, Frank L. 2003. ‘Pharmaceutical innovation, mortality reduction, and economic growth’, in Kevin M. Murphy and Robert H. Topel (eds.), Measuring the Gains from Medical Research: an Economic Approach, Chicago: University of Chicago Press, 2003, pp. 74-109.
Lindert, Peter. 2000. ‘Three centuries of income inequality in Britain and America’. In A.B. Atkinson and F. Bourguignon, eds. Handbook of Income Distribution. Amsterdam: Elsevier, pp. 167-216.
31

Lindert, P. and J.G. Williamson. 1983. ‘Revising Britain’s social tables, 1688-1913’. Explorations in Economic History, 19(4): 385-408.
Lucas, Robert. 2004. ‘Macroeconomic priorities’. American Economic Review. McCants, Anne E.C. 1997. Civic Charity in a Golden Age: Orphan Care in Early Modern Amsterdam. Urbana and Chicago: University of Illinois Press. Maddison, Angus. 2000. The World Economy: A Millennial Perspective, Paris: OECD. Maddison, Angus. 2005. ‘Measuring and Interpreting World Economic Performance 1500-2001’, Review of Income and Wealth, 51: 1-35. Mokyr, Joel. 1976. The Industrialization of the Low Countries 1795-1850, New Haven: Yale University Press. Mokyr, Joel and C. Ó Gráda. 1988. 'Poor and getting poorer ? Irish living standards before the Famine', Economic History Review, vol. 51, 209-35. Munro, John H. 2001. ‘Money, Wages, and Real Incomes in the Age of Erasmus: The Purchasing Power of Coins and of Building Craftsmen’s Wages in England and the Low Countries, 1500 – 1540’. (http://www.economics.utoronto.ca/ecipa/archive/UT-ECIPA-MUNRO-01-01.html). National Economic and Social Council. 1980. Personal Incomes by Region. Pr. 8683. Dublin: Stationary Office.
Nolan, Brian and Bertrand Mâitre. 2000. ‘A comparative perspective on trends in income inequality in Ireland’. Economic and Social Review, 31(4): 329-50. http://www.esr.ie/vol31_4/3Nolan.pdf Nolan, Brian and Timothy M. Smeeding. 2004. ‘Ireland’s income distribution in comparative perspective’, unpublished. Nordhaus, William D. 2002. ‘The health of nations: the contribution of improved health to living standards’. NBER Working Paper No. 8818. Noordam, D.J. 1986. Leven in Maasland. Een hoogontwikkelde plattelandssamenleving in de achttiende en het begin van de negentiende eeuw. Amsterdam. O'Brien, Patrick and Derek Keene. (eds). 2001. Urban Achievement in Early Modern Europe: Golden Ages in Antwerp, Amsterdam, and London. New York: Cambridge University Press. Offer, Avner. 2002 .Economic welfare measurements of human well-being’, Paul David and Mark Thomas, eds. The Economic Future in Historical Perspective. London: British Academy, pp. 371-99. Ó Gráda, C. 1997a. A Rocky Road: The Irish Economy since the 1920s. Manchester: Manchester University Press.
32
Ó Gráda, C. 1997b. ‘Les fluctuations de la population irlandaise avant 1700’, in Jean-Pierre Bardet and Jacques Dupâquier, eds. Histoire des populations de l’Europe. I. Origines aux prémices de la revolution démographique. Paris: Fayard, pp. 382-7. Ó Gráda, C. 2002. 'Is the Celtic Tiger a Paper Tiger? '. ESRI Quarterly Economic Commentary, Summer 2002, pp. 51-62. Ó Gráda, C. and K.H. O'Rourke. 2000. 'Living standards and growth', in John O'Hagan (ed.), The Economy of Ireland: Policy and Performance of a European Region, Dublin: Gill & Macmillan, pp. 178-204. O’Leary, Eoin. 2003. ‘Aggregate and sectoral convergence among Irish regions: the role of structural change 1960-96’. International Regional Science Review. 26(4): 483-501. Paping, R.J.F. 1988. ‘Papisten in de Ommelanden 1730-1810’. Unpublished History Dissertation. University of Groningen 1988. Perrenoud, Alfred. 1975. ‘L’inégalité sociale devant la mort à Genève au XVIIe siècle’, Population (numéro spécial) 30: 236. Perrenoud, Alfred and Patrice Bourdelais. 1998. ‘Le recul de la mortalité’, in Jean-Pierre Bardet and Jacques Dupâquier, eds. Histoire des populations de l’Europe. 2. La révolution démographique, 1750-1914. Paris: Fayard, pp. 57-101. Preston, Samuel and Etienne van de Walle. 1978. ‘Urban French mortality in the nineteenth century’, Population Studies, 32(2): 275-97. Riley, James C. 2001. Rising Life Expectancy: A Global History. Cambridge: Cambridge University Press. Rossi, Nicola and Gianni Toniolo. 1996. ‘Italy’. In Nicholas Crafts and Gianni Toniolo (eds.). Economic Growth in Europe since 1945. Cambridge: CUP, pp.427-454. Schama, Simon. 1987. The Embarrassment of Riches: An Interpretation of Dutch Culture in the Golden Age. New York: Knopf. Sen, A.K. 1976. ‘Real national income’. Review of Economic Studies. 43:19-39. Soderberg, Johann, Ulf Jonsson and Christer Persson. 1911. A Stagnating Metropolis: The Economy and Demography of Stockholm 1750-1850, Cambridge: Cambridge University Press. Soltow, Lee and Jan L. van Zanden. 2002. Income and Wealth Inequality in the Netherlands, 16th-20th century. Amsterdam: Het Spinhuis. Steckel, Richard H. 2002. ‘Health and nutrition in the pre-industrial era: insights from a millennium of average heights in northern Europe’. National Bureau of Economic Research. Steckel, Richard H. and Jerome C. Rose. 2002. The Backbone of History: Health and Nutrition in the Western Hemisphere. Cambridge: CUP.
33
Szreter, Simon and Graham Mooney. 1998. ‘Urbanization, mortality, and the standard of living debate: new estimates of the expectation of life at birth in nineteenth-century British cities’. Economic History Review.51(1): 84-112. Temple, Sir William. 1673 [1971]. Observations upon the United Provinces of the Netherlands. Farnborough: Gregg [photographic reprint of the original]. van den Berg, Hendrick. 2002. ‘Does annual real gross domestic product per capita overstate or understate the growth of individual welfare over the past two centuries?’ The Independent Review. 7(2): 181-196 (downloadable at: http://www.independent.org/pdf/tir/tir_07_2_vandenberg.pdf) van der Woude, A.M. 1972. ‘Variations in the size and composition of the household in the United Provinces of the Netherlands’, in Peter Laslett (ed.). Household and Family in Past Time. Cambridge: Cambridge University Press, pp. 299-318. van der Woude, A.M. 1983. Het Noorderqkwartier. Utrecht: H&S. van Leeuwen, Marco H.D. and James E. Oeppen (1993). 'Reconstructing the demographic regime of Amsterdam 1681-1920', in Economic and Social History of the Netherlands, Volume 5, pp. 61-102. van Strien, C.D. 1993. British Travellers in Holland during the Stuart Period. Leiden: Brill. van Strien-Chardonneau, Madeleine. 1994. Le voyage de Hollande: récits de voyageurs français dans les Provinces-Unies. Oxford: Voltaire Foundation. van Zanden, Jan Luiten. 1995. ‘Tracing the beginning of the Kuznets curve: western Europe during the early modern period’, Economic History Review, XLVIII(4): 643-664. Van Zanden, Jan Luiten. 2001. ‘A survey of the European economy 1500-2000’, in Maarten Roy Prak (ed.), Early Modern Capitalism: Economic and Social Change in Europe 1400-1800. London: Routledge. van Zanden, Jan Luiten. 2002a. 'Taking the measure of the early modern economy: historical national accounts for Holland in 1510-14', European Review of Economic History, 6(1): 3-36. van Zanden, Jan Luiten. 2002b. 'The revolt of the early modernists and 'the first modern economy': an assessment', Economic History Review, LV(4): 619-641. van Zanden, Jan Luiten and Arthur van Riel. 2004. The Strictures of Inheritance: the Dutch Economy in the Nineteenth Century. Princeton: Princeton University Press. Williamson, J.G. 1984. ‘British mortality and the value of life’. Population Studies. 38: 157-72. Woods, Robert. 2000. The Demography of Victorian England and Wales. Cambridge: Cambridge University Press. Wrigley, E.A. and R. Schofield. 1991. The Population History of England: A Reconstruction. London: Arnold.
34

Wrigley, E.A., R. Davies, J. Oeppen, and R.S. Schofield. 1997. English Population History from. Family Reconstitution, 1580–1837. Cambridge: Cambridge University Press. ENDNOTES 1 Earlier versions were given at Universitat Pompeu Fabra and Queen’s University Belfast. My
thanks to Andrea Brandolini, Kevin Denny, Gianfranco di Viao, Michael Edelstein, David
Madden, Brian Nolan, and Brendan Walsh for sharing data and for comments. 2 Survey data generally refer only to the recent past; see, however, the Subjective
Impoverishment Index discussed in Mokyr and Ó Gráda 1988, which refer to data from the
1830s. While Tim Leunig and Joachim Voth have recently commented on ‘the fading use of
stature’ as indicators of movements in health and wellbeing in advanced industrial societies,
much is expected of the anthropometric approach in assessments of health and nutritional status
in the pre-documented past, such as in medieval Europe and pre-Columban America (Leunig
and Voth 2002; Steckel 2002; Steckel and Rose 2002). 3 The sorpasso emerged when the Italian statistical service revised its estimate of the black
economy upward. 4 For an account of the Irish economy before the boom see Ó Gráda 1997a. 5 In mid-century the Italian economy was sixteen times the size of Ireland’s. 6 Italy had been worse affected by World War II than neutral Ireland, and its recovery between
1945 and 1950 – spurred on by the Marshall Plan – was accordingly faster. However, by mid-
century the rates of growth in both economies had declined to levels sustained in the following
decade. 7 For an excellent overview of the Italian economy between 1945 and the mid-1990s see Rossi
and Toniolo (1996). 8 Between 1998 and 2001 Italian GDP per head grew by 6% whereas Irish GDP per head grew
by 27%. 9 For more recent applied work on this topic compare Nordhaus (2002) and Becker et al. (2003). 10 In partial mitigation, over the half-century the number of hours worked per employee in
Ireland dropped more than in Italy: by 25.8% versus 18.9% (compare Gordon 2004).
35

11 An earlier estimate for urban Ireland can be inferred from data on gross weekly household
incomes in Irish cities and towns in 1965-66 (as reported in Geary 1977: 172-5). It implies a G
of 0.345, but is not readily comparable to our later estimates. 12 I owe the 2000 Irish estimate to Brian Nolan, who estimated it from the Household Budget
Survey. 13 The following exercise implicitly assumes that both economies ‘care’ equally about inequality. 14 The problems of the Italian South, or Mezzogiorno, have been the focus of a huge literature
from a variety of disciplines. For nuanced studies of the Mezzogiorno in the 1990s, with some
background on earlier trends, see Barca (2001) and di Vaio (2004). 15 Calculations based on weighted standard deviations yield broadly similar results. 16 Both Irish measures involve splicing data and shifts in definition. The income data splices two
series. (i) The 1960-77 estimates refer to estimates of personal income (which includes
transfers). These are mainly the work of Micheál Ross, and were originally published by NESC
(see National Economic and Social Council 1980). (ii) The 1980-1994 data are taken from Boyle
et al. (1999), and the 2000 figure derived from Central Statistics Office estimates of disposable
income by county
(http://www.cso.ie/releasespublications/documents/economy/2001/regincome_2001.pdf).
The gross value added series combines that of O’Leary (2004) for 1960-1996 with CSO data for
2000, adjusted downward from 0.213 to 0.177 to allow for the effect of transfer pricing. This
reflects the gap between O’Leary’s estimate for 1996 (0.156) and the uncorrected CSO data
(0.188). I assume that the coefficients of variation changed at a constant rate in years between
observations. 17 De Vries (1995: 669) notes that in the 1730s Amsterdam parish registers recorded an annual
average of 3,300 girls born; twenty-five years later, an annual average of 1,410 Amsterdam-born
women were wed. The ratio seems to imply high mortality, but this makes no allowance for the
relative importance of inward and outward migration, celibacy, and the likely under-registration
of births. 18 These are Alter’s ‘non-select’ estimates, which exclude the first years of each annuity in order
to minimize selection bias. In Amsterdam in 1636 the plague killed over seventeen thousand
people, or one-seventh of the population; in Leiden and in Haarlem too it killed significant
proportions of the inhabitants. 19 The estimates of life expectancy yielded by van Leeuwen and Oeppen’s Generalised Inverse
Projection modeling are generally higher than those derived from annuities between the 1670s
and 1720s; I do not invoke them here for that reason.
36
20 Death-by-age data for London as a whole become available only in the early eighteenth
century. 21 Life expectancy in Geneva grew roughly in tandem with London: from 23.9 years in 1625-49
to 34.3 years a century later and 39.9 years in 1800-1820 (ADH 1978: 223). 22 In a rather different vein Robert Lucas has famously argued, referring to economic growth in
the developed world in recent decades, that the gap between a growth path associated with ‘real’
business cycles one which succeeded in eliminating the cycles was small, in the sense that society
should have been prepared to pay only a small fraction of output in order to eliminate
fluctuations (Lucas 2004).
37