CENSUS OF INDIA 2011
Varsha Joshiof the Indian Administrative ServiceDirector of Census OperationsNational Capital Territory of Delhi
Primary Census AbstractData Highlights
NCT OF DELHI
Persons Males Females
1 2 3 4 5 6 7 8 10
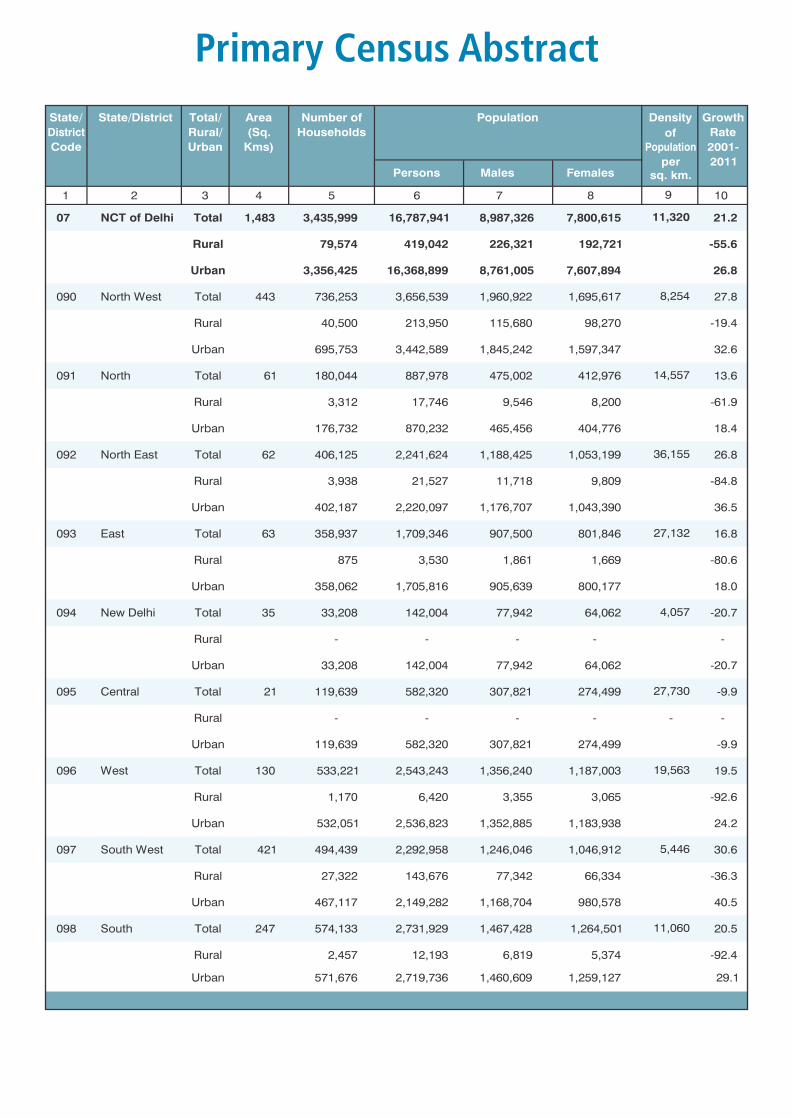
07 NCT of Delhi Total 1,483 3,435,999 16,787,941 8,987,326 7,800,615 21.2
Rural 79,574 419,042 226,321 192,721 -55.6
Urban 3,356,425 16,368,899 8,761,005 7,607,894 26.8
090 North West Total 443 736,253 3,656,539 1,960,922 1,695,617 27.8
Rural 40,500 213,950 115,680 98,270 -19.4
Urban 695,753 3,442,589 1,845,242 1,597,347 32.6
091 North Total 61 180,044 887,978 475,002 412,976 13.6
Rural 3,312 17,746 9,546 8,200 -61.9
Urban 176,732 870,232 465,456 404,776 18.4
092 North East Total 62 406,125 2,241,624 1,188,425 1,053,199 26.8
Rural 3,938 21,527 11,718 9,809 -84.8
Urban 402,187 2,220,097 1,176,707 1,043,390 36.5
093 East Total 63 358,937
1,709,346
907,500
801,846
16.8
Rural 875
3,530
1,861
1,669
-80.6
Urban 358,062
1,705,816
905,639
800,177
18.0
094 New Delhi Total 35 33,208
142,004
77,942
64,062
-20.7
Rural -
-
-
-
-
Urban 33,208
142,004
77,942
64,062
-20.7
095 Central Total 21 119,639
582,320
307,821
274,499
-9.9
Rural -
-
-
-
-
-
Urban 119,639
582,320
307,821
274,499
-9.9
096 West Total 130 533,221
2,543,243
1,356,240
1,187,003 19.5
Rural 1,170
6,420
3,355
3,065
-92.6
Urban 532,051
2,536,823
1,352,885
1,183,938 24.2
097 South West Total 421 494,439
2,292,958
1,246,046
1,046,912 30.6
Rural 27,322
143,676
77,342
66,334
-36.3
Urban 467,117
2,149,282
1,168,704
980,578
40.5
098 South Total 247 574,133
2,731,929
1,467,428
1,264,501 20.5
Rural 2,457
12,193
6,819
5,374
-92.4
Urban 571,676
2,719,736
1,460,609
1,259,127 29.1
State/
District
Code
Growth
Rate
2001-
2011
State/District Total/
Rural/
Urban
Area
(Sq.
Kms)
Number of
Households
Population
9
11,060
27,132
4,057
27,730
19,563
5,446
11,320
8,254
14,557
36,155
Density
of
Population
per sq. km.
Primary Census Abstract
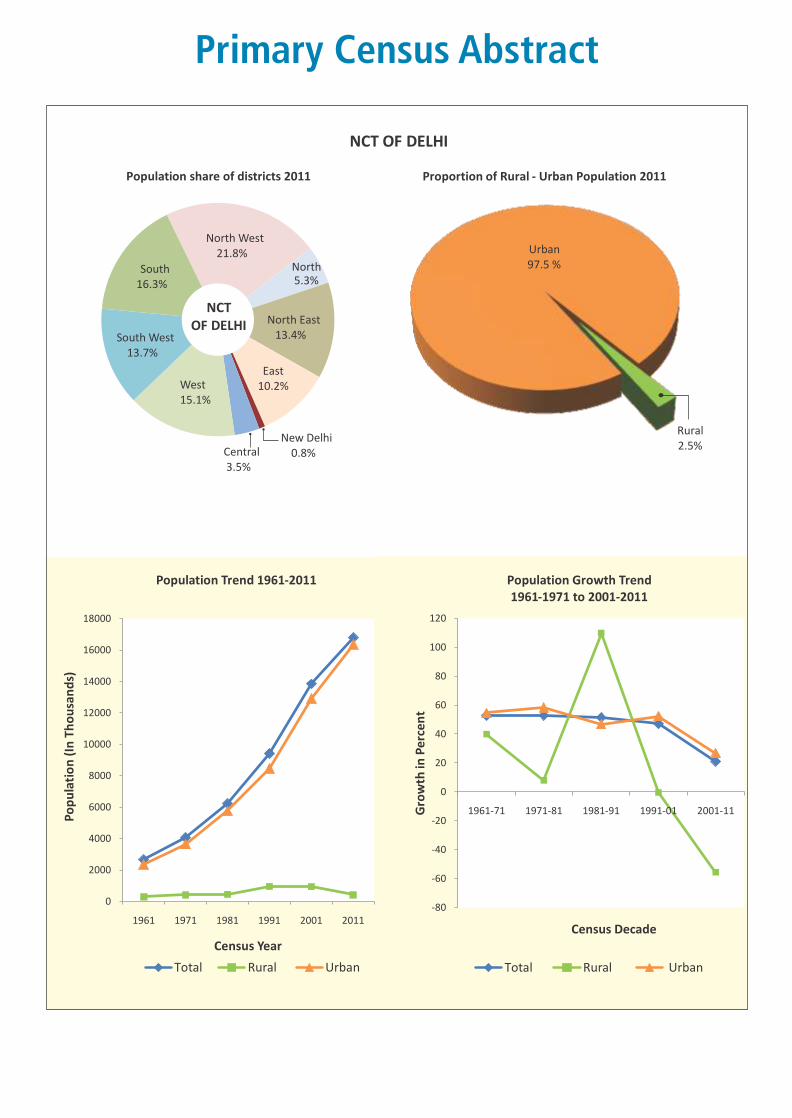
North West 21.8%
North 5.3%
North East 13.4%
East 10.2%
New Delhi 0.8%Central
3.5%
West 15.1%
South West 13.7%
South 16.3%
NCT OF DELHI
Population share of districts 2011
Population Trend 1961-2011
0
2000
4000
6000
8000
10000
12000
14000
16000
18000
1961 1971 1981 1991 2001 2011
Po
pu
lati
on
(In
Th
ou
san
ds)
Census Year
Total Rural Urban
Population Growth Trend 1961-1971 to 2001-2011
-80
-60
-40
-20
0
20
40
60
80
100
120
1961-71 1971-81 1981-91 1991-01 2001-11Gro
wth
in P
erc
en
t
Census Decade
Total Rural Urban
Rural 2.5%
Urban 97.5 %
Proportion of Rural - Urban Population 2011
NCT OF DELHI
Primary Census Abstract
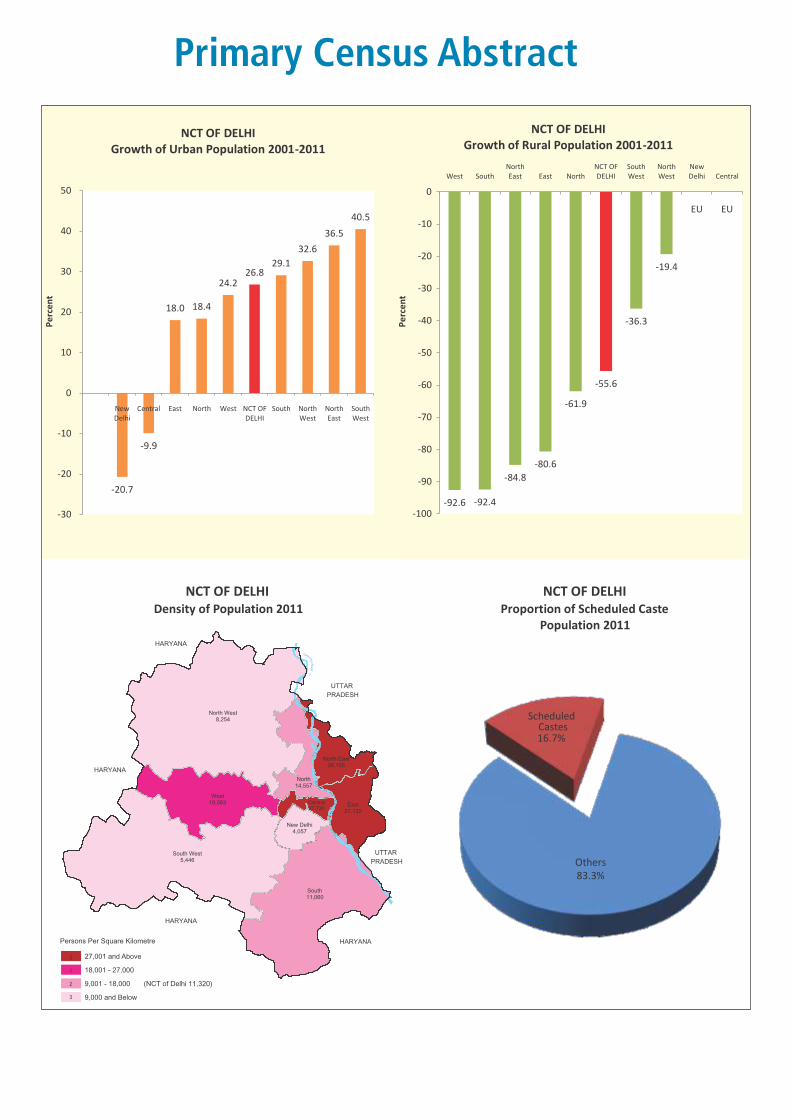
-92.6 -92.4
-84.8
-80.6
-61.9
-55.6
-36.3
-19.4
EU EU
-100
-90
-80
-70
-60
-50
-40
-30
-20
-10
0
West SouthNorth East East North
NCT OF DELHI
South West
North West
New Delhi Central
NCT OF DELHI Growth of Rural Population 2001-2011
-20.7
-9.9
18.0 18.4
24.226.8
29.1
32.6
36.5
40.5
-30
-20
-10
0
10
20
30
40
50
New Delhi
Central East North West NCT OF DELHI
South North West
North East
South West
NCT OF DELHI Growth of Urban Population 2001-2011
Others 83.3%
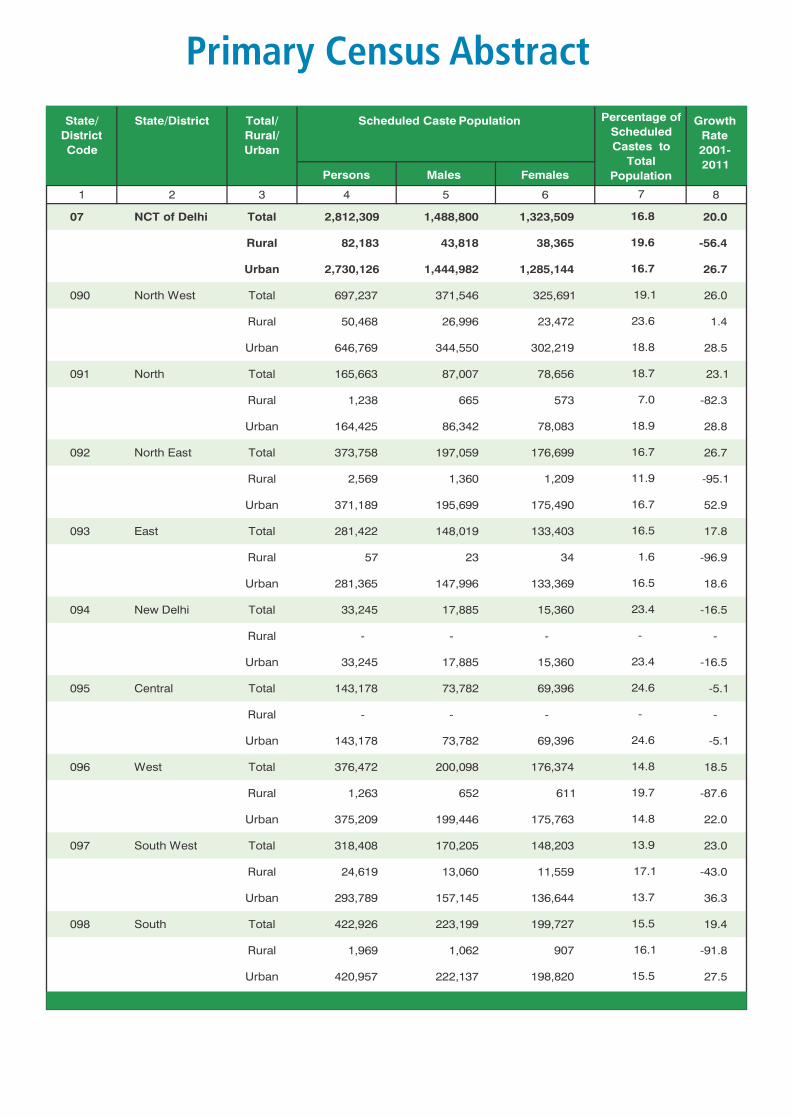
Scheduled Castes16.7%
NCT OF DELHIProportion of Scheduled Caste
Population 2011Density of Population 2011
NCT OF DELHI
27,001 and Above
18,001 - 27,000
9,000 and Below
Pe
rce
nt
Pe
rce
nt
Primary Census Abstract
Growth
Rate
2001-
2011Persons Males Females
1 2 3 4 5 6 8
07 NCT of Delhi Total 2,812,309
1,488,800
1,323,509 20.0
Rural 82,183
43,818
38,365 -56.4
Urban 2,730,126
1,444,982
1,285,144 26.7
090 North West Total 697,237
371,546
325,691 26.0
Rural 50,468
26,996
23,472 1.4
Urban 646,769
344,550
302,219 28.5
091 North Total 165,663
87,007
78,656 23.1
Rural 1,238
665
573
-82.3
Urban 164,425
86,342
78,083 28.8
092 North East Total 373,758
197,059
176,699 26.7
Rural 2,569 1,360 1,209 -95.1
Urban 371,189 195,699 175,490 52.9
093 East Total 281,422 148,019 133,403 17.8
Rural 57 23 34 -96.9
Urban 281,365 147,996 133,369 18.6
094 New Delhi Total 33,245 17,885 15,360 -16.5
Rural - - - -
Urban 33,245 17,885 15,360 -16.5
095 Central Total 143,178 73,782 69,396 -5.1
Rural - - - -
Urban 143,178 73,782 69,396 -5.1
096 West Total 376,472 200,098 176,374 18.5
Rural 1,263 652 611 -87.6
Urban 375,209 199,446 175,763 22.0
097 South West Total 318,408 170,205 148,203 23.0
Rural 24,619 13,060 11,559 -43.0
Urban 293,789 157,145 136,644 36.3
098 South Total 422,926 223,199 199,727 19.4
Rural 1,969 1,062 907 -91.8
Urban 420,957 222,137 198,820 27.5
7
23.6
18.8
18.7
7.0
18.9
16.7
11.9
16.7
16.5
1.6
16.5
13.7
State/
District
Code
State/District Total/
Rural/
Urban
Scheduled Caste Population
16.8
19.6
16.7
19.1
16.1
15.5
15.5
13.9
14.8
24.6
19.7
14.8
17.1
Percentage of
Scheduled
Castes to
Total
Population
23.4
-
23.4
24.6
-
Primary Census Abstract
2001 2011 Persons Males Females 2001 2011
1 2 3 4 5 6 7 8 9 10 11
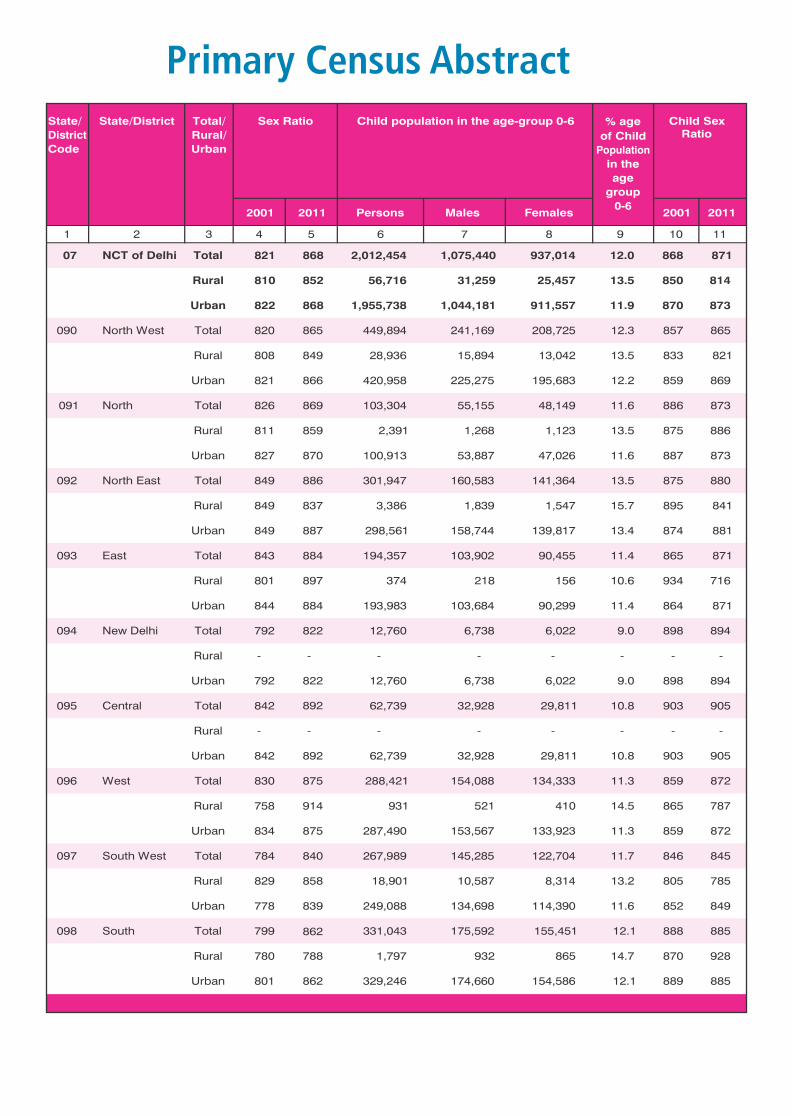
07 NCT of Delhi Total 821 868 2,012,454 1,075,440 937,014 12.0 868 871
Rural 810
852
56,716
31,259
25,457 13.5
850
814
Urban 822
868
1,955,738
1,044,181 911,557 11.9
870
873
090 North West Total 820
865
449,894
241,169
208,725 12.3
857
865
Rural 808
849
28,936
15,894
13,042 13.5
833
821
Urban 821
866
420,958
225,275
195,683 12.2
859
869
091 North Total 826
869
103,304
55,155
48,149 11.6
886
873
Rural 811
859
2,391
1,268
1,123 13.5
875
886
Urban 827
870
100,913
53,887
47,026 11.6
887
873
092 North East Total 849
886
301,947
160,583
141,364 13.5
875
880
Rural 849
837
3,386
1,839
1,547 15.7
895
841
Urban 849
887
298,561
158,744
139,817 13.4
874
881
093 East Total 843
884
194,357
103,902
90,455 11.4
865
871
Rural 801
897
374
218
156 10.6
934
716
Urban 844
884
193,983
103,684
90,299 11.4
864
871
094 New Delhi Total 792
822
12,760
6,738
6,022 9.0
898
894
Rural -
-
-
- - -
-
Urban 792
822
12,760
6,738
6,022 9.0
898
894
095 Central Total 842
892
62,739
32,928
29,811 10.8
903
905
Rural -
-
-
- - -
-
Urban 842
892
62,739
32,928
29,811 10.8
903
905
096 West Total 830
875
288,421
154,088
134,333 11.3
859
872
Rural 758
914
931
521
410 14.5
865
787
Urban 834
875
287,490
153,567 133,923 11.3
859
872
097 South West Total 784
840
267,989
145,285 122,704 11.7
846
845
Rural 829
858
18,901
10,587
8,314 13.2
805
785
Urban 778
839
249,088
134,698 114,390 11.6
852
849
098 South Total 799
862
331,043
175,592 155,451 12.1
888
885
Rural 780
788
1,797
932
865 14.7
870
928
Urban 801
862
329,246
174,660 154,586 12.1
889
885
State/District Total/
Rural/
Urban
Sex Ratio Child population in the age-group 0-6 % age
of Child
Population
in the
age
group
0-6
Child Sex Ratio
State/
District
Code
-
-
Primary Census Abstract
82
0
82
6 84
9
84
3
79
2
84
2
83
0
78
4 79
9
86
5
86
9 88
6
88
4
82
2
89
2
87
5
84
0 86
2
700
750
800
850
900
950
1000
North West
North North East
East New Delhi
Central West South West
South
Districts
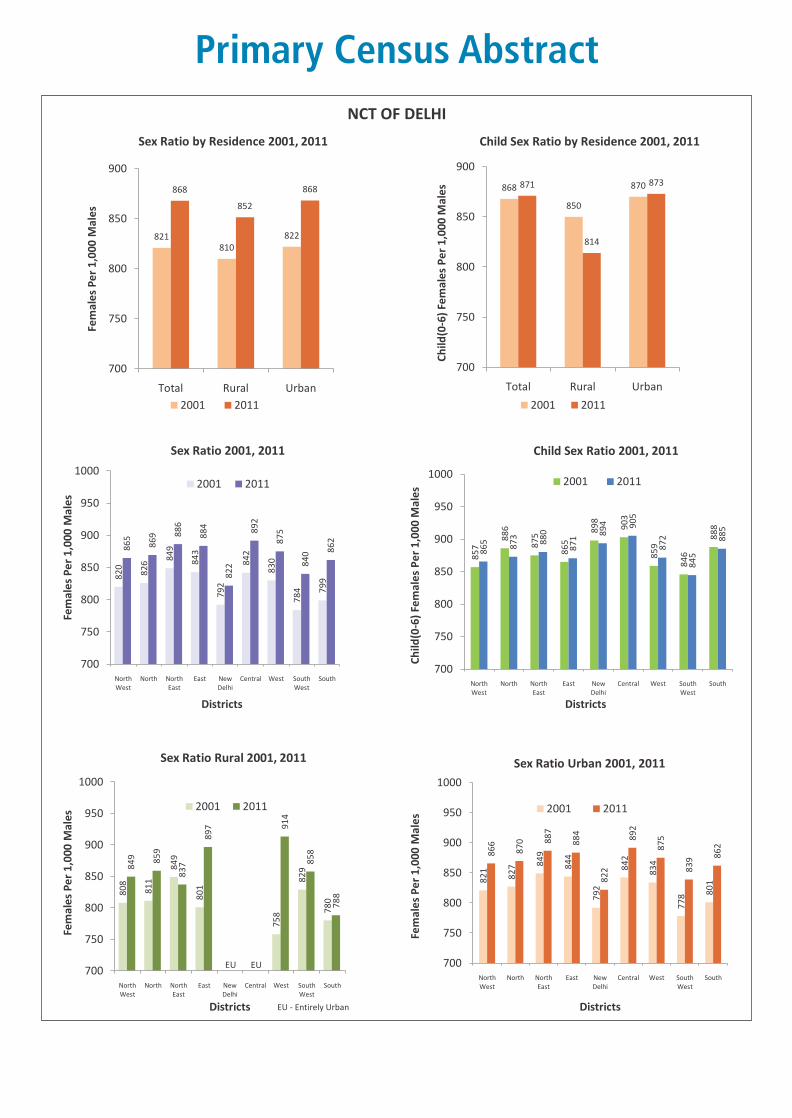
Sex Ratio 2001, 2011
2001 20118
21
82
7 84
9
84
4
79
2
84
2
83
4
77
8 80
1
86
6
87
0 88
7
88
4
82
2
89
2
87
5
83
9 86
2
700
750
800
850
900
950
1000
North West
North North East
East New Delhi
Central West South West
South
Districts
Sex Ratio Urban 2001, 2011
2001 2011
80
8
81
1
84
9
80
1
75
8
82
9
78
0
84
9 85
9
83
7
89
7 91
4
85
8
78
8
700
750
800
850
900
950
1000
North West
North North East
East New Delhi
Central West South West
South
Districts
Sex Ratio Rural 2001, 2011
2001 2011
821810
822
868
852
868
700
750
800
850
900
Total Rural Urban
Fem
ale
s P
er
1,0
00 M
ale
s
NCT OF DELHI
Sex Ratio by Residence 2001, 2011
2001 2011
85
7
88
6
87
5
86
5
89
8
90
3
85
9
84
6
88
8
86
5
87
3
88
0
87
1
89
4 90
5
87
2
84
5
88
5
700
750
800
850
900
950
1000
North West
North North East
East New Delhi
Central West South West
South
Districts
Child Sex Ratio 2001, 2011
2001 2011
868
850
870871
814
873
700
750
800
850
900
Total Rural Urban
Ch
ild(0
-6)
Fem
ale
s P
er
1,0
00 M
ale
s
Child Sex Ratio by Residence 2001, 2011
2001 2011
EUEU
EU - Entirely Urban
Ch
ild(0
-6)
Fem
ale
s P
er
1,0
00 M
ale
s
Fem
ale
s P
er
1,0
00 M
ale
sFe
mal
es
Pe
r 1
,000
Mal
es
Fem
ale
s P
er
1,0
00 M
ale
s
Primary Census Abstract
Persons Males Females Persons Males Females
1 2 3 4 5 6 7 8 9
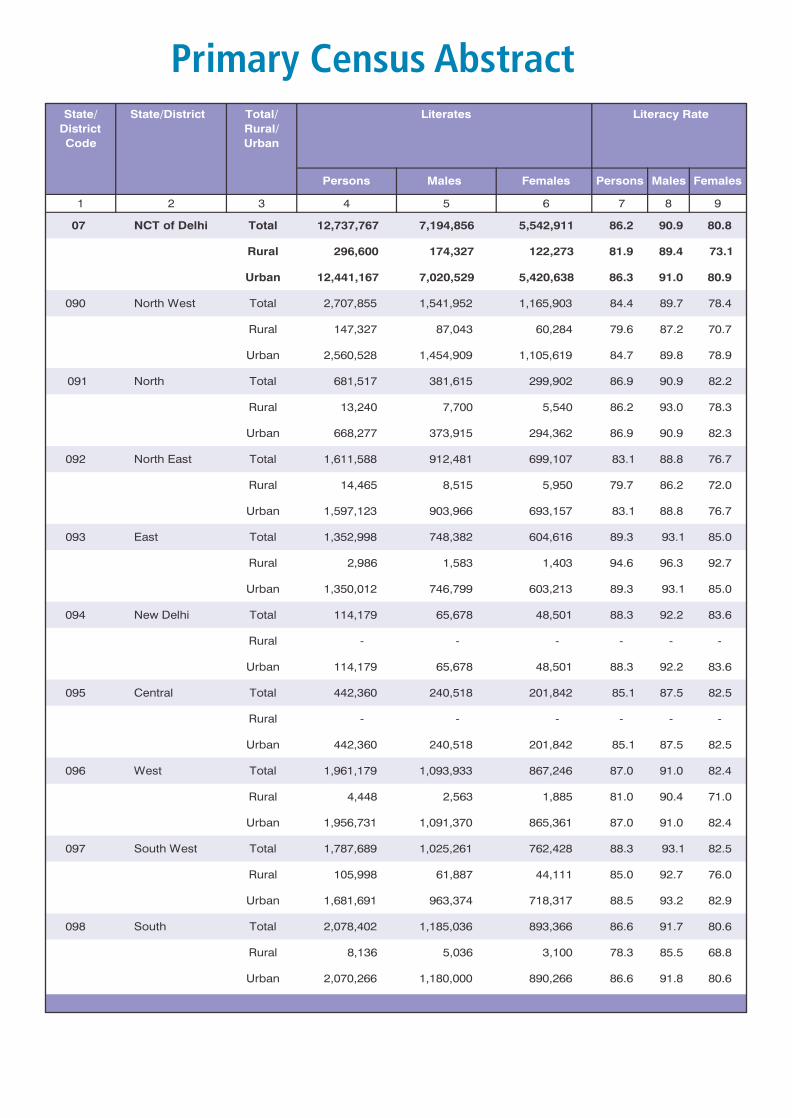
07 NCT of Delhi Total 12,737,767 7,194,856 5,542,911 86.2 90.9 80.8
Rural 296,600 174,327 122,273 81.9 89.4 73.1
Urban 12,441,167 7,020,529 5,420,638 86.3 91.0 80.9
090 North West Total 2,707,855 1,541,952 1,165,903 84.4 89.7 78.4
Rural 147,327 87,043 60,284 79.6 87.2 70.7
Urban 2,560,528 1,454,909 1,105,619 84.7 89.8 78.9
091 North Total 681,517 381,615 299,902 86.9 90.9 82.2
Rural 13,240 7,700 5,540 86.2 93.0 78.3
Urban 668,277 373,915 294,362 86.9 90.9 82.3
092 North East Total 1,611,588 912,481 699,107 83.1 88.8 76.7
Rural 14,465 8,515 5,950 79.7 86.2 72.0
Urban 1,597,123 903,966 693,157 83.1 88.8 76.7
093 East Total 1,352,998 748,382 604,616 89.3 93.1 85.0
Rural 2,986 1,583 1,403 94.6 96.3 92.7
Urban 1,350,012 746,799 603,213 89.3 93.1 85.0
094 New Delhi Total 114,179 65,678 48,501 88.3 92.2 83.6
Rural -
-
-
-
-
-
Urban 114,179
65,678
48,501
88.3 92.2 83.6
095 Central Total 442,360
240,518
201,842
85.1 87.5 82.5
Rural -
-
-
-
-
-
Urban 442,360
240,518
201,842
85.1 87.5 82.5
096 West Total 1,961,179
1,093,933
867,246
87.0 91.0 82.4
Rural 4,448
2,563
1,885
81.0 90.4 71.0
Urban 1,956,731
1,091,370
865,361
87.0 91.0 82.4
097 South West Total 1,787,689
1,025,261
762,428
88.3 93.1 82.5
Rural 105,998
61,887
44,111
85.0 92.7 76.0
Urban 1,681,691
963,374
718,317
88.5 93.2 82.9
098 South Total 2,078,402
1,185,036
893,366
86.6 91.7 80.6
Rural 8,136
5,036
3,100
78.3 85.5 68.8
Urban 2,070,266
1,180,000
890,266
86.6 91.8 80.6
State/
District
Code
State/District Literates Literacy Rate Total/
Rural/
Urban
Primary Census Abstract
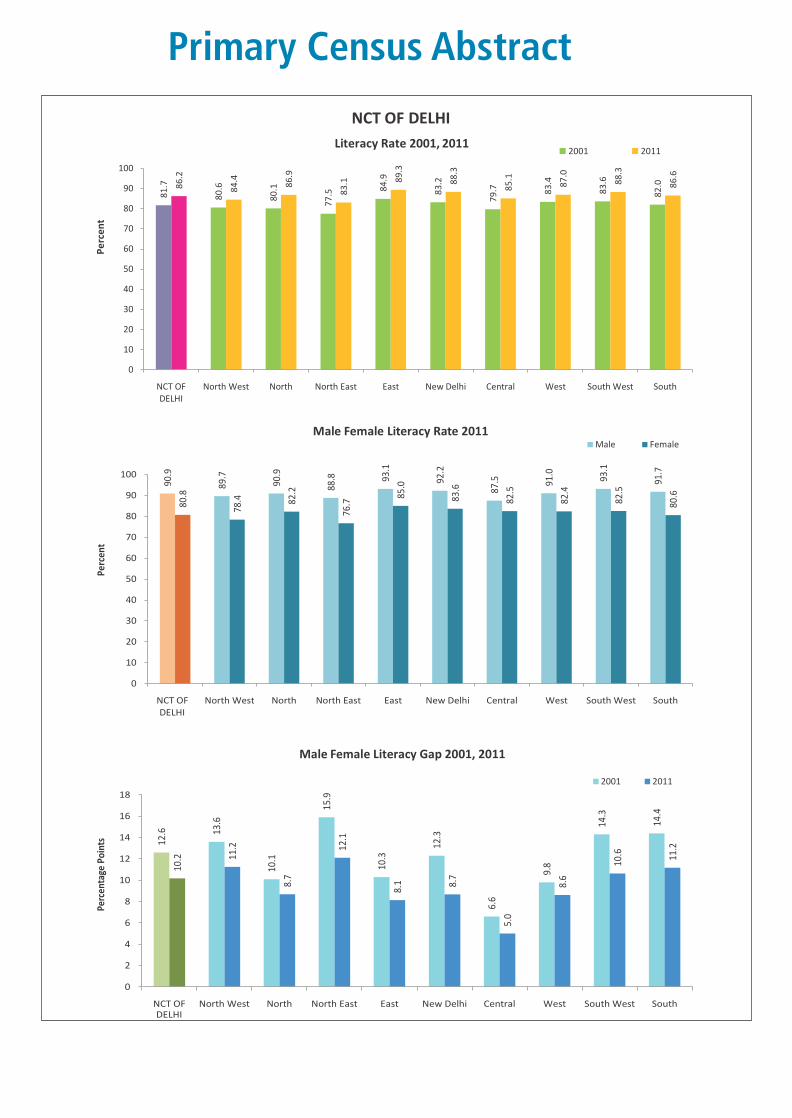
Male Female Literacy Rate 2011Male Female
90.9
89.7
90.9
88.8 93
.1
92.2
87.5 91
.0
93.1
91.7
80.8
78.4 82
.2
76.7
85.0
83.6
82.5
82.4
82.5
80.6
0
10
20
30
40
50
60
70
80
90
100
NCT OF DELHI
North West North North East East New Delhi Central West South West South
Perc
ent
81
.7
80
.6
80
.1
77
.5
84
.9
83
.2
79
.7 83
.4
83
.6
82
.086
.2
84
.4
86
.9
83
.1 89
.3
88
.3
85
.1
87
.0
88
.3
86
.6
0
10
20
30
40
50
60
70
80
90
100
NCT OF DELHI
North West North North East East New Delhi Central West South West South
NCT OF DELHI
Literacy Rate 2001, 20112001 2011
Pe
rce
nt
Male Female Literacy Gap 2001, 2011
2001 2011
12.6 13
.6
10.1
15.9
10.3
12.3
6.6
9.8
14.3
14.4
10.2 11
.2
8.7
12.1
8.1 8.
7
5.0
8.6
10.6 11
.2
0
2
4
6
8
10
12
14
16
18
NCT OF DELHI
North West North North East East New Delhi Central West South West South
Perc
enta
ge P
oint
s
Primary Census Abstract
Persons Males Females Persons Males Females
1 2 3 4 5 6 7 8 9
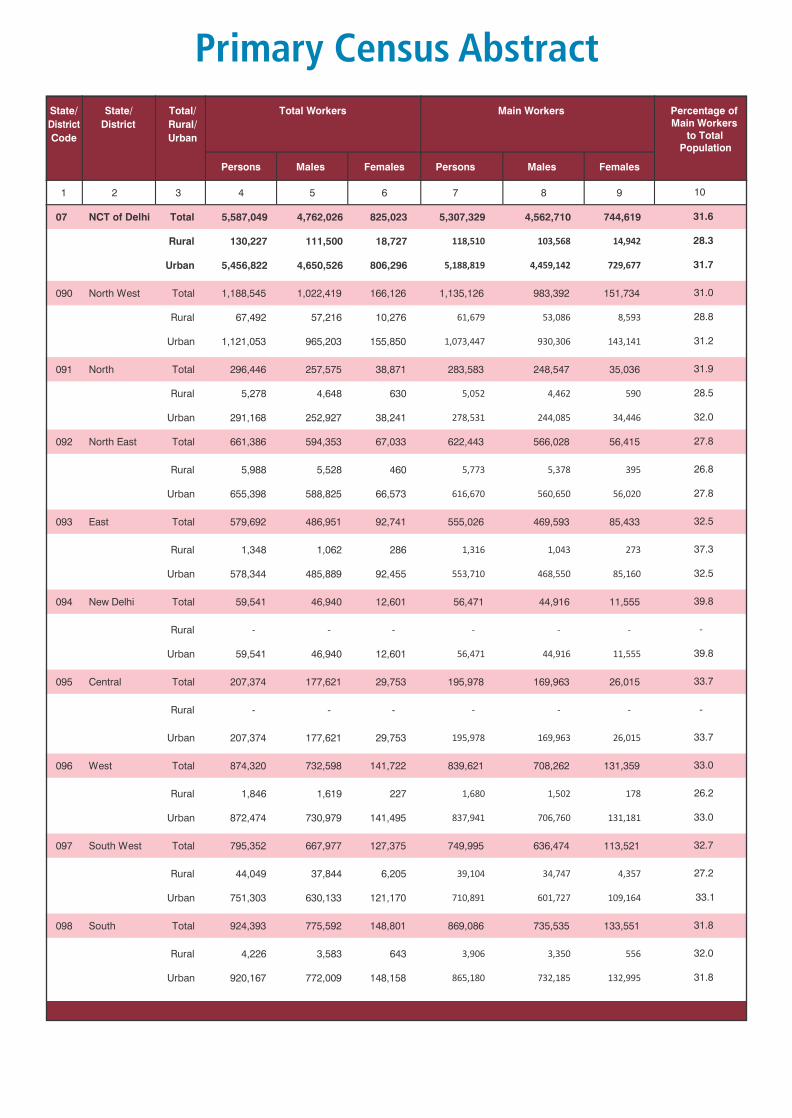
07 NCT of Delhi Total 5,587,049
4,762,026
825,023
5,307,329
4,562,710
744,619
Rural 130,227
111,500
18,727
118,510
103,568
14,942
Urban 5,456,822
4,650,526
806,296
5,188,819
4,459,142
729,677
090 North West Total 1,188,545
1,022,419
166,126
1,135,126
983,392
151,734
Rural 67,492
57,216
10,276
61,679
53,086
8,593
Urban 1,121,053
965,203
155,850
1,073,447
930,306
143,141
091 North Total 296,446
257,575
38,871
283,583
248,547
35,036
Rural 5,278
4,648
630
5,052
4,462
590
Urban 291,168
252,927
38,241
278,531
244,085
34,446
092 North East Total 661,386
594,353
67,033
622,443
566,028
56,415
Rural 5,988
5,528
460
5,773
5,378
395
Urban 655,398
588,825
66,573
616,670
560,650
56,020
093 East Total 579,692
486,951
92,741
555,026
469,593
85,433
Rural 1,348
1,062
286
1,316
1,043
273
Urban 578,344
485,889
92,455
553,710
468,550
85,160
094 New Delhi Total 59,541
46,940
12,601
56,471
44,916
11,555
Rural -
-
-
-
-
-
Urban 59,541
46,940
12,601
56,471
44,916
11,555
095 Central Total 207,374
177,621
29,753
195,978
169,963
26,015
Rural -
-
-
-
-
-
Urban 207,374
177,621
29,753
195,978
169,963
26,015
096 West Total 874,320
732,598
141,722
839,621
708,262
131,359
Rural 1,846
1,619
227
1,680
1,502
178
Urban 872,474
730,979
141,495
837,941
706,760
131,181
097 South West Total 795,352
667,977
127,375
749,995
636,474
113,521
Rural 44,049
37,844
6,205
39,104
34,747
4,357
Urban 751,303
630,133
121,170
710,891
601,727
109,164
098 South Total 924,393
775,592
148,801
869,086
735,535
133,551
Rural 4,226
3,583
643
3,906
3,350
556
Urban 920,167
772,009
148,158
865,180
732,185
132,995
State/
District
State/
District
Code
Total/
Rural/
Urban
Total Workers Main Workers
31.9
27.8
28.3
31.7
31.2
28.8
28.5
32.0
Percentage ofMain Workers
to Total Population
10
31.6
31.0
39.8
-
39.8
33.7
-
26.8
27.8
32.5
37.3
32.5
27.2
33.1
31.8
32.0
31.8
33.7
33.0
26.2
33.0
32.7
Primary Census Abstract
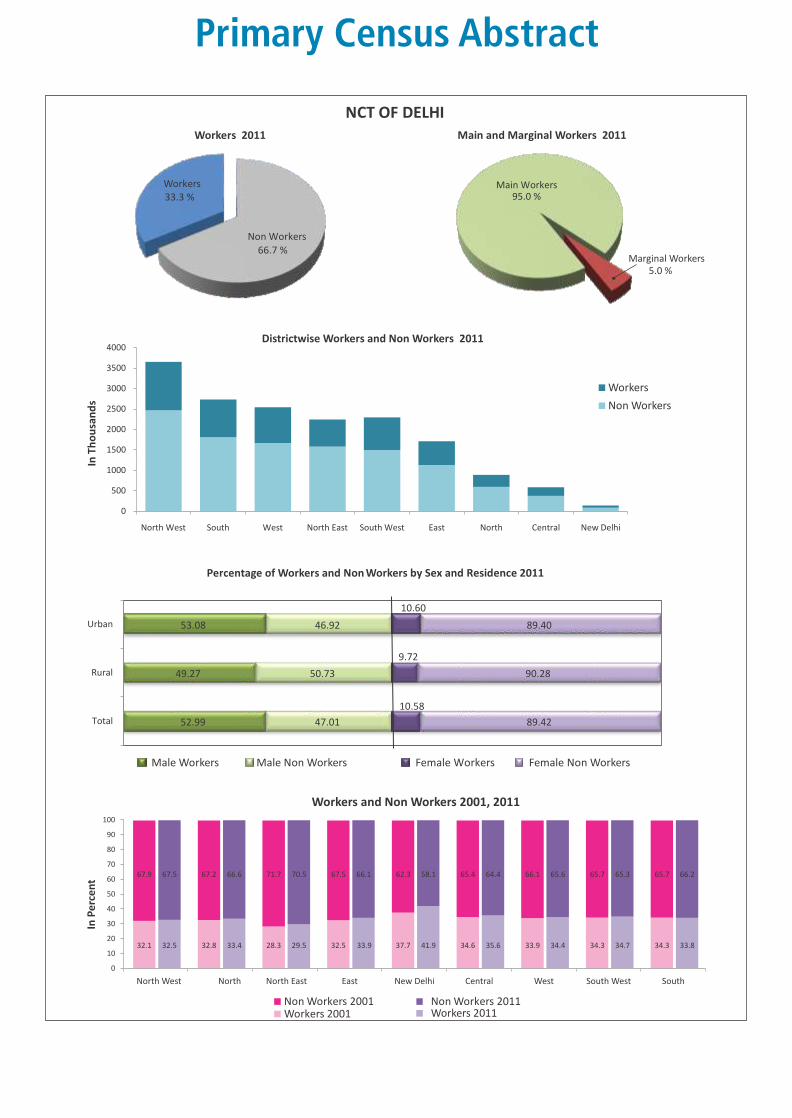
Main Workers95.0 %
Marginal Workers5.0 %
Main and Marginal Workers 2011
Non Workers
66.7 %
Workers33.3 %
NCT OF DELHI Workers 2011
0
500
1000
1500
2000
2500
3000
3500
4000
North West South West North East South West East North Central New Delhi
In T
ho
usa
nd
s
Districtwise Workers and Non Workers 2011
Workers
Non Workers
52.99
49.27
53.08
47.01
50.73
46.92
10.58
9.72
10.60
89.42
90.28
89.40
Total
Rural
Urban
Percentage of Workers and Non Workers by Sex and Residence 2011
Male Workers Male Non Workers Female Workers Female Non Workers
32.1 32.8 28.3 32.5 37.7 34.6 33.9 34.3 34.3
67.9 67.2 71.7 67.5 62.3 65.4 66.1 65.7 65.7
32.5 33.4 29.5 33.9 41.9 35.6 34.4 34.7 33.8
67.5 66.6 70.5 66.1 58.1 64.4 65.6 65.3 66.2
0
10
20
30
40
50
60
70
80
90
100
North West North North East East New Delhi Central West South West South
Workers 2001Non Workers 2001
Workers 2011Non Workers 2011
Workers and Non Workers 2001, 2011
In P
erc
en
t
Primary Census Abstract
Persons Males Females Persons Males Females
1 2 3 11 12 13 14 15 16 17 18
07NCT of
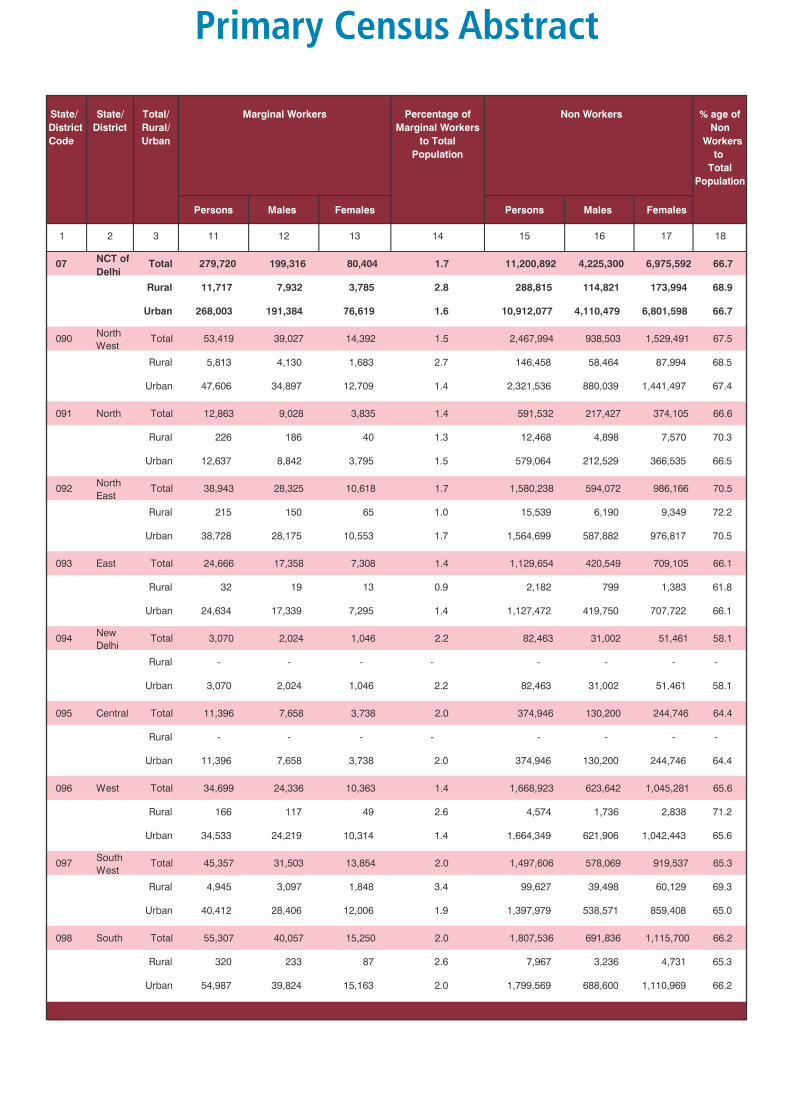
Delhi Total 279,720 199,316 80,404 1.7 11,200,892 4,225,300 6,975,592 66.7
Rural 11,717
7,932
3,785
2.8 288,815
114,821
173,994
68.9
Urban 268,003
191,384
76,619
1.6 10,912,077
4,110,479
6,801,598
66.7
090North
WestTotal 53,419 39,027 14,392 1.5 2,467,994 938,503 1,529,491 67.5
Rural 5,813
4,130
1,683
2.7 146,458
58,464
87,994
68.5
Urban 47,606
34,897
12,709
1.4 2,321,536
880,039
1,441,497
67.4
091 North Total 12,863 9,028 3,835 1.4 591,532 217,427 374,105 66.6
Rural 226
186
40
1.3 12,468
4,898
7,570
70.3
Urban 12,637
8,842
3,795
1.5 579,064
212,529
366,535
66.5
092North
East Total 38,943 28,325 10,618 1.7 1,580,238 594,072 986,166 70.5
Rural 215
150
65
1.0 15,539
6,190
9,349
72.2
Urban 38,728
28,175
10,553
1.7 1,564,699
587,882
976,817
70.5
093 East Total 24,666 17,358 7,308 1.4 1,129,654 420,549 709,105 66.1
Rural 32
19
13
0.9 2,182
799
1,383
61.8
Urban 24,634
17,339
7,295
1.4 1,127,472
419,750
707,722
66.1
094New
Delhi Total 3,070 2,024 1,046 2.2 82,463 31,002 51,461 58.1
Rural -
-
-
-
-
-
-
-
Urban 3,070
2,024
1,046
2.2 82,463
31,002
51,461
58.1
095 Central Total 11,396 7,658 3,738 2.0 374,946 130,200 244,746 64.4
Rural -
-
-
-
-
-
-
-
Urban 11,396
7,658
3,738
2.0 374,946
130,200
244,746
64.4
096 West Total 34,699 24,336 10,363 1.4 1,668,923 623,642 1,045,281 65.6
Rural 166
117
49
2.6 4,574
1,736
2,838
71.2
Urban 34,533
24,219
10,314
1.4 1,664,349
621,906
1,042,443
65.6
097South
West Total 45,357 31,503 13,854 2.0 1,497,606 578,069 919,537 65.3
Rural 4,945
3,097
1,848
3.4 99,627
39,498
60,129
69.3
Urban 40,412
28,406
12,006
1.9 1,397,979
538,571
859,408
65.0
098 South Total 55,307 40,057 15,250 2.0 1,807,536 691,836 1,115,700 66.2
Rural 320
233
87
2.6 7,967
3,236
4,731
65.3
Urban 54,987
39,824
15,163
2.0 1,799,569
688,600
1,110,969
66.2
State/
District
Code
State/
District
Total/
Rural/
Urban
Non Workers % age of
Non
Workers
to
Total
Population
Marginal Workers Percentage of
Marginal Workers
to Total
Population
Primary Census Abstract
48.
1
48.
6
47.6
57.8
53.2
48.6 51
.5
49.5
48.7
47.2
57.1
EU EU
48.3
48.
9 52.5
0
10
20
30
40
50
60
70
North West
North North East
East New Delhi
Central West South West
South
NCT OF DELHI
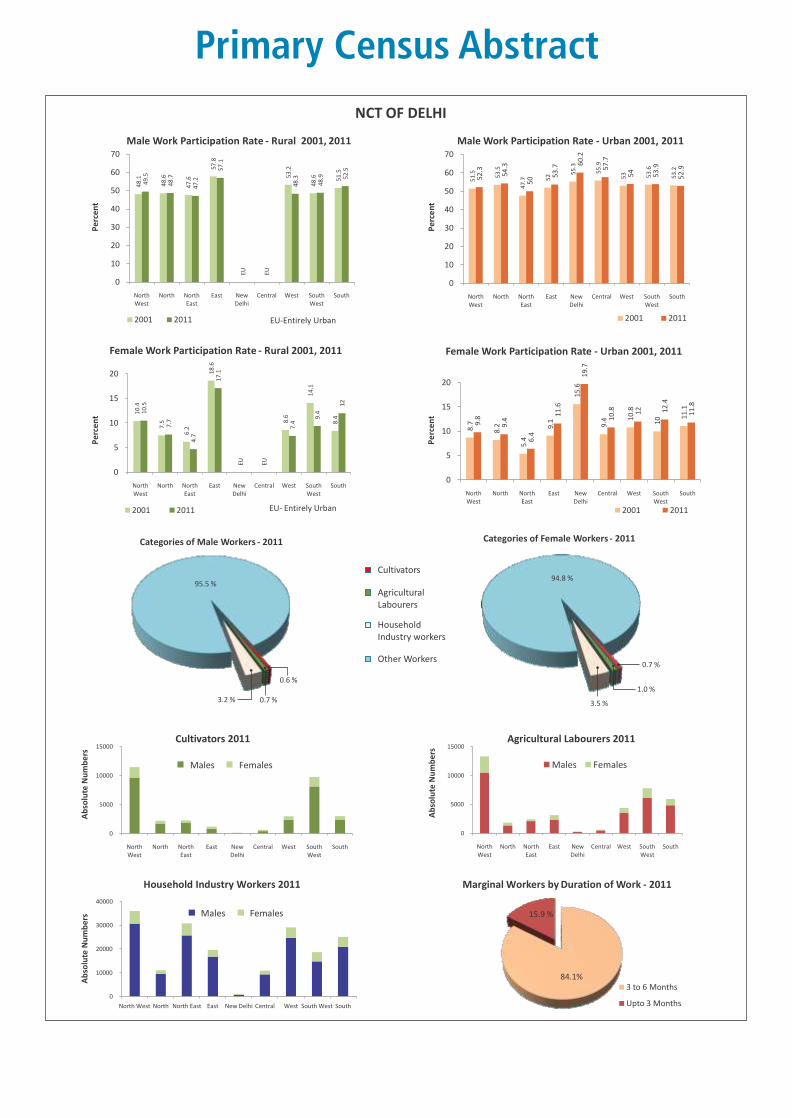
Male Work Participation Rate - Rural 2001, 2011
2001 2011 EU-Entirely Urban
Pe
rce
nt
10.
4
7.5
6.2
18.6
8.6
14.
1
8.4
10.5
7.7
4.7
17.
1
EU EU
7.4
9.4
12
0
5
10
15
20
North West
North North East
East New Delhi
Central West South West
South
Female Work Participation Rate - Rural 2001, 2011
2001 2011 EU- Entirely Urban
Pe
rce
nt
51.5 53.
5
47.7 5
2 55.3
55.9
53 53
.6
53.2
52.3
54.3
50 53
.7
60.2
57.7
54 53.9
52.9
0
10
20
30
40
50
60
70
North West
North North East
East New Delhi
Central West South West
South
Male Work Participation Rate - Urban 2001, 2011
2001 2011
Pe
rce
nt
8.7
8.2
5.4
9.1
15.6
9.4 10
.8
10
11.1
9.8
9.4
6.4
11.6
19.7
10.8 12 12
.4
11.8
0
5
10
15
20
North West
North North East
East New Delhi
Central West South West
South
Female Work Participation Rate - Urban 2001, 2011
2001 2011
Pe
rce
nt
0
5000
10000
15000
North West
North North East
East New Delhi
Central West South West
South
Cultivators 2011
FemalesMales
0
5000
10000
15000
North West
North North East
East New Delhi
Central West South West
South
Agricultural Labourers 2011
FemalesMales
0.6 %
0.7 %3.2 %
95.5 %
Categories of Male Workers - 2011
0
10000
20000
30000
40000
North West North North East East New Delhi Central West South West South
Household Industry Workers 2011
FemalesMales
0.7 %
1.0 %
3.5 %
94.8 %
Categories of Female Workers - 2011
84.1%
15.9 %
Marginal Workers by Duration of Work - 2011
3 to 6 Months
Upto 3 Months
Cultivators
Agricultural Labourers
Household Industry workers
Other Workers
Ab
solu
te N
um
be
rsA
bso
lute
Nu
mb
ers
Ab
solu
te N
um
be
rs
Primary Census Abstract
Persons Males Females Persons Males Females
1 2 3 4 5 6 7 8 9
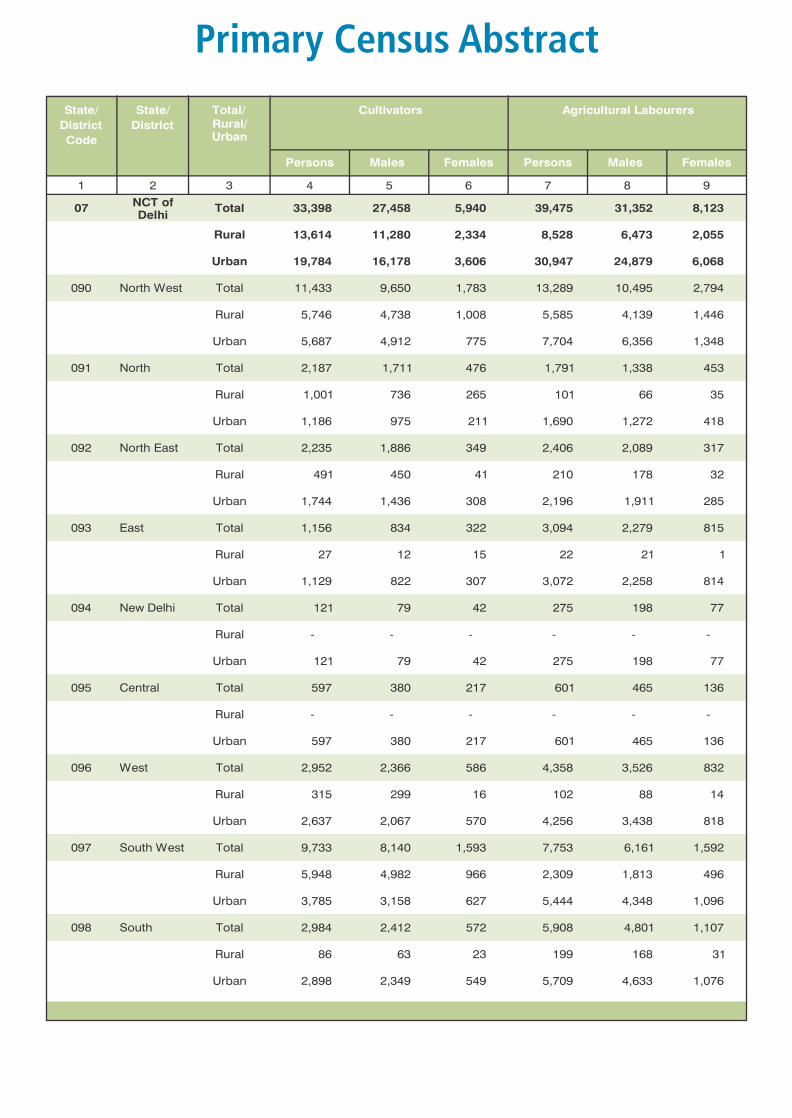
07 NCT of Delhi
Total 33,398 27,458 5,940 39,475 31,352 8,123
Rural 13,614
11,280
2,334
8,528
6,473
2,055
Urban 19,784
16,178
3,606
30,947
24,879
6,068
090 North West Total 11,433
9,650
1,783
13,289
10,495
2,794
Rural 5,746
4,738
1,008
5,585
4,139
1,446
Urban 5,687
4,912
775
7,704
6,356
1,348
091 North Total 2,187
1,711
476
1,791
1,338
453
Rural 1,001
736
265
101
66
35
Urban 1,186
975
211
1,690
1,272
418
092 North East Total 2,235
1,886
349
2,406
2,089
317
Rural 491
450
41
210
178
32
Urban 1,744
1,436
308
2,196
1,911
285
093 East Total 1,156
834
322
3,094
2,279
815
Rural 27
12
15
22
21
1
Urban 1,129
822
307
3,072
2,258
814
094 New Delhi Total 121
79
42
275
198
77
Rural -
-
-
-
-
-
Urban 121
79
42
275
198
77
095 Central Total 597
380
217
601
465
136
Rural -
-
-
-
-
-
Urban 597
380
217
601
465
136
096 West Total 2,952
2,366
586
4,358
3,526
832
Rural 315
299
16
102
88
14
Urban 2,637
2,067
570
4,256
3,438
818
097 South West Total 9,733
8,140
1,593
7,753
6,161
1,592
Rural 5,948
4,982
966
2,309
1,813
496
Urban 3,785
3,158
627
5,444
4,348
1,096
098 South Total 2,984
2,412
572
5,908
4,801
1,107
Rural 86
63
23
199
168
31
Urban 2,898
2,349
549
5,709
4,633
1,076
Cultivators Agricultural LabourersState/
District
Code
State/
District
Total/ Rural/ Urban
Primary Census Abstract
Persons Males Females Persons Males Females
1 2 3 10 11 12 13 14 15
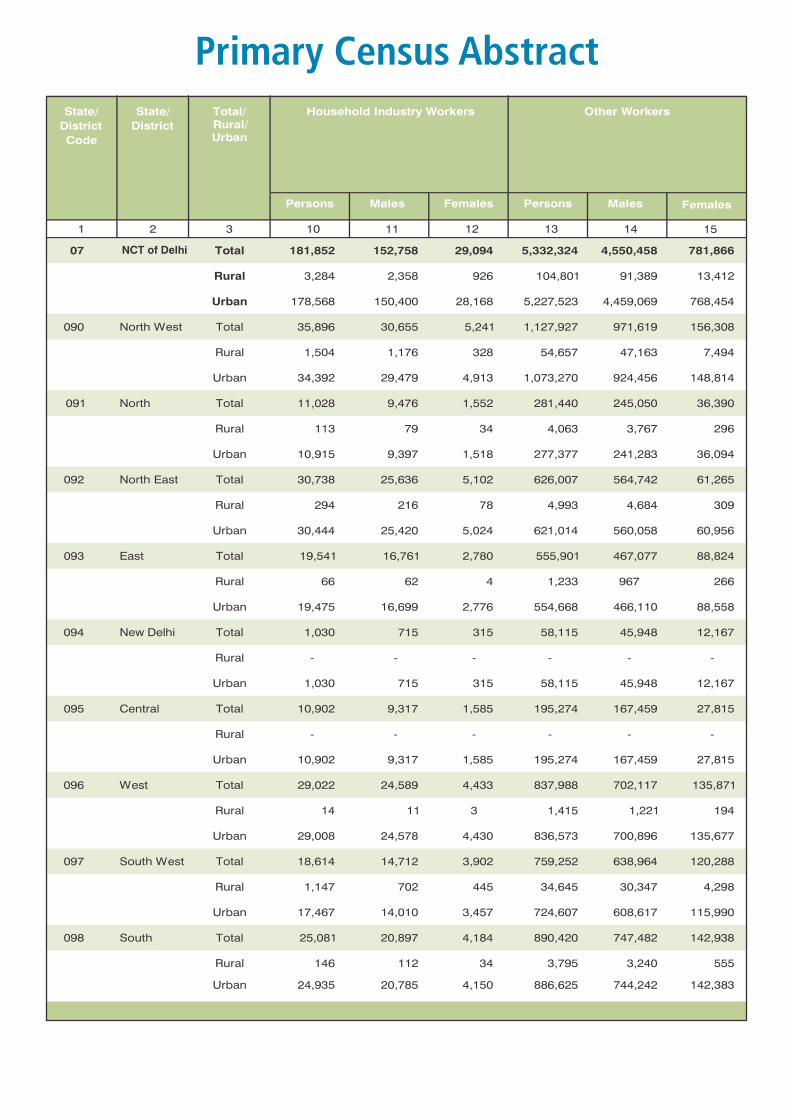
07 NCT of Delhi Total 181,852 152,758 29,094 5,332,324 4,550,458 781,866
Rural 3,284
2,358
926
104,801
91,389
13,412
Urban 178,568
150,400
28,168
5,227,523
4,459,069
768,454
090 North West Total 35,896
30,655
5,241
1,127,927
971,619
156,308
Rural 1,504
1,176
328
54,657
47,163
7,494
Urban 34,392
29,479
4,913
1,073,270
924,456
148,814
091 North Total 11,028
9,476
1,552
281,440
245,050
36,390
Rural 113
79
34
4,063
3,767
296
Urban 10,915
9,397
1,518
277,377
241,283
36,094
092 North East Total 30,738
25,636
5,102
626,007
564,742
61,265
Rural 294
216
78
4,993
4,684
309
Urban 30,444
25,420
5,024
621,014
560,058
60,956
093 East Total 19,541
16,761
2,780
555,901
467,077
88,824
Rural 66
62
4
1,233
967
266
Urban 19,475
16,699
2,776
554,668
466,110
88,558
094 New Delhi Total 1,030
715
315
58,115
45,948
12,167
Rural -
-
-
-
-
-
Urban 1,030
715
315
58,115
45,948
12,167
095 Central Total 10,902
9,317
1,585
195,274
167,459
27,815
Rural -
-
-
-
-
-
Urban 10,902
9,317
1,585
195,274
167,459
27,815
096 West Total 29,022
24,589
4,433
837,988
702,117
135,871
Rural 14
11
3
1,415
1,221
194
Urban 29,008
24,578
4,430
836,573
700,896
135,677
097 South West Total 18,614
14,712
3,902
759,252
638,964
120,288
Rural 1,147
702
445
34,645
30,347
4,298
Urban 17,467
14,010
3,457
724,607
608,617
115,990
098 South Total 25,081
20,897
4,184
890,420
747,482
142,938
Rural 146
112
34
3,795
3,240
555
Urban 24,935
20,785
4,150
886,625
744,242
142,383
Household Industry Workers Other WorkersState/
District
Code
State/
District
Total/ Rural/ Urban
Primary Census Abstract
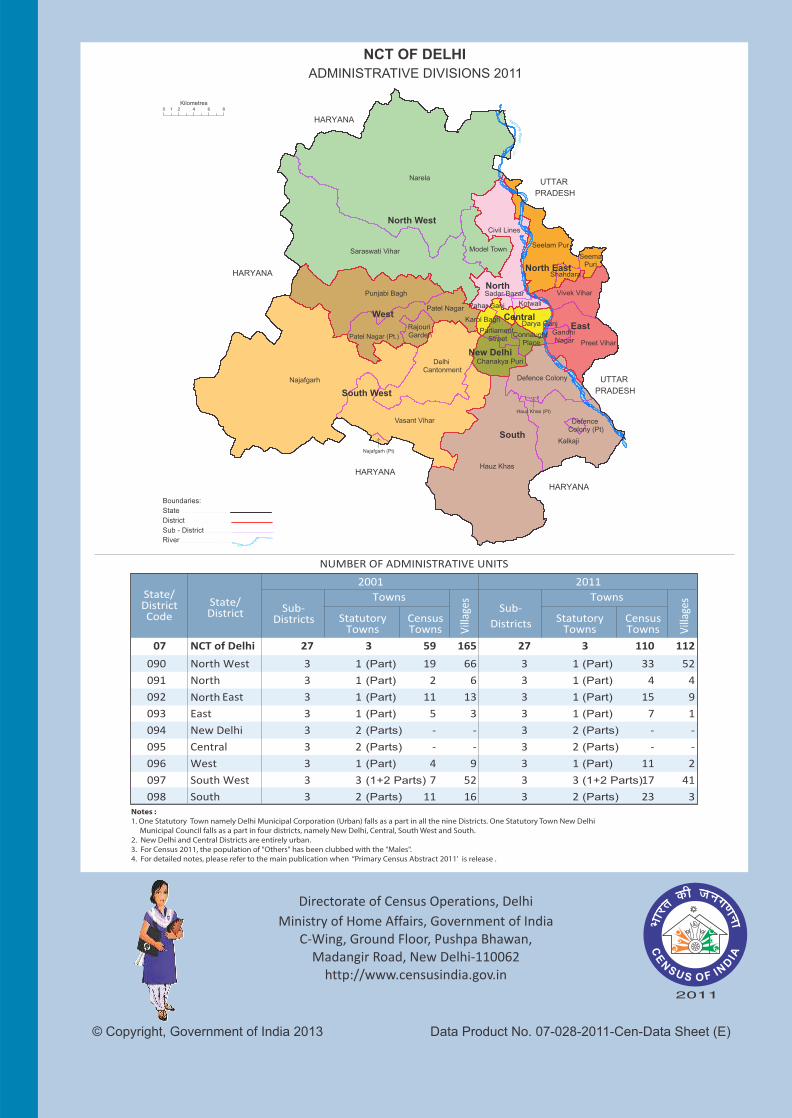
© Government of India 2013Copyright, Data Product No. 07-028-2011-Cen-Data Sheet (E)
Directorate of Census Operations, Delhi
Ministry of Home Affairs, Government of IndiaC-Wing, Ground Floor, Pushpa Bhawan,
Madangir Road, New Delhi-110062http://www.censusindia.gov.in
Notes :1. One Statutory Town namely Delhi Municipal Corporation (Urban) falls as a part in all the nine Districts. One Statutory Town New Delhi Municipal Council falls as a part in four districts, namely New Delhi, Central, South West and South.2. New Delhi and Central Districts are entirely urban.3. For Census 2011, the population of "Others" has been clubbed with the "Males".4. For detailed notes, please refer to the main publication when ‘‘Primary Census Abstract 2011' is release .
(Part) (Part)
(Part)
(Part)
(Part)
(Part)
(Parts)
(1+2 Parts) (1+2 Parts)
(Parts) (Parts)
(Parts) (Parts)
(Parts)
(Part) (Part)
(Part) (Part)
NCT OF DELHI
ADMINISTRATIVE DIVISIONS 2011
0 2 4 6 81
Kilometres
Boundaries:
State
District
Sub - District
River
. . . . . . . . . . . . . . . . . . . . . . .
. . . . . . . . . . . . . . . . . . . . . .
. . . . . . . . . . . . . . . . . . . . . . . . .
. . . . . . . . . . . .
YamunaR
ive
r
UTTAR
PRADESH
UTTAR
PRADESH
HARYANA
HARYANA
HARYANA
HARYANA
Patel Nagar (Pt.)
North West
North
North East
EastCentralWest
New Delhi
South West
South
Narela
Najafgarh
Hauz Khas
Kalkaji
Saraswati Vihar
Vasant Vihar
Punjabi Bagh
Civil Lines
Patel Nagar
Seelam Pur
Preet Vihar
Delhi Cantonment
Defence Colony
Vivek Vihar
Model Town
Chanakya Puri
Darya GanjRajouri Garden
Seema Puri
Kotwali
Shahdara
Parliament Street
Connaught Place
Karol Bagh
Pahar Ganj
Gandhi Nagar
Sadar Bazar
Defence Colony (Pt)
Najafgarh (Pt)
Hauz Khas (Pt)