Sustainability 2018, 10, 3902; doi:10.3390/su10113902 www.mdpi.com/journal/sustainability
Article
The Approach of Including TVOCs Concentration in
the Indoor Environmental Quality Model (IEQ)—
Case Studies of BREEAM Certified Office Buildings
Michał Piasecki 1,*, Mateusz Kozicki 1, Szymon Firląg 2, Anna Goljan 1 and Krystyna Kostyrko 1
1 Departament of Thermal Physic, Acoustic and Environment, Building Research Institute, 00-611 Warsaw,
Poland; [email protected] (M.K.); [email protected] (A.G.); [email protected] (K.K.) 2 The Faculty of Civil Engineering, Warsaw University of Technology, 00-637 Warsaw, Poland;
* Correspondence: [email protected]; Tel.: +48-22-5796-149
Received: 25 September 2018; Accepted: 19 October 2018; Published: 26 October 2018
Abstract: The article analyzes the impact of measured concentrations of Total Volatile Organic
Compounds (TVOC) emissions determined for four BREEAM certified buildings on the Indoor Air
Quality Index (IAQindex) and the overall Indoor Environment Quality index (IEQindex). The IEQindex
indicates the percentage of building users who are satisfied from the indoor environment. In
existing IEQ models, currently the concentration of CO2 is mostly used to evaluate the IAQindex sub-
component. Authors point out that it is recommended to use TVOC instead CO2 at pre-occupant
stage where building is mainly polluted by emission from finishing products. The research provides
the approach where the component related to the emission of TVOCs is implemented to IEQ model.
The first stage of assessment was a test of the volatile organic compounds concentrations in case
study buildings. Secondly, the analysis results were assigned into the number of dissatisfied users
(PD(IAQ)) from the theoretical function given by Jokl-Fanger resulting from the Weber-Fechner
equation. Finally, the overall IEQindex was calculated. The IEQ approach proposed in this paper is
mainly based on a consideration of EN 15251 and scientifically accepted models.
Keywords: Indoor environment quality; IEQ; IAQ; TVOC; BREEAM assessment
1. Introduction
Employees often spend eight–10 h daily in the offices. The working environment affects their
health and productivity. Recent studies show that the costs incurred by the employer, owner of
building and society, caused by poor indoor environment conditions in office buildings, may be
higher than the energy consumption cost in a building [1,2]. A relevant quality of the indoor
environment can improve the productivity of a work and reduce the number of health exemptions
for employees [3]. The authors promote the use of simplified methods to assess the indoor
environmental quality (IEQ). Very useful summary for IEQ literature was done by Al Horr [3]. The
research of authors [4–12], influencing the presented study, indicates that the IEQindex is accepted and
recognized tool for assessing the comfort of building users (in design, pre-occupant stage and post-
occupant stage of buildings), however, sub-models of IEQ model elements still require analysis and
a global harmonization for a wider practical use (e.g., Building Research Establishment
Environmental Assessment Method—BREEAM scheme [13]) and acceptance [14]. The IEQindex
indicates the percentage of building users who are satisfied with the indoor environment, taking into
consideration air quality, visual comfort, acoustic comfort, and thermal comfort (or other) [15]. Each
IEQ sub-component is based on the theoretical sub-model, presented by authors in this study (see
Section 2.2). In existing IEQ models, currently the concentration of CO2 is mainly used to evaluate the
Sustainability 2018, 10, 3902 2 of 24
IAQindex but this requires a deeper discussion. The authors in a paper undertook the research to
include in the practical IEQ assessment (simultaneously with BREEAM assessment) the element
related to the emission of total volatile organic compounds (TVOCs). The analysis of the literature on
volatile organic compounds (VOCs) testing [16–23] and own tests of new office buildings shows that
the TVOC concentration range may vary depending on the construction and finishing materials,
temperature, and ventilation rate. It may change in the range 20–3000 μg/m3, where the value “pass”
required in the BREEAM system is 300 μg/m3. The weakest odor that can be detected by the human
smell sensors has TVOC threshold concentration of 50 μg/m3 [24]. Over 1000 μg/m3 the human
sensory effects may appear. The sensory effects may include dryness, irritation, weak inflammatory
irritation in nose, eyes, skin, and air ways At TVOC concentrations level above 2500 μg/m3, other
types of effects may become of greater concern [25].
Presented research intention was not to solve the problem of TVOC using to assess the indoor
air quality but to provide a method and analyze a possible impact of TVOCs on the IEQ model,
having in mind that TVOC approach would find wider acceptance in future (e.g., BREEAM). The
main need for VOC element implementation into IEQ model is that CO2 emissions are representative
for the air pollution associated with the presence of a significant number of occupants. The VOCs
emissions represent pollution caused mainly by emissions from the construction products inside the
building. Having years of experience in testing building contamination with detailed VOC
compounds, the authors are willing to suggest using the TVOC approach presented later for
determining the IEQindex but considering the fact that it is not a tool to solve the air pollution problems
in a building. The authors are aware of TVOC approach criticism on international level, for example,
one of main academic research center in this area stated in a scientific letter that “TVOC
measurements may be grossly inaccurate and therefore the TVOC concept is unsuitable as a
PASS/FAIL metric” [26].
The choice of internal environment parameters of IEQ model is regulated by EN 15251 [27]
concerning the classification of the indoor environment of buildings. Individual elements of the IEQ
model along with references to literature have been presented in Section 2 on methods.
A main recommendation to include information on the indoor environment in the building for
the energy certificate of the building is given in Article 7 of Directive 2010/31/EU (EPBD) [28]. It was
stated there that for the purposes of energy certification it may be necessary to convert complex
information about the indoor environment into one simple generalized indicator of the quality of the
indoor environment in the building. This generalized indicator is, according to the current analysis
and research, on a global scale is IEQindex, containing four components of the internal environment
quality: thermal comfort, indoor air quality, acoustic comfort, and visual comfort [29,30]. Recently,
among many conscious participants of the construction process, there is a consensus that energy
characteristic without a part concerning the internal environment does not make any sense. In new
buildings with low energy demand, nearly zero-energy buildings (NZEB), there are investigated
problems with ensuring adequate air quality and comfort [31]. According to the author’s experience,
this problem concerns a minimum 30% of new buildings. Nowadays, the methods of commercial
environmental assessment of buildings are becoming popular, taking into account the comfort of use,
however, in the country of the authors, the number of facilities implemented according to the criteria
of these methods is still relatively small—only dozens of buildings (mainly office buildings) for
thousands of new buildings constructed each year. Fulfilling the requirements of national
regulations—e.g., contained in the regulation on the technical building code to be met by buildings
and their location—also does not guarantee that the building will be healthy and user-friendly. The
demand for the methods of assessing building comfort available to every engineer was reflected in
other CEN TC 350 standardization work. In 2014, a standard was published indicating the
methodology for determining the parameters of the indoor environment, e.g., EN 16309 [32].
Standards provides the methodology of the building’s social assessment, indicating the elements that
affect the comfort of use of the building. Currently, various research centers world-wide are working
on the IEQ model, with the assumption of building a simplified model to predict the design values
of the input parameters of the internal environment or to assess the existing buildings, including
Sustainability 2018, 10, 3902 3 of 24
thermal environment, air quality, lighting, and acoustics. The IEQ indicator model used by authors
consists of four partial models of its components:
• anticipated satisfaction with TCindex thermal comfort,
• satisfaction with IAQindex air quality,
• satisfaction with acoustic comfort ACcindex,
• satisfaction with the quality of lighting Lindex.
It is a physical model describing four physical processes affecting the internal environment, in
which the input data are measurable environmental parameters (e.g., temperature, TVOCs, etc.), and
the initial data—the percentage of people satisfied with the indoor environment. The models for
components of the comfort for assessment of case study office building are briefly described later.
The authors, as part of presented research, performed measurements of internal air quality
(VOCs) in new four office buildings BREEAM certified [33]. BREEAM is the international assessment
method based on scientifically based sustainable metrics and indicators that covers a range of
environmental aspects and issues. Its categories consider health and wellbeing (also TVOC), the
energy consumption, pollution, transport, water use, materials, ecology, and management processes
and waste processing. Buildings are rated using a scale of “Pass”, “Good”, “Very Good”, “Excellent”,
and “Outstanding”.
The concentration of TVOC and Formaldehyde were determined including other environmental
parameters. The research intention was to show the potential influence of TVOC concentrations and
contribution into the result of IAQindex and the value of overall IEQindex of the building. Until now,
most authors in the IAQindex analysis have been focused on the concentration of CO2 and less common
on the intensity of the odour in the indoor spaces [1]. The use of TVOC impact in the IEQ model is an
issue taken up by the authors, a new element is the implementation of the function that allows the
conversion of concentrations to the number of dissatisfied users (PD). Analysis of the significance of
TVOC inclusion into IAQ and then IEQ models carried out by the authors gives the possibility to
determine from the values of concentration of TVOC, the PD values. Obtained converted TVOC
emission concentration results were used for the case study buildings IEQ assessment and the results
are presented in the study. Thanks to the tests performed on the BREEAM certified buildings, it was
possible to determine and validate the impact of building TVOC air pollution on the overall IEQindex.
In our experience, the IEQ model (together with its sub-component models) was created mainly
for the purpose of predicting user reactions/satisfaction based on the project/design values. Taking
into account the building design solutions, there is an option to predict user future satisfaction. IEQ
model is theoretical but resulting from the large scale practical assessments made by the authors of
the sub-models. Assessment/measurements in the BREEAM system for new buildings are usually
made when finishing works are completed at pre-occupant stage. The assessment on this stage is to
ensure that the building occupied later will be comfortable, healthy, and safe for users (BREEAM
Excellent). This is a kind of pre-verification of real performance/wellbeing. When building is already
occupied, there might be no option for any high level improvements. Of course the authors are aware
that real user satisfaction surveys offer a real satisfaction values and are the best option, but at pre-
occupant stage presented model is satisfactory enough and technically useful. Therefore, we assess
the theoretical index of the predicted/expected user response to the presence of TVOC in the office
indoor air. The research cited later provides a significant correlation factor between the results
predicted and the results carried later with users when building is occupied. In our future work, we
will focus on this element and we are constantly investigating new buildings.
The quality of indoor air in the context of VOC pollution is significantly affected by emissions
from the construction products. Therefore, before occupation stage, VOC tests carried out are a main
option to detect any air problems in building. This investigation allows us to make good decisions
(like postponed occupation) and the building later may be safe for users (in the case of BREEAM,
recommended level of TVOC is 300 μg/m3).
2. Materials and Methods
Sustainability 2018, 10, 3902 4 of 24
2.1. General Information on Methods Used
The following models and methods were used in the research:
• building assessment criteria acc. to BREEAM system [13,34]
• methods of air sampling in buildings (for VOC tests)
• methods for determining environmental conditions in in-situ buildings
• chromatographic VOC analysis methods (GC/MS) [35]
• IAQ model including TVOC impact (conversion form VOC concentration to PD) [36]
• 4 sub-component models for determining IEQ with the crude weight system [5,9]
• measurement uncertainty scheme for IEQ [37]
The authors put the main attention on the evaluation of TVOC emission and its impact on
IAQindex and finally on IEQindex. The description of methods for estimating other 3 IEQ sub-
components for case studies in the article has been partly simplified however, scientifically accepted
models and results are presented below. The BREEAM guidelines and common ISO/CEN standards
for measuring the parameters of the internal environment were used to determine the values of
thermal and acoustic comfort in buildings. VOC measurements were the basis to calculate the sum
of TVOC. The sum of VOCs was used to determine the IAQindex and then to determine the total IEQindex
for four office buildings. Table 1 shows the most commonly used approaches for calculating the
IEQindex for existing and designed buildings due to the use of actual (real) and theoretical data
resulting from the design and theoretical models of comfort.
Table 1. Types of possible approaches for calculating IEQindex due to the use of actual and predicted
data.
No Types of IEQ Assessment Design Stage
of Building
Existing Building
Pre-Occupancy
Existing Building
Post-Occupancy
1
Predicted IEQ:
The design values of building
technical parameters + theoretical
models of indoor comfort
Yes
(prediction)
Yes
(not recommended)
Yes
(not recommended)
2
Actual IEQ:
The measurement of physical
parameters and real satisfaction
answers (survey) from occupants
N/A N/A
Yes
(recommended)
(very complex, high level of
statistic accuracy is required)
3a
Semi-actual IEQ:
The measurement of physical
parameters and theoretical models
of comfort
N/A
Yes
(prediction)
(recommended)
Yes
(recommended)
3b
Semi-actual IEQ:
The measurement of physical
parameters mixed with the design
values of building technical
parameters and theoretical models
of comfort
N/A Yes
(common approach)
Yes
(common approach)
For the purposes of this study, the authors used semi-actual approach (No 3b, Table 1) including
measurements (VOC and other environmental parameters) and partly use the parameters from the
documentation of building design project. The theoretical models of comfort were used by authors
without conducting the surveys of building users’ satisfaction (buildings were not yet
used/occupied). The TVOC assessment was done at the pre-occupant in accordance to agreement
with Investor to ensure that the building occupied will be comfortable, healthy, and safe for users (at
BREEAM Excellent level). The tests goal was a pre-verification of expected offices
performance/wellbeing mainly IAQ. The authors had the only option to use the semi-actual IEQ
approach mainly because: Authors were asked to provide tests only at pre-occupant stage, authors
were able to do the measurement of physical parameters of TVOC and thermal indoor thermal
parameters, but were not able to provide full tests on other parameters. Design data on the acoustic
performance and visual comfort were verified by accredited laboratory, but is partly used from the
Sustainability 2018, 10, 3902 5 of 24
design data of expected performance and we used such data for a case studies assessment. The
selected approach uses different types of data because so this type is a mixed approach (3b).
2.2. The Equipment and Experimental Tests Methodology
The standardized analytical methods were used to determine the VOCs concentration and
Formaldehyde in the indoor air of case study buildings. Selection of sampling points for each building
was adopted with BREEAM assessor (two representative office zones per tested floor, minimum 2
floors per building). Building No 2 was tested 3 days and 3 weeks after formal final finishing works
and other 3 buildings were tested after 2 months after the all works were finished (at pre-occupancy
stage–no users inside). In every building minimum 2 representative floors were assessed. In the
building No 1 measurements were carried out on 1st, 4th, 6th, 7th, and 8th floor in selected two zones
of office space. In the case of office building No 2, the test was made on the 55th and 47th floor, for
two office zones. For building No 3, the measurements were carried out on 1st, 2nd, 6th, 7th, and 8th
also in two office areas. In the case of office building No 4, a ground floor and 1st floor were tested.
Indoor samples were set up in selected representative office locations, approx. 1.5 m above the
floor, away from windows, doors, potential emission sources and direct sunlight. Air samples were
tested in accordance with the ISO 16000-6: 2011 [35] and ISO 16000-3: 2011 [38]. Air samples were
collected with active sampling procedure by using electronic mass flow controllers, which were
produced by Aparatura Pomiarowa Ochrony Środowiska (local manufacturer). Mass flow controllers
are periodically calibrated by accredited calibration laboratories.
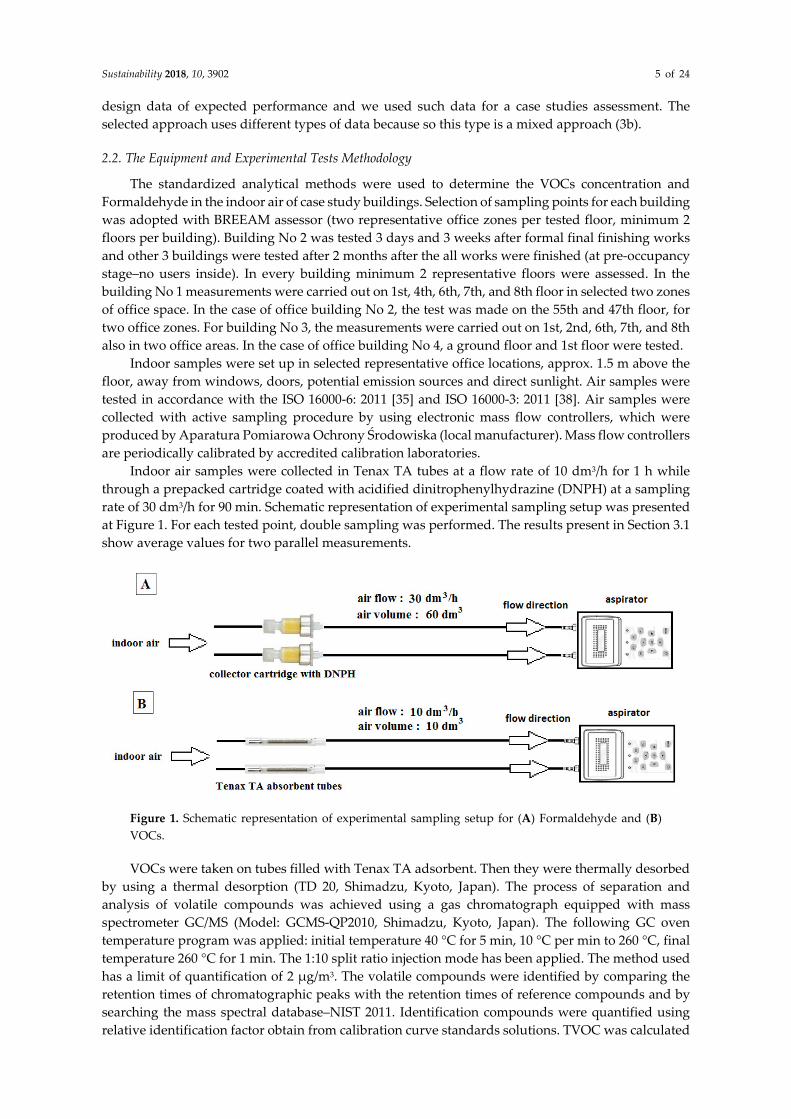
Indoor air samples were collected in Tenax TA tubes at a flow rate of 10 dm3/h for 1 h while
through a prepacked cartridge coated with acidified dinitrophenylhydrazine (DNPH) at a sampling
rate of 30 dm3/h for 90 min. Schematic representation of experimental sampling setup was presented
at Figure 1. For each tested point, double sampling was performed. The results present in Section 3.1
show average values for two parallel measurements.
Figure 1. Schematic representation of experimental sampling setup for (A) Formaldehyde and (B)
VOCs.
VOCs were taken on tubes filled with Tenax TA adsorbent. Then they were thermally desorbed
by using a thermal desorption (TD 20, Shimadzu, Kyoto, Japan). The process of separation and
analysis of volatile compounds was achieved using a gas chromatograph equipped with mass
spectrometer GC/MS (Model: GCMS-QP2010, Shimadzu, Kyoto, Japan). The following GC oven
temperature program was applied: initial temperature 40 °C for 5 min, 10 °C per min to 260 °C, final
temperature 260 °C for 1 min. The 1:10 split ratio injection mode has been applied. The method used
has a limit of quantification of 2 μg/m3. The volatile compounds were identified by comparing the
retention times of chromatographic peaks with the retention times of reference compounds and by
searching the mass spectral database–NIST 2011. Identification compounds were quantified using
relative identification factor obtain from calibration curve standards solutions. TVOC was calculated
Sustainability 2018, 10, 3902 6 of 24
by summing identified and unidentified compounds eluting between n-Hexane and n-Hexadecane.
In order to determine volatile aldehydes, air samples were taken to the collector cartridges with a
solid absorbent, silica gel coated with 2,4-dinitrilophenyl hydrazine (2,4-DNPH), and then subjected
to a laboratory test by HPLC-high-performance liquid chromatography with UV-VIS detection
(Dionex 170S, Dionex, Sunnyvale, California, US) and isocratic pomp (Dionex P580A, Dionex,
Sunnyvale, California, US). The described method has a limit of quantification of 2 μg/m3. Standard
deviation of all TVOC concentration results is ±18% [39] and the expanded uncertainty representing
the 95% confidence interval is 35%.
The acoustic tests of building external walls confirming the designed values were carried out by
accredited laboratory in accordance with ISO 140-5: 1999. The parameter describing the acoustic
insulation of the façade is the reference difference in sound pressure levels, Dtr,2m,nT,w. The sound
pressure level inside the office and outside the building was tested at a distance of two meters from
the building external façade (2 measurement points per each building). In addition to the sound
pressure level measurements, the reverberation time inside the office was also measured. The
instruments used for measurements were: B&K 4165 measuring microphones, acoustic calibrator
B&K 4231, Nor-121, and Nor-140 analyzer and sound source Nor-275. Thermal environmental
measurements were provided using HD32.1 the microclimate multifunctional instrument and the
tests were in accordance to ISO 7726 and ISO 7730 in all points where VOCs were tested
simultaneously. Hea 01 Visual comfort of BREEAM system does not require measurements of
daylight but the daylight illuminance level form executive project was confirmed by using the
instrument MAVOLUX 5032C (USB version) with detector 3C15683 in accordance with EN 12464 by
the BREEAM assessor.
2.3. IEQ Model and Sub-Components Models
EN-15251: 2014 draft is the reference for IEQ model creation [27]. The standard allows to present
a complex indoor information as one overall indicator IEQindex of indoor environmental quality of the
building. Model reliability including uncertainty of measurement and data for this model was
provided clearly in the research paper [37] where the authors also presented the justification for using
the crude-weight method for each sub-component (Table 2). Originally, the IEQ model was expressed
as a polynomial equation consisting of four terms by Wong [40]. The ASHRAE Guideline [41]
recommended that the IEQ model should contain the synergy effect of environmental parameters
included in sub-components and their sensory perception. IEQindex is made of the following sub-
components (SIi): Thermal comfort (TCindex), indoor air quality (IAQindex), acoustics (ACcindex), and
lighting quality (Lindex), and multiplying by their weights Wi (Table 2) gives IEQindex, as follows:
IEQindex = Σ Wi·SIi (1)
Most recognized weighing schemes* for IEQindex assessment (1) are presented in Table 2.
Table 2. Most often used weighing schemes* for IEQindex assessment.
Types of IEQ
Category Weighting Scheme
Number of
Occupants
Thermal
Comfort W1
Indoor Air
Quality W2
Acoustics
W3
Lighting
W4
Wong LT [40] 293 0.31 0.25 0.24 0.19
ASHRAE. PMP [29]
(weighting scheme is adapted to
PN-EN 15251)
52,980 0.12 0.2 0.39 0.29
Crude weighting scheme [5] - 0.25 0.25 0.25 0.25
The authors adopted the crude weighting system, where all elements weight the same (0.25 for
W1–W4), as follows:
IEQindex = 0.25·TCindex + 0.25·IAQindex + 0.25 ACCindex + 0.25·Lindex (2)
Weight value (Table 2) is reported with two decimal points [42] therefore the satisfaction
percentage is reported in the same way.
Sustainability 2018, 10, 3902 7 of 24
The sub-model for determining TCindex was provided by Fanger [43] and based on the indoor
thermal environmental parameters. For buildings with heating and cooling systems, predicted mean
vote indicator (PMV; see ISO-7730 [44]) is commonly used as a reference parameter and also
recommended by the standards EN-15251 [27] or ASHRAE-55: 2010 [44]. In buildings where people
are the main source of pollution, it is commonly recommended to determine the IAQindex by
calculating the percentage of people dissatisfied with the air quality (PDIAQ(CO2)) as a function of CO2
concentration. According to the existing standard EN-15251: 2007, 350 ppm is typically used as the
outdoor CO2 concentration (if not measured). Useful Equation (10) was provided by the European
Concerted Action (ECA, 1992) [45]:
PDIAQ(CO2) = 395·exp(−15.15·CCO2–0.25) (3)
where CCO2 is carbon concentration (ppm) above the outdoor level.
While CO2 is a commonly used indicator for IAQ assessment, it does not represent other sources
of indoor contamination, such as VOC emissions from construction materials, fittings, finishings,
carpets, and floor covering materials. Some of the researchers went towards including into the IAQ
analysis a component associated with the intensity of the odor, which is relatively easy to determine.
If the concentration of an indoor odor may be detected and the curve of odor intensity (OI) may be
known as function OI = f(log10c) and the odorant concentration C in the air is dominant that the other
contaminants can be omitted. It is suggested to use the relation-ship (4) as the model of the sub-model
for the IAQ assessment. Fanger [46] discovered that the relation between an acceptability of IAQ and
OI have a very similar shape for the odorants with various chemical structures. The team of Wargocki
[47] obtained relationship (4) between the dissatisfied percentage (PDIAQ(OI)) and the OI, expressed as
a OI six-level scale from 0 to 5 (no odour = 0 and overpowering odour = 5). Basing on experimental
data, there is the probable option to determine the OI value for a measured concentration (c) and then
to determine the value of PDIAQ(OI) with R2 = 0.95
�����(��) =exp(2.14 ∙ �� − 3.81)
exp(2.14 ∙ �� − 3.81) + 1 (4)
The OI linear relationships of common odorant concentrations can be found in Kostyrko and
Wargocki monography [48].
The authors suggest an alternative approach where the main impact comes from building
materials currently being analyzed is the implementation of the VOCs impact on users. TVOC is
defined by organization of WHO as a set of compounds like Toluene, Xylene, Pinene, 2-(2-
Ethoxyethoxy)ethanol, etc., with a melting points below room temperature and a boiling point in the
range 50–260 °C. The EU-LCI ECA Report [49] provides information that TVOC is to be accepted in
Europe in connection to product emission. It is justified also to use this indicator to quantify VOC
emissions when assessing IAQ. When evaluating the emissions of construction products, TVOC
provides specific additional data to be combined with the EU-LCI concept and CMR approach;
carcinogenic, mutagenic, or toxic to reproduction compounds. The results of practical analyzes [50]
showed that TVOC may exceed about 80% of the national standard. Formaldehyde health risks
exceeded acceptable risk threshold for the adapted and un-adapted persons, 90% and 55% of the
monitoring points were located within the long-term tolerance range of TVOC decibel application,
respectively. According to Wu [39], high levels of Formaldehyde and TVOC may be a factor to asthma
and rhinitis, and may even lead to skin, melanoma, lung, and endocrine-related cancers and of sick
building syndrome (SBS), which have been regularly reported worldwide. In field studies and IAQ
questionnaire survey results in the library rooms in the University of Science and Technology Beijing
in April 2016, the authors get, in the results, the correlations between IAQ and the concentrations of
pollutants as 0.88 (PM2.5), 0.61 (TVOC), 0.58 (Formaldehyde). According to Reference [25], TVOC is
sensed by means of olfactory-smell sensors, the impact of which depends on the magnitude of the
stimulus [16] and [49] is suggested to create a standard for Codour(TVOC) sensory evaluation. Based on
the Yaglou theory and the Weber-Fechner theory, Jokl [32] defined the Lodor(TVOC) as TVOC evaluation
index using the decibel concept. The decibel model is used to characterize a relationship between
TVOC concentration and Predicted Dissatisfaction of indoor air quality in the percentage of
Sustainability 2018, 10, 3902 8 of 24
dissatisfied occupants (PD%). Model provided in the research paper in Reference [36] is based on
large scale research with measured TVOC values in various locations proposed an theoretical
function of TVOC concentration in relation with the percentage dissatisfied (PD) adequately to the
CO2 function:
CTVOC = k(ln(PDTVOC) − 5.98)−4 (5)
The authors transformed this function and obtained;
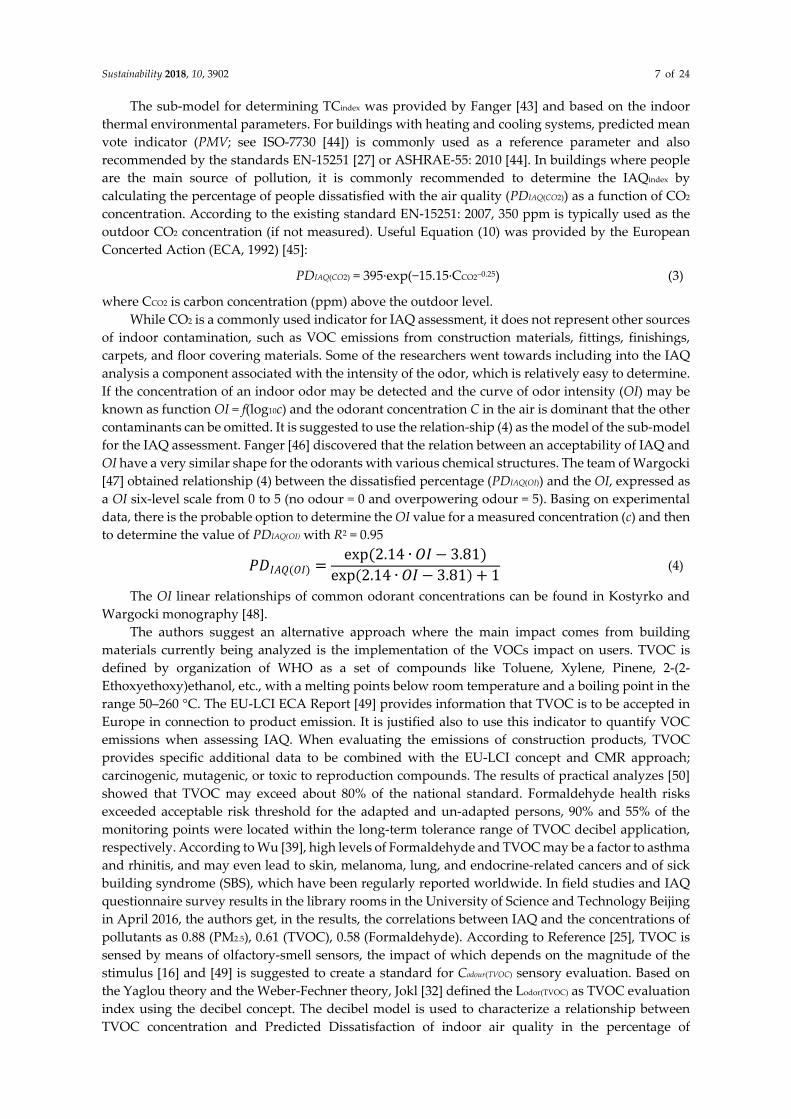
PDTVOC = 405·exp(−11.3·CTVOC0.25) (6)
The experimental research results presented in Figure 2 shows the relationship between
occupants PD and measured TVOC concentrations.
Figure 2. Relationship between TVOC concentrations and Percentage Dissatisfied (PD) for sedentary
persons for results obtained by Jokl and authors.
Besides the experimental function already applied to Equations (5) and (6), a lot of individually
measured TVOC levels from various locations with specific outcome from occupants were available
for validation by authors. The further step of our research is the data base of PD curves for individual
VOC compounds.
For the purpose of determining IEQindex, a simple model of acoustic comfort evaluation was
adopted. The author suggest to use the New Zealand Standard [51] that allows to calculate the increase
in the percentage of people dissatisfied with noise (PD(Acc)) with an increase in the A-weighted noise
level LAeq. The relationship for the increase of PD with the change in noise level from ‘Design’ to
‘Actual’ is
PD(ACc) = 2·(ActualSound_Pressure_Level – DesignSound_Pressure_Level) [dB(A)] (7)
and the calculated result is equal to the increase in percentage dissatisfied in %PD(ACc). Actual sound
level was measured in case study buildings by accredited laboratory and design levels that were
taken from the buildings documentation.
Relationship between a daylight illuminance and probable percentage of people switching on
artificial lighting calculated with Hunt’s equation [52] For a purpose of this research level of daylight
illuminance was measured by an un-accredited method using the MAVOLUX 5032C. Lindex was
determined by measuring [lux] results and a Hunt curve.
The sub-models presented above were used to assess the office buildings and determine the
IEQindex based on measurements of physical properties of the models in accordance to the scheme in
0
10
20
30
40
50
60
70
0 200 400 600 800 1000 1200
PD
TV
OC
[%
]
TVOC [µg/m3]
PD by JoklPD by authors
Sustainability 2018, 10, 3902 9 of 24
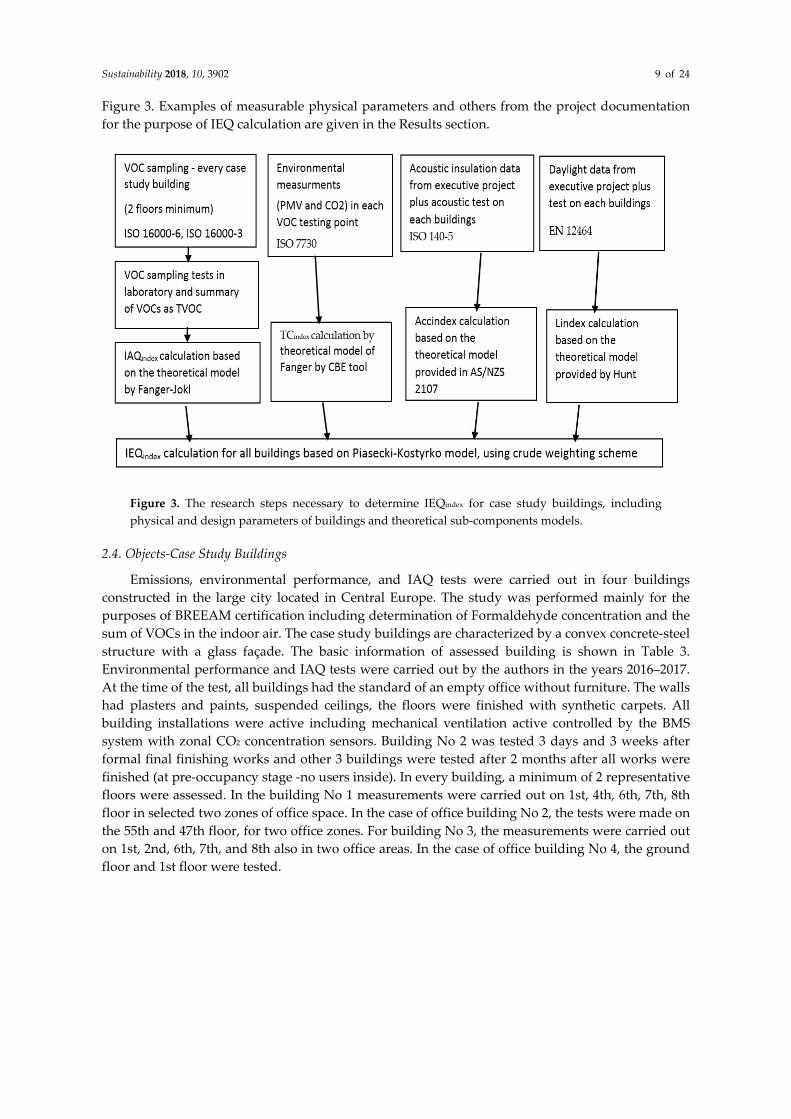
Figure 3. Examples of measurable physical parameters and others from the project documentation
for the purpose of IEQ calculation are given in the Results section.
Figure 3. The research steps necessary to determine IEQindex for case study buildings, including
physical and design parameters of buildings and theoretical sub-components models.
2.4. Objects-Case Study Buildings
Emissions, environmental performance, and IAQ tests were carried out in four buildings
constructed in the large city located in Central Europe. The study was performed mainly for the
purposes of BREEAM certification including determination of Formaldehyde concentration and the
sum of VOCs in the indoor air. The case study buildings are characterized by a convex concrete-steel
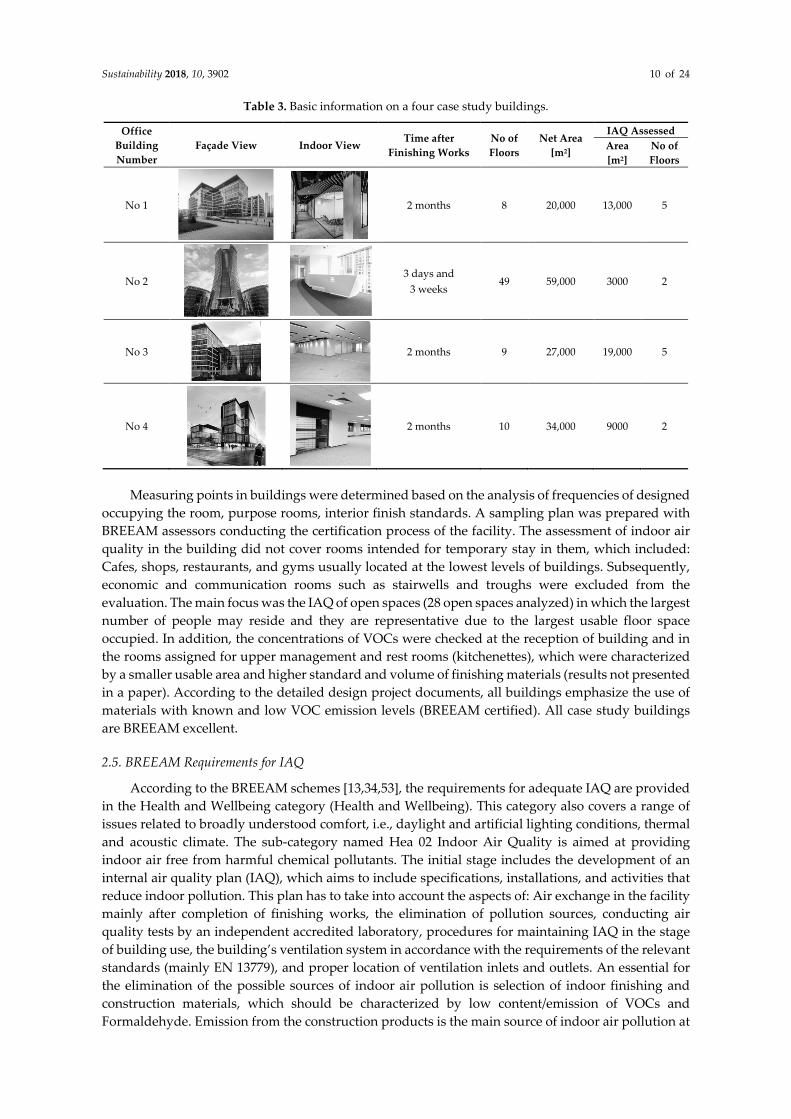
structure with a glass façade. The basic information of assessed building is shown in Table 3.
Environmental performance and IAQ tests were carried out by the authors in the years 2016–2017.
At the time of the test, all buildings had the standard of an empty office without furniture. The walls
had plasters and paints, suspended ceilings, the floors were finished with synthetic carpets. All
building installations were active including mechanical ventilation active controlled by the BMS
system with zonal CO2 concentration sensors. Building No 2 was tested 3 days and 3 weeks after
formal final finishing works and other 3 buildings were tested after 2 months after all works were
finished (at pre-occupancy stage -no users inside). In every building, a minimum of 2 representative
floors were assessed. In the building No 1 measurements were carried out on 1st, 4th, 6th, 7th, 8th
floor in selected two zones of office space. In the case of office building No 2, the tests were made on
the 55th and 47th floor, for two office zones. For building No 3, the measurements were carried out
on 1st, 2nd, 6th, 7th, and 8th also in two office areas. In the case of office building No 4, the ground
floor and 1st floor were tested.
Sustainability 2018, 10, 3902 10 of 24
Table 3. Basic information on a four case study buildings.
Office
Building
Number
Façade View Indoor View Time after
Finishing Works
No of
Floors
Net Area
[m2]
IAQ Assessed
Area
[m2]
No of
Floors
No 1
2 months 8 20,000 13,000 5
No 2
3 days and
3 weeks 49 59,000 3000 2
No 3
2 months 9 27,000 19,000 5
No 4
2 months 10 34,000 9000 2
Measuring points in buildings were determined based on the analysis of frequencies of designed
occupying the room, purpose rooms, interior finish standards. A sampling plan was prepared with
BREEAM assessors conducting the certification process of the facility. The assessment of indoor air
quality in the building did not cover rooms intended for temporary stay in them, which included:
Cafes, shops, restaurants, and gyms usually located at the lowest levels of buildings. Subsequently,
economic and communication rooms such as stairwells and troughs were excluded from the
evaluation. The main focus was the IAQ of open spaces (28 open spaces analyzed) in which the largest
number of people may reside and they are representative due to the largest usable floor space
occupied. In addition, the concentrations of VOCs were checked at the reception of building and in
the rooms assigned for upper management and rest rooms (kitchenettes), which were characterized
by a smaller usable area and higher standard and volume of finishing materials (results not presented
in a paper). According to the detailed design project documents, all buildings emphasize the use of
materials with known and low VOC emission levels (BREEAM certified). All case study buildings
are BREEAM excellent.
2.5. BREEAM Requirements for IAQ
According to the BREEAM schemes [13,34,53], the requirements for adequate IAQ are provided
in the Health and Wellbeing category (Health and Wellbeing). This category also covers a range of
issues related to broadly understood comfort, i.e., daylight and artificial lighting conditions, thermal
and acoustic climate. The sub-category named Hea 02 Indoor Air Quality is aimed at providing
indoor air free from harmful chemical pollutants. The initial stage includes the development of an
internal air quality plan (IAQ), which aims to include specifications, installations, and activities that
reduce indoor pollution. This plan has to take into account the aspects of: Air exchange in the facility
mainly after completion of finishing works, the elimination of pollution sources, conducting air
quality tests by an independent accredited laboratory, procedures for maintaining IAQ in the stage
of building use, the building’s ventilation system in accordance with the requirements of the relevant
standards (mainly EN 13779), and proper location of ventilation inlets and outlets. An essential for
the elimination of the possible sources of indoor air pollution is selection of indoor finishing and
construction materials, which should be characterized by low content/emission of VOCs and
Formaldehyde. Emission from the construction products is the main source of indoor air pollution at
Sustainability 2018, 10, 3902 11 of 24
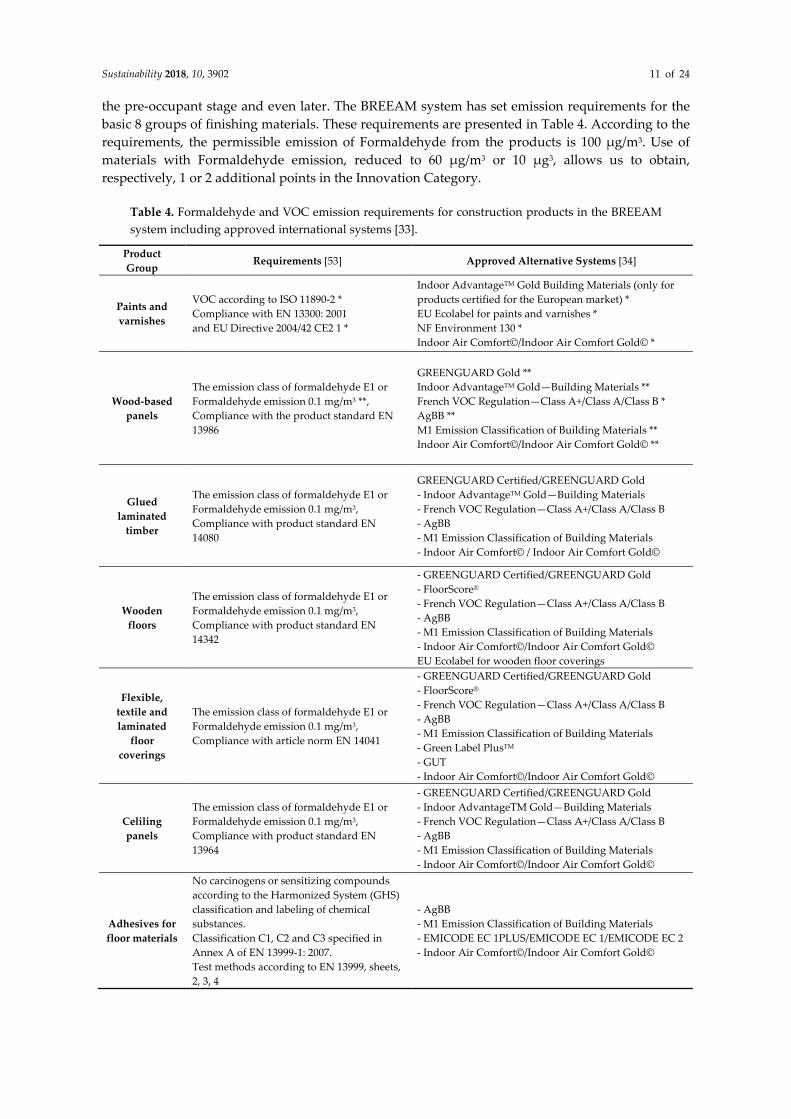
the pre-occupant stage and even later. The BREEAM system has set emission requirements for the
basic 8 groups of finishing materials. These requirements are presented in Table 4. According to the
requirements, the permissible emission of Formaldehyde from the products is 100 μg/m3. Use of
materials with Formaldehyde emission, reduced to 60 μg/m3 or 10 μg3, allows us to obtain,
respectively, 1 or 2 additional points in the Innovation Category.
Table 4. Formaldehyde and VOC emission requirements for construction products in the BREEAM
system including approved international systems [33].
Product
Group Requirements [53] Approved Alternative Systems [34]
Paints and
varnishes
VOC according to ISO 11890-2 *
Compliance with EN 13300: 2001
and EU Directive 2004/42 CE2 1 *
Indoor AdvantageTM Gold Building Materials (only for
products certified for the European market) *
EU Ecolabel for paints and varnishes *
NF Environment 130 *
Indoor Air Comfort©/Indoor Air Comfort Gold© *
Wood-based
panels
The emission class of formaldehyde E1 or
Formaldehyde emission 0.1 mg/m3 **,
Compliance with the product standard EN
13986
GREENGUARD Gold **
Indoor AdvantageTM Gold—Building Materials **
French VOC Regulation—Class A+/Class A/Class B *
AgBB **
M1 Emission Classification of Building Materials **
Indoor Air Comfort©/Indoor Air Comfort Gold© **
Glued
laminated
timber
The emission class of formaldehyde E1 or
Formaldehyde emission 0.1 mg/m3,
Compliance with product standard EN
14080
GREENGUARD Certified/GREENGUARD Gold
- Indoor AdvantageTM Gold—Building Materials
- French VOC Regulation—Class A+/Class A/Class B
- AgBB
- M1 Emission Classification of Building Materials
- Indoor Air Comfort© / Indoor Air Comfort Gold©
Wooden
floors
The emission class of formaldehyde E1 or
Formaldehyde emission 0.1 mg/m3,
Compliance with product standard EN
14342
- GREENGUARD Certified/GREENGUARD Gold
- FloorScore®
- French VOC Regulation—Class A+/Class A/Class B
- AgBB
- M1 Emission Classification of Building Materials
- Indoor Air Comfort©/Indoor Air Comfort Gold©
EU Ecolabel for wooden floor coverings
Flexible,
textile and
laminated
floor
coverings
The emission class of formaldehyde E1 or
Formaldehyde emission 0.1 mg/m3,
Compliance with article norm EN 14041
- GREENGUARD Certified/GREENGUARD Gold
- FloorScore®
- French VOC Regulation—Class A+/Class A/Class B
- AgBB
- M1 Emission Classification of Building Materials
- Green Label PlusTM
- GUT
- Indoor Air Comfort©/Indoor Air Comfort Gold©
Celiling
panels
The emission class of formaldehyde E1 or
Formaldehyde emission 0.1 mg/m3,
Compliance with product standard EN
13964
- GREENGUARD Certified/GREENGUARD Gold
- Indoor AdvantageTM Gold—Building Materials
- French VOC Regulation—Class A+/Class A/Class B
- AgBB
- M1 Emission Classification of Building Materials
- Indoor Air Comfort©/Indoor Air Comfort Gold©
Adhesives for
floor materials
No carcinogens or sensitizing compounds
according to the Harmonized System (GHS)
classification and labeling of chemical
substances.
Classification C1, C2 and C3 specified in
Annex A of EN 13999-1: 2007.
Test methods according to EN 13999, sheets,
2, 3, 4
- AgBB
- M1 Emission Classification of Building Materials
- EMICODE EC 1PLUS/EMICODE EC 1/EMICODE EC 2
- Indoor Air Comfort©/Indoor Air Comfort Gold©
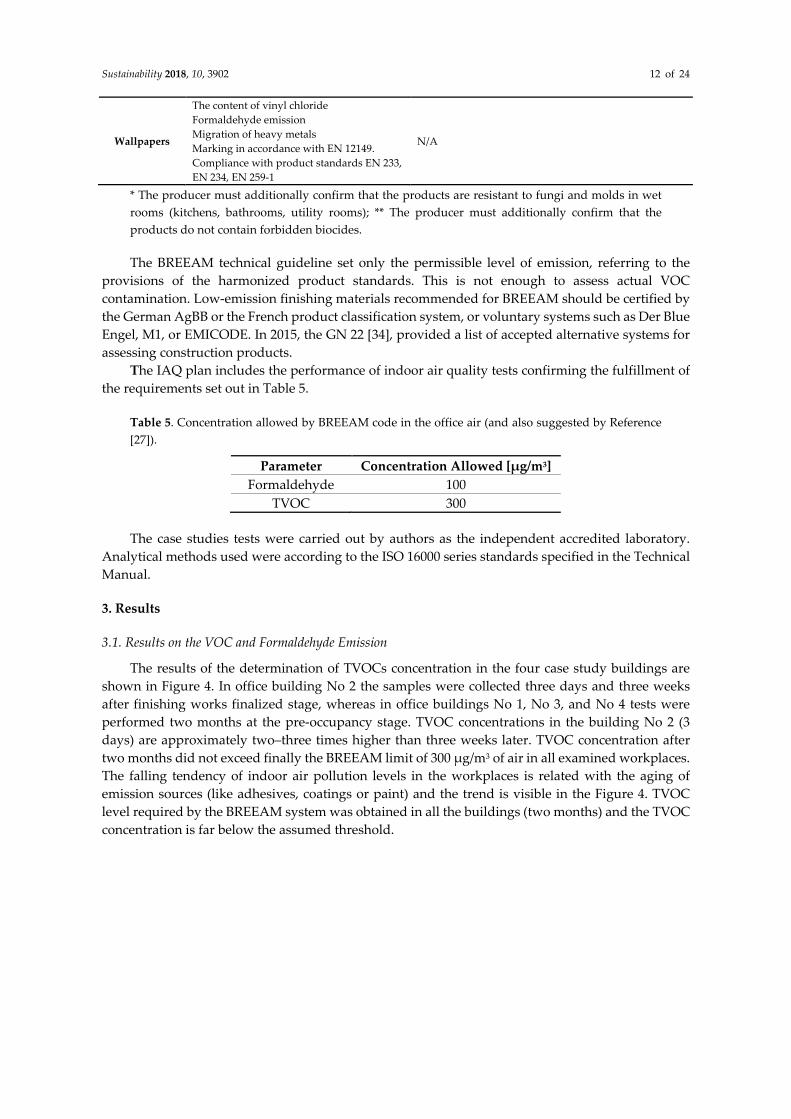
Sustainability 2018, 10, 3902 12 of 24
Wallpapers
The content of vinyl chloride
Formaldehyde emission
Migration of heavy metals
Marking in accordance with EN 12149.
Compliance with product standards EN 233,
EN 234, EN 259-1
N/A
* The producer must additionally confirm that the products are resistant to fungi and molds in wet
rooms (kitchens, bathrooms, utility rooms); ** The producer must additionally confirm that the
products do not contain forbidden biocides.
The BREEAM technical guideline set only the permissible level of emission, referring to the
provisions of the harmonized product standards. This is not enough to assess actual VOC
contamination. Low-emission finishing materials recommended for BREEAM should be certified by
the German AgBB or the French product classification system, or voluntary systems such as Der Blue
Engel, M1, or EMICODE. In 2015, the GN 22 [34], provided a list of accepted alternative systems for
assessing construction products.
The IAQ plan includes the performance of indoor air quality tests confirming the fulfillment of
the requirements set out in Table 5.
Table 5. Concentration allowed by BREEAM code in the office air (and also suggested by Reference
[27]).
Parameter Concentration Allowed [µg/m3]
Formaldehyde 100
TVOC 300
The case studies tests were carried out by authors as the independent accredited laboratory.
Analytical methods used were according to the ISO 16000 series standards specified in the Technical
Manual.
3. Results
3.1. Results on the VOC and Formaldehyde Emission
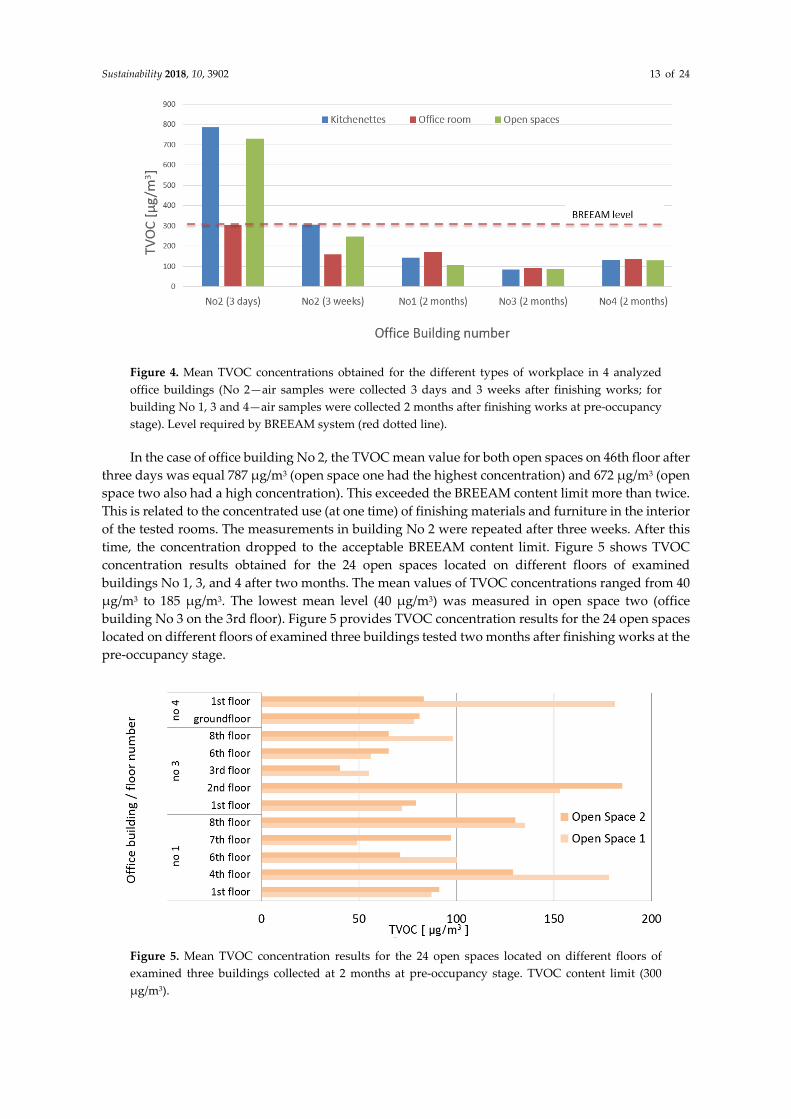
The results of the determination of TVOCs concentration in the four case study buildings are
shown in Figure 4. In office building No 2 the samples were collected three days and three weeks
after finishing works finalized stage, whereas in office buildings No 1, No 3, and No 4 tests were
performed two months at the pre-occupancy stage. TVOC concentrations in the building No 2 (3
days) are approximately two–three times higher than three weeks later. TVOC concentration after
two months did not exceed finally the BREEAM limit of 300 μg/m3 of air in all examined workplaces.
The falling tendency of indoor air pollution levels in the workplaces is related with the aging of
emission sources (like adhesives, coatings or paint) and the trend is visible in the Figure 4. TVOC
level required by the BREEAM system was obtained in all the buildings (two months) and the TVOC
concentration is far below the assumed threshold.
Sustainability 2018, 10, 3902 13 of 24
Figure 4. Mean TVOC concentrations obtained for the different types of workplace in 4 analyzed
office buildings (No 2—air samples were collected 3 days and 3 weeks after finishing works; for
building No 1, 3 and 4—air samples were collected 2 months after finishing works at pre-occupancy
stage). Level required by BREEAM system (red dotted line).
In the case of office building No 2, the TVOC mean value for both open spaces on 46th floor after
three days was equal 787 μg/m3 (open space one had the highest concentration) and 672 μg/m3 (open
space two also had a high concentration). This exceeded the BREEAM content limit more than twice.
This is related to the concentrated use (at one time) of finishing materials and furniture in the interior
of the tested rooms. The measurements in building No 2 were repeated after three weeks. After this
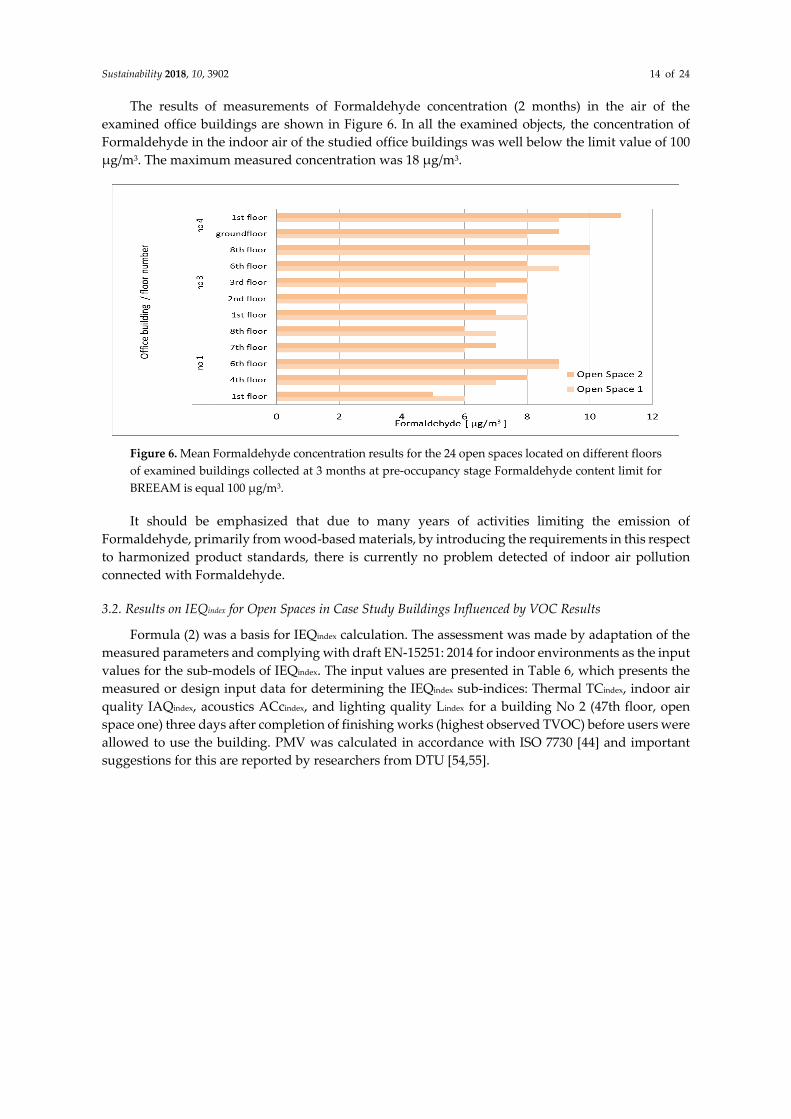
time, the concentration dropped to the acceptable BREEAM content limit. Figure 5 shows TVOC
concentration results obtained for the 24 open spaces located on different floors of examined
buildings No 1, 3, and 4 after two months. The mean values of TVOC concentrations ranged from 40
μg/m3 to 185 μg/m3. The lowest mean level (40 μg/m3) was measured in open space two (office
building No 3 on the 3rd floor). Figure 5 provides TVOC concentration results for the 24 open spaces
located on different floors of examined three buildings tested two months after finishing works at the
pre-occupancy stage.
Figure 5. Mean TVOC concentration results for the 24 open spaces located on different floors of
examined three buildings collected at 2 months at pre-occupancy stage. TVOC content limit (300
μg/m3).
Sustainability 2018, 10, 3902 14 of 24
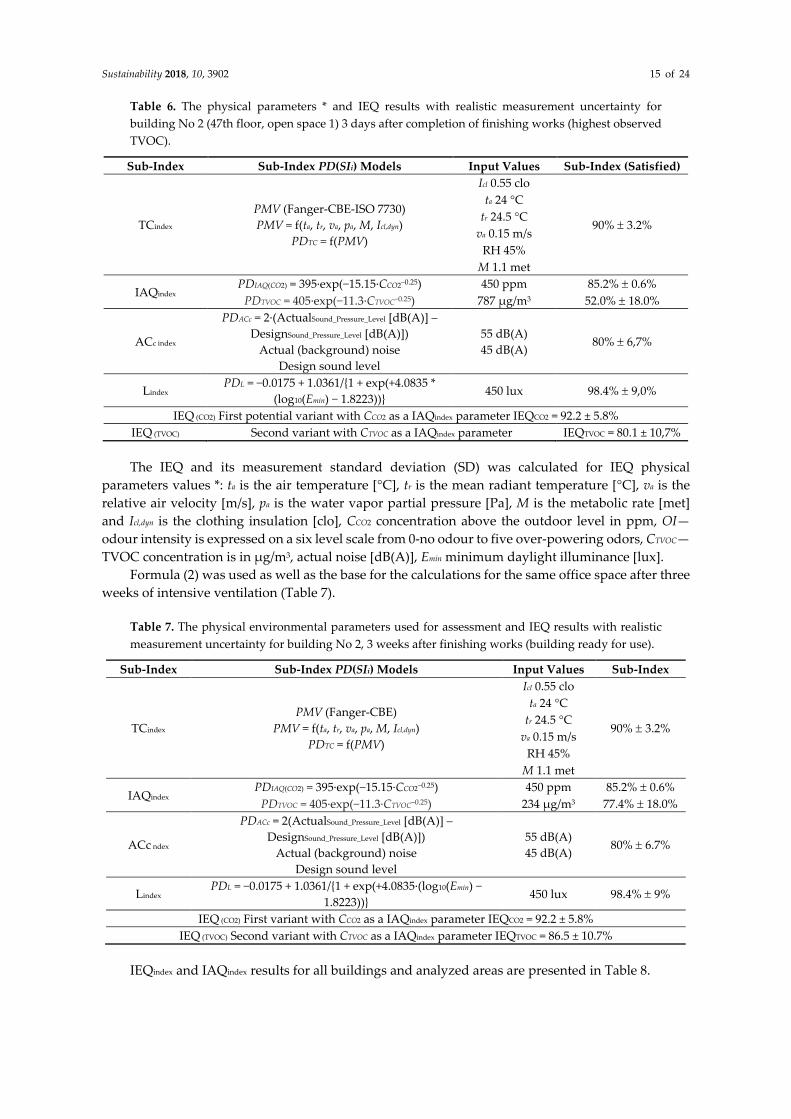
The results of measurements of Formaldehyde concentration (2 months) in the air of the
examined office buildings are shown in Figure 6. In all the examined objects, the concentration of
Formaldehyde in the indoor air of the studied office buildings was well below the limit value of 100
μg/m3. The maximum measured concentration was 18 μg/m3.
Figure 6. Mean Formaldehyde concentration results for the 24 open spaces located on different floors
of examined buildings collected at 3 months at pre-occupancy stage Formaldehyde content limit for
BREEAM is equal 100 μg/m3.
It should be emphasized that due to many years of activities limiting the emission of
Formaldehyde, primarily from wood-based materials, by introducing the requirements in this respect
to harmonized product standards, there is currently no problem detected of indoor air pollution
connected with Formaldehyde.
3.2. Results on IEQindex for Open Spaces in Case Study Buildings Influenced by VOC Results
Formula (2) was a basis for IEQindex calculation. The assessment was made by adaptation of the
measured parameters and complying with draft EN-15251: 2014 for indoor environments as the input
values for the sub-models of IEQindex. The input values are presented in Table 6, which presents the
measured or design input data for determining the IEQindex sub-indices: Thermal TCindex, indoor air
quality IAQindex, acoustics ACcindex, and lighting quality Lindex for a building No 2 (47th floor, open
space one) three days after completion of finishing works (highest observed TVOC) before users were
allowed to use the building. PMV was calculated in accordance with ISO 7730 [44] and important
suggestions for this are reported by researchers from DTU [54,55].
Sustainability 2018, 10, 3902 15 of 24
Table 6. The physical parameters * and IEQ results with realistic measurement uncertainty for
building No 2 (47th floor, open space 1) 3 days after completion of finishing works (highest observed
TVOC).
Sub-Index Sub-Index PD(SIi) Models Input Values Sub-Index (Satisfied)
TCindex
PMV (Fanger-CBE-ISO 7730)
PMV = f(ta, tr, va, pa, M, Icl,dyn)
PDTC = f(PMV)
Icl 0.55 clo
90% 3.2%
ta 24 °C
tr 24.5 °C
va 0.15 m/s
RH 45%
M 1.1 met
IAQindex PDIAQ(CO2) = 395·exp(−15.15·CCO2−0.25) 450 ppm 85.2% 0.6%
PDTVOC = 405·exp(−11.3·CTVOC−0.25) 787 μg/m3 52.0% 18.0%
ACc index
PDACc = 2·(ActualSound_Pressure_Level [dB(A)] –
DesignSound_Pressure_Level [dB(A)])
Actual (background) noise
Design sound level
55 dB(A)
45 dB(A) 80% 6,7%
Lindex PDL = −0.0175 + 1.0361/{1 + exp(+4.0835 *
(log10(Emin) − 1.8223))} 450 lux 98.4% 9,0%
IEQ (CO2) First potential variant with CCO2 as a IAQindex parameter IEQCO2 = 92.2 ± 5.8%
IEQ (TVOC) Second variant with CTVOC as a IAQindex parameter IEQTVOC = 80.1 ± 10,7%
The IEQ and its measurement standard deviation (SD) was calculated for IEQ physical
parameters values *: ta is the air temperature [°C], tr is the mean radiant temperature [°C], va is the
relative air velocity [m/s], pa is the water vapor partial pressure [Pa], M is the metabolic rate [met]
and Icl,dyn is the clothing insulation [clo], CCO2 concentration above the outdoor level in ppm, OI—
odour intensity is expressed on a six level scale from 0-no odour to five over-powering odors, CTVOC—
TVOC concentration is in μg/m3, actual noise [dB(A)], Emin minimum daylight illuminance [lux].
Formula (2) was used as well as the base for the calculations for the same office space after three
weeks of intensive ventilation (Table 7).
Table 7. The physical environmental parameters used for assessment and IEQ results with realistic
measurement uncertainty for building No 2, 3 weeks after finishing works (building ready for use).
Sub-Index Sub-Index PD(SIi) Models Input Values Sub-Index
TCindex
PMV (Fanger-CBE)
PMV = f(ta, tr, va, pa, M, Icl,dyn)
PDTC = f(PMV)
Icl 0.55 clo
90% 3.2%
ta 24 °C
tr 24.5 °C
va 0.15 m/s
RH 45%
M 1.1 met
IAQindex PDIAQ(CO2) = 395·exp(−15.15·CCO2–0.25) 450 ppm 85.2% 0.6%
PDTVOC = 405·exp(−11.3·CTVOC−0.25) 234 μg/m3 77.4% 18.0%
ACc ndex
PDACc = 2(ActualSound_Pressure_Level [dB(A)] –
DesignSound_Pressure_Level [dB(A)])
Actual (background) noise
Design sound level
55 dB(A)
45 dB(A) 80% 6.7%
Lindex PDL = −0.0175 + 1.0361/{1 + exp(+4.0835·(log10(Emin) −
1.8223))} 450 lux 98.4% 9%
IEQ (CO2) First variant with CCO2 as a IAQindex parameter IEQCO2 = 92.2 ± 5.8%
IEQ (TVOC) Second variant with CTVOC as a IAQindex parameter IEQTVOC = 86.5 ± 10.7%
IEQindex and IAQindex results for all buildings and analyzed areas are presented in Table 8.
Sustainability 2018, 10, 3902 16 of 24
Table 8. Results for IAQindex and IEQindex for four case study BREEAM certified buildings.
IAQindex (%) IEQindex (%)
Building Space Assessed Open Space 1 Open Space 2 Open Space 1 Open Space 2
No 1
1st floor (2 months) 89.99 89.56 89.60 89.49
4th floor (2 months) 81.64 85.83 87.51 88.56
6th floor (2 months) 88.64 91.74 89.26 90.04
7th floor (2 months) 94.34 88.94 90.69 89.34
8th floor (2 months) 85.29 85.74 88.42 88.54
No 2
45th floor (3 weeks) 86.20 76.18 88.65 86.14
46th floor (3 days) 52.04 55.99 80.11 81.10
46th floor (3 weeks) 77.47 75.85 86.47 86.06
No 3
1st floor 91.63 90.85 90.01 89.81
2nd floor 83.70 81.09 88.03 87.37
3rd floor 93.61 95.47 90.50 90.97
6th floor 93.49 92.43 90.47 90.21
8th floor 88.84 92.43 89.31 90.21
No 4 groundfloor 90.96 90.63 89.84 89.76
1st floor 81.40 90.42 87.45 89.70
4. Discussion of Results
4.1. VOC/TVOC
The concentration value of the VOC emitted from the construction and finishing products is not
a constant value. Increased concentration of the emitted compounds in the indoor air most often
occurs during the construction of the building, in particular at the stage of indoor finishing works.
The results obtained in the presented studies show that in the period immediately after completion
of finishing works in indoor spaces, there may be temporarily increased concentration of TVOC,
which systematically decreases over time. This phenomenon should be included in the developed
building air quality plan. Therefore, it would be beneficial to maintain a certain period for newly
finished rooms. In the case of building No 2, the research showed that the tests carried out
immediately after finishing works in this case after three days yielded results that significantly
exceeded the BREEAM limit (two times higher). It should be concluded that an acceptable level
should be reached after about a minimum of three weeks from the completion of the work. Generally
speaking, TVOC concentration was acceptable low or very low in the open spaces in all buildings
after two months, in 70% of cases did not exceed 100 μg/m3. The similar results were reported by
other authors, for example in the research paper in Reference [39].
The example (other research of authors) providing a similar trend of significant decrease in the
concentration of VOCs emitted from the selected high-emissive indoor product over time is presented
in Figure 7. Tests were performed using a standard chamber method with described test parameters
provided in a standard [56]. Chamber tests and in-situ analyzes on the building show a highly
correlated trend of TVOC emission decline over time.
Sustainability 2018, 10, 3902 17 of 24
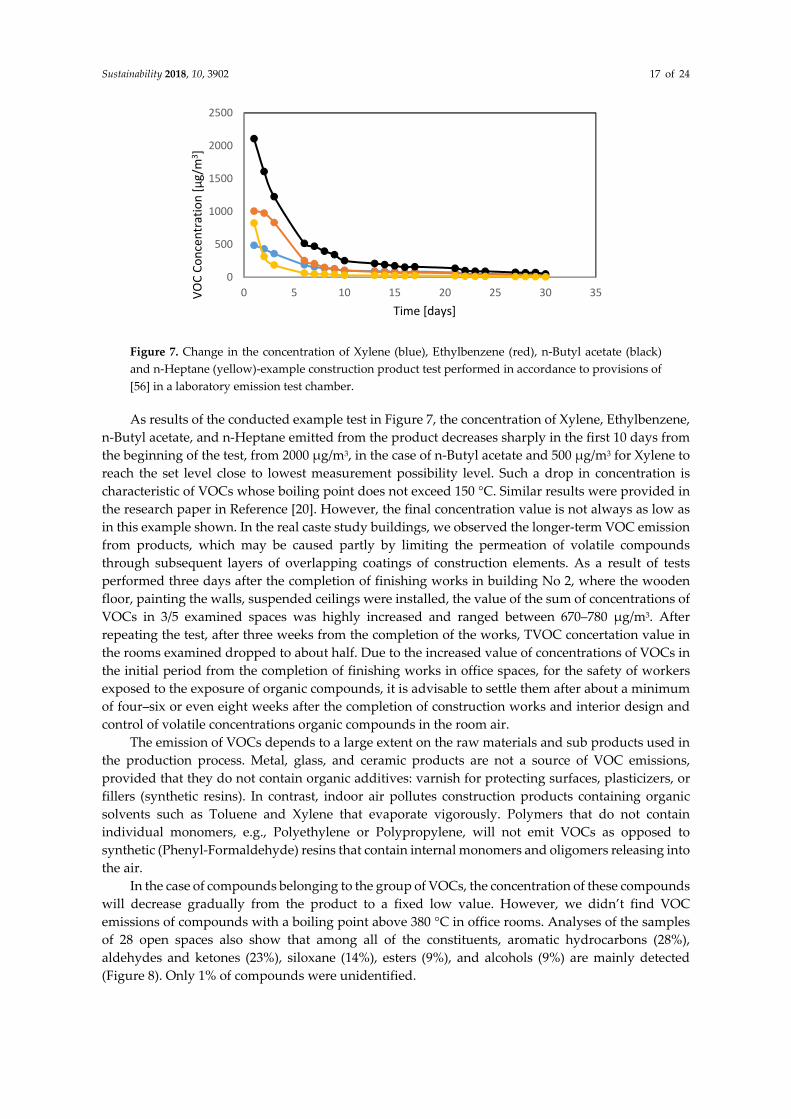
Figure 7. Change in the concentration of Xylene (blue), Ethylbenzene (red), n-Butyl acetate (black)
and n-Heptane (yellow)-example construction product test performed in accordance to provisions of
[56] in a laboratory emission test chamber.
As results of the conducted example test in Figure 7, the concentration of Xylene, Ethylbenzene,
n-Butyl acetate, and n-Heptane emitted from the product decreases sharply in the first 10 days from
the beginning of the test, from 2000 μg/m3, in the case of n-Butyl acetate and 500 μg/m3 for Xylene to
reach the set level close to lowest measurement possibility level. Such a drop in concentration is
characteristic of VOCs whose boiling point does not exceed 150 °C. Similar results were provided in
the research paper in Reference [20]. However, the final concentration value is not always as low as
in this example shown. In the real caste study buildings, we observed the longer-term VOC emission
from products, which may be caused partly by limiting the permeation of volatile compounds
through subsequent layers of overlapping coatings of construction elements. As a result of tests
performed three days after the completion of finishing works in building No 2, where the wooden
floor, painting the walls, suspended ceilings were installed, the value of the sum of concentrations of
VOCs in 3/5 examined spaces was highly increased and ranged between 670–780 μg/m3. After
repeating the test, after three weeks from the completion of the works, TVOC concertation value in
the rooms examined dropped to about half. Due to the increased value of concentrations of VOCs in
the initial period from the completion of finishing works in office spaces, for the safety of workers
exposed to the exposure of organic compounds, it is advisable to settle them after about a minimum
of four–six or even eight weeks after the completion of construction works and interior design and
control of volatile concentrations organic compounds in the room air.
The emission of VOCs depends to a large extent on the raw materials and sub products used in
the production process. Metal, glass, and ceramic products are not a source of VOC emissions,
provided that they do not contain organic additives: varnish for protecting surfaces, plasticizers, or
fillers (synthetic resins). In contrast, indoor air pollutes construction products containing organic
solvents such as Toluene and Xylene that evaporate vigorously. Polymers that do not contain
individual monomers, e.g., Polyethylene or Polypropylene, will not emit VOCs as opposed to
synthetic (Phenyl-Formaldehyde) resins that contain internal monomers and oligomers releasing into
the air.
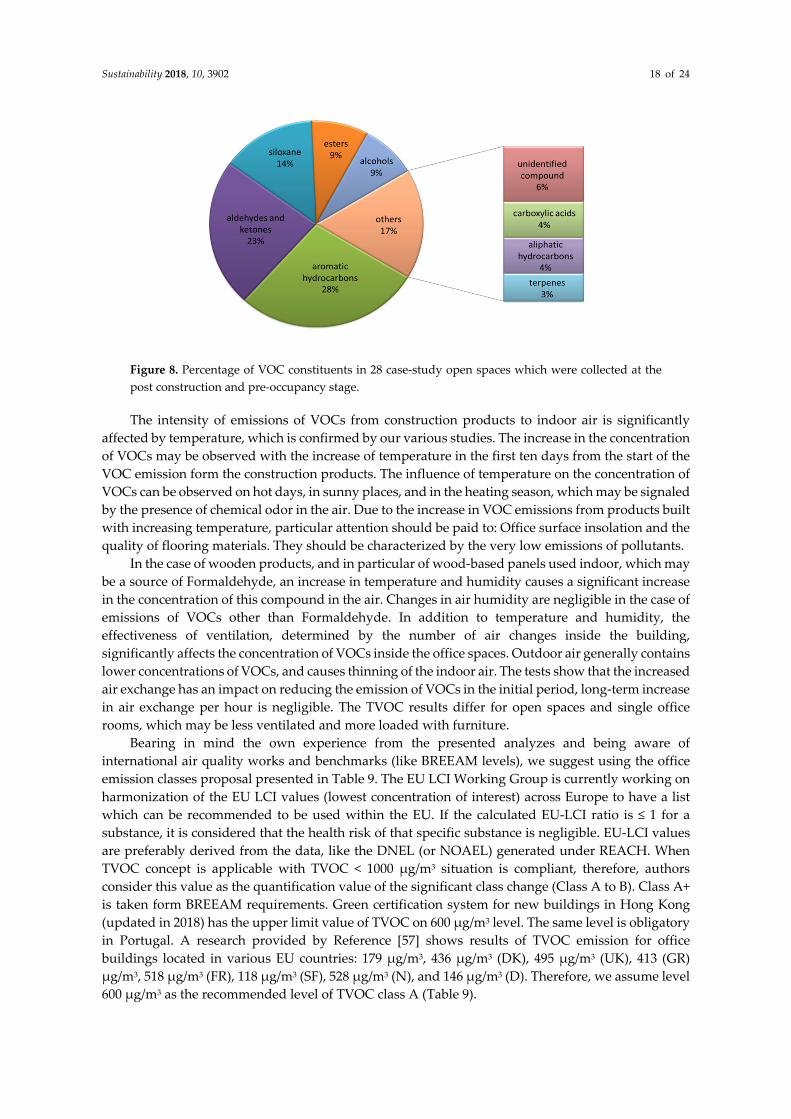
In the case of compounds belonging to the group of VOCs, the concentration of these compounds
will decrease gradually from the product to a fixed low value. However, we didn’t find VOC
emissions of compounds with a boiling point above 380 °C in office rooms. Analyses of the samples
of 28 open spaces also show that among all of the constituents, aromatic hydrocarbons (28%),
aldehydes and ketones (23%), siloxane (14%), esters (9%), and alcohols (9%) are mainly detected
(Figure 8). Only 1% of compounds were unidentified.
0
500
1000
1500
2000
2500
0 5 10 15 20 25 30 35VO
C C
on
cen
trat
ion
[µ
g/m
3]
Time [days]
Sustainability 2018, 10, 3902 18 of 24
Figure 8. Percentage of VOC constituents in 28 case-study open spaces which were collected at the
post construction and pre-occupancy stage.
The intensity of emissions of VOCs from construction products to indoor air is significantly
affected by temperature, which is confirmed by our various studies. The increase in the concentration
of VOCs may be observed with the increase of temperature in the first ten days from the start of the
VOC emission form the construction products. The influence of temperature on the concentration of
VOCs can be observed on hot days, in sunny places, and in the heating season, which may be signaled
by the presence of chemical odor in the air. Due to the increase in VOC emissions from products built
with increasing temperature, particular attention should be paid to: Office surface insolation and the
quality of flooring materials. They should be characterized by the very low emissions of pollutants.
In the case of wooden products, and in particular of wood-based panels used indoor, which may
be a source of Formaldehyde, an increase in temperature and humidity causes a significant increase
in the concentration of this compound in the air. Changes in air humidity are negligible in the case of
emissions of VOCs other than Formaldehyde. In addition to temperature and humidity, the
effectiveness of ventilation, determined by the number of air changes inside the building,
significantly affects the concentration of VOCs inside the office spaces. Outdoor air generally contains
lower concentrations of VOCs, and causes thinning of the indoor air. The tests show that the increased
air exchange has an impact on reducing the emission of VOCs in the initial period, long-term increase
in air exchange per hour is negligible. The TVOC results differ for open spaces and single office
rooms, which may be less ventilated and more loaded with furniture.
Bearing in mind the own experience from the presented analyzes and being aware of
international air quality works and benchmarks (like BREEAM levels), we suggest using the office
emission classes proposal presented in Table 9. The EU LCI Working Group is currently working on
harmonization of the EU LCI values (lowest concentration of interest) across Europe to have a list
which can be recommended to be used within the EU. If the calculated EU-LCI ratio is ≤ 1 for a
substance, it is considered that the health risk of that specific substance is negligible. EU-LCI values
are preferably derived from the data, like the DNEL (or NOAEL) generated under REACH. When
TVOC concept is applicable with TVOC < 1000 μg/m3 situation is compliant, therefore, authors
consider this value as the quantification value of the significant class change (Class A to B). Class A+
is taken form BREEAM requirements. Green certification system for new buildings in Hong Kong
(updated in 2018) has the upper limit value of TVOC on 600 μg/m3 level. The same level is obligatory
in Portugal. A research provided by Reference [57] shows results of TVOC emission for office
buildings located in various EU countries: 179 μg/m3, 436 μg/m3 (DK), 495 μg/m3 (UK), 413 (GR)
μg/m3, 518 μg/m3 (FR), 118 μg/m3 (SF), 528 μg/m3 (N), and 146 μg/m3 (D). Therefore, we assume level
600 μg/m3 as the recommended level of TVOC class A (Table 9).
Sustainability 2018, 10, 3902 19 of 24
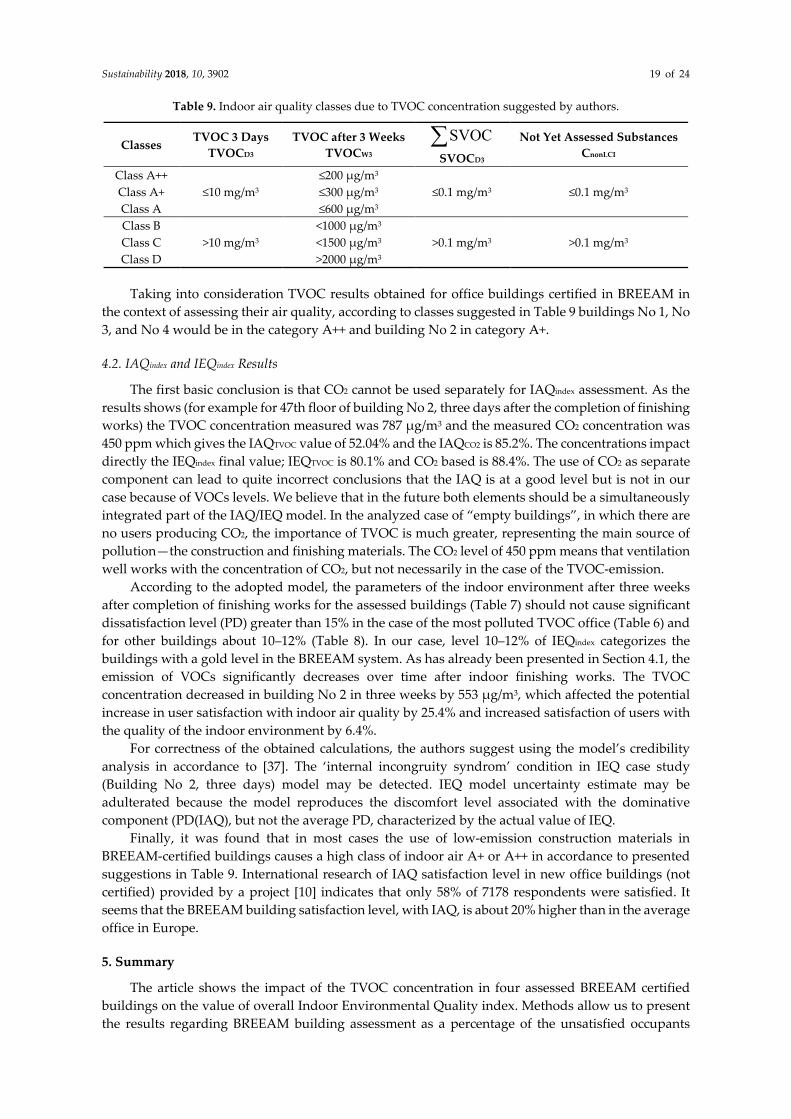
Table 9. Indoor air quality classes due to TVOC concentration suggested by authors.
Classes TVOC 3 Days
TVOCD3
TVOC after 3 Weeks
TVOCW3
SVOC
SVOCD3
Not Yet Assessed Substances
CnonLCI
Class A++
≤10 mg/m3
≤200 μg/m3
≤0.1 mg/m3 ≤0.1 mg/m3 Class A+ ≤300 μg/m3
Class A ≤600 μg/m3
Class B
>10 mg/m3
<1000 μg/m3
>0.1 mg/m3 >0.1 mg/m3 Class C <1500 μg/m3
Class D >2000 μg/m3
Taking into consideration TVOC results obtained for office buildings certified in BREEAM in
the context of assessing their air quality, according to classes suggested in Table 9 buildings No 1, No
3, and No 4 would be in the category A++ and building No 2 in category A+.
4.2. IAQindex and IEQindex Results
The first basic conclusion is that CO2 cannot be used separately for IAQindex assessment. As the
results shows (for example for 47th floor of building No 2, three days after the completion of finishing
works) the TVOC concentration measured was 787 μg/m3 and the measured CO2 concentration was
450 ppm which gives the IAQTVOC value of 52.04% and the IAQCO2 is 85.2%. The concentrations impact
directly the IEQindex final value; IEQTVOC is 80.1% and CO2 based is 88.4%. The use of CO2 as separate
component can lead to quite incorrect conclusions that the IAQ is at a good level but is not in our
case because of VOCs levels. We believe that in the future both elements should be a simultaneously
integrated part of the IAQ/IEQ model. In the analyzed case of “empty buildings”, in which there are
no users producing CO2, the importance of TVOC is much greater, representing the main source of
pollution—the construction and finishing materials. The CO2 level of 450 ppm means that ventilation
well works with the concentration of CO2, but not necessarily in the case of the TVOC-emission.
According to the adopted model, the parameters of the indoor environment after three weeks
after completion of finishing works for the assessed buildings (Table 7) should not cause significant
dissatisfaction level (PD) greater than 15% in the case of the most polluted TVOC office (Table 6) and
for other buildings about 10–12% (Table 8). In our case, level 10–12% of IEQindex categorizes the
buildings with a gold level in the BREEAM system. As has already been presented in Section 4.1, the
emission of VOCs significantly decreases over time after indoor finishing works. The TVOC
concentration decreased in building No 2 in three weeks by 553 μg/m3, which affected the potential
increase in user satisfaction with indoor air quality by 25.4% and increased satisfaction of users with
the quality of the indoor environment by 6.4%.
For correctness of the obtained calculations, the authors suggest using the model’s credibility
analysis in accordance to [37]. The ‘internal incongruity syndrom’ condition in IEQ case study
(Building No 2, three days) model may be detected. IEQ model uncertainty estimate may be
adulterated because the model reproduces the discomfort level associated with the dominative
component (PD(IAQ), but not the average PD, characterized by the actual value of IEQ.
Finally, it was found that in most cases the use of low-emission construction materials in
BREEAM-certified buildings causes a high class of indoor air A+ or A++ in accordance to presented
suggestions in Table 9. International research of IAQ satisfaction level in new office buildings (not
certified) provided by a project [10] indicates that only 58% of 7178 respondents were satisfied. It
seems that the BREEAM building satisfaction level, with IAQ, is about 20% higher than in the average
office in Europe.
5. Summary
The article shows the impact of the TVOC concentration in four assessed BREEAM certified
buildings on the value of overall Indoor Environmental Quality index. Methods allow us to present
the results regarding BREEAM building assessment as a percentage of the unsatisfied occupants
Sustainability 2018, 10, 3902 20 of 24
(PD). IEQ model (together with its sub-component models) was used mainly for the purpose of
predicting of user reactions/satisfaction. Taking into account the building design solutions and
measurements on the pre occupant stage there was an option to predict user satisfaction. All detected
TVOC concentration in four buildings were acceptably low or very low in the all tested open spaces
in all buildings after two months and in 70% of cases TVOC level did not exceed 100 μg/m3. The
predicted satisfaction IAQindex in all case study buildings (two month after finishing works) is in the
range of 81 to 94% while the overall IEQindex is in the range 87–91%. As presented, BREEAM excellent
buildings satisfaction level with IAQ is approx. 20% higher than in the average new office in the EU.
Comparisons with results obtained by other citied authors shows that BREEAM excellent buildings
have a higher level of indoor quality expressed as IEQindex.
The model of IAQTVOC allows including TVOC concentration as sub component of IEQ model,
this is a new idea. The results presented justified need to use other factors than CO2 as sub-
components in the IEQ model (to include a direct impact on the users from the indoor construction
materials). IEQe(CO2) indicated “a good level” of indoor air quality (85% satisfied) when one of the
buildings was contaminated with VOCs emissions. Without TVOC research (52% satisfied), the
interpretation of a good overall IAQ in a building would be wrong.
A way of determining indoor comfort based on measurements of TVOC influencing people’s
perception is a very simplified approach, but has a practical dimension for a building benchmarking.
CO2 tests should be performed only with consideration of occupants, that is, during the building
operation, and TVOC may be provided at pre-occupant stage, which is an additional advantage of
the presented approach.
The authors are aware on TVOC discussion on international level and do not want to present
any final position on this issue, but want to show the possibilities that are behind it. The significant
potential influence of TVOC concentration on IAQindex results on the IEQindex has been demonstrated,
as an example, TVOC emission at the level of about 700 μg/m3 decrease IAQindex almost 30% and the
overall IEQindex by 10%.
The studies provide suggestions for the building TVOC emission classes presented in the paper
(Table 9). The decreasing trend of changing in time TVOC concentration was detected, for buildings,
is longer than in the laboratory chambers.
Our results show that it was possible in the case of the most polluted office space to reduce up
to almost 60% of the TVOC pollution level in three weeks and further expected decrease (after two
months) is half of the value after two weeks. TVOC measurement for BREEAM is suggested to be
done a few days from the completion of finishing works, after a few weeks until reaching the
recommended level of indoor air quality. Taking into consideration the results, there is an advice to
building owners to maintain a minimum of a three week period without introducing users into the
indoor offices.
The positive impact of low emission construction and finishing product on a high class of indoor
office air of BREEAM buildings were proved, and thus it can indirectly promote the sustainable
construction market.
Author Contributions: Conceptualization, M.P. and K.K.; Methodology, M.P. and K.K.; Validation, M.K., K.K.,
S.F.; Formal Analysis, M.P., A.G., M.K.; Investigation, M.P.; Resources, M.P.; Writing—Original Draft
Preparation, M.P.; Writing—Review & Editing, K.K., S.F., M.K.; Visualization, M.P.; Supervision, K.K.; Project
Administration, M.P.
Funding: This research received no external funding.
Acknowledgments: We would like to thank Mark Bomberg for inspiration to explore the topic.
Conflicts of Interest: The authors declare no conflict of interest.
Sustainability 2018, 10, 3902 21 of 24
Abbreviations
The following abbreviations are used in this manuscript:
ACcindex index of acoustic comfort
ACinput increasing level of input noise
CCO2 carbon dioxide concentration (ppm)
Emin minimum daylight illuminance (lux)
IAQindex index of indoor air quality—percentage of persons satisfied with indoor air quality
IAQ(CO2)index index of indoor air quality—percentage of persons satisfied with CO2 level
IAQ(OI)index indoor air quality index for odorous air- percentage of persons satisfied with odorous air
Icl,dyn clothing insulation (m2 K/W)
IEQindex Indoor Environmental quality index—overall percentage of persons satisfied with Indoor
Quality
IEQcrude IEQ with crude weighting scheme (the mean value of IEQ)—“0.25” for each of 4
components
LCI lowest concentration interest
M metabolic rate (W/m2)
OI odour intensity level (six-level scale)
pa is the water vapour partial pressure (Pa)
PD percentage of persons dissatisfied (percentage dissatisfied)
PD(ACc) percentage of persons dissatisfied with acoustic comfort level
PD(IAQ(CO2)) percentage of persons dissatisfied with IAQ by CO2
PD(IAQ(TVOC)) percentage of persons dissatisfied with IAQ by TVOC concentration
PD(IEQ) percentage of persons dissatisfied with IEQ (indoor environmental discomfort index)
PD(L) percentage of persons dissatisfied with lighting quality
PD(TC) percentage of persons dissatisfied with thermal comfort level
PMP ASHRAE Performance Measurement Protocols weighting scheme
PMV Predicted Mean Vote (ISO 7730)
PMV PMV model by ISO 7730 according to (Fanger, 1998)
PMV value according to (Fanger, 1998) thermal comfort equations by CBE e-table
PPD predicted percentage of persons dissatisfied
SD standard deviation
ta air temperature (°C)
TCindex thermal comfort index
tg black globe temperature (°C)
tr mean radiant temperature (°C)
Uoverall combined overall uncertainty of SIi
va relative air velocity (m/s)
W1 weight for thermal comfort
W2 weight for indoor air quality
W3 weight for acoustic comfort
W4 weight for lighting quality
Wi weight for each IEQ sub-component model
VOC volatile organic compounds
References
1. Al horr, Y.; Arif, M.; Katafygiotou, M.; Mazroei, A.; Kaushik, A.; Elsarrag, E. Impact of indoor
environmental quality on occupant well-being and comfort: A review of the literature. Int. J. Sustain. Built
Environ. 2016, 5, 1–11.
2. Heerwagen, J. Green buildings, organizational success and occupant productivity. Build. Res. Inf. 2000, 28,
353–367.
3. Al Horr, Y.; Arif, M.; Kaushik, A.; Mazroei, A.; Katafygiotou, M.; Elsarrag, E. Occupant productivity and
office indoor environment quality: A review of the literature. Build. Environ. 2016, 105, 369–389.
4. Geng, Y.; Ji, W.; Lin, B.; Zhu, Y. The impact of thermal environment on occupant IEQ perception and
productivity. Build. Environ. 2017, 121, 158–167.
5. Piasecki, M.; Kostyrko, K.; Pykacz, S. Indoor environmental quality assessment: Part 1: Choice of the indoor
environmental quality sub-component models. J. Build. Phys. 2017, 41, 264–289.
Sustainability 2018, 10, 3902 22 of 24
6. Frontczak, M.; Schiavon, S.; Goins, J.; Arens, E.; Zhang, H.; Wargocki, P. Quantitative relationships between
occupant satisfaction and satisfaction aspects of indoor environmental quality and building design. Indoor
Air 2012, 22, 119–131.
7. Lee, Y.S.; Guerin, D.A. Indoor Environmental Quality Related to Occupant Satisfaction and Performance
in LEED-certified Buildings. Indoor Built Environ. 2009, 18, doi:10.1177/1420326X09105455.
8. Mihai, T.; Iordache, V. Determining the Indoor Environment Quality for an Educational Building. Energy
Procedia 2016, 85, 566–574.
9. Ncube, M.; Riffat, S. Developing an indoor environment quality tool for assessment of mechanically
ventilated office buildings in the UK—A preliminary study. Build. Environ. 2012, 53, 26–33.
10. Sakellaris, I.A.; Saraga, D.E.; Mandin, C.; Roda, C.; Fossati, S.; De Kluizenaar, Y.; Carrer, P.;
Dimitroulopoulou, S.; Mihucz, V.G.; Szigeti, T.; et al. Perceived indoor environment and occupants’
comfort in European ‘Modern’ office buildings: The OFFICAIR Study. Int. J. Environ. Res. Public Health 2016,
13, 444.
11. Sarbu, I.; Sebarchievici, C. Aspects of indoor environmental quality assessment in buildings. Energy Build.
2013, 60, 410–419.
12. Nimlyat, P.S. Indoor environmental quality performance and occupants’ satisfaction [IEQPOS] as
assessment criteria for green healthcare building rating. Build. Environ. 2018, 144, 598–610.
13. BRE. TST SD 233 BREEAM International New Construction 2016. Technical Manual SD 233 2.0; BRE Global
Ltd.: Bricket Wood, UK, 2016.
14. Laskari, M.; Karatasou, S.; Santamouris, M. A methodology for the determination of indoor environmental
quality in residential buildings through the monitoring of fundamental environmental parameters: A
proposed Dwelling Environmental Quality Index. Indoor Built Environ. 2017, 26, 813–827.
15. Ncube, M. The Development of a Methodology for a Tool for Rapid Assessment of Indoor Environment
Quality in Office Buildings in the UK. Ph.D. Thesis, University of Nottingham, Nottingham, UK, 2012.
16. Mečiarová, L.; Vilčeková, S.; Burdová, E.K.; Kiselák, J. Factors effecting the total volatile organic compound
(TVOC) concentrations in slovak households. Int. J. Environ. Res. Public Health 2017. 14, 1443.
17. Molhave, L. Volatile organic compounds, indoor air quality and health. Indoor Air 1991, 1, 357–376
18. Noguchi, M.; Mizukoshi, A.; Yanagisawa, Y.; Yamasaki, A. Measurements of volatile organic compounds
in a newly built daycare center. Int. J. Environ. Res. Public Health 2016, 7, 736.
19. Kozicki, M.; Piasecki, M.; Goljan, A.; Deptuła, H.; Niesłochowski, A. Emission of Volatile Organic
Compounds (VOCs) from Dispersion and Cementitious Waterproofing Products. Sustainability 2018, 10,
2178.
20. Andersson, K. TVOC and health in non-industrial indoor environments report from a nordic scientific
consensus meeting at l̊ngholmen in Stockholm, 1996. Indoor Air 1997, 13, 736.
21. Zamani, M.E.; Jalaludin, J.; Shaharom, N. Indoor air quality and prevalence of sick building syndrome
among office workers in two different offices in selangor. Am. J. Appl. Sci. 2013, 10, 1140.
22. Tao, H.; Fan, Y.; Li, X.; Zhang, Z.; Hou, W. Investigation of formaldehyde and TVOC in underground malls
in Xi’an, China: Concentrations, sources, and affecting factors. Build. Environ. 2015, 85, 85–93.
23. De Gennaro, G.; Dambruoso, P.R.; Loiotile, A.D.; Di Gilio, A.; Giungato, P.; Tutino, M.; Marzocca, A.;
Mazzone, A.; Palmisani, J.; Porcelli, F. Indoor air quality in schools. Environ. Chem. Lett. 2014, 12, 467–482.
24. Jokl, M.V. Evaluation of indoor air quality using the decibel concept based on carbon dioxide and TVOC.
Build. Environ. 2000, 35, 677–697.
25. Mølhave, L.; Clausen, G.; Berglund, B.; De Ceaurriz, J.; Kettrup, A.; Lindvall, T.; Maroni, M.; Pickering,
A.C.; Risse, U.; Rothweiler, H.; et al. Total Volatile Organic Compounds (TVOC) in Indoor Air Quality
Investigation. Eur. Communies 1997, 7, 225–240.
26. Hodgson, A. Moving Beyond TVOC—Reasons to Avoid the Use of TVOC as Pass/Fail Criterion for
Assessing VOC Emissions from Products—Building Ecology. Available online:
http://www.buildingecology.com/articles/tvoc-what-is-its-value (accessed on 23 August 2018).
27. CEN TC 156. Guideline for Using Indoor Environmental Input Parameters for the Design and Assessment of Energy
Performance of Buildings; Comité Européen de Normalisation: Brussels, Belgium, 2014.
28. European Union. Directive 2010/31/EU of the European Parliament and of the Council of 19 May 2010 on
the energy performance of buildings (recast). Off. J. Eur. Union 2010, 18, 2010.
29. American Society of Heating, Refrigerating and Air-Conditioning Engineers (ASHRAE). Performance
Measurement Protocols for Commercial Buildings: Best Practices Guide; ASHRAE: Atlanta, GA, USA, 2012.
Sustainability 2018, 10, 3902 23 of 24
30. Wong, L.T.; Mui, K.W.; Tsang, T.W. An open acceptance model for indoor environmental quality (IEQ).
Build. Environ. 2018, 142, 371–378.
31. Węglarz, A.; Pierzchalski, M. Comparing construction technologies of single family housing with regard
of minimizing embodied energy and embodied carbon. E3S Web Conf. 2018, 49,
doi:10.1051/e3sconf/20184900126.
32. CEN. EN 16309: 2015 Sustainable Construction—Assessment of the Social/Utility Quality of the Building—
Methods; Comité Européen de Normalisation: Brussels, Belgium, 2015.
33. BRE. Available online: https://www.breeam.com/ (accessed on 30 August 2018).
34. BRE. Guidance GN22: BREEAM Recognised Schemes for VOC Emissions from Building Products V1.0 August
2015; BRE Global Ltd.: Watford, UK, 2015.
35. ISO/TC 146. ISO 16000-6: 2011 Indoor Air—Part 6: Determination of Volcanic Organic Compounds in Tenax TA
Sorbent, Thermal Desorption and Gas Chromatography Using MS or MS/FID; International Organization for
Standardization: Geneva, Switzerland, 2011.
36. Jokl, M.V. Indoor Air Quality Assessment Based on Human Physiology—Part 1. New Criteria Proposal.
Acta Polytech. 2003, 43, 31–37.
37. Piasecki, M.; Kostyrko, K.B. Indoor environmental quality assessment, part 2: Model reliability analysis. J.
Build. Phys. 2018, 5, doi:10.1177/1744259118754391.
38. ISO 16000-3: 2011. Indoor Air—Part 3: Determination of Formaldehyde and Other Carbonyl Compounds—Active
Sampling Method; International Organization for Standardization: Geneva, Switzerland, 2011.
39. Wu, Y.; Lu, Y.; Chou, D.-C. Indoor air quality investigation of a university library based on field
measurement and questionnaire survey. Int. J. Low-Carbon Technol. 2018, 13, 148–160.
40. Wong, L.T.; Mui, K.W.; Hui, P.S. A multivariate-logistic model for acceptance of indoor environmental
quality (IEQ) in offices. Build. Environ. 2008, 43, 1–6.
41. American Society of Heating, Refrigerating and Air-Conditioning Engineers (ASHRAE). Guideline 10—
Interactions Affecting the Achievement of Acceptable Indoor Environments; ASHRAE: Atlanta, GA, USA, 2011.
42. Heinzerling, D.; Schiavon, S.; Webster, T.; Arens, E. Indoor environmental quality assessment models: A
literature review and a proposed weighting and classification scheme. Build. Environ. 2013, 70, 210–222.
43. Fang, L.; Clausen, G.; Fanger, P.O. Impact of temperature and humidity on the perception of indoor air
quality. Indoor Air 1998, 8, 80–90.
44. International Organization for Standardization. Ergonomics of the Thermal Environment—Analytical
Determination and Interpretation of Thermal Comfort Using Calculation of the PMV and PPD Indices and Local
Thermal Comfort Criteria; International Organization for Standardization: Geneva, Switzerland, 2015.
45. Luxembourg Office of European Comission. European Concerted Action (ECA). 1992. Indoor Air Quality and
Its Impact on Man; Report No. 1; Luxembourg Office of European Comission: Brussels, Belgium, 1992.
46. Gunnarsen, L.; Fanger, P.O. Adaptation to indoor air pollution. Environ. Int. 1992, 18, 43–54.
47. Wargocki, P.; Knudsen, H.N.; Krzyzanowska, J. Some methodological aspects of sensory testing of indoor
air quality. In Proceedings of the CLIMA, 10th REVHA World Congress Sustainable Energy Use in
Buildings’, Antalya, Turkey, 9–12 May 2010.
48. Kostyrko, K.B.; Wargocki, P. Pomiary Zapachów i Odczuwalnej Jakości Powietrza w Pomieszczeniach; ITB: Berlin,
Germany, 2012.
49. JRC. Report No 29- Harmonisation Framework for Health Based Evaluation of Indoor Emissions from Construction
Products in the European Union Using the EU -LCI Concept; Luxembourg Office of European Comission:
Brussels, Belgium, 2013.
50. Chen, X.; Li, F.; Liu, C.; Yang, J.; Zhang, J.; Peng, C. Monitoring, human health risk assessment and
optimized management for typical pollutants in indoor air from random Families of University staff,
Wuhan City, China. Sustainability 2017, 97, 1115.
51. Australian Standards. AS/NZS 2107:2000 Acoustics—Recommended Design Sound Levels and Reverberation
Times for Building Interiors; Australian Standards: Sydney, Australia, 2000.
52. Hunt, D.R.G. Predicting artificial lighting use—A method based upon observed patterns of behaviour.
Light. Res. Technol. 1980, 12, 7–14.
53. BRE. ESS SD 5075 BREEAM International New Construction. Technical Manual; BRE Global Ltd.: Watford,
UK, 2014.
54. D’ambrosio Alfano, F.R.; Palella, B.I.; Riccio, G.; Toftum, J. Fifty years of Fanger’s equation: Is there
anything to discover yet? Int. J. Ind. Ergon. 2018, 66, 157–160.

Sustainability 2018, 10, 3902 24 of 24
55. Alfano, F.R.D.A.; Palella, B.I.; Riccio, G. Notes on the Calculation of the PMV Index by Means of Apps.
Energy Procedia 2016, 101, 249–256.
56. CEN. EN 16516 Construction Products: Assessment of Release of Dangerous Substances—Determination of
Emissions into Indoor Air; Comité Européen de Normalisation: Brussels, Belgium, 2017.
57. Gomes, J.; Esteves, H. Deriving an Indoor Environmental Index for Portuguese Office Buildings.
Technologies 2016, 4, 40.
© 2018 by the authors. Licensee MDPI, Basel, Switzerland. This article is an open access
article distributed under the terms and conditions of the Creative Commons Attribution (CC
BY) license (http://creativecommons.org/licenses/by/4.0/).