Case Studies in Bayesian Augmented Control Design
Nathan Enas Ji Lin
Eli Lilly and Company

Outline
• Drivers for innovation in Phase II designs • Case Study #1 – Pancreatic cancer
– Study design – Analysis – Learning
• Case Study #2 – Non-small cell lung cancer – Study design – Analysis – Learning

The Need for Better Phase II Designs Likelihood of Obtaining FDA Approval by Development Phase
Source: http://www.pharmamedtechbi.com/publications/the-pink-sheet/76/5/rampd-productivity-still-lags-study-shows-success-rates-may-have-been-overestimated

The Need for Better Phase II Designs Likelihood of Obtaining FDA Approval by Development Phase
Source: http://www.pharmamedtechbi.com/publications/the-pink-sheet/76/5/rampd-productivity-still-lags-study-shows-success-rates-may-have-been-overestimated

The global Phase II challenge
Speed to patients
Robust Phase II data package
Best of both worlds?
Single Arm Trial
Randomized Controlled Trial
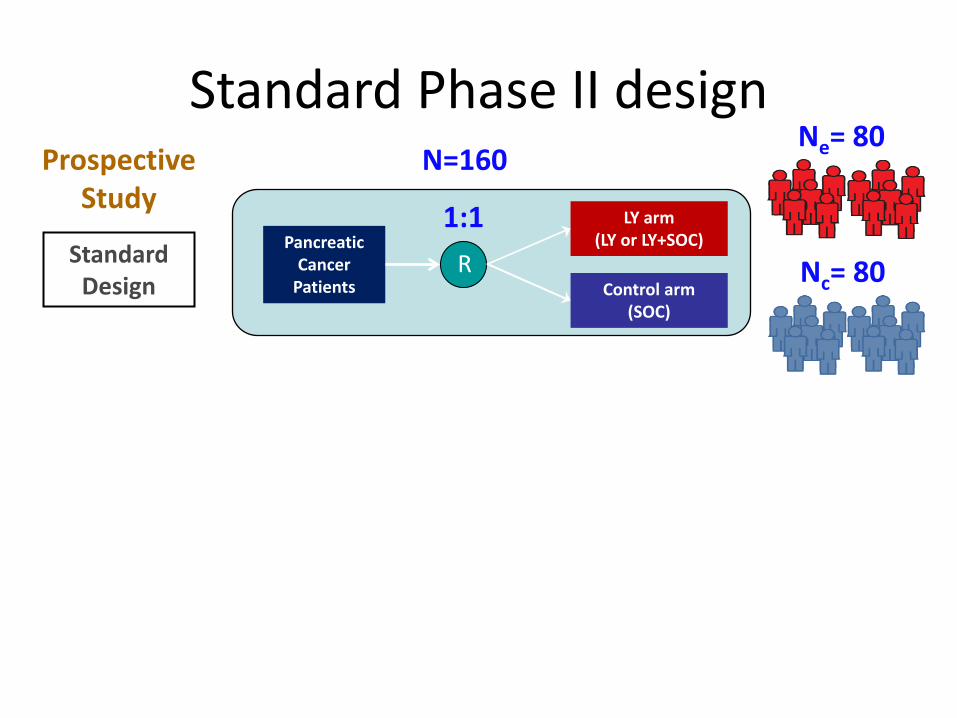
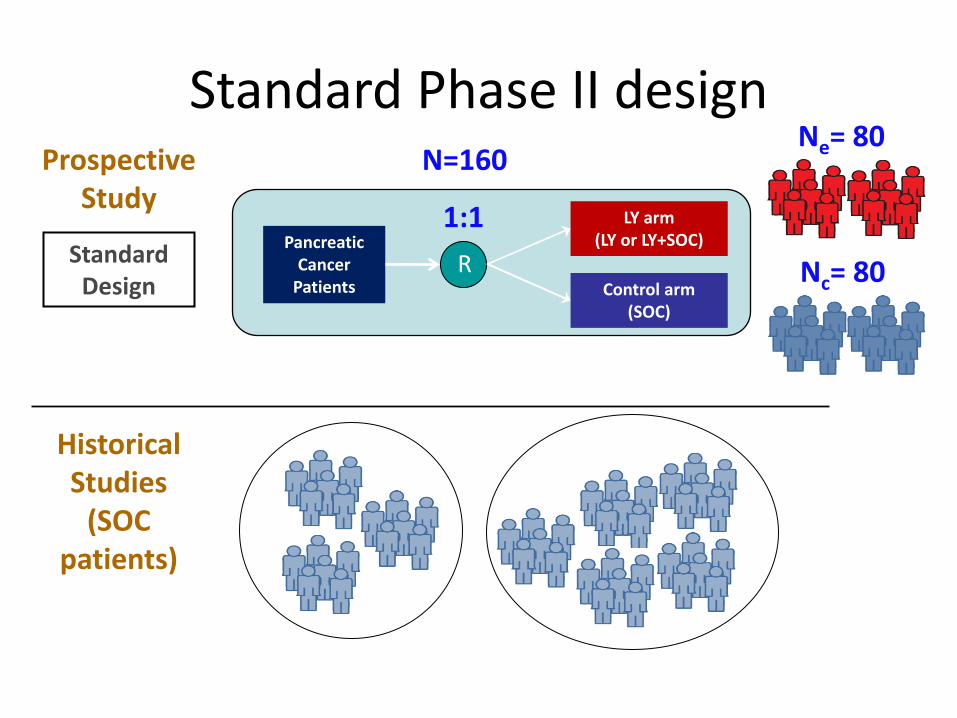
Standard Phase II design
Pancreatic Cancer
Patients
LY arm (LY or LY+SOC)
Control arm (SOC)
R
Prospective Study 1:1
N=160
Standard Design
Ne= 80
Nc= 80
Standard Phase II design
Pancreatic Cancer
Patients
LY arm (LY or LY+SOC)
Control arm (SOC)
R
Prospective Study 1:1
N=160
Standard Design
Historical Studies
(SOC patients)
Ne= 80
Nc= 80

Nc= 40
Nb= 40
Novel Phase II design
Pancreatic Cancer
Patients
LY arm (LY or LY+SOC)
Control arm (SOC)
R
2:1
Prospective Study
Historical Studies
(SOC patients)
Bayesian Augmented
Control (BAC) Design
“Borrowing Strength”
N=120 Ne= 80

Nc= 40
Nb= 40
Novel Phase II design
Pancreatic Cancer
Patients
LY arm (LY or LY+SOC)
Control arm (SOC)
R
2:1
Prospective Study
Historical Studies
(SOC patients)
Bayesian Augmented
Control Design
“Borrowing Strength”
• Reduce patient numbers o Without reducing power
• Put more patients on LY arm • Balance speed and robustness • Enable better Phase III prediction
N=120 Ne= 80

Using BAC in Lilly Oncology Indication Design Endpoint N Alloc Ratio
Pancreas Gem±LY OS 99 1:2
NSCLC Pem-Cis±LY PFS 100 1:2
GBM Temo-RT±LY PFS 56 1:3
Pancreas Gem±LY OS 150 1:2
Renal Cell Sutent±LY PFS 108 1:2
Pancreas Gem±LYlo/hi OS 120 1:1:1
GBM CCNU⊗LY OS 155 1:1:2
SCLC Carbo-Etop±LY PFS 120 1:2
Liver Sorafenib⊗LY PFS 120 1:1:2

CASE STUDY #1 – PANCREATIC CANCER

Phase 1: LY Dose Escalation in Patients with
Advanced or Metastatic Cancer
R
Phase 2: Randomized Phase in Patients with
Metastatic Pancreatic Cancer
Arm A: LY + Gemcitabine
Arm B: Gemcitabine
MTD
3 + 3 Escalation
Gem (std. dosing) + LY
Overview of Phase 2 • Population: Stage II-IV unresectable pancreatic cancer (PS 0-2) • Primary Objective: Overall Survival (OS) • Observation time: 15 months enrollment, 9 months follow-up • Success criterion: Prob(HR < 1 | data) ≥ 0.8
Study Design (STUDY1)
2:1

Historical data Study JEAL Study JMES
0 5 10 15 20 25
0.0
0.2
0.4
0.6
0.8
1.0
Months
Sur
viva
l
JEALJMESJHEW Study Median
(months) 95% CI
JEAL 8.3 (n=66) (6.5, 10.7)
JMES 6.2 (n=282) (5.3, 6.9)

0.01.02.03.04.05.06.07.08.09.0
10.0
1996 1998 2000 2002 2004 2006 2008
Year of publication
Med
ian
surv
ival
JEAL
JMES
Published Gemzar studies
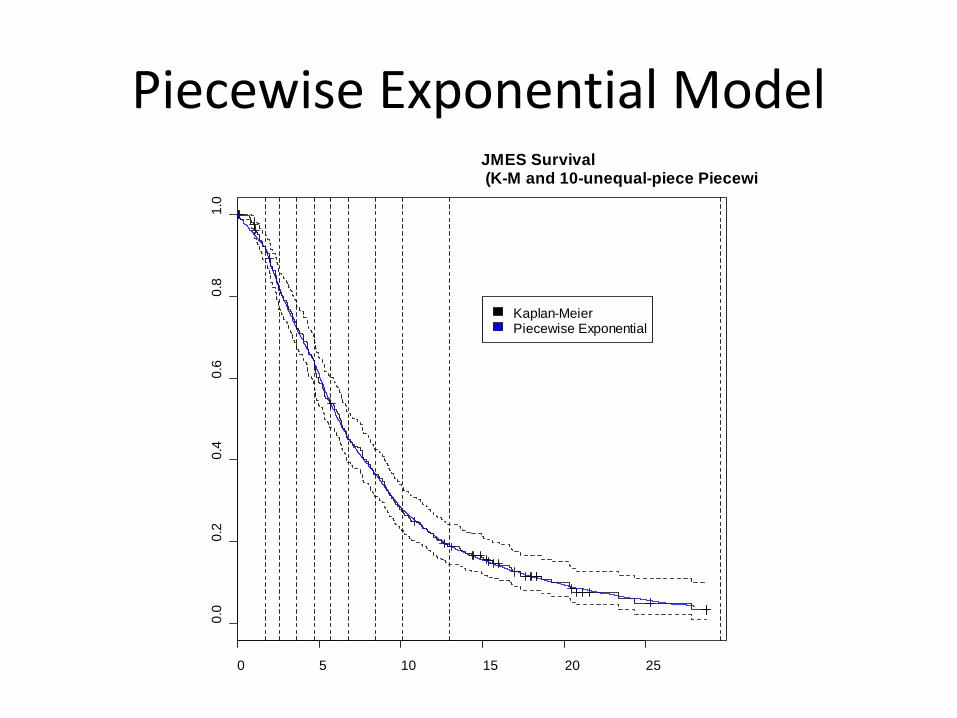
Piecewise Exponential Model
0 5 10 15 20 25
0.0
0.2
0.4
0.6
0.8
1.0
JMES Survival (K-M and 10-unequal-piece Piecewi
Kaplan-MeierPiecewise Exponential
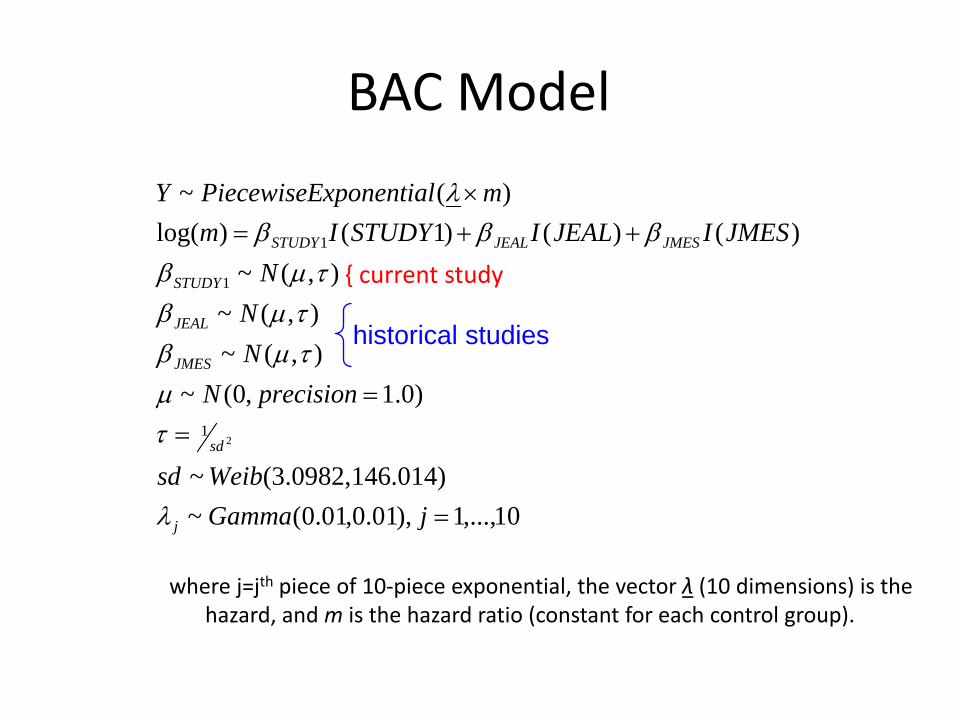
BAC Model
where j=jth piece of 10-piece exponential, the vector λ (10 dimensions) is the hazard, and m is the hazard ratio (constant for each control group).
10,...,1),01.0,01.0(~).0143.0982,146(~
)0.1,0(~),(~),(~
),(~)()()1()log(
)(~
21
1
1
=
==
++=×
jGammaWeibsd
precisionNNN
NJMESIJEALISTUDYIm
mxponentialPiecewiseEY
j
sd
JMES
JEAL
STUDY
JMESJEALSTUDY
λ
τµ
τµβτµβτµβ
βββλ
historical studies
{ current study

Choice of prior distributions • Normal, Gamma priors
• Chosen to be relatively noninformative, but also allow MCMC to converge
• Weibull prior for sd – Weibull dist’n chosen since always > 0 and flexible in shape – Need to be informative due to only 3 studies of control info
• Nc1 = 66, median = 8.3 months (as in JEAL) • Nc2 = 278, median = 6.2 months (as in JMES) • Nc3 = 33, median = function of Beta random variate
– Centered at 7 months, min = 5, max = 9 (assumed for STUDY1) • Nt = 66, median = function of c3 and another Beta random variate
– Tends to be 2 months bigger than control • Simulate 2000 iterations
– Collect set of 2000 sd’s of random effects from a parametric Weibull regression
– Best-fit density to these 2000 estimates is Weibull(3,146)
SD of beta-hats
Den
sity
0.0 0.1 0.2 0.3 0.4 0.5 0.60
24
68
10

Operating Characteristics • Posterior probability (HR < 1) ≥ 0.8 at final analysis • Frequentist OCs obtained by simulation
Overall Survival
BAC design N = 99
(NC = 33, NT = 66) Gemzar vs. LY+Gemzar, median (mo.)
“Power” “Type I Error”
6 vs. 8 0.660 0.052
7 vs. 9 0.752 0.114
8 vs. 10 0.774 0.216
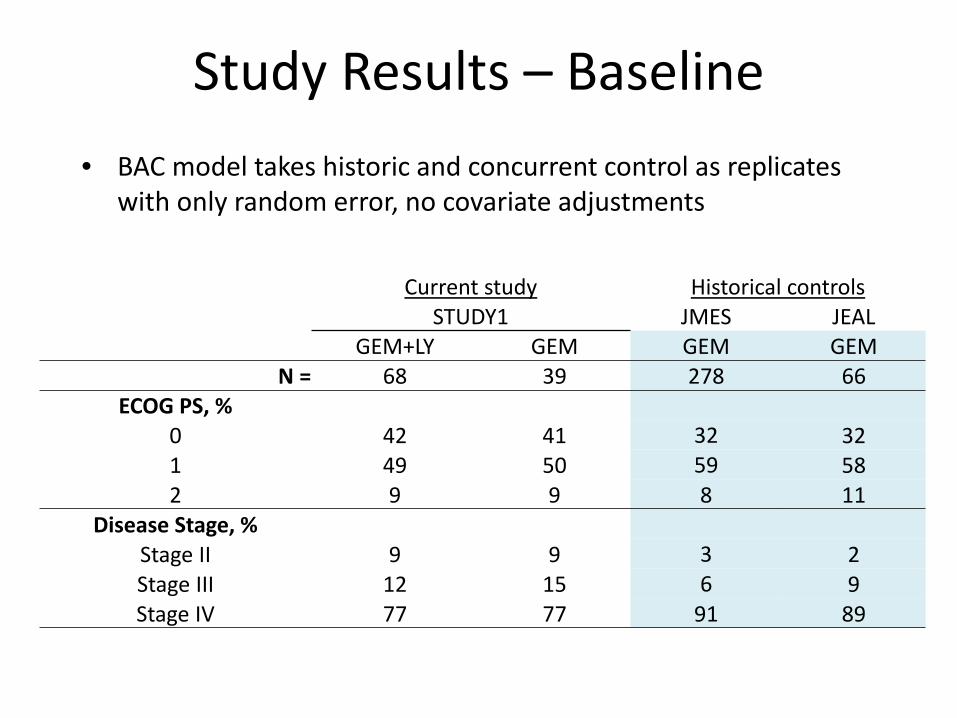
Study Results – Baseline • BAC model takes historic and concurrent control as replicates
with only random error, no covariate adjustments
Current study Historical controls STUDY1 JMES JEAL
GEM+LY GEM GEM GEM N = 68 39 278 66
ECOG PS, % 0 42 41 32 32 1 49 50 59 58 2 9 9 8 11
Disease Stage, % Stage II 9 9 3 2 Stage III 12 15 6 9 Stage IV 77 77 91 89
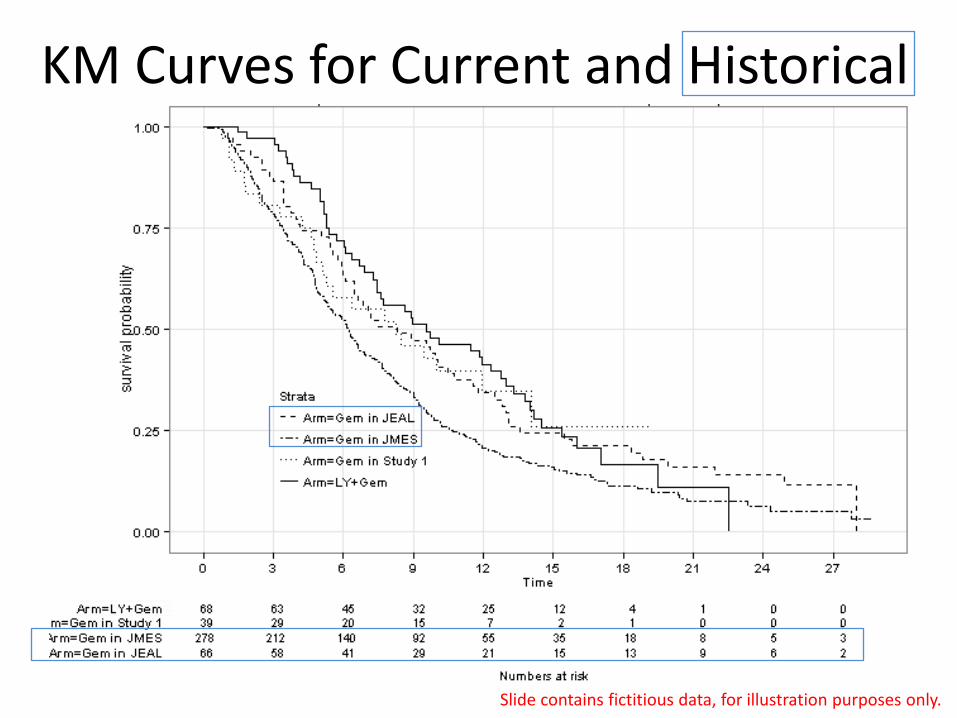
KM Curves for Current and Historical
Slide contains fictitious data, for illustration purposes only.

Frequentist Analyses of OS GEM + LY
(N=68) GEM
(N=39)
Kaplan-Meier Estimate Number (%) of Patients with Events 50 (73.5) 23 (59.0)
Number (%) of Patients Censored 18 (26.5) 16 (41.0)
Median (95% C.I.) 9.6 (7.3, 12.8) 8.3 (4.8, 14.1)
Log-rank P-value for Comparison of Arms: 0.60 Slide contains fictitious data, for illustration purposes only.

Posterior Distribution of Median OS
Effective Sample Size borrowed = 18
Slide contains fictitious data, for illustration purposes only.
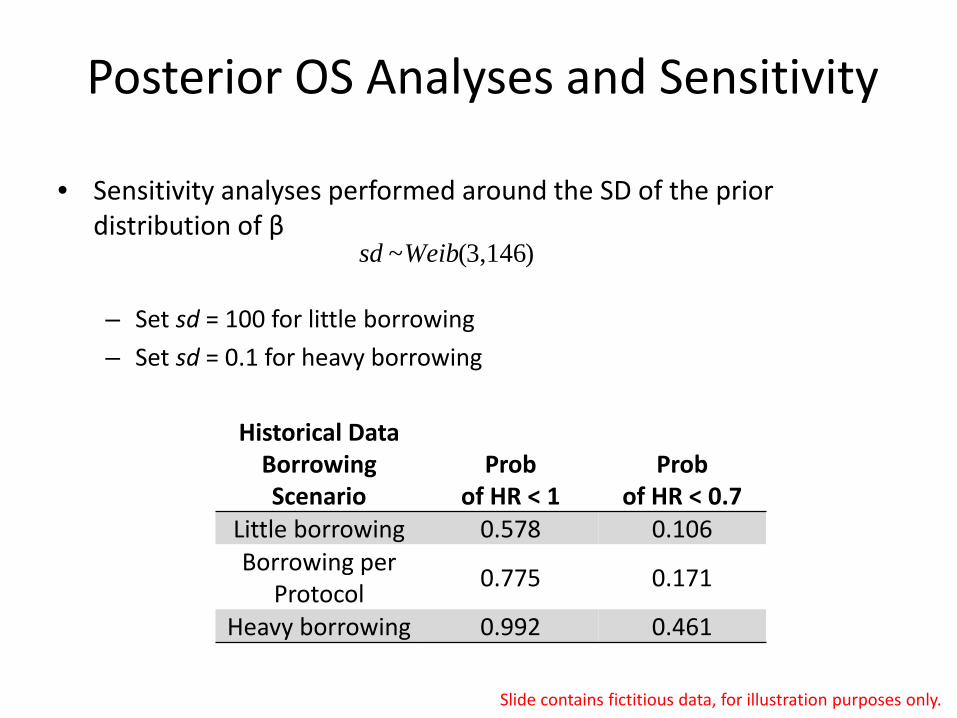
Posterior OS Analyses and Sensitivity
Historical Data Borrowing Scenario
Prob of HR < 1
Prob of HR < 0.7
Little borrowing 0.578 0.106 Borrowing per
Protocol 0.775 0.171
Heavy borrowing 0.992 0.461
• Sensitivity analyses performed around the SD of the prior distribution of β
– Set sd = 100 for little borrowing – Set sd = 0.1 for heavy borrowing
)3,146(~Weibsd
Slide contains fictitious data, for illustration purposes only.

Learning Points • BAC design enables randomized controlled trials
with smaller sample sizes, yet can maintain power
• BAC justifies increased enrollment to the experimental arm
• Posterior plots and probabilities can help understand data and borrowing
• Similarity and sample size of historical controls both play a significant role in borrowing
• Sensitivity analysis, either Bayesian or frequentist, can help interpret study results

CASE STUDY #2 – NON-SMALL CELL LUNG CANCER
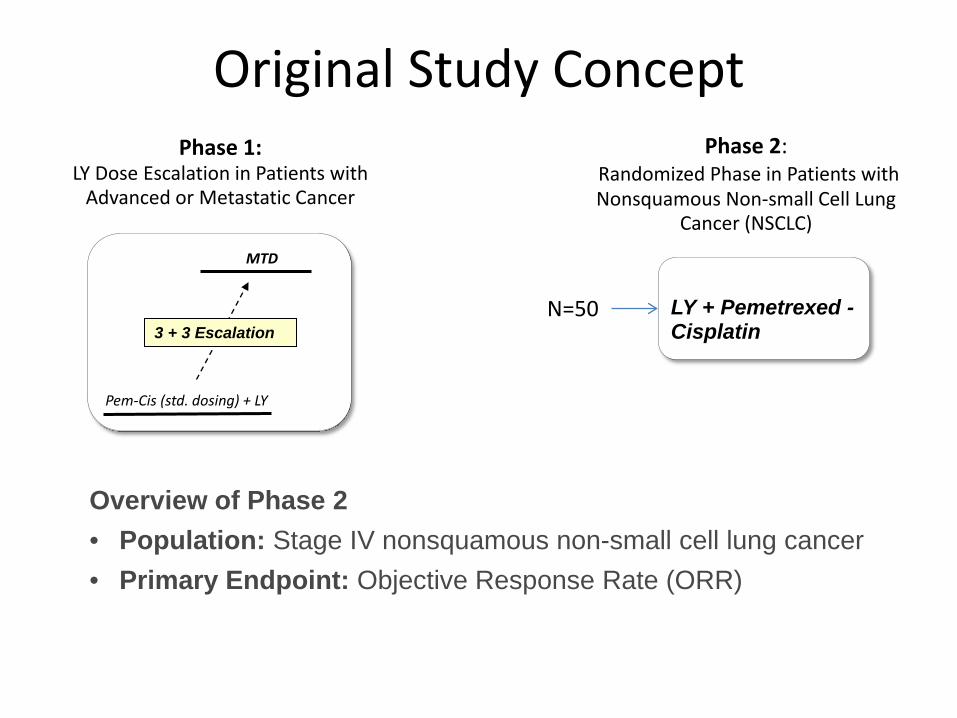
Phase 1: LY Dose Escalation in Patients with
Advanced or Metastatic Cancer
Phase 2: Randomized Phase in Patients with Nonsquamous Non-small Cell Lung
Cancer (NSCLC)
LY + Pemetrexed - Cisplatin
MTD
3 + 3 Escalation
Pem-Cis (std. dosing) + LY
Original Study Concept
N=50
Overview of Phase 2 • Population: Stage IV nonsquamous non-small cell lung cancer • Primary Endpoint: Objective Response Rate (ORR)

Phase 1: LY Dose Escalation in Patients with
Advanced or Metastatic Cancer
R
Phase 2: Randomized Phase in Patients with Nonsquamous Non-small Cell Lung
Cancer (NSCLC)
Arm A: LY + Pemetrexed - Cisplatin
Arm B: Pemetrexed - Cisplatin
MTD
3 + 3 Escalation
Pem-Cis (std. dosing) + LY
BAC Study Design (STUDY2)
2:1
N=50
Overview of Phase 2 • Population: Stage IV nonsquamous non-small cell lung cancer • Primary Endpoint: Progression-free Survival (PFS) • Observation time: 12 months enrollment, 6 months follow-up • Success criterion: Prob(HR < 1 | data) ≥ 0.85

Historical data Original study

Using FACTS for simulations
• The hazard rate for the treatment arm is modeled as piecewise exponential. • Survival time is divided into S segments (maximum allowable S is 10). The hazard
rate is assumed to be constant in each segment. • Proportional hazards model is used to model the hazard rate in segment s:
λst = λsexp(γt)
γt ~ N(μγ ,τγ2)
τγ2 ~ IG(aγ, bγ)
μγ ~ N(mγ, tγ2)
λs hazard rate in segment s for control arm in current trial
λst hazard rate in segment s for previous trial t
γt log hazard ratio
User must specify: Hyperparameters aγ*, bγ*, mγ, tγ For each segment in each historical control arm, Xst = exposure time Est = number of events
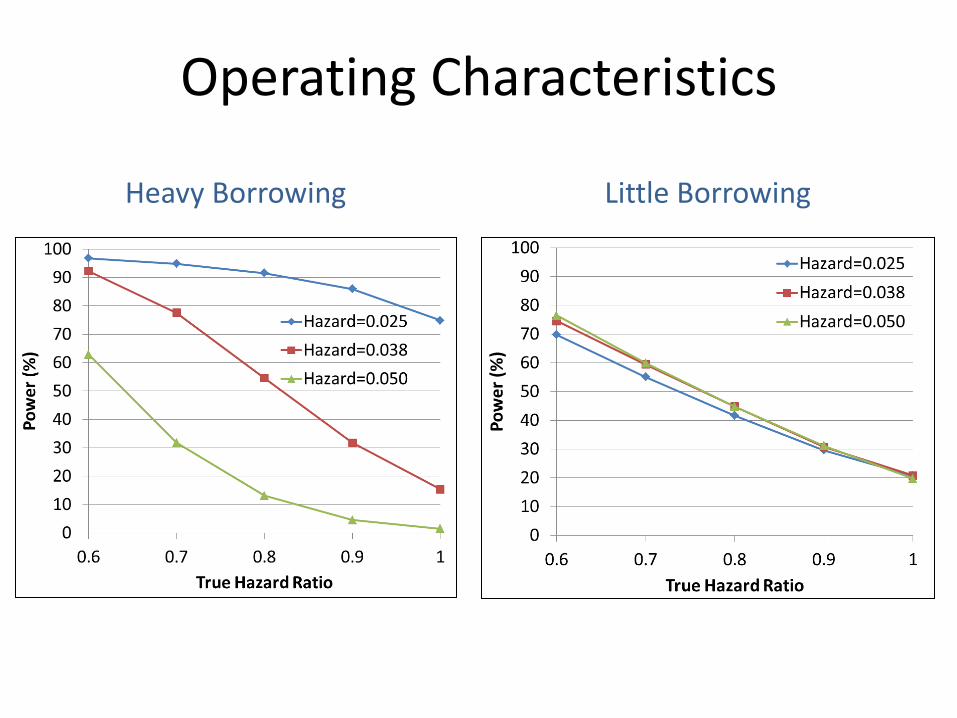
Operating Characteristics
Heavy Borrowing Little Borrowing
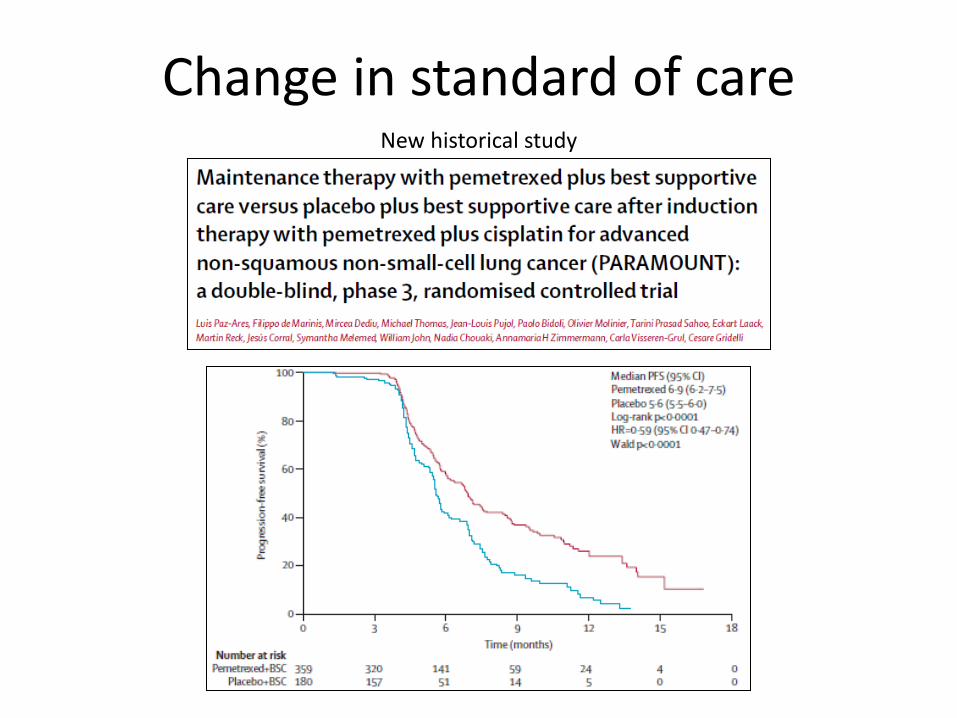
Change in standard of care New historical study

Phase 1: LY Dose Escalation in Patients with
Advanced or Metastatic Cancer
R
Phase 2: Randomized Phase in Patients with Nonsquamous Non-small Cell Lung
Cancer (NSCLC)
Arm A: LY + Pemetrexed - Cisplatin
Arm B: Pemetrexed - Cisplatin
MTD
3 + 3 Escalation
Pem-Cis (std. dosing) + LY
Updated BAC Study Design
2:1
N=100
Overview of Phase 2 • Population: Stage IV nonsquamous non-small cell lung cancer • Primary Endpoint: Progression-free Survival (PFS) • Observation time: 12 months enrollment, 6 months follow-up • Success criterion: Prob(HR < 1 | data) > 0.85
LY + Pemetrexed
Pemetrexed
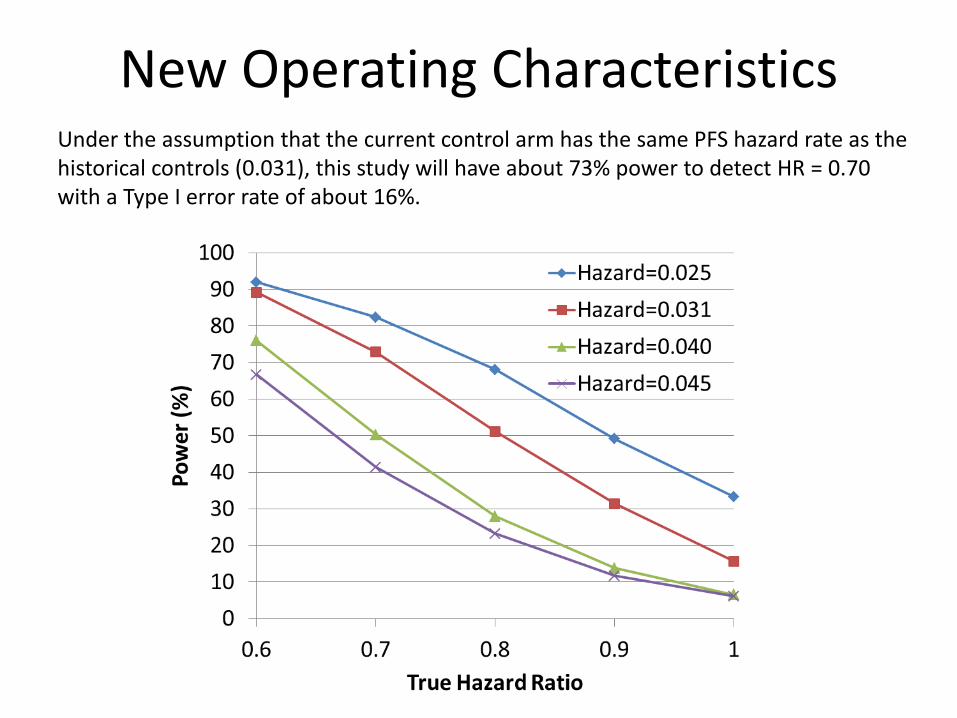
New Operating Characteristics Under the assumption that the current control arm has the same PFS hazard rate as the historical controls (0.031), this study will have about 73% power to detect HR = 0.70 with a Type I error rate of about 16%.
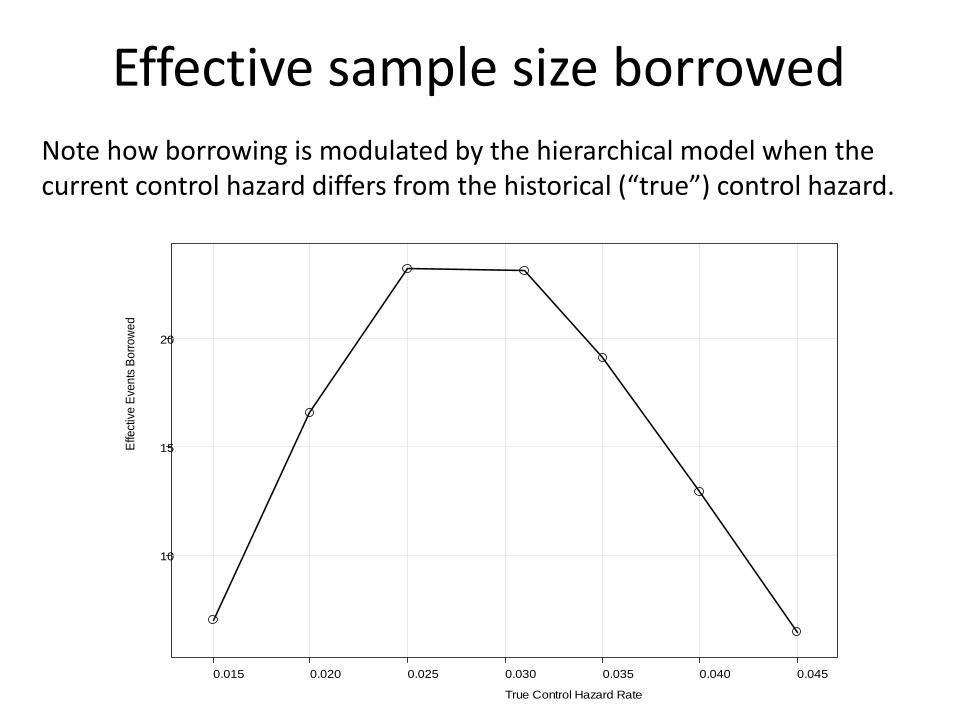
Effective sample size borrowed Note how borrowing is modulated by the hierarchical model when the current control hazard differs from the historical (“true”) control hazard.
True Control Hazard Rate
Effe
ctiv
e Ev
ents
Bor
row
ed
10
15
20
0.015 0.020 0.025 0.030 0.035 0.040 0.045

PFS time (weeks)
PFS
prob
abili
ty
KM Curves for Current and Historical
Slide contains fictitious data, for illustration purposes only.

Frequentist Analyses of OS GEM + LY
(N=39) GEM
(N=23)
Kaplan-Meier Estimate Number (%) of Patients with Events 30 (76.9) 19 (82.6)
Number (%) of Patients Censored 9 (23.1) 4 (17.4)
Median (95% C.I.) 32.3 (22.1, 42.3) 14.4 (9.9, 21.4)
Log-rank P-value for Comparison of Arms: 0.001 Slide contains fictitious data, for illustration purposes only.

Posterior Distribution of Median PFS
Effective Sample Size borrowed = 17
Slide contains fictitious data, for illustration purposes only.

Primary and Sensitivity Analysis
Historical Data Borrowing Scenario
Prob of HR < 1
Prob of HR < 0.7
Little borrowing 0.994 0.915 Borrowing per
protocol 0.987 0.765
Full borrowing 0.982 0.481
• The primary endpoint is defined as the Posterior Probability of Superiority (Hazard Ratio: LY+Pem+Cis / Pem+Cis < 1.0)
• A secondary endpoint could be considered as the Posterior Probability of Clinically Meaningful Difference (Hazard Ratio: LY+Pem+Cis / Pem+Cis < 0.7)
• The threshold for the primary analysis is 0.85 at the end of the trial.
Slide contains fictitious data, for illustration purposes only.

Learning Points
• Since this BAC method doesn’t control for covariates, a close look at baseline disease characteristics is necessary
• Patient level historic data is helpful for matching covariates between historical and current controls
• BAC requires careful use of historical data, and monitoring of shifts in “standard of care”
• Sensitivity analyses are useful for interpreting study results, including frequentist analyses

Acknowledgements
• Andy Mugglin • Baoguang Han • Berry Consultants

THANKS!