1
Capturing Independence Graphically; Undirected Graphs
COMPSCI 276, Spring 2017
Set 2: Rina Dechter
(Reading: Pearl chapters 3, Darwiche chapter 4)

Outline
• Graphical models: The constraint network, Probabilistic networks, cost networks and
mixed networks. queries: consistency, counting, optimization and likelihood queries.
• Graphoids: Qualitative Notion of Dependencies by axioms, Semi-graphoids
• Dependency Graphs, D-MAPS and I-MAPS
• Markov networks, Markov Random Fields
• Examples of networks

A Bred green
red yellow
green red
green yellow
yellow green
yellow red
Example: map coloring
Variables - countries (A,B,C,etc.)
Values - colors (red, green, blue)
Constraints: etc. ,ED D, AB,A
C
A
B
D
E
F
G
Constraint Networks
A
B
E
G
DF
C
Constraint graph

Bayesian Networks (Pearl 1988)
P(S, C, B, X, D) = P(S) P(C|S) P(B|S) P(X|C,S) P(D|C,B)
lung Cancer
Smoking
X-ray
Bronchitis
DyspnoeaP(D|C,B)
P(B|S)
P(S)
P(X|C,S)
P(C|S)
Θ) (G,BN
CPD:
C B P(D|C,B)0 0 0.1 0.90 1 0.7 0.31 0 0.8 0.21 1 0.9 0.1
• Posterior marginals, probability of evidence, MPE
• P( D= 0) = σ𝑆,𝐿,𝐵,𝑋 P(S)· P(C|S)· P(B|S)· P(X|C,S)· P(D|C,B
MAP(P)= 𝑚𝑎𝑥𝑆,𝐿,𝐵,𝑋 P(S)· P(C|S)· P(B|S)· P(X|C,S)· P(D|C,B)
)(max
))(|()(
))(|()...( 1
xPmpe
xpaxpeP
xpaxpxxP
x
ii
EX
i
iiin
Combination: ProductMarginalization: sum/max

Sample Applications for Graphical Models
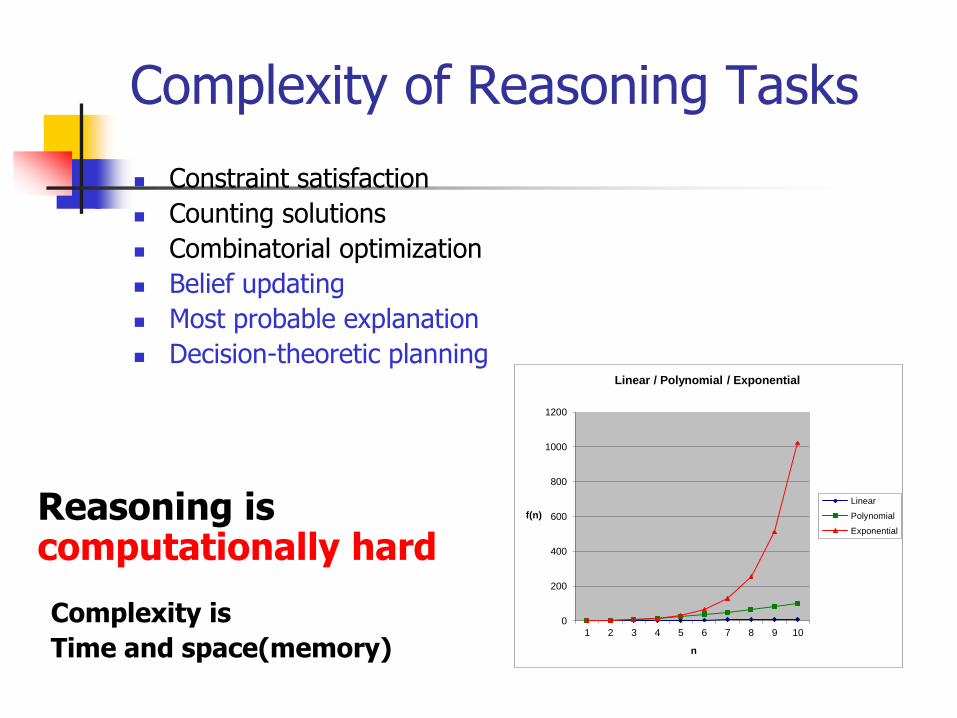
Complexity of Reasoning Tasks
Constraint satisfaction
Counting solutions
Combinatorial optimization
Belief updating
Most probable explanation
Decision-theoretic planning
0
200
400
600
800
1000
1200
1 2 3 4 5 6 7 8 9 10
f(n)
n
Linear / Polynomial / Exponential
Linear
Polynomial
Exponential
Reasoning iscomputationally hard
Complexity is
Time and space(memory)

7
The Qualitative Notion of DepedenceMotivations and issues
Motivating example:
What I eat for breakfast, what I eat for dinner?
What I eat for breakfast, What I dress
What I eat for breakfast today, the grade in 276
The time I devote to work on homework 1, my grade in 276
Shoe size,reading ability
Shoe-size, reading ability, if we know the age

8
The Qualitative Notion of Depedencemotivations and issues
The traditional definition of independence uses equality of numerical quantities as in P(x,y)=P(x)P(y)
People can easily and confidently detect dependencies, but not provide numbers
The notion of relevance and dependence are far more basic to human reasoning than the numerical quantification.
Assertions about dependency relationships should be expressed first.

9
Dependency graphs
The nodes represent propositional variables and the arcs represent local dependencies among conceptually related propositions.
Graph concepts are entrenched in our language (e.g., “thread of thoughts”, “lines of reasoning”, “connected ideas”). One wonders if people can reason any other way except by tracing links and arrows and paths in some mental representation of concepts and relations.
What types of (in)dependencies are deducible from graphs?
For a given probability distribution P and any three variables X,Y,Z,it is straightforward to verify whether knowing Z renders X independent of Y, but P does not dictates which variables should be regarded as neighbors.
Some useful properties of dependencies and relevancies cannot be represented graphically.


Properties of Probabilistic independence
11
If Probabilistic independence is a good (intuitive to human reasoning)formalizm, then the axioms it obeys will be consistent with our intuition

Properties of Probabilistic independence
Symmetry: I(X,Z,Y) I(Y,Z,X)
Decomposition:
I(X,Z,YW) I(X,Z,Y) and I(X,Z,W)
Weak union: I(X,Z,YW)I(X,ZW,Y)
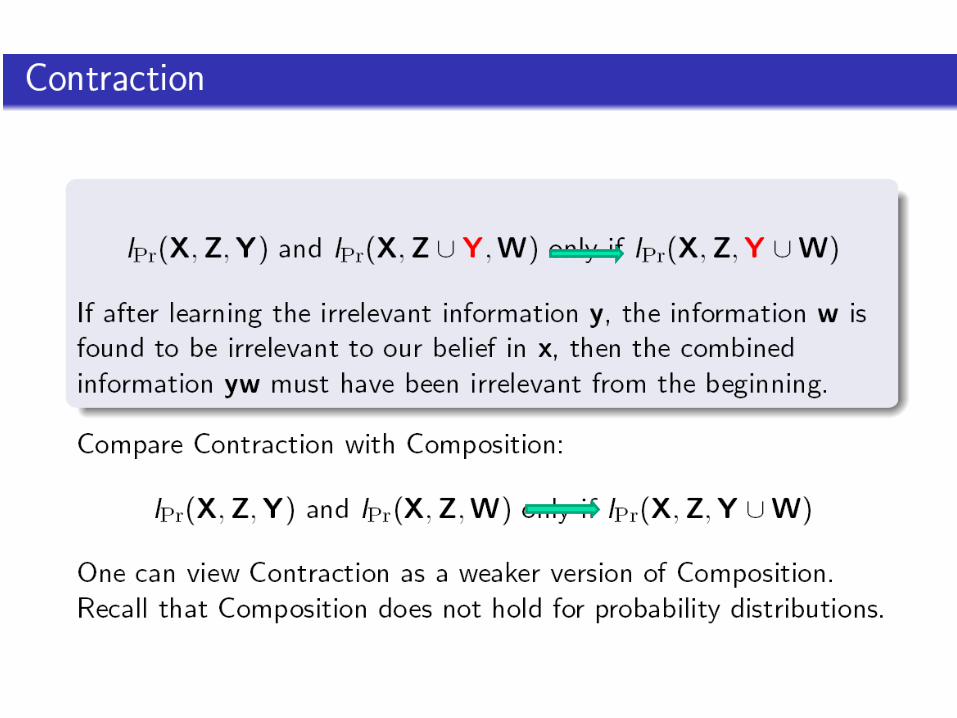
Contraction: I(X,Z,Y) and I(X,ZY,W)I(X,Z,YW)
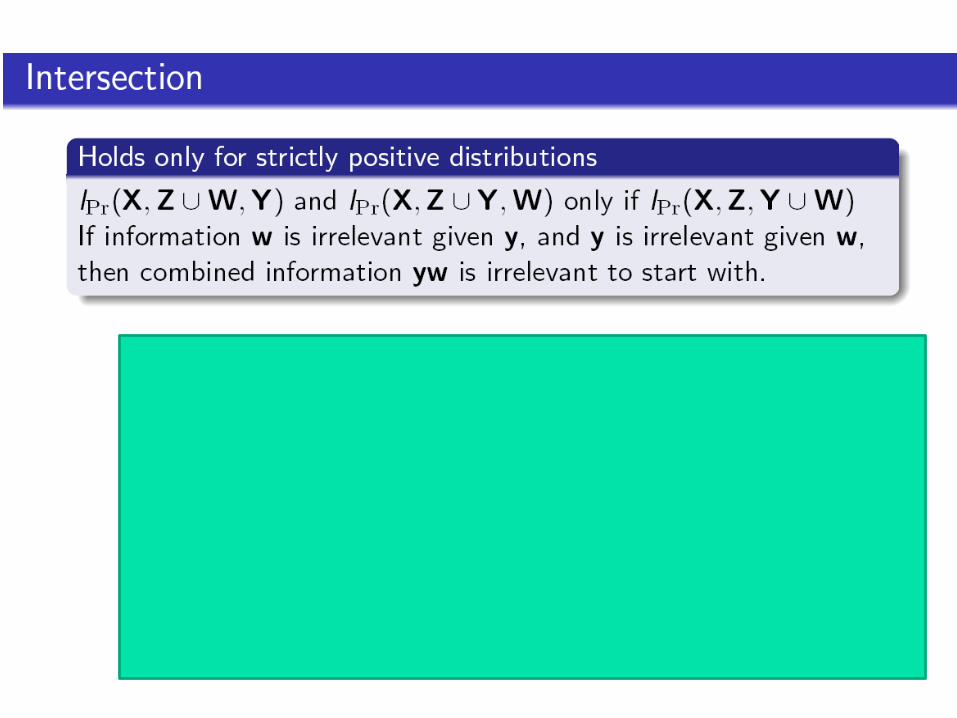
Intersection: I(X,ZY,W) and I(X,ZW,Y) I(X,Z,YW)
12
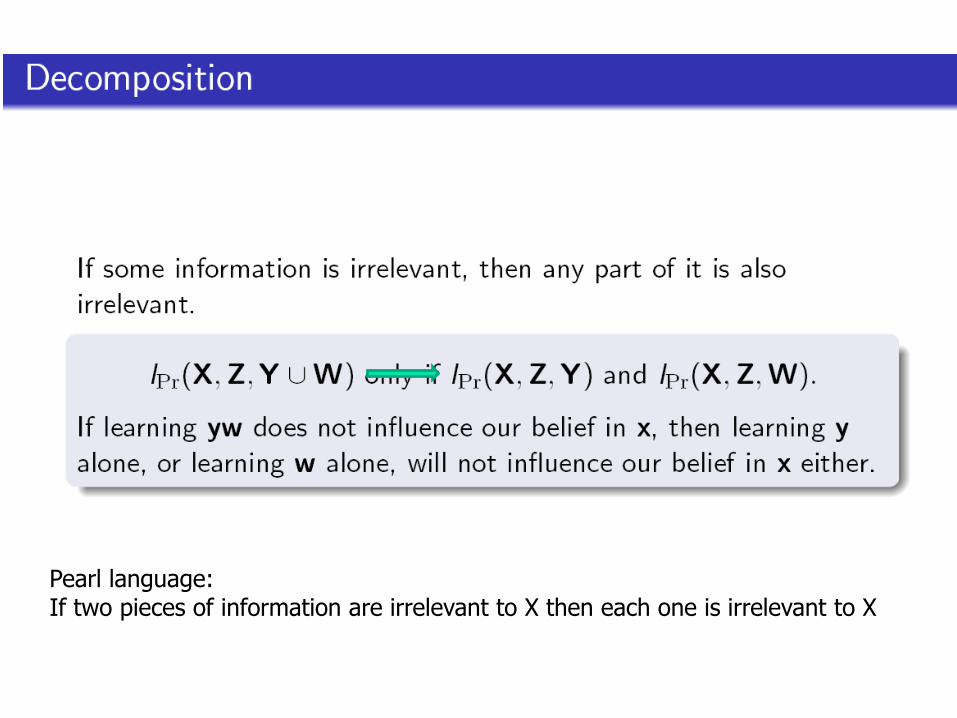
Pearl language:If two pieces of information are irrelevant to X then each one is irrelevant to X

Example: Two coins and a bell


19

Graphs vs Graphoids
Symmetry: I(X,Z,Y) I(Y,Z,X)
Decomposition:
I(X,Z,YW) I(X,Z,Y) and I(X,Z,W)
Weak union: I(X,Z,YW)I(X,ZW,Y)
Contraction: I(X,Z,Y) and I(X,ZY,W)I(X,Z,YW)
Intersection: I(X,ZY,W) and I(X,ZW,Y) I(X,Z,YW)
Graphoid: satisfy all 5 axioms
Semi-graphoid: satisfies the first 4.
Decomposition is only one way in probability independeencies, while in graphs it is iff.
Weak union states that w should be chosen from a set that, like Y should already be separated from X by Z
20

21
Why Axiomatic Characterization?
Allows deriving conjectures about independencies in a clear fashion
Axioms serve as inference rules
Can capture the principal differences between various notions of relevance or independence

Dependency Models and Dependency Maps
A dependency model is a set of independence statements I(X,Y,Z) that are either true or false.
An undirected graph with node separation is a dependency model
We say < 𝑋, 𝑍, 𝑌 >𝐺 iff once you remove Z from the graph X
and Y are not connected
Can we completely capture probabilistic independencies by the notion of separation in a graph?
Example: 2 coins and a bell.
22

Independency-map (i-map) and Dependency-maps (d-maps)
A graph G is an independency map (i-map) of a probability distribution iff
< 𝑋, 𝑍, 𝑌 >𝐺 implies 𝐼𝑃(X,Z,Y)
A graph G is a Dependency map (d-map) of a probability distribution P iff𝑛𝑜𝑡 < 𝑋, 𝑍, 𝑌 >𝐺 implies 𝑛𝑜𝑡 𝐼𝑃(X,Z,Y)
23
• A model with induced dependencies cannot have a graph which is a perfect map. • Example: two coins and a bell… try it• How we then represent two causes leading to a common consequence?

Axiomatic Characterization of Graphs
Definition: A model M is graph-isomorph if there exists a graph which is a perfect map of M.
Theorem (Pearl and Paz 1985): A necessary and sufficient condition for a dependency model to be graph–isomorph is that it satisfies
Symmetry: I(X,Z,Y) I(Y,Z,X)
Decomposition: I(X,Z,YW) I(X,Z,Y) and I(X,Z,Y)
Intersection: I(X,ZW,Y) and I(X,ZY,W)I(X,Z,YW)
Strong union: I(X,Z,Y) I(X,ZW, Y)
Transitivity: I(X,Z,Y) exists t s.t. I(X,Z,t) or I(t,Z,Y)
This properties are satisfied by graph separation
24

Markov Networks
Graphs and probabilities:
Given P, can we construct a graph I-map with minimal edges?
Given (G,P) can we test if G is an I-map? a perfect map?
Markov Network Definition: A graph G which is a minimal I-map of a probability distribution P, namely deleting any edge destroys its i-mappness, is called a Markov network of P.
25

Markov Networks
Theorem (Pearl and Paz 1985): A dependency model satisfying symmetry decomposition and intersection has a unique minimal graph as an i-map, produced by deleting every edge (a,b) for which I(a,U-a-b,b) is true.
The theorem defines an edge-deletion method for constructing G0
Markov blanket of a is a set S for which I(a,S,U-S-a).
Markov Boundary: a minimal Markov blanket.
Theorem (Pearl and Paz 1985): if symmetry, decomposition, weak union and intersection are satisfied by P, the Markov boundary is unique and it is the neighborhood in the Markov network of P
26

Markov Networks
Corollary: the Markov network G of any strictly positive distribution P can be obtained by connecting every node to its Markov boundary.
The following 2 interpretations of direct neighbors are identical:
Neighbors as blanket that shields a variable from the influence of all others
Neighborhood as a tight influence between variables that cannot be weakened by other elements in the system
So, given P (positive) how can we construct G?
Given (G,P) how do we test that G is an I-map of P?
Given G, can we construct P which is a perfect i-map? (Geiger and Pearl 1988)
27

Testing I-mapness
Theorem 5 (Pearl): Given a positive P and a graph G the following are equivalent: G is an I-map of P iff G is a super-graph of the Markov network of P
G is locally Markov w.r.t. P (the neighbors of a in G is a Markov blanket.) iffG is a super-graph of the Markov network of P
There appear to be no test for I-mappness of undirected graph that works for extreme distributions without testing every cutsetin G (ex: x=y=z=t )
Representations of probabilistic independence using undirected graphs rest heavily on the intersection and weak union axioms.
In contrast, we will see that directed graph representations rely on the contraction and weak union axiom, with intersection playing a minor role.
28

Markov Networks: Summary
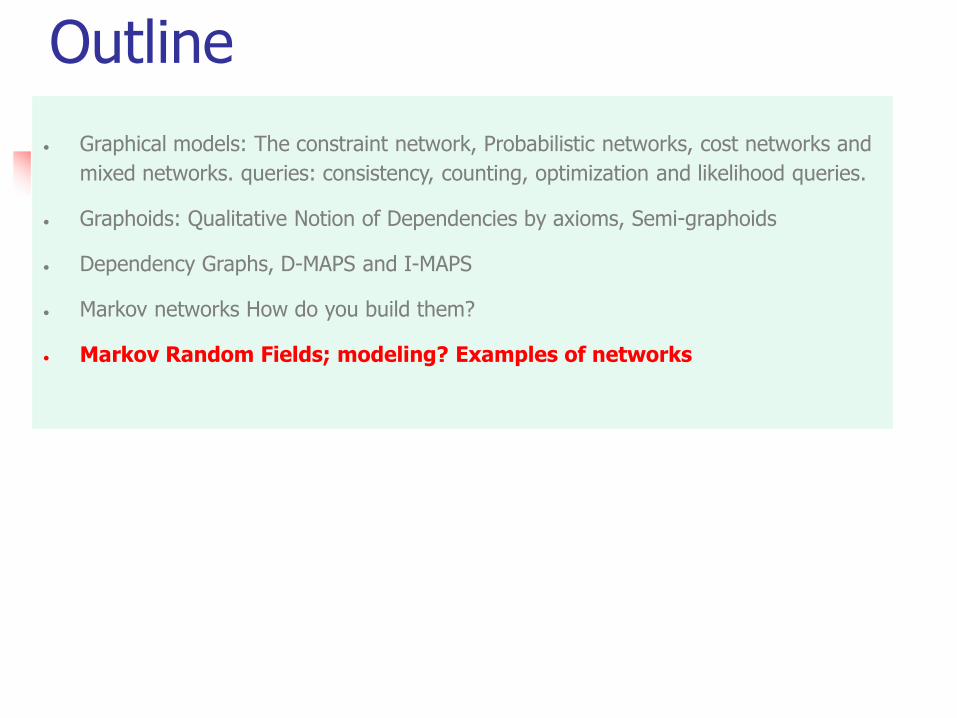
Outline
• Graphical models: The constraint network, Probabilistic networks, cost networks and
mixed networks. queries: consistency, counting, optimization and likelihood queries.
• Graphoids: Qualitative Notion of Dependencies by axioms, Semi-graphoids
• Dependency Graphs, D-MAPS and I-MAPS
• Markov networks How do you build them?
• Markov Random Fields; modeling? Examples of networks

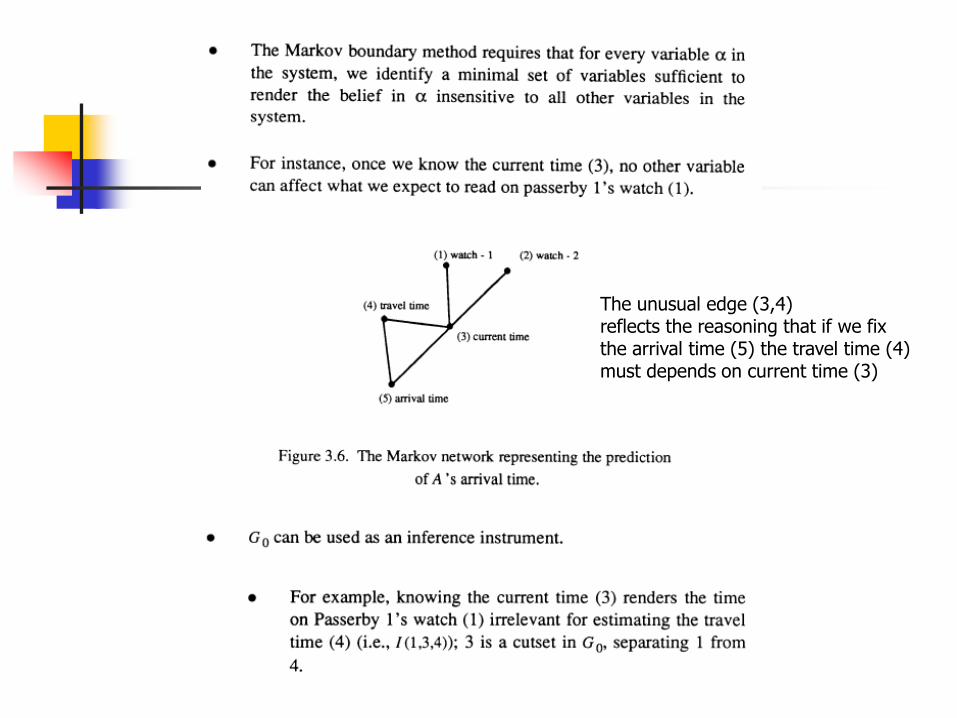
The unusual edge (3,4)reflects the reasoning that if we fix the arrival time (5) the travel time (4) must depends on current time (3)

How can we construct a probabilityDistribution that will have all these independencies?

So, How do we learnMarkov networks From data?
Markov Random Field (MRF)

G is locally markovIf neighbors make every Variable independentFrom the rest.
Markov Random Field (MRF)

Pearl says: this information must come from measurements or from experts.But what about learning?
37
Example Markov networks and applications

Probabilistic Reasoning
Alex is-likely-to-go in bad weather Chris rarely-goes in bad weather Becky is indifferent but unpredictable
Questions: Given bad weather, which group of individuals is
most likely to show up at the party? What is the probability that Chris goes to the
party but Becky does not?
Party example: the weather effect
P(W,A,C,B) = P(B|W) · P(C|W) · P(A|W) · P(W)
P(A,C,B|W=bad) = 0.9 · 0.1 · 0.5
P(A|W=bad)=.9W A
P(C|W=bad)=.1W C
P(B|W=bad)=.5W B
W
P(W)
P(A|W)
P(C|W)P(B|W)
B CA
W A P(A|W)
good 0 .01
good 1 .99
bad 0 .1
bad 1 .9

Mixed Networks: Mixing Belief and Constraints
Belief or Bayesian NetworksA
D
B C
E
F
A
D
B C
E
F
)|(),,|(
),|(),|(),|(),( :CPTS
}1,0{:Domains
,,,,, :Variables
AFPBAEP
CBDPACPABPAP
DDDDDD
FEDCBA
FEDCBA
Constraint Networks
)( :solutions ofset theExpresses
),(),(),(),( :sConstraint
}1,0{:Domains
,,,,, :Variables
4321
Rsol
EARBCDRACFRABCR
DDDDDD
FEDCBA
FEDCBA
B C D=0 D=1
0 0 0 1
0 1 .1 .9
1 0 .3 .7
1 1 1 0
),|( CBDP
allowednot is 1D1,C1,B
allowednot is 0,0,0
)(3
DCB
BCDR
B= R=
Constraints could be specified externally or may occur as zeros in the Belief network

Motivation: Applications
• Determinism: More Ubiquitous than you may think!
Transportation Planning (Liao et al. 2004, Gogate et al. 2005) Predicting and Inferring Car Travel Activity of individuals
Genetic Linkage Analysis (Fischelson and Geiger, 2002) associate functionality of genes to their location on
chromosomes.
Functional/Software Verification (Bergeron, 2000) Generating random test programs to check validity of
hardware
First Order Probabilistic models (Domingos et al. 2006, Milch et al. 2005) Citation matching

Transportation Planning: Graphical model
gt-1
rt-1
lt-1
yt-1
vt-1
gt
rt
lt
yt
vt
Ft-1
D: Time-of-day (discrete)
W: Day of week (discrete)
G: collection of locations where the
person spends significant amount of
time. (discrete)
F: Counter
Route: A hidden variable that just
predicts what path the person takes
(discrete)
Location: A pair (e,d) e is the edge on
which the person is and d is the
distance of the person from one of the
end-points of the edge (continuous)
Velocity: Continuous
GPS reading: (lat,lon,spd,utc).
Ft
dt-1 wt-1dt wt
Outline
• Graphical models: The constraint network, Probabilistic networks, cost networks and
mixed networks. queries: consistency, counting, optimization and likelihood queries.
• Graphoids: Qualitative Notion of Dependencies by axioms, Semi-graphoids
• Dependency Graphs, D-MAPS and I-MAPS
• Markov networks, Markov Random Fields
• Examples of networks