business AircrAft
marketforecast
2012-2031

bombArdier business AircrAft Market forecast 2012-2031 02table of contents
executive summary
Historical market Performance
current market drivers
the forecast
conclusion
03
08
1 1
23
46

bombArdier business AircrAft Market forecast 2012-2031 03
executivesummary

bombArdier business AircrAft Market forecast 2012-2031 04executive summary
bombardier Aerospace is pleased to present the 2012 edition of its business Aircraft market forecast. the forecast incorporates a 20-year outlook of the business jet industry, bombardier’s long-term vision of the business jet market and an in-depth look at the market drivers in the major regions of the world.
bombardier continues to grow its leadership position in the business jet manufacturing industry. during 2011, bombardier again recorded more orders than any single competitor, with 191 net orders, representing approximately 45% of industry total net orders. bombardier also had strong delivery performance in 2011 with a 32% market share based on units and 38% market share based on revenues.
bombardier remains confident in the strong long-term potential for the business aircraft industry and maintains its focus on strength-ening its market leadership position by continuing to invest in its development programs: the Global 7000, Global 8000, Learjet 70, Learjet 75 and Learjet 85 aircraft. during Q1 2012, the first Global 6000 and Global 5000 aircraft equipped with the Vision Flight Deck entered service.
With its comprehensive product portfolio, dedication to superior customer support
and solid product-development roadmap, bombardier is well positioned to benefit from the next business aircraft industry up-cycle.
this forecast focuses on the three business jet categories in which bombardier competes: Light, medium and Large. the Very Light and Large corporate Airliner categories are excluded.
bombardier remains confident in the stronglong-term potential for
the business aircraft industry.
Figure #1
INDUSTRY ORDERS AND DELIVERIESUnits, 2002–2011
Sources: Actual deliveries from GAMA. Orders estimated from competitive intelligence, OEM guidance.Excludes Very Light Jet and Large corporate airliners segments.
400
600
800
1,200
1,400
1,600
1,800
2011201020092008200720062005200420032002-1,000
0
1,000
-800
-600
-400
-200
200
Total DeliveriesTotal Orders
Ord
er a
nd
Del
iver
y U
nit
s

industry recovery continuesthe business jet industry is progressing well on a prolonged and gradual recovery from the steep industry downturn of 2009-2010.
many market indicators continue to improve. industry order intake grew over 2010 levels and the industry book-to-bill ratio also improved. bombardier business Aircraft’s book-to-bill ratio was 1.2 for 2011.
industry deliveries were relatively flat, year-over-year. While pre-owned inventories continue their gradual decline, residual values remain depressed and trade-ins of pre-owned aircraft continue to be active. Aircraft utiliza-tion is increasing gradually, but remains below pre-recession levels. the recovery in business jet orders has been stronger in the Large cat-egory while the Light category continues to lag. stock markets improved during 2011, but remain very volatile. corporate profitability and the number of billionaires worldwide are at record levels.
the u.s. economy experienced continued growth in 2011 and showed signs of improved market confidence, with increased business jet orders. certain emerging markets, notably china, continued to grow strongly and were very active for business jet orders during 2011.
the european economy continues to cause widespread uncertainty.
market confidence needs to be fully restored for industry business jet deliveries to increase substantially and enable the industry to realize its full potential. industry deliveries are not expected to improve significantly in 2012. With increasing confidence and stronger economic growth, bombardier believes business jet deliveries will return to sustained growth starting in 2013. this forecast will detail the expected timeline and magnitude of the business jet industry comeback.
bombArdier business AircrAft Market forecast 2012-2031 05executive summary
Figure #2
INDUSTRY NET ORDERSUnits, 2010–Q1 2012
73
232
Q1 2012
78
40
2011
423
191
2010
180
107
Sources: Manufacturer disclosures and Bombardier estimates.Excludes Very Light Jet and Large Corporate Airlines categories.
Other OEMsBombardier
59% 45%
51% 38

bombArdier business AircrAft Market forecast 2012-2031 06executive summary
business Jet value ProPosition business jets provide fast, flexible, safe, secure and cost-effective access to travelers’ destinations of choice. in addition to the time saving and flexibility gained when using a business jet, there exist other less quantifiable, but equally important benefits. these include: on-demand flight schedules, the ability to discuss business privately during flights, more direct access to company’s sites (which may not be served by scheduled airlines), and reduced fatigue on a company’s frequent travelers.
nexa Advisors has conducted studies be-tween 2009 and 2012 to evaluate the impact of business jet ownership on large, medium and small companies, as well as government agencies. they found that companies using business jets are most likely to outperform non-users on revenue growth, share price growth, profitability and employee satisfac-tion. nexa Advisors also came to the conclu-sion that business jet use among government agencies clearly improves taxpayer value.
noted investor Warren buffett, ceo of berkshire Hathaway, stated: “berkshire has been better off by me having a plane available to go and do deals or whatever it may be. A lot of times it doesn’t work out. but net,
it’s a plus. We have done things i wouldn’t have done if we hadn’t had a plane.”
in an increasingly competitive global marketplace, business aviation is a tool that contributes directly to growth.
in an increasingly competitive global marketplace, business
aviation is a tool that contributes directly to growth.

a long-term vision for the industry We believe that the long-term market drivers of business jet industry growth remain solid. these market drivers include: wealth creation, increasing business jet penetration in high-growth economies, globalization of trade, replacement demand, and market accessibility.
this confidence is reflected in our 20-year delivery forecast, which predicts 24,000 business jet deliveries valued at $648 billion. We anticipate 9,800 deliveries worth $266 billion from 2012 to 2021, and 14,200 deliveries worth $382 billion from 2022 to 2031.
We expect the worldwide business jet fleet to grow at a compound annual growth rate (cAGr) of 3.7% over the forecast period, from 15,200 aircraft in 2011 to 31,500 aircraft by 2031, net of retirements.
bombArdier business AircrAft Market forecast 2012-2031 07executive summary
Figure #4
BUSINESS JET FLEET FORECASTUnits, 2011-2031
Source: Bombardier Forecast Model.
3,100
4,600
Fleet 2031
31,500
RetirementsDeliveries
14,200
Fleet 2021
21,900
RetirementsDeliveries
9,800
Fleet 2011
15,200
Figure #3
Source: Bombardier Forecast Model.
BUSINESS JET MARKET HISTORY AND FORECAST
HISTORICAL
2002-2011
Delivery Units 6,300
Revenues $139 billion
FORECAST
2012-2021 2022-2031 Total (2012-2031)
9,800 14,200 24,000
$266 billion $382 billion $648 billion

bombArdier business AircrAft Market forecast 2012-2031 08
historical market
Performance
bombArdier business AircrAft Market forecast 2012-2031 09historical market Performance
Figure #5
Source: Actual deliveries from GAMA.
HISTORICAL BUSINESS JET DELIVERIESUnits, 1965-2011
2011
CAGR = 4%
CAGR = 9%
2008200620042002
700
500
900
800
600
400
300
200
100
50
2010
150
2000
250
1990
350
1980
450
1970
550
650
750
850
950
1966 1968 1972 1974 1976 1978 1982 1984 1986 1988 1992 1994 1996 1998
Business Jet Deliveries
1965 2011
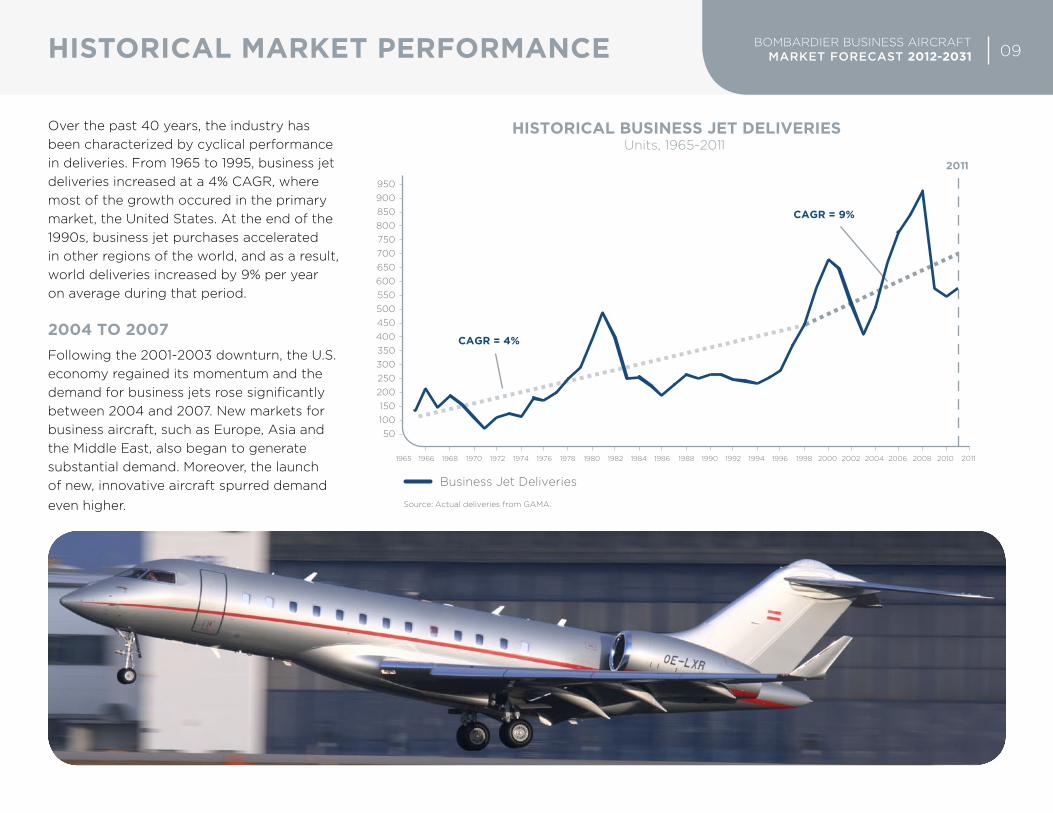
over the past 40 years, the industry has been characterized by cyclical performance in deliveries. from 1965 to 1995, business jet deliveries increased at a 4% cAGr, where most of the growth occured in the primary market, the united states. At the end of the 1990s, business jet purchases accelerated in other regions of the world, and as a result, world deliveries increased by 9% per year on average during that period.
2004 to 2007following the 2001-2003 downturn, the u.s. economy regained its momentum and the demand for business jets rose significantly between 2004 and 2007. new markets for business aircraft, such as europe, Asia and the middle east, also began to generate substantial demand. moreover, the launch of new, innovative aircraft spurred demand even higher.

bombArdier business AircrAft Market forecast 2012-2031 10historical market Performance
2008-2011the near-collapse of the financial markets at the end of 2008 precipitated a sharp downturn in business aviation and new business aircraft orders. order intake stalled in Q4 2008 and remained very low. the inventory of pre-owned aircraft for sale increased dramatically and residual values declined sharply.
bombardier estimates that more than 800 orders were cancelled in the Light to Large categories in 2009. that forced manufacturers to juggle order deferrals and cancellations, and led them to decrease production rates and deliveries. the bottom of the market in terms of demand was reached in the first half of 2009.
from mid-2009 until mid-2012, the market has made progress on many fronts: credit availability is less problematic, business jet usage is rising and gross orders are up. moreover, cancellations are back to relatively low levels. As of Q1-2012, pre-owned inventory is also down significantly at 13.6%, 4.2 percentage points below its mid-2009 peak.
20.1 15.2 15.9 15.512.39.6 9.87.8 14.9 17.6
Figure #6
BUSINESS JET DELIVERY REVENUES$B, 2002-2011
Sources: Revenues estimated from GAMA and B&CA list prices.
2003 20042002 2005 2006 2007 2008 2009 2010 2011
Segments in which Bombardier competes
in 2011, market
fundamentals continued to
improve and order intake
increased significantly.

bombArdier business AircrAft Market forecast 2012-2031 11
current market drivers
bombArdier business AircrAft Market forecast 2012-2031 12current market drivers
the bombardier business Aircraft market forecast uses an econometric model based on several market drivers. the long-term portion of the forecast is explained by both the economic growth and the expected rate of business jet fleet penetration in each of the forecast regions.
economic market drivers
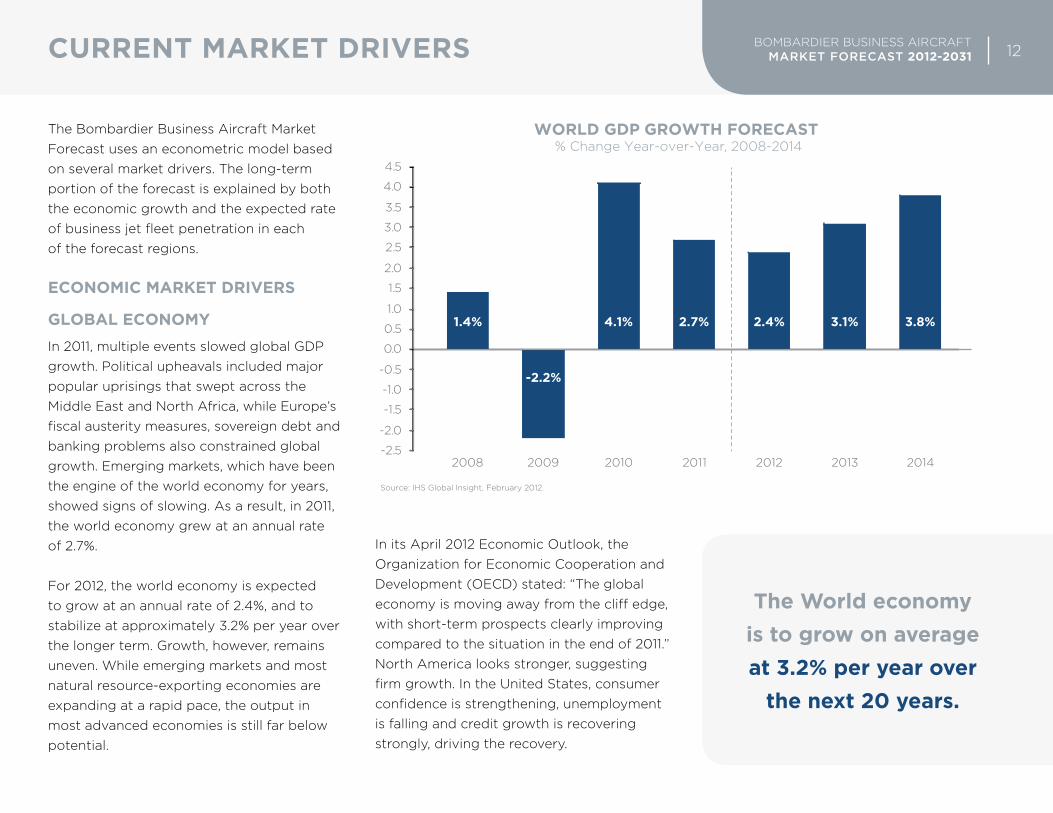
global economyin 2011, multiple events slowed global GdP growth. Political upheavals included major popular uprisings that swept across the middle east and north Africa, while europe’s fiscal austerity measures, sovereign debt and banking problems also constrained global growth. emerging markets, which have been the engine of the world economy for years, showed signs of slowing. As a result, in 2011, the world economy grew at an annual rate of 2.7%.
for 2012, the world economy is expected to grow at an annual rate of 2.4%, and to stabilize at approximately 3.2% per year over the longer term. Growth, however, remains uneven. While emerging markets and most natural resource-exporting economies are expanding at a rapid pace, the output in most advanced economies is still far below potential.
in its April 2012 economic outlook, the organization for economic cooperation and development (oecd) stated: “the global economy is moving away from the cliff edge, with short-term prospects clearly improving compared to the situation in the end of 2011.” north America looks stronger, suggesting firm growth. in the united states, consumer confidence is strengthening, unemployment is falling and credit growth is recovering strongly, driving the recovery.
the World economy is to grow on average at 3.2% per year over
the next 20 years.
Figure #7
WORLD GDP GROWTH FORECAST % Change Year-over-Year, 2008-2014
Source: IHS Global Insight, February 2012.
-2.5
-2.0
-1.5
-1.0
-0.5
0.0
0.5
1.0
1.5
2.0
2.5
3.0
3.5
4.0
4.5
3.8%
-2.2%
2.4%
2.7%
4.1%
3.1%
2009 20102008 2011 20132012
1.4%
2014

bombArdier business AircrAft Market forecast 2012-2031 13current market drivers
Activity in Japan will remain volatile, with moderate growth expected in the first half of the year. in china, recent policy decisions have been effective in partially offsetting external headwinds faced by its export sector. in brazil, a loosening of monetary policy and a boost to investment in infrastructure and energy should help offset economic challenges.
the european economy is expected to remain fragile. major decisions in europe at the beginning of 2012 have improved the outlook, reduced the risk of catastrophe, and moderated the severity of the recession. nevertheless, substantial risks remain in the eurozone: high unemployment, low confidence and weak lending activity prevent the economy from growing.
the oecd also suggests: “the global outlook is still largely dependent on policy actions: in the u.s. the fiscal debt lock must be addressed, in the eurozone the firewall must be significantly strengthened, banks need to be recapitalized.”
We have stepped back from the cliff, but more needs to be done to boost growth and sustain the recovery.
bombArdier business AircrAft Market forecast 2012-2031 14current market drivers
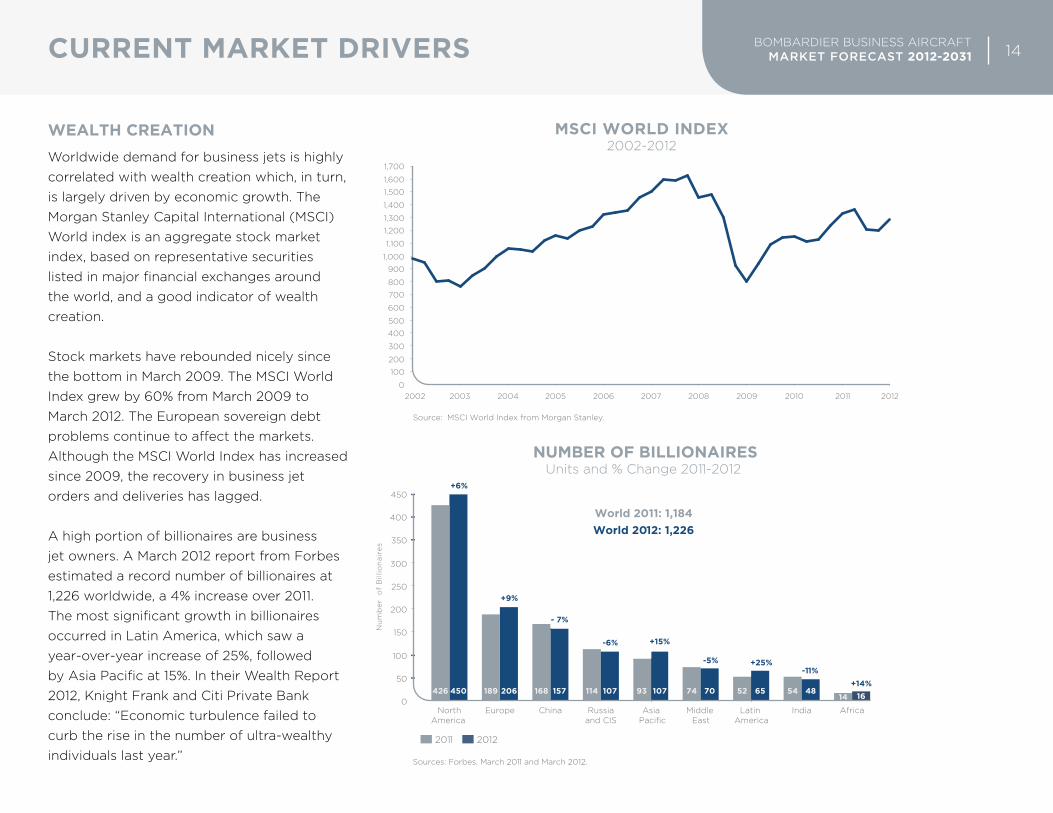
Wealth creationWorldwide demand for business jets is highly correlated with wealth creation which, in turn, is largely driven by economic growth. the morgan stanley capital international (msci) World index is an aggregate stock market index, based on representative securities listed in major financial exchanges around the world, and a good indicator of wealth creation.
stock markets have rebounded nicely since the bottom in march 2009. the msci World index grew by 60% from march 2009 to march 2012. the european sovereign debt problems continue to affect the markets. Although the msci World index has increased since 2009, the recovery in business jet orders and deliveries has lagged.
A high portion of billionaires are business jet owners. A march 2012 report from forbes estimated a record number of billionaires at 1,226 worldwide, a 4% increase over 2011. the most significant growth in billionaires occurred in Latin America, which saw a year-over-year increase of 25%, followed by Asia Pacific at 15%. in their Wealth report 2012, Knight frank and citi Private bank conclude: “economic turbulence failed to curb the rise in the number of ultra-wealthy individuals last year.”
Figure #9
NUMBER OF BILLIONAIRESUnits and % Change 2011-2012
Sources: Forbes, March 2011 and March 2012.
World 2011: 1,184 World 2012: 1,226
+6%
+9%
- 7%
-6% +15%
-5% +25% -11%
+14%
Nu
mb
er
of
Bill
ion
air
es
Russiaand CIS
Middle East
AfricaLatin America
IndiaEurope ChinaNorthAmerica
Asia Pacific
16 14
107
157
107
206
65 450
70
48
250
200
150
100
50
0
300
350
400
450
20122011
426 189 168 114 93 74 52 54
Figure #8
MSCI WORLD INDEX2002-2012
Source: MSCI World Index from Morgan Stanley.
20122011201020092008200720062005200420032002
200
300
400
600
700
800
100
1,500
1,000
500
0
900
1,100
1,200
1,300
1,400
1,600
1,700

bombArdier business AircrAft Market forecast 2012-2031 15current market drivers
business Jet market drivers
business Jet utilizationHistorically, business jet utilization is an indication of the overall health of the industry. the federal Aviation Administration (fAA) and eurocontrol record the number of take-offs and landings at u.s. and european airports respectively.
the busiest airports for business jet move-ments in the u.s. include teterboro, White Plains and Washington-dulles. Around the
world, Paris-Le bourget, Geneva, nice, London-Luton, farnborough, mexico city-toluca, moscow-Vnukovo, Johannesburg-Lanseria and beijing-capital are among the most significant business jet airports.
in both the u.s. and europe, business jet usage made little progress in 2011 over 2010. in its April 2011 briefing on business Aviation in europe, eurocontrol predicted that utiliza-tion wouldn’t return to pre-crisis growth rates in the medium-term, given the relative weak-ness of european economies.
Figure #10
U.S. BUSINESS JET UTILIZATIONTake-o�s and Landings (’000), 2009-2012
Source: FAA.
Q4 09 Q1 12Q4 11Q3 11Q2 11Q1 11 Q4 10 Q3 10 Q2 10 Q1 10
Take-o�s and Landings (’000)
-1%-1% 4% 1%
5% 8% 10% 15% 16%
0%
Take-o�s and Landings YoY (%)
EUROPEAN BUSINESS JET UTILIZATIONTake-o�s and Landings (’000), 2009-2012
Source: Eurocontrol.
945 960 1,001 1,018 1,019 1,006 1,041 1,013 1,010 1,015
99105
137128
100108
133120
97103
-1% -3% 3%
7% 3% 5% 7% 6%
9%
0%
Q4 09 Q1 10 Q2 10 Q3 10 Q4 10 Q1 11 Q2 11 Q3 11 Q4 11 Q1 12
Take-o�s and Landings (’000) Take-o�s and Landings YoY (%)
bombArdier business AircrAft Market forecast 2012-2031 16current market drivers
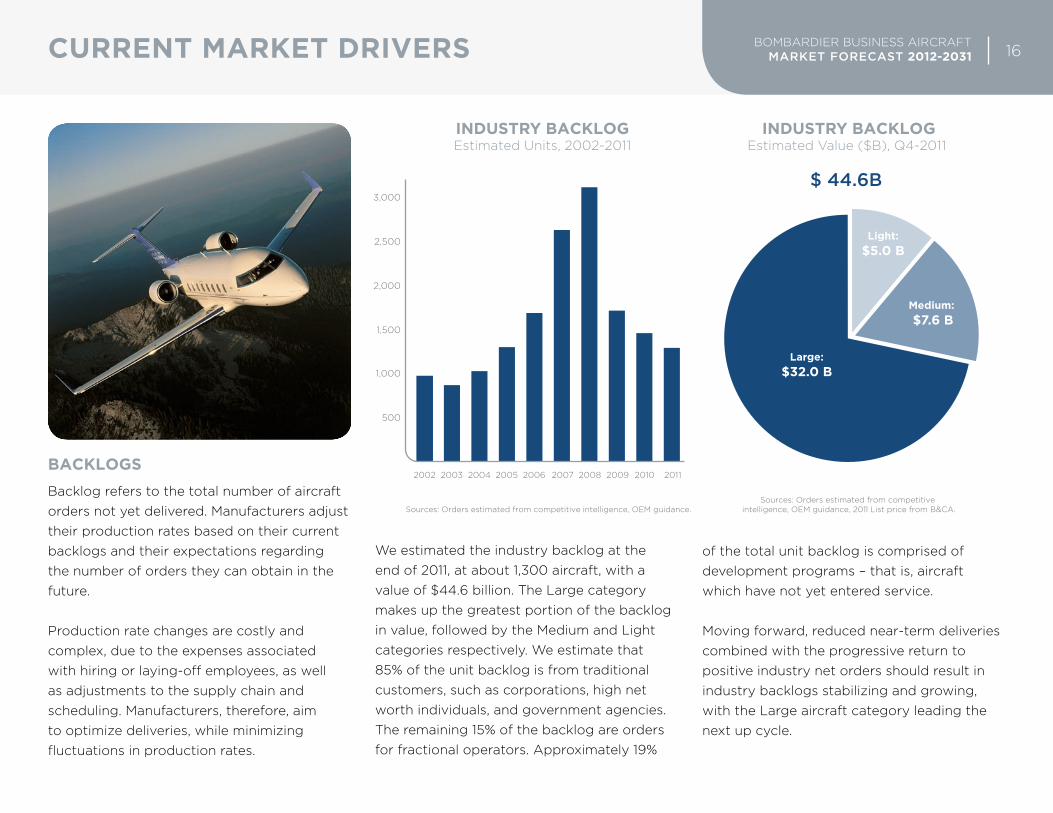
backlogsbacklog refers to the total number of aircraft orders not yet delivered. manufacturers adjust their production rates based on their current backlogs and their expectations regarding the number of orders they can obtain in the future.
Production rate changes are costly and complex, due to the expenses associated with hiring or laying-off employees, as well as adjustments to the supply chain and scheduling. manufacturers, therefore, aim to optimize deliveries, while minimizing fluctuations in production rates.
We estimated the industry backlog at the end of 2011, at about 1,300 aircraft, with a value of $44.6 billion. the Large category makes up the greatest portion of the backlog in value, followed by the medium and Light categories respectively. We estimate that 85% of the unit backlog is from traditional customers, such as corporations, high net worth individuals, and government agencies. the remaining 15% of the backlog are orders for fractional operators. Approximately 19%
of the total unit backlog is comprised of development programs – that is, aircraft which have not yet entered service.
moving forward, reduced near-term deliveries combined with the progressive return to positive industry net orders should result in industry backlogs stabilizing and growing, with the Large aircraft category leading the next up cycle.
Sources: Orders estimated from competitive intelligence, OEM guidance.
INDUSTRY BACKLOGEstimated Units, 2002-2011
500
1,000
1,500
2,000
2,500
3,000
2002 2003 2004 2005 2006 2007 2008 2009 2010 2011
Sources: Orders estimated from competitive intelligence, OEM guidance, 2011 List price from B&CA.
INDUSTRY BACKLOGEstimated Value ($B), Q4-2011
$ 44.6B
Large: $32.0 B
Light:$5.0 B
Medium: $7.6 B

bombArdier business AircrAft Market forecast 2012-2031 17current market drivers
the Pre-oWned aircraft marketmore than 85% of new business jet orders originate from existing owners, either to replace or expand their fleet. the demand for new aircraft is stimulated by the conditions prevailing on the pre-owned market. this market is considered healthy when residual values are high and when the inventory of used aircraft for sale is low.
At the end of 2007, the pre-owned inventory sat at a low of 10.5% of the business aircraft fleet. the accumulation of aircraft on the pre-owned market was a leading indicator of
the new business aircraft market downturn that started a year later.
in early 2008, the percentage of the overall business jet fleet for sale on the pre-owned market started to increase rapidly. many owners experienced difficulties selling their aircraft, which, in turn, made these owners less likely to purchase new aircraft. the inventory peaked at 17.8% in Q2 2009. financing became very difficult for aircraft more than 15 years old.
from mid-2009 until now, sales of pre-owned aircraft have increased and inventory has
declined. by Q1 2012, pre-owned inventories continued to fall, to 13.6%. We expect pre-owned inventories to stabilize in the range of 11% to 13% of the fleet.
As for residual values, they remained elevated through the first half of 2008 due to manufac-turers’ long backlogs. since then, residual values have dropped across all aircraft catego-ries. during 2009, average business jet residual values fell by 27 percentage points. by Q1 2012, residual values appeared to have bottomed with the average value for a 5-year old business jet at 63% of the original business & commercial Aviation (b&cA) magazine list price.
Figure #14
Source: Aircraft inventory and fleet from Jetnet. Excludes Very Light Jet Segment.
PRE-OWNED AIRCRAFT INVENTORY AS A % OF THE FLEET
%, 2006-2012
Q1 06
Q2 06
Q3 06
Q4 06
Q1 07
Q2 07
Q3 07
Q4 07
Q1 08
Q2 08
Q3 08
Q4 08
Q1 09
Q2 09
Q3 09
Q4 09
Q1 10
Q2 10
Q3 10
Q4 10
Q1 1 1
Q2 11
Q3 11
Q4 11
Q1 12
10.5%
17.8%
13.6%
5-YEAR RESIDUAL VALUE AS A % OF THE ORIGINAL B&CA LIST PRICE
%, 2006-2012
Sources: Residual values from Aircraft Bluebook Price Digest, original list price from B&CA.
92%
67% 59% 63%
Q1 06
Q2 06
Q3 06
Q4 06
Q1 07
Q2 07
Q3 07
Q4 07
Q1 08
Q2 08
Q3 08
Q4 08
Q1 09
Q2 09
Q3 09
Q4 09
Q1 10
Q2 10
Q3 10
Q4 10
Q1 1 1
Q2 11
Q3 11
Q4 11
Q1 12
bombArdier business AircrAft Market forecast 2012-2031 18current market drivers
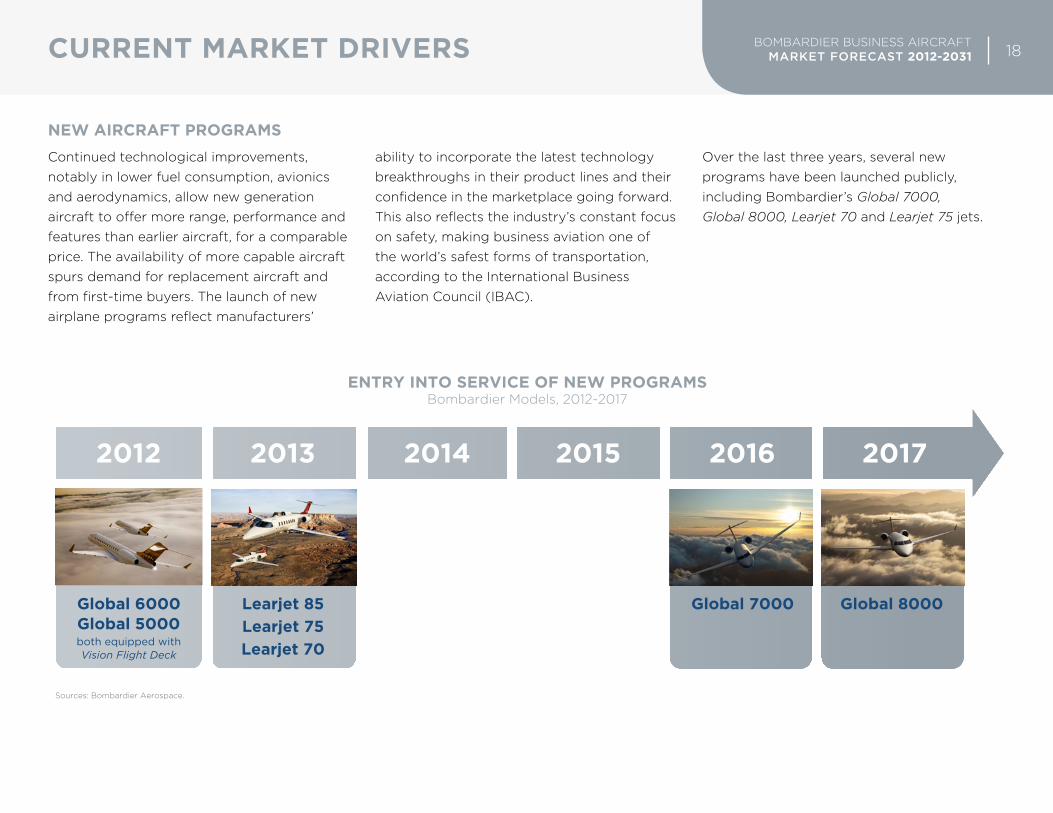
neW aircraft Programscontinued technological improvements, notably in lower fuel consumption, avionics and aerodynamics, allow new generation aircraft to offer more range, performance and features than earlier aircraft, for a comparable price. the availability of more capable aircraft spurs demand for replacement aircraft and from first-time buyers. the launch of new airplane programs reflect manufacturers’
ability to incorporate the latest technology breakthroughs in their product lines and their confidence in the marketplace going forward. this also reflects the industry’s constant focus on safety, making business aviation one of the world’s safest forms of transportation, according to the international business Aviation council (ibAc).
over the last three years, several new programs have been launched publicly, including bombardier’s Global 7000, Global 8000, Learjet 70 and Learjet 75 jets.
2012 2013 2017
ENTRY INTO SERVICE OF NEW PROGRAMSBombardier Models, 2012-2017
Global 6000Global 5000 both equipped withVision Flight Deck
Learjet 85Learjet 75Learjet 70
Sources: Bombardier Aerospace.
2014 2016
Global 7000
2015
Global 8000

bombArdier business AircrAft Market forecast 2012-2031 19current market drivers
fractional and branded charter demandfractional ownership, through which several users acquire ownership interests in the same aircraft, has existed since the mid-1990s and has accounted for an average of 10% to 15% of business jet deliveries. in the 1995-2011 period, fractional operators took delivery of more than 1,150 business jets. other alternatives to conventional ownership include “fractional card” and “jet card” programs, through which customers obtain on-demand access to a third party-operated business jet.
there are currently four large operators in the fractional ownership industry, including flexjet by bombardier. one operator, citationAir, has announced plans to exit the fractional ownership market, but will remain in the jet card and jet management businesses. the fractional ownership industry went through a period of fleet rationalisation in 2009, resulting in a substantial reduction of its order backlog. fractional program orders have since resumed growth; in particular, netJets placed signficant volume orders between 2010 and 2012, including firm orders for 50 bombardier Global and 100 bombardier Challenger aircraft.

bombArdier business AircrAft Market forecast 2012-2031 20current market drivers
the growth in the number of branded charter operators is more recent. these operators offer on-demand lift and compete on trip-specific pricing. branded charter operators, like Vistajet or XoJet, are characterized by sophisticated operations infrastructure and greater use of airline-style scheduling prac-tices to minimize deadhead costs. in 2008, branded charter operator orders represented approximately 20% to 30% of total business jet orders. in 2009, the aftermath of the economic downturn caused branded charter operators to defer and cancel orders.
Large fleet operators are growing again and have placed orders for additional business jets in 2010 and 2011.
in the near-term, fractional market demand will be mainly for fleet replacement. fractional operators are expected to account for approximately 10% of business jet deliveries over the next 20 years.
Figure #17
+
Hours
Per
Year
–
- Personalized service +
AIR-TRAVEL OPTIONS
Commercial – aviation o�ering
Low costairlines
Commercialairlines
First-class commercial
airlines
Air Taxis Charters/BrandedCharters
Jet-cardprograms
Fractionalownership
Fullownership
On-demand service Business jet ownership
Business jet market
Source: Bombardier Aerospace.
BUSINESS JET FRACTIONAL FLEETUnits, 2002-2011
Source: Jetnet. Includes the 4 major fractional providers: Flexjet, NetJets (all subsidiaries), CitationAir, Flight Options.
2002 2003 2004
900
800
700
600
500
400
300
200
100
0
2005 2007
2010 20112008 2009
2006
fractional operators are expected to account for approximately 10% of
business jet deliveries over the next 20 years.

business Jet Penetration in groWth marketsbusiness jet penetration is a measure of the number of business jets in each of the forecast regions relative to the size of that region’s economy, as represented by gross domestic product (GdP). to normalize for differing population sizes in each region, penetration rates and GdP are best compared on a per capita basis. the penetration rate of business jets by region is highly variable. the most established market for business jets, north America, has the world’s largest fleet, which continues to grow, but slowly. china, in contrast, has a very small number of business jets relative to the size of its economy and its business jet fleet is now entering a rapid growth phase.
Longer term business jet fleet growth by region is best represented by an expected market maturity curve resembling an “s” shape, with the fastest growth occurring in the early phase of market adoption and slowing growth as the market matures.
Projected GdP growth can be used to forecast the likely trajectory of the business jet penetration for each region. realization of fleet growth implicitly assumes expected adoption and acceptance of business jets and the progressive removal of barriers, notably
the lack of adequate infrastructure and regulatory limitations. As the economy develops, the expected growth of the business jet fleet in each region can reasonably be predicted over the longer term. once fleet sizes are netted of aircraft retirements, business jet deliveries can be derived for each region.
NORTH AMERICA
LATIN AMERICA
MIDDLE-EAST& AFRICA
ASIA
EUROPE &RUSSIA
1st driving force: GDP growth
2nd driving force:
removal of barriers
Averagegrowth path
GDP per Capita ($, Log Scale)
10,000
1,000
100
10
1
100 1,000 10,000 100,000
PENETRATION RATES BY REGIONFleet per Capita vs. GDP per Capita, 1960-2011
Sources: Ascend, IMF, IHS Global Insight, UN population project, Bombardier forecast. Includes Very Light Jets.
Fle
et p
er 1
00
Mill
ion
Po
pu
lati
on
(Lo
g S
cale
)
the penetration rate of
business jets by region is
highly variable; each region
is at a different stage.
bombArdier business AircrAft Market forecast 2012-2031 21current market drivers

Goldman sachs Asset management has introduced the term “growth market” to define any country outside the developed world that is responsible for at least 1% of global GdP. these economies are most likely to “experience rising productivity coupled with favorable demographics and, therefore, a faster growth rate than the world average going forward.” these include the bric countries (brazil, russia, india and china), as well as mexico, south Korea, turkey and indonesia. We expect a significant share of business jets to be delivered in these growth markets.
aircraft retirementsAs of the end of 2011, the average age of the worldwide business jet fleet was 15.9 years, with 60% of the fleet at less than 15 years old. At the other end of the spectrum, around 200 aircraft are more than 40 years old.
to date, the total number of permanent retirements of business jets has been low, equivalent to about 7% of total deliveries since 1965. However, as a result of emerging environmental concerns, new regulations and airspace modernization, the retirement of the oldest business jets is expected to accelerate. environmental regulations include potential airport restrictions on stage 2 business jet operations and the introduction of the
emissions trading scheme (ets) in europe taking effect in 2012. the ets will penalize aircraft with older technology engines that burn more fuel and emit more greenhouse gases (such as co2). similarly, planned air-space modernization in the united states (fAA nextGen), in europe (single european sky) and elsewhere will require advanced flight deck avionics technologies and it may not be economically feasible to retrofit older aircraft, rendering these types obsolete.
these dynamics will result in a reduction of
the business jet fleet half-life (age at which 50% of aircraft have retired) from 40 years in 2011 to 30 years in 2031.
the number of aircraft that retire within the forecast period will vary considerably by region. naturally, the regions having well established business jet fleets and older aircraft will experience the greatest numbers of retirements. regions that currently have relatively small business jet fleets, such as china, will experience comparatively fewer retirements during the forecast period.
bombArdier business AircrAft Market forecast 2012-2031 22current market drivers
BUSINESS JET DELIVERIES AND RETIREMENTS BY AGE GROUP1965-2011
Source: Ascend.
Total deliveries: 16,330 Total retirements: 1,130 Current fleet: 15,200
1-5 6-10 11-15 16-20 21-25 26-30 31-35 36-40 >40
3,410
3,410
2,840
2,840
2,690
2,690
1,360
1,365
1,240
1,25515
40 110
1,480
1,520
1,480
1,590
490210
200 760
970
690
5
0% 0% 0% 0% 1% 3% 7%
In Service Retired % Retired
29%
78%
Aircraft Age Groups
Retired
Current Fleet

bombArdier business AircrAft Market forecast 2012-2031 23
the forecast

orders, deliveries and revenuesWhile leading indicators for business aviation gradually improved in 2011, the disparity in economic recovery among regions is becoming more apparent, with north America set for growth while europe remains under strong pressure and Asia slows its expansion.
industry deliveries are expected to lag order intake as manufacturers strive to maintain acceptable backlog levels. business jet deliveries for 2012 are expected to be comparable to 2011, just under 600 aircraft. deliveries are expected to accelerate in 2013 and we forecast that the industry will surpass the 2008 delivery peak, as early as 2016.
bombArdier business AircrAft Market forecast 2012-2031 24the forecast
BUSINESS JET INDUSTRY 20-YEAR DELIVERIES OUTLOOKUnits, 1992-2031
Source: Bombardier Forecasting Model.
1992-2001 3,950 units
2002-2011 6,300 units
2012-2021 9,800 units
2022-2031 14,200 units
700
600
100
200
400
1,500
300
500
1,000
800
900
1,100
1,200
1,300
1,400
92 94 96 98 00 02 04 06 08 10 12 14 16 18 20 22 24 26 28 30
HISTORY FORECAST
We forecast that the industry will surpass the prior delivery peak year
by as early as 2016.
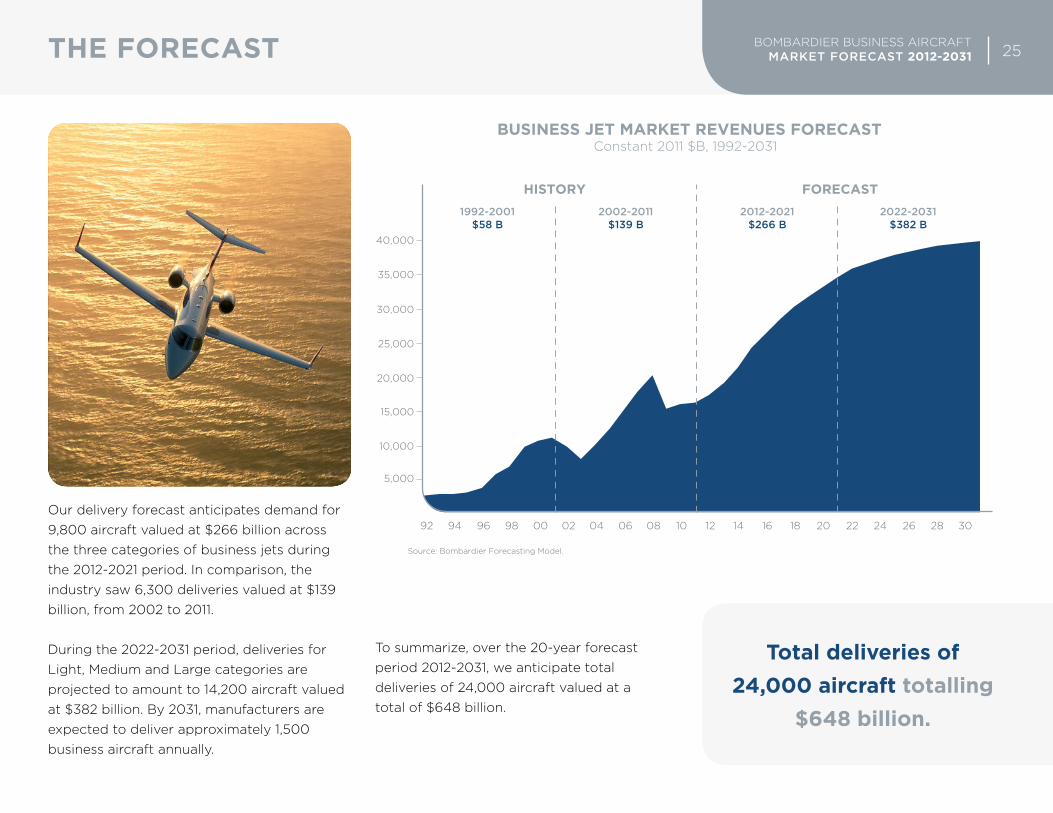
our delivery forecast anticipates demand for 9,800 aircraft valued at $266 billion across the three categories of business jets during the 2012-2021 period. in comparison, the industry saw 6,300 deliveries valued at $139 billion, from 2002 to 2011.
during the 2022-2031 period, deliveries for Light, medium and Large categories are projected to amount to 14,200 aircraft valued at $382 billion. by 2031, manufacturers are expected to deliver approximately 1,500 business aircraft annually.
to summarize, over the 20-year forecast period 2012-2031, we anticipate total deliveries of 24,000 aircraft valued at a total of $648 billion.
bombArdier business AircrAft Market forecast 2012-2031 25the forecast
total deliveries of 24,000 aircraft totalling
$648 billion.
BUSINESS JET MARKET REVENUES FORECASTConstant 2011 $B, 1992-2031
Source: Bombardier Forecasting Model.
1992-2001 $58 B
2002-2011 $139 B
2012-2021
$266 B
2022-2031
$382 B
20,000
10,000
40,000
35,000
30,000
25,000
15,000
5,000
92 94 96 98 00 02 04 06 08 10 12 14 16 18 20 22 24 26 28 30
HISTORY FORECAST

regional detailsthe forecast is broken down into eight geographic regions: north America, europe, china, india, Latin America, russia and the commonwealth of independent states (cis), middle east and Africa, and Asia Pacific. deliveries for each region are presented below in the form of two proportional bubbles according to expected delivery quantities, where the inner bubble represents deliveries in the 2012-2021 period, and the outer (larger) bubble represents deliveries in the 2022-2031 period.
bombArdier business AircrAft Market forecast 2012-2031 26the forecast
India2012-2021: 3852022-2031: 960
North America2012-2021: 4,100
2022-2031: 5,400
Europe2012-2021: 1,7002022-2031: 2,220
Africa2012-2021: 325
2022-2031: 485Latin America
2012-2021: 9852022-2031: 1,300
Russia and CIS2012-2021: 525
2022-2031: 1,025
China2012-2021: 1,0002022-2031: 1,420
Asia Pacific2012-2021: 3702022-2031: 615
MiddleEast
2012-2021: 4102022-2031: 775
Source: Bombardier forecast.
INDUSTRY DELIVERIES BY REGION2012-2021 vs. 2022-2031

north america (United StateS and Canada)
north America is, by far, the largest market for business jets and key to the long-term success of the industry.
the u.s. economy has been recovering since mid-2009. in recent quarters, the economy has been strengthened by the ongoing rebound in employment, stronger consumer confidence, higher equity prices and credit growth. notably, corporate profitability is at record levels. However, risks remain to the economy in terms of surging gasoline prices driving up inflation, sluggish worldwide growth impacting exports and high debt levels. this is also a presidential election
year, which could impact u.s. corporate and personal buying decisions.
canada accounts for about 4% of the business jet demand in north America. According to iHs Global insight, the canadian economy
grew at a rate of 2.3% in 2011 and is expected to grow at a slower rate of around 2% in 2012. While many sectors have performed well, canadian economic growth is being impacted by high household debt, government deficits and associated restraint measures.
bombArdier business AircrAft Market forecast 2012-2031 27the forecast Figure #24
BUSINESS JET PENETRATION FORECAST – NORTH AMERICAFleet per Capita vs. GDP per Capita, 1960-2031
Sources: Ascend, IMF, IHS Global Insight, UN population project, Bombardier forecast. Includes Very Light Jets.
1961
1971
19811991
2001201120212031
10,000
1,000
100
100 1,000 10,000 100,000
10
1
Fle
et p
er 1
00
Mill
ion
Po
pu
lati
on
(L
og
Sca
le)
GDP per Capita ($, Log Scale)
ActualsForecast
the canadian economy is highly reliant on commodity exports and is therefore affected by the economic health of its southern neighbor and the rest of the world.
According to iHs Global insight, real GdP growth for north America should improve this year over last year, with 2.1% growth in 2012, up from 1.8% in 2011. economic growth should remain steady for the region over the 2012-2031 period, averaging 2.5%.
business aviation began in north America in the 1960s by leveraging the established gen-eral aviation infrastructure. As a consequence, the business aviation industrial network, including manufacturers, suppliers, fixed base operators (fbos), and dedicated airports, experienced rapid expansion. this development path explains the unique shape of the historical business jet penetration curve for north America, which is significantly higher than other regions.
north America is the world’s most mature market. Aircraft replacement is an important driver of business jet demand in north America. following the downturn of 2009-2010, many buyers deferred replacement decisions.
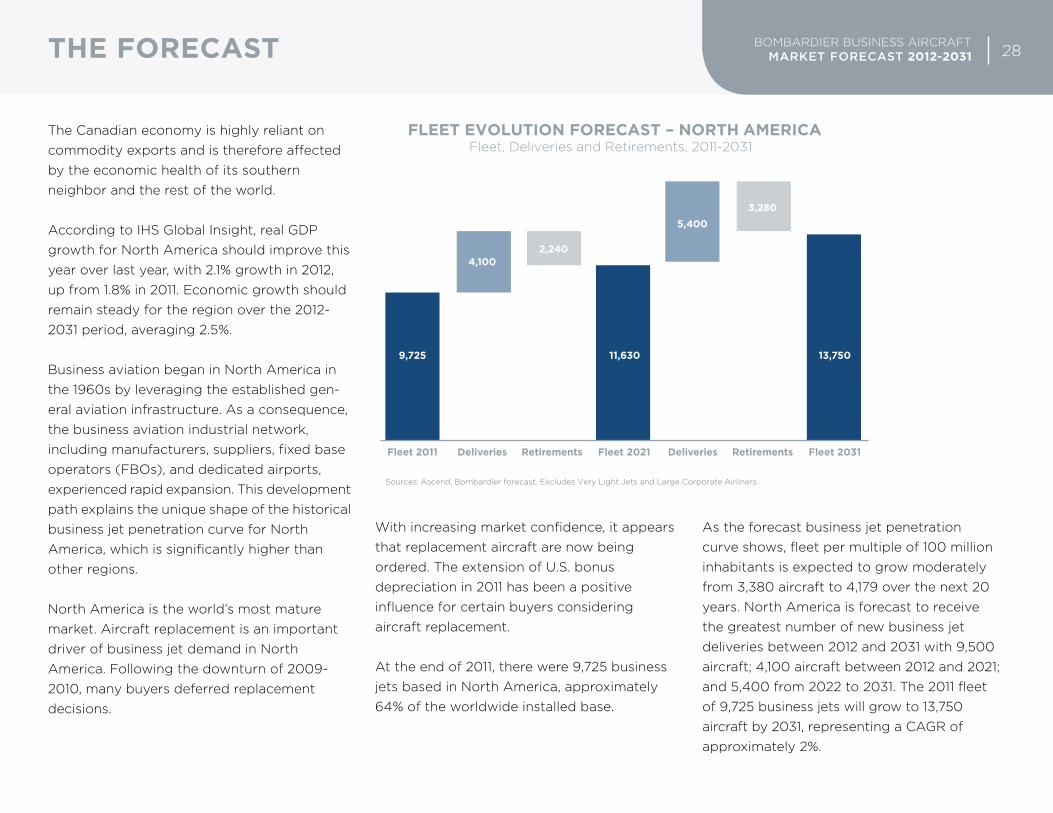
With increasing market confidence, it appears that replacement aircraft are now being ordered. the extension of u.s. bonus depreciation in 2011 has been a positive influence for certain buyers considering aircraft replacement.
At the end of 2011, there were 9,725 business jets based in north America, approximately 64% of the worldwide installed base.
As the forecast business jet penetration curve shows, fleet per multiple of 100 million inhabitants is expected to grow moderately from 3,380 aircraft to 4,179 over the next 20 years. north America is forecast to receive the greatest number of new business jet deliveries between 2012 and 2031 with 9,500 aircraft; 4,100 aircraft between 2012 and 2021; and 5,400 from 2022 to 2031. the 2011 fleet of 9,725 business jets will grow to 13,750 aircraft by 2031, representing a cAGr of approximately 2%.
bombArdier business AircrAft Market forecast 2012-2031 28the forecast
Figure #25
FLEET EVOLUTION FORECAST – NORTH AMERICAFleet, Deliveries and Retirements, 2011-2031
Sources: Ascend, Bombardier forecast. Excludes Very Light Jets and Large Corporate Airliners.
9,725
Fleet 2011 Deliveries Retirements Fleet 2021 Deliveries Retirements Fleet 2031
4,1002,240
11,630
5,4003,280
13,750

euroPe
Although the collapse of the eurozone was avoided during 2011, europe is still suffering from economic difficulties. the sovereign debt crisis weighs heavily on consumer and business confidence across the region. Growth differs significantly between the relatively healthy northern countries, led by Germany, and struggling southern countries.
the German economy is performing well and the strength of its exports has made it the economic engine of europe. the German economy is likely to grow in 2012. At 5.5%, it has one of the lowest unemployment rates in europe, according to the oecd, as of december 2011.
france is currently facing rising unemployment and a weak economy. the new french President, françois Hollande, will therefore have to address multiple challenges during his first year. He will seek to recalibrate french policies regarding the european union
through an attempt to renegotiate the eurozone fiscal measures.
britain’s economy was weak at the beginning of 2012, affected by fiscal austerity and the lengthened eurozone crisis.
bombArdier business AircrAft Market forecast 2012-2031 29the forecast Figure #26
1961
1971
19811991
2001
2011
20212031
BUSINESS JET PENETRATION FORECAST – EUROPEFleet per Capita vs. GDP per Capita, 1960-2031
Sources: Ascend, IMF, IHS Global Insight, UN population project, Bombardier forecast. Includes Very Light Jets.
10,000
1,000
100
100 1,000 10,000 100,000
10
1
Fle
et p
er 1
00
Mill
ion
Po
pu
lati
on
(L
og
Sca
le)
GDP per Capita ($, Log Scale)
ActualsForecast
A highly ambitious fiscal tightening program requiring tax increases and significant public spending cuts will continue to affect uK’s economic activity in 2012. Hence, according to the economist intelligence unit (eiu), the uK is expected to grow by a weak 0.2% in 2012.
despite the fact that Greece and its major bondholders came to an agreement in march 2012 to restructure the Greek debt, the country remains under intense pressure. the Greek economy is expected to contract again in 2012 for a fifth consecutive year, according to projections from the imf. in addition, political turmoil and economic difficulties could still trigger a debt default in the near-term, forcing Greece to exit the eurozone, a scenario that is 35% likely, according to morgan stanley.
overall, after having its GdP decline by 4.1% in 2009, the eurozone countries rebounded with 2.2% growth in 2010 and 1.9% in 2011. However, Q1 2012 economic indicators highlight the
fragility of the european economy. According to deutsche bank, the eurozone GdP is anticipated to contract by 0.2% in 2012, as pessimism persists, especially in Greece, spain, Portugal and italy. from 2012 to 2031, growth is expected to average 1.9%.
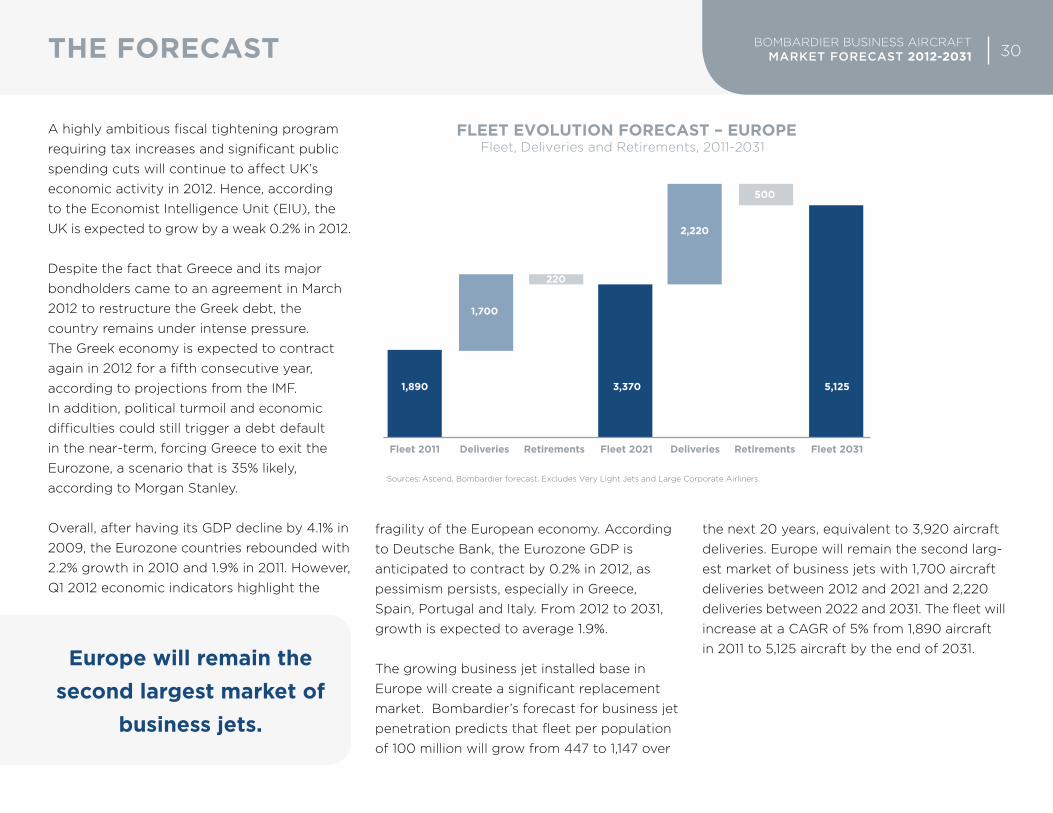
the growing business jet installed base in europe will create a significant replacement market. bombardier’s forecast for business jet penetration predicts that fleet per population of 100 million will grow from 447 to 1,147 over
the next 20 years, equivalent to 3,920 aircraft deliveries. europe will remain the second larg-est market of business jets with 1,700 aircraft deliveries between 2012 and 2021 and 2,220 deliveries between 2022 and 2031. the fleet will increase at a cAGr of 5% from 1,890 aircraft in 2011 to 5,125 aircraft by the end of 2031.
bombArdier business AircrAft Market forecast 2012-2031 30the forecast
Figure #27
FLEET EVOLUTION FORECAST – EUROPEFleet, Deliveries and Retirements, 2011-2031
Sources: Ascend, Bombardier forecast. Excludes Very Light Jets and Large Corporate Airliners.
1,890
Fleet 2011 Deliveries Retirements Fleet 2021 Deliveries Retirements Fleet 2031
1,700
220
3,370
2,220
500
5,125
europe will remain the second largest market of
business jets.

bombArdier business AircrAft Market forecast 2012-2031 31the forecast
china
during the last recession, the chinese economy probably prevented the world economy from contracting more than it did. However, the chinese economy is starting to show some signs of vulnerability. it is in the midst of a gradual slowdown, due to the combined impact of lower exports to Western economies and tighter domestic policies. most economists agree that china’s economy will likely avoid a hard landing in the short term.
industrial value added output was up by 11.4% year on year in January-february – its slowest rate of growth in two years. Accord-ing to the economist intelligence unit, GdP growth is expected to reach 8.2% in 2012
and 8.6% in 2013. china posted double-digit growth during most of the past decade.
traditionally driven by export markets, china is determined to accelerate its transition toward a more domestically based economy.
taking a longer term perspective, china and india are expected to lead world economic growth. According to iHs Global insight, china is expected to account for annual average GdP growth of 6.3% for the next 20 years.
Figure #28
1981 1991
2001
2011
2021
2031
BUSINESS JET PENETRATION FORECAST – CHINAFleet per Capita vs. GDP per Capita, 1960-2031
Sources: Ascend, IMF, IHS Global Insight, UN population project, Bombardier forecast. Includes Very Light Jets.
10,000
1,000
100
100 1,000 10,000 100,000
10
1
Fle
et p
er 1
00
Mill
ion
Po
pu
lati
on
(L
og
Sca
le)
GDP per Capita ($, Log Scale)
ActualsForecast

business aviation in china is in its very early stage. over the past years, significant barriers have prevented the chinese business jet market from growing to its potential. restrictive airspace access, high aircraft import taxes, a shortage of airport infrastructure for business aviation and high user fees are among the factors which explain why china only hosts an installed base of some 210 business jets for a population of 1.3 billion. nevertheless, the number of civil airports in china is expected to grow from 156 in 2009 to 244 by 2020, according to the General Ad-ministration of civil Aviation of china (cAAc). Aside from its buoyant economic growth, many factors suggest that china holds the potential for rapid business aircraft market development in the coming years. the chinese population of billionaires has been increasing by 16% annually between 2008 and 2012, totaling 157 individuals as of 2012, according to forbes. china is already the second largest luxury goods market, and is forecast to take first place by 2015, according to boston consulting Group. this year’s forbes Global 2000 list of the biggest and most powerful companies in the world include 207 chinese companies with Petrochina and industrial and commercial bank of china (icbc) ranking in the top 10.
ultimately, we expect that the cultural acceptance of business aviation, the rapid growth of High net Worth individuals (HnWis), the plans for new airports, and the recent improvements to flight planning regulation and airspace liberalization will allow business aviation to blossom in china over the next 20 years.
demand for business jets should increase as barriers progressively come down. over the forecast period, china’s business jet fleet penetration per population of 100 million will grow from 16 to 195, translating into 2,420
deliveries over 20 years. china is the third largest region for business jet deliveries in our forecast, which predicts that 1,000 aircraft will be delivered between 2012 and 2021 and 1,420 aircraft between 2022 and 2031. the fleet of 210 aircraft at the end of 2011 will increase to 2,590 aircraft by the end of 2031, equivalent to a cAGr of 13%.
bombArdier business AircrAft Market forecast 2012-2031 32the forecast
Figure #29
FLEET EVOLUTION FORECAST – CHINAFleet, Deliveries and Retirements, 2011-2031
Sources: Ascend, Bombardier forecast. Excludes Very Light Jets and Large Corporate Airliners.
210
Fleet 2011 Deliveries Retirements Fleet 2021 Deliveries Retirements Fleet 2031
1,000
10
1,200
1,420
30
2,590
china holds the potential for rapid business aircraft
market development.
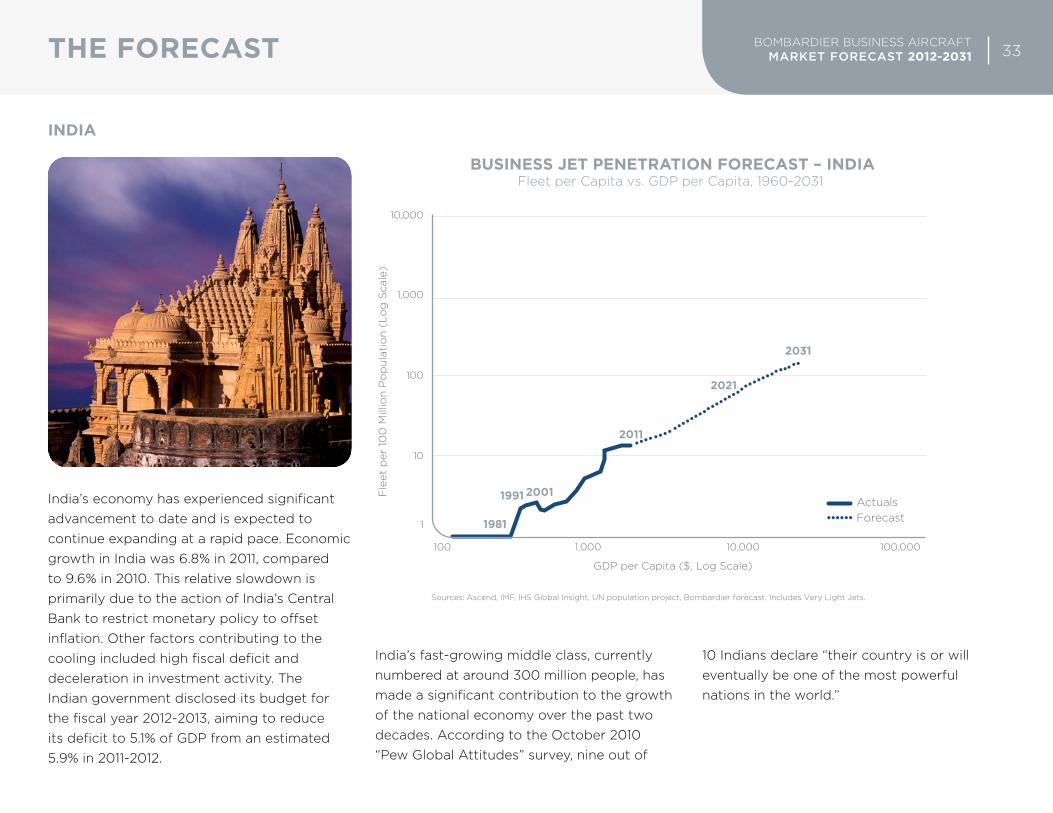
india
india’s economy has experienced significant advancement to date and is expected to continue expanding at a rapid pace. economic growth in india was 6.8% in 2011, compared to 9.6% in 2010. this relative slowdown is primarily due to the action of india’s central bank to restrict monetary policy to offset inflation. other factors contributing to the cooling included high fiscal deficit and deceleration in investment activity. the indian government disclosed its budget for the fiscal year 2012-2013, aiming to reduce its deficit to 5.1% of GdP from an estimated 5.9% in 2011-2012.
india’s fast-growing middle class, currently numbered at around 300 million people, has made a significant contribution to the growth of the national economy over the past two decades. According to the october 2010 “Pew Global Attitudes” survey, nine out of
10 indians declare “their country is or will eventually be one of the most powerful nations in the world.”
bombArdier business AircrAft Market forecast 2012-2031 33the forecast
1981
1991 2001
2011
2021
2031
BUSINESS JET PENETRATION FORECAST – INDIAFleet per Capita vs. GDP per Capita, 1960-2031
Sources: Ascend, IMF, IHS Global Insight, UN population project, Bombardier forecast. Includes Very Light Jets.
10,000
1,000
100
100 1,000 10,000 100,000
10
1
Fle
et p
er 1
00
Mill
ion
Po
pu
lati
on
(L
og
Sca
le)
GDP per Capita ($, Log Scale)
ActualsForecast

According to the World bank, india’s real GdP growth is anticipated to be 6.5% in 2012. iHs Global insight predicts india to be the world’s fastest growing region from 2012 to 2031, with GdP growth averaging 7.4% per year and surpassing china by almost 1 percentage point. moreover, forbes estimated that the number of billionaires in india has more than doubled, reaching 55 in 2012, up from 23 in 2006.
Although the government of india has increased infrastructure investments under the eleventh five Year Plan for 2008-2012, the lack of aviation infrastructure remains an issue for the business aviation industry. in addition, stringent government regulations, high import taxes and duties as well as long procedures for aircraft imports are preventing india’s business aviation sector from reaching its full potential. there are, however, signs of improvement, as the Airports Authority of india (AAi) has announced plans to modernize many airports and bring 32 currently unused airports into operation over the next 10 years. As the installed base of business jets in india is small and relatively young (8.9 years old at the end of 2011), retirements will not be a major driver in this market.
As the forecast business jet penetration curve shows, fleet per 100 million population is expected to grow from 12 to 121 over the next 20 years. business jet sales should accelerate due to economic growth and wealth creation. india is forecast to take delivery of 1,345 business aircraft during the period from 2012 to 2031, with 385 deliveries between 2012 and 2021 and 960 from 2022 to 2031. the 2011 fleet of 115 business jets will grow to 1,420 aircraft by 2031, resulting in a cAGr of approximately 13%.
bombArdier business AircrAft Market forecast 2012-2031 34the forecast
Figure #31
FLEET EVOLUTION FORECAST – INDIAFleet, Deliveries and Retirements, 2011-2031
Sources: Ascend, Bombardier forecast. Excludes Very Light Jets and Large Corporate Airliners.
115
Fleet 2011 Deliveries Retirements Fleet 2021 Deliveries Retirements Fleet 2031
385
10
490
960
30
1,420

latin america
Latin America is a diverse region and, for the purposes of the forecast, comprises all countries between the rio Grande and cape Horn. Latin American economies grew at 4.2% in 2011, due to rising commodity prices and increasing employment, which boosted export revenue and consumption demand respectively.
to anticipate and offset the deceleration of economic growth in the region, some countries, brazil in particular, have already adopted stimulus packages.
Latin America’s largest economy, brazil,has emerged as an important global player. brazil’s active exports policy, abundant natural resources and strong industrial capacity have stimulated the growth of its economy.
brazil is preparing to host the 2014 fifA World cup and the 2016 olympics, which will bring increased international exposure. the economy of the region has traditionally been driven by exports of manufactured goods, agricultural products and natural re-sources, such as oil and minerals.
bombArdier business AircrAft Market forecast 2012-2031 35the forecast Figure #32
1981
1971
1961
1991 2001
2011 20212031
BUSINESS JET PENETRATION FORECAST – LATIN AMERICAFleet per Capita vs. GDP per Capita, 1960-2031
Sources: Ascend, IMF, IHS Global Insight, UN population project, Bombardier forecast. Includes Very Light Jets.
10,000
1,000
100
100 1,000 10,000 100,000
10
1
Fle
et p
er 1
00
Mill
ion
Po
pu
lati
on
(L
og
Sca
le)
GDP per Capita ($, Log Scale)
ActualsForecast

the economy of Latin America’s second most populous country, mexico, has been vigorous lately, led by expanding demand from the u.s. and growing domestic consumption. Argentina’s economy also expanded strongly in 2011. this growth was spurred by high consumer spending, buoyant commodity prices and generally solid demand from brazil and china.
As reported by forbes, Latin America generated the greatest increase in the number of billionaires last year, going from 52 in 2011 to 65 in 2012. mexico is home to the world’s wealthiest individual in 2012, carlos slim Helu. over the 20-year forecast period, Latin America’s economy is forecast to grow, on average, by 4.1% per year, according to iHs Global insight. According to the World bank, Latin America will remain, in 2012, resilient to the economic challenges faced by the u.s. and european countries. the region’s prosperity, however, relies significantly on china’s economy, which is currently showing gradual slowdown. in addition, challenges to sustain growth, such as modernizing infrastructure, boosting innovation and rebuilding political institutions, remain across the region.
business aviation has a long and well established presence in Latin America, which most resembles north America in business jet fleet penetration, and is therefore a relatively mature market. A high proportion of the region’s fleet is in the Light jet category. the largest business jet fleet concentrations are in mexico and brazil.
At the end of 2011, the region had one of the oldest business jet fleets in the world, with an average age of 18 years. As a result, the region should account for a significant number of replacements.
Latin American business jet fleet penetration per population of 100 million will grow from 353 to 546 over the forecast period, translat-ing into 2,285 aircraft deliveries over 20 years. this region is expected to be one of the most important business jet markets, which will see 985 aircraft deliveries between 2012 and 2021 and 1,300 deliveries from 2022 to 2031. the fleet of 1,650 business jets at the end of 2011 will increase to 3,135 aircraft by the end of 2031, equivalent to a cAGr of 3%
bombArdier business AircrAft Market forecast 2012-2031 36the forecast
Figure #33
FLEET EVOLUTION FORECAST – LATIN AMERICAFleet, Deliveries and Retirements, 2011-2031
Sources: Ascend, Bombardier forecast. Excludes Very Light Jets and Large Corporate Airliners.
1,650
Fleet 2011 Deliveries Retirements Fleet 2021 Deliveries Retirements Fleet 2031
985
370
2,265
1,300
430
3,135

russia and cis
the present moderate pace of growth in russia and cis is expected to continue. Although russia’s manufacturing sector decelerated in the second half of 2011, private consumption and exports have been flourishing. the russian economy remains dependent on energy export revenues to drive domestic growth; energy prices have risen steadily since mid-2009 and are ex-pected to remain high in 2012 and 2013. fossil fuel production from russia and Kazakhstan is projected to remain very strong. the en-ergy sector will continue to drive the region’s expansion in the near-to-medium term.
external factors will impact russia’s economic growth. the sovereign debt crisis in the eurozone and easing growth in china have a negative impact on russian export revenues.
the turmoil in international capital markets has caused investors to move out of russian assets and reduce their exposure to risk in emerging markets. According to the central bank of russia, the country continued to experience a net capital outflow through 2011,
partially due to uncertainty about the political forces after the parliamentary and presidential elections, held in december 2011 and march 2012.
bombArdier business AircrAft Market forecast 2012-2031 37the forecast Figure #34
1991
2001
2011
2021
2031
BUSINESS JET PENETRATION FORECAST – RUSSIA AND CISFleet per Capita vs. GDP per Capita, 1960-2031
Sources: Ascend, IMF, IHS Global Insight, UN population project, Bombardier forecast. Includes Very Light Jets.
10,000
1,000
100
100 1,000 10,000 100,000
10
1
Fle
et p
er 1
00
Mill
ion
Po
pu
lati
on
(L
og
Sca
le)
GDP per Capita ($, Log Scale)
ActualsForecast

bombArdier business AircrAft Market forecast 2012-2031 38the forecast
in the long term, growth will rely on the willingness of the new russian government to modernize and expand the manufacturing sector. Accelerated investment is the key to diversifying the russian economy and sustaining robust development.
According to forbes, russia and cis had 107 billionaires in march 2012. As of 2011, moscow was home to more billionaires than any other city in the world, with 79. the imf estimates russia’s GdP growth at 4% for 2012. economic advancement should remain steady for russia and cis over the 2012-2031 period, with annual average growth of 3.4%, according to iHs Global insight.
the development of the russian economy has had a positive effect on regional demand for business jets. the region’s fleet grew significantly from 100 aircraft in 2004 to an estimated 400 jets in 2011. due to taxation issues, most russian business jet owners register their aircraft outside of russia.
russian customers have a strong acceptance of business aviation. they also have to fly long distances. currently, the major characteristics of the russian business aviation market are the dominance of foreign operators, intense concentration in the moscow region and a
lack of clear legislation in the field. infrastruc-ture, an issue for many years, is now improv-ing, and air traffic control is becoming more accustomed to working with business aviation.
our forecast for business jet penetration predicts that fleet per population of 100 million will grow from 155 to 727 over the next 20 years, equivalent to 1,550 aircraft
deliveries. the russia and cis region is forecast to receive 525 aircraft deliveries between 2012 and 2021 and 1,025 deliveries between 2022 and 2031. the fleet will increase at a cAGr of 8% from 400 aircraft in 2011 to 1,800 aircraft by the end of 2031.
Figure #35
FLEET EVOLUTION FORECAST – RUSSIA AND CISFleet, Deliveries and Retirements, 2011-2031
Sources: Ascend. Bombardier forecast. Excludes Very Light Jets and Large Corporate Airliners. The Russia & CIS fleet is adjusted to include aircraft registered outside of the region.
400
Fleet 2011 Deliveries Retirements Fleet 2021 Deliveries Retirements Fleet 2031
525
60
865
1,025
90
1,800

middle east and africa
Political unrest erupted in north Africa and the middle east in 2011. the “Arab spring” resulted in regime changes in tunisia, egypt, Libya and Yemen. revolts also affected bahrain, while violence continues in syria. in the four states where governments were overthrown, the economic and political situation remains very delicate. this extreme political volatility has caused the economy of north Africa and the middle east to see a reduction in GdP growth from 4.4% in 2010 to 2.9% in 2011.
daily life in these countries continues to be punctuated by protests, and the main structural problems, such as unemployment and income inequality remain unresolved. moreover, foreign investment and tourism have not fully resumed. the imf, in its April 2012 regional economic outlook, remarked that social
unrest and policy uncertainty in the Arab spring countries are likely to endure in the near term. in egypt, despite these difficulties, the population remains upbeat about the course of the nation and prospects for progress, according to a recent Pew Global Attitudes survey.
the Gulf countries shrugged off the regional
turmoil and maintained strong growth in 2011. oil producing countries such as saudi Arabia and the united Arab emirates have boosted production following the war in Libya and the embargo over iran. the u.s. energy informa-tion Administration (eiA) is expecting oil prices to remain high in 2012 and over the next several years, at $95-$115 between 2012-2016.
bombArdier business AircrAft Market forecast 2012-2031 39the forecast Figure #36
1991 20012011
20212031
1981
1971
1961
BUSINESS JET PENETRATION FORECAST – MIDDLE EAST AND AFRICAFleet per Capita vs. GDP per Capita, 1960-2031
Sources: Ascend, IMF, IHS Global Insight, UN population project, Bombardier forecast. Includes Very Light Jets.
10,000
1,000
100
100 1,000 10,000 100,000
10
1
Fle
et p
er 1
00
Mill
ion
Po
pu
lati
on
(L
og
Sca
le)
GDP per Capita ($, Log Scale)
ActualsForecast

if the economic situation worsens in europe or worldwide, demand for oil and the pros-pects for economic growth in the Gulf will be compromised. north Africa and the middle east economies are expected to return to a growth rate of 4.1% in 2012 according to iHs Global insight.
sub-saharan Africa has benefited from investments by booming Asian economies looking to secure energy and food supplies. foreign and domestic investment has been aided by improvements in the regulatory environment. According to the doing business 2012 report, over the last year, a record 78% of the economies in sub-saharan Africa made changes to their respective regulatory environments to facilitate domestic firm start-ups and operations.
the resource-rich sub-saharan African economy grew by 4.8% in 2011, aided by high commodity prices. over a third of countries in the region attained growth rates of at least 6%. rising oil output, increasingly diversified trade with growing Asian economies and a rebounding agricultural market will push output growth higher than 5% in 2012.
from 2012 to 2031, GdP growth in the middle east and African economies should average 3.7% per year, according to iHs Global insight.
the business jet fleet per 100 million population is expected to grow from 64 to 142 over the next 20 years. Against the global backdrop of economic turmoil, middle east and Africa remains a strong market for business aviation. High prices for the region’s oil exports, long distances between its major cities, and mediocre surface transportation, all help to support the business aviation industry, as do the scheduled airlines services in the region that focus more on long-haul routes than on shorter ones. According to the middle east business Aviation Association (mebA), the next barrier to overcome in the
region is access, as there are not enough airports designated for business aviation. moreover, business aviation is still absent from many African countries, while the economic development of the continent is showing major potential.
middle east and Africa will receive up to 1,995 business jet deliveries during the 2012-2031 period, 735 deliveries between 2012 and 2021, and 1,260 from 2022 to 2031. the 2011 fleet of 775 business jets will grow to 2,440 aircraft by 2031, representing a cAGr of approximately 6%.
bombArdier business AircrAft Market forecast 2012-2031 40the forecast
Figure #37
FLEET EVOLUTION FORECAST – MIDDLE EAST AND AFRICAFleet, Deliveries and Retirements, 2011-2031
Sources: Ascend, Bombardier forecast. Excludes Very Light Jets and Large Corporate Airliners.
775
Fleet 2011 Deliveries Retirements Fleet 2021 Deliveries Retirements Fleet 2031
735
130
1,380
1,260
120
2,440
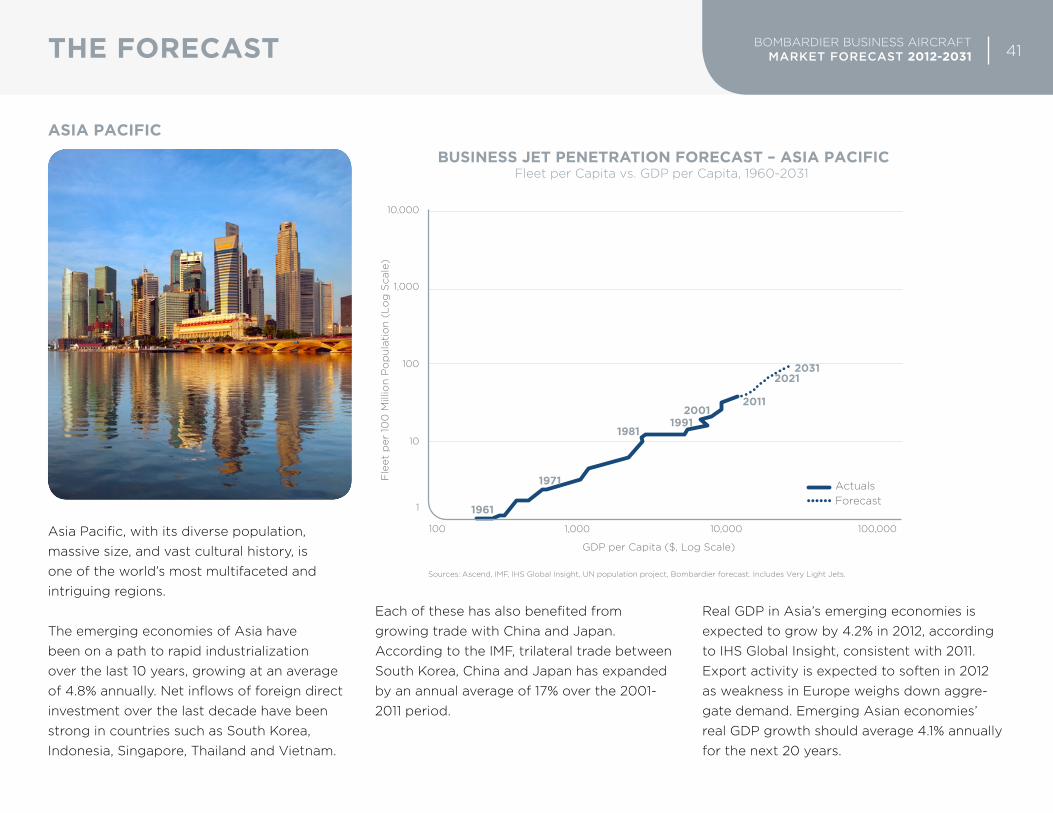
asia Pacific
Asia Pacific, with its diverse population, massive size, and vast cultural history, is one of the world’s most multifaceted and intriguing regions.
the emerging economies of Asia have been on a path to rapid industrialization over the last 10 years, growing at an average of 4.8% annually. net inflows of foreign direct investment over the last decade have been strong in countries such as south Korea, indonesia, singapore, thailand and Vietnam.
each of these has also benefited from growing trade with china and Japan. According to the imf, trilateral trade between south Korea, china and Japan has expanded by an annual average of 17% over the 2001-2011 period.
real GdP in Asia’s emerging economies is expected to grow by 4.2% in 2012, according to iHs Global insight, consistent with 2011. export activity is expected to soften in 2012 as weakness in europe weighs down aggre-gate demand. emerging Asian economies’ real GdP growth should average 4.1% annually for the next 20 years.
bombArdier business AircrAft Market forecast 2012-2031 41the forecast Figure #42
19912001
2011
20212031
1981
1961
BUSINESS JET PENETRATION FORECAST – ASIA PACIFICFleet per Capita vs. GDP per Capita, 1960-2031
Sources: Ascend, IMF, IHS Global Insight, UN population project, Bombardier forecast. Includes Very Light Jets.
10,000
1,000
100
100 1,000 10,000 100,000
10
1
Fle
et p
er 1
00
Mill
ion
Po
pu
lati
on
(L
og
Sca
le)
GDP per Capita ($, Log Scale)
ActualsForecast
1971

Japan’s economy contracted by 0.9% in 2011 as a result of the march earthquake and tsunami. buoyed by accelerated reconstruction spending, the economy is expected to grow by 1.8% in 2012, according to the may 2012 blue chip consensus forecast. However, with the extent of reconstruction required, growth is not expected to return to normal rates before 2014. over the 2012-2031 period, Japan is expected to grow by 0.8% annually, according to iHs Global insight.
Australia’s Queensland floods and new Zealand’s canterbury-region earthquake damaged oceania’s two biggest economies in 2011. reconstruction efforts will bring investment to the region. stronger demand for Australian coal and liquid natural gas from Asian economies such as china, india and post-fukushima Japan will drive GdP in 2012. iHs Global insight expects that oceania’s economy will grow by 3.1% in 2012. over the next 20 years, oceania’s real GdP is expected to grow on average by 2.7% annually.
forbes estimates that the number of billionaires in the Asia Pacific region has grown almost 70%, from 63 in 2006 to 107 in 2012.
As shown on the business jet penetration curve, fleet per 100 million population is expected to grow from 36 to 95 over the next 20 years. from a business aviation market perspective, the Japanese market remains comparatively under developed. despite hurdles such as high aircraft handling costs at airports and limited airport access
in countries like Japan, Asia Pacific’s current business jet fleet of 375 aircraft is expected to grow at a 6% cAGr over the next 20 years, and to account for 1,170 aircraft in 2031.
We expect 985 deliveries in Asia Pacific over the next 20 years, 370 deliveries between 2012 and 2021, and 615 from 2022 to 2031.
bombArdier business AircrAft Market forecast 2012-2031 42the forecast
Figure #43
FLEET EVOLUTION FORECAST – ASIA PACIFICFleet, Deliveries and Retirements, 2011-2031
Sources: Ascend, Bombardier forecast. Excludes Very Light Jets and Large Corporate Airliners.
375
Fleet 2011 Deliveries Retirements Fleet 2021 Deliveries Retirements Fleet 2031
370
60
685
615
120
1,170

segment detailsthe following section presents the forecast of the business jet market broken down into three categories (Light, medium and Large), which are defined through a combination of price, range and cabin volume.
in recent years, demand has improved for Large and medium category aircraft. As business jet purchases soared outside of north America, the need for larger and more capable aircraft increased. in north America, business jet adoption has been historically driven by Light aircraft sales. However, the demand for business jets is shifting towards emerging markets, where it is not uncommon to encounter first-time buyers who purchase in the Large category. moreover, as aircraft productivity increases, customers can get more performance and cabin size at a similar price. for all these reasons, we expect the fleet of Large and medium category aircraft to grow at a faster pace, relative to Light aircraft.
light categorythe Light category comprises business jets with b&cA magazine’s 2012 Purchase Planning Handbook equipped prices between $9m and $18m, offering ranges of 1,700 nm to 3,100 nm and cabin volumes of 300 ft3 (8.5 m3) to 700 ft3 (19.8 m3). compared to other
business jet categories, the Light category is differentiated by relatively low purchase prices and low operating costs, combined with sufficient range for short distance missions. in this category, bombardier delivers three types of aircraft to the market: the Learjet 40XR, the Learjet 45XR and the Learjet 60XR. in addition, bombardier is currently developing the Learjet 70, the Learjet 75 and the Learjet 85 aircraft.
bombArdier business AircrAft Market forecast 2012-2031 43the forecast
Global8000
ACJ 318/319
BBJ 1/2/3
BUSINESS JET MARKET SEGMENTATION(1)
(1) Segmentation is largely determined by a combination of cabin volume, range and price.
Note: Bombardier, Learjet 40, Learjet 45, Learjet 60, Learjet 85, Learjet 70, Learjet 75, Challenger 300, Challenger 605, Challenger 850, Global 5000, Global 6000, Global 7000, Global 8000, XR and Vision Flight Deck are either registered or unregistered trademarks of Bombardier Inc. or its subsidiaries.
Source: Bombardier.
Bombardier
Cessna
Dassault
Gulfstream
HawkerBeechcraft
Embraer
Others
Very Light Jets Light Jets Medium Jets Large JetsLarge
CorporateAirliners
Global7000
Learjet40 XR
Learjet45 XR
Challenger300
Challenger605
Challenger850
Global5000
Global6000
Learjet60 XR
Learjet85
F2000LX F900LXF2000S
35 In production 15 In development
Legacy600
Legacy650
Lineage1000
Phenom100
Phenom300
Legacy450
Legacy500
Premier 1A H4000H900XP
HondaJet
SJ30-2
F7X
Citation Ten
Learjet70
Learjet75
G150 G280 G450 G550 G650G500
CJ3M2
Mustang CJ4 Citation XSovereignXLS+CJ2+ Latitude Longitude

All three aircraft development programs are progressing on schedule and the aircraft are expected to enter service in 2013. the Learjet 70 and Learjet 75 were launched in may 2012 and will feature an all-new modern design interior, a new cabin management system, the Vision Flight Deck with a state-of-the-art avionics suite, superior aircraft performance and low operating costs.
demand in the Light category remains soft and is recovering slowly from the downturn. residual values remain low and levels of pre-owned inventory are high (14.6% of the Light aircraft fleet in Q1 2012). during the 20-year period from 2012 to 2031, we anticipate the Light category to generate a total of 10,700 deliveries, valued at $117 billion.
medium categorythe medium category features aircraft with equipped prices from $18m to $45m, offering ranges from 3,100 nm to 5,000 nm and cabin volume of 700 ft3 (19.8 m3 ) to 1,500 ft3 (42.5 m3). the medium category value proposition relies on greater cabin comfort and superior range compared to the Light category. medium category aircraft are often the backbone of large corporations’ business jet operations. bombardier has successfully developed the medium category through the Challenger 600 jet series offering. bombardier
now has three well-known products in this category, the Challenger 300, Challenger 605 and Challenger 850 jets.
for the 2012-2031 period, our market forecast anticipates promising growth in the medium aircraft category. the pre-owned inventory
in this category accounts for 13.5% of the fleet, and is close to pre-recession levels. during the 20-year period from 2012 to 2031, we anticipate the medium category to generate a total of 7,800 deliveries, valued at $239 billion.
bombArdier business AircrAft Market forecast 2012-2031 44the forecast
40
35
30
25
20
30 29 28 27 26 25 24 23 22 21 15 14 13 12 20 19 18 17 16
15
10
5
31
$292(45%)
$117(18%)
$239(37%)
Large
Medium
Light
10,700(45%)
7,800(32%)
5,500(23%)
Total 20Yrs $648B
Total 20Yrs 24,000 units
FORECAST BY CATEGORYUnits and Revenues ($ Billion), 2012-2031
Source: GAMA, Bombardier forecast. All revenues expressed in 2011 dollars.
Figure #41

large categorythe Large category features aircraft with equipped prices between $45m and $69m, offering ranges over 5,000 nm and cabin volumes of 1,500 ft3 (42.5 m3 ) to 3,000 ft3 (85.0 m3). Large category business jets offer the greatest capabilities in range, speed, and cabin comfort.
bombardier currently delivers Global 5000 and Global 6000 aircraft. the first Global 5000 and Global 6000 jets equipped with the Vision Flight Deck were delivered in march 2012. the Global 7000 and Global 8000 jets will enter service in 2016 and 2017 respectively. bombardier offers the most technologically advanced and the broadest product line in this market category. the Global 7000 and Global 8000 aircraft are designed to offer customers more non-stop destinations, combined with extraordinary performance, flexibility and comfort.
in addition, for the 2012-2031 period, our market forecast anticipates that the Large aircraft category will demonstrate the fastest growth. this category was less affected by the downturn than the medium and Light categories. Pre-owned inventory accounts for 6.2% of the Large category fleet.
during the 20-year period from 2012 to 2031, we anticipate the Large category to generate a total of 5,500 deliveries, valued at $292 billion, representing approximately 45% of total delivery revenues.
bombArdier business AircrAft Market forecast 2012-2031 45the forecast
deliveries in the large category will generate 45% of total industry revenues in the
period from 2012 to 2031.

bombArdier business AircrAft Market forecast 2012-2031 46
conclusion

the business aviation market continues to make progress in recovering from the significant downturn of 2009-2010. While current market leading indicators are mixed, the overall trend is positive. As confidence returns to world markets, aircraft orders and backlogs will expand and deliveries will accelerate. While the business jet industry is cyclical, it also has significant growth potential. the key market drivers such as wealth creation, globalization of trade, replacement demand, new aircraft programs, emerging market growth and greater market accessibility through fractional and branded charter demand are all showing positive trends. furthermore, the penetration of business jet fleets in many emerging markets is low, indicating significant growth potential as these economies surge and more readily accept business jets as productivity tools. manufacturers continue to anticipate market needs by developing and supplying more ca-pable, efficient and better designed aircraft.
bombArdier business AircrAft Market forecast 2012-2031 47conclusion
the business jet market will generate 24,000 new aircraft deliveries, worth
$648 billion over the next 20 years.

the business jet market should experience strong growth over the 2012-2031 period with 24,000 deliveries valued at $648 billion. the worldwide business jet fleet is expected to swell from 15,200 in 2011 to 31,500 by 2031, net of retirements. the ingenuity and labor needed to manufacture these aircraft and deliver the revenues associated with them will create significant economic value.
the business aircraft industry will likely face new challenges going forward. As fuel prices and environmental awareness rise, bombardier continues to address environmental concerns actively, through corporate social responsibility initiatives, as well as through the technology
incorporated in our products. manufacturers will also have to help develop the infrastructure to support the expected rapid adoption of business aviation in growth markets.
As market confidence returns, so will the demand for business jets. the long-term
prospects for business aviation are solid and bombardier is a proven visionary. the concept of evolution, of constant, deliberate and tangible progress, is a perfect reflection of who we are. We see far ahead, while delivering today. it’s all about the evolution of mobility.
bombArdier business AircrAft Market forecast 2012-2031 48conclusion
the long-term prospects for business aviation are
solid and bombardier expects the industry to
achieve new heights in the next 20 years.
it’s about the evolution of mobility.

this presentation includes forward-looking statements,
which may involve, but are not limited to: statements with
respect to our objectives, guidance, targets, goals, pri-
orities, markets and strategies, financial position, beliefs,
prospects, plans, expectations, anticipations, estimates
and intentions; general economic and business outlook,
prospects and trends of an industry; expected growth in
demand for products and services; product development,
including projected design, characteristics, capacity or
performance; expected or scheduled entry into service
of products and services, orders, deliveries, testing, lead
times, certifications and project execution in general; our
competitive position; and the expected impact of the leg-
islative and regulatory environment and legal proceedings
on our business and operations. forward-looking state-
ments generally can be identified by the use of forward-
looking terminology such as “may”, “will”, “expect”, “in-
tend”, “anticipate”, “plan”, “foresee”, “believe” , “continue”
or ”maintain”, the negative of these terms, variations of
them or similar terminology. by their nature, forward-look-
ing statements require us to make assumptions and are
subject to important known and unknown risks and uncer-
tainties, which may cause our actual results in future peri-
ods to differ materially from forecasted results. While we
consider our assumptions to be reasonable and appropri-
ate based on information currently available, there is a risk
that they may not be accurate. for additional information
with respect to the assumptions underlying the forward-
looking statements made in this presentation, refer to the
respective Guidance and forward-looking statements sec-
tions in overview, bombardier Aerospace and bombardier
transportation sections in the management’s discussion
and Analysis (“md&A”) in the corporation’s annual report
for the fiscal year ended december 31, 2011.
certain factors that could cause actual results to differ
materially from those anticipated in the forward-looking
statements include risks associated with general economic
conditions, risks associated with our business environment
(such as risks associated with the financial condition of the
airline industry and major rail operators), operational risks
(such as risks related to developing new products and ser-
vices; doing business with partners; product performance
warranty and casualty claim losses; regulatory and legal
proceedings; to the environment; dependence on certain
customers and suppliers; human resources; fixed-price
commitments and production and project execution), fi-
nancing risks (such as risks related to liquidity and access
to capital markets, exposure to credit risk, certain restric-
tive debt covenants, financing support provided for the
benefit of certain customers and reliance on government
support) and market risks (such as risks related to foreign
currency fluctuations, changing interest rates, decreases
in residual value and increases in commodity prices). for
more details, see the risks and uncertainties section in
other. readers are cautioned that the foregoing list of
factors that may affect future growth, results and perfor-
mance is not exhaustive and undue reliance should not be
placed on forward-looking statements. the forward-look-
ing statements set forth herein reflect our expectations as
at the date of the corporation’s md&A and are subject to
change after such date. unless otherwise required by ap-
plicable securities laws, we expressly disclaim any inten-
tion, and assume no obligation to update or revise any
forward-looking statements, whether as a result of new in-
formation, future events or otherwise. the forward-looking
statements contained in this presentation are expressly
qualified by this cautionary statement.
All monetary amounts are expressed in 2012 u.s. dollars, unless otherwise stated.
bombArdier business AircrAft Market forecast 2012-2031 49forWard looking statements
bombArdier business AircrAft Market forecast 2012-2031 50resources
resources used in the bombardier business Aircraft market forecast:
Aircraft blue book Price digestAAi – Airport Authority of indiaAscendb&cA – business & commercial Aviation magazineblue chip economic forecastboston consulting GroupcAAc – General Administration of civil Aviation of chinacentral bank of indiacentral bank of russiadeutsche bankdoing businesseiA – u.s. energy information Administrationeiu – economist intelligence uniteurocontroleurostatfAA – federal Aviation AdministrationforbesGAmA – General Aviation manufacturers AssociationGoldman sachs Asset managementibAc – international business Aviation counciliHs Global insightimf – international monetary fundJetnetKnight frank / citi Private bank – the Wealth report 2012mebA – middle east business Aviation Associationmerrill Lynch and capgeminimorgan stanleymorgan stanley capital international (msci) World indexnexa Advisorsoecd – organisation for economic co-operation and developmentPew Global Attitudes surveyun Population projectu.s. bureau of economic AnalysisWorld bank
note: bombardier, Challenger 300, Challenger 605, Challenger 850, Global 5000, Global 6000, Global 7000, Global 8000, Learjet 40, Learjet 45, Learjet 60, Learjet 70, Learjet 75, Learjet 85, XR, Vision Flight Deck are either registered or unregistered trademarks of bombardier inc. or its subsidiaries.