McGraw-Hill/Irwin Copyright © 2013 by The McGraw-Hill Companies, Inc. All rights reserved.
Mutual Funds and Other Investment Companies 4Bodie, Kane, and MarcusEssentials of Investments, 9th Edition
The McGraw-Hill Companies, © 2013 24-2
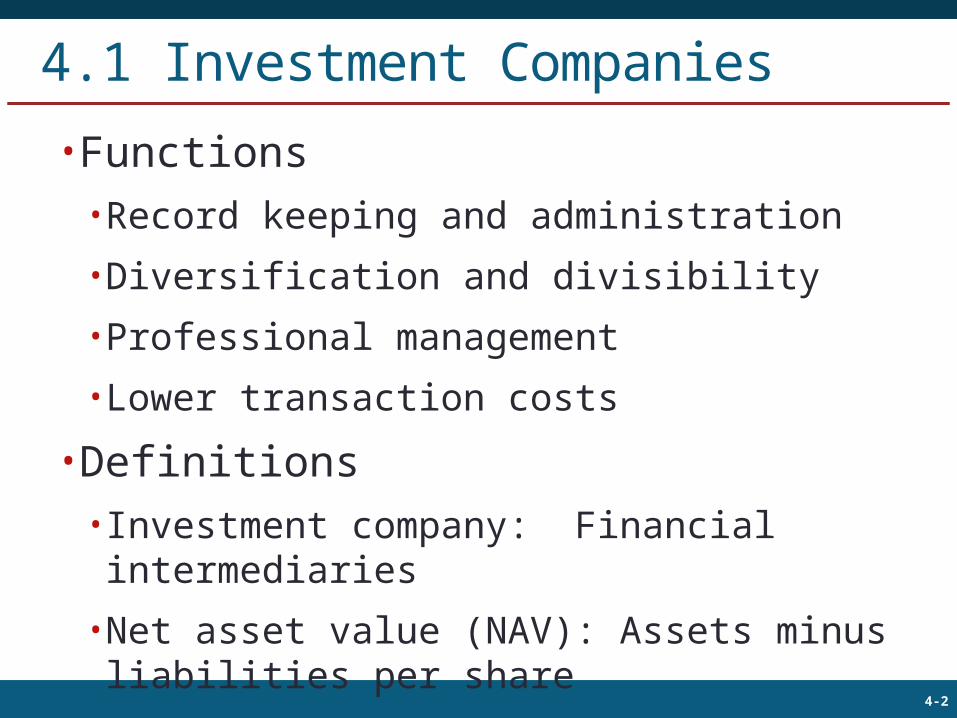
4.1 Investment Companies•Functions•Record keeping and administration•Diversification and divisibility•Professional management•Lower transaction costs
•Definitions•Investment company: Financial intermediaries
•Net asset value (NAV): Assets minus liabilities per share
The McGraw-Hill Companies, © 2013 34-3
4.2 Types of Investment Companies•Unit Investment Trusts•Money pooled from many investors is invested in portfolio fixed for life of fund
•Managed Investment Companies•Open-end fund: Issues or redeems shares at net value•Closed-end fund: Shares can’t be redeemed, are traded at prices different than NAV•Load: Sales commission charged on mutual fund
The McGraw-Hill Companies, © 2013 44-4
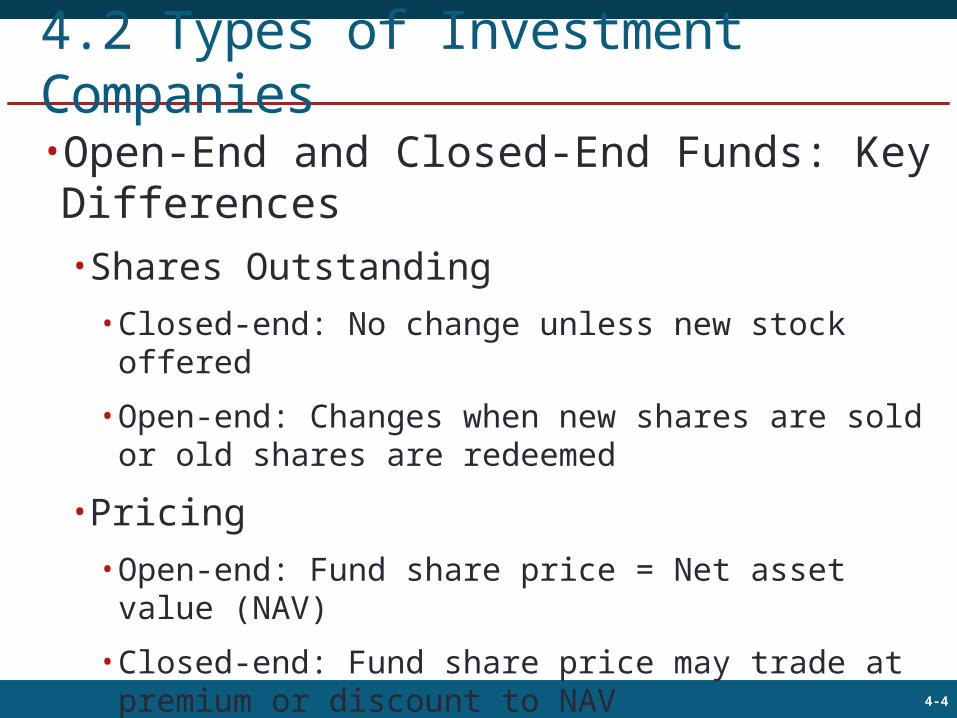
4.2 Types of Investment Companies•Open-End and Closed-End Funds: Key Differences•Shares Outstanding•Closed-end: No change unless new stock offered
•Open-end: Changes when new shares are sold or old shares are redeemed
•Pricing•Open-end: Fund share price = Net asset value (NAV)
•Closed-end: Fund share price may trade at premium or discount to NAV
The McGraw-Hill Companies, © 2013 54-5
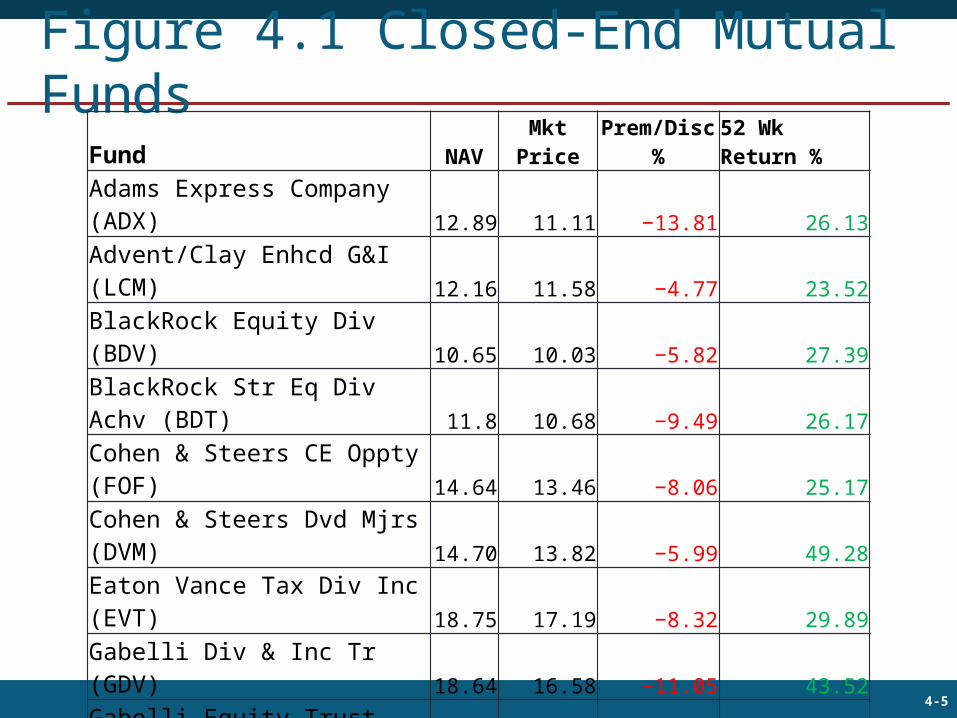
Figure 4.1 Closed-End Mutual Funds
Fund NAVMkt Price
Prem/Disc %
52 Wk Return %
Adams Express Company (ADX) 12.89 11.11 −13.81 26.13Advent/Clay Enhcd G&I (LCM) 12.16 11.58 −4.77 23.52BlackRock Equity Div (BDV) 10.65 10.03 −5.82 27.39BlackRock Str Eq Div Achv (BDT) 11.8 10.68 −9.49 26.17Cohen & Steers CE Oppty (FOF) 14.64 13.46 −8.06 25.17Cohen & Steers Dvd Mjrs (DVM) 14.70 13.82 −5.99 49.28Eaton Vance Tax Div Inc (EVT) 18.75 17.19 −8.32 29.89Gabelli Div & Inc Tr (GDV) 18.64 16.58 −11.05 43.52Gabelli Equity Trust (GAB) 6.08 6.10 0.33 48.48General Amer Investors (GAM) 32.71 28.26 −13.60 30.93Guggenheim Enh Eq Inc (GPM) 9.58 9.65 0.73 38.93
The McGraw-Hill Companies, © 2013 64-6
4.2 Types of Investment Companies•Other Investment Organizations•Commingled Funds•Partnership of investors pooling funds; designed for trusts/larger retirement accounts to get professional management for fee
•Real Estate Investment Trusts (REITs)•Similar to closed-end funds, invests in real estate/real estate loans
•Hedge Funds •Private speculative investment pool, exempt from SEC regulation
The McGraw-Hill Companies, © 2013 74-7
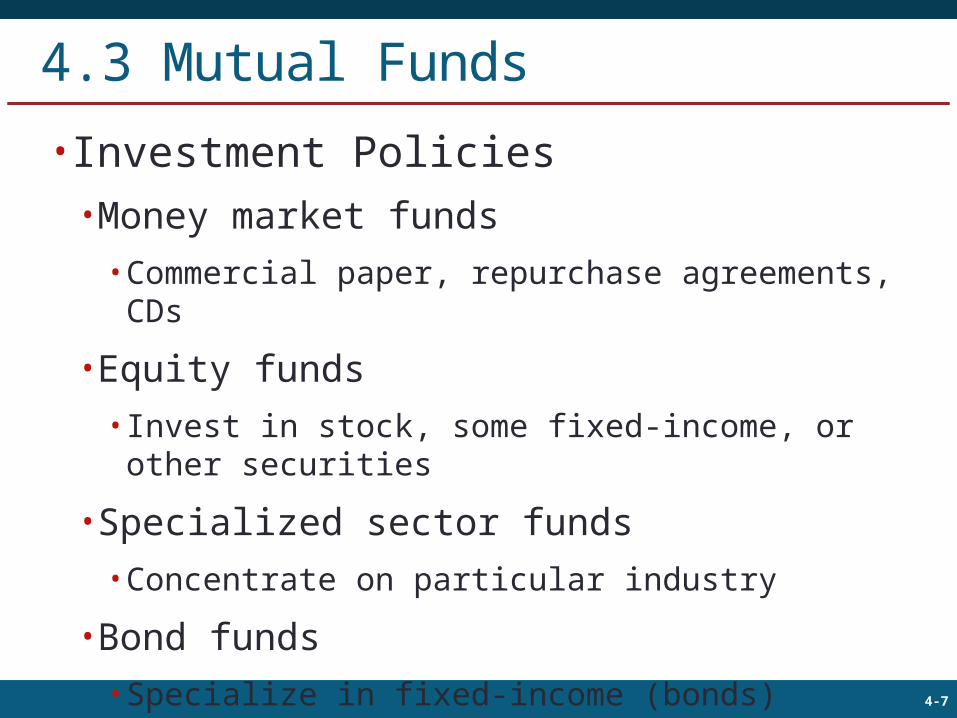
4.3 Mutual Funds•Investment Policies•Money market funds•Commercial paper, repurchase agreements, CDs
•Equity funds•Invest in stock, some fixed-income, or other securities
•Specialized sector funds•Concentrate on particular industry
•Bond funds•Specialize in fixed-income (bonds) sector

The McGraw-Hill Companies, © 2013 84-8
4.3 Mutual Funds•Investment Policies•International funds•Global funds invest in securities worldwide, including U.S.•International funds invest outside U.S.•Regional funds focus on particular part of world•Emerging market funds invest in developing nations
The McGraw-Hill Companies, © 2013 94-9
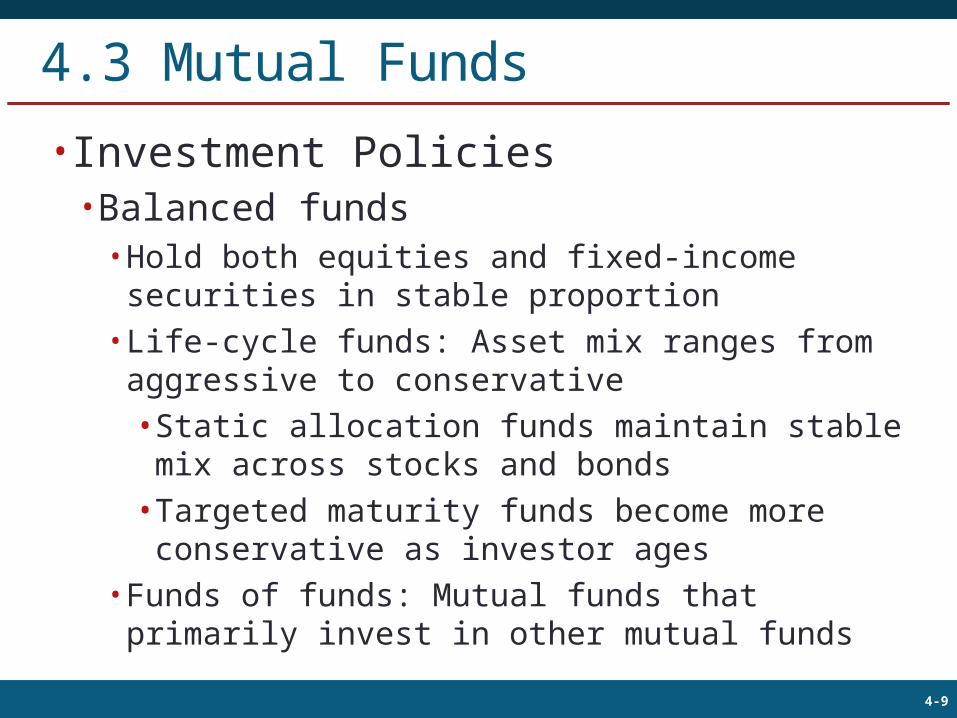
4.3 Mutual Funds•Investment Policies•Balanced funds•Hold both equities and fixed-income securities in stable proportion
•Life-cycle funds: Asset mix ranges from aggressive to conservative•Static allocation funds maintain stable mix across stocks and bonds•Targeted maturity funds become more conservative as investor ages
•Funds of funds: Mutual funds that primarily invest in other mutual funds
The McGraw-Hill Companies, © 2013 104-10
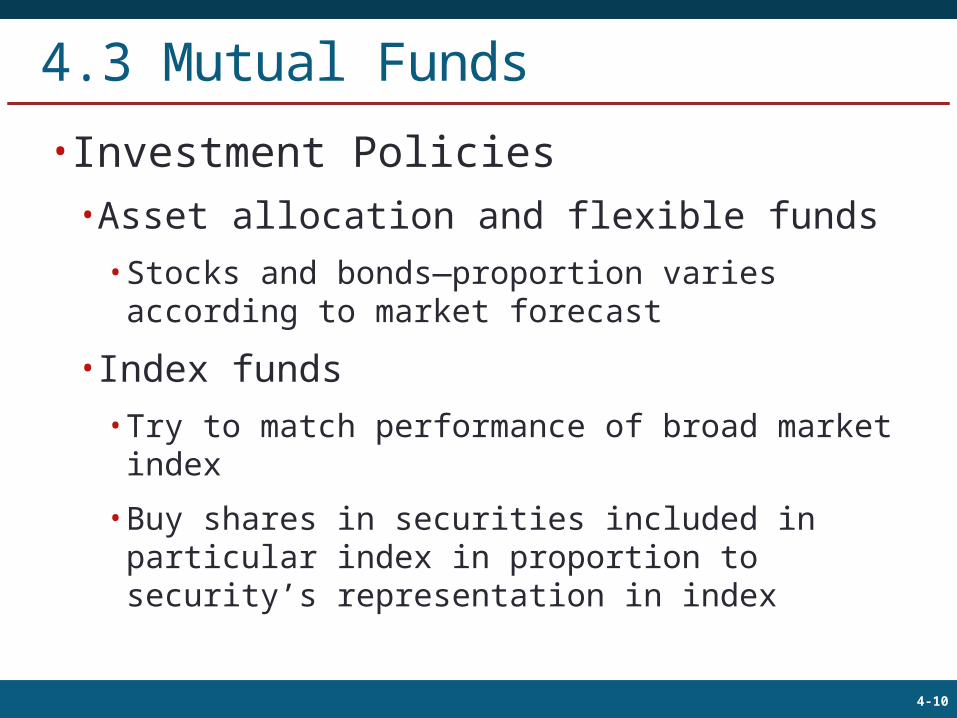
4.3 Mutual Funds•Investment Policies•Asset allocation and flexible funds•Stocks and bonds—proportion varies according to market forecast
•Index funds•Try to match performance of broad market index
•Buy shares in securities included in particular index in proportion to security’s representation in index

The McGraw-Hill Companies, © 2013 114-11
Table 4.1 U.S. Mutual Funds by Investment Classification
Assets ($ billion)
Percent of Total Assets Number of Funds
Equity FundsCapital appreciation focus 2,912 24.2% 3,037World/international 1,660 13.8% 968Total return 1,950 16.2% 762 Total equity funds 6,522 54.2% 4,767
Bond FundsCorporate 301 2.5% 293High yield 157 1.3% 206World 84 0.7% 122Government 203 1.7% 301Strategic income 560 4.7% 370Single-state municipal 156 1.3% 451National municipal 218 1.8% 224 Total bond funds 1,679 14.0% 1,967
Hybrid (bond/stock) funds 713 5.9% 488
Money market fundsTaxable 2,642 22.0% 548Tax-exempt 465 3.9% 259 Total money market funds 3,107 25.8% 807
Total 12,021 100.0% 8,029
The McGraw-Hill Companies, © 2013 124-12
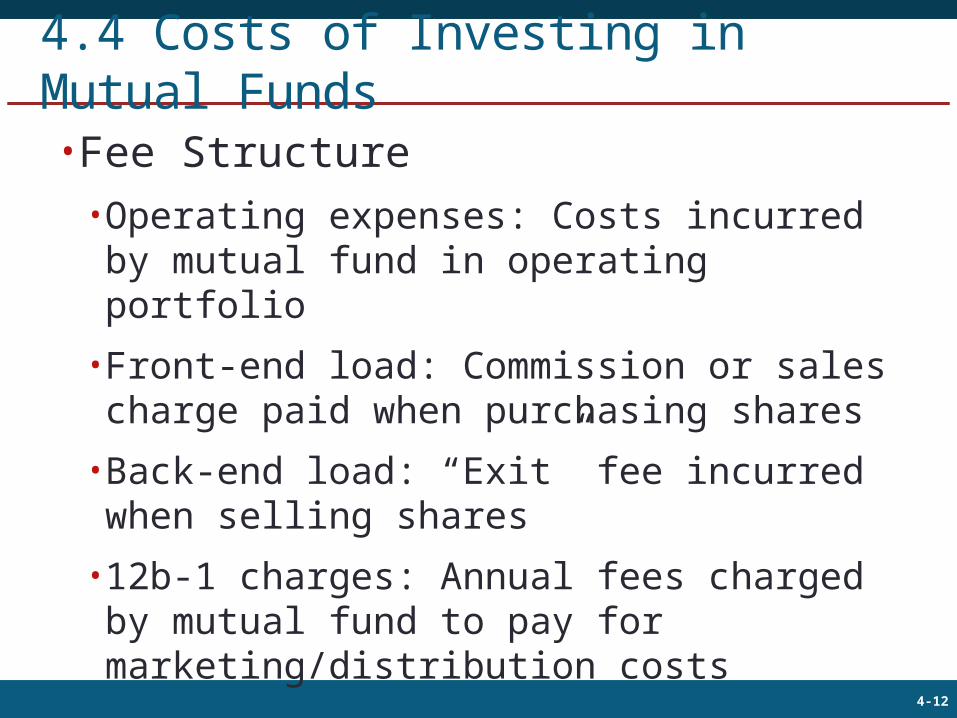
4.4 Costs of Investing in Mutual Funds•Fee Structure•Operating expenses: Costs incurred by mutual fund in operating portfolio•Front-end load: Commission or sales charge paid when purchasing shares•Back-end load: “Exit” fee incurred when selling shares•12b-1 charges: Annual fees charged by mutual fund to pay for marketing/distribution costs

The McGraw-Hill Companies, © 2013 134-13
4.4 Costs of Investing in Mutual Funds•Fees, Loads, and Performance•Gross performance of load funds is statistically identical to gross performance of no-load funds•Funds with high expenses tend to be poorer performers•12b-1 charges should be added to expense ratios•Compare costs with Morningstar

The McGraw-Hill Companies, © 2013 144-14
4.4 Costs of Investing in Mutual Funds•NAV and Effective Load•Cost to initially purchase one share of load fund = NAV + Front-end load (%) (if any)•Stated loads typically range from 0 to 8.5%•Load is designed to offset expenses of marketing the fund; it goes to broker who sells fund to investor•Effective load greater than stated load

The McGraw-Hill Companies, © 2013 154-15
4.4 Costs of Investing in Mutual Funds•Avoiding the Load•Choose different class of fund shares
Notes:a Depending on size of investment.b Depending on years until holdings are sold.c Including service fee of .25%.

The McGraw-Hill Companies, © 2013 164-16
4.4 Costs of Investing in Mutual Funds•Fees and Mutual Fund Returns•Soft dollars: Value of research services brokerage house provides “free of charge” in exchange for business
0
01
NAVondistributi gains CapitalIncomeNAVNAVreturn of Rate
The McGraw-Hill Companies, © 2013 174-17
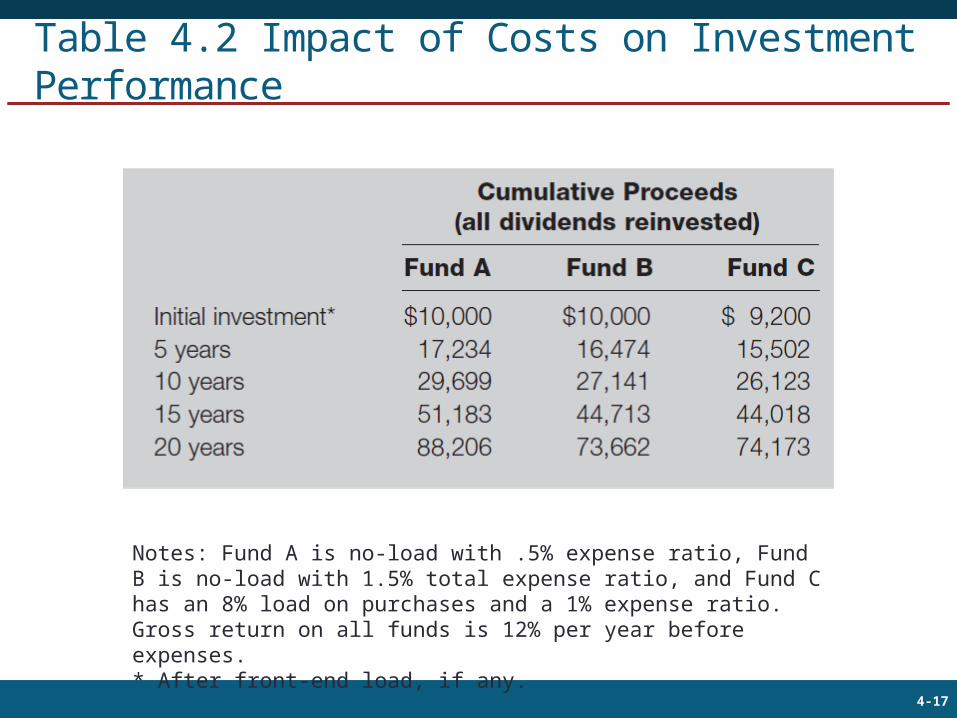
Table 4.2 Impact of Costs on Investment Performance
Notes: Fund A is no-load with .5% expense ratio, Fund B is no-load with 1.5% total expense ratio, and Fund C has an 8% load on purchases and a 1% expense ratio. Gross return on all funds is 12% per year before expenses.* After front-end load, if any.

The McGraw-Hill Companies, © 2013 184-18
4.5 Taxation of Mutual Fund Income•General Tax Rules•Fund not taxed if diversified and income distributed•Investor taxed on capital gain and dividend distributions•Turnover: Ratio of trading activity to assets of portfolio•Portfolio turnover may affect investor’s tax liability

The McGraw-Hill Companies, © 2013 194-19
4.5 Taxation of Mutual Fund Income•Implications of Fund Turnover•Fund pays commission costs on portfolio purchases and sales—charged against NAV•Turnover rate measured as annual total asset value bought or sold in a year divided by average total asset value
The McGraw-Hill Companies, © 2013 204-20
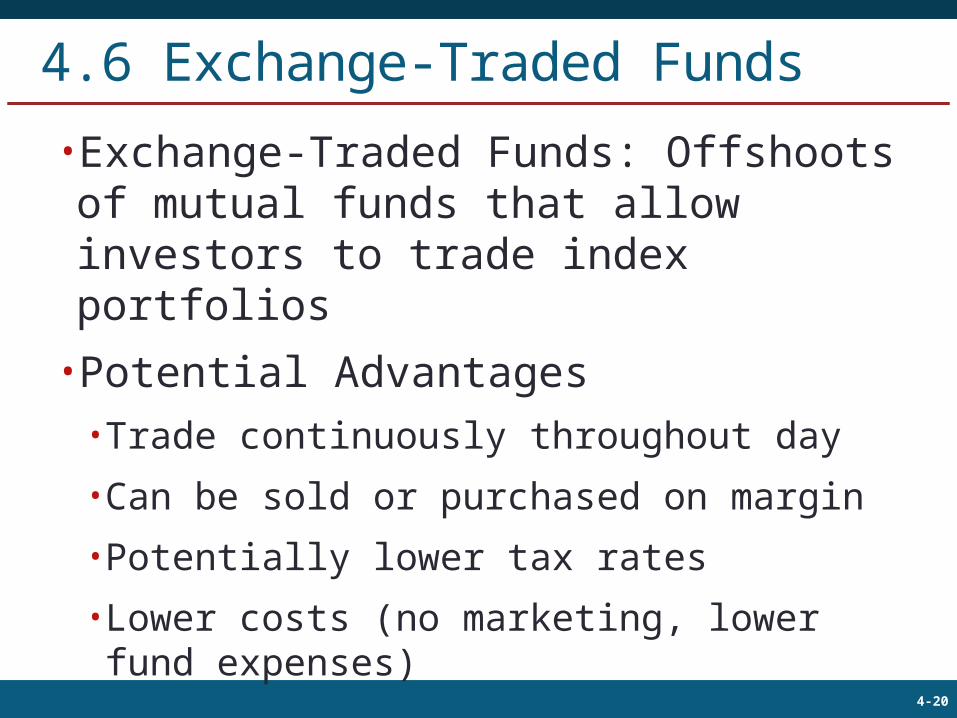
4.6 Exchange-Traded Funds•Exchange-Traded Funds: Offshoots of mutual funds that allow investors to trade index portfolios•Potential Advantages•Trade continuously throughout day•Can be sold or purchased on margin•Potentially lower tax rates•Lower costs (no marketing, lower fund expenses)
The McGraw-Hill Companies, © 2013 214-21
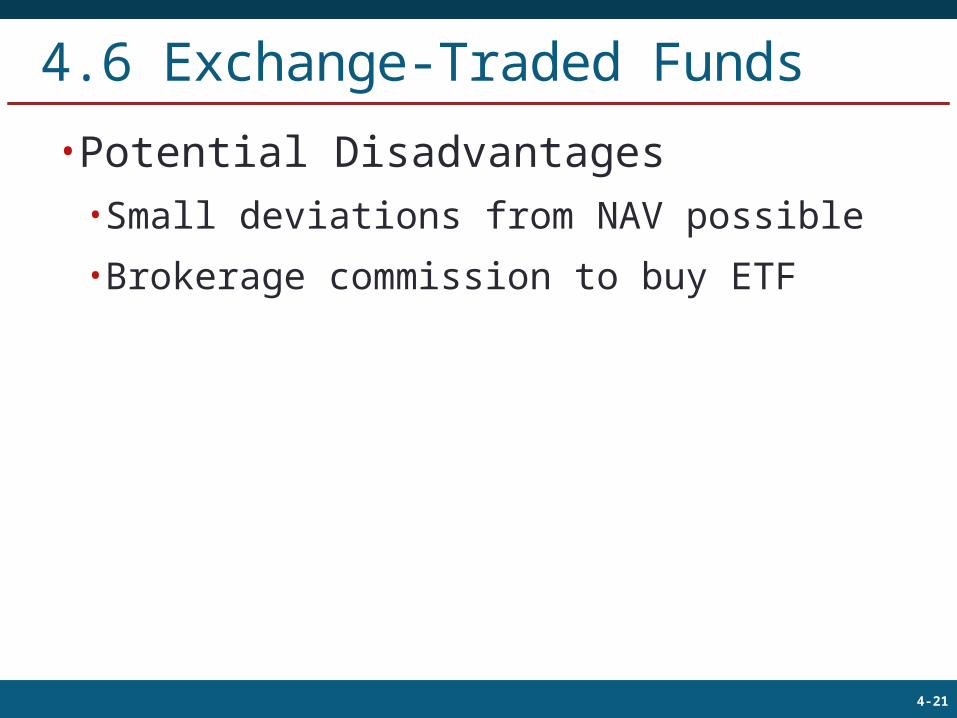
4.6 Exchange-Traded Funds•Potential Disadvantages•Small deviations from NAV possible•Brokerage commission to buy ETF
The McGraw-Hill Companies, © 2013 224-22
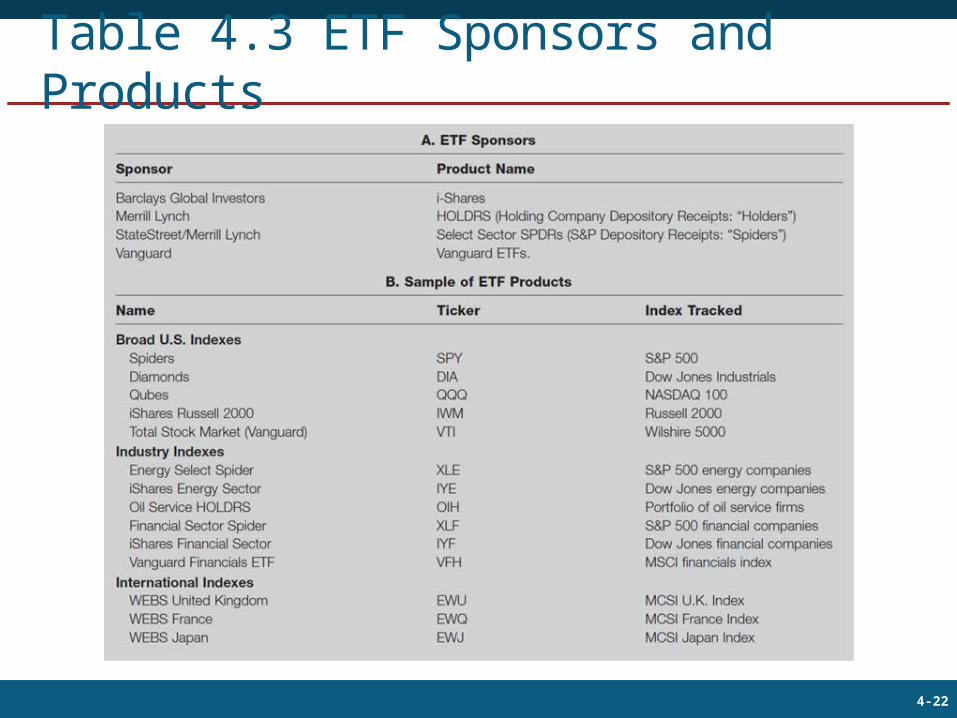
Table 4.3 ETF Sponsors and Products

The McGraw-Hill Companies, © 2013 234-23
Figure 4.2 Assets in ETFs
The McGraw-Hill Companies, © 2013 244-24
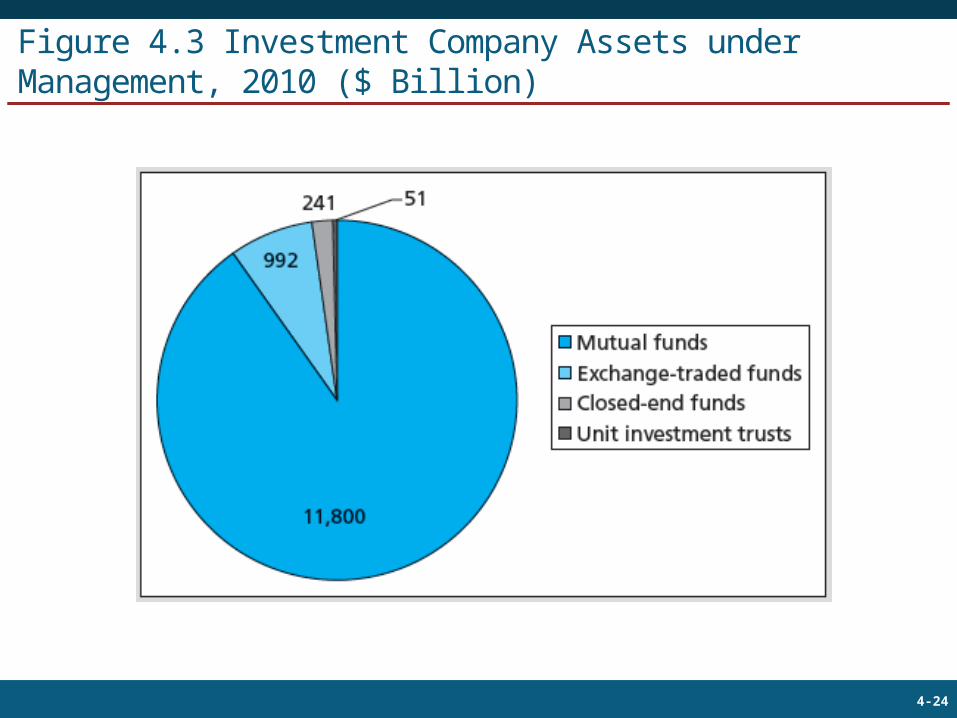
Figure 4.3 Investment Company Assets under Management, 2010 ($ Billion)

The McGraw-Hill Companies, © 2013 254-25
4.7 Mutual Fund Investment Performance
•On average, mutual fund performance less than broad market performance•Evidence suggests some persistence in positive performance over certain horizons

The McGraw-Hill Companies, © 2013 264-26
Figure 4.4 Average Returns on Diversified Equity Funds vs. Wilshire 5000 Index
1971
1972
1973
1974
1975
1976
1977
1978
1979
1980
1981
1982
1983
1984
1985
1986
1987
1988
1989
1990
1991
1992
1993
1994
1995
1996
1997
1998
1999
2000
2001
2002
2003
2004
2005
2006
2007
2008
2009
2010
-50%
-40%
-30%
-20%
-10%
0%
10%
20%
30%
40%
50%
Diversified equity funds Wilshire return
Rate
of
retu
rn (
%)
The McGraw-Hill Companies, © 2013 274-27
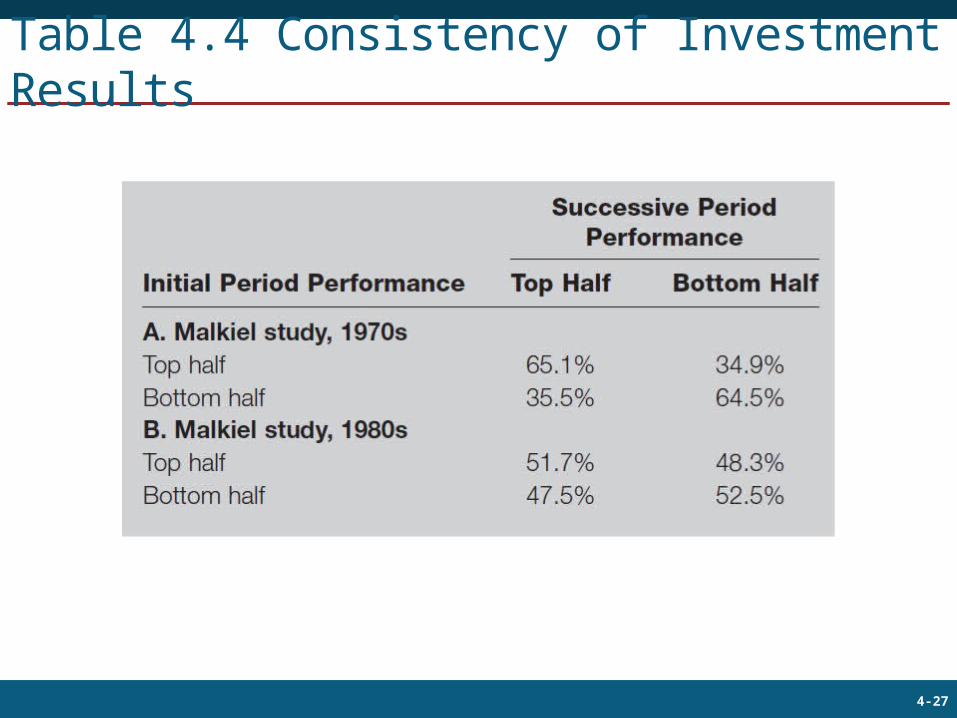
Table 4.4 Consistency of Investment Results

The McGraw-Hill Companies, © 2013 284-28
4.8 Information on Mutual Funds•Sources of Information on Mutual Funds•Morningstar (www.morningstar.com)•Fund prospectus•Yahoo!•The Wall Street Journal•Investment Company Institute (www.ici.org)•American Institute of Individual Investors•Brokers