Edited by: National Institute for Research and Development in Environmental Protection (INCDPM)
2017
Elaborated within the project: “Mapping and Assessment of the Ecosystem Services in
Divici-Pojejena Wetland and Identification of their Contribution to the Economic Sectors’’ (WETECOS), financed under the Programme RO02 Biodiversity and ecosystem services, by a grant from Iceland, Liechtenstein and Norway (EEA 2009-2014)
Best practices guide on mapping and assessing wetland ecosystems
and their services
Edited by NATIONAL INSTITUTE FOR RESEARCH AND DEVELOPMENT IN ENVIRONMENTAL PROTECTION (INCDPM)
Photo cover: Ştefan Zamfir, Theodor Lupei
Descrierea CIP a Bibliotecii Naţionale a RomânieiBest practices guide on mapping and assessing wetland ecosystems and their services / Monica Matei, Lucian Laslo, György Deák, .... - Petroşani : Universitas, 2017Contains bibliographyISBN 978-973-741-534-9ISBN 978-973-741-534-9I. Matei, MonicaII. Laslo, LucianIII. Deák, György502/504
Best practices guide on mapping and assessing wetland ecosystems and their services
COLLECTIVE OF AUTHORS:
Monica Matei
Lucian Laslo
DEÁK György
Ciobotaru Nicu
Mădălina Boboc
Marius Raischi
Cristina Mușat
Theodor Lupei
Simona Raischi
Andreea Moncea
Diana Dumitru
Gabriel Badea
Lampros Lamprinakis
Divina Gracia P. Rodriguez
Anne Strøm Prestvik
Asbjorn Veidal
Bjørn Klimek

Best practices guide on mapping and assessing wetland ecosystems and their services
CONTENT
FOREWORD
INTRODUCTION 1
CHAPTER 1. GENERAL INFORMATION AND DESCRIPTION OF THE STUDY
AREA 2
1.1. MAES conceptual framework 2
1.2. Physical-geographical characterization of the Divici-Pojejena wetland 8
CHAPTER 2. WETLAND ECOSYSTEM MAPPING 15
2.1. Methods of mapping wetlands 15
2.1.1. Mapping ecosystems using remote sensing data 15
2.1.2. Mapping based on topographic or cartographic support and
attribution of properties in thematic layers 20
2.1.3. Mapping wetlands by Principal Components Analysis 22
2.2. Wetland mapping at national level 23
2.3. Mapping wetlands at local level. Case study Divici – Pojejena wetland 35
CHAPTER 3. EVALUATION OF ECOSYSTEM STATE. CASE STUDY DIVICI-
POJEJENA WETLAND 38
3.1. Indirect estimation of wetland ecosystems state in Romania 39
3.1.1. Pressures caused by habitat change 43
3.1.2. Pressures caused by climate change 49
3.1.3. Pressures caused by invasive species 60
3.1.4. Pressures caused by pollution and nutrient enrichment 68
3.1.5. Pressures caused by exploitation 84
3.2. Direct estimation of wetland ecosystems state in Romania 93
3.2.1. Water quality indicators 93
3.2.2. Biodiversity indicators 97
3.2.3. Water quantity indicators 99
3.2.4. Soil quality indicators 104
CHAPTER 4. EVALUATION OF ECOSYSTEM SERVICES. CASE STUDY
DIVICI-POJEJENA WETLAND 107
4.1 Provisioning services 107
4.1.1. Food supply service, biomass group 109
4.1.2. Food supply service, water group 115
4.1.3. Material supply service, biomass group 125
4.1.4. Material supply service, water group 128
4.1.5. Energy supply service, biomass based energy sources group 130
4.2 Regulation and maintenance services 132
4.2.1. Mediation of waste, toxics and other nuisances, mediation by biota
group 133
4.2.2. Mediation of waste, toxics and other nuisances, mediation by
ecosystems group 142
4.2.3. Mediation of flows service, mass flows group 146
4.2.4. Mediation of flows service, liquid flows group 147
4.2.5. Maintenance of physical, chemical, biological conditions service,
lifecycle maintenance, habitat and gene pool protection group 150
4.2.6. Maintenance of physical, chemical, biological conditions service, soil
formation and composition group 152
4.3 Cultural services 159
Best practices guide on mapping and assessing wetland ecosystems and their services
CHAPTER 5. ECONOMIC EVALUATION OF ECOSYSTEM SERVICES
PROVIDED BY DIVICI-POJEJENA WETLAND 190
5.1. Qualitative approach for assessing ecosystem services of Divici-Pojejena
wetland 191
5.2. Quantitative approach for assessing ecosystem services of Divici-Pojejena
wetland 194
5.3. Monetary assessment of ecosystem services provided by Divici-Pojejena
wetland 197
CHAPTER 6. ACTIVITIES FORESEEN FOR IMPLEMENTING THE WETECOS
PROJECT 204
CONCLUSIONS AND RECOMMENDATIONS 215
REFERENCES 219
Best practices guide on mapping and assessing wetland ecosystems and their services
FOREWORD This book was drafted by the INCDPM experts
involved in the project „Mapping and Assessment of the
Ecosystem Services in Divici-Pojejena Wetland and
Identification of their Contribution to the Economic
Sectors (WETECOS)”, financed by the EEA Financial
Mechanism 2009-2014, RO02 Programme - Biodiversity
and Ecosystem Services.
The book contains information related to the
methodology of mapping and assessment of wetland
ecosystems and services provided by them, being
developed as a best practices guide, having as the main
objective the identification of Romanian wetlds’ contribution to the main economic sectors.
At the same time, it is a support instrument for strenghtening the capacity of implementing
the EU and national law requirements in the field of biodiversity.
The necessity of developing this best practices guide has been identified by the
Project Promoter (INCDPM) and the Norwegian Partner – The Norwegian Institute of
Bioeconomy Research (NIBIO), as a result of their own experience in the field of
environmental protection and through the actions performed under the project (meetings,
workshops with the authorities and national and local public administrations, information
and awareness campaigns). Thus, it has been proposed a guidance document regarding
the mapping and assessment of wetland ecosystems’ condition in order to obtain
information related to their evolution over time, the quality any quantity of services
provided, and also on expected changes resulted from the impact of pressures on the
ecosystems. Also, with the support of the Norwegian Partner, this material provides
information regarding the monetary valuation of ecosystem goods and services.
The best practices guide adresses to local and national public administrations and
authorities, scientific communities, non-governamental organizations (NGOs) and
population. Its purpose is to highlight the natural, scientific, recreational and economic
value of wetland ecosystems and their services, and also, the role and importance of their
sustainable management for biodiversity and socio-economic development of society.
This best practices guide, applicable both in Romania and in EU Member States,
Romanian partners within WETECOS project (INCDPM and DDNIRD Tulcea) together with
the Norwegian partner (NIBIO) based on their great experience in the field of
environmental protection and efforts made jointly.
Eng. DEÁK György, PhD
General Manager of INCDPM
Project Manager of WETECOS

Best practices guide on mapping and assessing wetland ecosystems and their services
1
INTRODUCTION
This guide was developed by the National Institute for Research and
Development in Environmental Protection, Bucharest, in partnership with
Norwegian Institute of Bioeconomy Research, from Oslo, Norway, within the project
„Mapping and assessment of the ecosystem services in Divici-Pojejena wetland
and identification of their contribution to the economic sectors’’ (WETECOS),
project funded by the EEA Financial Mechanism 2009-2014, under the Programme RO02 -
Biodiversity and Ecosystem Services.
The project had as general objective the adaptation of the methodology for mapping
and assessment of wetland ecosystems in Romania by using customized recommendations
of European Union (EU), provided in reports Mapping and Assessment of Ecosystem
Services (MAES), for achieving the objectives of Action 5 from the EU Biodiversity Strategy
to 2020. The methodology obtained at national level was applied locally, using as case
study the Divici-Pojejena wetland, located in the southwestern part of Romania, Caras-
Severin County. The purpose of such an analysis is to highlight the natural, scientific,
recreational and economic value of wetland ecosystems and the goods and services they
offer. Therefore, the detailed knowledge of the condition of ecosystems and of the factors
that exert pressure on them, responds to more current requirements at European and
national levels, in the field of environmental protection. Taking into account that the
unsustainable use and management of goods and services provided by ecosystems,
whether we refer to grasslands, forests or wetlands, is a major global threat to biodiversity,
as well as for the socio-economic development of society, such an analysis is necessary.
Moreover, according to studies conducted at international level, it is estimated that the
amount of biodiversity loss or degradation is substantial and shows an upward trend.
The present guide is addressed both to national and European authorities and public
administrations, the scientific community, non-governmental organizations (NGOs), and
also to the population, by raising awareness upon services and benefits of wetlands and
the importance of their sustainable management.
The first chapter presents basic information on the mapping and assessment of
ecosystems and their services, and also presents the physico-geographical characterization
of the Divici-Pojejena wetland. The current techniques used to map ecosystems to obtain
information on their evolution in time, the quality and quantity of provided services, and
the pressure factors to which ecosystems are exposed, are presented in the second
chapter. Chapter 3analyses the state of wetland ecosystems at national and local levels
using direct and indirect assessment methods. The approach used provides information on
both the current state of the ecosystem and the expected changes due to the impact of
direct and indirect pressures. Chapter 4 presents the assessment of ecosystem services
offered by the analysed wetland, Chapter 5 contains monetary analysis of these by
estimating the value of goods and services offered, while Chapter 6 contains information
on the working steps of the project. The present guide is completed by presenting the main
conclusions and recommendations resulted from the analysis, based on the case study and
experience at European level through the involvement of the National Institute for
Bioeconomy Research from Oslo, Norway.
Best practices guide on mapping and assessing wetland ecosystems and their services
2
CHAPTER 1. GENERAL INFORMATION AND DESCRIPTION OF
THE CASE STUDY
1.1 MAES conceptual framework
In general terms, ecosystem services consist of the benefits people obtain from
ecosystems (MA, 2005) through their direct or indirect contribution to human well-being
(TEEB, 2010). Recognizing and integrating the value of ecosystems in the current economic
model is a fundamental step for sustainable development and nature conservation (EC,
2017). Taking into account the growing socio-economic development, a new approach to
global environmental issues is needed in terms of the analysis of pressure factors and their
effects on biodiversity.
Halting the loss of biodiversity and global ecosystem services degradation are priority
actions that have been analysed since the beginning of the 2000s as part of an initiative
launched by the United Nations (UN). Thus, in the report on the Millennium Ecosystem
Assessment (MEA), finalized in 2005, it was found that about two thirds of the Earth's
ecosystems are in decline or are threatened by various factors. In the framework of this
global initiative aimed at continuing MEA actions, the European Union has committed to
conduct such an assessment for the European region. In this regard, in May 2011, the
European Commission adopted a new 2020 Biodiversity Strategy, which is the framework
for action to meet the agreed priority objectives. The Biodiversity strategy for 2020 is
based on six interconnected objectives that aim to reduce the main pressures on natural
and semi-natural ecosystems and at the same time on their services at EU level. Each
objective is further translated into a set of actions with specific termsand relevant
measures.
Action 5 of Objective 2 of the Strategy aims at maintaining and improving ecosystems
and their services by 2020 by establishing green infrastructure and restoring at least 15%
of degraded ecosystems (European Commission, 2011).
In this context, the mapping and assessment of ecosystems and ecosystem services
in each Member State is foreseen by 2014 and the creation of tools for economic recovery
by 2020. The implementation of Action 5 is also supported by other initiatives such as the
reports and publications of the European Environment Agency (EEA, 2015) and the Joint
Research Center (JRC), (Maes et al., 2015), independent research (Science for
Environment Policy, 2015) and also projects such as MARS11, OpenNESS2, OPERAs3 and
ESMERALDA4.
In order to support the implementation of Action 5 within the Member States, the
Mapping and Assessment of Ecosystem Services Working Group (MAES) was set up,
according with the Common Implementation Framework (CIF). The first action of the MAES
Working Group was to develop a coherent analytical framework to support a common
1 http://www.mars-project.eu 2http://www.openness-progect.eu 3http://www.operas-project.eu 4http://www.esmeralda-project.eu
Best practices guide on mapping and assessing wetland ecosystems and their services
3
approach to how the methodology is applied by EU Member States (Maes et al., 2013). In
the second MAES report, indicators for mapping and estimating biodiversity, ecosystem
state and ecosystem services (Maes et al., 2014) were proposed. By the 2016 report
(Erhard, 2016), is presented the progress made in assessing and mapping ecosystems at
European level in the light of the activities undertaken by the European Environment
Agency during the period 2012-2014.
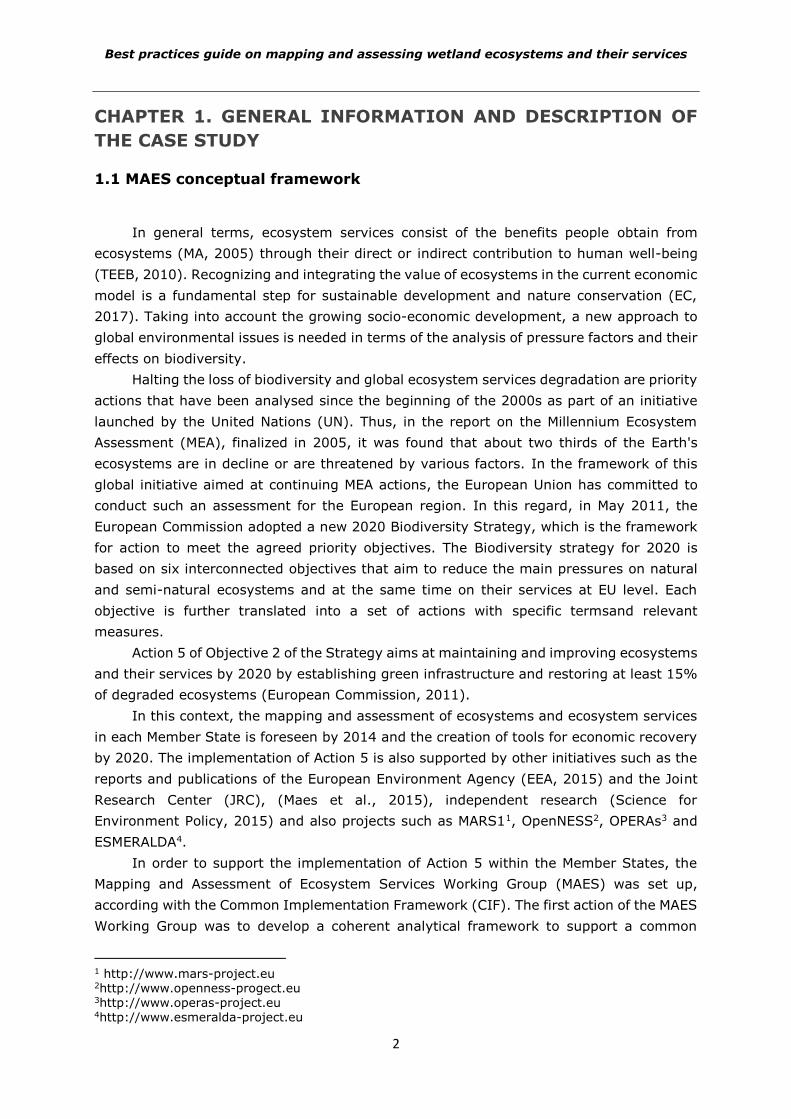
Conceptual framework developed by MAES (figure 1.1), highlights the link between
biodiversity and socio-economic systems through the flow of ecosystem services generated
on the one hand and the pressure factors that can cause major imbalances on the other.
This conceptual framework is based on the premise that the delivery of certain types of
ecosystem services, which are essential for socio-economic development and human well-
being, is dependent both on the spatial accessibility of ecosystems and on their condition.
Figure 1.1 Conceptual framework developed by MAES - illustrating the link between ecosystems,
biodiversity, functions and services provided by ecosystems (Maes et al., 2013)
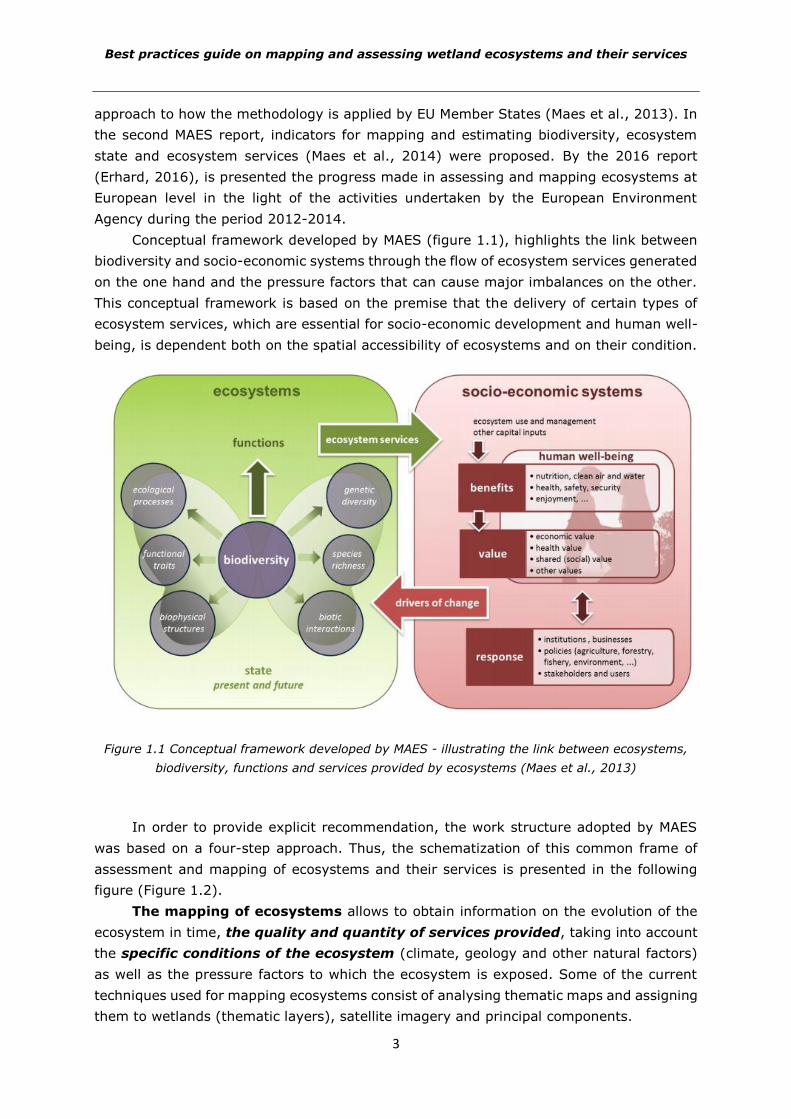
In order to provide explicit recommendation, the work structure adopted by MAES
was based on a four-step approach. Thus, the schematization of this common frame of
assessment and mapping of ecosystems and their services is presented in the following
figure (Figure 1.2).
The mapping of ecosystems allows to obtain information on the evolution of the
ecosystem in time, the quality and quantity of services provided, taking into account
the specific conditions of the ecosystem (climate, geology and other natural factors)
as well as the pressure factors to which the ecosystem is exposed. Some of the current
techniques used for mapping ecosystems consist of analysing thematic maps and assigning
them to wetlands (thematic layers), satellite imagery and principal components.
Best practices guide on mapping and assessing wetland ecosystems and their services
4
The assessment of the ecosystems state / condition provides information on
their ability to continuously provide services to human well-being (EEA, 2015). The
ecosystem condition is the product of factors represented by natural state and anthropic
pressures. Climate, soil, elevation, slope, and other natural environmental parameters
determine the state or ecosystems natural potential. Anthropogenic pressures such as
those caused by land use, management and air pollution affect the condition of ecosystems
and thus, the combination of this two factors reveals the effective capacity of ecosystems
to deliver services.
Figure 1.2 Common framework for assessing ecosystems and their services (Maes et al., 2014)
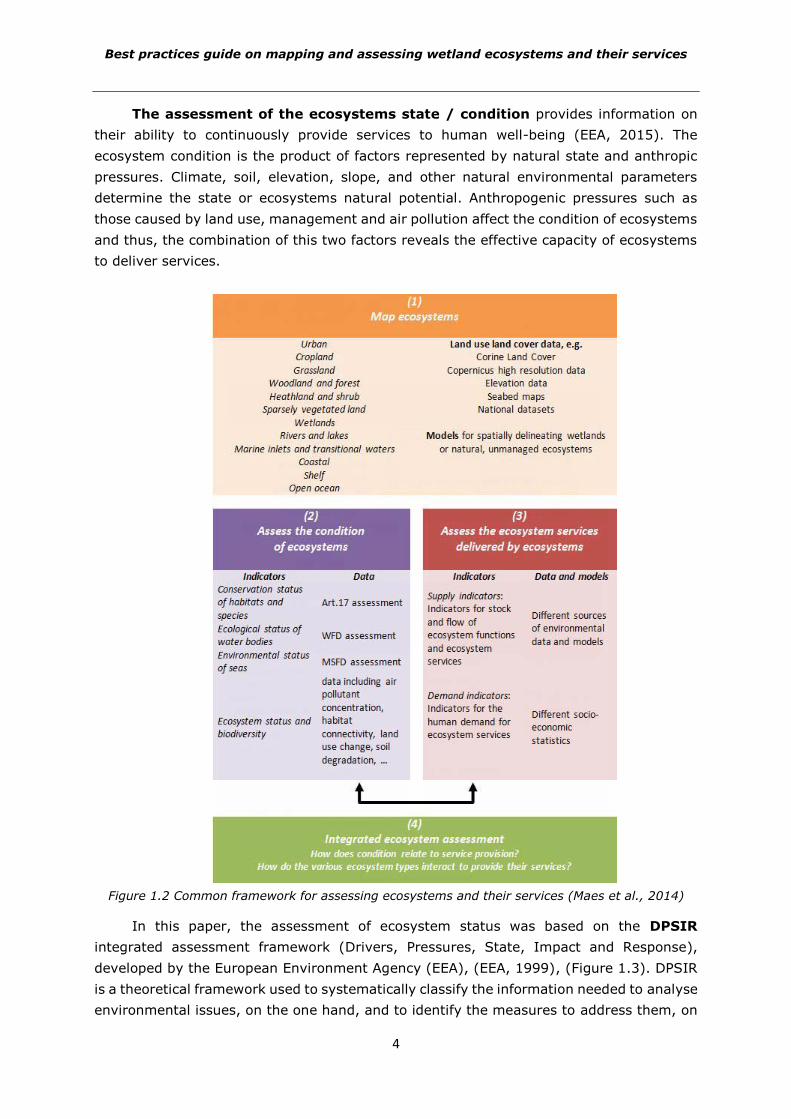
In this paper, the assessment of ecosystem status was based on the DPSIR
integrated assessment framework (Drivers, Pressures, State, Impact and Response),
developed by the European Environment Agency (EEA), (EEA, 1999), (Figure 1.3). DPSIR
is a theoretical framework used to systematically classify the information needed to analyse
environmental issues, on the one hand, and to identify the measures to address them, on
Best practices guide on mapping and assessing wetland ecosystems and their services
5
the other hand (Turner et al., 2010). Thus, drivers (D) exert pressure (P) on the
ecosystems state / condition (S), affecting, at one time habitats and biodiversity (I) and
consequently the services they can provide. Decision makers will implement relevant
responses(R) by taking action to counteract negative impacts. The DPSIR framework is
independent of spatial and temporal coordinates and can be adapted and applied to any
type of ecosystem at any level of detail. It supports the approach structuring and helps
identify the relevant data needed to perform the assessment at appropriate temporal and
spatial resolutions. Moreover, this information regarding the ecosystem state can be used
to estimate its capacity to provide services (EEA, 2015).
Figure 1.3 Links between pressure and ecosystem state (adapted after EEA, 2015)
Over time, several classifications and conceptual frameworks have been proposed for
the analysis of ecosystem services, such as: Millennium Ecosystem Assessment (MA,
2005), Economics of Ecosystems and Biodiversity (TEEB, 2010) and Common International
Classification of Ecosystem Services (CICES), (Haines-Young and Potschin, 2010). In the
MAES reports, for the evaluation and mapping of ecosystem services, it is
recommended to use the CICES benchmark developed by the EEA. According to CICES,
ecosystem services are classified into 3 categories:
provisioning services;
regulation and maintenance services;
cultural services.
Mechanisms
Agriculture, forestry, water management, human
settlements, transport, industry, tourism
Pressures
Habitats change, climate change, invasive species, land use / exploitation, pollution and
nutrient enrichment
Condition / Condition
Condition and quality of the ecosystem
Structure and conditions of nutrient functionality, diversity of habitats, species abundance and diversity
Impact
Changes / losses on ecosystem functionality
Answer
Maintaining ecosystem and biodiversity functionality,
management change, preventive measures, reducing pollution and
nutrient enrichment
Best practices guide on mapping and assessing wetland ecosystems and their services
6
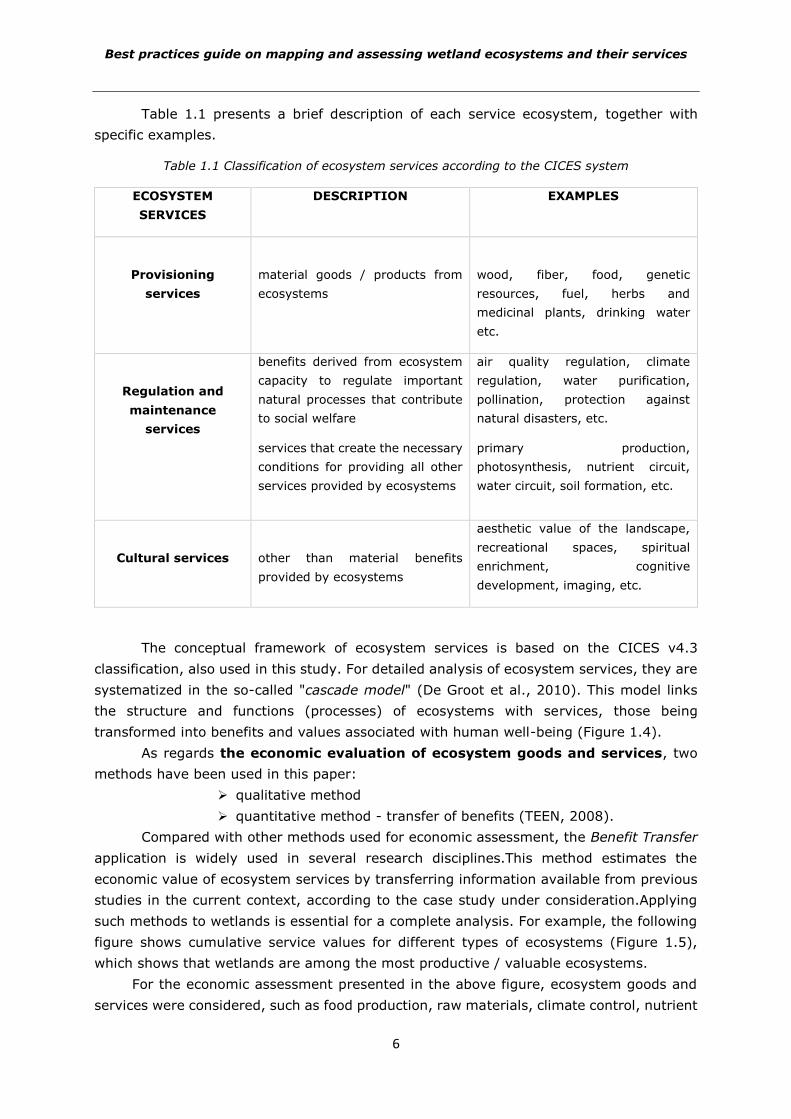
Table 1.1 presents a brief description of each service ecosystem, together with
specific examples.
Table 1.1 Classification of ecosystem services according to the CICES system
ECOSYSTEM
SERVICES
DESCRIPTION EXAMPLES
Provisioning
services
material goods / products from
ecosystems
wood, fiber, food, genetic
resources, fuel, herbs and
medicinal plants, drinking water
etc.
Regulation and
maintenance
services
benefits derived from ecosystem
capacity to regulate important
natural processes that contribute
to social welfare
services that create the necessary
conditions for providing all other
services provided by ecosystems
air quality regulation, climate
regulation, water purification,
pollination, protection against
natural disasters, etc.
primary production,
photosynthesis, nutrient circuit,
water circuit, soil formation, etc.
Cultural services
other than material benefits
provided by ecosystems
aesthetic value of the landscape,
recreational spaces, spiritual
enrichment, cognitive
development, imaging, etc.
The conceptual framework of ecosystem services is based on the CICES v4.3
classification, also used in this study. For detailed analysis of ecosystem services, they are
systematized in the so-called "cascade model" (De Groot et al., 2010). This model links
the structure and functions (processes) of ecosystems with services, those being
transformed into benefits and values associated with human well-being (Figure 1.4).
As regards the economic evaluation of ecosystem goods and services, two
methods have been used in this paper:
qualitative method
quantitative method - transfer of benefits (TEEN, 2008).
Compared with other methods used for economic assessment, the Benefit Transfer
application is widely used in several research disciplines.This method estimates the
economic value of ecosystem services by transferring information available from previous
studies in the current context, according to the case study under consideration.Applying
such methods to wetlands is essential for a complete analysis. For example, the following
figure shows cumulative service values for different types of ecosystems (Figure 1.5),
which shows that wetlands are among the most productive / valuable ecosystems.
For the economic assessment presented in the above figure, ecosystem goods and
services were considered, such as food production, raw materials, climate control, nutrient
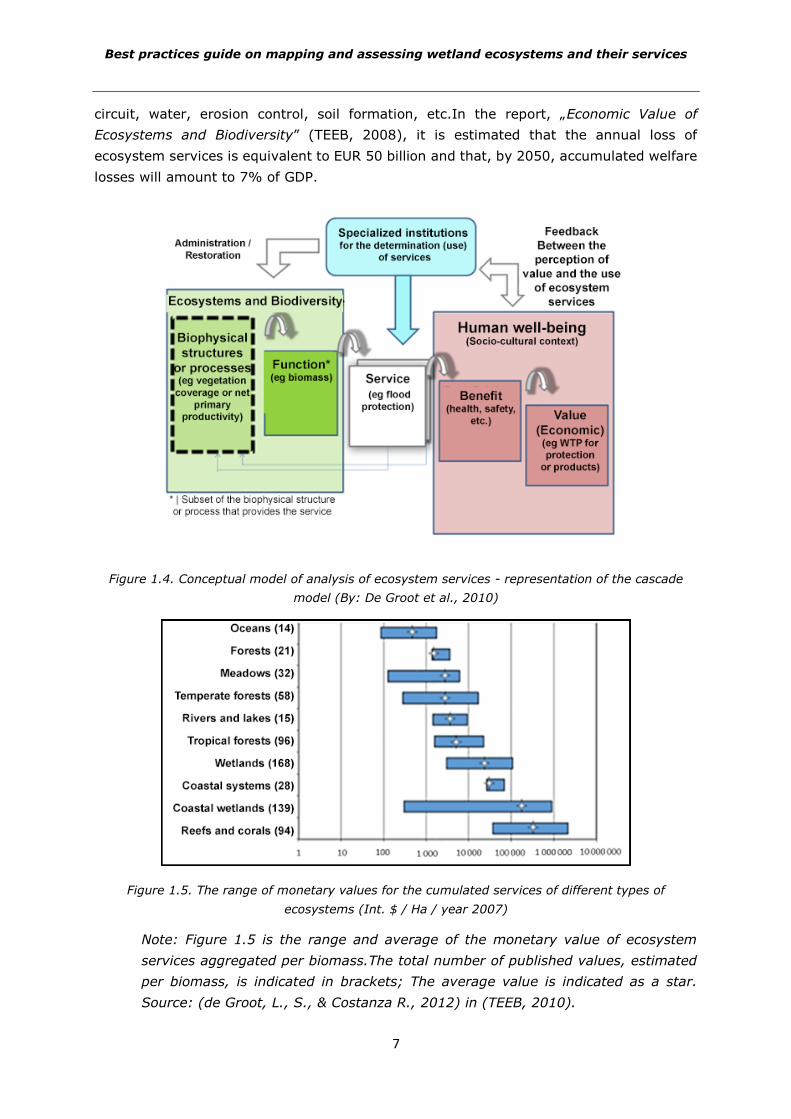
Best practices guide on mapping and assessing wetland ecosystems and their services
7
circuit, water, erosion control, soil formation, etc.In the report, „Economic Value of
Ecosystems and Biodiversity” (TEEB, 2008), it is estimated that the annual loss of
ecosystem services is equivalent to EUR 50 billion and that, by 2050, accumulated welfare
losses will amount to 7% of GDP.
Figure 1.4. Conceptual model of analysis of ecosystem services - representation of the cascade
model (By: De Groot et al., 2010)
Figure 1.5. The range of monetary values for the cumulated services of different types of
ecosystems (Int. $ / Ha / year 2007)
Note: Figure 1.5 is the range and average of the monetary value of ecosystem
services aggregated per biomass.The total number of published values, estimated
per biomass, is indicated in brackets; The average value is indicated as a star.
Source: (de Groot, L., S., & Costanza R., 2012) in (TEEB, 2010).
Best practices guide on mapping and assessing wetland ecosystems and their services
8
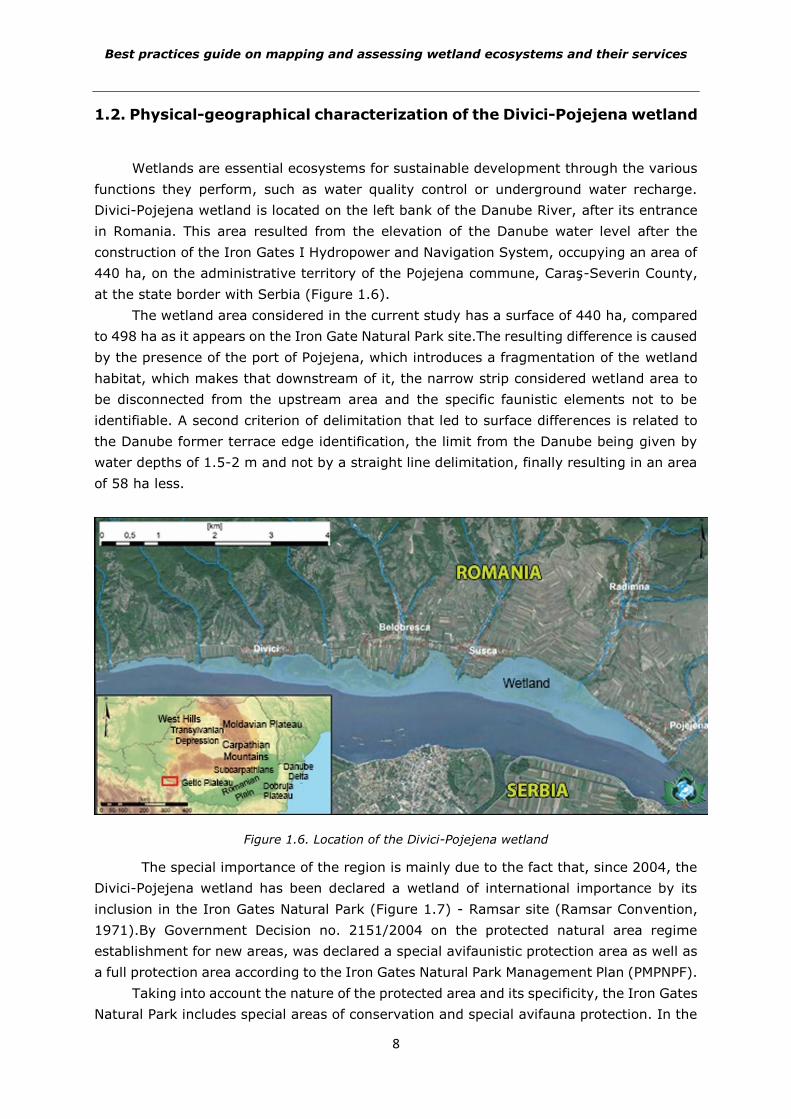
1.2. Physical-geographical characterization of the Divici-Pojejena wetland
Wetlands are essential ecosystems for sustainable development through the various
functions they perform, such as water quality control or underground water recharge.
Divici-Pojejena wetland is located on the left bank of the Danube River, after its entrance
in Romania. This area resulted from the elevation of the Danube water level after the
construction of the Iron Gates I Hydropower and Navigation System, occupying an area of
440 ha, on the administrative territory of the Pojejena commune, Caraş-Severin County,
at the state border with Serbia (Figure 1.6).
The wetland area considered in the current study has a surface of 440 ha, compared
to 498 ha as it appears on the Iron Gate Natural Park site.The resulting difference is caused
by the presence of the port of Pojejena, which introduces a fragmentation of the wetland
habitat, which makes that downstream of it, the narrow strip considered wetland area to
be disconnected from the upstream area and the specific faunistic elements not to be
identifiable. A second criterion of delimitation that led to surface differences is related to
the Danube former terrace edge identification, the limit from the Danube being given by
water depths of 1.5-2 m and not by a straight line delimitation, finally resulting in an area
of 58 ha less.
Figure 1.6. Location of the Divici-Pojejena wetland
The special importance of the region is mainly due to the fact that, since 2004, the
Divici-Pojejena wetland has been declared a wetland of international importance by its
inclusion in the Iron Gates Natural Park (Figure 1.7) - Ramsar site (Ramsar Convention,
1971).By Government Decision no. 2151/2004 on the protected natural area regime
establishment for new areas, was declared a special avifaunistic protection area as well as
a full protection area according to the Iron Gates Natural Park Management Plan (PMPNPF).
Taking into account the nature of the protected area and its specificity, the Iron Gates
Natural Park includes special areas of conservation and special avifauna protection. In the
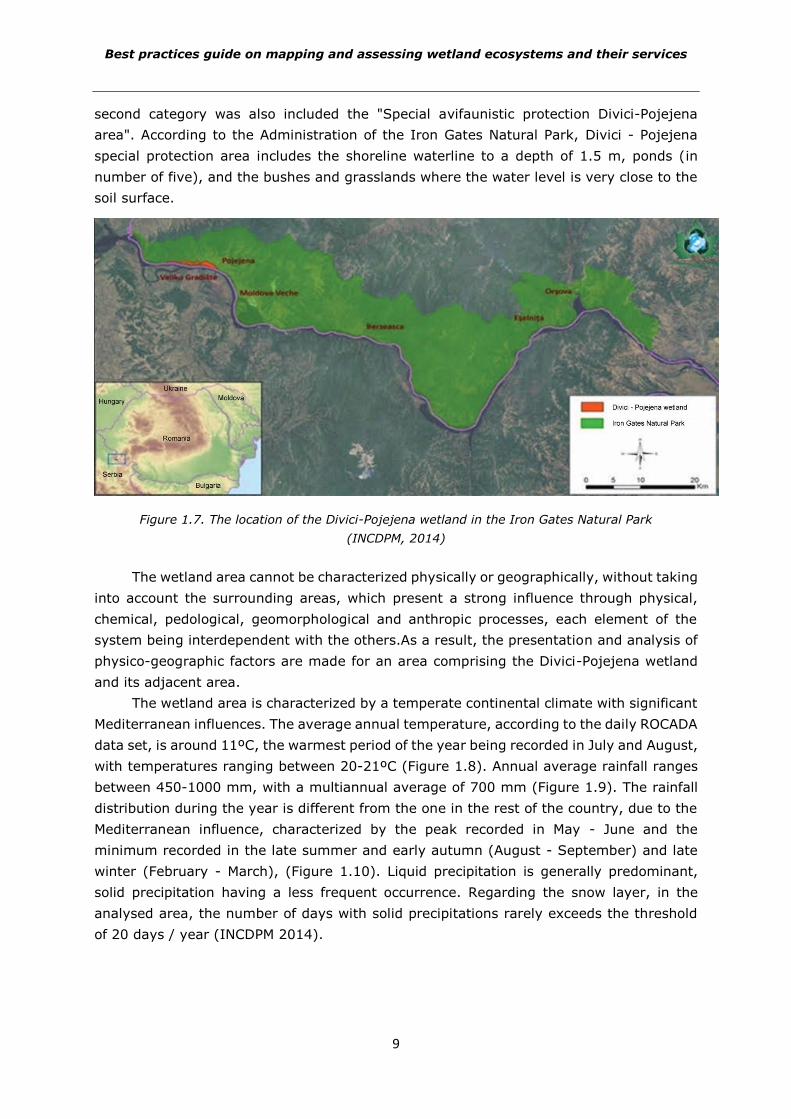
Best practices guide on mapping and assessing wetland ecosystems and their services
9
second category was also included the "Special avifaunistic protection Divici-Pojejena
area". According to the Administration of the Iron Gates Natural Park, Divici - Pojejena
special protection area includes the shoreline waterline to a depth of 1.5 m, ponds (in
number of five), and the bushes and grasslands where the water level is very close to the
soil surface.
Figure 1.7. The location of the Divici-Pojejena wetland in the Iron Gates Natural Park
(INCDPM, 2014)
The wetland area cannot be characterized physically or geographically, without taking
into account the surrounding areas, which present a strong influence through physical,
chemical, pedological, geomorphological and anthropic processes, each element of the
system being interdependent with the others.As a result, the presentation and analysis of
physico-geographic factors are made for an area comprising the Divici-Pojejena wetland
and its adjacent area.
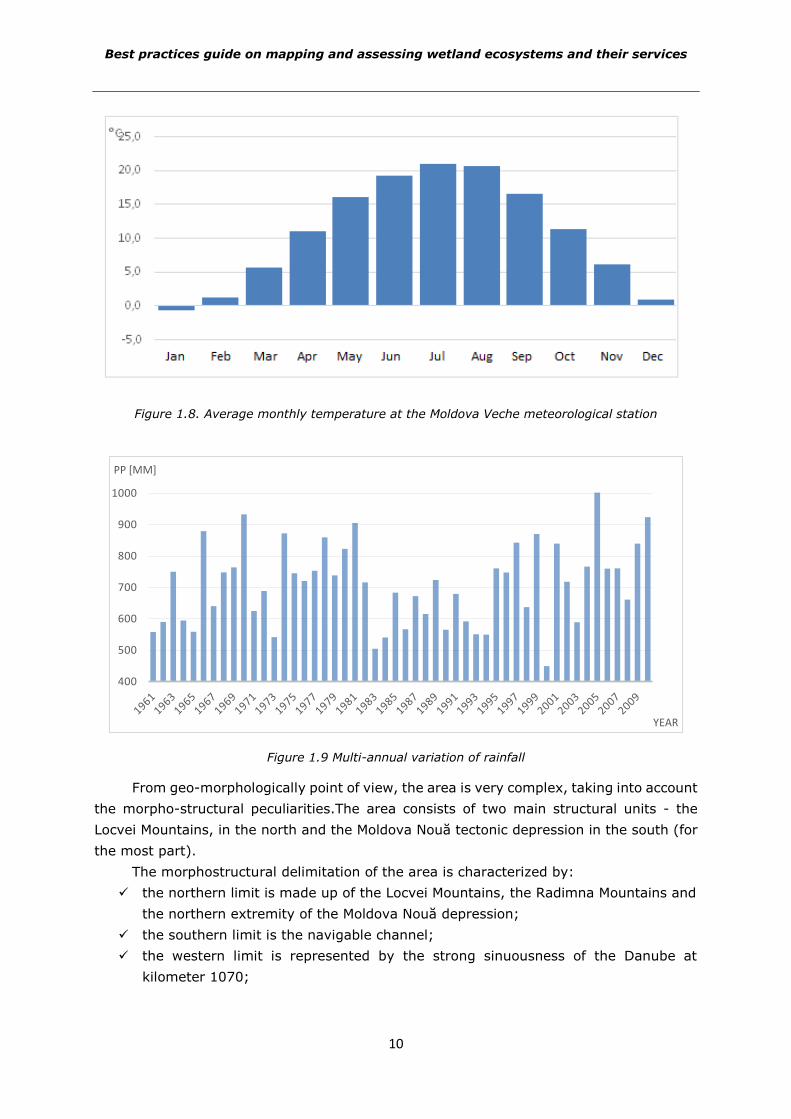
The wetland area is characterized by a temperate continental climate with significant
Mediterranean influences. The average annual temperature, according to the daily ROCADA
data set, is around 11ºC, the warmest period of the year being recorded in July and August,
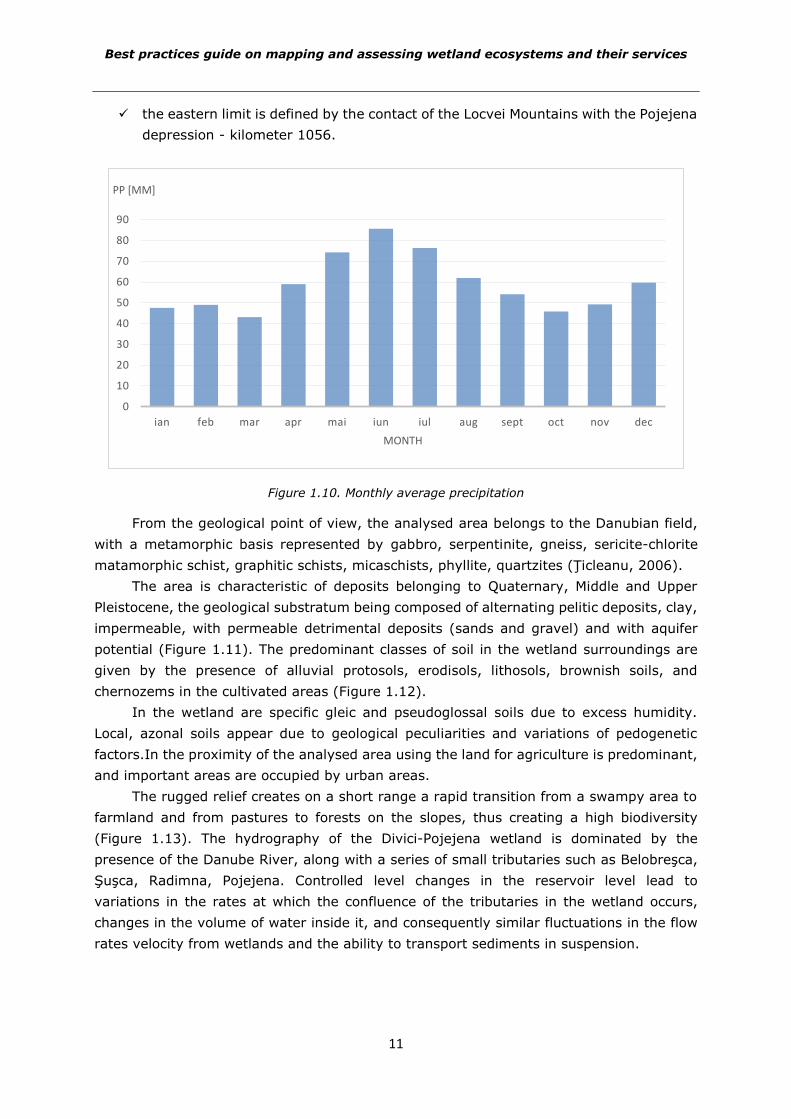
with temperatures ranging between 20-21ºC (Figure 1.8). Annual average rainfall ranges
between 450-1000 mm, with a multiannual average of 700 mm (Figure 1.9). The rainfall
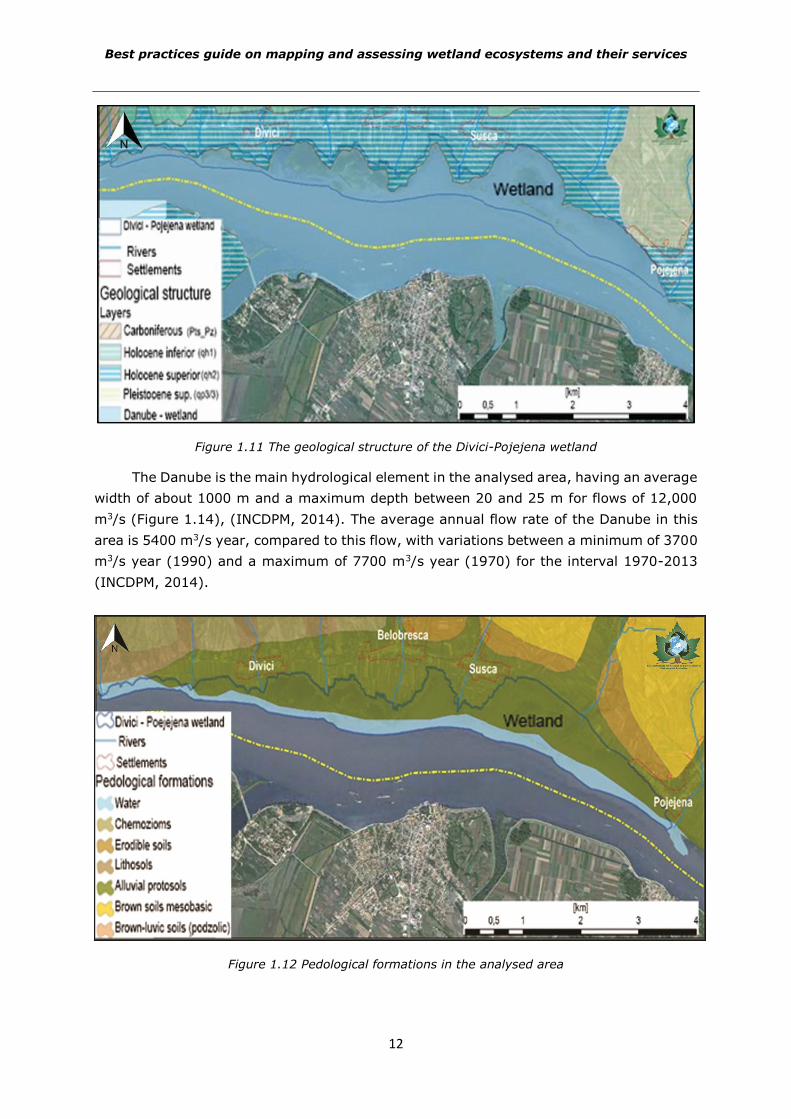
distribution during the year is different from the one in the rest of the country, due to the
Mediterranean influence, characterized by the peak recorded in May - June and the
minimum recorded in the late summer and early autumn (August - September) and late
winter (February - March), (Figure 1.10). Liquid precipitation is generally predominant,
solid precipitation having a less frequent occurrence. Regarding the snow layer, in the
analysed area, the number of days with solid precipitations rarely exceeds the threshold
of 20 days / year (INCDPM 2014).
Best practices guide on mapping and assessing wetland ecosystems and their services
10
Figure 1.8. Average monthly temperature at the Moldova Veche meteorological station
Figure 1.9 Multi-annual variation of rainfall
From geo-morphologically point of view, the area is very complex, taking into account
the morpho-structural peculiarities.The area consists of two main structural units - the
Locvei Mountains, in the north and the Moldova Nouă tectonic depression in the south (for
the most part).
The morphostructural delimitation of the area is characterized by:
the northern limit is made up of the Locvei Mountains, the Radimna Mountains and the northern extremity of the Moldova Nouă depression;
the southern limit is the navigable channel;
the western limit is represented by the strong sinuousness of the Danube at
kilometer 1070;
400
500
600
700
800
900
1000
PP [MM]
YEAR
Best practices guide on mapping and assessing wetland ecosystems and their services
11
the eastern limit is defined by the contact of the Locvei Mountains with the Pojejena
depression - kilometer 1056.
Figure 1.10. Monthly average precipitation
From the geological point of view, the analysed area belongs to the Danubian field,
with a metamorphic basis represented by gabbro, serpentinite, gneiss, sericite-chlorite
matamorphic schist, graphitic schists, micaschists, phyllite, quartzites (Ţicleanu, 2006).
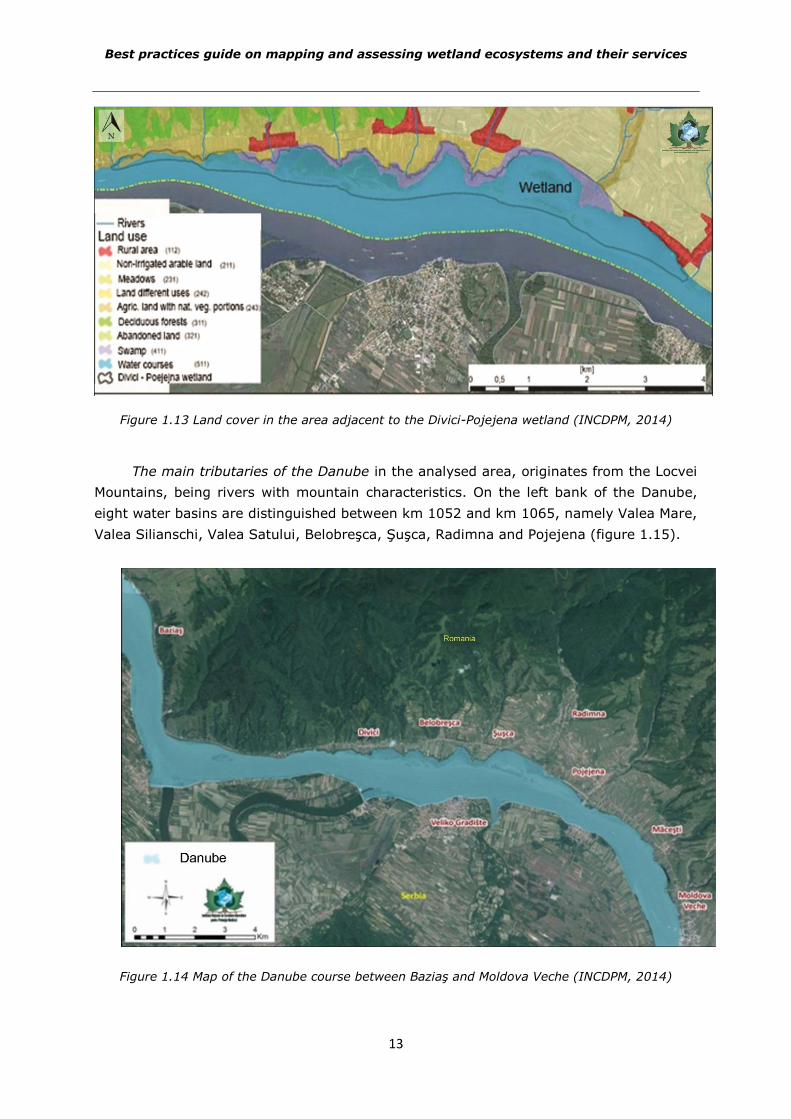
The area is characteristic of deposits belonging to Quaternary, Middle and Upper
Pleistocene, the geological substratum being composed of alternating pelitic deposits, clay,
impermeable, with permeable detrimental deposits (sands and gravel) and with aquifer
potential (Figure 1.11). The predominant classes of soil in the wetland surroundings are
given by the presence of alluvial protosols, erodisols, lithosols, brownish soils, and
chernozems in the cultivated areas (Figure 1.12).
In the wetland are specific gleic and pseudoglossal soils due to excess humidity.
Local, azonal soils appear due to geological peculiarities and variations of pedogenetic
factors.In the proximity of the analysed area using the land for agriculture is predominant,
and important areas are occupied by urban areas.
The rugged relief creates on a short range a rapid transition from a swampy area to
farmland and from pastures to forests on the slopes, thus creating a high biodiversity
(Figure 1.13). The hydrography of the Divici-Pojejena wetland is dominated by the
presence of the Danube River, along with a series of small tributaries such as Belobreşca,
Şuşca, Radimna, Pojejena. Controlled level changes in the reservoir level lead to
variations in the rates at which the confluence of the tributaries in the wetland occurs,
changes in the volume of water inside it, and consequently similar fluctuations in the flow
rates velocity from wetlands and the ability to transport sediments in suspension.
0
10
20
30
40
50
60
70
80
90
ian feb mar apr mai iun iul aug sept oct nov dec
PP [MM]
MONTH
Best practices guide on mapping and assessing wetland ecosystems and their services
12
Figure 1.11 The geological structure of the Divici-Pojejena wetland
The Danube is the main hydrological element in the analysed area, having an average
width of about 1000 m and a maximum depth between 20 and 25 m for flows of 12,000
m3/s (Figure 1.14), (INCDPM, 2014). The average annual flow rate of the Danube in this
area is 5400 m3/s year, compared to this flow, with variations between a minimum of 3700
m3/s year (1990) and a maximum of 7700 m3/s year (1970) for the interval 1970-2013
(INCDPM, 2014).
Figure 1.12 Pedological formations in the analysed area
Best practices guide on mapping and assessing wetland ecosystems and their services
13
Figure 1.13 Land cover in the area adjacent to the Divici-Pojejena wetland (INCDPM, 2014)
The main tributaries of the Danube in the analysed area, originates from the Locvei
Mountains, being rivers with mountain characteristics. On the left bank of the Danube,
eight water basins are distinguished between km 1052 and km 1065, namely Valea Mare,
Valea Silianschi, Valea Satului, Belobreşca, Şuşca, Radimna and Pojejena (figure 1.15).
Figure 1.14 Map of the Danube course between Baziaş and Moldova Veche (INCDPM, 2014)
Best practices guide on mapping and assessing wetland ecosystems and their services
14
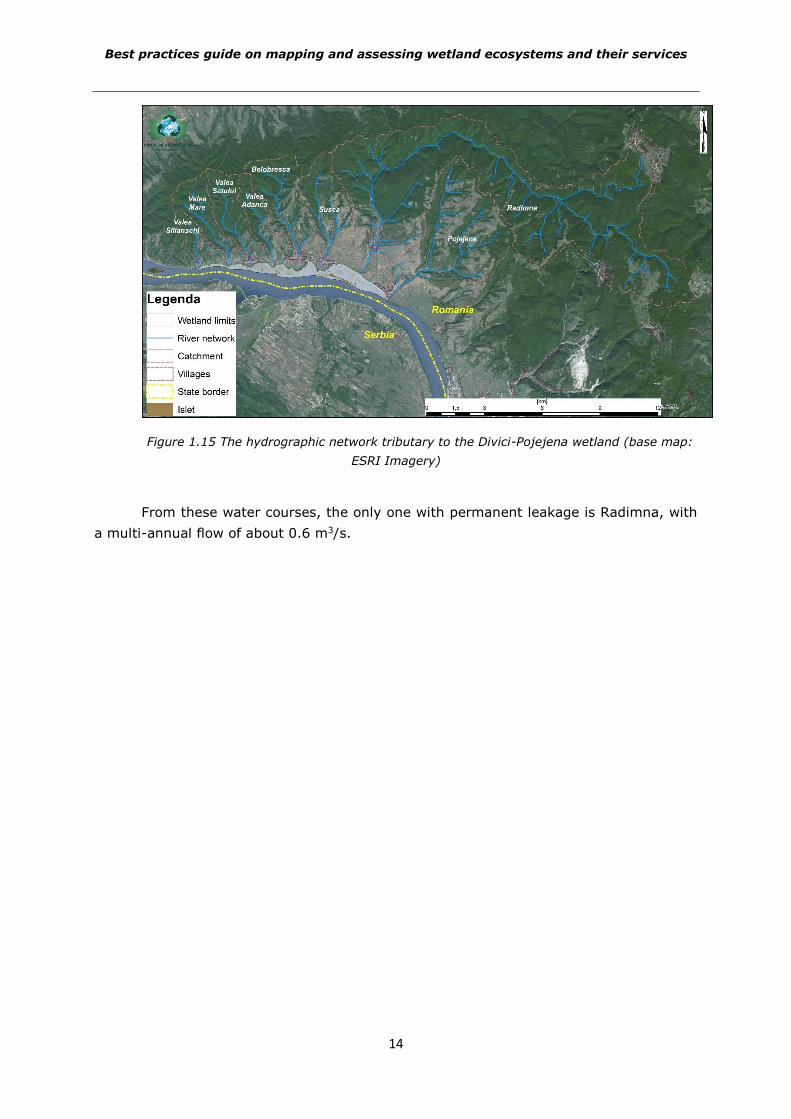
Figure 1.15 The hydrographic network tributary to the Divici-Pojejena wetland (base map:
ESRI Imagery)
From these water courses, the only one with permanent leakage is Radimna, with
a multi-annual flow of about 0.6 m3/s.
Best practices guide on mapping and assessing wetland ecosystems and their services
15
CHAPTER 2. MAPPING WETLAND ECOSYSTEMS
Mapping ecosystems represents the action by which the attributes of a landscape are
schematically represented in a plan. By mapping are represented the dominant features of a
study area.
Ecosystem delineation is a very important preliminary action in the framework of
ecosystem services mapping. This action can be fulfilled either by using a GIS (Geographical
Information System) data base (Troy and Wilson, 2006) either by in-situ measurements, when
information on ecosystem boundaries is missing, thus obtaining spatial location and
information on their characteristics. These data can be used to track changes over time on
ecosystems by modifying land use, while GIS techniques can detect trends in spatial-temporal
and qualitative evolution.
2.1 Methods of mapping wetlands
The ecosystems mapping was performed through techniques that consisted of analysing
thematic maps and attributing their features to wetlands, mapping using remote sensing data
and principal components method. The mapping also aimed at applying the techniques at two
different scales, national and local scale.
2.1.1. Mapping ecosystems using remote sensing data
Mapping ecosystems based on satellite images involves the use of remote sensing
techniques for delineating wetlands and presents the advantage that it can be applied to large
surfaces, capturing spatial-temporal evolution of habitats and ecosystems in general.
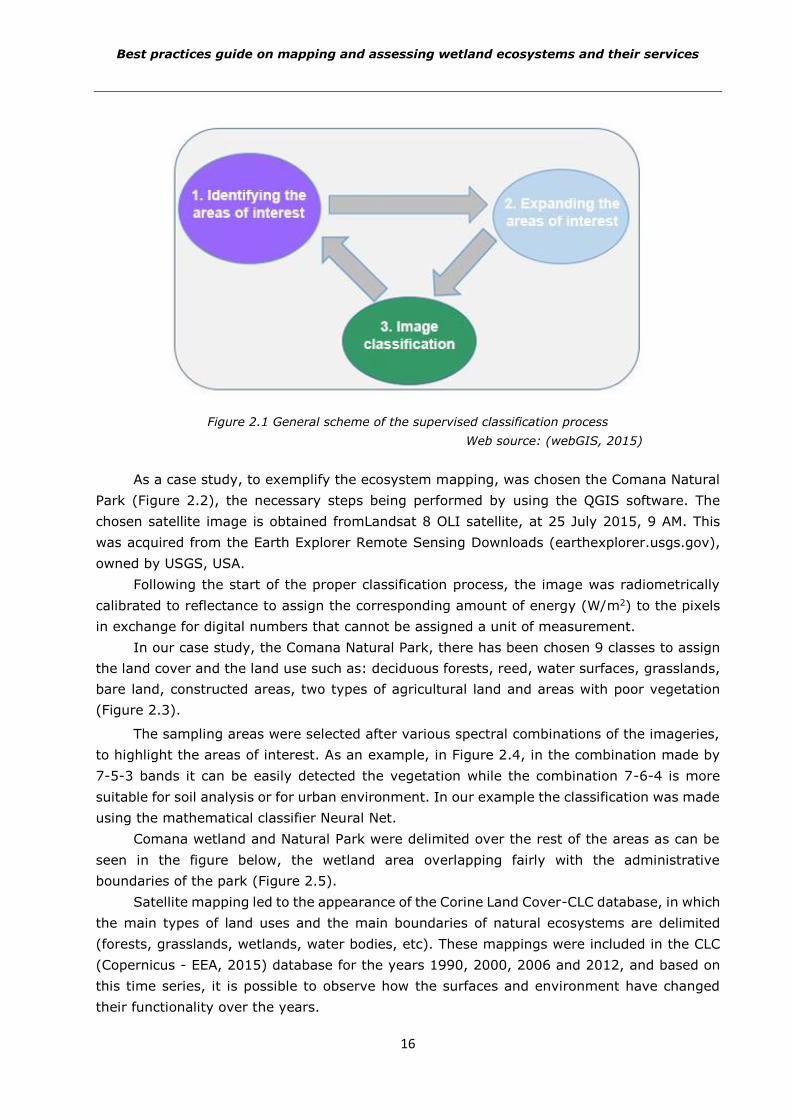
The remote sensing technique consists of using the supervised classification, which
involves grouping the constituent pixels of the satellite image into aggregates (classes)
relatively homogeneous in terms of physical and spatial characteristics. With this property of
identifying homogeneous objects, image classification can be used in many spatial applications
(ecosystem mapping, land use maps, processes mapping, or physical phenomena).
In the remote sensing studies, the supervised classification is widely used as satellite
imagery classification (Blaschke, 2010). This technique imply two working procedures;
automated unsupervised classification, and object orientated classification (OBIA) that uses
specialist expertise in discriminating the areas (Tempfli, et al., 2001). The classification
process follows a simple conceptual scheme: the expert selects sample areas in the image
and includes them in homogeneous classes based on ground knowledge and pixel spectral
analysis, then, based on the created classes, runs a mathematical classifier that reclassifies
the entire image by including of all existing pixels in the created classes, based on the
probability of belonging to each class (Bogdan, 2009), (Figure 2.1).
Best practices guide on mapping and assessing wetland ecosystems and their services
16
Figure 2.1 General scheme of the supervised classification process
Web source: (webGIS, 2015)
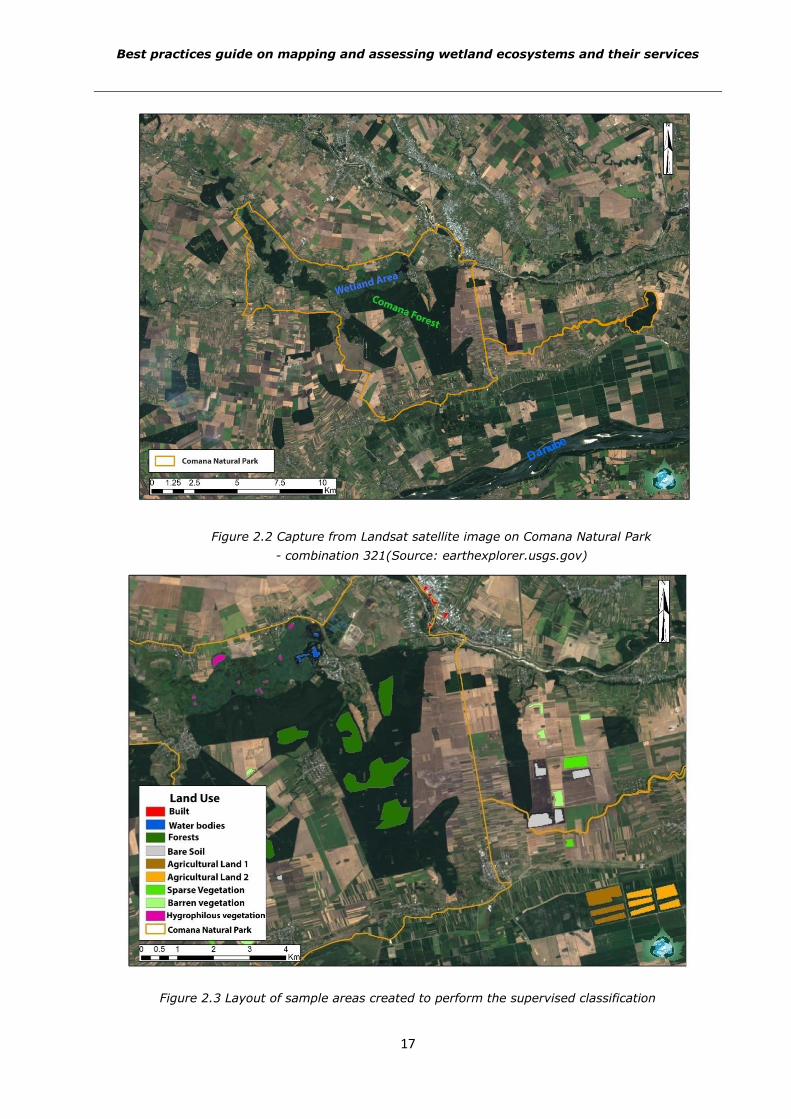
As a case study, to exemplify the ecosystem mapping, was chosen the Comana Natural
Park (Figure 2.2), the necessary steps being performed by using the QGIS software. The
chosen satellite image is obtained fromLandsat 8 OLI satellite, at 25 July 2015, 9 AM. This
was acquired from the Earth Explorer Remote Sensing Downloads (earthexplorer.usgs.gov),
owned by USGS, USA.
Following the start of the proper classification process, the image was radiometrically
calibrated to reflectance to assign the corresponding amount of energy (W/m2) to the pixels
in exchange for digital numbers that cannot be assigned a unit of measurement.
In our case study, the Comana Natural Park, there has been chosen 9 classes to assign
the land cover and the land use such as: deciduous forests, reed, water surfaces, grasslands,
bare land, constructed areas, two types of agricultural land and areas with poor vegetation
(Figure 2.3).
The sampling areas were selected after various spectral combinations of the imageries,
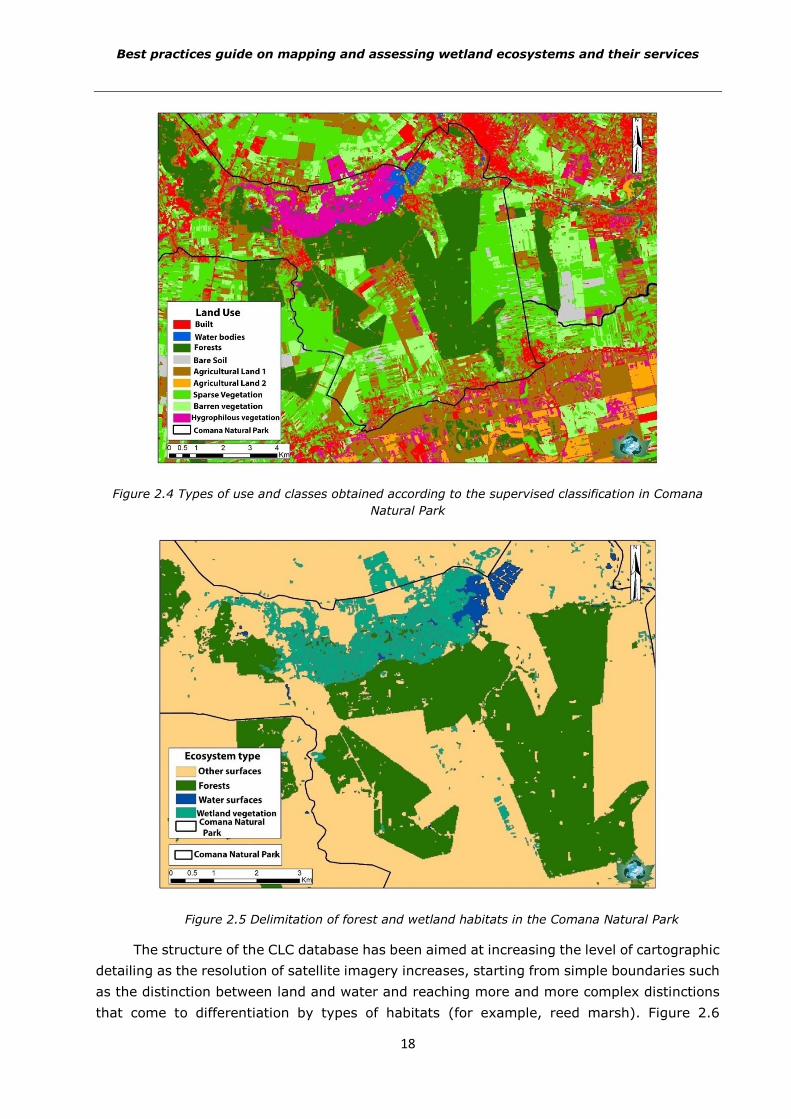
to highlight the areas of interest. As an example, in Figure 2.4, in the combination made by
7-5-3 bands it can be easily detected the vegetation while the combination 7-6-4 is more
suitable for soil analysis or for urban environment. In our example the classification was made
using the mathematical classifier Neural Net.
Comana wetland and Natural Park were delimited over the rest of the areas as can be
seen in the figure below, the wetland area overlapping fairly with the administrative
boundaries of the park (Figure 2.5).
Satellite mapping led to the appearance of the Corine Land Cover-CLC database, in which
the main types of land uses and the main boundaries of natural ecosystems are delimited
(forests, grasslands, wetlands, water bodies, etc). These mappings were included in the CLC
(Copernicus - EEA, 2015) database for the years 1990, 2000, 2006 and 2012, and based on
this time series, it is possible to observe how the surfaces and environment have changed
their functionality over the years.
Best practices guide on mapping and assessing wetland ecosystems and their services
17
Figure 2.2 Capture from Landsat satellite image on Comana Natural Park
- combination 321(Source: earthexplorer.usgs.gov)
Figure 2.3 Layout of sample areas created to perform the supervised classification
Best practices guide on mapping and assessing wetland ecosystems and their services
18
Figure 2.4 Types of use and classes obtained according to the supervised classification in Comana
Natural Park
Figure 2.5 Delimitation of forest and wetland habitats in the Comana Natural Park
The structure of the CLC database has been aimed at increasing the level of cartographic
detailing as the resolution of satellite imagery increases, starting from simple boundaries such
as the distinction between land and water and reaching more and more complex distinctions
that come to differentiation by types of habitats (for example, reed marsh). Figure 2.6
Best practices guide on mapping and assessing wetland ecosystems and their services
19
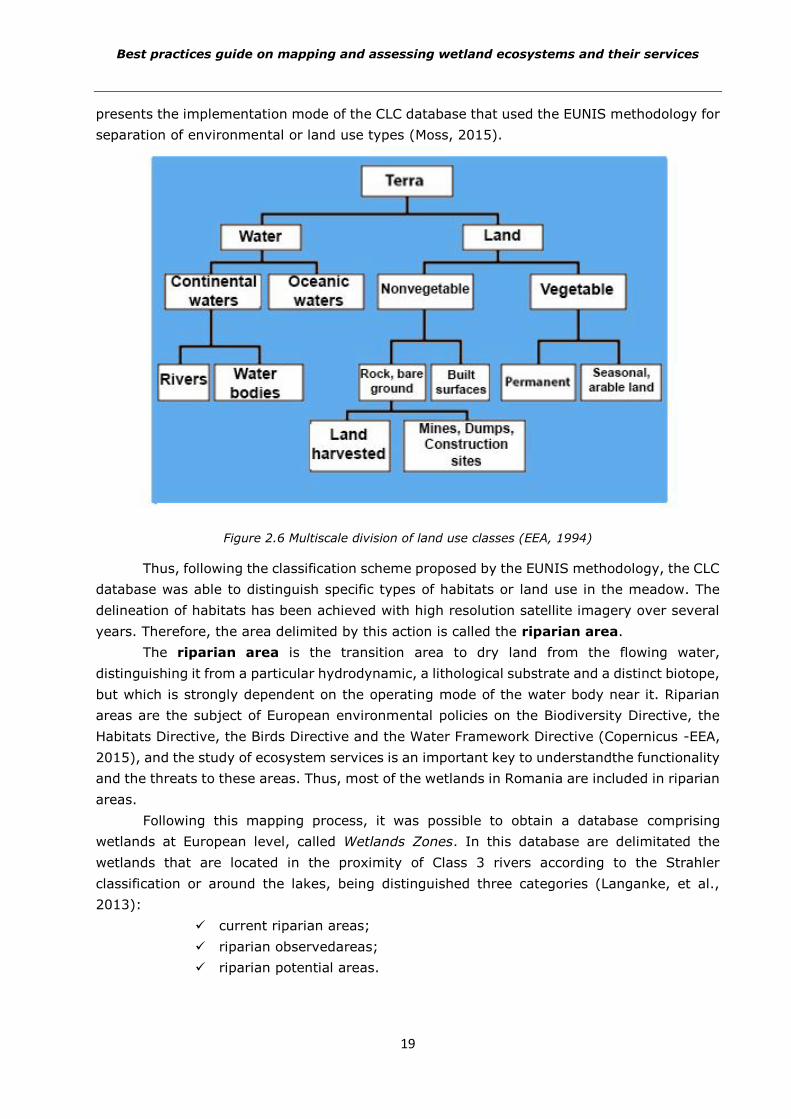
presents the implementation mode of the CLC database that used the EUNIS methodology for
separation of environmental or land use types (Moss, 2015).
Figure 2.6 Multiscale division of land use classes (EEA, 1994)
Thus, following the classification scheme proposed by the EUNIS methodology, the CLC
database was able to distinguish specific types of habitats or land use in the meadow. The
delineation of habitats has been achieved with high resolution satellite imagery over several
years. Therefore, the area delimited by this action is called the riparian area.
The riparian area is the transition area to dry land from the flowing water,
distinguishing it from a particular hydrodynamic, a lithological substrate and a distinct biotope,
but which is strongly dependent on the operating mode of the water body near it. Riparian
areas are the subject of European environmental policies on the Biodiversity Directive, the
Habitats Directive, the Birds Directive and the Water Framework Directive (Copernicus -EEA,
2015), and the study of ecosystem services is an important key to understandthe functionality
and the threats to these areas. Thus, most of the wetlands in Romania are included in riparian
areas.
Following this mapping process, it was possible to obtain a database comprising
wetlands at European level, called Wetlands Zones. In this database are delimitated the
wetlands that are located in the proximity of Class 3 rivers according to the Strahler
classification or around the lakes, being distinguished three categories (Langanke, et al.,
2013):
current riparian areas;
riparian observedareas;
riparian potential areas.
Best practices guide on mapping and assessing wetland ecosystems and their services
20
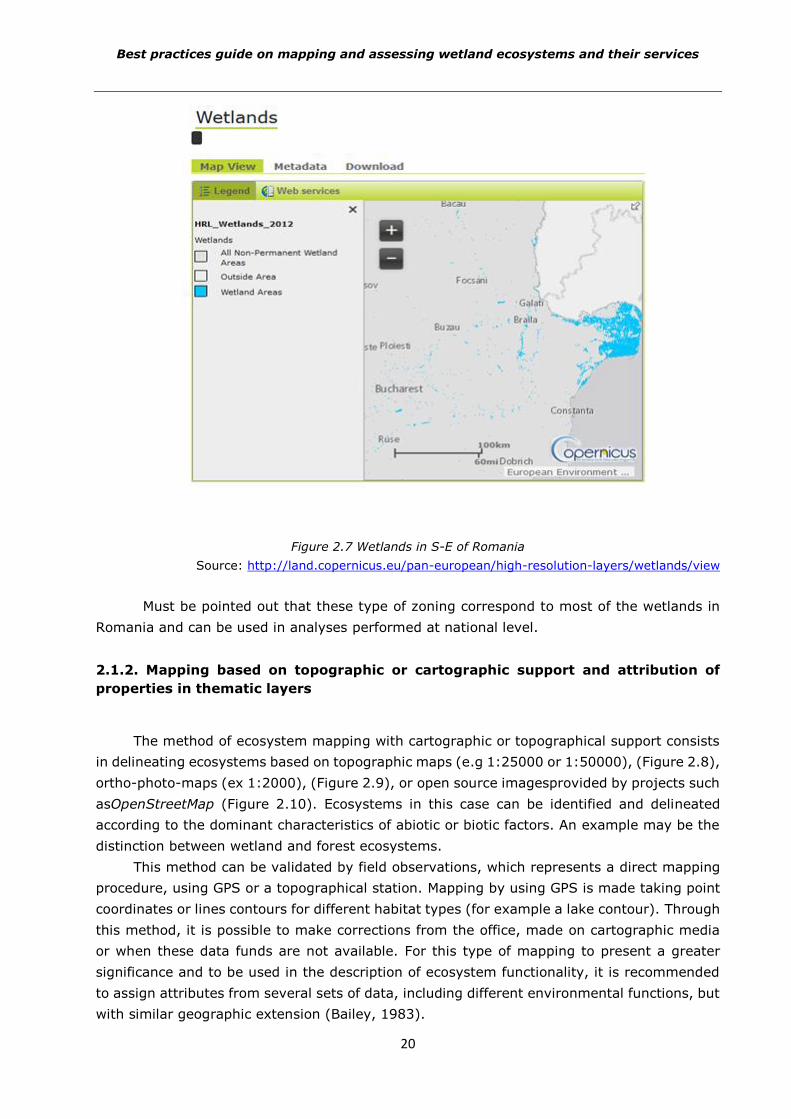
Figure 2.7 Wetlands in S-E of Romania
Source: http://land.copernicus.eu/pan-european/high-resolution-layers/wetlands/view
Must be pointed out that these type of zoning correspond to most of the wetlands in
Romania and can be used in analyses performed at national level.
2.1.2. Mapping based on topographic or cartographic support and attribution of
properties in thematic layers
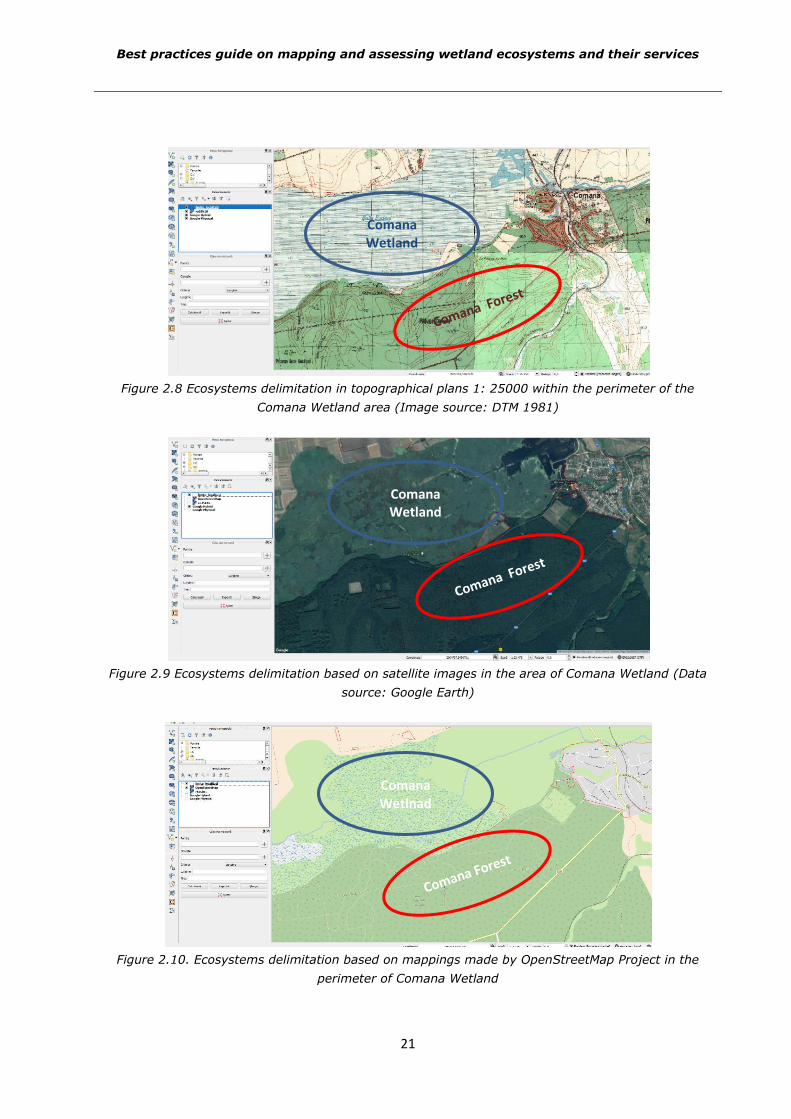
The method of ecosystem mapping with cartographic or topographical support consists
in delineating ecosystems based on topographic maps (e.g 1:25000 or 1:50000), (Figure 2.8),
ortho-photo-maps (ex 1:2000), (Figure 2.9), or open source imagesprovided by projects such
asOpenStreetMap (Figure 2.10). Ecosystems in this case can be identified and delineated
according to the dominant characteristics of abiotic or biotic factors. An example may be the
distinction between wetland and forest ecosystems.
This method can be validated by field observations, which represents a direct mapping
procedure, using GPS or a topographical station. Mapping by using GPS is made taking point
coordinates or lines contours for different habitat types (for example a lake contour). Through
this method, it is possible to make corrections from the office, made on cartographic media
or when these data funds are not available. For this type of mapping to present a greater
significance and to be used in the description of ecosystem functionality, it is recommended
to assign attributes from several sets of data, including different environmental functions, but
with similar geographic extension (Bailey, 1983).
Best practices guide on mapping and assessing wetland ecosystems and their services
21
Figure 2.8 Ecosystems delimitation in topographical plans 1: 25000 within the perimeter of the
Comana Wetland area (Image source: DTM 1981)
Figure 2.9 Ecosystems delimitation based on satellite images in the area of Comana Wetland (Data
source: Google Earth)
Figure 2.10. Ecosystems delimitation based on mappings made by OpenStreetMap Project in the
perimeter of Comana Wetland
Comana Wetland
Comana Wetland
Comana Wetlnad
Best practices guide on mapping and assessing wetland ecosystems and their services
22
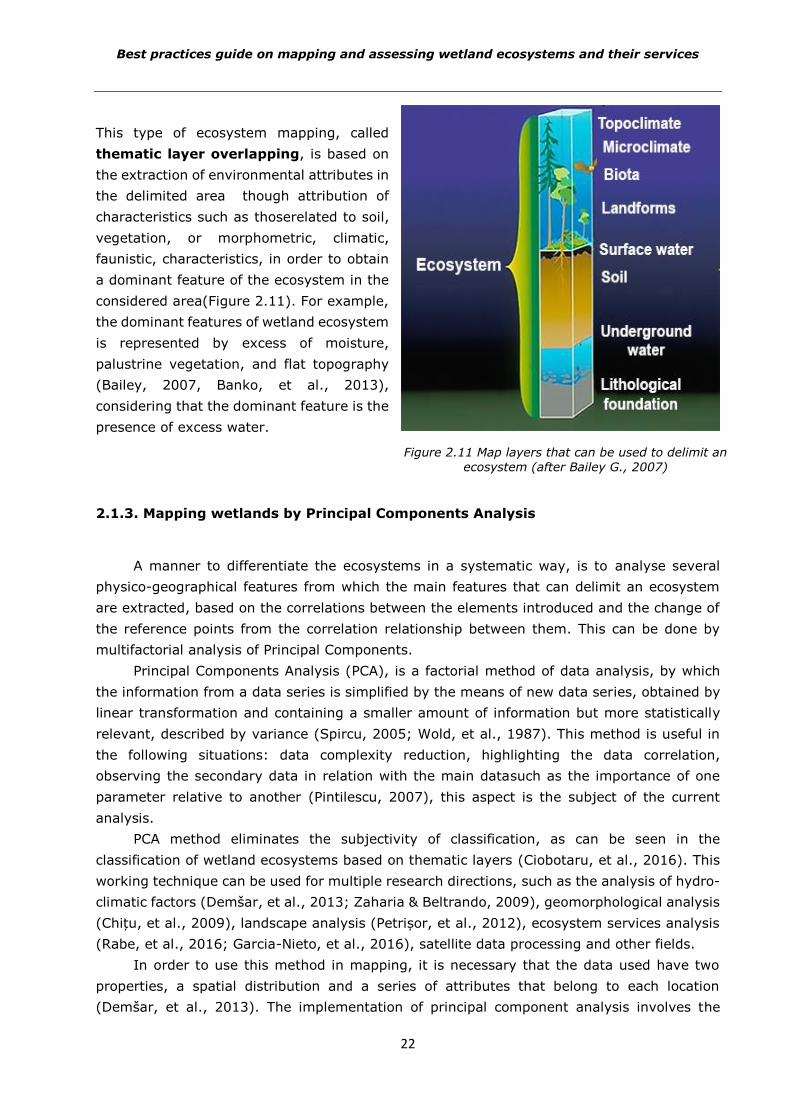
This type of ecosystem mapping, called
thematic layer overlapping, is based on
the extraction of environmental attributes in
the delimited area though attribution of
characteristics such as thoserelated to soil,
vegetation, or morphometric, climatic,
faunistic, characteristics, in order to obtain
a dominant feature of the ecosystem in the
considered area(Figure 2.11). For example,
the dominant features of wetland ecosystem
is represented by excess of moisture,
palustrine vegetation, and flat topography
(Bailey, 2007, Banko, et al., 2013),
considering that the dominant feature is the
presence of excess water.
2.1.3. Mapping wetlands by Principal Components Analysis
A manner to differentiate the ecosystems in a systematic way, is to analyse several
physico-geographical features from which the main features that can delimit an ecosystem
are extracted, based on the correlations between the elements introduced and the change of
the reference points from the correlation relationship between them. This can be done by
multifactorial analysis of Principal Components.
Principal Components Analysis (PCA), is a factorial method of data analysis, by which
the information from a data series is simplified by the means of new data series, obtained by
linear transformation and containing a smaller amount of information but more statistically
relevant, described by variance (Spircu, 2005; Wold, et al., 1987). This method is useful in
the following situations: data complexity reduction, highlighting the data correlation,
observing the secondary data in relation with the main datasuch as the importance of one
parameter relative to another (Pintilescu, 2007), this aspect is the subject of the current
analysis.
PCA method eliminates the subjectivity of classification, as can be seen in the
classification of wetland ecosystems based on thematic layers (Ciobotaru, et al., 2016). This
working technique can be used for multiple research directions, such as the analysis of hydro-
climatic factors (Demšar, et al., 2013; Zaharia & Beltrando, 2009), geomorphological analysis
(Chițu, et al., 2009), landscape analysis (Petrișor, et al., 2012), ecosystem services analysis
(Rabe, et al., 2016; Garcia-Nieto, et al., 2016), satellite data processing and other fields.
In order to use this method in mapping, it is necessary that the data used have two
properties, a spatial distribution and a series of attributes that belong to each location
(Demšar, et al., 2013). The implementation of principal component analysis involves the
Figure 2.11 Map layers that can be used to delimit an
ecosystem (after Bailey G., 2007)
Best practices guide on mapping and assessing wetland ecosystems and their services
23
transformation of the raster and analysis attributes using a GIS module.In case of current
analysis the Spatial Analyst - Multivariate – PCA analysis from ArcGIS tool was used.
The necessary steps in mapping wetland ecosystems consist of (Ciobotaru, et al., 2016):
Selection of representative spatial attributes to be analysed, as are the thematic
layer data;
analysis of the total variance explained by each component with the values of
its own vectors above 1, considered as a significant threshold;
Analysis of the eigenvector on the rotational matrix, to explain the structural
composition of the model;
Graphical representation of the analysis results;
GIS mapping of the main components to highlight their spatial distribution.
Thus, PCA has the advantage of simplifying the data interpretation and identifying the
information that contribute significantly to extract main characteristics in the data set
analysed.This is done by means of correlations between variables and by evaluating the
common variation existing between the elements (Bogdan, 2009; Smith, 2002).
Below are presented examples of applying wetland ecosystem mapping methods
according to the methods described on two different scales: national and local level.
2.2. Wetlands mapping at national level
Romanian wetlands played over time an important role in the economy through the
land use constraints imposed by these (Ciobotaru, et al., 2016). One of the largest human
intervention on wetlands in Romania took place during the XVIIIth and XIXth centuries in
Western Plain (Eastern Panonian Plain), when there were about 850.000 ha of marshes
drained for agricultural use (Romanescu, 2004). The second and the largest intervention at
national level on wetlands took place in the XX century during 30 years’ time span (1960-
1989), when there were drained more than one million hectares of wetlands in the Danube
floodplain and along its major tributary rivers, with the major goal to regulate the river
courses, and to limit the flood risk but also eliminating problems such as malaria (Academy
of the Socialist Republic of Romania, 1969; Ciuca, 1956) or to obtain new agricultural surfaces.
Most of the interventions were along the Danube floodplain, with more than 860.000 ha of
wetlands converted into agricultural areas of high productivity (Iordan, 2005).
Despite the high environmental impact, these works provided more than 1
milionhectares of arable land in Romania, offering protection against flood risks and eliminated
one of most backward problem, the presence of malaria (Ciobotaru, et al., 2016).
Regarding the statute of wetlands, Romania is part of the Ramsar Convention since
1991 (Law no. 5/1991), aspect which led to the emergence of some new protected areas such
as the Danube Delta Biosphere Reservation, Small Island of Brăila Natural Park and other
RAMSAR sites. In the last 30 years, the research topics regarding the wetlands followed the
international trends, by research papers that refer to:
wetlands restoration necessity (Pringle et al., 1995);
Best practices guide on mapping and assessing wetland ecosystems and their services
24
environmental impact of the wetland loss (Muica & Zavoianu, 1996; Vadineanu, et
al., 2003)
the analysis of the extent and of the types of wetland habitats at national scale
(Török, 1999 Torok, 2000 Gâştescu & Ciupitu, 2016 Matei et al., 2016; Ciobotaru,
et al., 2016)
local studies referring to the wetland functionality (Romanescu, et al., 2011;
Vartolomei, 2012; Matei, et al., 2017; Matei, et al., 2016).
Despite the debates regarding the renaturation of some polders along Danube
floodplain, the impact of the wetland rehabilitation can often be negative, as is shown during
debates that took place on the symposium "Danube Polders - prospects and current problems"
in 2014, supported by the Agriculture R & D Station from Braila (Bularda & Vişinescu 2014).
In this study, the mapping of wetland ecosystems involved the use of high-resolution
database Wetlands, which includes the areas covered by water with a depth of less than 0.5
m, and with a minimum mapping unit of 400 m² area. This database is provided by
Copernicus-Land Platforms (EEA, 2011-2013) and is a product obtained from high-resolution
satellite data processing, over several years, by observing the dynamics of land cover of
wetlands. The surface detected as being covered with wetlands is of 386.000 ha and summing
1.6% of the country surface, representing only 50% of the surface reported by INHGA, that
included the lakes, rivers, and swamps as being wetlands, in total of 843700 ha, 3.5% of the
national territory (ANAR, 2013). Most of the wetlands areas are located along the Danube
floodplain and in the Danube Delta while the rest of these wetlands are found mainly around
the other rivers and lakes across the country.
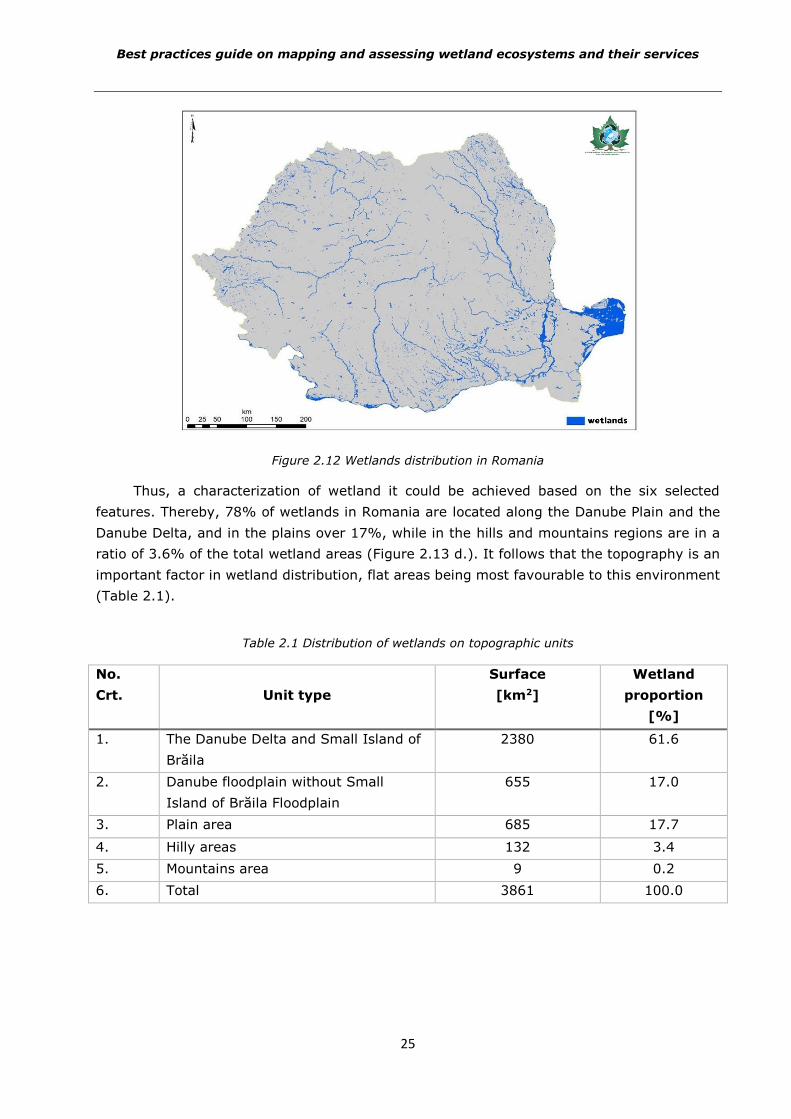
Using a pre-defined product, such as Wetlands database, make irrelevant the
methodology for mapping the wetlands at national scale by satellite imagery, the delineation
described above being sufficient to identify the main wetlands in Romania, as can be seen in
the figure bellow (Figure 2.12). Wetlands mapping based on thematic layers involved selection
of few defining features of wetlands (Figure 2.13) for the area delineated by Wetlands
database including:
average annual precipitation, data source WorldClim (Hijmans et al., 2005);
average annual temperature, data source WorldClim (Hijmans et al., 2005);
De Martonne Aridity index, (de Martonne, 1926), calculated based on precipitation
and temperature data;
topography at national level, obtained from the land numerical model EU-DEM (EEA,
2013);
soil texture, derived from soil map at 1:200.000 developed by ICPA (HICP 2003);
land use type according to the CLC 2012 database (EEA, 2007).
Best practices guide on mapping and assessing wetland ecosystems and their services
25
Figure 2.12 Wetlands distribution in Romania
Thus, a characterization of wetland it could be achieved based on the six selected
features. Thereby, 78% of wetlands in Romania are located along the Danube Plain and the
Danube Delta, and in the plains over 17%, while in the hills and mountains regions are in a
ratio of 3.6% of the total wetland areas (Figure 2.13 d.). It follows that the topography is an
important factor in wetland distribution, flat areas being most favourable to this environment
(Table 2.1).
Table 2.1 Distribution of wetlands on topographic units
No.
Crt. Unit type
Surface
[km2]
Wetland
proportion
[%]
1. The Danube Delta and Small Island of
Brăila
2380 61.6
2. Danube floodplain without Small
Island of Brăila Floodplain
655 17.0
3. Plain area 685 17.7
4. Hilly areas 132 3.4
5. Mountains area 9 0.2
6. Total 3861 100.0
26
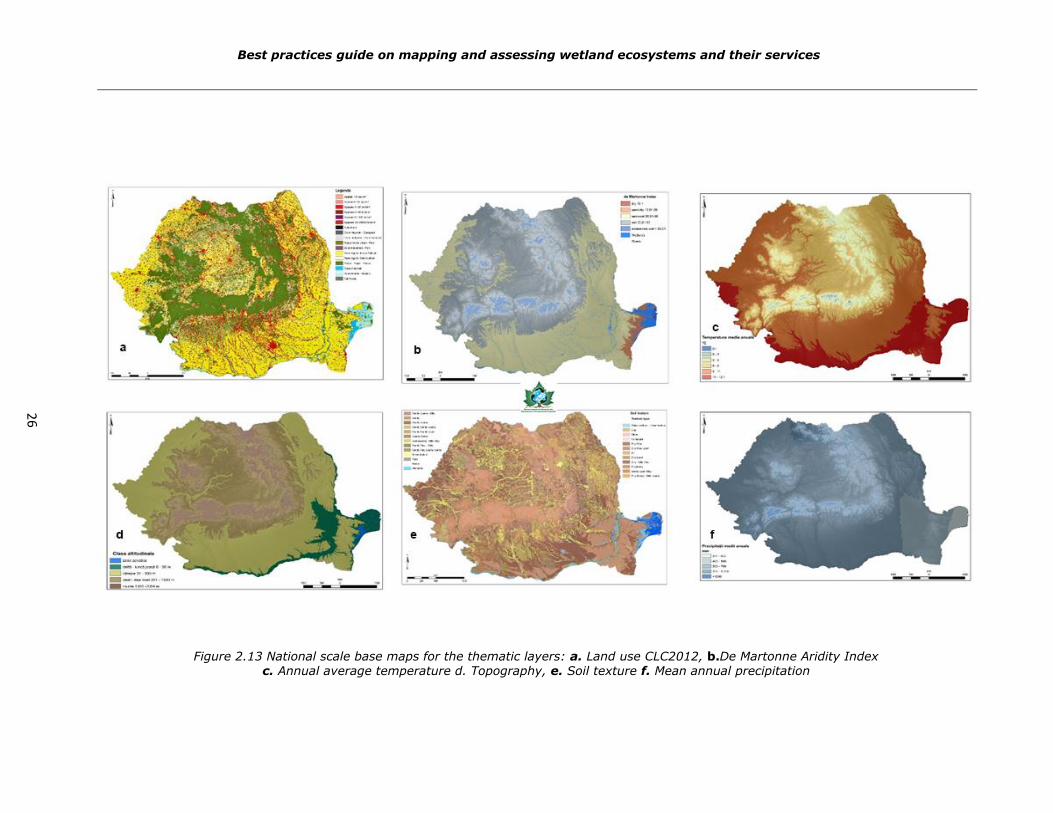
Figure 2.13 National scale base maps for the thematic layers: a. Land use CLC2012, b.De Martonne Aridity Index c. Annual average temperature d. Topography, e. Soil texture f. Mean annual precipitation
Best practices guide on mapping and assessing wetland ecosystems and their services
Best practices guide on mapping and assessing wetland ecosystems and their services
27
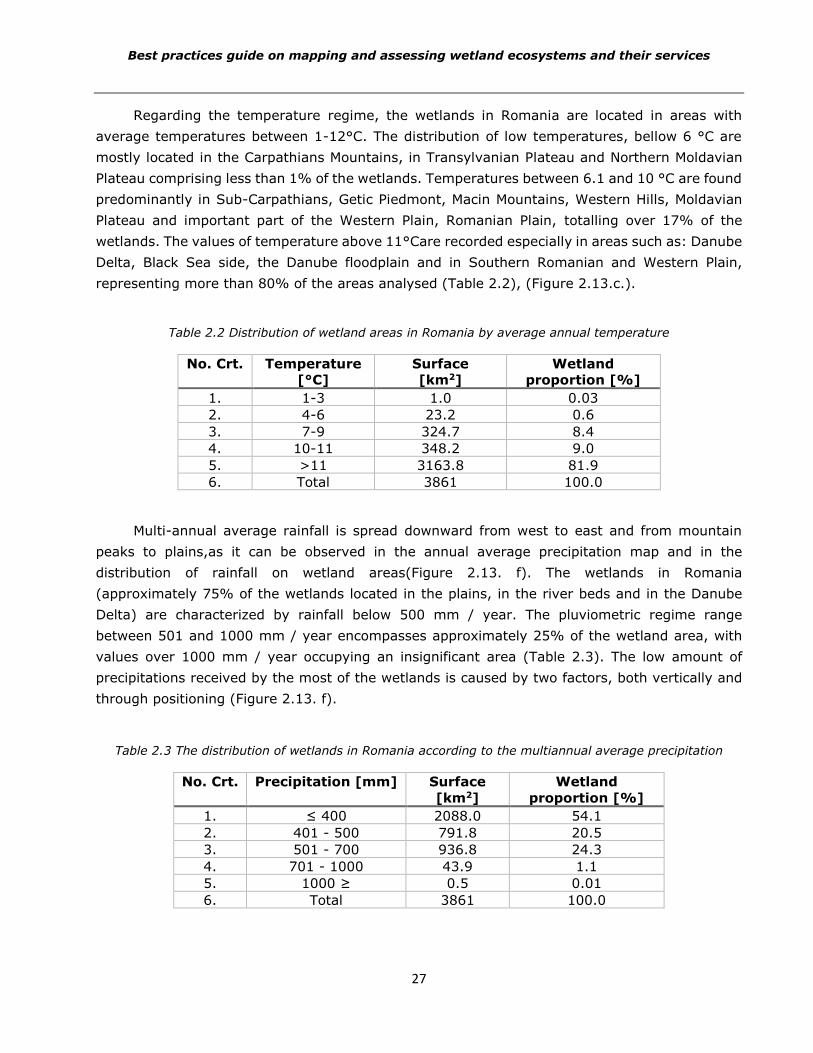
Regarding the temperature regime, the wetlands in Romania are located in areas with
average temperatures between 1-12°C. The distribution of low temperatures, bellow 6 °C are
mostly located in the Carpathians Mountains, in Transylvanian Plateau and Northern Moldavian
Plateau comprising less than 1% of the wetlands. Temperatures between 6.1 and 10 °C are found
predominantly in Sub-Carpathians, Getic Piedmont, Macin Mountains, Western Hills, Moldavian
Plateau and important part of the Western Plain, Romanian Plain, totalling over 17% of the
wetlands. The values of temperature above 11°Care recorded especially in areas such as: Danube
Delta, Black Sea side, the Danube floodplain and in Southern Romanian and Western Plain,
representing more than 80% of the areas analysed (Table 2.2), (Figure 2.13.c.).
Table 2.2 Distribution of wetland areas in Romania by average annual temperature
No. Crt. Temperature
[°C]
Surface
[km2]
Wetland
proportion [%]
1. 1-3 1.0 0.03
2. 4-6 23.2 0.6
3. 7-9 324.7 8.4
4. 10-11 348.2 9.0
5. >11 3163.8 81.9
6. Total 3861 100.0
Multi-annual average rainfall is spread downward from west to east and from mountain
peaks to plains,as it can be observed in the annual average precipitation map and in the
distribution of rainfall on wetland areas(Figure 2.13. f). The wetlands in Romania
(approximately 75% of the wetlands located in the plains, in the river beds and in the Danube
Delta) are characterized by rainfall below 500 mm / year. The pluviometric regime range
between 501 and 1000 mm / year encompasses approximately 25% of the wetland area, with
values over 1000 mm / year occupying an insignificant area (Table 2.3). The low amount of
precipitations received by the most of the wetlands is caused by two factors, both vertically and
through positioning (Figure 2.13. f).
Table 2.3 The distribution of wetlands in Romania according to the multiannual average precipitation
No. Crt. Precipitation [mm] Surface
[km2]
Wetland
proportion [%]
1. ≤ 400 2088.0 54.1
2. 401 - 500 791.8 20.5
3. 501 - 700 936.8 24.3
4. 701 - 1000 43.9 1.1
5. 1000 ≥ 0.5 0.01
6. Total 3861 100.0
Best practices guide on mapping and assessing wetland ecosystems and their services
28
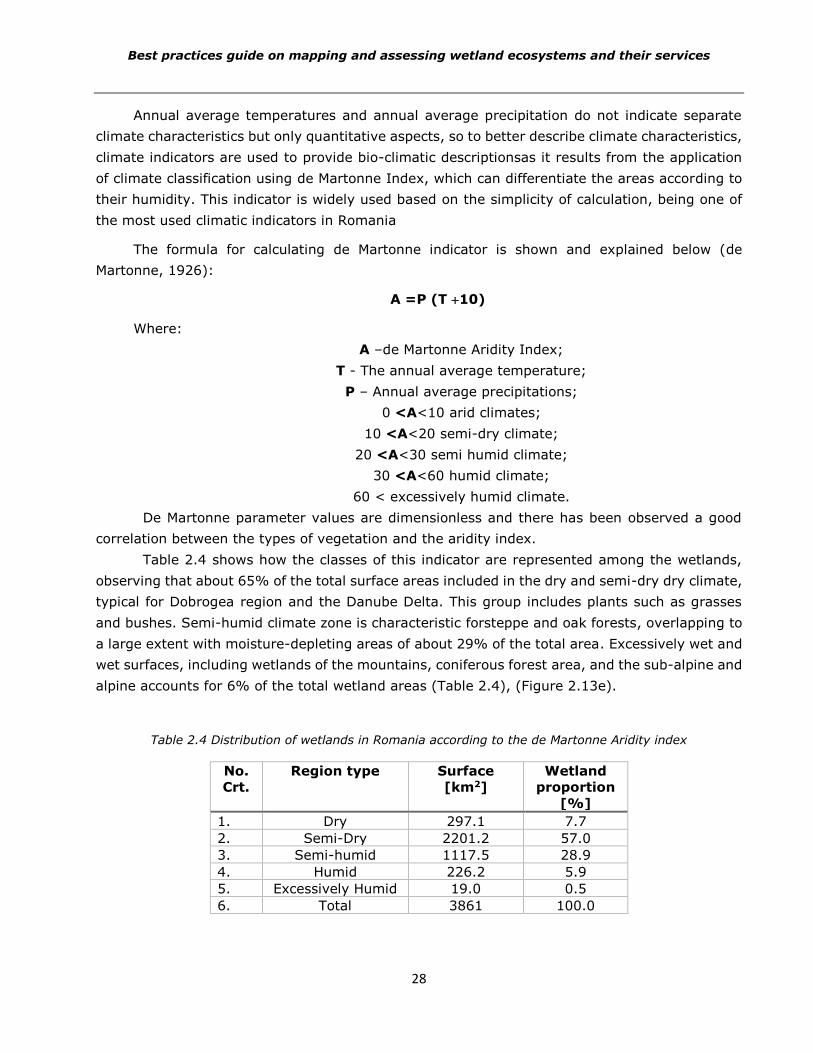
Annual average temperatures and annual average precipitation do not indicate separate
climate characteristics but only quantitative aspects, so to better describe climate characteristics,
climate indicators are used to provide bio-climatic descriptionsas it results from the application
of climate classification using de Martonne Index, which can differentiate the areas according to
their humidity. This indicator is widely used based on the simplicity of calculation, being one of
the most used climatic indicators in Romania
The formula for calculating de Martonne indicator is shown and explained below (de
Martonne, 1926):
A =P (T 10)
Where:
A –de Martonne Aridity Index;
T - The annual average temperature;
P – Annual average precipitations;
0 <A<10 arid climates;
10 <A<20 semi-dry climate;
20 <A<30 semi humid climate;
30 <A<60 humid climate;
60 < excessively humid climate.
De Martonne parameter values are dimensionless and there has been observed a good
correlation between the types of vegetation and the aridity index.
Table 2.4 shows how the classes of this indicator are represented among the wetlands,
observing that about 65% of the total surface areas included in the dry and semi-dry dry climate,
typical for Dobrogea region and the Danube Delta. This group includes plants such as grasses
and bushes. Semi-humid climate zone is characteristic forsteppe and oak forests, overlapping to
a large extent with moisture-depleting areas of about 29% of the total area. Excessively wet and
wet surfaces, including wetlands of the mountains, coniferous forest area, and the sub-alpine and
alpine accounts for 6% of the total wetland areas (Table 2.4), (Figure 2.13e).
Table 2.4 Distribution of wetlands in Romania according to the de Martonne Aridity index
No.
Crt.
Region type Surface
[km2]
Wetland
proportion
[%]
1. Dry 297.1 7.7
2. Semi-Dry 2201.2 57.0
3. Semi-humid 1117.5 28.9
4. Humid 226.2 5.9
5. Excessively Humid 19.0 0.5
6. Total 3861 100.0
Best practices guide on mapping and assessing wetland ecosystems and their services
29
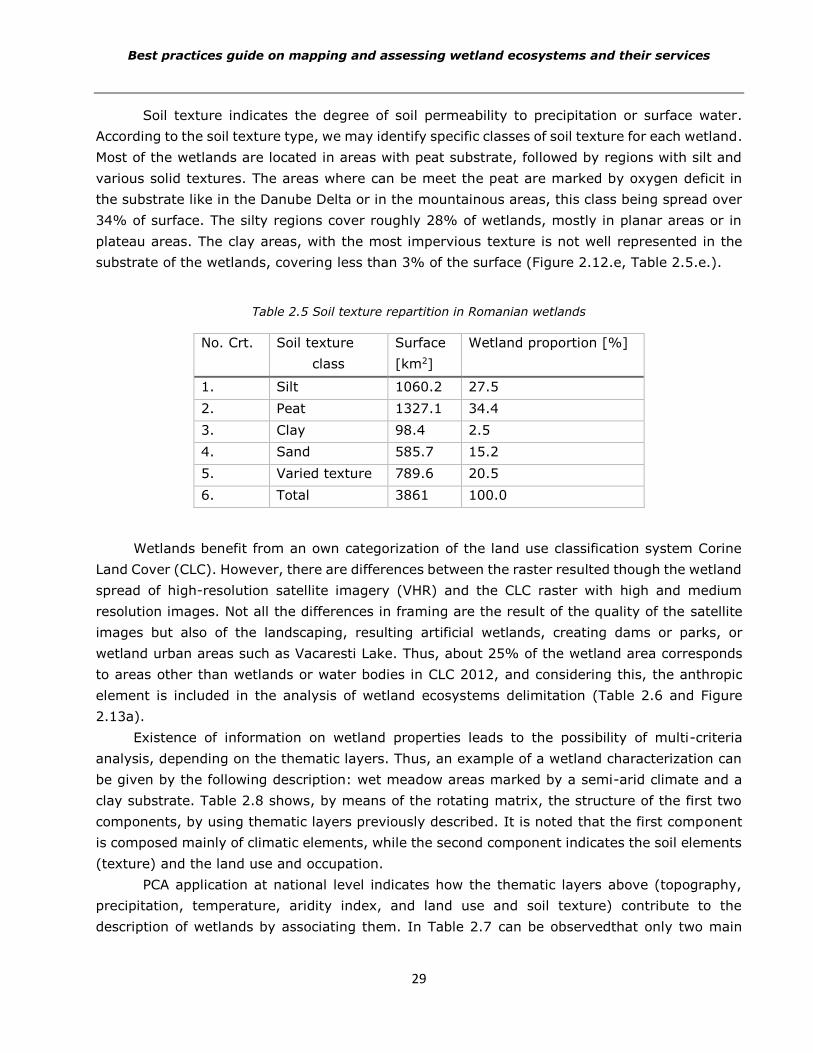
Soil texture indicates the degree of soil permeability to precipitation or surface water.
According to the soil texture type, we may identify specific classes of soil texture for each wetland.
Most of the wetlands are located in areas with peat substrate, followed by regions with silt and
various solid textures. The areas where can be meet the peat are marked by oxygen deficit in
the substrate like in the Danube Delta or in the mountainous areas, this class being spread over
34% of surface. The silty regions cover roughly 28% of wetlands, mostly in planar areas or in
plateau areas. The clay areas, with the most impervious texture is not well represented in the
substrate of the wetlands, covering less than 3% of the surface (Figure 2.12.e, Table 2.5.e.).
Table 2.5 Soil texture repartition in Romanian wetlands
No. Crt. Soil texture
class
Surface
[km2]
Wetland proportion [%]
1. Silt 1060.2 27.5
2. Peat 1327.1 34.4
3. Clay 98.4 2.5
4. Sand 585.7 15.2
5. Varied texture 789.6 20.5
6. Total 3861 100.0
Wetlands benefit from an own categorization of the land use classification system Corine
Land Cover (CLC). However, there are differences between the raster resulted though the wetland
spread of high-resolution satellite imagery (VHR) and the CLC raster with high and medium
resolution images. Not all the differences in framing are the result of the quality of the satellite
images but also of the landscaping, resulting artificial wetlands, creating dams or parks, or
wetland urban areas such as Vacaresti Lake. Thus, about 25% of the wetland area corresponds
to areas other than wetlands or water bodies in CLC 2012, and considering this, the anthropic
element is included in the analysis of wetland ecosystems delimitation (Table 2.6 and Figure
2.13a).
Existence of information on wetland properties leads to the possibility of multi-criteria
analysis, depending on the thematic layers. Thus, an example of a wetland characterization can
be given by the following description: wet meadow areas marked by a semi-arid climate and a
clay substrate. Table 2.8 shows, by means of the rotating matrix, the structure of the first two
components, by using thematic layers previously described. It is noted that the first component
is composed mainly of climatic elements, while the second component indicates the soil elements
(texture) and the land use and occupation.
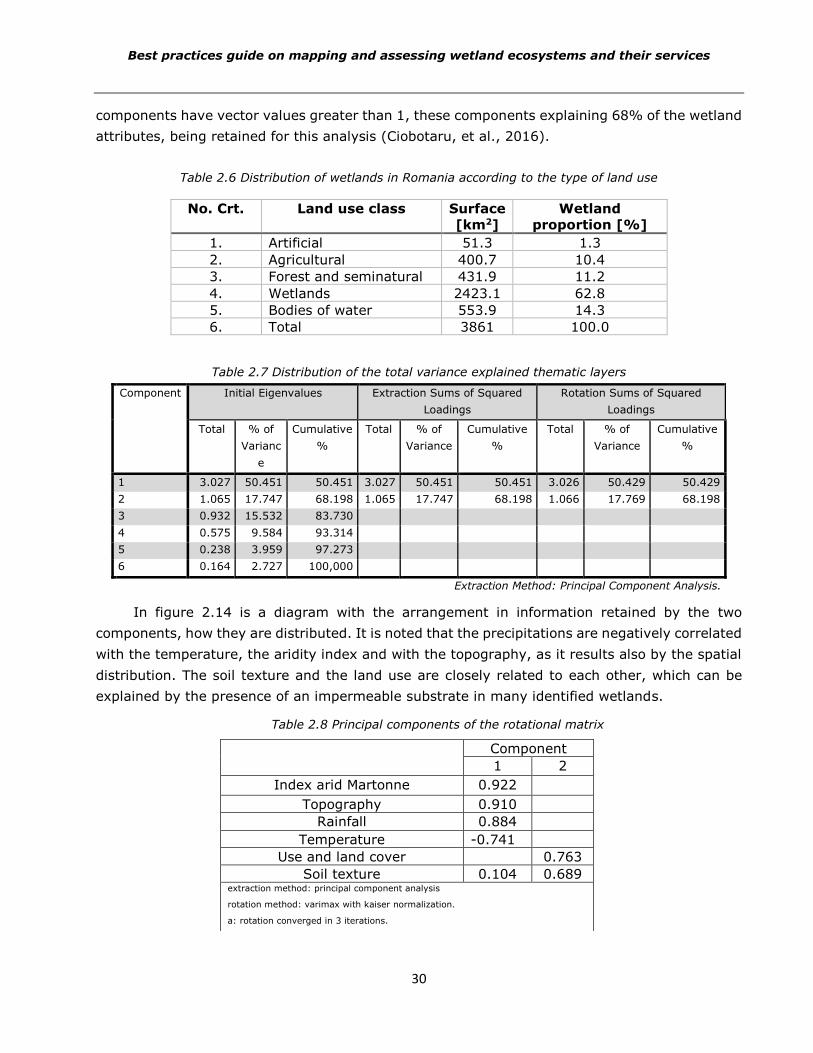
PCA application at national level indicates how the thematic layers above (topography,
precipitation, temperature, aridity index, and land use and soil texture) contribute to the
description of wetlands by associating them. In Table 2.7 can be observedthat only two main
Best practices guide on mapping and assessing wetland ecosystems and their services
30
components have vector values greater than 1, these components explaining 68% of the wetland
attributes, being retained for this analysis (Ciobotaru, et al., 2016).
Table 2.6 Distribution of wetlands in Romania according to the type of land use
No. Crt. Land use class Surface
[km2]
Wetland
proportion [%]
1. Artificial 51.3 1.3
2. Agricultural 400.7 10.4
3. Forest and seminatural 431.9 11.2
4. Wetlands 2423.1 62.8
5. Bodies of water 553.9 14.3
6. Total 3861 100.0
Table 2.7 Distribution of the total variance explained thematic layers
Component Initial Eigenvalues Extraction Sums of Squared
Loadings
Rotation Sums of Squared
Loadings
Total % of
Varianc
e
Cumulative
%
Total % of
Variance
Cumulative
%
Total % of
Variance
Cumulative
%
1 3.027 50.451 50.451 3.027 50.451 50.451 3.026 50.429 50.429
2 1.065 17.747 68.198 1.065 17.747 68.198 1.066 17.769 68.198
3 0.932 15.532 83.730
4 0.575 9.584 93.314
5 0.238 3.959 97.273
6 0.164 2.727 100,000
Extraction Method: Principal Component Analysis.
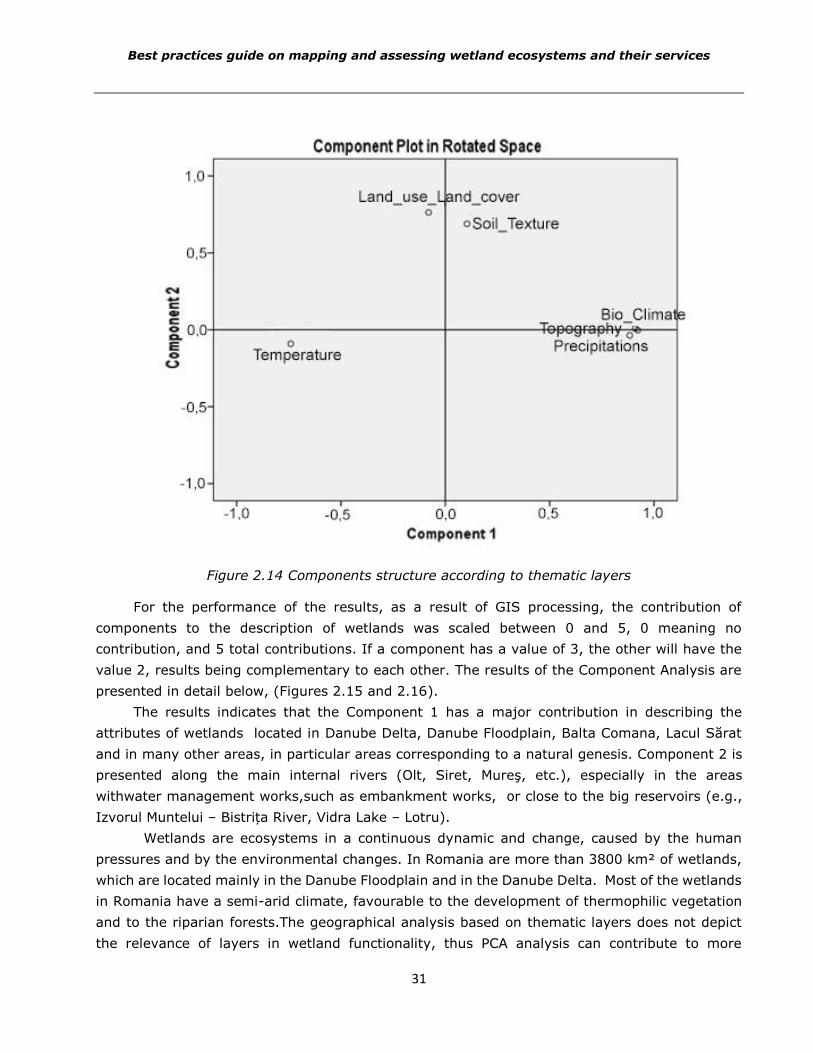
In figure 2.14 is a diagram with the arrangement in information retained by the two
components, how they are distributed. It is noted that the precipitations are negatively correlated
with the temperature, the aridity index and with the topography, as it results also by the spatial
distribution. The soil texture and the land use are closely related to each other, which can be
explained by the presence of an impermeable substrate in many identified wetlands.
Table 2.8 Principal components of the rotational matrix
Component
1 2
Index arid Martonne 0.922
Topography 0.910
Rainfall 0.884
Temperature -0.741
Use and land cover 0.763
Soil texture 0.104 0.689 extraction method: principal component analysis
rotation method: varimax with kaiser normalization.
a: rotation converged in 3 iterations.
Best practices guide on mapping and assessing wetland ecosystems and their services
31
Figure 2.14 Components structure according to thematic layers
For the performance of the results, as a result of GIS processing, the contribution of
components to the description of wetlands was scaled between 0 and 5, 0 meaning no
contribution, and 5 total contributions. If a component has a value of 3, the other will have the
value 2, results being complementary to each other. The results of the Component Analysis are
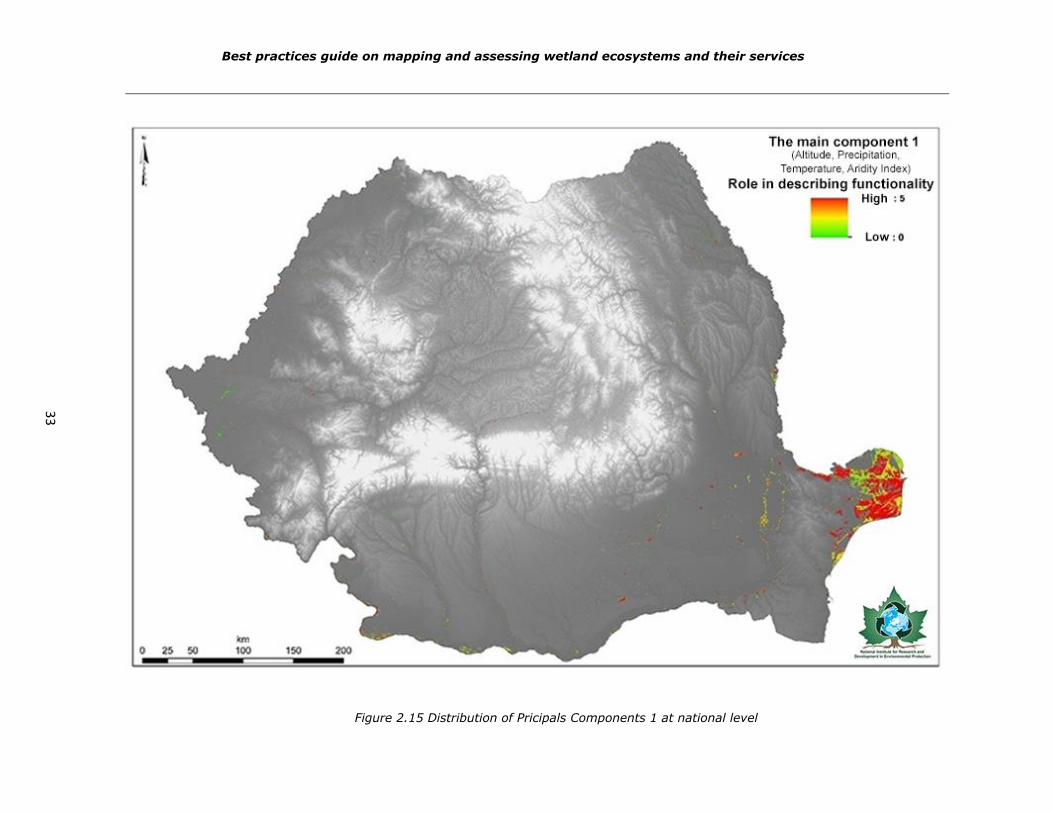
presented in detail below, (Figures 2.15 and 2.16).
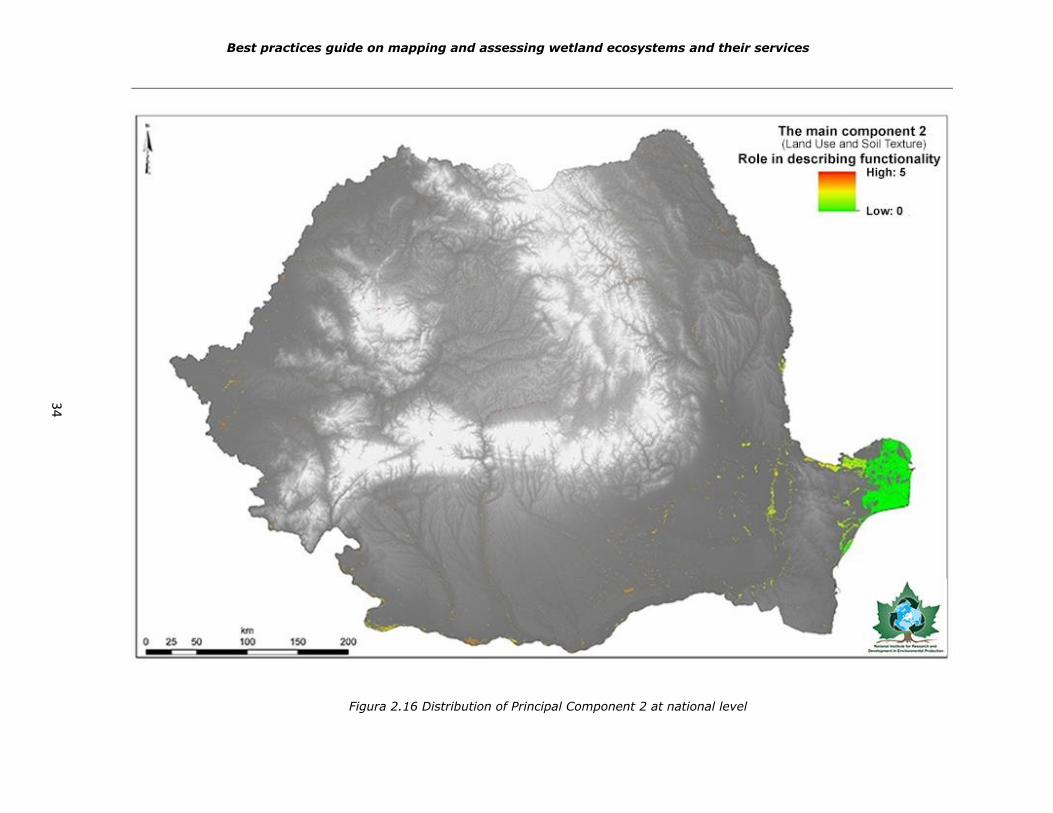
The results indicates that the Component 1 has a major contribution in describing the
attributes of wetlands located in Danube Delta, Danube Floodplain, Balta Comana, Lacul Sărat
and in many other areas, in particular areas corresponding to a natural genesis. Component 2 is
presented along the main internal rivers (Olt, Siret, Mureş, etc.), especially in the areas
withwater management works,such as embankment works, or close to the big reservoirs (e.g.,
Izvorul Muntelui – Bistrița River, Vidra Lake – Lotru).
Wetlands are ecosystems in a continuous dynamic and change, caused by the human
pressures and by the environmental changes. In Romania are more than 3800 km² of wetlands,
which are located mainly in the Danube Floodplain and in the Danube Delta. Most of the wetlands
in Romania have a semi-arid climate, favourable to the development of thermophilic vegetation
and to the riparian forests.The geographical analysis based on thematic layers does not depict
the relevance of layers in wetland functionality, thus PCA analysis can contribute to more
Best practices guide on mapping and assessing wetland ecosystems and their services
32
objective analysis regarding the functionality of the wetlands and thereby eliminating the
subjectivity of classification based on expert decision. After applying principal component analysis
it was possible to identify two major types of wetlands, natural wetlands and artificial wetlands,
the latter having the lowest distribution. This method can provide support in monitoring changes
occurring in wetland distribution at national scale.
33
Figure 2.15 Distribution of Pricipals Components 1 at national level
Best practices guide on mapping and assessing wetland ecosystems and their services
34
Figura 2.16 Distribution of Principal Component 2 at national level
Best practices guide on mapping and assessing wetland ecosystems and their services
Best practices guide on mapping and assessing wetland ecosystems and their services
35
2.3. Mapping wetlands at local level. Case study Divici – Pojejena wetland
For local level mapping were used the satellite imagery analysis, this being a less
relevant method at national level.The methods explained above, being multiscalar, provide
the same results at local level.
The satellite imagery database is a very useful tool in mapping the landscape, the
habitats and the geographical features in general. For this activity, in the present study it
was used a Landsat OLI image (VIII), acquired in 07.07.2015. This satellite scene, with a
resolution of 30 m, is taken in full growing season and captures the Divici-Pojejena wetland
habitats distribution.
The working methods consisted in the radiometric correction of the satellite image
(radiometric calibration), the correction of atmospheric deformations (FLAASH correction),
resolution enhancement with the multispectral bands (Image Sharpening) and the
combinations of multispectral bands in order to identify the geographical features of the
area studied.
The mapping process of the Divici - Pojejena wetland was done using supervised
classification (Mahalanobis), for which were used eleven classes of land cover classification
being performed on a false-colour image (432) improved at the resolution of 15 m with
infrared image (B8).
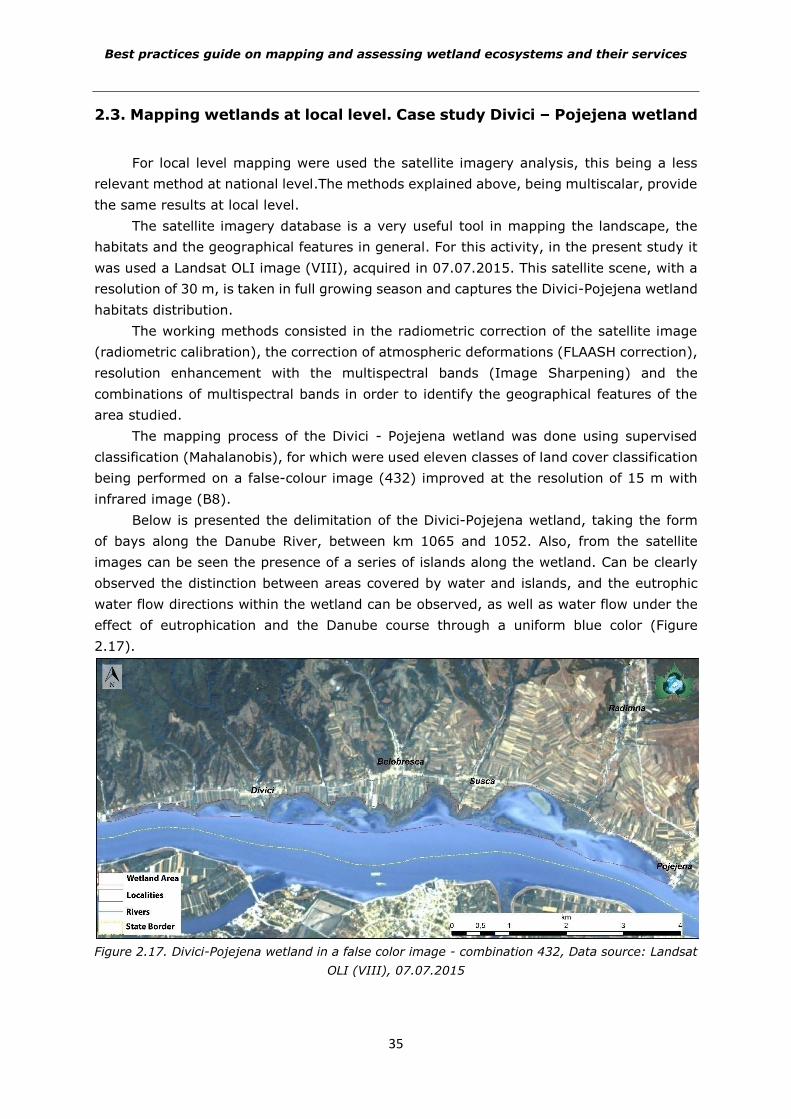
Below is presented the delimitation of the Divici-Pojejena wetland, taking the form
of bays along the Danube River, between km 1065 and 1052. Also, from the satellite
images can be seen the presence of a series of islands along the wetland. Can be clearly
observed the distinction between areas covered by water and islands, and the eutrophic
water flow directions within the wetland can be observed, as well as water flow under the
effect of eutrophication and the Danube course through a uniform blue color (Figure
2.17).
Figure 2.17. Divici-Pojejena wetland in a false color image - combination 432, Data source: Landsat
OLI (VIII), 07.07.2015
Best practices guide on mapping and assessing wetland ecosystems and their services
36
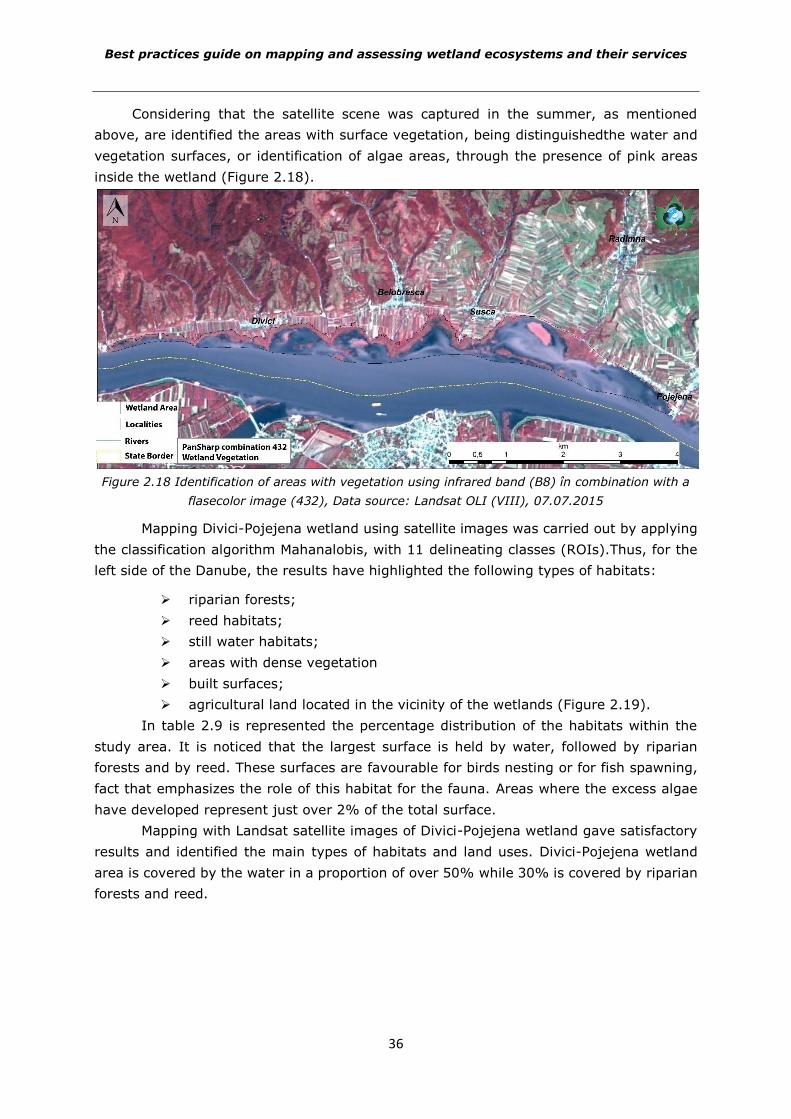
Considering that the satellite scene was captured in the summer, as mentioned
above, are identified the areas with surface vegetation, being distinguishedthe water and
vegetation surfaces, or identification of algae areas, through the presence of pink areas
inside the wetland (Figure 2.18).
Figure 2.18 Identification of areas with vegetation using infrared band (B8) în combination with a
flasecolor image (432), Data source: Landsat OLI (VIII), 07.07.2015
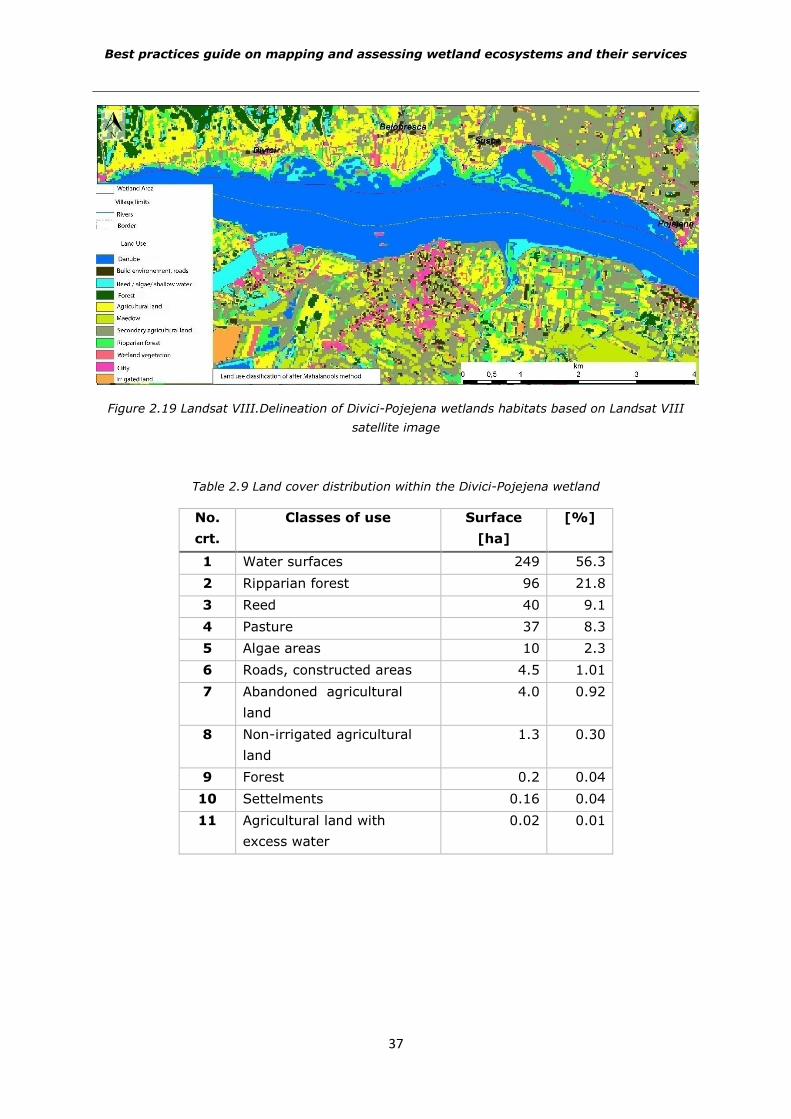
Mapping Divici-Pojejena wetland using satellite images was carried out by applying
the classification algorithm Mahanalobis, with 11 delineating classes (ROIs).Thus, for the
left side of the Danube, the results have highlighted the following types of habitats:
riparian forests;
reed habitats;
still water habitats;
areas with dense vegetation
built surfaces;
agricultural land located in the vicinity of the wetlands (Figure 2.19).
In table 2.9 is represented the percentage distribution of the habitats within the
study area. It is noticed that the largest surface is held by water, followed by riparian
forests and by reed. These surfaces are favourable for birds nesting or for fish spawning,
fact that emphasizes the role of this habitat for the fauna. Areas where the excess algae
have developed represent just over 2% of the total surface.
Mapping with Landsat satellite images of Divici-Pojejena wetland gave satisfactory
results and identified the main types of habitats and land uses. Divici-Pojejena wetland
area is covered by the water in a proportion of over 50% while 30% is covered by riparian
forests and reed.
Best practices guide on mapping and assessing wetland ecosystems and their services
37
Figure 2.19 Landsat VIII.Delineation of Divici-Pojejena wetlands habitats based on Landsat VIII
satellite image
Table 2.9 Land cover distribution within the Divici-Pojejena wetland
No.
crt.
Classes of use Surface
[ha]
[%]
1 Water surfaces 249 56.3
2 Ripparian forest 96 21.8
3 Reed 40 9.1
4 Pasture 37 8.3
5 Algae areas 10 2.3
6 Roads, constructed areas 4.5 1.01
7 Abandoned agricultural
land
4.0 0.92
8 Non-irrigated agricultural
land
1.3 0.30
9 Forest 0.2 0.04
10 Settelments 0.16 0.04
11 Agricultural land with
excess water
0.02 0.01
Best practices guide on mapping and assessing wetland ecosystems and their services
38
CHAPTER 3. EVALUATION OF ECOSYSTEM STATE. CASE STUDY
DIVICI-POJEJENA WETLAND
According to the methodology developed by the MAES Working Group, there
are two complementary approaches to determining the ecosystems condition:
indirect evaluation based on the evaluation and mapping of ecosystem
pressures;
direct assessment of habitat condition, biodiversity and environmental quality
(EEA, 2015b).
Based on the schematics of the DPSIR framework, links can be established
between pressures on ecosystems, their status and impact on ecosystem services. These
links can be analysed on the basis of the indicators proposed by MAES Working Group
(Maes et al., 2014), but also by using specific instruments, a number of 17 such
instruments (InVest, Globio, ARIES, ESTIMap, LUCI etc.), being evaluated comparatively
by Bastad et al., 2013 and Grizzetti et al., 2015.
By analysing and adapting the indicators proposed by the MAES Working Group
(Maes et al., 2014), complete with indicators and information from other bibliographic
sources (Grizzetti et al., 2015), the possibility of assessing them based on the availability
of information at the level of wetland ecosystems was considered, taking into account the
particularities in Romania (data reporting, deficiencies in the reporting system and
possibilities for completing them).
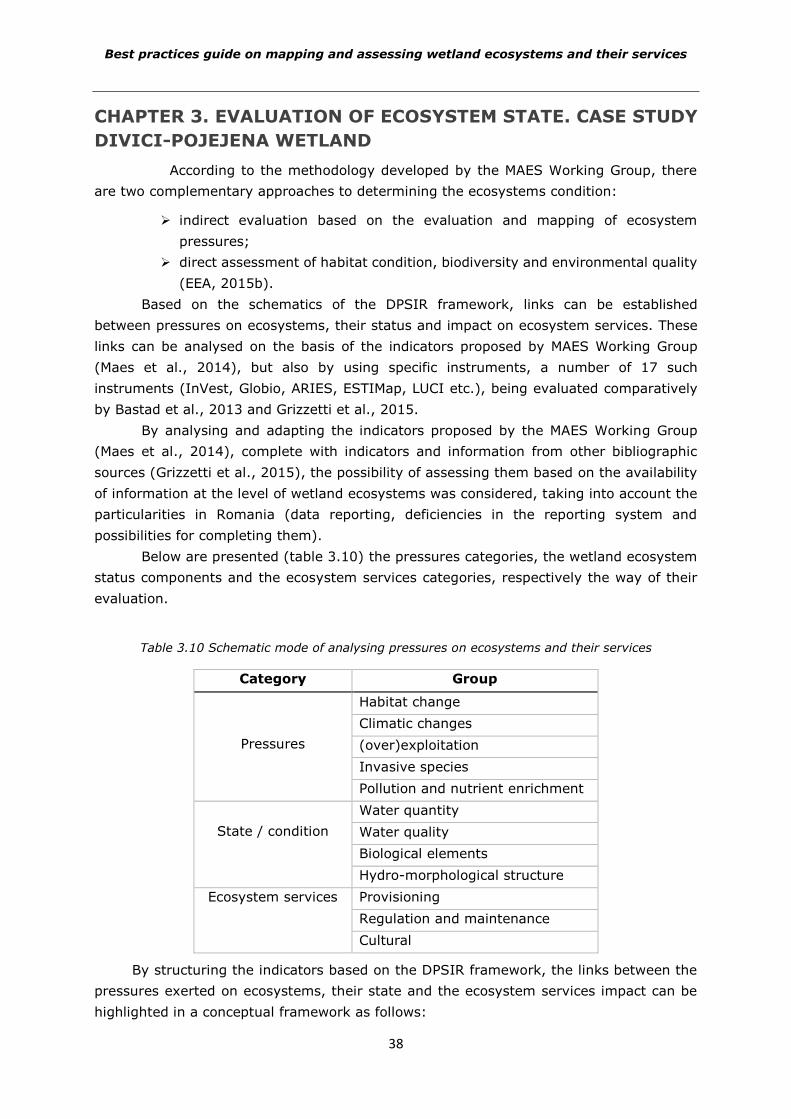
Below are presented (table 3.10) the pressures categories, the wetland ecosystem
status components and the ecosystem services categories, respectively the way of their
evaluation.
Table 3.10 Schematic mode of analysing pressures on ecosystems and their services
Category Group
Pressures
Habitat change
Climatic changes
(over)exploitation
Invasive species
Pollution and nutrient enrichment
State / condition
Water quantity
Water quality
Biological elements
Hydro-morphological structure
Ecosystem services Provisioning
Regulation and maintenance
Cultural
By structuring the indicators based on the DPSIR framework, the links between the
pressures exerted on ecosystems, their state and the ecosystem services impact can be
highlighted in a conceptual framework as follows:
Best practices guide on mapping and assessing wetland ecosystems and their services
39
1. Exercise of pressures
2. Changes in ecosystem status / condition
3. Changes in ecosystem services
4. Changing the value offered by ecosystem services.
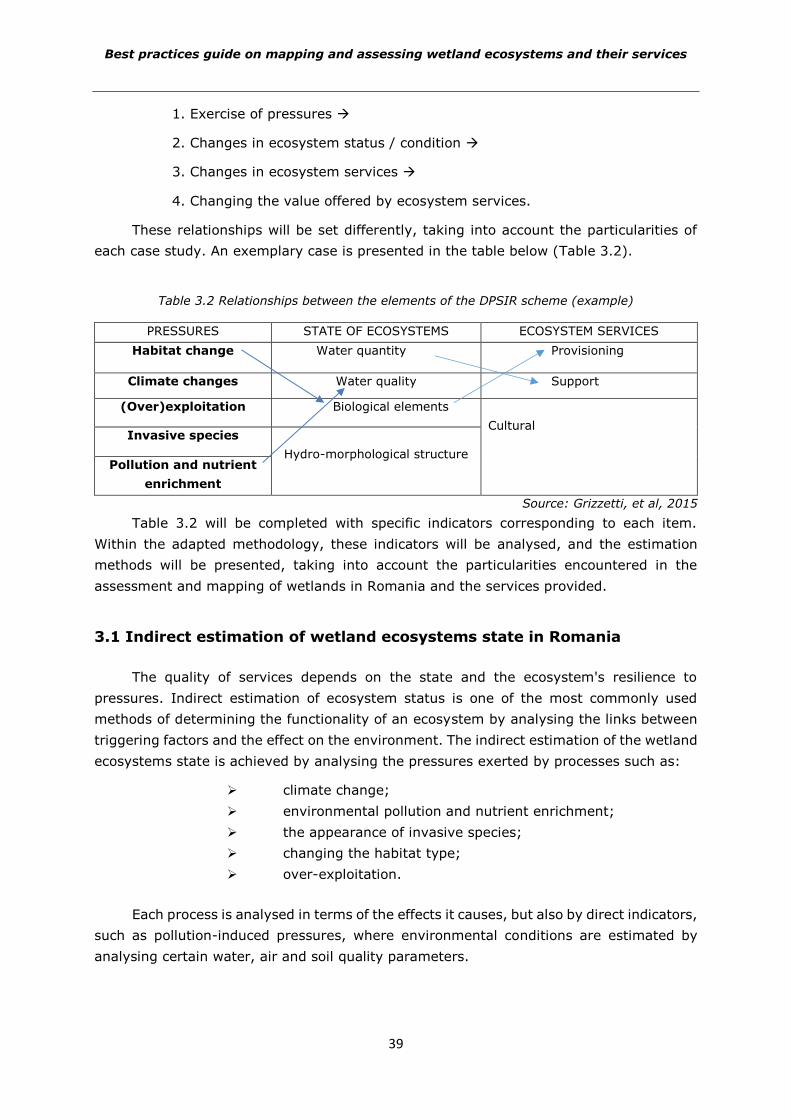
These relationships will be set differently, taking into account the particularities of
each case study. An exemplary case is presented in the table below (Table 3.2).
Table 3.2 Relationships between the elements of the DPSIR scheme (example)
PRESSURES STATE OF ECOSYSTEMS ECOSYSTEM SERVICES
Habitat change Water quantity Provisioning
Climate changes Water quality Support
(Over)exploitation Biological elements
Cultural Invasive species
Hydro-morphological structure Pollution and nutrient
enrichment
Source: Grizzetti, et al, 2015
Table 3.2 will be completed with specific indicators corresponding to each item.
Within the adapted methodology, these indicators will be analysed, and the estimation
methods will be presented, taking into account the particularities encountered in the
assessment and mapping of wetlands in Romania and the services provided.
3.1 Indirect estimation of wetland ecosystems state in Romania
The quality of services depends on the state and the ecosystem's resilience to
pressures. Indirect estimation of ecosystem status is one of the most commonly used
methods of determining the functionality of an ecosystem by analysing the links between
triggering factors and the effect on the environment. The indirect estimation of the wetland
ecosystems state is achieved by analysing the pressures exerted by processes such as:
climate change;
environmental pollution and nutrient enrichment;
the appearance of invasive species;
changing the habitat type;
over-exploitation.
Each process is analysed in terms of the effects it causes, but also by direct indicators,
such as pollution-induced pressures, where environmental conditions are estimated by
analysing certain water, air and soil quality parameters.
Best practices guide on mapping and assessing wetland ecosystems and their services
40
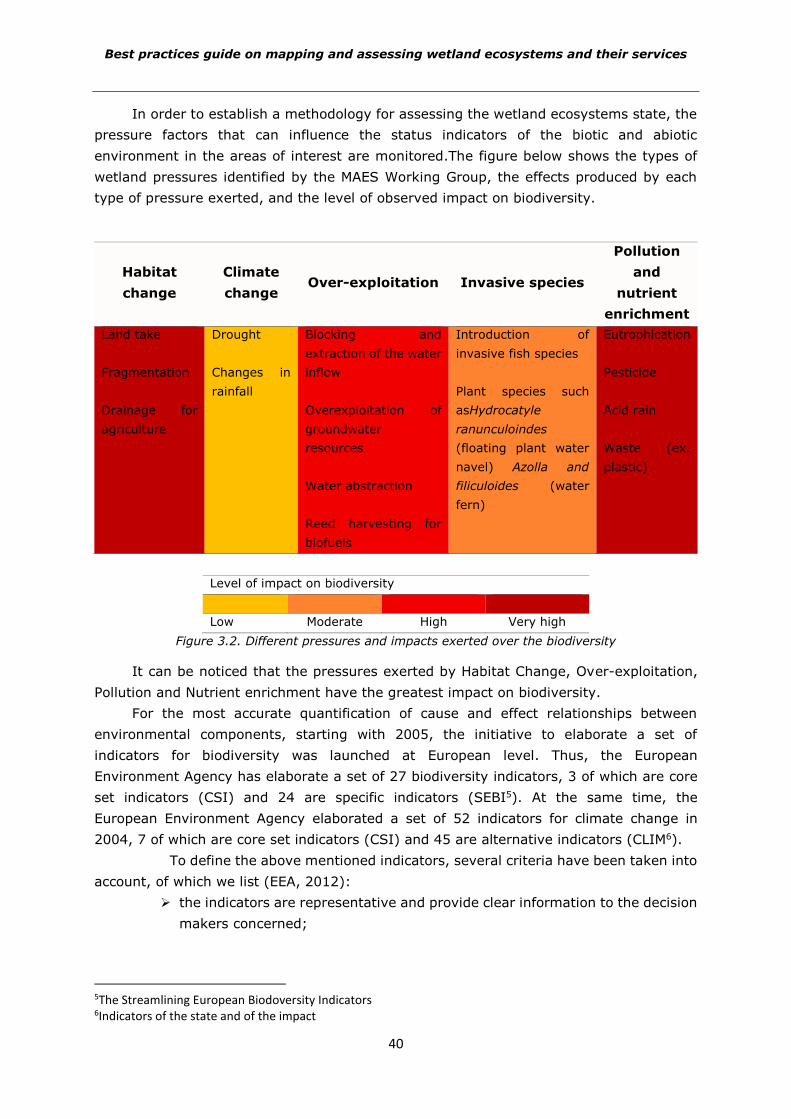
In order to establish a methodology for assessing the wetland ecosystems state, the
pressure factors that can influence the status indicators of the biotic and abiotic
environment in the areas of interest are monitored.The figure below shows the types of
wetland pressures identified by the MAES Working Group, the effects produced by each
type of pressure exerted, and the level of observed impact on biodiversity.
Habitat
change
Climate
change Over-exploitation Invasive species
Pollution
and
nutrient
enrichment
Land take
Fragmentation
Drainage for
agriculture
Drought
Changes in
rainfall
Blocking and
extraction of the water
inflow
Overexploitation of
groundwater
resources
Water abstraction
Reed harvesting for
biofuels
Introduction of
invasive fish species
Plant species such
asHydrocatyle
ranunculoindes
(floating plant water
navel) Azolla and
filiculoides (water
fern)
Eutrophication
Pesticide
Acid rain
Waste (ex.
plastic)
Level of impact on biodiversity
Low Moderate High Very high
Figure 3.2. Different pressures and impacts exerted over the biodiversity
It can be noticed that the pressures exerted by Habitat Change, Over-exploitation,
Pollution and Nutrient enrichment have the greatest impact on biodiversity.
For the most accurate quantification of cause and effect relationships between
environmental components, starting with 2005, the initiative to elaborate a set of
indicators for biodiversity was launched at European level. Thus, the European
Environment Agency has elaborate a set of 27 biodiversity indicators, 3 of which are core
set indicators (CSI) and 24 are specific indicators (SEBI5). At the same time, the
European Environment Agency elaborated a set of 52 indicators for climate change in
2004, 7 of which are core set indicators (CSI) and 45 are alternative indicators (CLIM6).
To define the above mentioned indicators, several criteria have been taken into
account, of which we list (EEA, 2012):
the indicators are representative and provide clear information to the decision
makers concerned;
5The Streamlining European Biodoversity Indicators 6Indicators of the state and of the impact
Best practices guide on mapping and assessing wetland ecosystems and their services
41
indicators to provide clear biodiversity information and key issues such as
pressures, status, impact and response;
the indicators clearly show the progress made towards achieving the targets
settled;
indicators to be based on clear, well-defined and simple methodology;
Indicators to be based on scientific data and to contain information on the
cause-effect relationship in order to be quantified;
the indicators should be of acceptable spatial resolution and cover a relevant
time period for the registered trends analysis;
the indicators can be compared with the results recorded in the other
countries;
indicators can allow a distinction between natural changes and the human
factor influence.
From the table below (Table 3.3), it can be noticed that, apart from the Habitats
Change pressure, the availability of data at European level is extremely low.
In the following section, is presented the indirect estimation of the wetland
ecosystems state in Romania, including the case study represented by Divici-Pojejena
wetland, by analysing the exerted pressures.
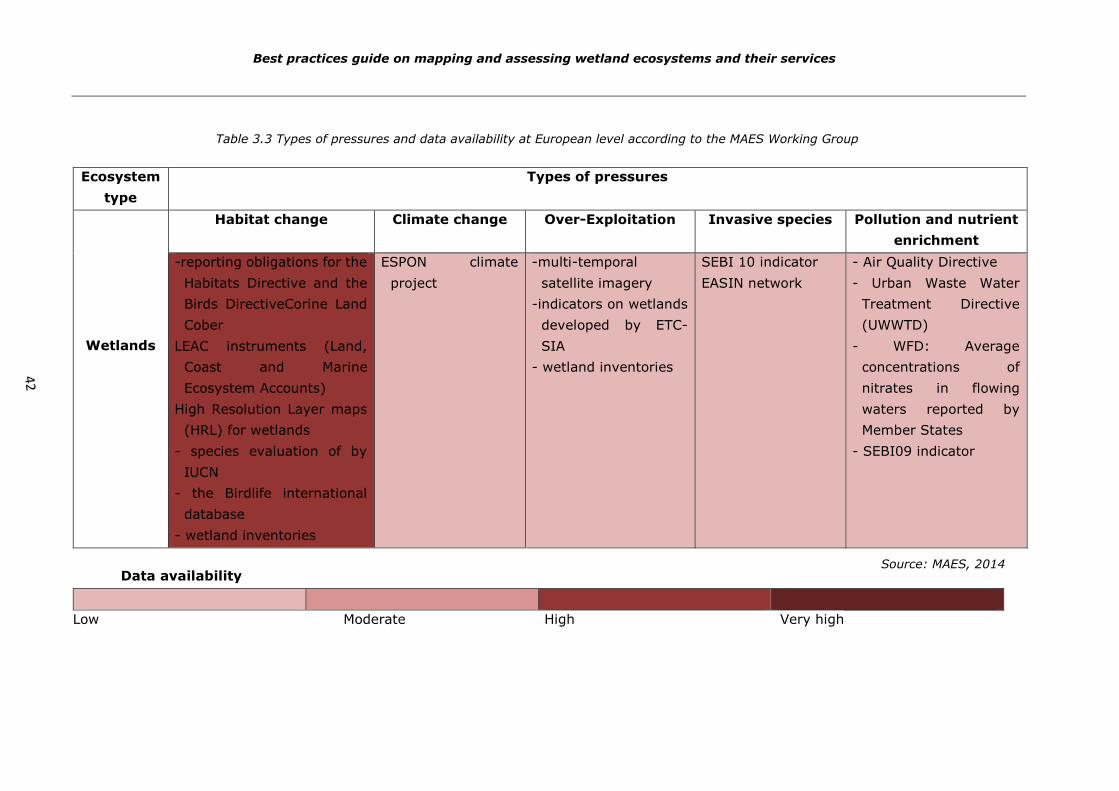
42
Table 3.3 Types of pressures and data availability at European level according to the MAES Working Group
Ecosystem
type
Types of pressures
Wetlands
Habitat change Climate change Over-Exploitation Invasive species Pollution and nutrient
enrichment
-reporting obligations for the
Habitats Directive and the
Birds DirectiveCorine Land
Cober
LEAC instruments (Land,
Coast and Marine
Ecosystem Accounts)
High Resolution Layer maps
(HRL) for wetlands
- species evaluation of by
IUCN
- the Birdlife international
database
- wetland inventories
ESPON climate
project
-multi-temporal
satellite imagery
-indicators on wetlands
developed by ETC-
SIA
- wetland inventories
SEBI 10 indicator
EASIN network
- Air Quality Directive
- Urban Waste Water
Treatment Directive
(UWWTD)
- WFD: Average
concentrations of
nitrates in flowing
waters reported by
Member States
- SEBI09 indicator
Source: MAES, 2014 Data availability
Low Moderate High Very high
Best practices guide on mapping and assessing wetland ecosystems and their services
Best practices guide on mapping and assessing wetland ecosystems and their services
43
3.1.1 Pressures caused by habitat change
Habitat change causes ecosystems direct degradation, considered a major cause of
biodiversity loss, leading to a partial or total destruction of habitats (MAES, 2014). The
way the habitats represent allowed space for some species depends largely on their shape
and spatial structure. It is known that habitats with a continuous geometric shape,
extended on large surfaces, without built areas or human arranged areas, represent spaces
favourable for reproduction, feeding and developing of fauna species (Fahrig, 2003).
Decreased quality of habitat is recorded by increased erosion and soil degradation
and land abandonment, which can lead to an additional impact on biodiversity.
Furthermore, changes at the ecosystem level causes modifications in the structure and
functions of habitats, thereby causing a high vulnerability for populations of plants and
animal species endangered locally. The main threats to habitats are the sources of pollution
and habitat fragmentation, which is a known cause for the disappearance of species with
dispersing or reduced movement capacity regarding food and reproduction.
In the field of ecology, habitat fragmentation analysis is a highly debated topic, being
the subject for many analyses that capture spatial and functional relationships for
expansion of a habitat and living environment of flora. Important papers that examines
aspects of habitat fragmentation, in a summary listing are: Primack, et al., 2008; Fahrig,
2003; McGarigal and Marks, 1995. In these works is speaking of habitat fragmentation
either by analysing at landscape level either though functionally fragmentation analysis,
considering as reference factor the required space for a certain species to carry out a
smooth life cycle.
In this case it was used and adapted to national level and analysed case study
benchmark SEBI 013 - Fragmentation of natural and semi-natural areas. The calculation
of this indicator, also the description and data sources are presented in the table below.
Table 3.1. Indicator Fragmentation of natural and semi-natural areas
Pressure type: Habitat change
Estimation method of the condition: indirect
Indicator: Fragmentation of natural and semi-natural areas
Scale:national, local
Indicator description [u.m.]:
The indicator shows the difference from averages between natural and semi-natural areas,
based on land cover maps accomplished by interpreting satellite images.
Measure unit: percentage of surface modification
Calculation method:
This indicator is calculated using a simple methodology, including mathematical
calculations and analysis based on Geographic Information Systems (GIS), using as
databaseCorine land cover (CLC), produced for the years 1990, 2000 and 2006. For
calculation, natural and semi-natural areas are classified into several classes CLC: forestry
(3.1), bushes and / or herbaceous vegetation (3.2), areas without vegetation or with
Best practices guide on mapping and assessing wetland ecosystems and their services
44
Pressure type: Habitat change
restricted vegetation (3.3), interior wetlands (4.1) and marine wetlands. Database CLC
uses satellite images with a spatial resolution ≤ 25 m (for CLC 2000 and 2006), minimum
mapping unit being 25 ha.
Data sources:
European Environment Agency, indicator SEBI 013 http://www.eea.europa.eu/data-and-
maps/indicators/fragmentation-of-natural-and-semi-1/assessment-1
Corine Land Cover 2000
Corine Land Cover 2006
Identification of lost wetlands can be achieved by using the indicator for land
occupation, developed by the European Environment Agency. The methodology developed
for this indicator is shown below (Table 3.5): indicator CSI 014- Land occupation.
Table 3.5 Land cover indicator
Pressure type: Habitat change
Estimation method of the condition: indirect
Indicator: Land Cover
Indicator description [u.m.]:
The indicator shows the quantitative change of land occupied by urban land development
and other artificial land (construction areas and urban infrastructure, urban green spaces,
sports and recreation complexes). The main drivers of land occupancy are grouped in
processes resulting from housing, services and recreation areas, industrial and commercial
areas, transport networks and infrastructure, mines, quarries and unsuitable landfills,
building site
Measurement unit: ha or km2
Results are shown as average annual change, % of the total area of the country and %
the different types of land cover occupied by urban development.
Calculation method:
The indicator is calculated using data from Corine Land Cover 2000 and 2006 mapped by
satellite images Landsat and SPOT (changes CLC 2000-2006 database version 16).
Changes in land occupied by wetlands (CLC class 4xx) in urban land (CLC class 1xx) they
are grouped according to the methodology of land cover. Changes in land cover values
are converted into grid cells and aggregated at national level. Using CLC geographical
database allows the calculation the same indicator for smaller units, such as regions or
hydrographic basins. When the indicator refers to the country's area, areas are calculated
using the same CLC database used for indicators.
Land occupation = LCF2 (residential urban expansion) (21 +22) + LCF3 (industrial and
infrastructure expansion) (31 +32 +33 +34 +35 +36 +37 +38) + LCF13 (developing
green urban areas on previously undeveloped land) –part of LCF38 (the conversion of land
occupied by sports facilities and leisure facilities from land previouslyarranged).Only
transport polygonal areas are recorded in the index; land occupation by development of
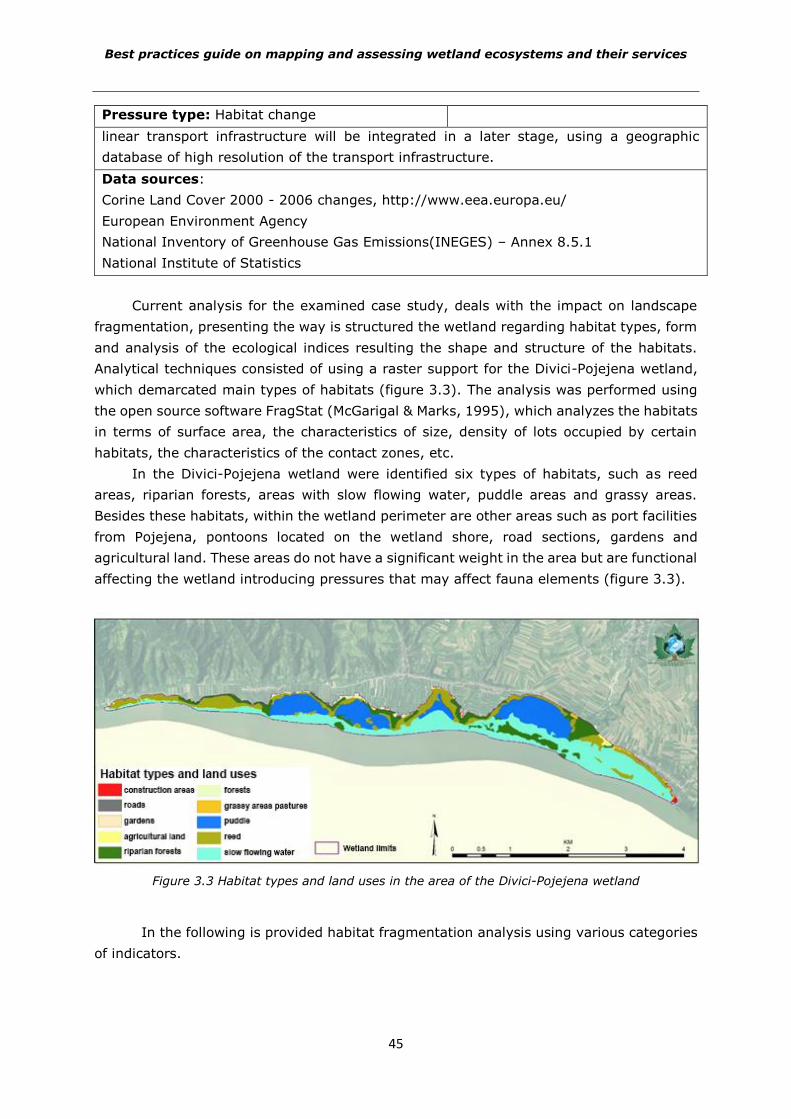
Best practices guide on mapping and assessing wetland ecosystems and their services
45
Pressure type: Habitat change
linear transport infrastructure will be integrated in a later stage, using a geographic
database of high resolution of the transport infrastructure.
Data sources:
Corine Land Cover 2000 - 2006 changes, http://www.eea.europa.eu/
European Environment Agency
National Inventory of Greenhouse Gas Emissions(INEGES) – Annex 8.5.1
National Institute of Statistics
Current analysis for the examined case study, deals with the impact on landscape
fragmentation, presenting the way is structured the wetland regarding habitat types, form
and analysis of the ecological indices resulting the shape and structure of the habitats.
Analytical techniques consisted of using a raster support for the Divici-Pojejena wetland,
which demarcated main types of habitats (figure 3.3). The analysis was performed using
the open source software FragStat (McGarigal & Marks, 1995), which analyzes the habitats
in terms of surface area, the characteristics of size, density of lots occupied by certain
habitats, the characteristics of the contact zones, etc.
In the Divici-Pojejena wetland were identified six types of habitats, such as reed
areas, riparian forests, areas with slow flowing water, puddle areas and grassy areas.
Besides these habitats, within the wetland perimeter are other areas such as port facilities
from Pojejena, pontoons located on the wetland shore, road sections, gardens and
agricultural land. These areas do not have a significant weight in the area but are functional
affecting the wetland introducing pressures that may affect fauna elements (figure 3.3).
Figure 3.3 Habitat types and land uses in the area of the Divici-Pojejena wetland
In the following is provided habitat fragmentation analysis using various categories
of indicators.
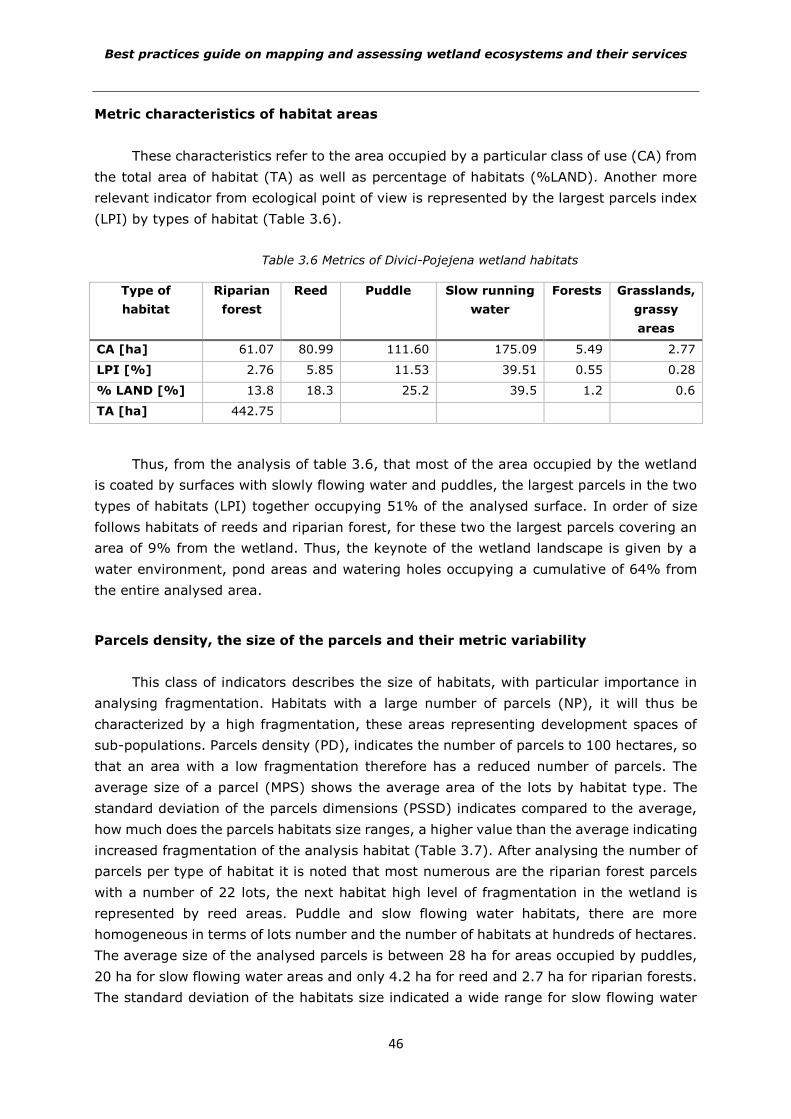
Best practices guide on mapping and assessing wetland ecosystems and their services
46
Metric characteristics of habitat areas
These characteristics refer to the area occupied by a particular class of use (CA) from
the total area of habitat (TA) as well as percentage of habitats (%LAND). Another more
relevant indicator from ecological point of view is represented by the largest parcels index
(LPI) by types of habitat (Table 3.6).
Table 3.6 Metrics of Divici-Pojejena wetland habitats
Type of
habitat
Riparian
forest
Reed Puddle Slow running
water
Forests Grasslands,
grassy
areas
CA [ha] 61.07 80.99 111.60 175.09 5.49 2.77
LPI [%] 2.76 5.85 11.53 39.51 0.55 0.28
% LAND [%] 13.8 18.3 25.2 39.5 1.2 0.6
TA [ha] 442.75
Thus, from the analysis of table 3.6, that most of the area occupied by the wetland
is coated by surfaces with slowly flowing water and puddles, the largest parcels in the two
types of habitats (LPI) together occupying 51% of the analysed surface. In order of size
follows habitats of reeds and riparian forest, for these two the largest parcels covering an
area of 9% from the wetland. Thus, the keynote of the wetland landscape is given by a
water environment, pond areas and watering holes occupying a cumulative of 64% from
the entire analysed area.
Parcels density, the size of the parcels and their metric variability
This class of indicators describes the size of habitats, with particular importance in
analysing fragmentation. Habitats with a large number of parcels (NP), it will thus be
characterized by a high fragmentation, these areas representing development spaces of
sub-populations. Parcels density (PD), indicates the number of parcels to 100 hectares, so
that an area with a low fragmentation therefore has a reduced number of parcels. The
average size of a parcel (MPS) shows the average area of the lots by habitat type. The
standard deviation of the parcels dimensions (PSSD) indicates compared to the average,
how much does the parcels habitats size ranges, a higher value than the average indicating
increased fragmentation of the analysis habitat (Table 3.7). After analysing the number of
parcels per type of habitat it is noted that most numerous are the riparian forest parcels
with a number of 22 lots, the next habitat high level of fragmentation in the wetland is
represented by reed areas. Puddle and slow flowing water habitats, there are more
homogeneous in terms of lots number and the number of habitats at hundreds of hectares.
The average size of the analysed parcels is between 28 ha for areas occupied by puddles,
20 ha for slow flowing water areas and only 4.2 ha for reed and 2.7 ha for riparian forests.
The standard deviation of the habitats size indicated a wide range for slow flowing water
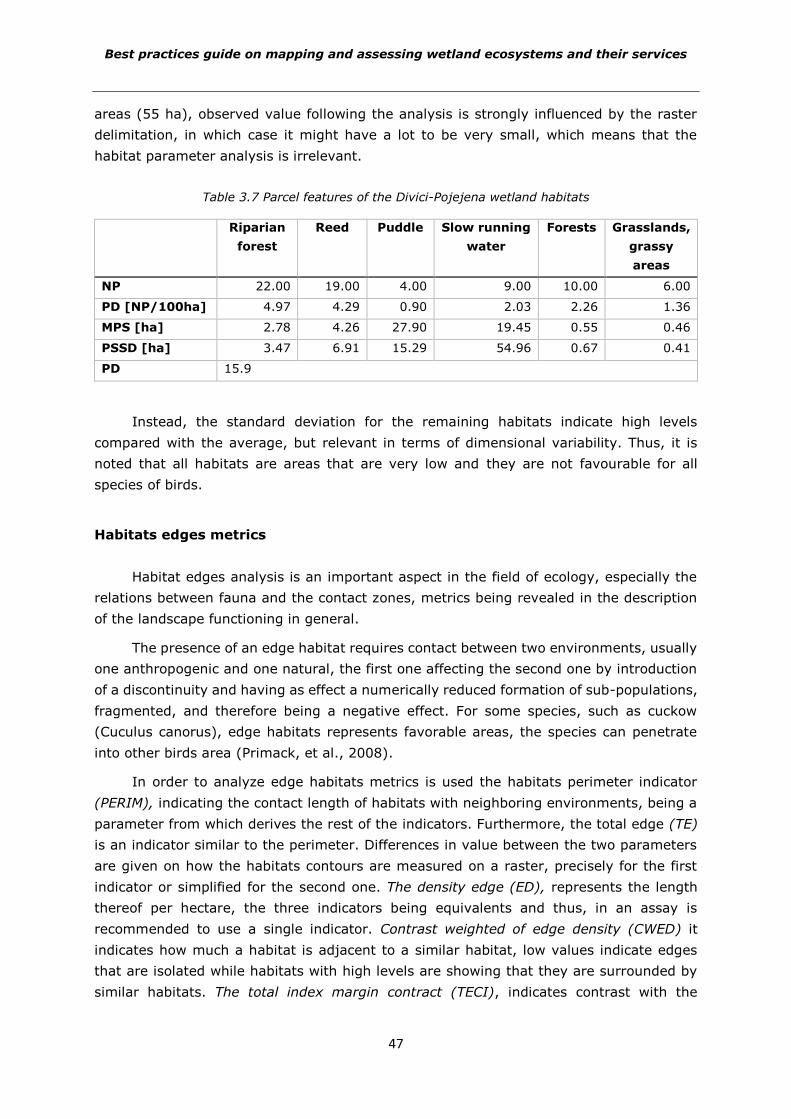
Best practices guide on mapping and assessing wetland ecosystems and their services
47
areas (55 ha), observed value following the analysis is strongly influenced by the raster
delimitation, in which case it might have a lot to be very small, which means that the
habitat parameter analysis is irrelevant.
Table 3.7 Parcel features of the Divici-Pojejena wetland habitats
Riparian
forest
Reed Puddle Slow running
water
Forests Grasslands,
grassy
areas
NP 22.00 19.00 4.00 9.00 10.00 6.00
PD [NP/100ha] 4.97 4.29 0.90 2.03 2.26 1.36
MPS [ha] 2.78 4.26 27.90 19.45 0.55 0.46
PSSD [ha] 3.47 6.91 15.29 54.96 0.67 0.41
PD 15.9
Instead, the standard deviation for the remaining habitats indicate high levels
compared with the average, but relevant in terms of dimensional variability. Thus, it is
noted that all habitats are areas that are very low and they are not favourable for all
species of birds.
Habitats edges metrics
Habitat edges analysis is an important aspect in the field of ecology, especially the
relations between fauna and the contact zones, metrics being revealed in the description
of the landscape functioning in general.
The presence of an edge habitat requires contact between two environments, usually
one anthropogenic and one natural, the first one affecting the second one by introduction
of a discontinuity and having as effect a numerically reduced formation of sub-populations,
fragmented, and therefore being a negative effect. For some species, such as cuckow
(Cuculus canorus), edge habitats represents favorable areas, the species can penetrate
into other birds area (Primack, et al., 2008).
In order to analyze edge habitats metrics is used the habitats perimeter indicator
(PERIM), indicating the contact length of habitats with neighboring environments, being a
parameter from which derives the rest of the indicators. Furthermore, the total edge (TE)
is an indicator similar to the perimeter. Differences in value between the two parameters
are given on how the habitats contours are measured on a raster, precisely for the first
indicator or simplified for the second one. The density edge (ED), represents the length
thereof per hectare, the three indicators being equivalents and thus, in an assay is
recommended to use a single indicator. Contrast weighted of edge density (CWED) it
indicates how much a habitat is adjacent to a similar habitat, low values indicate edges
that are isolated while habitats with high levels are showing that they are surrounded by
similar habitats. The total index margin contract (TECI), indicates contrast with the
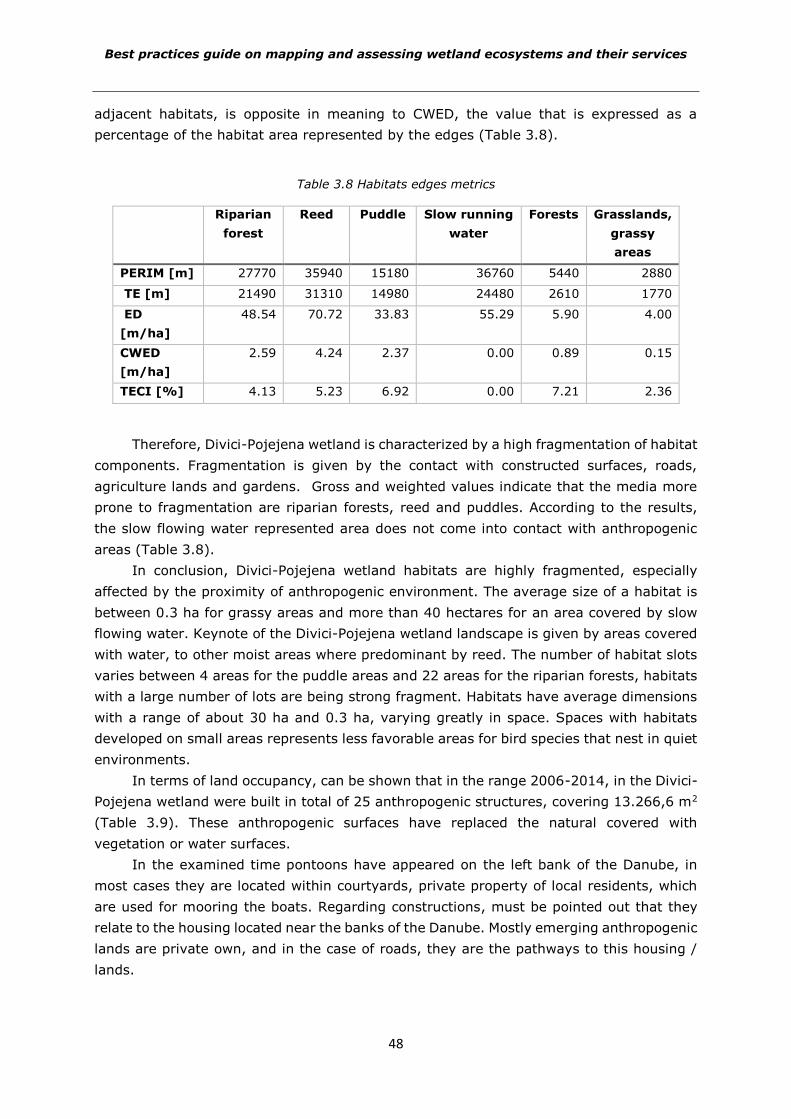
Best practices guide on mapping and assessing wetland ecosystems and their services
48
adjacent habitats, is opposite in meaning to CWED, the value that is expressed as a
percentage of the habitat area represented by the edges (Table 3.8).
Table 3.8 Habitats edges metrics
Riparian
forest
Reed Puddle Slow running
water
Forests Grasslands,
grassy
areas
PERIM [m] 27770 35940 15180 36760 5440 2880
TE [m] 21490 31310 14980 24480 2610 1770
ED
[m/ha]
48.54 70.72 33.83 55.29 5.90 4.00
CWED
[m/ha]
2.59 4.24 2.37 0.00 0.89 0.15
TECI [%] 4.13 5.23 6.92 0.00 7.21 2.36
Therefore, Divici-Pojejena wetland is characterized by a high fragmentation of habitat
components. Fragmentation is given by the contact with constructed surfaces, roads,
agriculture lands and gardens. Gross and weighted values indicate that the media more
prone to fragmentation are riparian forests, reed and puddles. According to the results,
the slow flowing water represented area does not come into contact with anthropogenic
areas (Table 3.8).
In conclusion, Divici-Pojejena wetland habitats are highly fragmented, especially
affected by the proximity of anthropogenic environment. The average size of a habitat is
between 0.3 ha for grassy areas and more than 40 hectares for an area covered by slow
flowing water. Keynote of the Divici-Pojejena wetland landscape is given by areas covered
with water, to other moist areas where predominant by reed. The number of habitat slots
varies between 4 areas for the puddle areas and 22 areas for the riparian forests, habitats
with a large number of lots are being strong fragment. Habitats have average dimensions
with a range of about 30 ha and 0.3 ha, varying greatly in space. Spaces with habitats
developed on small areas represents less favorable areas for bird species that nest in quiet
environments.
In terms of land occupancy, can be shown that in the range 2006-2014, in the Divici-
Pojejena wetland were built in total of 25 anthropogenic structures, covering 13.266,6 m2
(Table 3.9). These anthropogenic surfaces have replaced the natural covered with
vegetation or water surfaces.
In the examined time pontoons have appeared on the left bank of the Danube, in
most cases they are located within courtyards, private property of local residents, which
are used for mooring the boats. Regarding constructions, must be pointed out that they
relate to the housing located near the banks of the Danube. Mostly emerging anthropogenic
lands are private own, and in the case of roads, they are the pathways to this housing /
lands.
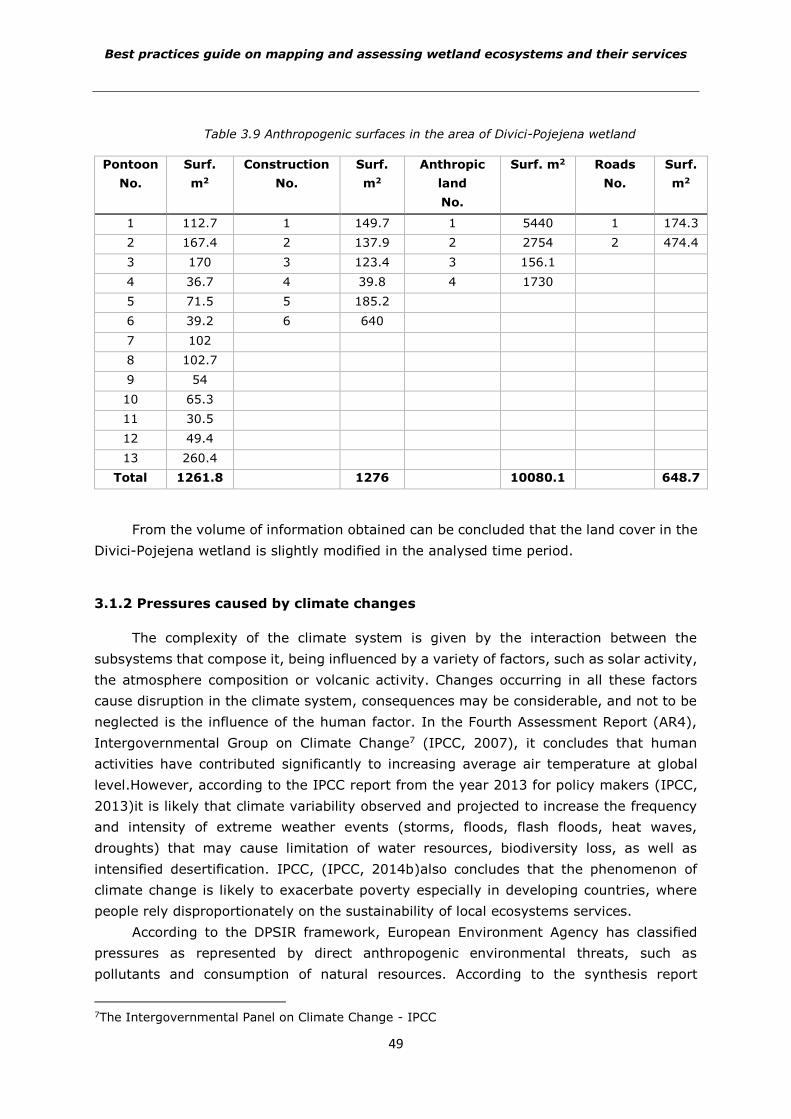
Best practices guide on mapping and assessing wetland ecosystems and their services
49
Table 3.9 Anthropogenic surfaces in the area of Divici-Pojejena wetland
Pontoon
No.
Surf.
m2
Construction
No.
Surf.
m2
Anthropic
land
No.
Surf. m2 Roads
No.
Surf.
m2
1 112.7 1 149.7 1 5440 1 174.3
2 167.4 2 137.9 2 2754 2 474.4
3 170 3 123.4 3 156.1
4 36.7 4 39.8 4 1730
5 71.5 5 185.2
6 39.2 6 640
7 102
8 102.7
9 54
10 65.3
11 30.5
12 49.4
13 260.4
Total 1261.8 1276 10080.1 648.7
From the volume of information obtained can be concluded that the land cover in the
Divici-Pojejena wetland is slightly modified in the analysed time period.
3.1.2 Pressures caused by climate changes
The complexity of the climate system is given by the interaction between the
subsystems that compose it, being influenced by a variety of factors, such as solar activity,
the atmosphere composition or volcanic activity. Changes occurring in all these factors
cause disruption in the climate system, consequences may be considerable, and not to be
neglected is the influence of the human factor. In the Fourth Assessment Report (AR4),
Intergovernmental Group on Climate Change7 (IPCC, 2007), it concludes that human
activities have contributed significantly to increasing average air temperature at global
level.However, according to the IPCC report from the year 2013 for policy makers (IPCC,
2013)it is likely that climate variability observed and projected to increase the frequency
and intensity of extreme weather events (storms, floods, flash floods, heat waves,
droughts) that may cause limitation of water resources, biodiversity loss, as well as
intensified desertification. IPCC, (IPCC, 2014b)also concludes that the phenomenon of
climate change is likely to exacerbate poverty especially in developing countries, where
people rely disproportionately on the sustainability of local ecosystems services.
According to the DPSIR framework, European Environment Agency has classified
pressures as represented by direct anthropogenic environmental threats, such as
pollutants and consumption of natural resources. According to the synthesis report
7The Intergovernmental Panel on Climate Change - IPCC
Best practices guide on mapping and assessing wetland ecosystems and their services
50
prepared by the European Environment Agency (AEM, 2015) climate change continues to
have a significant impact on ecosystems, and regarding the evaluation of progress in
achieving key indicative targets of these policies is still off course planning. Pressure on
water resources is increasingly affecting many parts of Europe, including Romania. As a
result of increased climate change phenomenon further action is needed for more efficient
use of water (UE, 2013).
In Romania, the precipitation regime changes can have significant effects on
biodiversity, given that the rainfall regime disruption may result in changed vegetation
periods (ANM, 2014).
There are several types of wetlands, but their common peculiarity, represented by
the water cycle makes them vulnerable to climate change. For example, elevated
temperatures will affect the water cycle and, therefore hydrology of wetlands, and this in
turn will affect, the structure and functionality of wetlands. Analysis of the air temperature
and precipitation over a period of at least 30 years, according to the recommendations the
World Meteorological Organization - OMM, (WMO, 2007), provides indications on the
pressures of climate change on a area. Climate change induced impacts overlaps and
interfere also with other pressures, thus cumulated effects can be observed as a multi-
dimensional changes in the ecosystem (Sienkiewicz et al., 2013). Meteorological data
provides essential information about past and present climate. Dynamic water cycle is one
of the key variables that determine the distribution and productivity of ecosystems, thus
as hydrological changes influence the plants and animals in various ways. For sustainable
management of protected areas knowledge of water regime plays a very important role,
especially for wetlands. Local hydrological conditions depend on the spatial and temporal
variation of the main components that form the hydrological cycle.
Indicators used in this case were taken and adapted for Romania from the set of EEA
indicators, respecting MAES requirements (MAES, 2014).
Each indicator has been characterized in sheet that includes the most important
aspects of their description, and the method of calculation. These sheets are presented
below for each selected indicator selected (Table 3.10, 3.11, 3.12).
Table 3.10 Indicator evolution trend of the average air temperature
Pressure type: Climate changes
Estimation method of the condition: indirect
Indicator: Evolution trend of average air temperature
Scale: national,local
Indicator description [u.m]:
This indicator shows the average air temperature absolute changes and rates of change
at national level, expressed in Celsius degrees. The indicator presents the annual average
temperature, based on thermal regime trend analysis for a period of at least 30 years
according to the recommendations the World Meteorological Organization - OMM, (WMO,
2007).
Measurement unit: °C
Calculation method:
Best practices guide on mapping and assessing wetland ecosystems and their services
51
Pressure type: Climate changes
Spatial distribution and air temperature can be described using several climatic
parameters and calculation of resulting statistical data streams, such as sums, averages,
extreme values, characteristic values time intervals, frequencies, probabilities, etc. (ANM,
2008). These parameters are calculated based on the measurements with three types of
thermometers (ordinary, minimum and maximum) a thermo-graphic device, in
meteorological shelters located at a height of 2 m above the ground. The climatological
program includes four measurements terms of daily observations: 01, 07, 13, 19. The
most used of the various climatic parameters for analysis are the monthly and annual
average temperatures. For the long time periods thermal regime analysis of evolution
trend, can be build graphs showing average change monthly, yearly, etc. In these graphs,
the evolution can be represented by linear regression8 which shows a tendency of
increasing or decreasing of air temperature in the examined time frame. Furthermore, to
identify trends in the data series is the commonly used also the Mann-Kendall test
(Sneyers R., 1975) where each value is compared with all previous values of the
considered array. Thus, this test combined with Sen’s slope (Gilbert, 1987) it can be used
to determine the trend in the time series of monthly, seasonal, annual and other specific
time series. Calculations can be performed using the MAKESENS automatically computer
program (Mann-Kendall test for trend and Sen’s slope estimates), created by researchers
at the Finnish Meteorological Institute (Salmi, 2002).
Data source:
Climatological database (National Meteorological Data Fund) of the National
Meteorological Administration.
National Statistics Institute which develop Romanian Statistical Yearbook comprising
air temperature values (monthly and annual average), the air temperatures (absolute
maximum and absolute minimum monthly and annual), from a total of 18
meteorological stations, for the period 1901-2000 and the year 2010.
The European project, European Climate Assessment and Development (ECA&D)
containing daily date of the daily average temperature, minimum and maximum for a
number of 28 meteorological stations.
Table 3.11.Indicator average annual rainfall indicator
Type of pressure: Climate changes
Condition estimation mode: indirect
Indicator: Rainfall annual average
Scale: national, local
Indicator description [u.m]:
Atmospheric precipitation is one of the most important climatic elements. The amount of
precipitation is the thickness of the water layer from the solid or liquid precipitations that
fall within a certain amount of time. Precipitation may be in a solid or liquid state, also
differing in particle size. The most common forms of precipitation are rain, snow (snow),
8http://profs.info.uaic.ro/~val/statistica/StatWork_7.pdf
Best practices guide on mapping and assessing wetland ecosystems and their services
52
Type of pressure: Climate changes
Condition estimation mode: indirect
Indicator: Rainfall annual average
snowstorm and hail. The indicator shows the average monthly and annual rainfall
amounts.
Unit of measurement :mm or l/m2
Calculation method :
The measurement of atmospheric precipitation in Romania is carried out in the network
of meteorological stations and pluviometric stations. In the meteorological network in
Romania, the atmospheric precipitation quantities are measured with the IMC type
rainwater meter at 07 and 19 climatological intervals, as well as whenever needed. Every
day, the quantities from the two observation terms are sum up, resulting in the daily
amount of rainfall (Climate of Romania, 2008). Average rainfall amounts are calculated
from the value obtained from the sum of several values of a variable divided by the
number of terms. In meteorological treatments, are use averages such as: hourly, diurnal,
5 days, 10 days, monthly, annual and multi-annual. The nationwide distribution of monthly
precipitation quantities highlights the pluviometric potential of each region. Thus,
pluviometric data can be represented on maps by lines joining points with the same
precipitation values, called isohietic lines.
Data source :
The Climatological Database (National Meteorological Data Fund) of the National
Meteorological Administration
The National Institute of Statistics elaborating Romania's Statistical Yearbook
containing the air temperature values (monthly and annual average), the air
temperature values (absolute maximum and absolute minimum monthly and annual)
at 18 meteorological stations for the period 1901-2000 and the year 2010
European Climate Assessment and Development (ECA & D) project containing daily
rainfall data for 28 weather stations.
Table 3.12 Indicator extreme precipitations
Pressure type: Extreme events
Estimation method of the condition: indirect
Indicator: Extreme precipitations
Scale: local, national
Indicator description [u.m]:
Climate change had led both at global and European level, as well in our country though
the amplification of extreme events by increasing frequency of intense rainstorms, of less
frequent colder nights / days and more frequent warmer days / nights (Busuioc, 2010).
Extreme rainfall events analysis frequently emphasizes the tendency to surplus or deficit
Best practices guide on mapping and assessing wetland ecosystems and their services
53
Pressure type: Extreme events
precipitation amount, which is equivalent to a tendency of increase / decrease in the
maximum interval length with / without precipitation.
This indicator is shown by the maximum number (monthly and annual) of days with
precipitation (moist periods), respectively without precipitation (dry periods).
Measurement unit: number of days
Calculation method:
Long arrays of data analysis provide an overview sequence of a surplus and deficient
period in rainfall terms. This approach allows identification of possible cyclical episodes of
floods and droughts.
The maximum number of days with precipitation is represented though days with
precipitation with total amounts>=1,0 mm, while the number of days without precipitation
refers to days with precipitation amounts<= 1,00 mm.
Data source:
Climatological database (National Meteorological Data Fund) of the National
Meteorological Administration
The European project, European Climate Assessment and Development (ECA&D)
which containing extreme indices calculated for a total of 29 meteorological stations.
In order to highlight the main climatic parameters evolution (temperature and
precipitation) at national level and their influence on wetlands functioning mode, datasets
available in WorldClim3 database for were used for the present climate (period 1950-2000)
and future (period 2041-2060).
The available data is represented though the projections obtained using global
climate models (Global Climate Models-GCMs), for four representative concentrations of
greenhouse gases4. These were established based on decisions taken though IPCC fifth
assessment report (AR5) from the year 2014 (IPCC, 2013)replacing the Special Report on
emission scenarios (SRES) published in 2000. In this case was used as output the
HadGEM2-ES global climate model, developed by Met Office Hadley Centre5, England, with
a spatial resolution of 20 m, for RCP4.5 (under this scenario, greenhouse gas emissions
have a peak around the year 2040, after that being recorded a decrease).
In the figure below (Figure 3.4), are presented the wetland proximity annual average
temperature values within the present climate from which it can be seen that the highest
values are up to 12°C being recorded in the Danube Delta, in the Danube meadow regions
and in the west part of the country. The lowest values, ranging between 3-5°C, are
recorded in the mountain areas and in the northern part of Moldova.
For future climate (Figure 3.5), the average annual air temperature values reach and
even exceed the value of 15°C in most of the analysed regions, except in remote mountain
areas, where the average annual air temperature values reach up to 11°C.
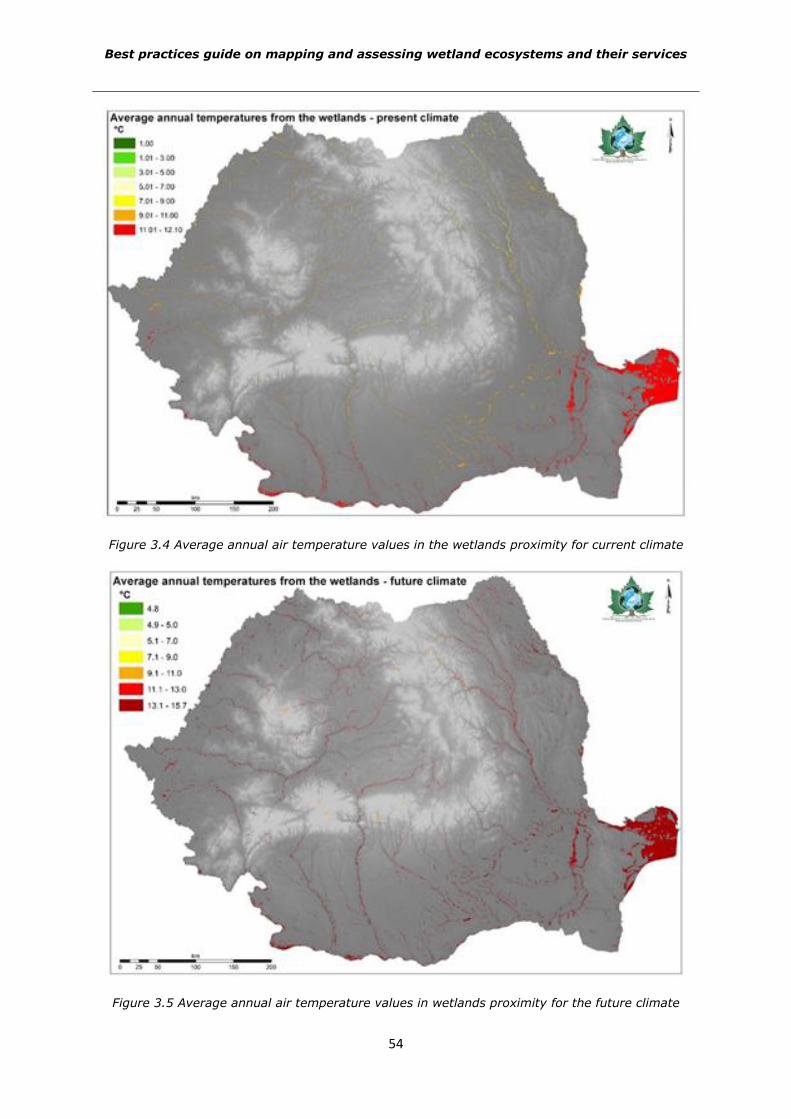
Best practices guide on mapping and assessing wetland ecosystems and their services
54
Figure 3.4 Average annual air temperature values in the wetlands proximity for current climate
Figure 3.5 Average annual air temperature values in wetlands proximity for the future climate
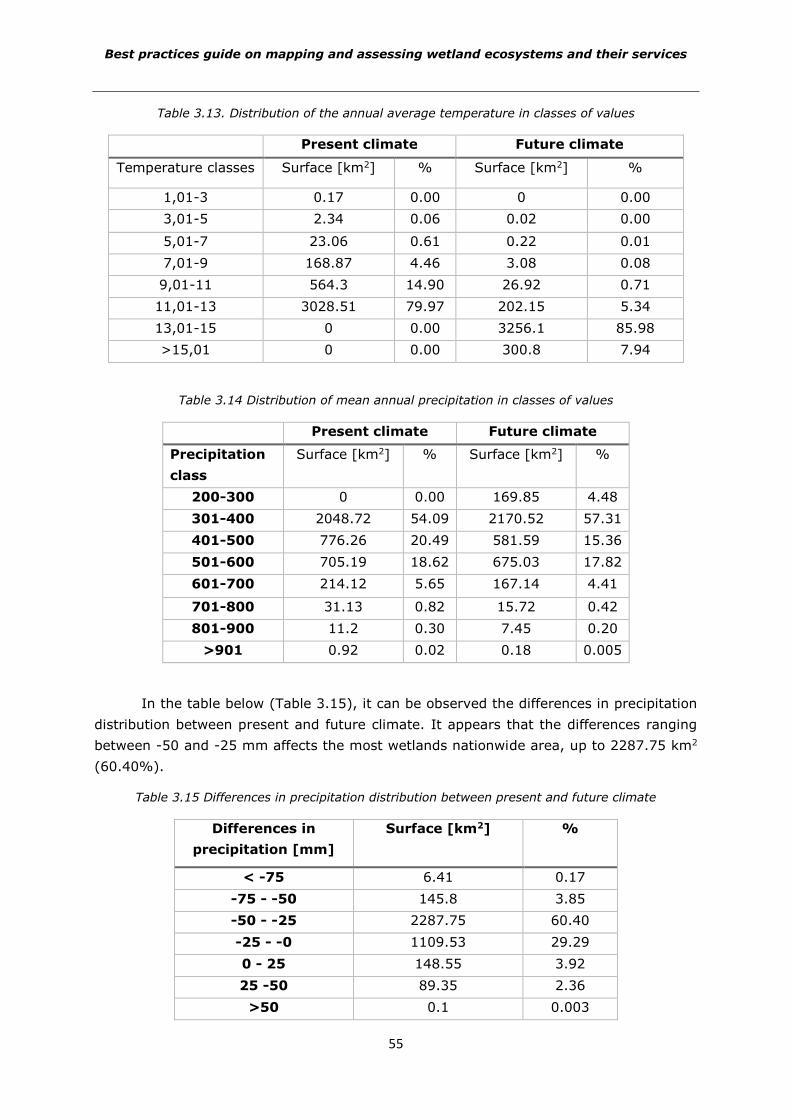
Best practices guide on mapping and assessing wetland ecosystems and their services
55
Table 3.13. Distribution of the annual average temperature in classes of values
Present climate Future climate
Temperature classes Surface [km2] % Surface [km2] %
1,01-3 0.17 0.00 0 0.00
3,01-5 2.34 0.06 0.02 0.00
5,01-7 23.06 0.61 0.22 0.01
7,01-9 168.87 4.46 3.08 0.08
9,01-11 564.3 14.90 26.92 0.71
11,01-13 3028.51 79.97 202.15 5.34
13,01-15 0 0.00 3256.1 85.98
>15,01 0 0.00 300.8 7.94
Table 3.14 Distribution of mean annual precipitation in classes of values
Present climate Future climate
Precipitation
class
Surface [km2] % Surface [km2] %
200-300 0 0.00 169.85 4.48
301-400 2048.72 54.09 2170.52 57.31
401-500 776.26 20.49 581.59 15.36
501-600 705.19 18.62 675.03 17.82
601-700 214.12 5.65 167.14 4.41
701-800 31.13 0.82 15.72 0.42
801-900 11.2 0.30 7.45 0.20
>901 0.92 0.02 0.18 0.005
In the table below (Table 3.15), it can be observed the differences in precipitation
distribution between present and future climate. It appears that the differences ranging
between -50 and -25 mm affects the most wetlands nationwide area, up to 2287.75 km2
(60.40%).
Table 3.15 Differences in precipitation distribution between present and future climate
Differences in
precipitation [mm]
Surface [km2] %
< -75 6.41 0.17
-75 - -50 145.8 3.85
-50 - -25 2287.75 60.40
-25 - -0 1109.53 29.29
0 - 25 148.55 3.92
25 -50 89.35 2.36
>50 0.1 0.003
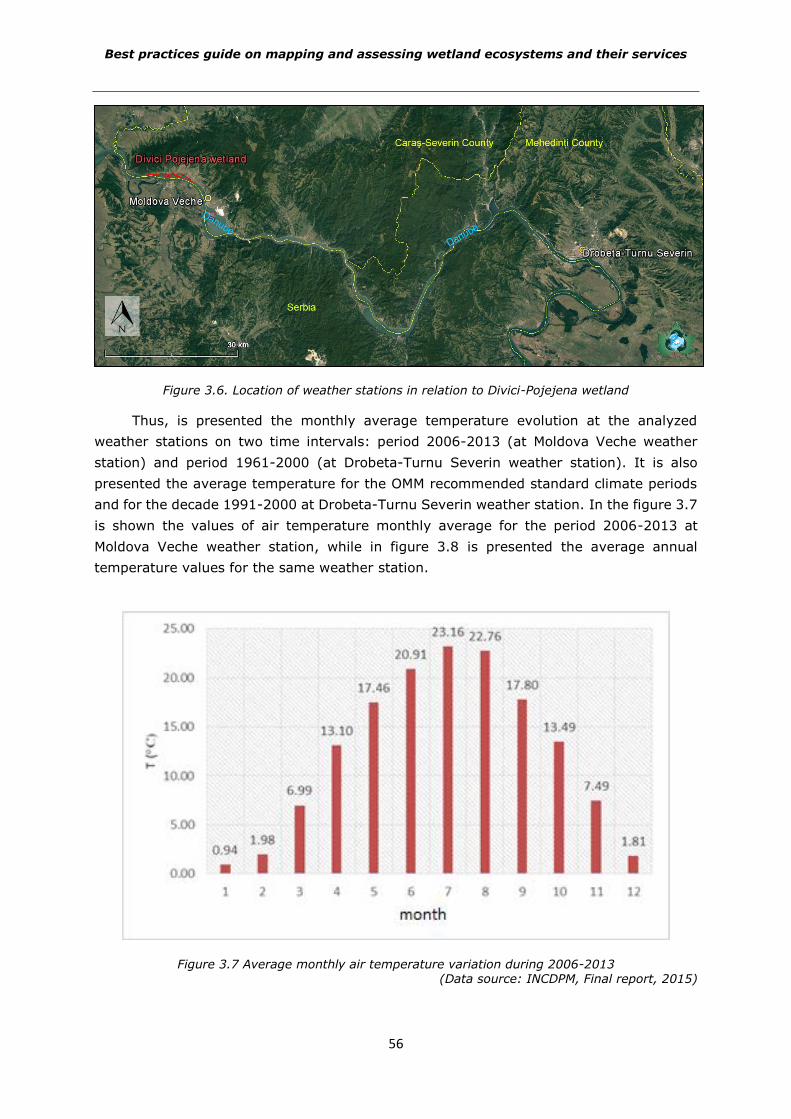
Best practices guide on mapping and assessing wetland ecosystems and their services
56
Figure 3.6. Location of weather stations in relation to Divici-Pojejena wetland
Thus, is presented the monthly average temperature evolution at the analyzed
weather stations on two time intervals: period 2006-2013 (at Moldova Veche weather
station) and period 1961-2000 (at Drobeta-Turnu Severin weather station). It is also
presented the average temperature for the OMM recommended standard climate periods
and for the decade 1991-2000 at Drobeta-Turnu Severin weather station. In the figure 3.7
is shown the values of air temperature monthly average for the period 2006-2013 at
Moldova Veche weather station, while in figure 3.8 is presented the average annual
temperature values for the same weather station.
Figure 3.7 Average monthly air temperature variation during 2006-2013 (Data source: INCDPM, Final report, 2015)
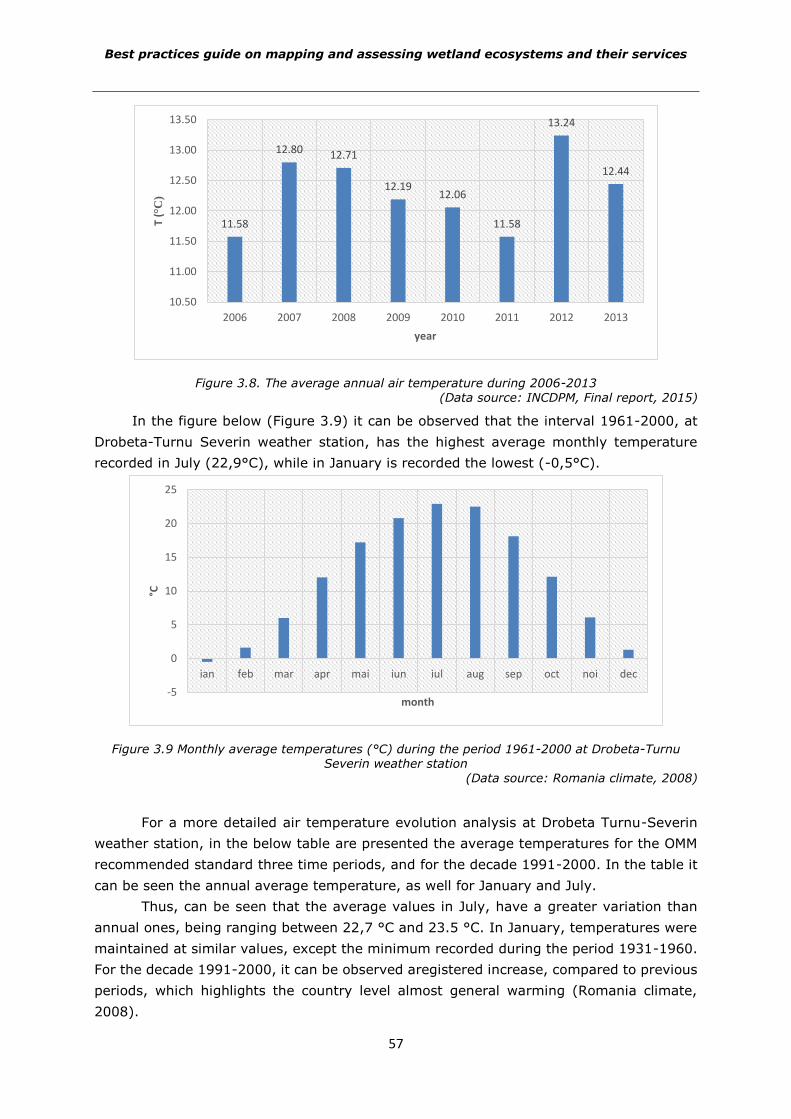
Best practices guide on mapping and assessing wetland ecosystems and their services
57
Figure 3.8. The average annual air temperature during 2006-2013 (Data source: INCDPM, Final report, 2015)
In the figure below (Figure 3.9) it can be observed that the interval 1961-2000, at
Drobeta-Turnu Severin weather station, has the highest average monthly temperature
recorded in July (22,9°C), while in January is recorded the lowest (-0,5°C).
Figure 3.9 Monthly average temperatures (°C) during the period 1961-2000 at Drobeta-Turnu Severin weather station
(Data source: Romania climate, 2008)
For a more detailed air temperature evolution analysis at Drobeta Turnu-Severin
weather station, in the below table are presented the average temperatures for the OMM
recommended standard three time periods, and for the decade 1991-2000. In the table it
can be seen the annual average temperature, as well for January and July.
Thus, can be seen that the average values in July, have a greater variation than
annual ones, being ranging between 22,7 °C and 23.5 °C. In January, temperatures were
maintained at similar values, except the minimum recorded during the period 1931-1960.
For the decade 1991-2000, it can be observed aregistered increase, compared to previous
periods, which highlights the country level almost general warming (Romania climate,
2008).
11.58
12.80 12.71
12.1912.06
11.58
13.24
12.44
10.50
11.00
11.50
12.00
12.50
13.00
13.50
2006 2007 2008 2009 2010 2011 2012 2013
T (°
C)
year
-5
0
5
10
15
20
25
ian feb mar apr mai iun iul aug sep oct noi dec
°C
month
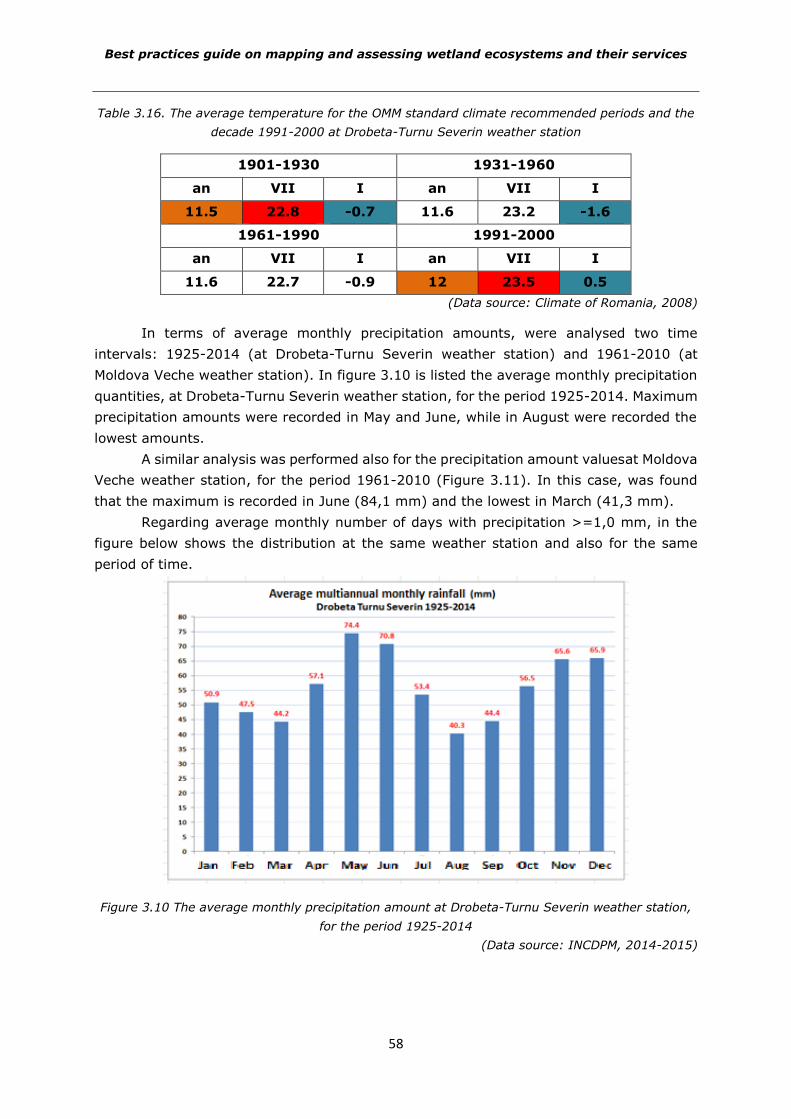
Best practices guide on mapping and assessing wetland ecosystems and their services
58
Table 3.16. The average temperature for the OMM standard climate recommended periods and the
decade 1991-2000 at Drobeta-Turnu Severin weather station
1901-1930 1931-1960
an VII I an VII I
11.5 22.8 -0.7 11.6 23.2 -1.6
1961-1990 1991-2000
an VII I an VII I
11.6 22.7 -0.9 12 23.5 0.5
(Data source: Climate of Romania, 2008)
In terms of average monthly precipitation amounts, were analysed two time
intervals: 1925-2014 (at Drobeta-Turnu Severin weather station) and 1961-2010 (at
Moldova Veche weather station). In figure 3.10 is listed the average monthly precipitation
quantities, at Drobeta-Turnu Severin weather station, for the period 1925-2014. Maximum
precipitation amounts were recorded in May and June, while in August were recorded the
lowest amounts.
A similar analysis was performed also for the precipitation amount valuesat Moldova
Veche weather station, for the period 1961-2010 (Figure 3.11). In this case, was found
that the maximum is recorded in June (84,1 mm) and the lowest in March (41,3 mm).
Regarding average monthly number of days with precipitation >=1,0 mm, in the
figure below shows the distribution at the same weather station and also for the same
period of time.
Figure 3.10 The average monthly precipitation amount at Drobeta-Turnu Severin weather station,
for the period 1925-2014
(Data source: INCDPM, 2014-2015)
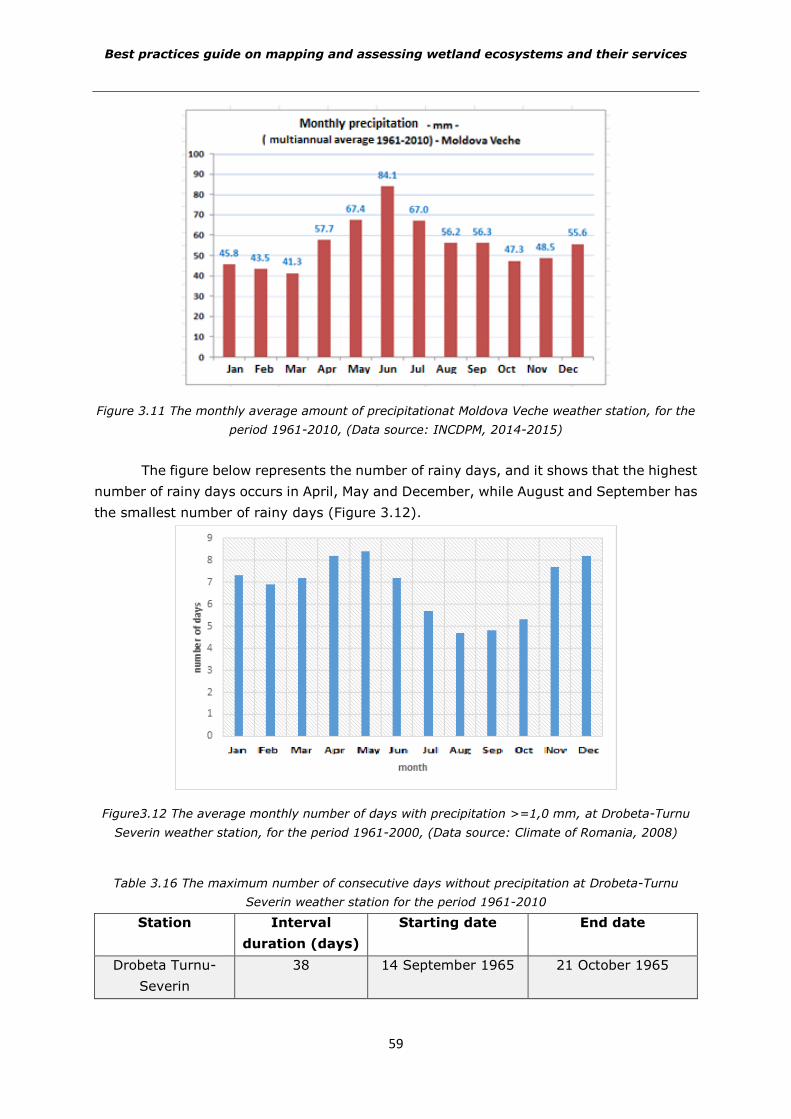
Best practices guide on mapping and assessing wetland ecosystems and their services
59
Figure 3.11 The monthly average amount of precipitationat Moldova Veche weather station, for the
period 1961-2010, (Data source: INCDPM, 2014-2015)
The figure below represents the number of rainy days, and it shows that the highest
number of rainy days occurs in April, May and December, while August and September has
the smallest number of rainy days (Figure 3.12).
Figure3.12 The average monthly number of days with precipitation >=1,0 mm, at Drobeta-Turnu
Severin weather station, for the period 1961-2000, (Data source: Climate of Romania, 2008)
Table 3.16 The maximum number of consecutive days without precipitation at Drobeta-Turnu
Severin weather station for the period 1961-2010
Station Interval
duration (days)
Starting date End date
Drobeta Turnu-
Severin
38 14 September 1965 21 October 1965
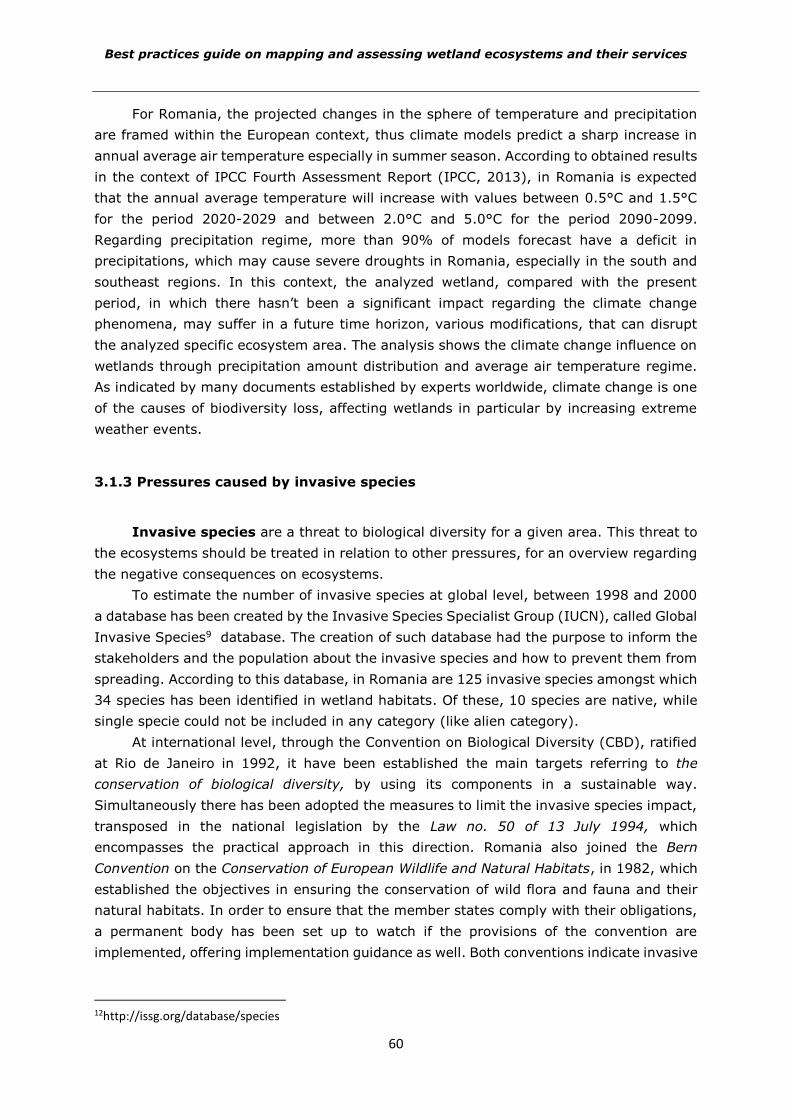
Best practices guide on mapping and assessing wetland ecosystems and their services
60
For Romania, the projected changes in the sphere of temperature and precipitation
are framed within the European context, thus climate models predict a sharp increase in
annual average air temperature especially in summer season. According to obtained results
in the context of IPCC Fourth Assessment Report (IPCC, 2013), in Romania is expected
that the annual average temperature will increase with values between 0.5°C and 1.5°C
for the period 2020-2029 and between 2.0°C and 5.0°C for the period 2090-2099.
Regarding precipitation regime, more than 90% of models forecast have a deficit in
precipitations, which may cause severe droughts in Romania, especially in the south and
southeast regions. In this context, the analyzed wetland, compared with the present
period, in which there hasn’t been a significant impact regarding the climate change
phenomena, may suffer in a future time horizon, various modifications, that can disrupt
the analyzed specific ecosystem area. The analysis shows the climate change influence on
wetlands through precipitation amount distribution and average air temperature regime.
As indicated by many documents established by experts worldwide, climate change is one
of the causes of biodiversity loss, affecting wetlands in particular by increasing extreme
weather events.
3.1.3 Pressures caused by invasive species
Invasive species are a threat to biological diversity for a given area. This threat to
the ecosystems should be treated in relation to other pressures, for an overview regarding
the negative consequences on ecosystems.
To estimate the number of invasive species at global level, between 1998 and 2000
a database has been created by the Invasive Species Specialist Group (IUCN), called Global
Invasive Species9 database. The creation of such database had the purpose to inform the
stakeholders and the population about the invasive species and how to prevent them from
spreading. According to this database, in Romania are 125 invasive species amongst which
34 species has been identified in wetland habitats. Of these, 10 species are native, while
single specie could not be included in any category (like alien category).
At international level, through the Convention on Biological Diversity (CBD), ratified
at Rio de Janeiro in 1992, it have been established the main targets referring to the
conservation of biological diversity, by using its components in a sustainable way.
Simultaneously there has been adopted the measures to limit the invasive species impact,
transposed in the national legislation by the Law no. 50 of 13 July 1994, which
encompasses the practical approach in this direction. Romania also joined the Bern
Convention on the Conservation of European Wildlife and Natural Habitats, in 1982, which
established the objectives in ensuring the conservation of wild flora and fauna and their
natural habitats. In order to ensure that the member states comply with their obligations,
a permanent body has been set up to watch if the provisions of the convention are
implemented, offering implementation guidance as well. Both conventions indicate invasive
12http://issg.org/database/species
Best practices guide on mapping and assessing wetland ecosystems and their services
61
species as a significant issue requiring the application of effective measures to avoid an
eventual major impact on ecosystems.
In the National Strategy and Action Plan for Biodiversity Conservation 2010 - 2020,
it is noted that at national level there is no clear evidence of the number of allogeneic,
invasive species, the only centralization of the data and the information related to it being
made in the database European DAISIE10. Within this database, are an estimated number
of 700 alien species, by which one in the marine environment, 70 species in the inland
waters, 267 terrestrial invertebrates, 15 vertebrates species, 288 invasive terrestrial plants
and 47 fungus (DAISIE, 2003).
In Romania, according to the National Report Regarding the State of the Environment
for 2015, prepared by the Romanian National Environmental Protection Agency, the
wetlands are one of the most sensitive ecosystems to the biological invasions, facilitating
the creation of ecosystem gaps which threats the structure of the habitats. Taking these
into account, it has been chosen as reference for this pressure the Invasive alien species
in Europe (SEBI 10) indicator, created by EEA.
Below are outlined the most important features regarding the indicator, such as
calculation method and the available data sources to quantify the indicator.
Table 3.17 Invasive alien species
Pressure type: Invasive species
Condition estimation approach: indirect
Indicator: Invasive alien species
Scale: local and national
Indicator description [u.m.]:
This indicator comprises two elements: “The total number of alien species in Europe
since 1990” and “and the most damaging alien species that threaten the biodiversity in
Europe” (EEA, 2009).
The total number of allogenic species in Europe since 1900 is estimated at 10 years’ time
lapse, the data being categorized according to the major ecosystems types, like
mainland, freshwater, and marine ecosystems and is ordered in classes corresponding
to their taxonomic groups: vertebrates, invertebrates, primary producers and fungi.
The list of the most damaging invasive alien species that threaten biodiversity in Europe
distinguishes the most damaging invasive alien species in Europe, for ecosystems and
for taxonomic groups, referring to the impact on European biodiversity and the changes
induced in abundance or extinction of native species. Thus, two main criteria were used
to select the species included in the list:
- The species is recognized by experts as having a significant negative impact on
Europe's biological diversity
- Species, in addition to the negative impact on biodiversity, could have also a
negative impact on human activities, health and/or on economic activities.
13http://www.europe-aliens.org/
Best practices guide on mapping and assessing wetland ecosystems and their services
62
Pressure type: Invasive species
Measure unit: number of species
Calculation method, according to (EEA, 2009):
The total number of allogenic species in Europe, changes since 1900
The data was calculated by existent networks, taking into account the following criteria
specified by the SEBI 2010 experts group:
1. Information are available for the 1990-2007 time span, changes in species
distribution are evaluated at every 10 years, since the reference date and where
it is possible, includes references to the allogenic species before 1900;
2. The database take into account only the first mention of an invasive species to
an area (no multiple counting for the same species);
3. Only the evaluations made by experts will be considered;
4. The database does not includes the species that are not able to reproduce
themselves in the host environment, hence being excluded (accidental
colonisations).
The most damaging alien species which threaten the biodiversity in Europe:
Candidate species were recorded in a provisional list initially selected from national lists
regarding the spatial distribution of invasive species. These lists point out also the spatial
evolution of territories occupied by the alien species. More, other sources were
considered by the experts of SEBI 2010 Group if they fill the assessment criteria as
follows:
1. The species is recognized by experts as having a significant impact on Europe's
biological diversity. "Significantly" refers to, for example:
- significant negative repercussions on the structure and functions of ecosystem;
- induces sharp replacement of indigenous species along of its territorial extension;
- hybridization with indigenous species;
- Threats to the uniqueness of biodiversity (e.g. endemic species).
2. Species, in addition to their impact on biodiversity, could have negative consequences
on human activities, health and / or economic interests (for example, it is a parasite,
pathogen or vector of the disease).
In order to identify the number of invasive alien species and of their share from the
habitat species, there are required in-situ observations to note their presence and extent
in the local environment.
Identifying and reporting the presence of species will be achieved through different
assessment methods (e.g. when identifying invasive fish species, fishing with nets and/
scientific electrofishing, and in the case of identification of invasive plant species, the
evaluation is made by delimiting some transects and visual determinations, the species
being identified with the help of specialty determiners).In the case of plant species it is
recommended that field trips be carried out so that the identification is performed in the
season when the plants are green, possessing characteristic leaves, flowers and fruits
that could induce a faster identification of the species (Anastasiu & Negrean, 2007).
Data sources:
CSI indicators: http://www.eea.europa.eu/data-and-maps/indicators
Best practices guide on mapping and assessing wetland ecosystems and their services
63
Pressure type: Invasive species
Invasive allogeneic species:
http://ec.europa.eu/environment/nature/info/pubs/docs/brochures/invasive_green.
National Biodiversity Strategy and Action Plan for Biodiversity Conservation 2010 -
2020 (http://biodiversitate.mmediu.ro/implementation/legislaie/politici/strategia-
nationala-si-planul-de-actiune-pentru-conservarea-biodiversitatii/)
Proposal for a Regulation on prevention and management of the introduction and
spread of invasive alien species[COM(2013) 620 final –]
Global Invasive Species Database (GISD): http://www.issg.org/database/welcome/
Global Invasive Species Information Network (GISIN) - http://www.gisin.org/
Project: DAISIE - Delivering Alien Invasive Species Inventories for Europe:
http://www.europe-aliens.org/
Project: Assessing Large Scale Environmental Risks for Biodiversity with Tested
Methods (ALARM): http://www.alarmproject.net/alarm/
List of the most invasive allochthones species threatening Europe's biodiversity:
http://www.europe-aliens.org/
Biodiversity Information System for Europe (BISE) : http://biodiversity.europa.eu/
Inventory of invasive species at national level was carried out in various research
projects. For example, a number of invasive aquatic invertebrates were identified at the
Iron Gates natural park through the project "Improving the Conservation Status of Priority
Species and Habitats in the Wet Grid LIFE10 / NAT / 740". It has been demonstrated that
all the invasive species identified create major imbalances within the ecosystems in which
they have adapted, and their control is very difficult due to abundance, reproduction rate
and wide range of physiological tolerances.
Among the invasive species that can be found in the area of the Iron Gates National
Park and which can harm the wetlands can be mentioned:
1. Mammals: Neovison vison - American mink;
2. Fish: Pseudorasbora parva - murgoi pitice; Carassius gibelio - caras; Ameiurus
nebulosus - dwarf sleep;
3. Aquatic invertebrates: Dreissena polymorpha - Zebra clam; Anomalous hemimyse
- red blood shrimps; Eustrongylides sp. - the species of cylindrical worms (nematodes);
4. Aquatic plants: Eichhornia crassipes - water scream; Vallisneria spiralis - rump;
5. Invasive alhotonic plants: Azolla filiculoides - azole; Echinocystis lobata - spiny
pheasant;
6. Invasive autochthonous plants: Trapa natans - corncobs or thistle thistle;
7. Terrestrial plants: Amorpha fruticosa - dwarf acacia; Ailanthus altissima - ash.
However, the data provided in this project refers to the invasive species encountered
throughout the Iron Gate area, but without local customization (in the present case, at the
Divici-Pojejena wetland level). At our country level there is no database to hold the
inventory of all invasive alien species at local level, existing databases at European level
providing data on the number of invasive species only at national level. Identifying the
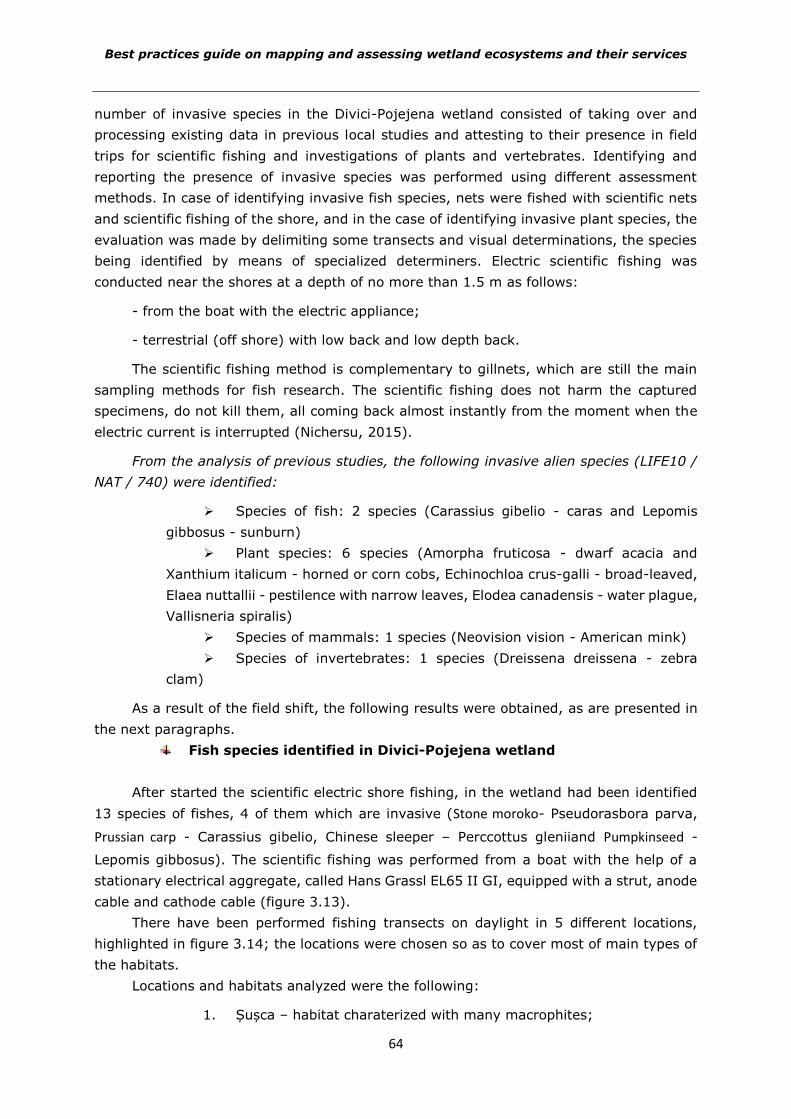
Best practices guide on mapping and assessing wetland ecosystems and their services
64
number of invasive species in the Divici-Pojejena wetland consisted of taking over and
processing existing data in previous local studies and attesting to their presence in field
trips for scientific fishing and investigations of plants and vertebrates. Identifying and
reporting the presence of invasive species was performed using different assessment
methods. In case of identifying invasive fish species, nets were fished with scientific nets
and scientific fishing of the shore, and in the case of identifying invasive plant species, the
evaluation was made by delimiting some transects and visual determinations, the species
being identified by means of specialized determiners. Electric scientific fishing was
conducted near the shores at a depth of no more than 1.5 m as follows:
- from the boat with the electric appliance;
- terrestrial (off shore) with low back and low depth back.
The scientific fishing method is complementary to gillnets, which are still the main
sampling methods for fish research. The scientific fishing does not harm the captured
specimens, do not kill them, all coming back almost instantly from the moment when the
electric current is interrupted (Nichersu, 2015).
From the analysis of previous studies, the following invasive alien species (LIFE10 /
NAT / 740) were identified:
Species of fish: 2 species (Carassius gibelio - caras and Lepomis
gibbosus - sunburn)
Plant species: 6 species (Amorpha fruticosa - dwarf acacia and
Xanthium italicum - horned or corn cobs, Echinochloa crus-galli - broad-leaved,
Elaea nuttallii - pestilence with narrow leaves, Elodea canadensis - water plague,
Vallisneria spiralis)
Species of mammals: 1 species (Neovision vision - American mink)
Species of invertebrates: 1 species (Dreissena dreissena - zebra
clam)
As a result of the field shift, the following results were obtained, as are presented in
the next paragraphs.
Fish species identified in Divici-Pojejena wetland
After started the scientific electric shore fishing, in the wetland had been identified
13 species of fishes, 4 of them which are invasive (Stone moroko- Pseudorasbora parva,
Prussian carp - Carassius gibelio, Chinese sleeper – Perccottus gleniiand Pumpkinseed -
Lepomis gibbosus). The scientific fishing was performed from a boat with the help of a
stationary electrical aggregate, called Hans Grassl EL65 II GI, equipped with a strut, anode
cable and cathode cable (figure 3.13).
There have been performed fishing transects on daylight in 5 different locations,
highlighted in figure 3.14; the locations were chosen so as to cover most of main types of
the habitats.
Locations and habitats analyzed were the following:
1. Șușca – habitat charaterized with many macrophites;
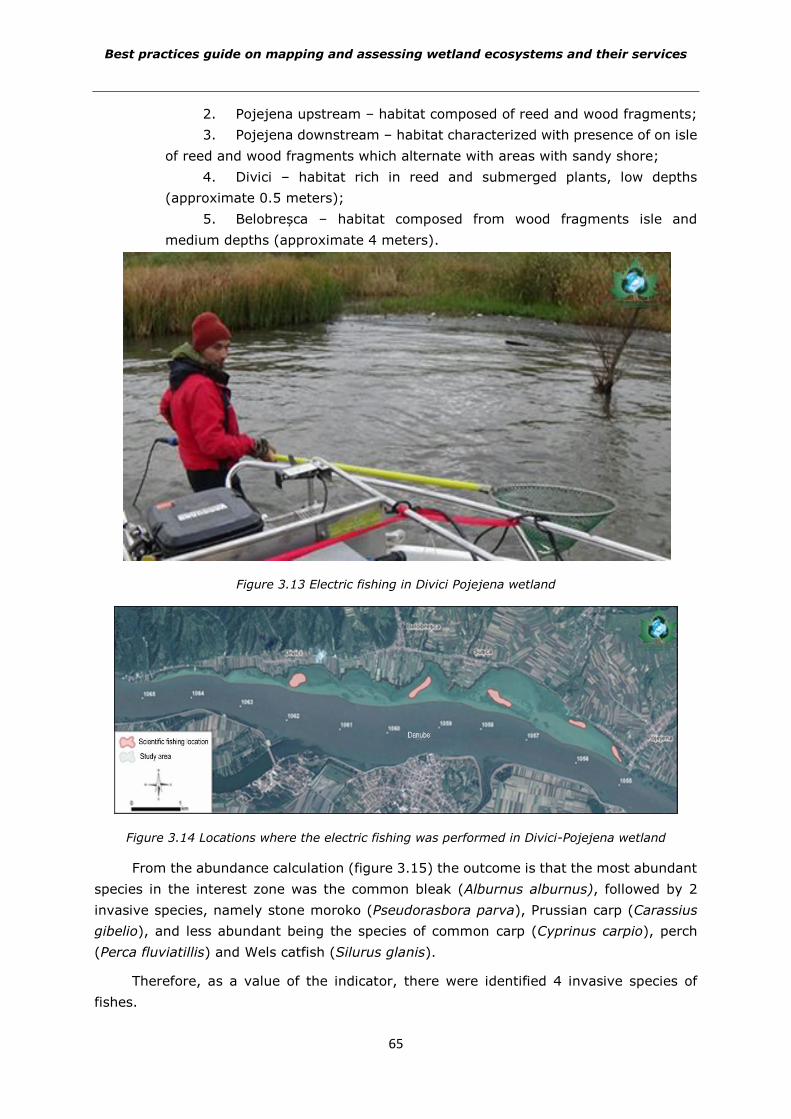
Best practices guide on mapping and assessing wetland ecosystems and their services
65
2. Pojejena upstream – habitat composed of reed and wood fragments;3. Pojejena downstream – habitat characterized with presence of on isle
of reed and wood fragments which alternate with areas with sandy shore; 4. Divici – habitat rich in reed and submerged plants, low depths
(approximate 0.5 meters); 5. Belobreșca – habitat composed from wood fragments isle and
medium depths (approximate 4 meters).
Figure 3.13 Electric fishing in Divici Pojejena wetland
Figure 3.14 Locations where the electric fishing was performed in Divici-Pojejena wetland
From the abundance calculation (figure 3.15) the outcome is that the most abundant
species in the interest zone was the common bleak (Alburnus alburnus), followed by 2
invasive species, namely stone moroko (Pseudorasbora parva), Prussian carp (Carassius
gibelio), and less abundant being the species of common carp (Cyprinus carpio), perch
(Perca fluviatillis) and Wels catfish (Silurus glanis).
Therefore, as a value of the indicator, there were identified 4 invasive species of
fishes.
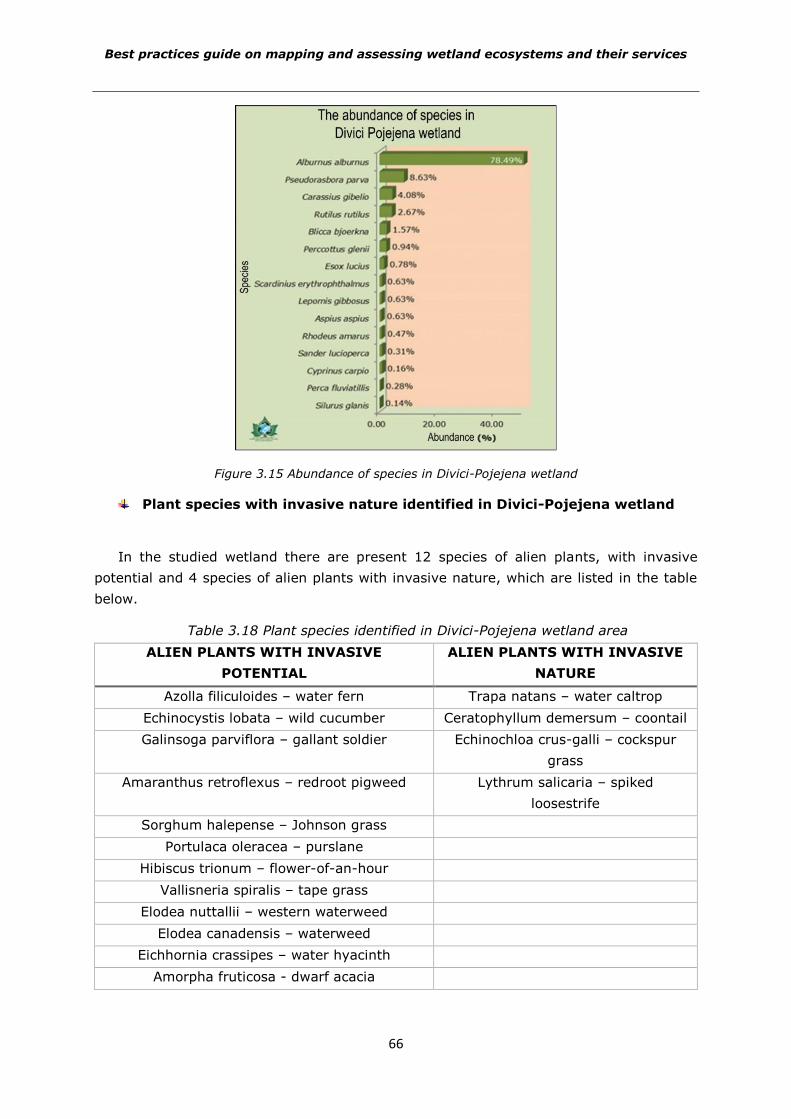
Best practices guide on mapping and assessing wetland ecosystems and their services
66
Figure 3.15 Abundance of species in Divici-Pojejena wetland
Plant species with invasive nature identified in Divici-Pojejena wetland
In the studied wetland there are present 12 species of alien plants, with invasive
potential and 4 species of alien plants with invasive nature, which are listed in the table
below.
Table 3.18 Plant species identified in Divici-Pojejena wetland area
ALIEN PLANTS WITH INVASIVE
POTENTIAL
ALIEN PLANTS WITH INVASIVE
NATURE
Azolla filiculoides – water fern Trapa natans – water caltrop
Echinocystis lobata – wild cucumber Ceratophyllum demersum – coontail
Galinsoga parviflora – gallant soldier Echinochloa crus-galli – cockspur
grass
Amaranthus retroflexus – redroot pigweed Lythrum salicaria – spiked
loosestrife
Sorghum halepense – Johnson grass
Portulaca oleracea – purslane
Hibiscus trionum – flower-of-an-hour
Vallisneria spiralis – tape grass
Elodea nuttallii – western waterweed
Elodea canadensis – waterweed
Eichhornia crassipes – water hyacinth
Amorpha fruticosa - dwarf acacia
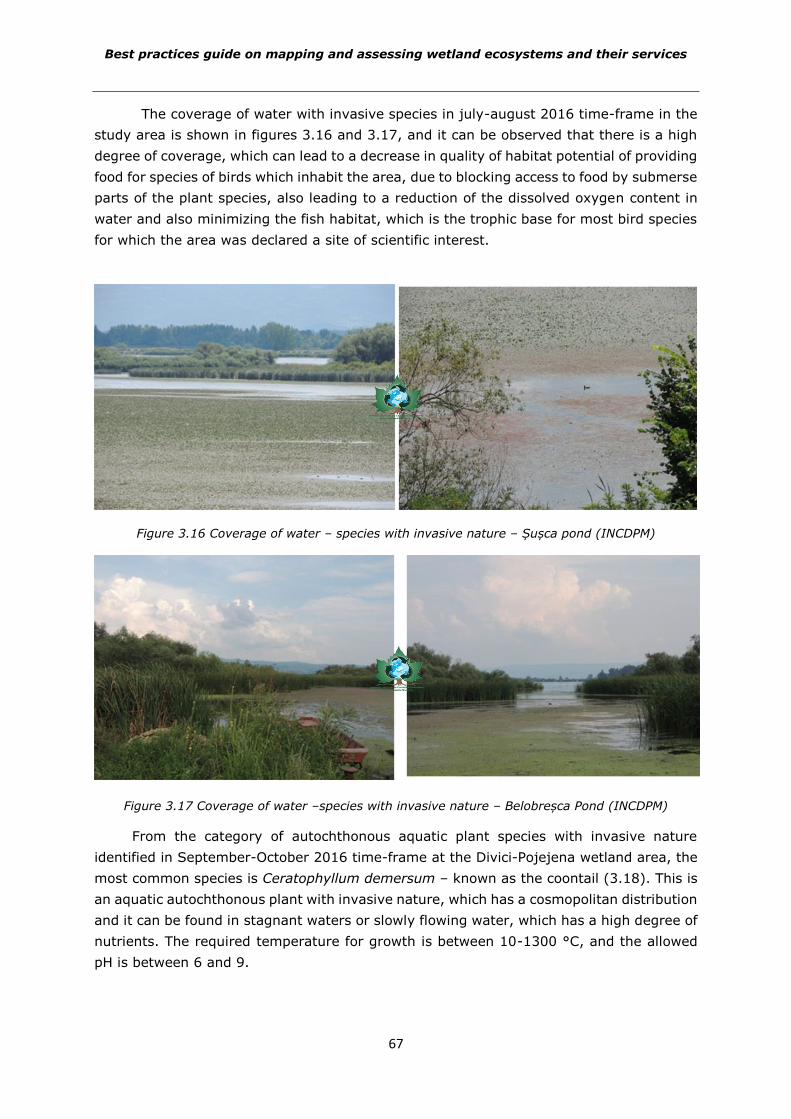
Best practices guide on mapping and assessing wetland ecosystems and their services
67
The coverage of water with invasive species in july-august 2016 time-frame in the
study area is shown in figures 3.16 and 3.17, and it can be observed that there is a high
degree of coverage, which can lead to a decrease in quality of habitat potential of providing
food for species of birds which inhabit the area, due to blocking access to food by submerse
parts of the plant species, also leading to a reduction of the dissolved oxygen content in
water and also minimizing the fish habitat, which is the trophic base for most bird species
for which the area was declared a site of scientific interest.
Figure 3.16 Coverage of water – species with invasive nature – Șușca pond (INCDPM)
Figure 3.17 Coverage of water –species with invasive nature – Belobreșca Pond (INCDPM)
From the category of autochthonous aquatic plant species with invasive nature
identified in September-October 2016 time-frame at the Divici-Pojejena wetland area, the
most common species is Ceratophyllum demersum – known as the coontail (3.18). This is
an aquatic autochthonous plant with invasive nature, which has a cosmopolitan distribution
and it can be found in stagnant waters or slowly flowing water, which has a high degree of
nutrients. The required temperature for growth is between 10-1300 °C, and the allowed
pH is between 6 and 9.
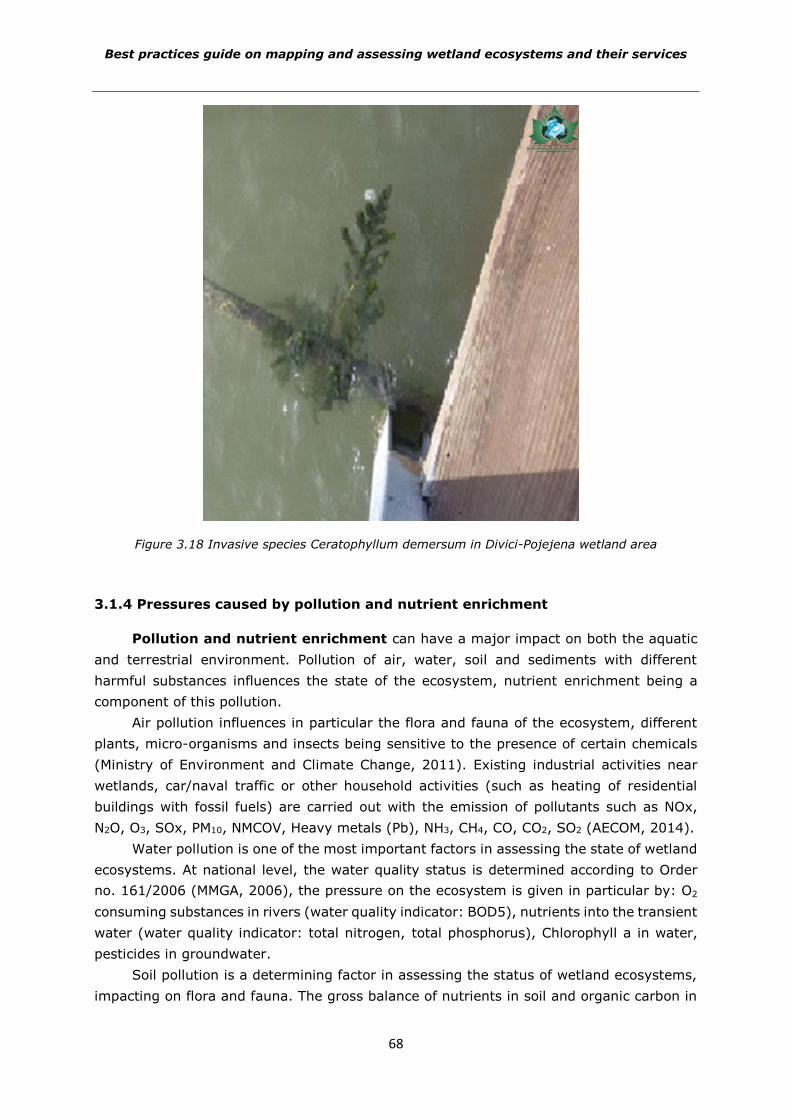
Best practices guide on mapping and assessing wetland ecosystems and their services
68
Figure 3.18 Invasive species Ceratophyllum demersum in Divici-Pojejena wetland area
3.1.4 Pressures caused by pollution and nutrient enrichment
Pollution and nutrient enrichment can have a major impact on both the aquatic
and terrestrial environment. Pollution of air, water, soil and sediments with different
harmful substances influences the state of the ecosystem, nutrient enrichment being a
component of this pollution.
Air pollution influences in particular the flora and fauna of the ecosystem, different
plants, micro-organisms and insects being sensitive to the presence of certain chemicals
(Ministry of Environment and Climate Change, 2011). Existing industrial activities near
wetlands, car/naval traffic or other household activities (such as heating of residential
buildings with fossil fuels) are carried out with the emission of pollutants such as NOx,
N2O, O3, SOx, PM10, NMCOV, Heavy metals (Pb), NH3, CH4, CO, CO2, SO2 (AECOM, 2014).
Water pollution is one of the most important factors in assessing the state of wetland
ecosystems. At national level, the water quality status is determined according to Order
no. 161/2006 (MMGA, 2006), the pressure on the ecosystem is given in particular by: O2
consuming substances in rivers (water quality indicator: BOD5), nutrients into the transient
water (water quality indicator: total nitrogen, total phosphorus), Chlorophyll a in water,
pesticides in groundwater.
Soil pollution is a determining factor in assessing the status of wetland ecosystems,
impacting on flora and fauna. The gross balance of nutrients in soil and organic carbon in
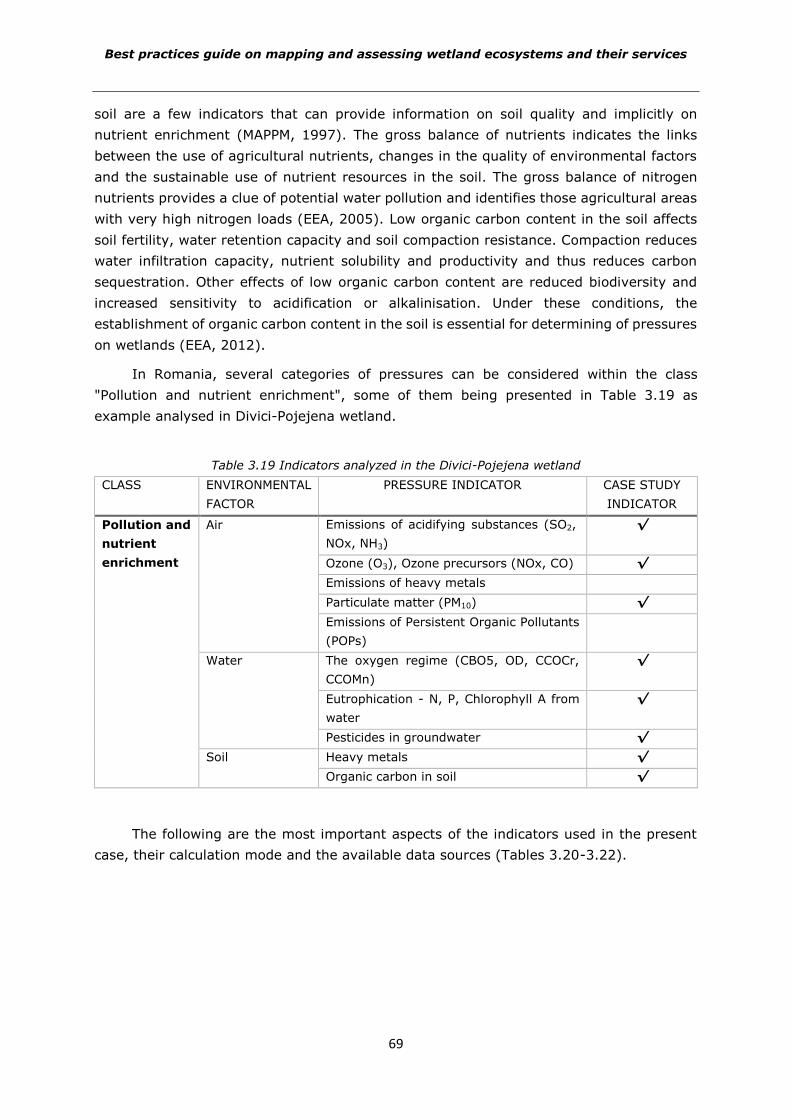
Best practices guide on mapping and assessing wetland ecosystems and their services
69
soil are a few indicators that can provide information on soil quality and implicitly on
nutrient enrichment (MAPPM, 1997). The gross balance of nutrients indicates the links
between the use of agricultural nutrients, changes in the quality of environmental factors
and the sustainable use of nutrient resources in the soil. The gross balance of nitrogen
nutrients provides a clue of potential water pollution and identifies those agricultural areas
with very high nitrogen loads (EEA, 2005). Low organic carbon content in the soil affects
soil fertility, water retention capacity and soil compaction resistance. Compaction reduces
water infiltration capacity, nutrient solubility and productivity and thus reduces carbon
sequestration. Other effects of low organic carbon content are reduced biodiversity and
increased sensitivity to acidification or alkalinisation. Under these conditions, the
establishment of organic carbon content in the soil is essential for determining of pressures
on wetlands (EEA, 2012).
In Romania, several categories of pressures can be considered within the class
"Pollution and nutrient enrichment", some of them being presented in Table 3.19 as
example analysed in Divici-Pojejena wetland.
Table 3.19 Indicators analyzed in the Divici-Pojejena wetland
CLASS ENVIRONMENTAL
FACTOR
PRESSURE INDICATOR CASE STUDY
INDICATOR
Pollution and
nutrient
enrichment
Air Emissions of acidifying substances (SO2,
NOx, NH3)
√
Ozone (O3), Ozone precursors (NOx, CO) √
Emissions of heavy metals
Particulate matter (PM10) √
Emissions of Persistent Organic Pollutants
(POPs)
Water The oxygen regime (CBO5, OD, CCOCr,
CCOMn)
√
Eutrophication - N, P, Chlorophyll A from
water
√
Pesticides in groundwater √
Soil Heavy metals √
Organic carbon in soil √
The following are the most important aspects of the indicators used in the present
case, their calculation mode and the available data sources (Tables 3.20-3.22).
Best practices guide on mapping and assessing wetland ecosystems and their services
70
Table 3.20 Emissions of acidifying substances
Pressure type: Pollution and nutrient
enrichment
Indicator: Emissions of acidifying
substances: SO2, NOX, NH3 in air
Mode of condition estimation: indirect
Scale: national, local
Indicator description [u.m]
The indicator follows the anthropogenic emission trends of acidifying substances:
nitrogen oxides (NOx), ammonia (NH3) and sulfur oxides (SOx, SO2), each of these
taking into account its acidifying potential. The indicator also provides information on
changes in emissions from major sectors: energy production and distribution, industrial
processes, transport, households, others.
Unit of measurement: kilotone, kg equivalents of acidification per inhabitant
Calculation mode:
This indicator can be measured with air quality monitoring equipment (directly on the
ground) or it can be obtained from the annual reports that are declared at national
level.
Data source:
The information is provided by the "National Air Pollutant Emissions Inventory System
(SNIEPA)" within the "Air Quality Assessment Center (CECA)".
National Environmental Protection Agency: national inventory of atmospheric pollutants
covered by Directive 2001/81 / EC and the report on this inventory.
Basic data is available from the EEA Data Service
http://dataservice.eea.europa.eu/dataservice/metadetails.asp?id=1096
Eionet: http://cdr.eionet.europa.eu/ro/un/UNECE_CLRTAP_RO/envur4ihw/
http://cdr.eionet.europa.eu/ro/un/UNECE_CLRTAP_RO/envt0ogrq
(National_emission_projections_2020_Annex_IV
Table 3.21 Indicator for the presence of pesticides in groundwater
Pressure type: Pollution and nutrient
enrichment
Indicator: Pesticides in
groundwater
Mode of condition estimation: indirect
Scale: local
Indicator description [u.m]
The indicator shows the concentration of an active substance or sum of the
concentrations of active substances in the class of pesticides determined in
groundwater. Pesticides contain a mixture of active ingredients and additives. The
active ingredient refers to the active biological part of the pesticide that kills or controls
the pests. Additives interact with the active ingredient to improve their application and
absorption. Among the additives used are solvents, surfactants and carriers.
As a considerable number of households are supplied with drinking water from private
wells, the quality of groundwater must be the same as the drinking water. The
Best practices guide on mapping and assessing wetland ecosystems and their services
71
Pressure type: Pollution and nutrient
enrichment
Indicator: Pesticides in
groundwater
concentration of pesticides in drinking water must not exceed 0,1 μg / L for a single
pesticide and 0,5 μg / L for the total amount of pesticides.
The most common pesticides in Romania's groundwater are: Atrazine, Simazine,
Hexachlorobenzene, Lindane, Diuron, Isoproturon, Alachlor, Desethylatrazine,
Endosulfan, Trifluralin, Chlorfenvinphos, Chlorpyriphos, Bentazon.
Unit of measurement: μg / L,%
Calculation mode:
According to order: O.M. no. 161/2006 for the approval of the Normative regarding
the classification of the surface water quality in order to determine the ecological
status of the water bodies.
Data source:
National Administration "Romanian Waters" (ANAR)
National Agency for Environmental Protection
Table 3.22 Indicator Organic carbon in soil
Pressure type: Pollution and nutrient
enrichment
Indicator:Organic carbon in soil
Mode of condition estimation: indirect
Scale: national
Indicator description [u.m]
The indicator represent the variation of organic carbon content in fertile soil.
Unit of measurement: %, gC / 100 g soil, t C / ha
Calculation mode:
Organic carbon content in the soil for 1 ha is calculated using the following formula:
Tc / ha = [apparent soil density (g / cm3)] x [carbon content in soil (%)] x [10000 (m2
/ ha)] x [0.30 (m)]
Apparent soil density = [dry mass at 105 degrees C soil (g)] / [volume of harvested
soil (cm3)]
The results are statistically processed and presented as average on layers (soil type
respectively), with statistical indices (standard deviation of the string, average error
and upper confidence interval for a 95% coverage probability). Average layer values
are then applied across the entire surface of the layer, resulting the carbon stock in the
soil at that time (initial or monitored).
Data source:
"Marin Drăcea" Forest Research and Development Institute: manages the soil and forest
vegetation monitoring database at country level and develops annual reports on the
state of health of forest vegetation and regular reports on the state of forest soils.
National Research and Development Institute for Pedology, Agrochemistry and
Environmental Protection
County Offices of Pedological and Agrochemical Studies
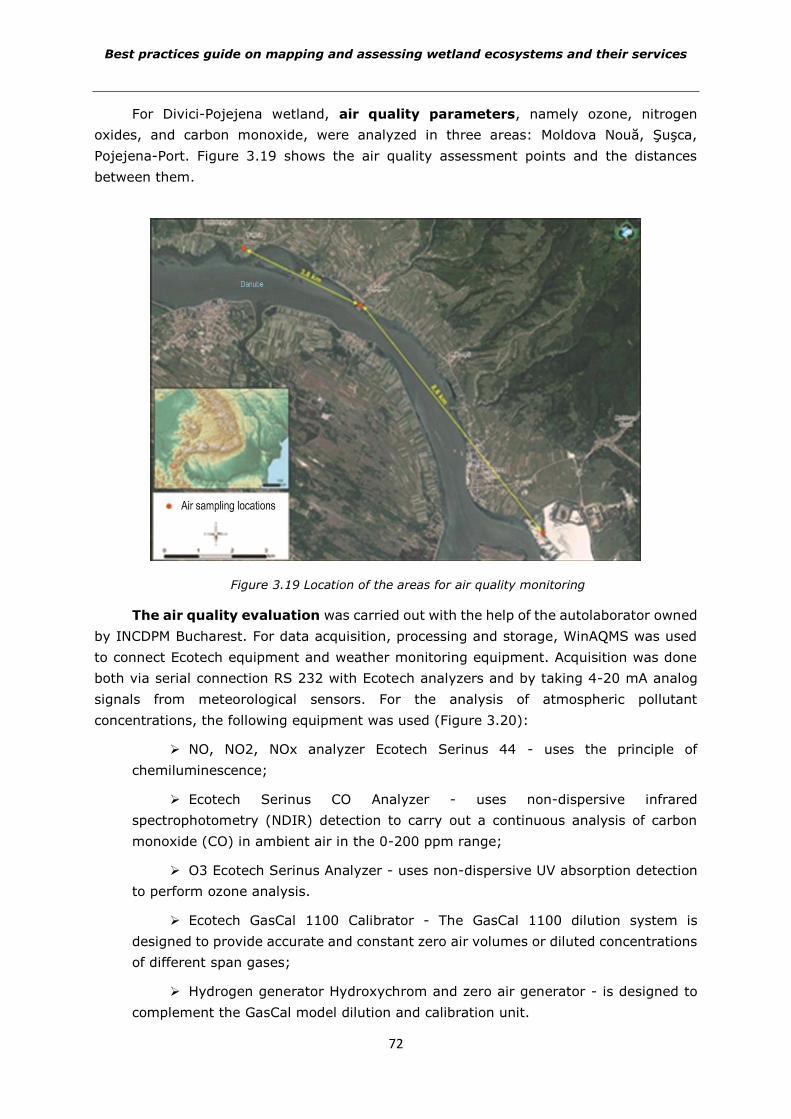
Best practices guide on mapping and assessing wetland ecosystems and their services
72
For Divici-Pojejena wetland, air quality parameters, namely ozone, nitrogen
oxides, and carbon monoxide, were analyzed in three areas: Moldova Nouă, Şuşca,
Pojejena-Port. Figure 3.19 shows the air quality assessment points and the distances
between them.
Figure 3.19 Location of the areas for air quality monitoring
The air quality evaluation was carried out with the help of the autolaborator owned
by INCDPM Bucharest. For data acquisition, processing and storage, WinAQMS was used
to connect Ecotech equipment and weather monitoring equipment. Acquisition was done
both via serial connection RS 232 with Ecotech analyzers and by taking 4-20 mA analog
signals from meteorological sensors. For the analysis of atmospheric pollutant
concentrations, the following equipment was used (Figure 3.20):
NO, NO2, NOx analyzer Ecotech Serinus 44 - uses the principle of
chemiluminescence;
Ecotech Serinus CO Analyzer - uses non-dispersive infrared
spectrophotometry (NDIR) detection to carry out a continuous analysis of carbon
monoxide (CO) in ambient air in the 0-200 ppm range;
O3 Ecotech Serinus Analyzer - uses non-dispersive UV absorption detection
to perform ozone analysis.
Ecotech GasCal 1100 Calibrator - The GasCal 1100 dilution system is
designed to provide accurate and constant zero air volumes or diluted concentrations
of different span gases;
Hydrogen generator Hydroxychrom and zero air generator - is designed to
complement the GasCal model dilution and calibration unit.
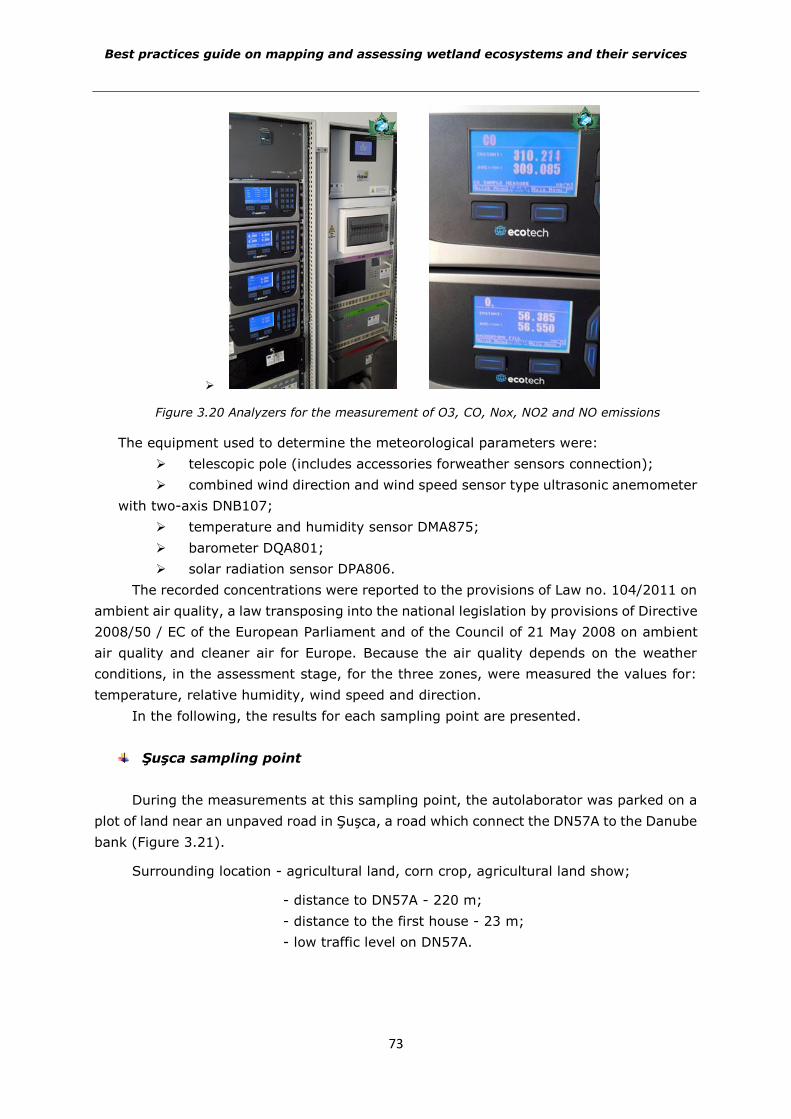
Best practices guide on mapping and assessing wetland ecosystems and their services
73
Figure 3.20 Analyzers for the measurement of O3, CO, Nox, NO2 and NO emissions
The equipment used to determine the meteorological parameters were:
telescopic pole (includes accessories forweather sensors connection);
combined wind direction and wind speed sensor type ultrasonic anemometer
with two-axis DNB107;
temperature and humidity sensor DMA875;
barometer DQA801;
solar radiation sensor DPA806.
The recorded concentrations were reported to the provisions of Law no. 104/2011 on
ambient air quality, a law transposing into the national legislation by provisions of Directive
2008/50 / EC of the European Parliament and of the Council of 21 May 2008 on ambient
air quality and cleaner air for Europe. Because the air quality depends on the weather
conditions, in the assessment stage, for the three zones, were measured the values for:
temperature, relative humidity, wind speed and direction.
In the following, the results for each sampling point are presented.
Şuşca sampling point
During the measurements at this sampling point, the autolaborator was parked on a
plot of land near an unpaved road in Şuşca, a road which connect the DN57A to the Danube
bank (Figure 3.21).
Surrounding location - agricultural land, corn crop, agricultural land show;
- distance to DN57A - 220 m;
- distance to the first house - 23 m;
- low traffic level on DN57A.
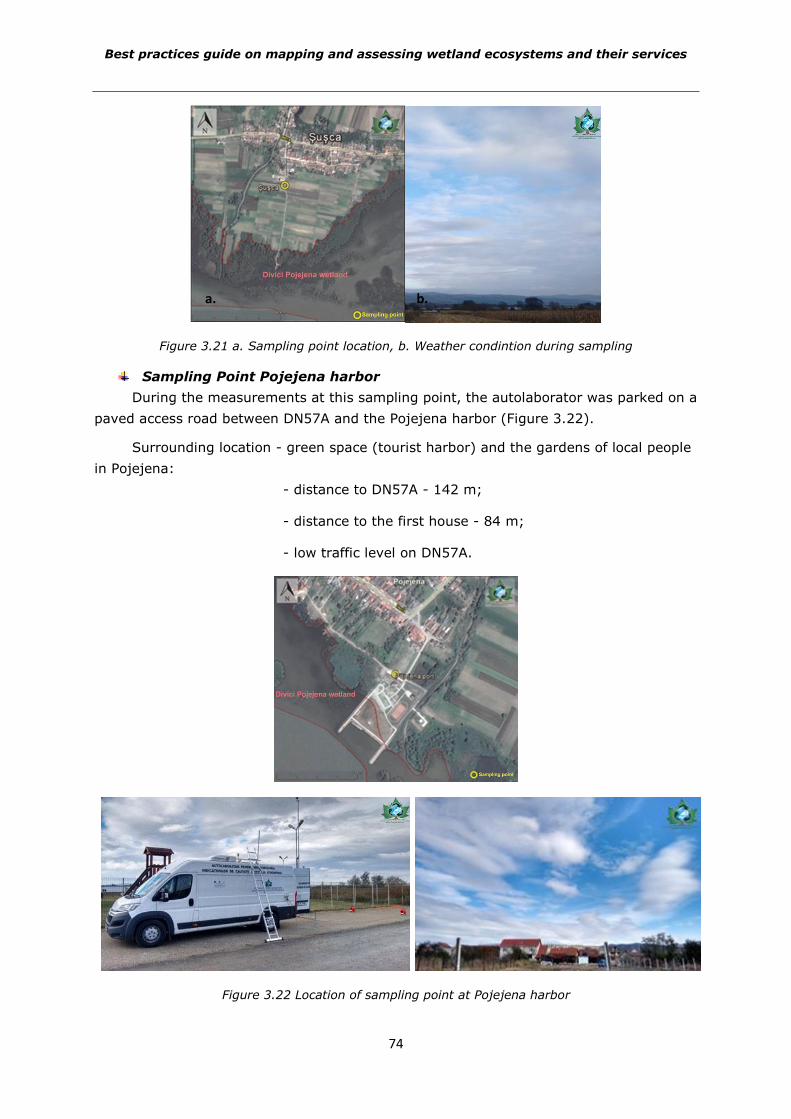
Best practices guide on mapping and assessing wetland ecosystems and their services
74
Figure 3.21 a. Sampling point location, b. Weather condintion during sampling
Sampling Point Pojejena harbor
During the measurements at this sampling point, the autolaborator was parked on a
paved access road between DN57A and the Pojejena harbor (Figure 3.22).
Surrounding location - green space (tourist harbor) and the gardens of local people
in Pojejena:
- distance to DN57A - 142 m;
- distance to the first house - 84 m;
- low traffic level on DN57A.
Figure 3.22 Location of sampling point at Pojejena harbor
a. b.
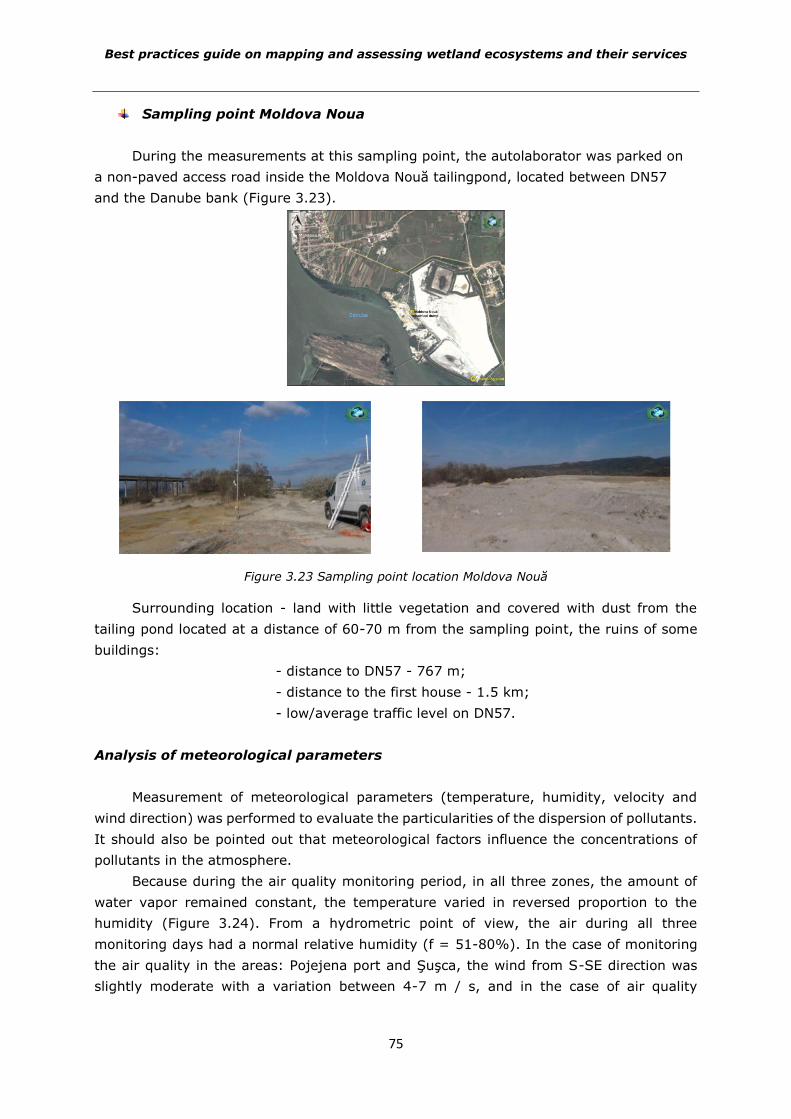
Best practices guide on mapping and assessing wetland ecosystems and their services
75
Sampling point Moldova Noua
During the measurements at this sampling point, the autolaborator was parked on
a non-paved access road inside the Moldova Nouă tailingpond, located between DN57
and the Danube bank (Figure 3.23).
Figure 3.23 Sampling point location Moldova Nouă
Surrounding location - land with little vegetation and covered with dust from the
tailing pond located at a distance of 60-70 m from the sampling point, the ruins of some
buildings:
- distance to DN57 - 767 m;
- distance to the first house - 1.5 km;
- low/average traffic level on DN57.
Analysis of meteorological parameters
Measurement of meteorological parameters (temperature, humidity, velocity and
wind direction) was performed to evaluate the particularities of the dispersion of pollutants.
It should also be pointed out that meteorological factors influence the concentrations of
pollutants in the atmosphere.
Because during the air quality monitoring period, in all three zones, the amount of
water vapor remained constant, the temperature varied in reversed proportion to the
humidity (Figure 3.24). From a hydrometric point of view, the air during all three
monitoring days had a normal relative humidity (f = 51-80%). In the case of monitoring
the air quality in the areas: Pojejena port and Şuşca, the wind from S-SE direction was
slightly moderate with a variation between 4-7 m / s, and in the case of air quality
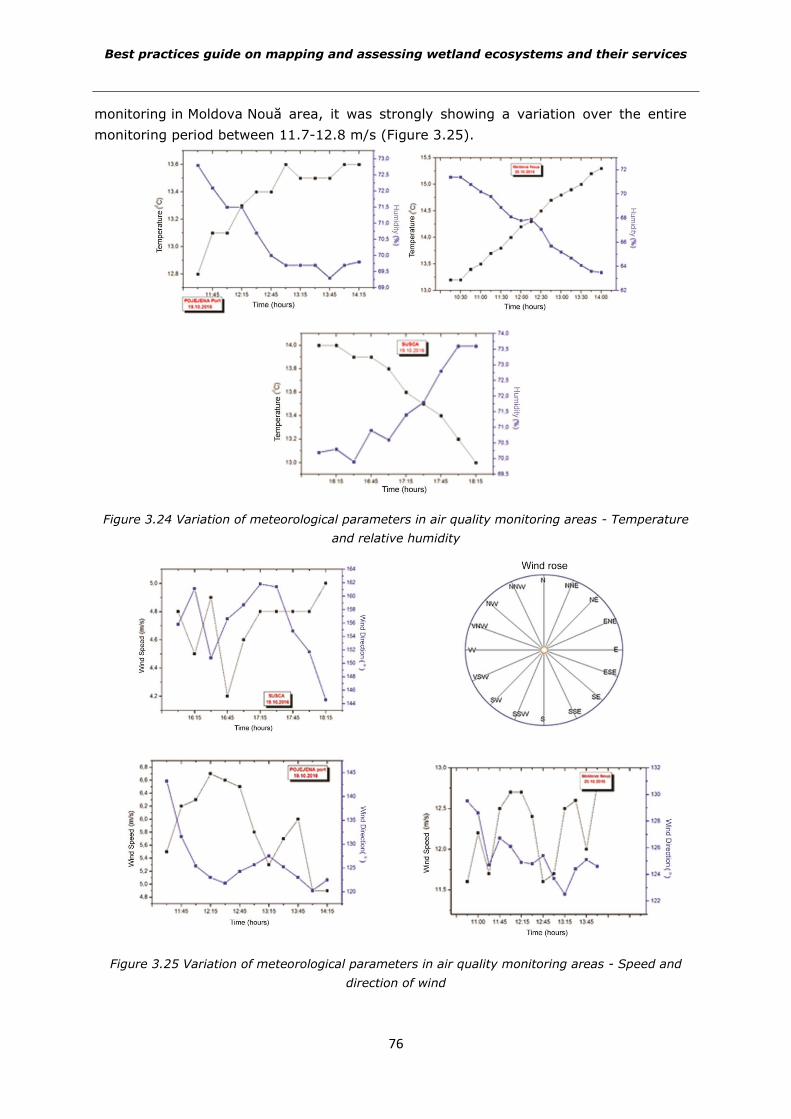
Best practices guide on mapping and assessing wetland ecosystems and their services
76
monitoring in Moldova Nouă area, it was strongly showing a variation over the entire
monitoring period between 11.7-12.8 m/s (Figure 3.25).
Figure 3.24 Variation of meteorological parameters in air quality monitoring areas - Temperature
and relative humidity
Figure 3.25 Variation of meteorological parameters in air quality monitoring areas - Speed and
direction of wind
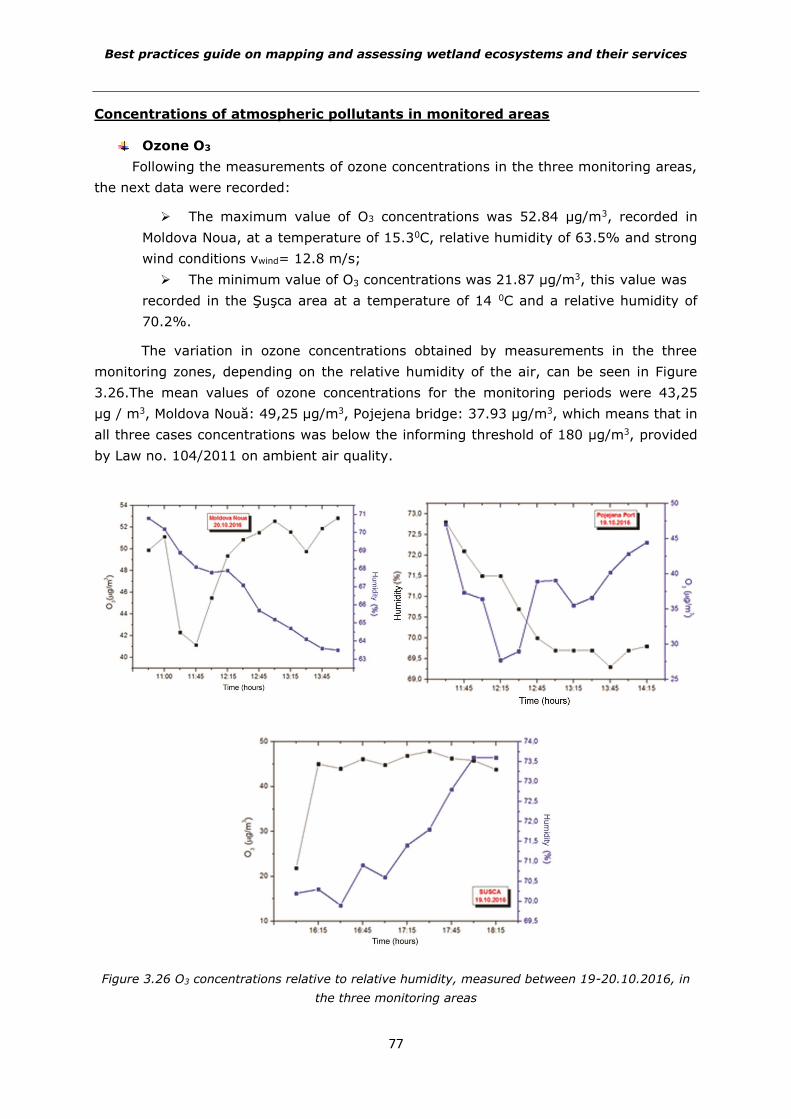
Best practices guide on mapping and assessing wetland ecosystems and their services
77
Concentrations of atmospheric pollutants in monitored areas
Ozone O3
Following the measurements of ozone concentrations in the three monitoring areas,
the next data were recorded:
The maximum value of O3 concentrations was 52.84 μg/m3, recorded in
Moldova Noua, at a temperature of 15.30C, relative humidity of 63.5% and strong
wind conditions vwind= 12.8 m/s;
The minimum value of O3 concentrations was 21.87 μg/m3, this value was
recorded in the Şuşca area at a temperature of 14 0C and a relative humidity of
70.2%.
The variation in ozone concentrations obtained by measurements in the three
monitoring zones, depending on the relative humidity of the air, can be seen in Figure
3.26.The mean values of ozone concentrations for the monitoring periods were 43,25
μg / m3, Moldova Nouă: 49,25 μg/m3, Pojejena bridge: 37.93 μg/m3, which means that in
all three cases concentrations was below the informing threshold of 180 μg/m3, provided
by Law no. 104/2011 on ambient air quality.
Figure 3.26 O3 concentrations relative to relative humidity, measured between 19-20.10.2016, in
the three monitoring areas
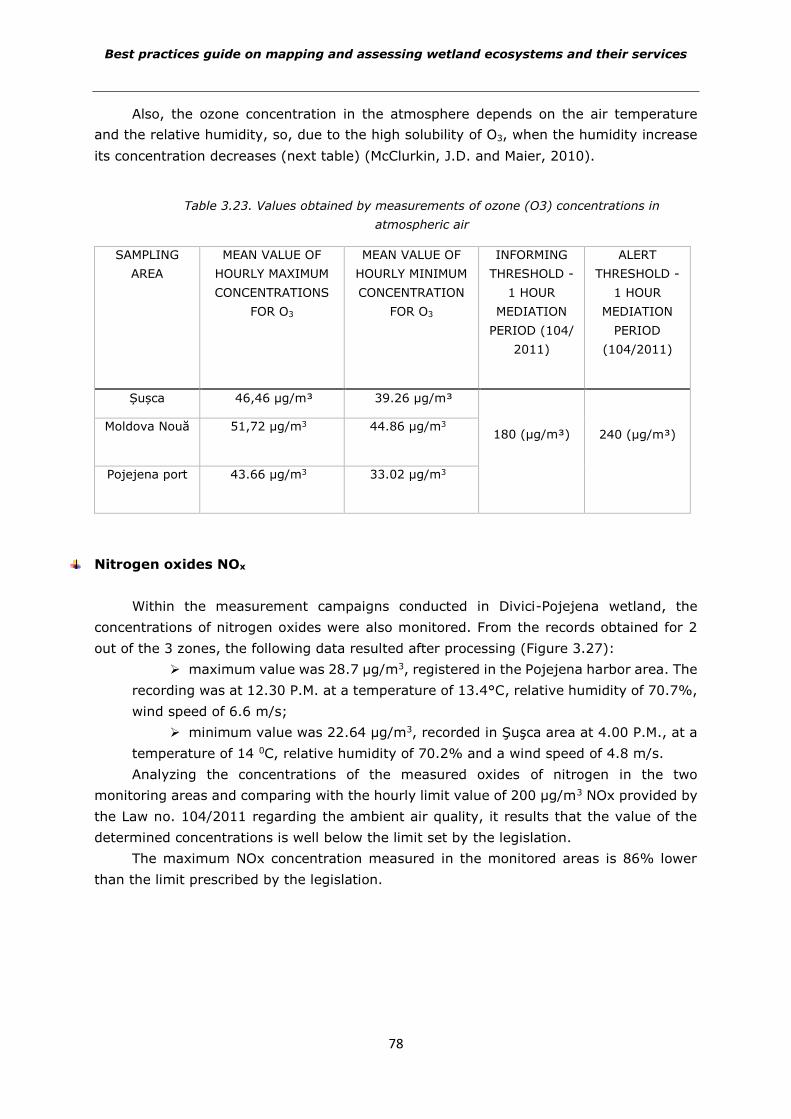
Best practices guide on mapping and assessing wetland ecosystems and their services
78
Also, the ozone concentration in the atmosphere depends on the air temperature
and the relative humidity, so, due to the high solubility of O3, when the humidity increase
its concentration decreases (next table) (McClurkin, J.D. and Maier, 2010).
Table 3.23. Values obtained by measurements of ozone (O3) concentrations in
atmospheric air
SAMPLING
AREA
MEAN VALUE OF
HOURLY MAXIMUM
CONCENTRATIONS
FOR O3
MEAN VALUE OF
HOURLY MINIMUM
CONCENTRATION
FOR O3
INFORMING
THRESHOLD -
1 HOUR
MEDIATION
PERIOD (104/
2011)
ALERT
THRESHOLD -
1 HOUR
MEDIATION
PERIOD
(104/2011)
Șușca 46,46 μg/m³ 39.26 μg/m³
180 (μg/m³) 240 (μg/m³) Moldova Nouă 51,72 µg/m3 44.86 µg/m3
Pojejena port 43.66 µg/m3 33.02 µg/m3
Nitrogen oxides NOx
Within the measurement campaigns conducted in Divici-Pojejena wetland, the
concentrations of nitrogen oxides were also monitored. From the records obtained for 2
out of the 3 zones, the following data resulted after processing (Figure 3.27):
maximum value was 28.7 μg/m3, registered in the Pojejena harbor area. The
recording was at 12.30 P.M. at a temperature of 13.4°C, relative humidity of 70.7%,
wind speed of 6.6 m/s;
minimum value was 22.64 μg/m3, recorded in Şuşca area at 4.00 P.M., at a
temperature of 14 0C, relative humidity of 70.2% and a wind speed of 4.8 m/s.
Analyzing the concentrations of the measured oxides of nitrogen in the two
monitoring areas and comparing with the hourly limit value of 200 μg/m3 NOx provided by
the Law no. 104/2011 regarding the ambient air quality, it results that the value of the
determined concentrations is well below the limit set by the legislation.
The maximum NOx concentration measured in the monitored areas is 86% lower
than the limit prescribed by the legislation.
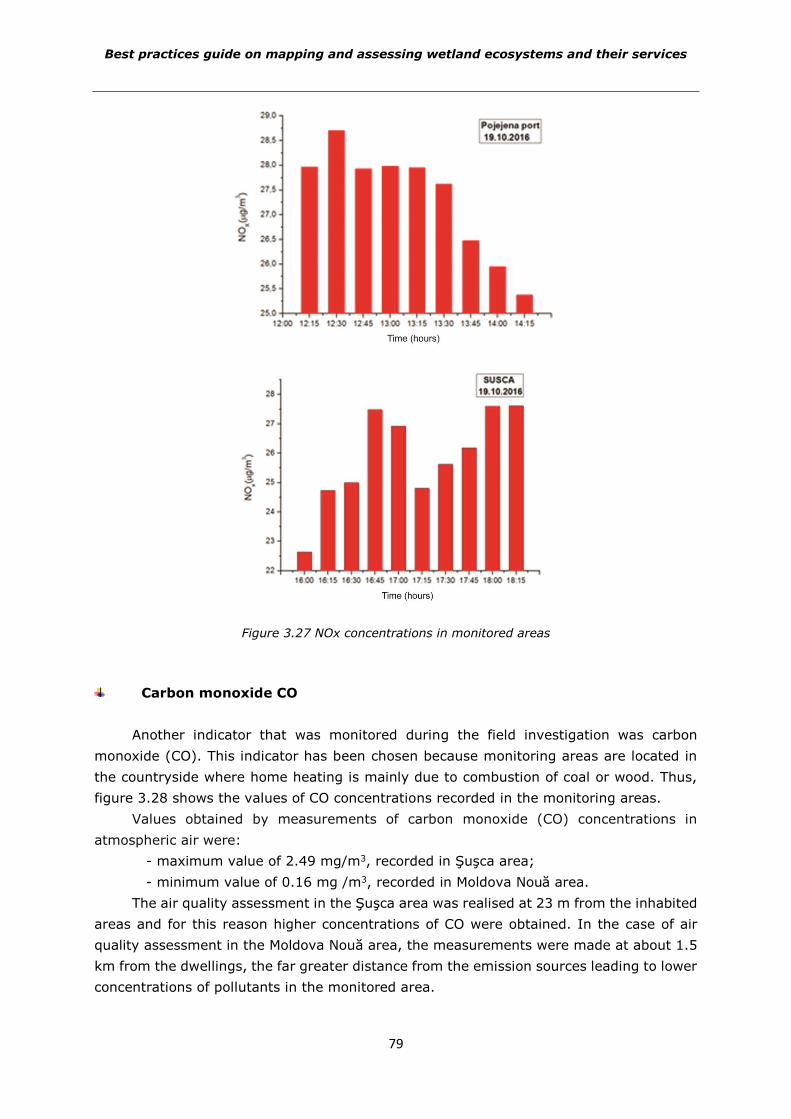
Best practices guide on mapping and assessing wetland ecosystems and their services
79
Figure 3.27 NOx concentrations in monitored areas
Carbon monoxide CO
Another indicator that was monitored during the field investigation was carbon
monoxide (CO). This indicator has been chosen because monitoring areas are located in
the countryside where home heating is mainly due to combustion of coal or wood. Thus,
figure 3.28 shows the values of CO concentrations recorded in the monitoring areas.
Values obtained by measurements of carbon monoxide (CO) concentrations in
atmospheric air were:
- maximum value of 2.49 mg/m3, recorded in Şuşca area;
- minimum value of 0.16 mg /m3, recorded in Moldova Nouă area.
The air quality assessment in the Şuşca area was realised at 23 m from the inhabited
areas and for this reason higher concentrations of CO were obtained. In the case of air
quality assessment in the Moldova Nouă area, the measurements were made at about 1.5
km from the dwellings, the far greater distance from the emission sources leading to lower
concentrations of pollutants in the monitored area.
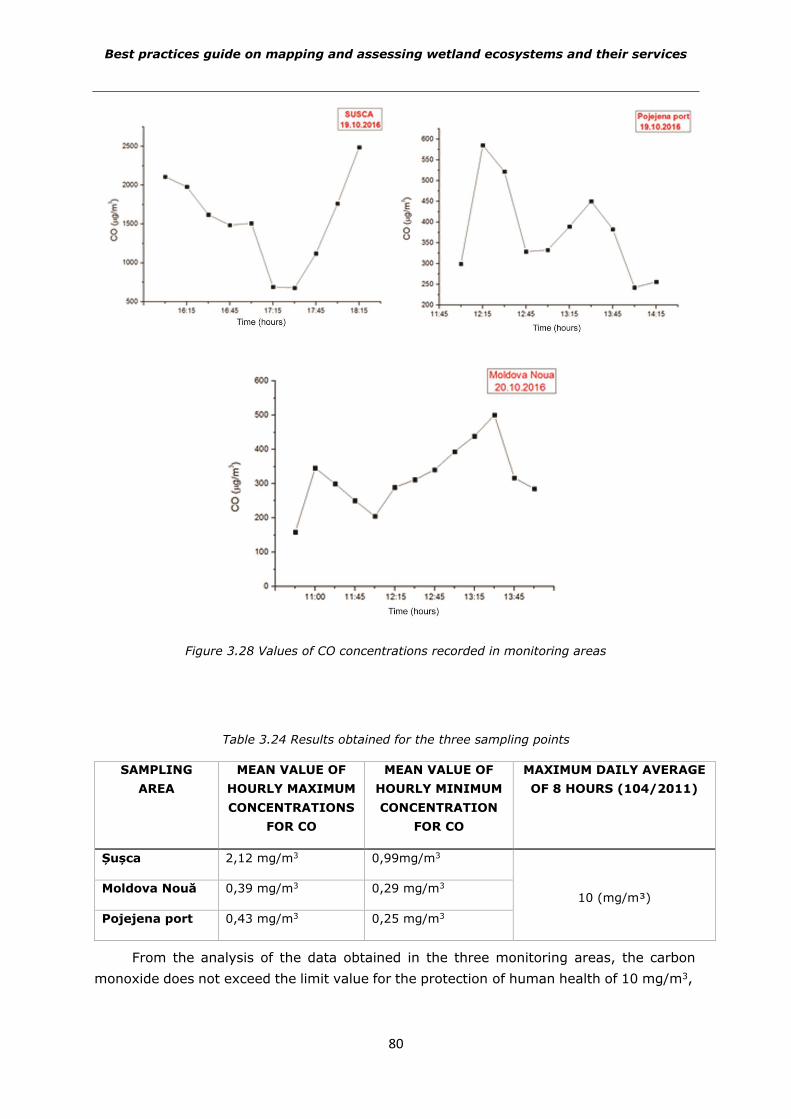
Best practices guide on mapping and assessing wetland ecosystems and their services
80
Figure 3.28 Values of CO concentrations recorded in monitoring areas
Table 3.24 Results obtained for the three sampling points
SAMPLING
AREA
MEAN VALUE OF
HOURLY MAXIMUM
CONCENTRATIONS
FOR CO
MEAN VALUE OF
HOURLY MINIMUM
CONCENTRATION
FOR CO
MAXIMUM DAILY AVERAGE
OF 8 HOURS (104/2011)
Șușca 2,12 mg/m3 0,99mg/m3
10 (mg/m³) Moldova Nouă 0,39 mg/m3 0,29 mg/m3
Pojejena port 0,43 mg/m3 0,25 mg/m3
From the analysis of the data obtained in the three monitoring areas, the carbon
monoxide does not exceed the limit value for the protection of human health of 10 mg/m3,
Best practices guide on mapping and assessing wetland ecosystems and their services
81
according to the Law no. 104 / 2011 regarding the ambient air quality, the values
obtained being below this limit.
Particulate matter PM10
For Moldova Noua area, the air quality was also assessed from the point of view of
particulate matter due to the existence of tailingpond which can contribute substantially
to atmospheric pollution. Data shown in Figure 3.29 is the daily average of hourly PM10
concentrations.
Figure 3.29 The values of concentrations for PM10 measured in Moldova Noua area (Data Source: NEPA, National Air Quality Monitoring Network)
With regard to the PM10 concentration in air, according to Law 104/2011, the limit
value for the protection of human health is 50 μg/m3. In October 2016, this value was not
exceeded in the monitored area near Moldova Noua (CS3 Monitoring Station of the National
Air Quality Monitoring Network).
From the air quality point of view in the monitored areas, it can be stated that this is
very good, for none of the monitored indicators being recorded exceedances of the limit
values provided by the Law 104/2011 on the ambient air quality. At national level, the
quality of the bodies of water is asessed according to Order no. 161/2006 (MMGA, 2006),
the pressure on the ecosystem being given in particular by: Oxygen status indicators
(water quality indicator: CBO5, OD, CCO), indicators for the eutrophication process - N, P,
chlorophyll "a" from water, pesticides from groundwater.
In the following are briefly presented the characteristics of the indicators analyzed
as well as information on pesticides in groundwater:
o For Biochemical Oxygen Consumption in 5 Days (CBO5) and Chemical
Oxygen Consumption by Oxidation with Potassium Permanganate in Acidic
Environment (CCO-Mn) the values indicate that the surface water at the
sampling points is in Class I;
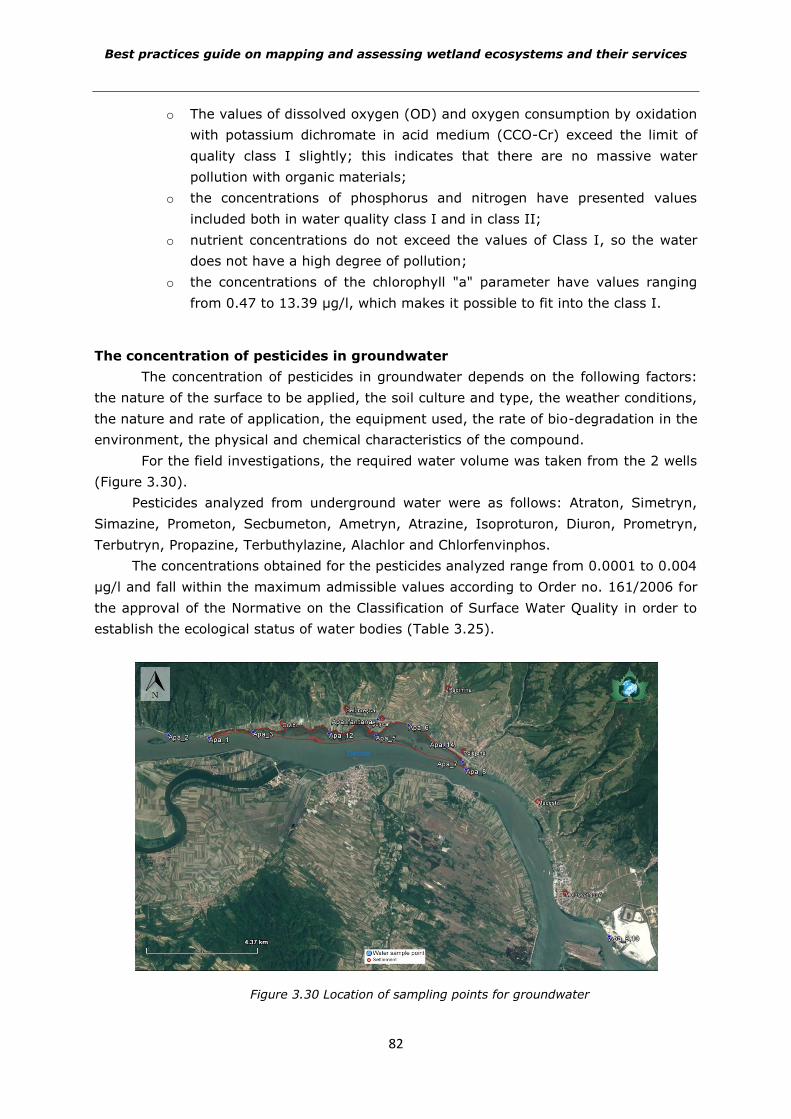
Best practices guide on mapping and assessing wetland ecosystems and their services
82
o The values of dissolved oxygen (OD) and oxygen consumption by oxidation
with potassium dichromate in acid medium (CCO-Cr) exceed the limit of
quality class I slightly; this indicates that there are no massive water
pollution with organic materials;
o the concentrations of phosphorus and nitrogen have presented values
included both in water quality class I and in class II;
o nutrient concentrations do not exceed the values of Class I, so the water
does not have a high degree of pollution;
o the concentrations of the chlorophyll "a" parameter have values ranging
from 0.47 to 13.39 μg/l, which makes it possible to fit into the class I.
The concentration of pesticides in groundwater
The concentration of pesticides in groundwater depends on the following factors:
the nature of the surface to be applied, the soil culture and type, the weather conditions,
the nature and rate of application, the equipment used, the rate of bio-degradation in the
environment, the physical and chemical characteristics of the compound.
For the field investigations, the required water volume was taken from the 2 wells
(Figure 3.30).
Pesticides analyzed from underground water were as follows: Atraton, Simetryn,
Simazine, Prometon, Secbumeton, Ametryn, Atrazine, Isoproturon, Diuron, Prometryn,
Terbutryn, Propazine, Terbuthylazine, Alachlor and Chlorfenvinphos.
The concentrations obtained for the pesticides analyzed range from 0.0001 to 0.004
μg/l and fall within the maximum admissible values according to Order no. 161/2006 for
the approval of the Normative on the Classification of Surface Water Quality in order to
establish the ecological status of water bodies (Table 3.25).
Figure 3.30 Location of sampling points for groundwater
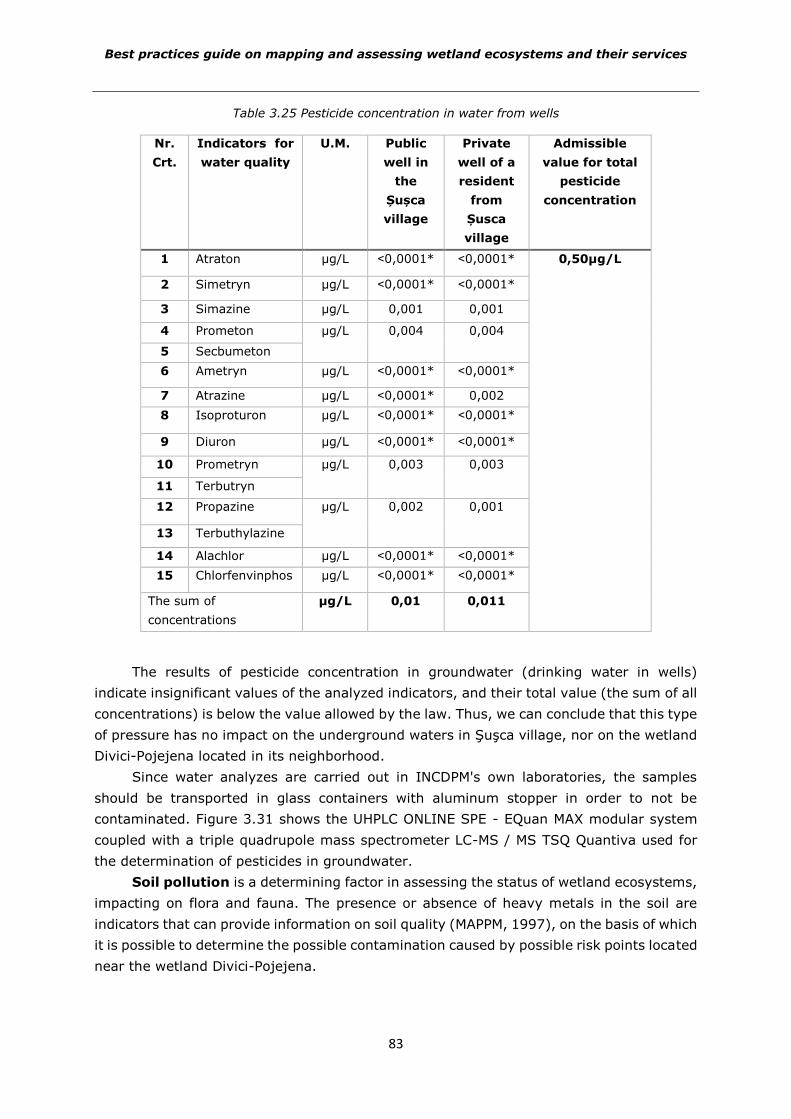
Best practices guide on mapping and assessing wetland ecosystems and their services
83
Table 3.25 Pesticide concentration in water from wells
Nr.
Crt.
Indicators for
water quality
U.M. Public
well in
the
Șușca
village
Private
well of a
resident
from
Șusca
village
Admissible
value for total
pesticide
concentration
1 Atraton µg/L ˂0,0001* ˂0,0001* 0,50µg/L
2 Simetryn µg/L ˂0,0001* ˂0,0001*
3 Simazine µg/L 0,001 0,001
4 Prometon µg/L 0,004 0,004
5 Secbumeton
6 Ametryn µg/L ˂0,0001* ˂0,0001*
7 Atrazine µg/L ˂0,0001* 0,002
8 Isoproturon µg/L ˂0,0001* ˂0,0001*
9 Diuron µg/L ˂0,0001* ˂0,0001*
10 Prometryn µg/L 0,003 0,003
11 Terbutryn
12 Propazine µg/L 0,002 0,001
13 Terbuthylazine
14 Alachlor µg/L ˂0,0001* ˂0,0001*
15 Chlorfenvinphos µg/L ˂0,0001* ˂0,0001*
The sum of
concentrations
µg/L 0,01 0,011
The results of pesticide concentration in groundwater (drinking water in wells)
indicate insignificant values of the analyzed indicators, and their total value (the sum of all
concentrations) is below the value allowed by the law. Thus, we can conclude that this type
of pressure has no impact on the underground waters in Şuşca village, nor on the wetland
Divici-Pojejena located in its neighborhood.
Since water analyzes are carried out in INCDPM's own laboratories, the samples
should be transported in glass containers with aluminum stopper in order to not be
contaminated. Figure 3.31 shows the UHPLC ONLINE SPE - EQuan MAX modular system
coupled with a triple quadrupole mass spectrometer LC-MS / MS TSQ Quantiva used for
the determination of pesticides in groundwater.
Soil pollution is a determining factor in assessing the status of wetland ecosystems,
impacting on flora and fauna. The presence or absence of heavy metals in the soil are
indicators that can provide information on soil quality (MAPPM, 1997), on the basis of which
it is possible to determine the possible contamination caused by possible risk points located
near the wetland Divici-Pojejena.
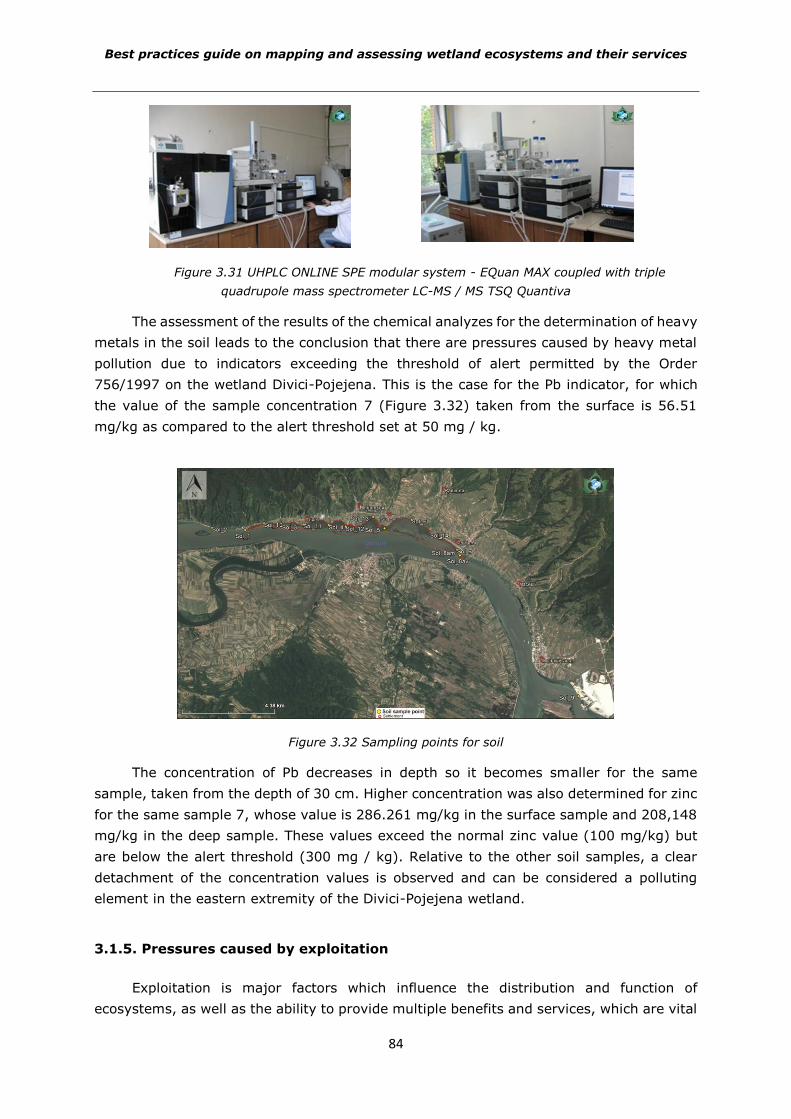
Best practices guide on mapping and assessing wetland ecosystems and their services
84
Figure 3.31 UHPLC ONLINE SPE modular system - EQuan MAX coupled with triple
quadrupole mass spectrometer LC-MS / MS TSQ Quantiva
The assessment of the results of the chemical analyzes for the determination of heavy
metals in the soil leads to the conclusion that there are pressures caused by heavy metal
pollution due to indicators exceeding the threshold of alert permitted by the Order
756/1997 on the wetland Divici-Pojejena. This is the case for the Pb indicator, for which
the value of the sample concentration 7 (Figure 3.32) taken from the surface is 56.51
mg/kg as compared to the alert threshold set at 50 mg / kg.
Figure 3.32 Sampling points for soil
The concentration of Pb decreases in depth so it becomes smaller for the same
sample, taken from the depth of 30 cm. Higher concentration was also determined for zinc
for the same sample 7, whose value is 286.261 mg/kg in the surface sample and 208,148
mg/kg in the deep sample. These values exceed the normal zinc value (100 mg/kg) but
are below the alert threshold (300 mg / kg). Relative to the other soil samples, a clear
detachment of the concentration values is observed and can be considered a polluting
element in the eastern extremity of the Divici-Pojejena wetland.
3.1.5. Pressures caused by exploitation
Exploitation is major factors which influence the distribution and function of
ecosystems, as well as the ability to provide multiple benefits and services, which are vital
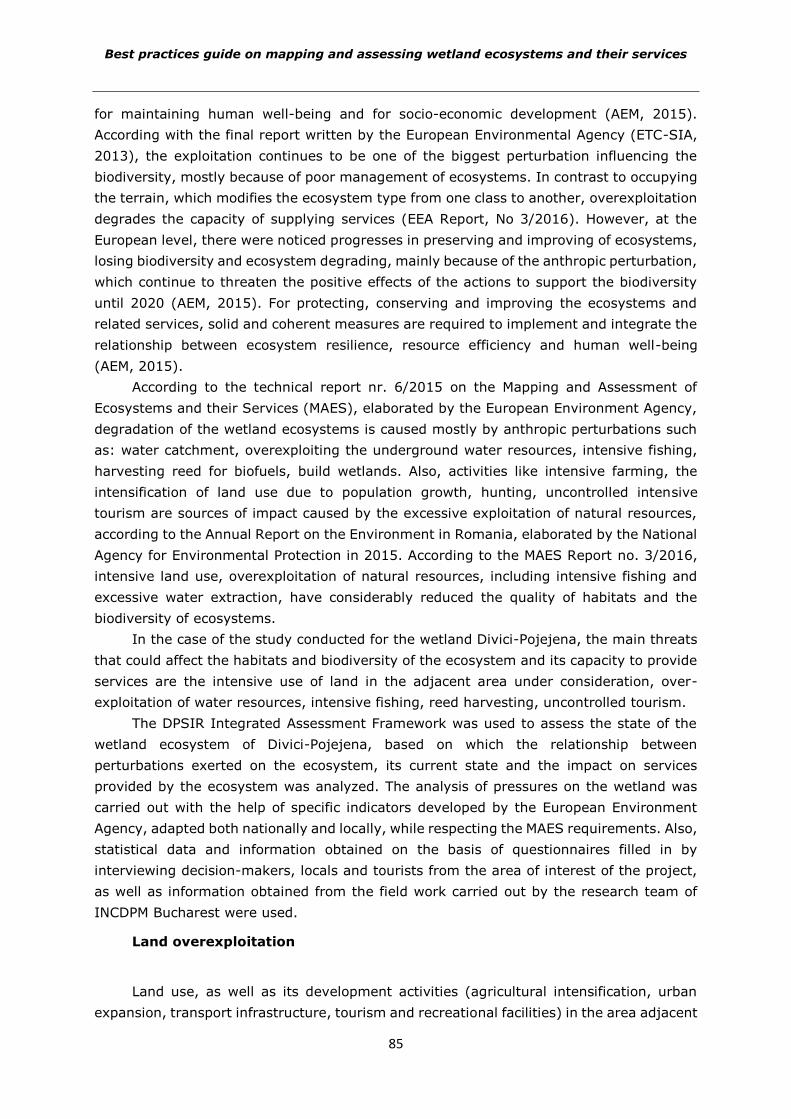
Best practices guide on mapping and assessing wetland ecosystems and their services
85
for maintaining human well-being and for socio-economic development (AEM, 2015).
According with the final report written by the European Environmental Agency (ETC-SIA,
2013), the exploitation continues to be one of the biggest perturbation influencing the
biodiversity, mostly because of poor management of ecosystems. In contrast to occupying
the terrain, which modifies the ecosystem type from one class to another, overexploitation
degrades the capacity of supplying services (EEA Report, No 3/2016). However, at the
European level, there were noticed progresses in preserving and improving of ecosystems,
losing biodiversity and ecosystem degrading, mainly because of the anthropic perturbation,
which continue to threaten the positive effects of the actions to support the biodiversity
until 2020 (AEM, 2015). For protecting, conserving and improving the ecosystems and
related services, solid and coherent measures are required to implement and integrate the
relationship between ecosystem resilience, resource efficiency and human well-being
(AEM, 2015).
According to the technical report nr. 6/2015 on the Mapping and Assessment of
Ecosystems and their Services (MAES), elaborated by the European Environment Agency,
degradation of the wetland ecosystems is caused mostly by anthropic perturbations such
as: water catchment, overexploiting the underground water resources, intensive fishing,
harvesting reed for biofuels, build wetlands. Also, activities like intensive farming, the
intensification of land use due to population growth, hunting, uncontrolled intensive
tourism are sources of impact caused by the excessive exploitation of natural resources,
according to the Annual Report on the Environment in Romania, elaborated by the National
Agency for Environmental Protection in 2015. According to the MAES Report no. 3/2016,
intensive land use, overexploitation of natural resources, including intensive fishing and
excessive water extraction, have considerably reduced the quality of habitats and the
biodiversity of ecosystems.
In the case of the study conducted for the wetland Divici-Pojejena, the main threats
that could affect the habitats and biodiversity of the ecosystem and its capacity to provide
services are the intensive use of land in the adjacent area under consideration, over-
exploitation of water resources, intensive fishing, reed harvesting, uncontrolled tourism.
The DPSIR Integrated Assessment Framework was used to assess the state of the
wetland ecosystem of Divici-Pojejena, based on which the relationship between
perturbations exerted on the ecosystem, its current state and the impact on services
provided by the ecosystem was analyzed. The analysis of pressures on the wetland was
carried out with the help of specific indicators developed by the European Environment
Agency, adapted both nationally and locally, while respecting the MAES requirements. Also,
statistical data and information obtained on the basis of questionnaires filled in by
interviewing decision-makers, locals and tourists from the area of interest of the project,
as well as information obtained from the field work carried out by the research team of
INCDPM Bucharest were used.
Land overexploitation
Land use, as well as its development activities (agricultural intensification, urban
expansion, transport infrastructure, tourism and recreational facilities) in the area adjacent
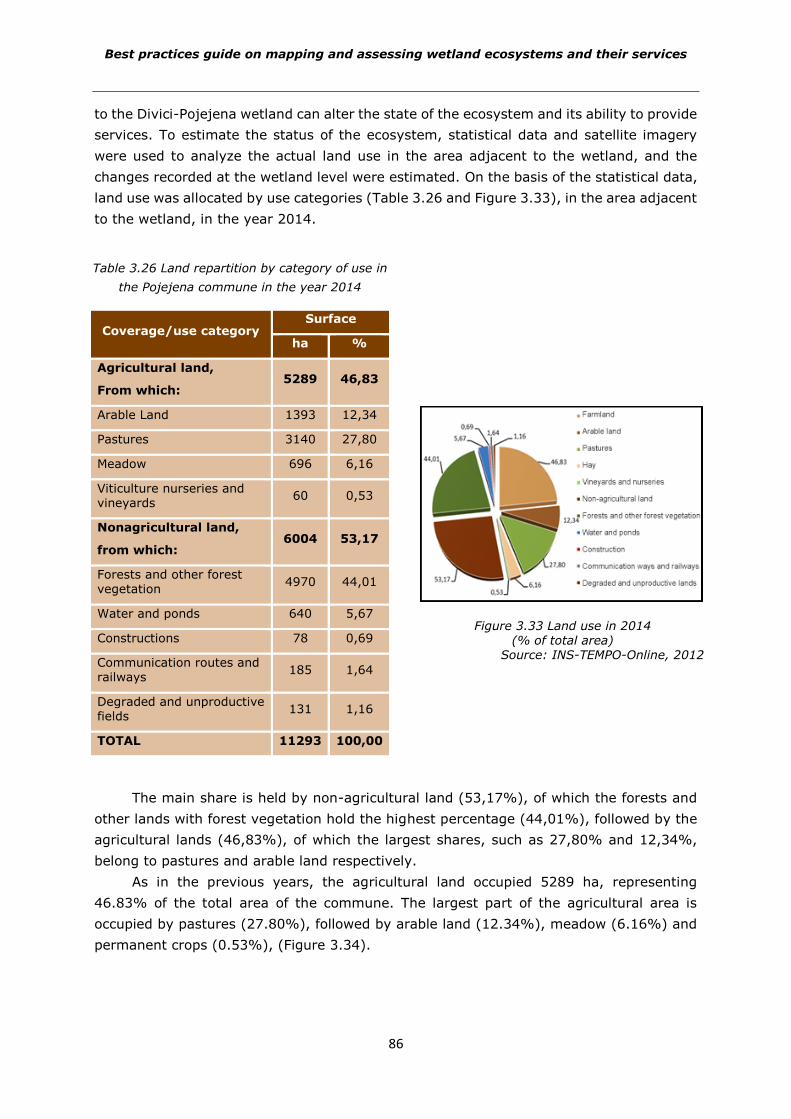
Best practices guide on mapping and assessing wetland ecosystems and their services
86
to the Divici-Pojejena wetland can alter the state of the ecosystem and its ability to provide
services. To estimate the status of the ecosystem, statistical data and satellite imagery
were used to analyze the actual land use in the area adjacent to the wetland, and the
changes recorded at the wetland level were estimated. On the basis of the statistical data,
land use was allocated by use categories (Table 3.26 and Figure 3.33), in the area adjacent
to the wetland, in the year 2014.
Table 3.26 Land repartition by category of use in
the Pojejena commune in the year 2014
Coverage/use category Surface
ha %
Agricultural land,
From which: 5289 46,83
Arable Land 1393 12,34
Pastures 3140 27,80
Meadow 696 6,16
Viticulture nurseries and vineyards
60 0,53
Nonagricultural land,
from which: 6004 53,17
Forests and other forest vegetation
4970 44,01
Water and ponds 640 5,67
Constructions 78 0,69
Communication routes and railways
185 1,64
Degraded and unproductive fields
131 1,16
TOTAL 11293 100,00
Figure 3.33 Land use in 2014 (% of total area)
Source: INS-TEMPO-Online, 2012
The main share is held by non-agricultural land (53,17%), of which the forests and
other lands with forest vegetation hold the highest percentage (44,01%), followed by the
agricultural lands (46,83%), of which the largest shares, such as 27,80% and 12,34%,
belong to pastures and arable land respectively.
As in the previous years, the agricultural land occupied 5289 ha, representing
46.83% of the total area of the commune. The largest part of the agricultural area is
occupied by pastures (27.80%), followed by arable land (12.34%), meadow (6.16%) and
permanent crops (0.53%), (Figure 3.34).
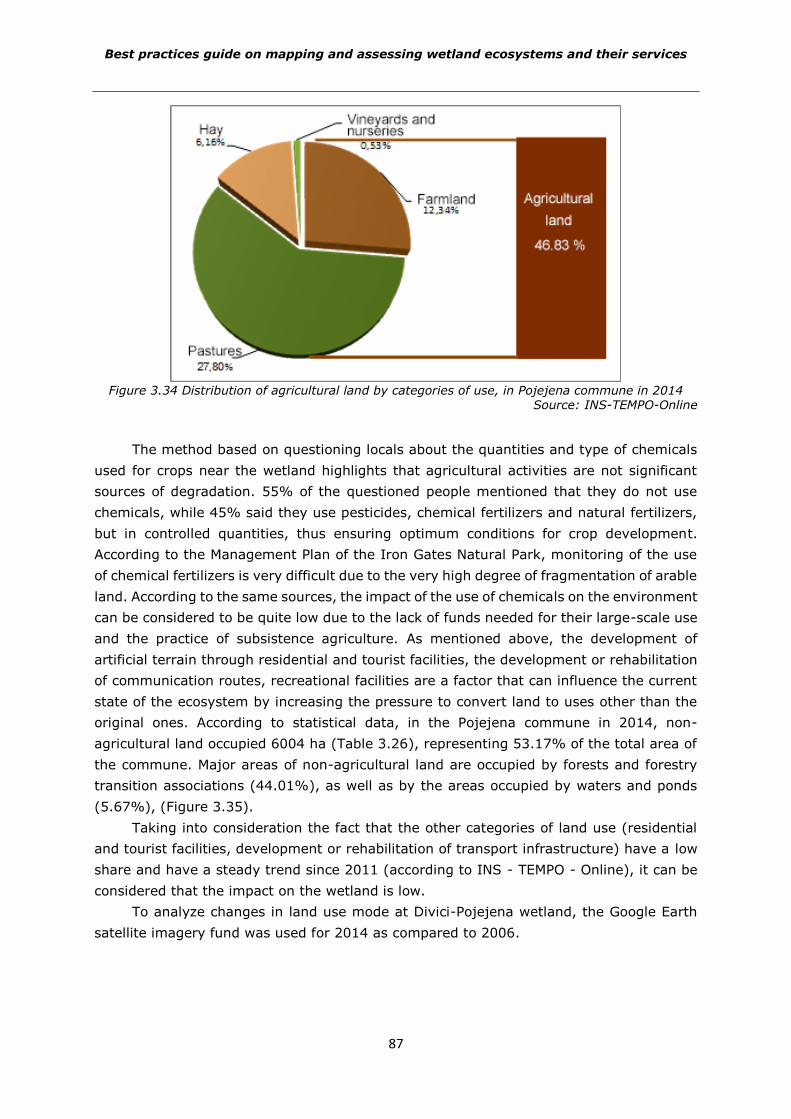
Best practices guide on mapping and assessing wetland ecosystems and their services
87
Figure 3.34 Distribution of agricultural land by categories of use, in Pojejena commune in 2014 Source: INS-TEMPO-Online
The method based on questioning locals about the quantities and type of chemicals
used for crops near the wetland highlights that agricultural activities are not significant
sources of degradation. 55% of the questioned people mentioned that they do not use
chemicals, while 45% said they use pesticides, chemical fertilizers and natural fertilizers,
but in controlled quantities, thus ensuring optimum conditions for crop development.
According to the Management Plan of the Iron Gates Natural Park, monitoring of the use
of chemical fertilizers is very difficult due to the very high degree of fragmentation of arable
land. According to the same sources, the impact of the use of chemicals on the environment
can be considered to be quite low due to the lack of funds needed for their large-scale use
and the practice of subsistence agriculture. As mentioned above, the development of
artificial terrain through residential and tourist facilities, the development or rehabilitation
of communication routes, recreational facilities are a factor that can influence the current
state of the ecosystem by increasing the pressure to convert land to uses other than the
original ones. According to statistical data, in the Pojejena commune in 2014, non-
agricultural land occupied 6004 ha (Table 3.26), representing 53.17% of the total area of
the commune. Major areas of non-agricultural land are occupied by forests and forestry
transition associations (44.01%), as well as by the areas occupied by waters and ponds
(5.67%), (Figure 3.35).
Taking into consideration the fact that the other categories of land use (residential
and tourist facilities, development or rehabilitation of transport infrastructure) have a low
share and have a steady trend since 2011 (according to INS - TEMPO - Online), it can be
considered that the impact on the wetland is low.
To analyze changes in land use mode at Divici-Pojejena wetland, the Google Earth
satellite imagery fund was used for 2014 as compared to 2006.
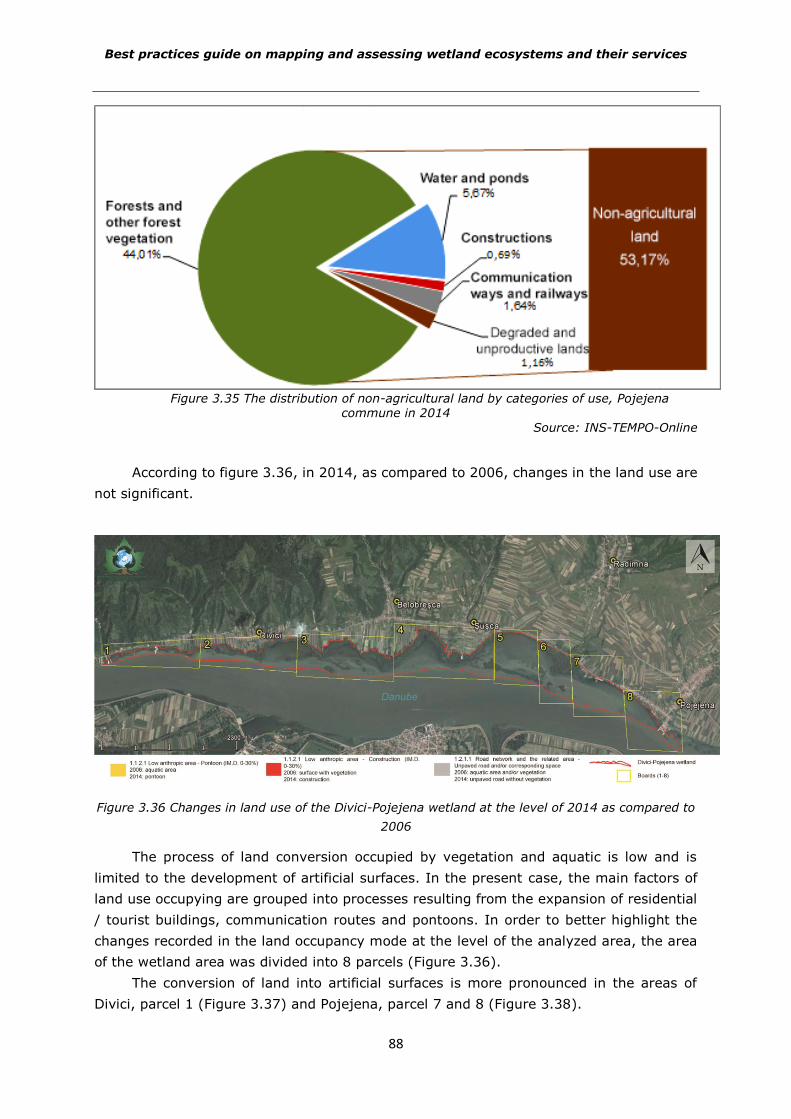
Best practices guide on mapping and assessing wetland ecosystems and their services
88
Figure 3.35 The distribution of non-agricultural land by categories of use, Pojejena commune in 2014
Source: INS-TEMPO-Online
According to figure 3.36, in 2014, as compared to 2006, changes in the land use are
not significant.
Figure 3.36 Changes in land use of the Divici-Pojejena wetland at the level of 2014 as compared to
2006
The process of land conversion occupied by vegetation and aquatic is low and is
limited to the development of artificial surfaces. In the present case, the main factors of
land use occupying are grouped into processes resulting from the expansion of residential
/ tourist buildings, communication routes and pontoons. In order to better highlight the
changes recorded in the land occupancy mode at the level of the analyzed area, the area
of the wetland area was divided into 8 parcels (Figure 3.36).
The conversion of land into artificial surfaces is more pronounced in the areas of
Divici, parcel 1 (Figure 3.37) and Pojejena, parcel 7 and 8 (Figure 3.38).
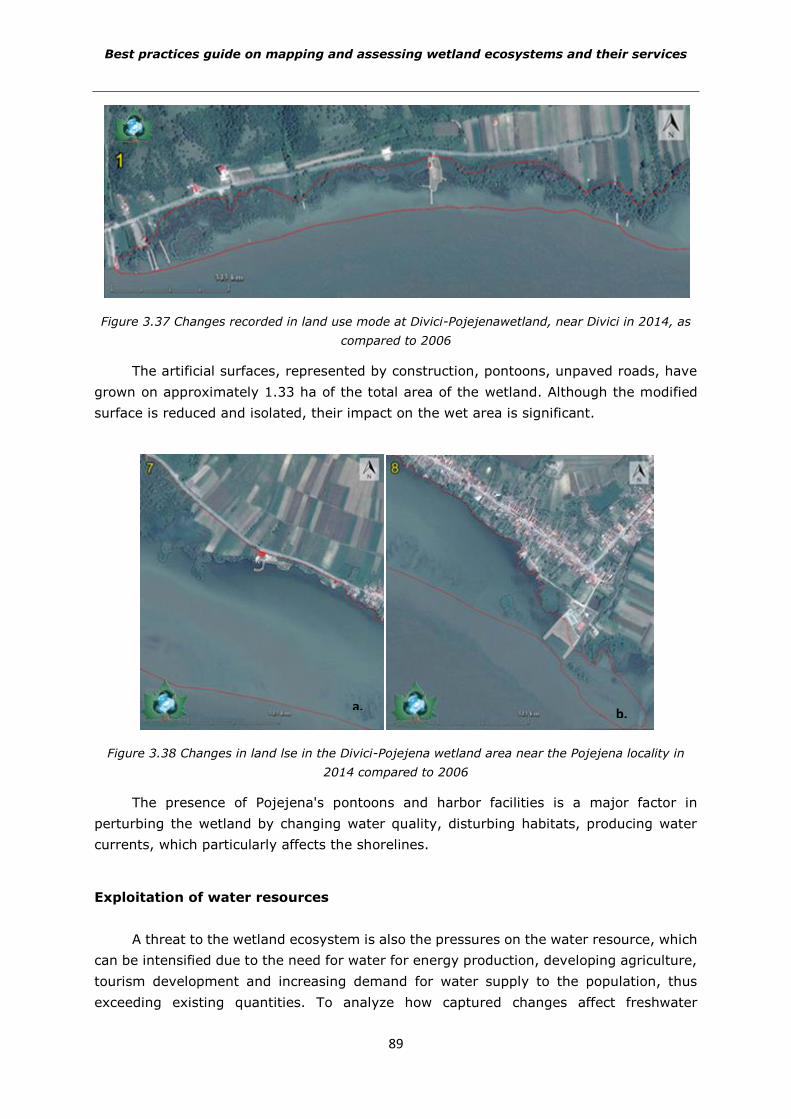
Best practices guide on mapping and assessing wetland ecosystems and their services
89
Figure 3.37 Changes recorded in land use mode at Divici-Pojejenawetland, near Divici in 2014, as
compared to 2006
The artificial surfaces, represented by construction, pontoons, unpaved roads, have
grown on approximately 1.33 ha of the total area of the wetland. Although the modified
surface is reduced and isolated, their impact on the wet area is significant.
Figure 3.38 Changes in land lse in the Divici-Pojejena wetland area near the Pojejena locality in
2014 compared to 2006
The presence of Pojejena's pontoons and harbor facilities is a major factor in
perturbing the wetland by changing water quality, disturbing habitats, producing water
currents, which particularly affects the shorelines.
Exploitation of water resources
A threat to the wetland ecosystem is also the pressures on the water resource, which
can be intensified due to the need for water for energy production, developing agriculture,
tourism development and increasing demand for water supply to the population, thus
exceeding existing quantities. To analyze how captured changes affect freshwater
a.b.
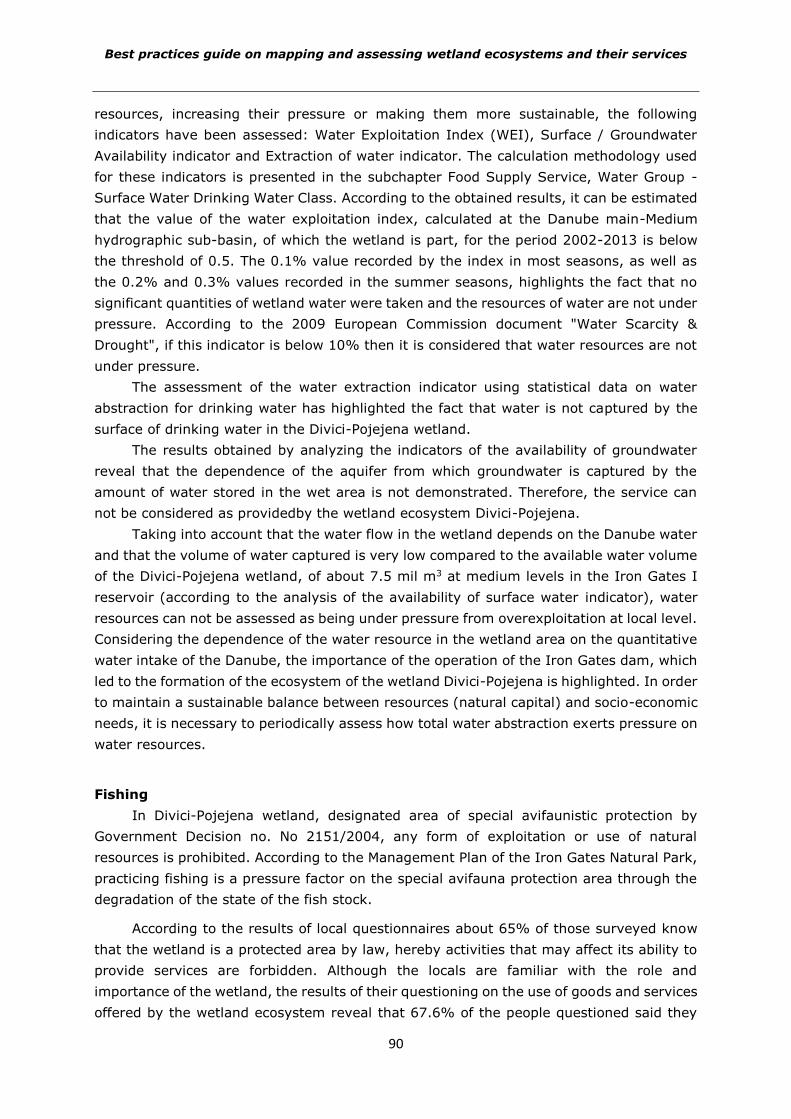
Best practices guide on mapping and assessing wetland ecosystems and their services
90
resources, increasing their pressure or making them more sustainable, the following
indicators have been assessed: Water Exploitation Index (WEI), Surface / Groundwater
Availability indicator and Extraction of water indicator. The calculation methodology used
for these indicators is presented in the subchapter Food Supply Service, Water Group -
Surface Water Drinking Water Class. According to the obtained results, it can be estimated
that the value of the water exploitation index, calculated at the Danube main-Medium
hydrographic sub-basin, of which the wetland is part, for the period 2002-2013 is below
the threshold of 0.5. The 0.1% value recorded by the index in most seasons, as well as
the 0.2% and 0.3% values recorded in the summer seasons, highlights the fact that no
significant quantities of wetland water were taken and the resources of water are not under
pressure. According to the 2009 European Commission document "Water Scarcity &
Drought", if this indicator is below 10% then it is considered that water resources are not
under pressure.
The assessment of the water extraction indicator using statistical data on water
abstraction for drinking water has highlighted the fact that water is not captured by the
surface of drinking water in the Divici-Pojejena wetland.
The results obtained by analyzing the indicators of the availability of groundwater
reveal that the dependence of the aquifer from which groundwater is captured by the
amount of water stored in the wet area is not demonstrated. Therefore, the service can
not be considered as providedby the wetland ecosystem Divici-Pojejena.
Taking into account that the water flow in the wetland depends on the Danube water
and that the volume of water captured is very low compared to the available water volume
of the Divici-Pojejena wetland, of about 7.5 mil m3 at medium levels in the Iron Gates I
reservoir (according to the analysis of the availability of surface water indicator), water
resources can not be assessed as being under pressure from overexploitation at local level.
Considering the dependence of the water resource in the wetland area on the quantitative
water intake of the Danube, the importance of the operation of the Iron Gates dam, which
led to the formation of the ecosystem of the wetland Divici-Pojejena is highlighted. In order
to maintain a sustainable balance between resources (natural capital) and socio-economic
needs, it is necessary to periodically assess how total water abstraction exerts pressure on
water resources.
Fishing
In Divici-Pojejena wetland, designated area of special avifaunistic protection by
Government Decision no. No 2151/2004, any form of exploitation or use of natural
resources is prohibited. According to the Management Plan of the Iron Gates Natural Park,
practicing fishing is a pressure factor on the special avifauna protection area through the
degradation of the state of the fish stock.
According to the results of local questionnaires about 65% of those surveyed know
that the wetland is a protected area by law, hereby activities that may affect its ability to
provide services are forbidden. Although the locals are familiar with the role and
importance of the wetland, the results of their questioning on the use of goods and services
offered by the wetland ecosystem reveal that 67.6% of the people questioned said they
Best practices guide on mapping and assessing wetland ecosystems and their services
91
were fishing and hunting. The practice of unauthorized fishing in the Divici-Pojejena
protected wetland (Figure 3.39) was also encountered during the fieldwork conducted in
the study "Studies for achieving shore protection of wetland area Divici-Pojejena ", 2014-
2015.
Figure 3.39 Fishing in the Divici-Pojejena protected wetland (INCDPM, 2014-2015)
Increasing pressure on special avifauna protection areas by practicing unauthorized
fishing of both commercial type and sporting type is also mentioned in the Iron Gate
Natural Park Management Plan. At present, there is no clear evidence of the quantities of
fish caught, which makes the impact on the fish stock not measurable.
In order to avoid the degradation of the fish stock and to maintain a sustainable
balance between resources and socio-economic needs, it is necessary to continuously
monitor these areas by the responsible authorities.
Reed harvesting
The wetland is an important natural product provider for human communities. Among
the main types of benefits that can be exploited is the reed production. The areas covered
by the reeds are the biggest areas, after the ones covered with water and forest meadow,
representing about 9% of total wetland area, according to the delimitation of the wetland
Divici-Pojejena made with the Landsat VIII satellite image within the chapter regarding
mapping of wetland.
Excess harvested reeds as a result of the implementation of reed management
measures to provide retreat places and nesting areas for bird species can be harnessed in
a sustainable way to generate additional income for the benefit of local communities.
In the surveyed area, the results obtained by questioning local people about the use
of reeds show that about 80% of those surveyed said that this wetland supply is not being
exploited.
Best practices guide on mapping and assessing wetland ecosystems and their services
92
Tourist activities
Tourism and recreation in accordance with the preservation requirements of the
natural heritage contribute to the attractiveness of the area as a tourist destination.
The Pojejena commune has a particularly high tourist potential, benefiting from the
beauty of natural landscapes, flora and fauna generated by the Divici-Pojejena wetland,
the presence of Natural Reserve Râpa with swallows of the Divici Valley, the Fortress and
the Dacian settlement in the village of Divici, as well as traditionally well-kept habits and
folklore, as well as specific gastronomy.
Divici-Pojejena wetland, as well as other local tourist attractions, offers significant
opportunities for tourism and recreation, opportunities that can be translated into economic
benefits for local communities. The tourism potential of the Divici-Pojejena wetland is one
of the most important services provided by its ecosystem. According to the Management
Plan of the Iron Gates Natural Park, the wetland provides recreation and tourism
opportunities for the public, while providing scientific and educational activities. Among the
tourist activities that take place in the adjacent areas of the wetland, according to the
answers given by the respondents, can be mentioned: recreational tourism (fishing,
hunting, cyclotourism, pedestrian tourism, and nautical tourism), scientific tourism,
traditional festivities and celebrations (The Golden Cauldron, Nedeia, minorities feasts,
Fasuliada, Fășancul, etc.), traditional cuisine.
However, tourism is still not being used to the extent of the existing natural potential.
The tourist infrastructure is insufficiently developed, thus helping to limit the attractiveness
of the area as a tourist destination. The auxiliary infrastructure (bird observatories, sight-
seeing trails, belvedere points, tourist information and promotion centers, etc.) and
technical-municipal facilities are also underdeveloped or non-existent.
The lack of measures to develop tourism activities and its infrastructure could lead,
according to the Iron Gates Natural Park Management Plan, to the practice of
unorganized tourism, limited to activities that may amplify the pressures for conversion
of open land into built-up areas, habitat degradation and Perturbation of their tranquility,
impacts on water quality through unspent sewage discharges, campings and open fires at
places not permitted and unorganized waste disposal.
The results obtained from the assessment of the ecosystem condition highlight that
certain types of pressures due to the use of land in the Divici-Pojejena wetland area, the
practice of unorganized tourism and poaching represent a threat to the wetland by
increasing pressures to convert land to other Uses other than baseline and habitat
degradation.
Regarding land use in the area adjacent to the wetland, the results have shown that
they do not change the state of the ecosystem and its ability to provide services. The
analysis of indicators on how to exploit water resources highlights that water resources are
not under pressure. Certain types of goods provided by the wetland, which could be used
to generate additional revenue, are not exploited.
Best practices guide on mapping and assessing wetland ecosystems and their services
93
3.2 Direct estimate of the status of wetland ecosystems in Romania
One of the approaches to the MAES framework for determining the condition of
ecosystems is a direct estimation based on the analysis of the biotic and abiotic
components by specific indicators such as soil, water, air, conservation status and species
and habitat trends. These indicators illustrate the cumulative effect of pressures on the
ecosystem over time.
At national level specific indicators of wetlands used for evaluation of the
status/condition of ecosystems have as a starting point the reports under Article 17 of the
Habitats Directive, Article 12 of the Birds Directive, Natura 2000 and reports of the Water
Framework Directive (EEA, 2015).
3.2.1 Water quality indicators
The assessment of surface water quality is carried out in accordance with Order no.
161/2006 for the approval of the Normative regarding the surface water quality
classification in order to establish the ecological water bodies’ status.
In order to determine the ecological status of the Divici-Pojejena wetland, the water
quality indicators for the following categories were analyzed:
Quality biological elements for rivers;
Quality biological elements for lakes;
C1. Thermal regime and acidification;
C2. Oxygen regime;
C3. nutrients;
C4. Salinity;
C5. Specific toxic pollutants of natural origin;
C6. Other relevant chemical indicators.
! For the direct evaluation of the Divici-Pojejena wetland ecosystem
condition, the following indicators were analyzed for the wetland areas
components on the permanent water course according to the Ramsar
classification (Convention on Wetlands of International Importance, 1971):
- Water Quality Indicators
- Indicators of the biodiversity component (flora and fauna)
- Water quantity indicators
- Soil quality indicators.
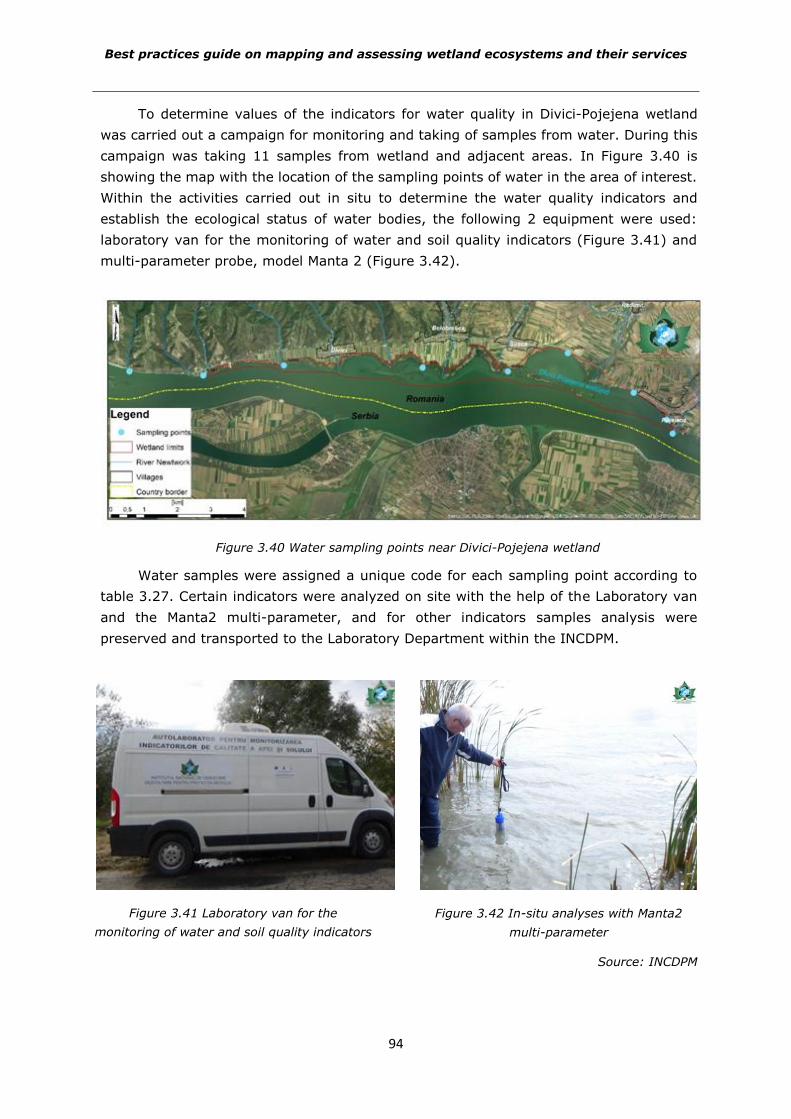
Best practices guide on mapping and assessing wetland ecosystems and their services
94
To determine values of the indicators for water quality in Divici-Pojejena wetland
was carried out a campaign for monitoring and taking of samples from water. During this
campaign was taking 11 samples from wetland and adjacent areas. In Figure 3.40 is
showing the map with the location of the sampling points of water in the area of interest.
Within the activities carried out in situ to determine the water quality indicators and
establish the ecological status of water bodies, the following 2 equipment were used:
laboratory van for the monitoring of water and soil quality indicators (Figure 3.41) and
multi-parameter probe, model Manta 2 (Figure 3.42).
Figure 3.40 Water sampling points near Divici-Pojejena wetland
Water samples were assigned a unique code for each sampling point according to
table 3.27. Certain indicators were analyzed on site with the help of the Laboratory van
and the Manta2 multi-parameter, and for other indicators samples analysis were
preserved and transported to the Laboratory Department within the INCDPM.
Figure 3.41 Laboratory van for the
monitoring of water and soil quality indicators
Figure 3.42 In-situ analyses with Manta2
multi-parameter
Source: INCDPM
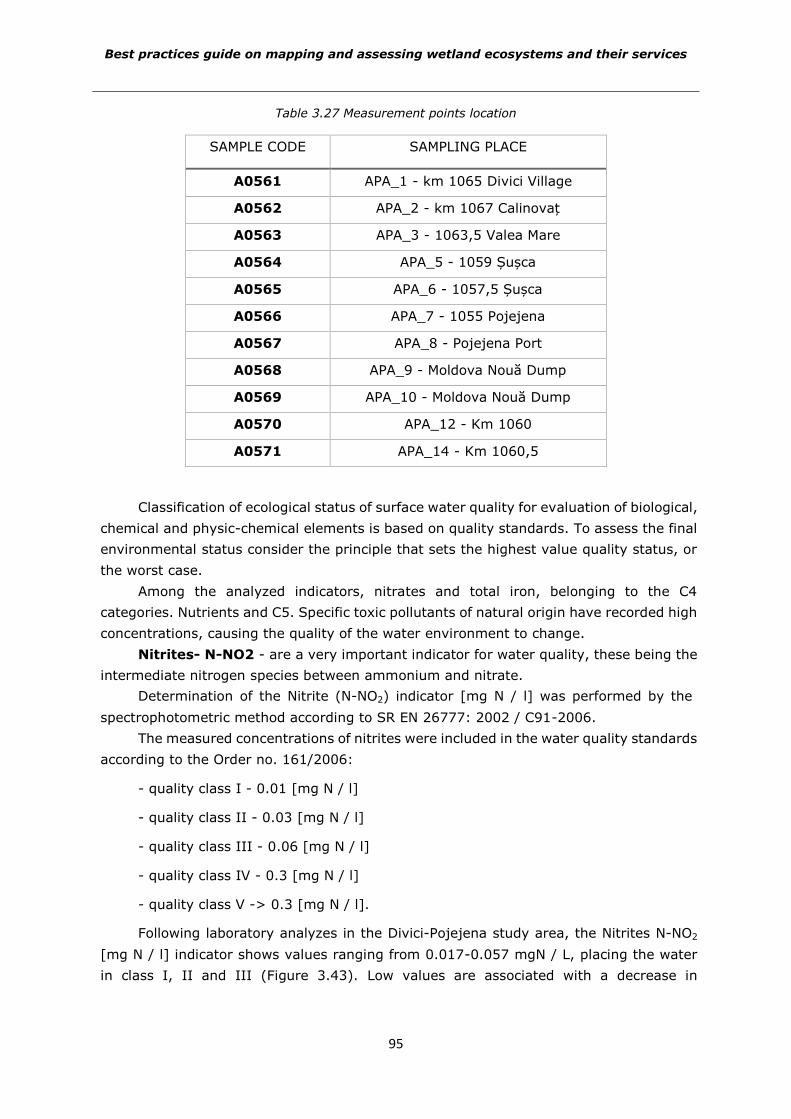
Best practices guide on mapping and assessing wetland ecosystems and their services
95
Table 3.27 Measurement points location
SAMPLE CODE SAMPLING PLACE
A0561 APA_1 - km 1065 Divici Village
A0562 APA_2 - km 1067 Calinovaț
A0563 APA_3 - 1063,5 Valea Mare
A0564 APA_5 - 1059 Șușca
A0565 APA_6 - 1057,5 Șușca
A0566 APA_7 - 1055 Pojejena
A0567 APA_8 - Pojejena Port
A0568 APA_9 - Moldova Nouă Dump
A0569 APA_10 - Moldova Nouă Dump
A0570 APA_12 - Km 1060
A0571 APA_14 - Km 1060,5
Classification of ecological status of surface water quality for evaluation of biological,
chemical and physic-chemical elements is based on quality standards. To assess the final
environmental status consider the principle that sets the highest value quality status, or
the worst case.
Among the analyzed indicators, nitrates and total iron, belonging to the C4
categories. Nutrients and C5. Specific toxic pollutants of natural origin have recorded high
concentrations, causing the quality of the water environment to change.
Nitrites- N-NO2 - are a very important indicator for water quality, these being the
intermediate nitrogen species between ammonium and nitrate.
Determination of the Nitrite (N-NO2) indicator [mg N / l] was performed by the
spectrophotometric method according to SR EN 26777: 2002 / C91-2006.
The measured concentrations of nitrites were included in the water quality standards
according to the Order no. 161/2006:
- quality class I - 0.01 [mg N / l]
- quality class II - 0.03 [mg N / l]
- quality class III - 0.06 [mg N / l]
- quality class IV - 0.3 [mg N / l]
- quality class V -> 0.3 [mg N / l].
Following laboratory analyzes in the Divici-Pojejena study area, the Nitrites N-NO2
[mg N / l] indicator shows values ranging from 0.017-0.057 mgN / L, placing the water
in class I, II and III (Figure 3.43). Low values are associated with a decrease in
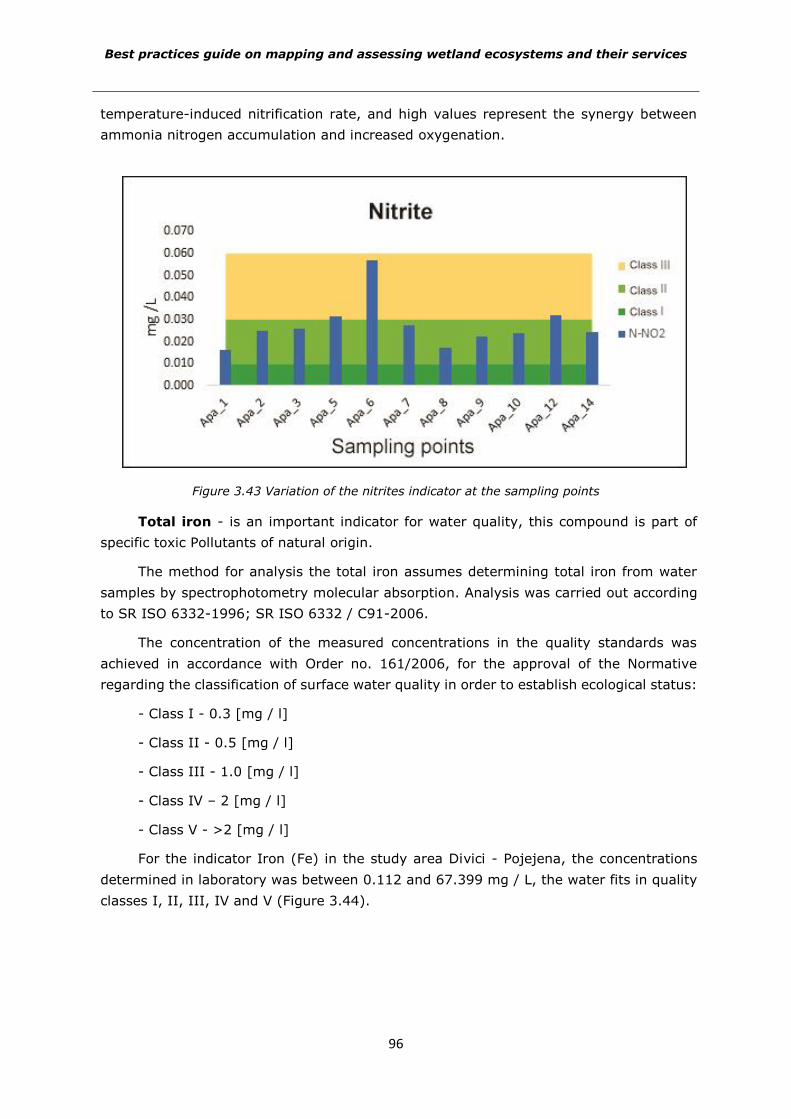
Best practices guide on mapping and assessing wetland ecosystems and their services
96
temperature-induced nitrification rate, and high values represent the synergy between
ammonia nitrogen accumulation and increased oxygenation.
Figure 3.43 Variation of the nitrites indicator at the sampling points
Total iron - is an important indicator for water quality, this compound is part of
specific toxic Pollutants of natural origin.
The method for analysis the total iron assumes determining total iron from water
samples by spectrophotometry molecular absorption. Analysis was carried out according
to SR ISO 6332-1996; SR ISO 6332 / C91-2006.
The concentration of the measured concentrations in the quality standards was
achieved in accordance with Order no. 161/2006, for the approval of the Normative
regarding the classification of surface water quality in order to establish ecological status:
- Class I - 0.3 [mg / l]
- Class II - 0.5 [mg / l]
- Class III - 1.0 [mg / l]
- Class IV – 2 [mg / l]
- Class V - >2 [mg / l]
For the indicator Iron (Fe) in the study area Divici - Pojejena, the concentrations
determined in laboratory was between 0.112 and 67.399 mg / L, the water fits in quality
classes I, II, III, IV and V (Figure 3.44).
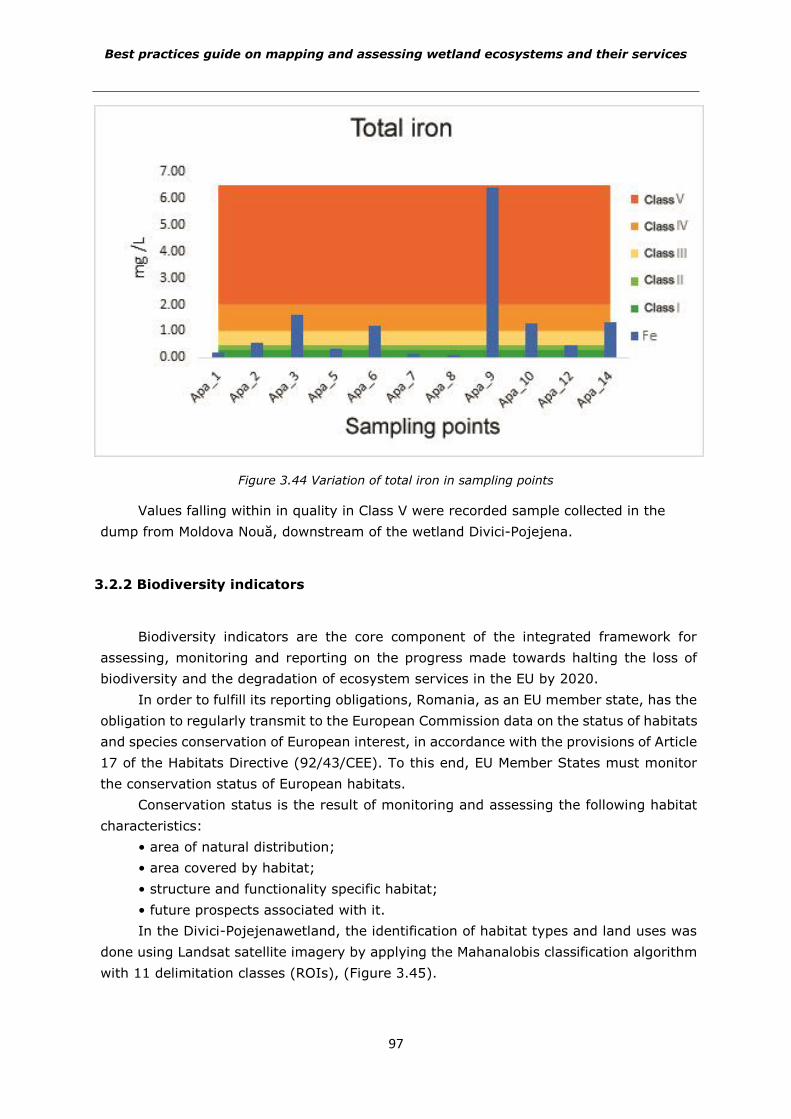
Best practices guide on mapping and assessing wetland ecosystems and their services
97
Figure 3.44 Variation of total iron in sampling points
Values falling within in quality in Class V were recorded sample collected in the
dump from Moldova Nouă, downstream of the wetland Divici-Pojejena.
3.2.2 Biodiversity indicators
Biodiversity indicators are the core component of the integrated framework for
assessing, monitoring and reporting on the progress made towards halting the loss of
biodiversity and the degradation of ecosystem services in the EU by 2020.
In order to fulfill its reporting obligations, Romania, as an EU member state, has the
obligation to regularly transmit to the European Commission data on the status of habitats
and species conservation of European interest, in accordance with the provisions of Article
17 of the Habitats Directive (92/43/CEE). To this end, EU Member States must monitor
the conservation status of European habitats.
Conservation status is the result of monitoring and assessing the following habitat
characteristics:
• area of natural distribution;
• area covered by habitat;
• structure and functionality specific habitat;
• future prospects associated with it.
In the Divici-Pojejenawetland, the identification of habitat types and land uses was
done using Landsat satellite imagery by applying the Mahanalobis classification algorithm
with 11 delimitation classes (ROIs), (Figure 3.45).
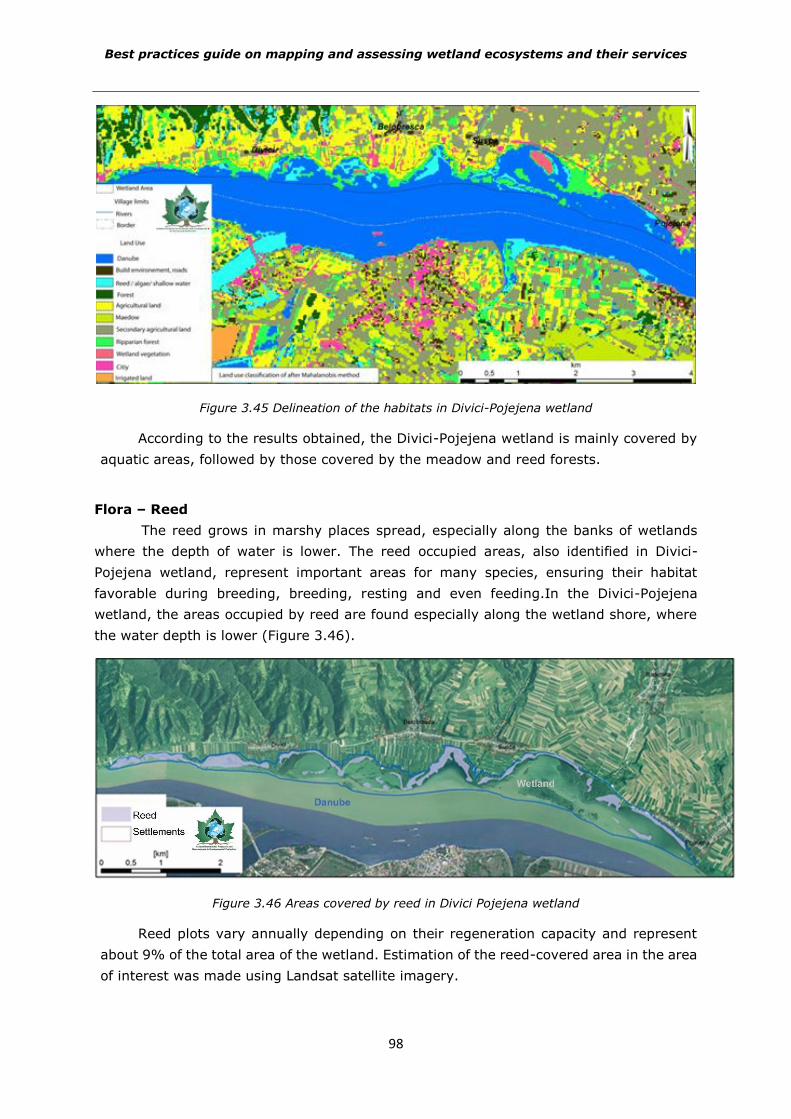
Best practices guide on mapping and assessing wetland ecosystems and their services
98
Figure 3.45 Delineation of the habitats in Divici-Pojejena wetland
According to the results obtained, the Divici-Pojejena wetland is mainly covered by
aquatic areas, followed by those covered by the meadow and reed forests.
Flora – Reed
The reed grows in marshy places spread, especially along the banks of wetlands
where the depth of water is lower. The reed occupied areas, also identified in Divici-
Pojejena wetland, represent important areas for many species, ensuring their habitat
favorable during breeding, breeding, resting and even feeding.In the Divici-Pojejena
wetland, the areas occupied by reed are found especially along the wetland shore, where
the water depth is lower (Figure 3.46).
Figure 3.46 Areas covered by reed in Divici Pojejena wetland
Reed plots vary annually depending on their regeneration capacity and represent
about 9% of the total area of the wetland. Estimation of the reed-covered area in the area
of interest was made using Landsat satellite imagery.
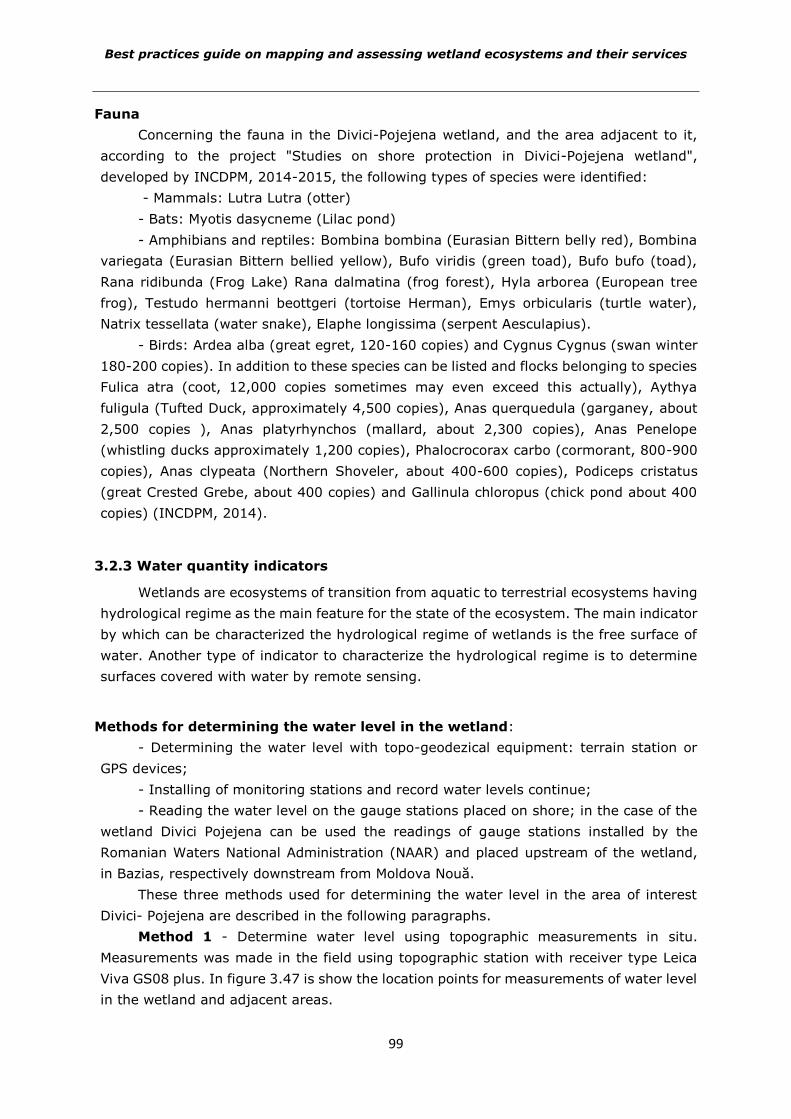
Best practices guide on mapping and assessing wetland ecosystems and their services
99
Fauna
Concerning the fauna in the Divici-Pojejena wetland, and the area adjacent to it,
according to the project "Studies on shore protection in Divici-Pojejena wetland",
developed by INCDPM, 2014-2015, the following types of species were identified:
- Mammals: Lutra Lutra (otter)
- Bats: Myotis dasycneme (Lilac pond)
- Amphibians and reptiles: Bombina bombina (Eurasian Bittern belly red), Bombina
variegata (Eurasian Bittern bellied yellow), Bufo viridis (green toad), Bufo bufo (toad),
Rana ridibunda (Frog Lake) Rana dalmatina (frog forest), Hyla arborea (European tree
frog), Testudo hermanni beottgeri (tortoise Herman), Emys orbicularis (turtle water),
Natrix tessellata (water snake), Elaphe longissima (serpent Aesculapius).
- Birds: Ardea alba (great egret, 120-160 copies) and Cygnus Cygnus (swan winter
180-200 copies). In addition to these species can be listed and flocks belonging to species
Fulica atra (coot, 12,000 copies sometimes may even exceed this actually), Aythya
fuligula (Tufted Duck, approximately 4,500 copies), Anas querquedula (garganey, about
2,500 copies ), Anas platyrhynchos (mallard, about 2,300 copies), Anas Penelope
(whistling ducks approximately 1,200 copies), Phalocrocorax carbo (cormorant, 800-900
copies), Anas clypeata (Northern Shoveler, about 400-600 copies), Podiceps cristatus
(great Crested Grebe, about 400 copies) and Gallinula chloropus (chick pond about 400
copies) (INCDPM, 2014).
3.2.3 Water quantity indicators
Wetlands are ecosystems of transition from aquatic to terrestrial ecosystems having
hydrological regime as the main feature for the state of the ecosystem. The main indicator
by which can be characterized the hydrological regime of wetlands is the free surface of
water. Another type of indicator to characterize the hydrological regime is to determine
surfaces covered with water by remote sensing.
Methods for determining the water level in the wetland:
- Determining the water level with topo-geodezical equipment: terrain station or
GPS devices;
- Installing of monitoring stations and record water levels continue;
- Reading the water level on the gauge stations placed on shore; in the case of the
wetland Divici Pojejena can be used the readings of gauge stations installed by the
Romanian Waters National Administration (NAAR) and placed upstream of the wetland,
in Bazias, respectively downstream from Moldova Nouă.
These three methods used for determining the water level in the area of interest
Divici- Pojejena are described in the following paragraphs.
Method 1 - Determine water level using topographic measurements in situ.
Measurements was made in the field using topographic station with receiver type Leica
Viva GS08 plus. In figure 3.47 is show the location points for measurements of water level
in the wetland and adjacent areas.
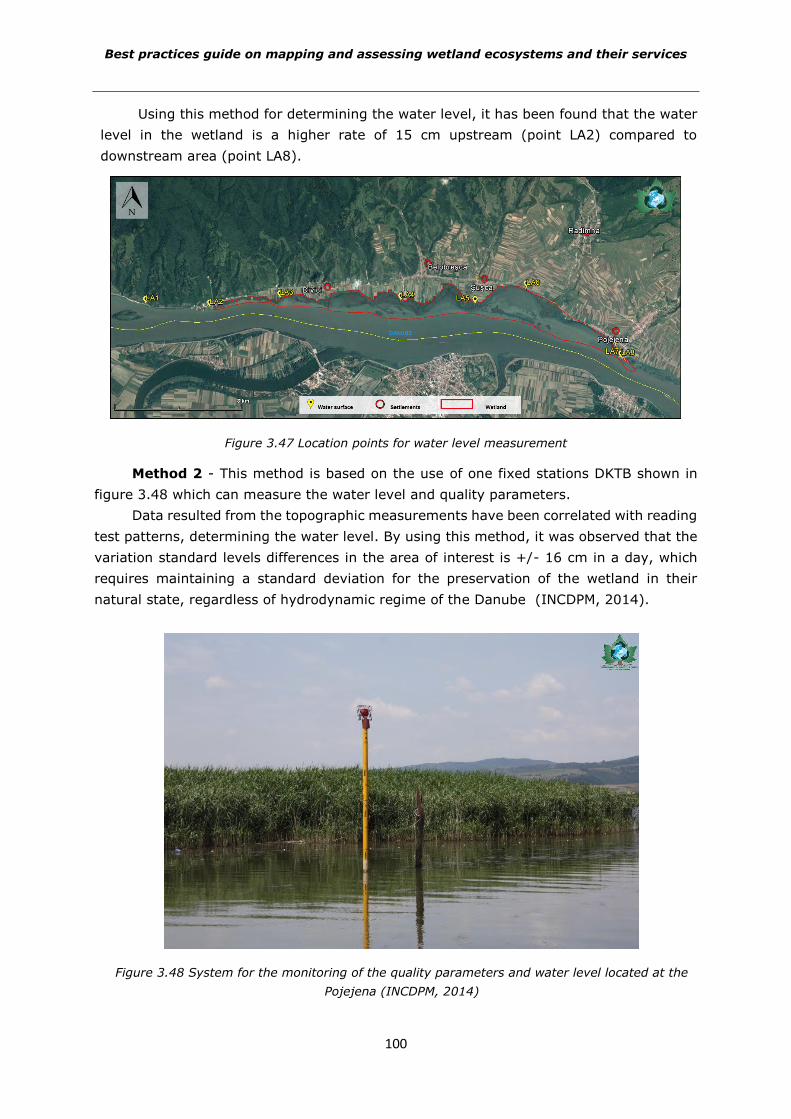
Best practices guide on mapping and assessing wetland ecosystems and their services
100
Using this method for determining the water level, it has been found that the water
level in the wetland is a higher rate of 15 cm upstream (point LA2) compared to
downstream area (point LA8).
Figure 3.47 Location points for water level measurement
Method 2 - This method is based on the use of one fixed stations DKTB shown in
figure 3.48 which can measure the water level and quality parameters.
Data resulted from the topographic measurements have been correlated with reading
test patterns, determining the water level. By using this method, it was observed that the
variation standard levels differences in the area of interest is +/- 16 cm in a day, which
requires maintaining a standard deviation for the preservation of the wetland in their
natural state, regardless of hydrodynamic regime of the Danube (INCDPM, 2014).
Figure 3.48 System for the monitoring of the quality parameters and water level located at the
Pojejena (INCDPM, 2014)
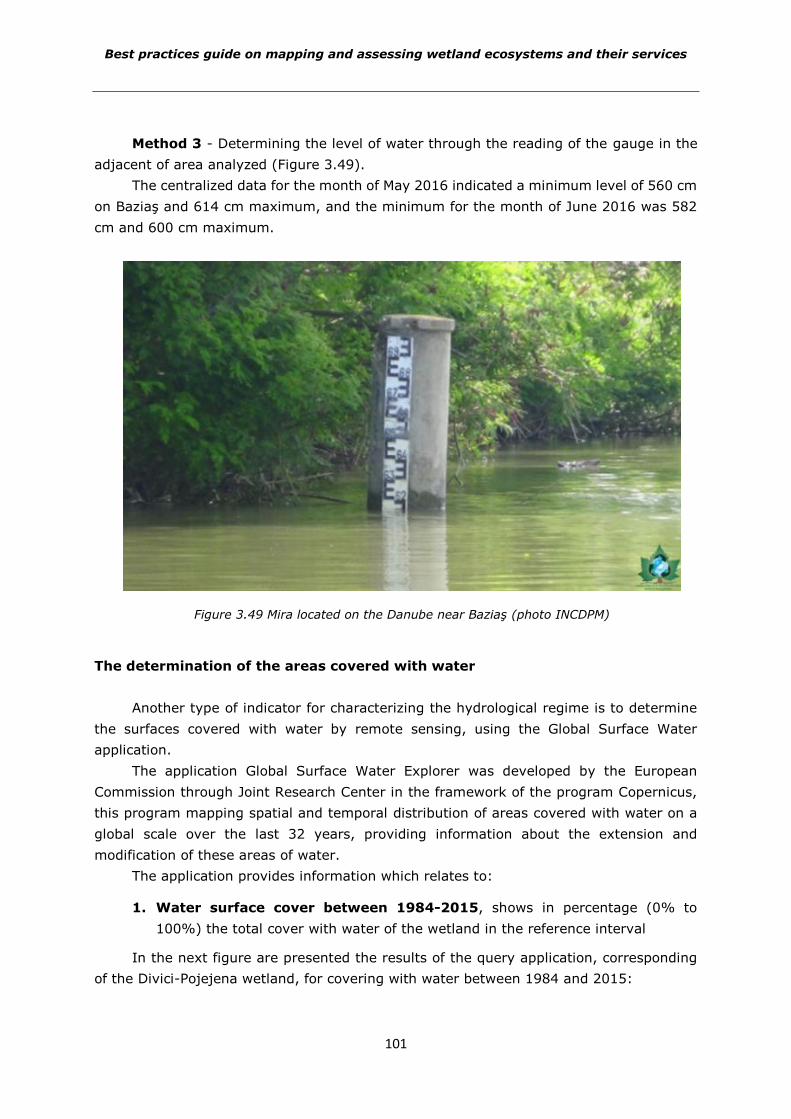
Best practices guide on mapping and assessing wetland ecosystems and their services
101
Method 3 - Determining the level of water through the reading of the gauge in the
adjacent of area analyzed (Figure 3.49).
The centralized data for the month of May 2016 indicated a minimum level of 560 cm
on Baziaş and 614 cm maximum, and the minimum for the month of June 2016 was 582
cm and 600 cm maximum.
Figure 3.49 Mira located on the Danube near Baziaş (photo INCDPM)
The determination of the areas covered with water
Another type of indicator for characterizing the hydrological regime is to determine
the surfaces covered with water by remote sensing, using the Global Surface Water
application.
The application Global Surface Water Explorer was developed by the European
Commission through Joint Research Center in the framework of the program Copernicus,
this program mapping spatial and temporal distribution of areas covered with water on a
global scale over the last 32 years, providing information about the extension and
modification of these areas of water.
The application provides information which relates to:
1. Water surface cover between 1984-2015, shows in percentage (0% to
100%) the total cover with water of the wetland in the reference interval
In the next figure are presented the results of the query application, corresponding
of the Divici-Pojejena wetland, for covering with water between 1984 and 2015:
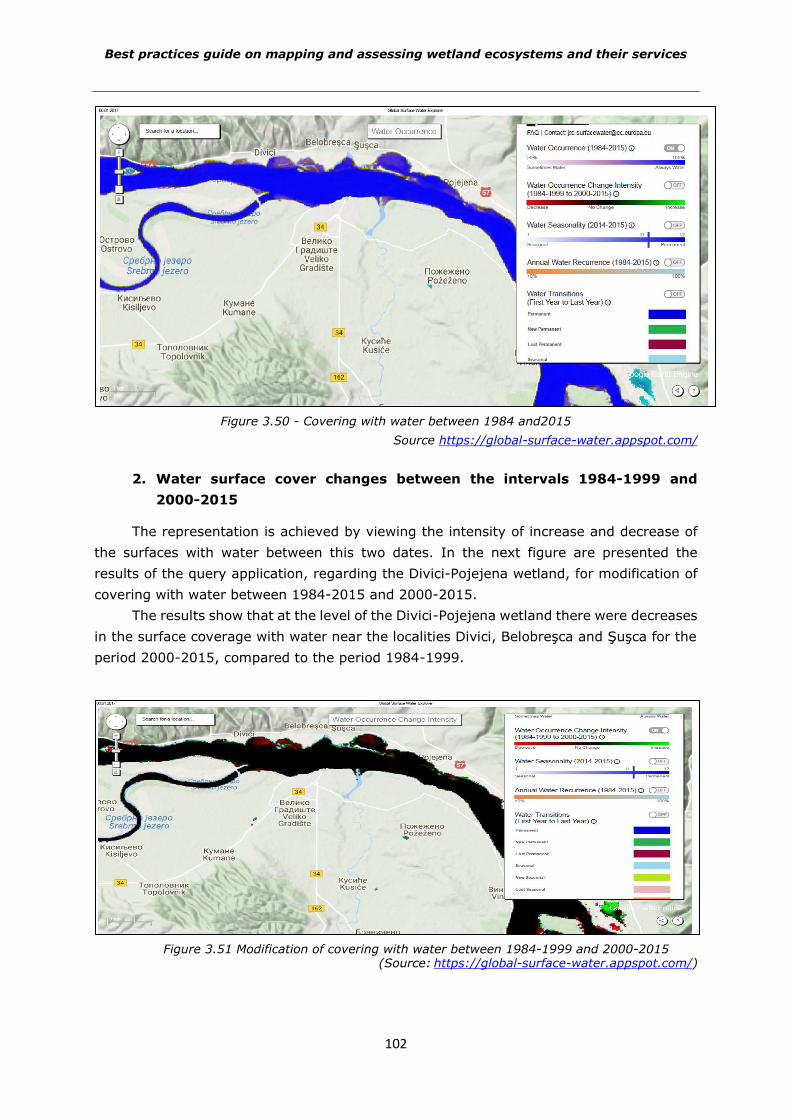
Best practices guide on mapping and assessing wetland ecosystems and their services
102
Figure 3.50 - Covering with water between 1984 and2015
Source https://global-surface-water.appspot.com/
2. Water surface cover changes between the intervals 1984-1999 and
2000-2015
The representation is achieved by viewing the intensity of increase and decrease of
the surfaces with water between this two dates. In the next figure are presented the
results of the query application, regarding the Divici-Pojejena wetland, for modification of
covering with water between 1984-2015 and 2000-2015.
The results show that at the level of the Divici-Pojejena wetland there were decreases
in the surface coverage with water near the localities Divici, Belobreşca and Şuşca for the
period 2000-2015, compared to the period 1984-1999.
Figure 3.51 Modification of covering with water between 1984-1999 and 2000-2015 (Source: https://global-surface-water.appspot.com/)
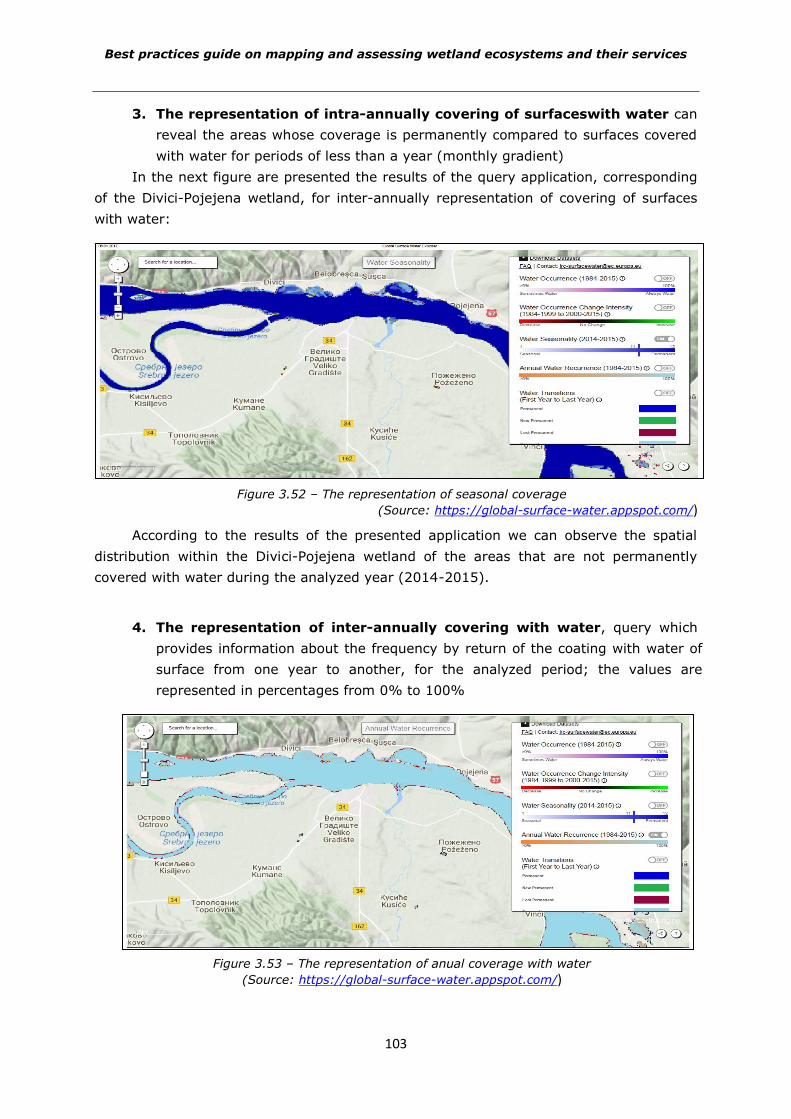
Best practices guide on mapping and assessing wetland ecosystems and their services
103
3. The representation of intra-annually covering of surfaceswith water can
reveal the areas whose coverage is permanently compared to surfaces covered
with water for periods of less than a year (monthly gradient)
In the next figure are presented the results of the query application, corresponding
of the Divici-Pojejena wetland, for inter-annually representation of covering of surfaces
with water:
Figure 3.52 – The representation of seasonal coverage
(Source: https://global-surface-water.appspot.com/)
According to the results of the presented application we can observe the spatial
distribution within the Divici-Pojejena wetland of the areas that are not permanently
covered with water during the analyzed year (2014-2015).
4. The representation of inter-annually covering with water, query which provides information about the frequency by return of the coating with water of surface from one year to another, for the analyzed period; the values are represented in percentages from 0% to 100%
Figure 3.53 – The representation of anual coverage with water
(Source: https://global-surface-water.appspot.com/)
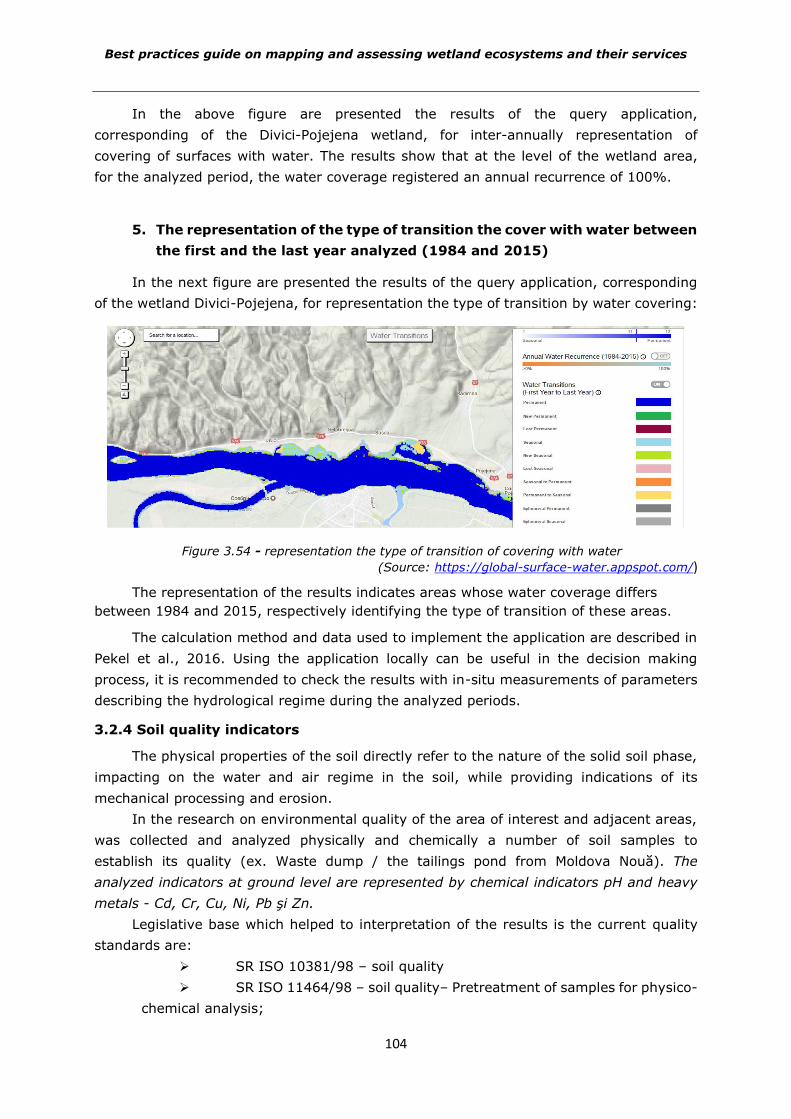
Best practices guide on mapping and assessing wetland ecosystems and their services
104
In the above figure are presented the results of the query application,
corresponding of the Divici-Pojejena wetland, for inter-annually representation of
covering of surfaces with water. The results show that at the level of the wetland area,
for the analyzed period, the water coverage registered an annual recurrence of 100%.
5. The representation of the type of transition the cover with water between
the first and the last year analyzed (1984 and 2015)
In the next figure are presented the results of the query application, corresponding
of the wetland Divici-Pojejena, for representation the type of transition by water covering:
Figure 3.54 - representation the type of transition of covering with water
(Source: https://global-surface-water.appspot.com/)
The representation of the results indicates areas whose water coverage differs
between 1984 and 2015, respectively identifying the type of transition of these areas.
The calculation method and data used to implement the application are described in
Pekel et al., 2016. Using the application locally can be useful in the decision making
process, it is recommended to check the results with in-situ measurements of parameters
describing the hydrological regime during the analyzed periods.
3.2.4 Soil quality indicators
The physical properties of the soil directly refer to the nature of the solid soil phase,
impacting on the water and air regime in the soil, while providing indications of its
mechanical processing and erosion.
In the research on environmental quality of the area of interest and adjacent areas,
was collected and analyzed physically and chemically a number of soil samples to
establish its quality (ex. Waste dump / the tailings pond from Moldova Nouă). The
analyzed indicators at ground level are represented by chemical indicators pH and heavy
metals - Cd, Cr, Cu, Ni, Pb şi Zn.
Legislative base which helped to interpretation of the results is the current quality
standards are:
SR ISO 10381/98 – soil quality
SR ISO 11464/98 – soil quality– Pretreatment of samples for physico-
chemical analysis;
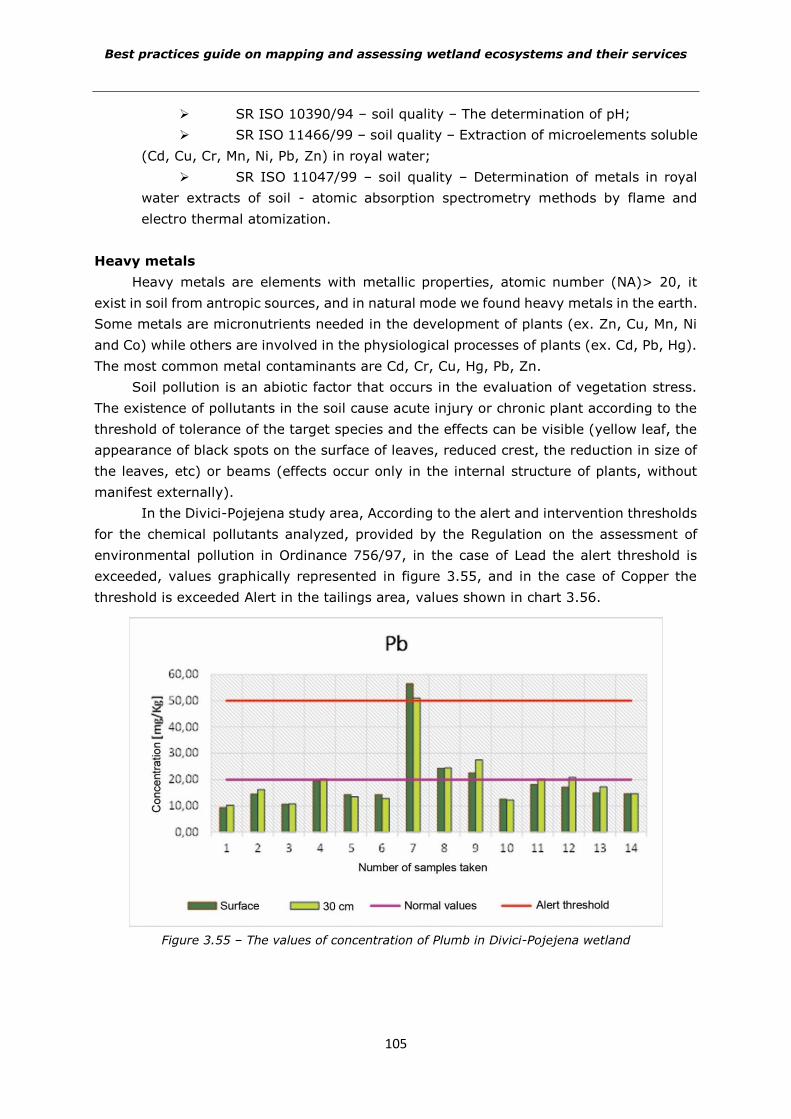
Best practices guide on mapping and assessing wetland ecosystems and their services
105
SR ISO 10390/94 – soil quality – The determination of pH;
SR ISO 11466/99 – soil quality – Extraction of microelements soluble
(Cd, Cu, Cr, Mn, Ni, Pb, Zn) in royal water;
SR ISO 11047/99 – soil quality – Determination of metals in royal
water extracts of soil - atomic absorption spectrometry methods by flame and
electro thermal atomization.
Heavy metals
Heavy metals are elements with metallic properties, atomic number (NA)> 20, it
exist in soil from antropic sources, and in natural mode we found heavy metals in the earth.
Some metals are micronutrients needed in the development of plants (ex. Zn, Cu, Mn, Ni
and Co) while others are involved in the physiological processes of plants (ex. Cd, Pb, Hg).
The most common metal contaminants are Cd, Cr, Cu, Hg, Pb, Zn.
Soil pollution is an abiotic factor that occurs in the evaluation of vegetation stress.
The existence of pollutants in the soil cause acute injury or chronic plant according to the
threshold of tolerance of the target species and the effects can be visible (yellow leaf, the
appearance of black spots on the surface of leaves, reduced crest, the reduction in size of
the leaves, etc) or beams (effects occur only in the internal structure of plants, without
manifest externally).
In the Divici-Pojejena study area, According to the alert and intervention thresholds
for the chemical pollutants analyzed, provided by the Regulation on the assessment of
environmental pollution in Ordinance 756/97, in the case of Lead the alert threshold is
exceeded, values graphically represented in figure 3.55, and in the case of Copper the
threshold is exceeded Alert in the tailings area, values shown in chart 3.56.
Figure 3.55 – The values of concentration of Plumb in Divici-Pojejena wetland
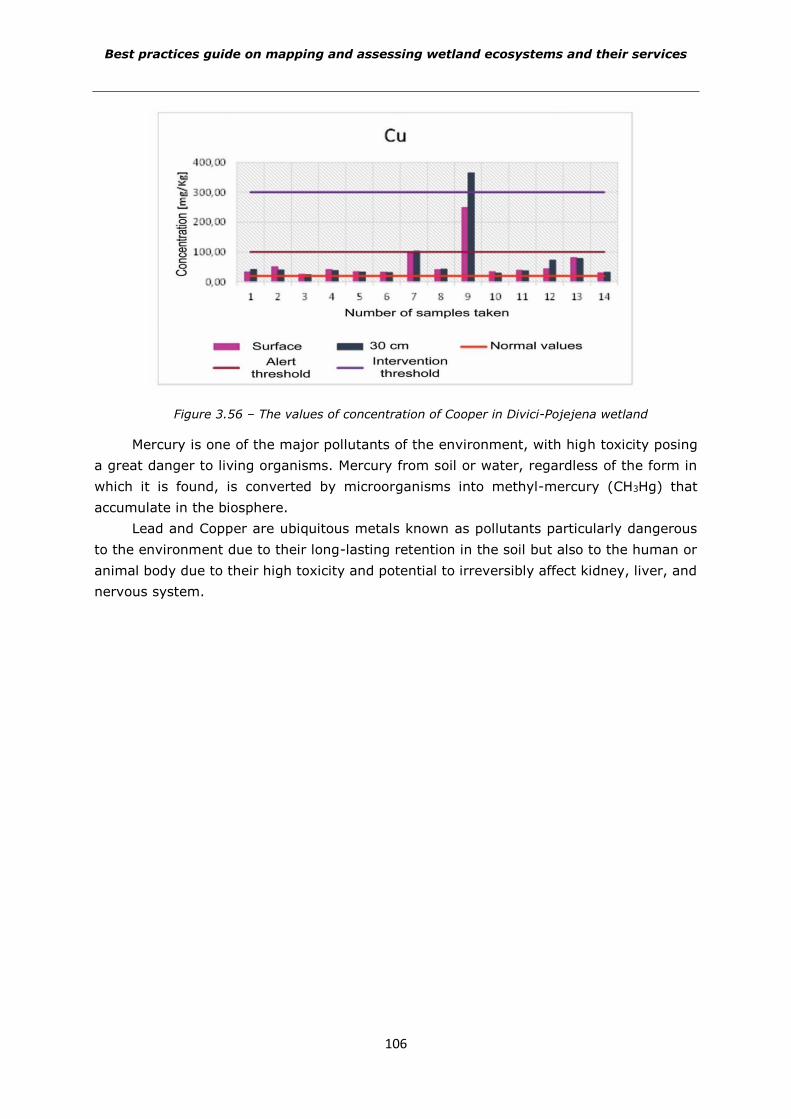
Best practices guide on mapping and assessing wetland ecosystems and their services
106
Figure 3.56 – The values of concentration of Cooper in Divici-Pojejena wetland
Mercury is one of the major pollutants of the environment, with high toxicity posing
a great danger to living organisms. Mercury from soil or water, regardless of the form in
which it is found, is converted by microorganisms into methyl-mercury (CH3Hg) that
accumulate in the biosphere.
Lead and Copper are ubiquitous metals known as pollutants particularly dangerous
to the environment due to their long-lasting retention in the soil but also to the human or
animal body due to their high toxicity and potential to irreversibly affect kidney, liver, and
nervous system.
Best practices guide on mapping and assessing wetland ecosystems and their services
107
CHAPTER. 4 ASSESSMENT OF THE ECOSYSTEM SERVICES. CASE
STUDY DIVICI-POJEJENA WETLAND
Over time, marshes, swamps, wetlands and peatlands have been associated as a
hostile environment, inaccessible and unproductive. Consequently, the wetlands have
suffered losses in particular by drainage areas and their use as polders in order to be
converted into agricultural land (Romanescu, 2004). Today, wetlands are recognized as
ecosystems that provide multiple services: high water level attenuation in floods, providing
food, improving water quality, climate regulation, etc.
In Romania, 19 sites were nominated as wetlands of international importance with a
total area of 1,156,448 hectares (Ministry of Environment, 2016). A total of 400,000
hectares of wetland habitats (mostly located along the Danube River) were permanently
or partially lost on Romanian territory (Decision no. 1081, 2013), from a total of 540,000
ha of floodplains in the Danube Lower (Staraș, 2001).
Wetlands, if there are sustainably managed, can provide a balance between services,
biodiversity and their status. The role of ecosystem services evaluation is to know the
potential of ecosystems to deliver these services as well as their fluxes. Once known these
issues, ecosystems and their services can be managed in a sustainable way.
In the following sections of this chapter ecosystem services are treated according to
the CICES classification with specific adaptation of the fresh water ecosystems according
to MAES et al, 2014 report. This report deals with the evaluation of ecosystem services
nationally as is recommended by European Union to its Member States. It also presents
methods for ecosystem services quantification as well as the results of applying such
methods locally to Divici-Pojejena wetland.
4.1 Provisioning services
The assessment of ecosystem services is based on the working diagram "in cascade"
which defines the links between the ecosystems and the services they provide (Haines-
Young & Potschin, 2010). Thus are defined the indicators of "potential" for the use of
services provided by ecosystems functions as well as indicators defined as the "benefit" of
the used service. There have been filled fact sheets containing the description of the
calculation mode for the indicators whose approach was considered relevant and whose
measurement methods can be applied, as appropriate, to wetlands ecosystems in
Romania.
In the following table (Table 4.1), offered as example, are centralized indicators
identified for each class of provisioning services. The approach of each ecosystem service,
respectively of each indicator that defines the service, was based on the reports of the
working group MAES considering the specificity of wetlands in Romania.
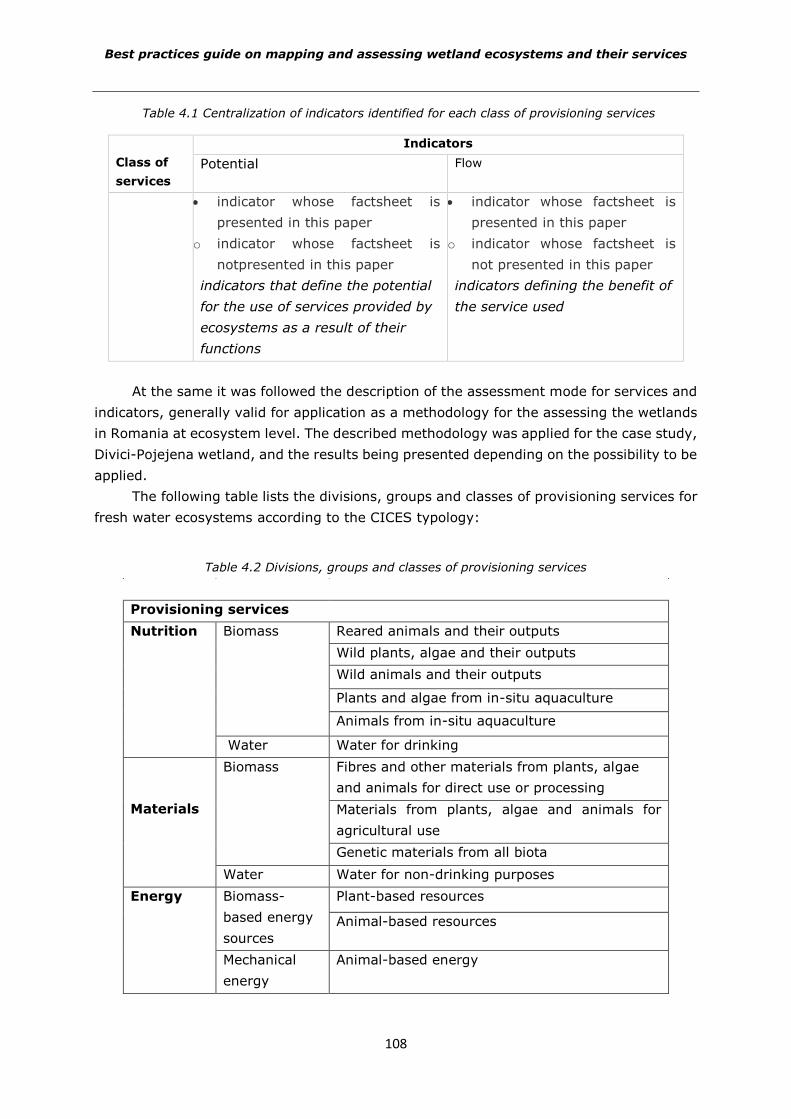
Best practices guide on mapping and assessing wetland ecosystems and their services
108
Table 4.1 Centralization of indicators identified for each class of provisioning services
Class of
services
Indicators
Potential Flow
indicator whose factsheet is
presented in this paper
o indicator whose factsheet is
notpresented in this paper
indicators that define the potential
for the use of services provided by
ecosystems as a result of their
functions
indicator whose factsheet is
presented in this paper
o indicator whose factsheet is
not presented in this paper
indicators defining the benefit of
the service used
At the same it was followed the description of the assessment mode for services and
indicators, generally valid for application as a methodology for the assessing the wetlands
in Romania at ecosystem level. The described methodology was applied for the case study,
Divici-Pojejena wetland, and the results being presented depending on the possibility to be
applied.
The following table lists the divisions, groups and classes of provisioning services for
fresh water ecosystems according to the CICES typology:
Table 4.2 Divisions, groups and classes of provisioning services
Provisioning services
Nutrition Biomass Reared animals and their outputs
Wild plants, algae and their outputs
Wild animals and their outputs
Plants and algae from in-situ aquaculture
Animals from in-situ aquaculture
Water Water for drinking
Materials
Biomass Fibres and other materials from plants, algae
and animals for direct use or processing
Materials from plants, algae and animals for
agricultural use
Genetic materials from all biota
Water Water for non-drinking purposes
Energy Biomass-
based energy
sources
Plant-based resources
Animal-based resources
Mechanical
energy
Animal-based energy
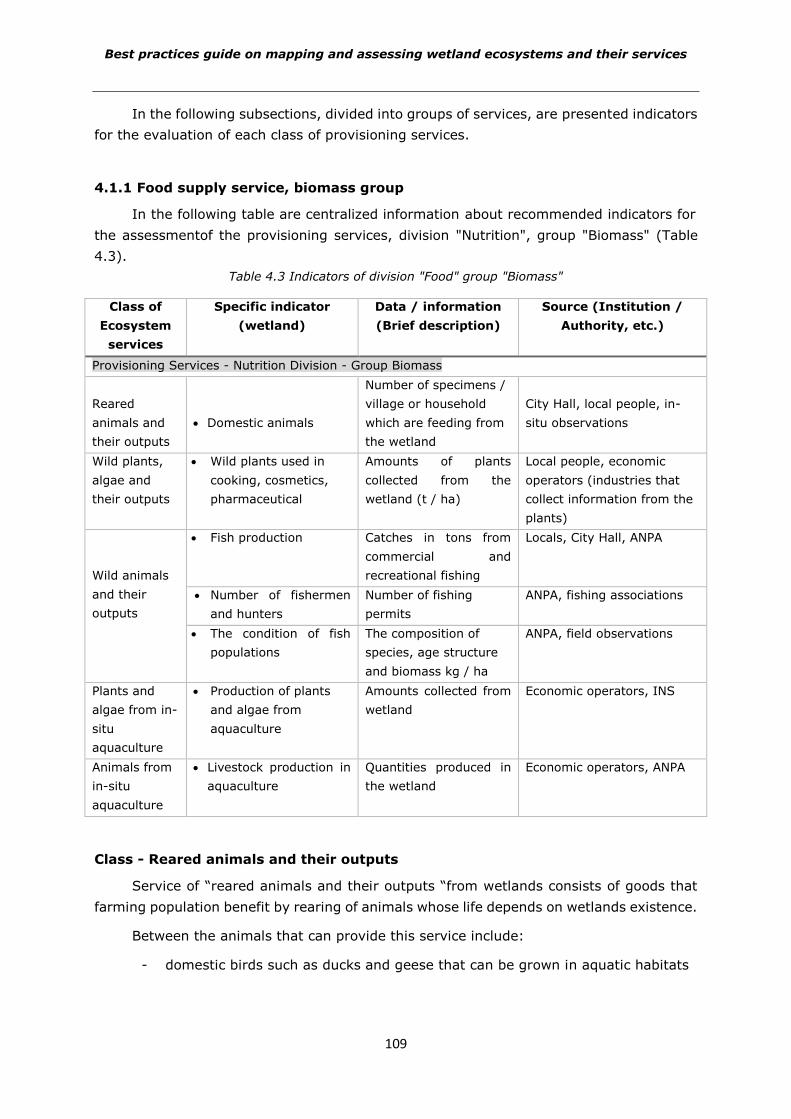
Best practices guide on mapping and assessing wetland ecosystems and their services
109
In the following subsections, divided into groups of services, are presented indicators
for the evaluation of each class of provisioning services.
4.1.1 Food supply service, biomass group
In the following table are centralized information about recommended indicators for
the assessmentof the provisioning services, division "Nutrition", group "Biomass" (Table
4.3).
Table 4.3 Indicators of division "Food" group "Biomass"
Class of
Ecosystem
services
Specific indicator
(wetland)
Data / information
(Brief description)
Source (Institution /
Authority, etc.)
Provisioning Services - Nutrition Division - Group Biomass
Reared
animals and
their outputs
Domestic animals
Number of specimens /
village or household
which are feeding from
the wetland
City Hall, local people, in-
situ observations
Wild plants,
algae and
their outputs
Wild plants used in
cooking, cosmetics,
pharmaceutical
Amounts of plants
collected from the
wetland (t / ha)
Local people, economic
operators (industries that
collect information from the
plants)
Wild animals
and their
outputs
Fish production Catches in tons from
commercial and
recreational fishing
Locals, City Hall, ANPA
Number of fishermen
and hunters
Number of fishing
permits
ANPA, fishing associations
The condition of fish
populations
The composition of
species, age structure
and biomass kg / ha
ANPA, field observations
Plants and
algae from in-
situ
aquaculture
Production of plants
and algae from
aquaculture
Amounts collected from
wetland
Economic operators, INS
Animals from
in-situ
aquaculture
Livestock production in
aquaculture
Quantities produced in
the wetland
Economic operators, ANPA
Class - Reared animals and their outputs
Service of “reared animals and their outputs “from wetlands consists of goods that
farming population benefit by rearing of animals whose life depends on wetlands existence.
Between the animals that can provide this service include:
- domestic birds such as ducks and geese that can be grown in aquatic habitats
Best practices guide on mapping and assessing wetland ecosystems and their services
110
- domestic animals such as cows, sheep, pigs, horses, etc. which can feed in
wetland proximity from terrestrial habitats (areas close to the aquatic habitat or
formed in periods after the water withdrawing).
Derivatives from these animals are related to the production of eggs, milk, wool, etc.
In the quantification of this service should be taken into account that not all animals kept
in localities near wetlands depend on the existence of these ecosystems. Their growth may
depend in particular on agricultural crops, pastures outside of wetlands, etc.
In the following table is centralized information on indicators corresponding to the
class of services "Reared animals and their outputs ".
Table 4.4 Centralization of indicators from the class of services "Reared animals and their outputs”
Class
Indicators
Potential Flux
Reared animals and
their outputs
o Availability of fodder
(e.g hectares of
temporarily flooded
pastures)
Animals (cows, geese, ducks,
pigs, chickens, etc.)
o Derivatives of livestock (milk,
cheese, eggs, etc.)
In the following factsheet (Table 4.5) is treated the indicator "Domestic animals"
which aims to estimate the number of specimens of animals whose growth depends on
wetlands.
Table 4.5 Indicator domestic animals
Ecosystem services
section:
Provisioning services
Division:
Nutrition
Group:
Biomass
Class: Reared animals and their outputs
Indicator of ecosystem service: domestic animals
Available/required data: http://statistici.insse.ro/shop/
Scale: local scale, neighbouring villages of wetland
Method of measurement: questionnaires, statistics
Suitability for mapping: low
Description of the indicators [u.m.]: Number of specimens/species
Calculation mothod:
Will be quantified specimens from domestic animals species of whose way of life is
dependent on wetlands. To estimate the number of copies will be combined
information from questionnaires distributed to locals and from statistical information.
Method: distribution of questionnaires
Will be achieved through survey for residents of wetlands’ neighbouring villages. The
questionnaire will consider providing information about the species of animals (ducks,
geese, etc.) whose way of life and feeding depends on wetlands near localities.
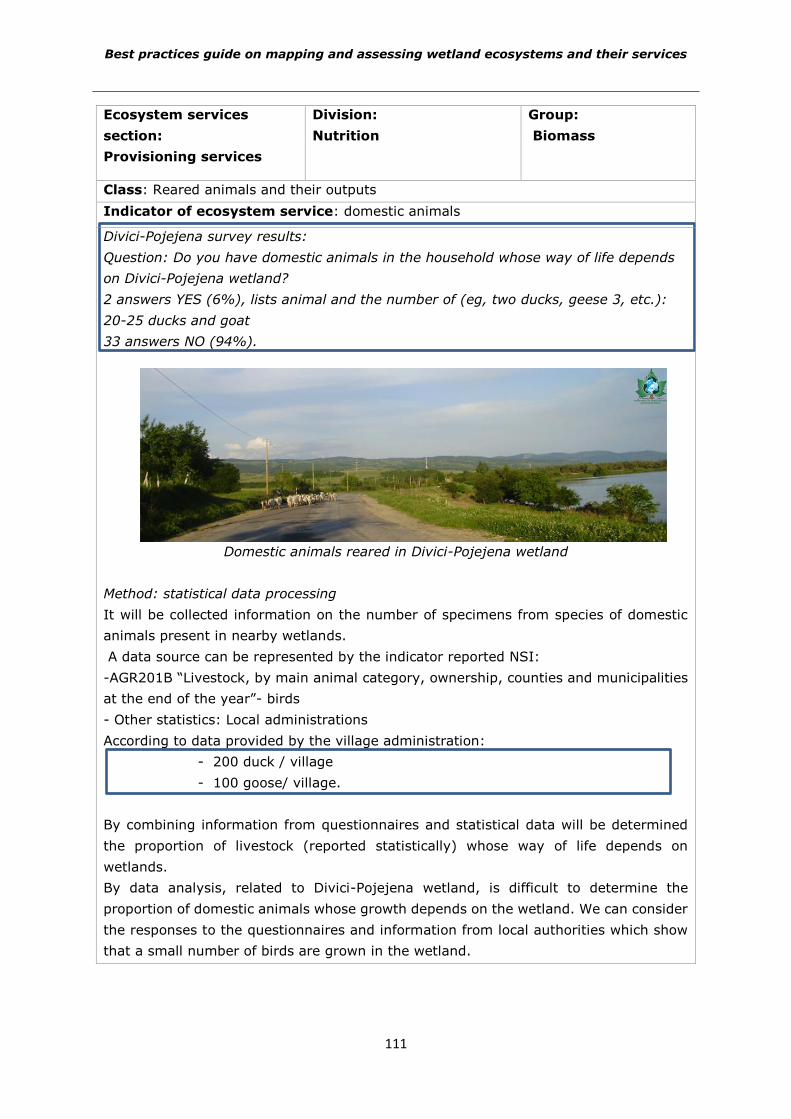
Best practices guide on mapping and assessing wetland ecosystems and their services
111
Ecosystem services
section:
Provisioning services
Division:
Nutrition
Group:
Biomass
Class: Reared animals and their outputs
Indicator of ecosystem service: domestic animals
Divici-Pojejena survey results:
Question: Do you have domestic animals in the household whose way of life depends
on Divici-Pojejena wetland?
2 answers YES (6%), lists animal and the number of (eg, two ducks, geese 3, etc.):
20-25 ducks and goat
33 answers NO (94%).
Domestic animals reared in Divici-Pojejena wetland
Method: statistical data processing
It will be collected information on the number of specimens from species of domestic
animals present in nearby wetlands.
A data source can be represented by the indicator reported NSI:
-AGR201B “Livestock, by main animal category, ownership, counties and municipalities
at the end of the year”- birds
- Other statistics: Local administrations
According to data provided by the village administration:
- 200 duck / village
- 100 goose/ village.
By combining information from questionnaires and statistical data will be determined
the proportion of livestock (reported statistically) whose way of life depends on
wetlands.
By data analysis, related to Divici-Pojejena wetland, is difficult to determine the
proportion of domestic animals whose growth depends on the wetland. We can consider
the responses to the questionnaires and information from local authorities which show
that a small number of birds are grown in the wetland.
Best practices guide on mapping and assessing wetland ecosystems and their services
112
Ecosystem services
section:
Provisioning services
Division:
Nutrition
Group:
Biomass
Class: Reared animals and their outputs
Indicator of ecosystem service: domestic animals
In these circumstances this service offered by the wetland can be considered
unexploited, being potential to growth birds (such as ducks and geese) and other
domestic animals (e.g. goats) in wetland.
Data source: INS, local people, municipalities.
Class- wild plants, algae and their outputs
Wild plants, algae and their derivatives can be collected from wetlands by local people
and/or companies specialized in this activity. Collected species and their quantities will be
determined by obtaining data on these activities, as appropriate: from local people and/or
companies and from administrative entities from that area (e.g. municipalities).
To assess this service in Pojejena Divici wetland were surveyed local people and
local authorities have been consulted. In conclusion, this service provided by Divici-
Pojejena wetland is not used.
Class - Wild animals and their outputs
One of the main services provided by wetlands is related to the production of fish.
Wetlands can be a favourable habitat for breeding, spawning and living for different fish
species. At global level the fish catch from inland wetlands was raised to 11.2 million tons
while the production of fish from aquaculture production was 41.7 million tons, in 2010
(FAO, 2012).
Fishing and aquaculture occupied and still occupy an important place among areas of
national interest. Although the fisheries sector made a small contribution to the national
economy, the importance of this sector is given especially by the social role that it has to
population in coastal areas ( the resulted financial resources support a significant portion
of the population) by potential food resources (Fishing Operational Program – Romania
2007-2013).
The people living near wetlands benefit from this service by having access to this
resource which in most cases is the main source of income and food provision.
Rivers and associated ecosystems (wetlands) are biologically productive entities and
provide suitable living conditions for many species of plants and animals. Characteristic
ecosystems of major rivers are among the most productive aquatic ecosystems.
At national and European level have been developed and are constantly revising a
number of policies and regulatory measures in fisheries and aquaculture. Policies for the
use of aquatic bio-resources include aspects relating to the conservation, management and
sustainable use of water resources and provide a wide range of issues related to water
resources types, methods of conservation and capitalization.
Best practices guide on mapping and assessing wetland ecosystems and their services
113
Their implementation at national level face a number of difficulties related primarily
to the relatively high costs involved for implementation, the resistance at changes of those
accustomed with old trends in exploitation of aquatic resources without taking into account
the possibility of regenerating them, etc.
In Romania, most economic activities within aquatic ecosystems are based on
valorisation of the main water resource, fish, by fishing and aquaculture.
The structure of the fishery stock in Romania:
85% are cyprinids both Indigenous and Asian origin
15% are perch, pike, catfish, sturgeon and freshwater salmonids.
Productive fields in the fisheries sector in Romania are: aquaculture, capture fishing
in the Black Sea and inland capture fishing. As results of aquatic ecosystems deterioration
and uncontrolled exploitation was reached the diminishing stocks of various species of
freshwater and marine. However, in recent years it has been a slight trend of improvement
for major biotic component of aquatic ecosystems (National Strategic Plan for Fisheries
2007-2013).
Activities of exploiting aquatic bio-resources require a legislative framework
governing the tasks of using water resources and obligations in the protection,
conservation and sustainable use them. The following table are centralized information on
indicators from the class of service "Wild animals and their outputs" (Table 4.6).
Table 4.6 Centralization of indicators from the class of services "Wild animals and their outputs"
Class Indicators
Potential Flux
Wildlife and their
outputs
Condition of fish
populations
o Fish production
o Number of fishermen and hunters
o Fish production/commercial capture
The commercial fishing from the proximity of Divici-Pojejena wetland is practiced on
the Danube River at a distance of approx. 63 km. In addition to commercial fishing, an
activity that provides benefits to those who undertake it is the practice of sport and
recreational fishing.
According to data provided by National Agency for Fishing and Aquaculture (ANPA)
in the Register of Ships and Fishing Boats, on the Danube River between km 1012 and km
1075, a sector that includes Divici-Pojejena wetland, the situation of boats used for
commercial fishing shows that there are a total of 75 boats involved in this activity.
Data obtained from the Fishing Association Divici revealed that in the area are
authorized 65 fishermen for the practice of recreational and sport fishing.
According to data provided by ANPA in 2016, on the river sector between km 1012
and km 1075, sector which comprise the Divici-Pojejena wetland:
-is expected to be captured (admissible) 197,7 tons from which 174,7 tons with
provenance from commercial fishing and 23 tons from recreational and sport fishing.
-total admissible capture for species is:
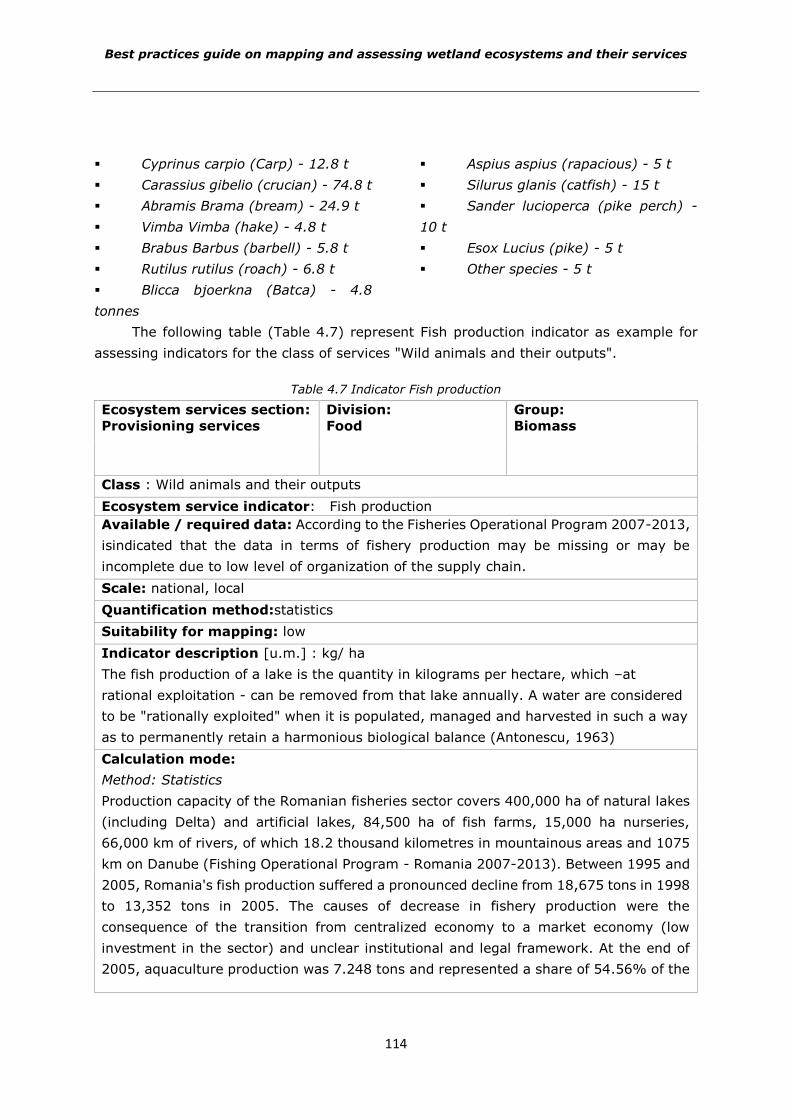
Best practices guide on mapping and assessing wetland ecosystems and their services
114
Cyprinus carpio (Carp) - 12.8 t
Carassius gibelio (crucian) - 74.8 t
Abramis Brama (bream) - 24.9 t
Vimba Vimba (hake) - 4.8 t
Brabus Barbus (barbell) - 5.8 t
Rutilus rutilus (roach) - 6.8 t
Blicca bjoerkna (Batca) - 4.8
tonnes
Aspius aspius (rapacious) - 5 t
Silurus glanis (catfish) - 15 t
Sander lucioperca (pike perch) -
10 t
Esox Lucius (pike) - 5 t
Other species - 5 t
The following table (Table 4.7) represent Fish production indicator as example for
assessing indicators for the class of services "Wild animals and their outputs".
Table 4.7 Indicator Fish production
Ecosystem services section:
Provisioning services
Division:
Food
Group:
Biomass
Class : Wild animals and their outputs
Ecosystem service indicator: Fish production
Available / required data: According to the Fisheries Operational Program 2007-2013,
isindicated that the data in terms of fishery production may be missing or may be
incomplete due to low level of organization of the supply chain.
Scale: national, local
Quantification method:statistics
Suitability for mapping: low
Indicator description [u.m.] : kg/ ha
The fish production of a lake is the quantity in kilograms per hectare, which –at
rational exploitation - can be removed from that lake annually. A water are considered
to be "rationally exploited" when it is populated, managed and harvested in such a way
as to permanently retain a harmonious biological balance (Antonescu, 1963)
Calculation mode:
Method: Statistics
Production capacity of the Romanian fisheries sector covers 400,000 ha of natural lakes
(including Delta) and artificial lakes, 84,500 ha of fish farms, 15,000 ha nurseries,
66,000 km of rivers, of which 18.2 thousand kilometres in mountainous areas and 1075
km on Danube (Fishing Operational Program - Romania 2007-2013). Between 1995 and
2005, Romania's fish production suffered a pronounced decline from 18,675 tons in 1998
to 13,352 tons in 2005. The causes of decrease in fishery production were the
consequence of the transition from centralized economy to a market economy (low
investment in the sector) and unclear institutional and legal framework. At the end of
2005, aquaculture production was 7.248 tons and represented a share of 54.56% of the
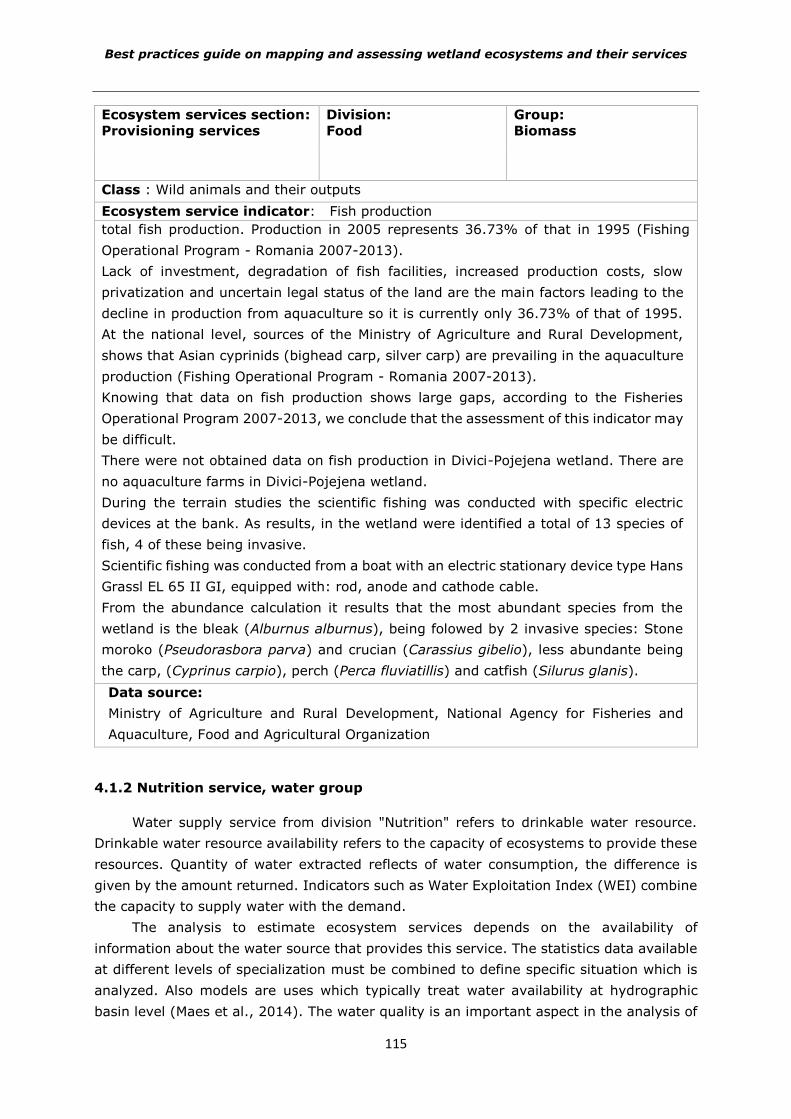
Best practices guide on mapping and assessing wetland ecosystems and their services
115
Ecosystem services section:
Provisioning services
Division:
Food
Group:
Biomass
Class : Wild animals and their outputs
Ecosystem service indicator: Fish production
total fish production. Production in 2005 represents 36.73% of that in 1995 (Fishing
Operational Program - Romania 2007-2013).
Lack of investment, degradation of fish facilities, increased production costs, slow
privatization and uncertain legal status of the land are the main factors leading to the
decline in production from aquaculture so it is currently only 36.73% of that of 1995.
At the national level, sources of the Ministry of Agriculture and Rural Development,
shows that Asian cyprinids (bighead carp, silver carp) are prevailing in the aquaculture
production (Fishing Operational Program - Romania 2007-2013).
Knowing that data on fish production shows large gaps, according to the Fisheries
Operational Program 2007-2013, we conclude that the assessment of this indicator may
be difficult.
There were not obtained data on fish production in Divici-Pojejena wetland. There are
no aquaculture farms in Divici-Pojejena wetland.
During the terrain studies the scientific fishing was conducted with specific electric
devices at the bank. As results, in the wetland were identified a total of 13 species of
fish, 4 of these being invasive.
Scientific fishing was conducted from a boat with an electric stationary device type Hans
Grassl EL 65 II GI, equipped with: rod, anode and cathode cable.
From the abundance calculation it results that the most abundant species from the
wetland is the bleak (Alburnus alburnus), being folowed by 2 invasive species: Stone
moroko (Pseudorasbora parva) and crucian (Carassius gibelio), less abundante being
the carp, (Cyprinus carpio), perch (Perca fluviatillis) and catfish (Silurus glanis).
Data source:
Ministry of Agriculture and Rural Development, National Agency for Fisheries and
Aquaculture, Food and Agricultural Organization
4.1.2 Nutrition service, water group
Water supply service from division "Nutrition" refers to drinkable water resource.
Drinkable water resource availability refers to the capacity of ecosystems to provide these
resources. Quantity of water extracted reflects of water consumption, the difference is
given by the amount returned. Indicators such as Water Exploitation Index (WEI) combine
the capacity to supply water with the demand.
The analysis to estimate ecosystem services depends on the availability of
information about the water source that provides this service. The statistics data available
at different levels of specialization must be combined to define specific situation which is
analyzed. Also models are uses which typically treat water availability at hydrographic
basin level (Maes et al., 2014). The water quality is an important aspect in the analysis of
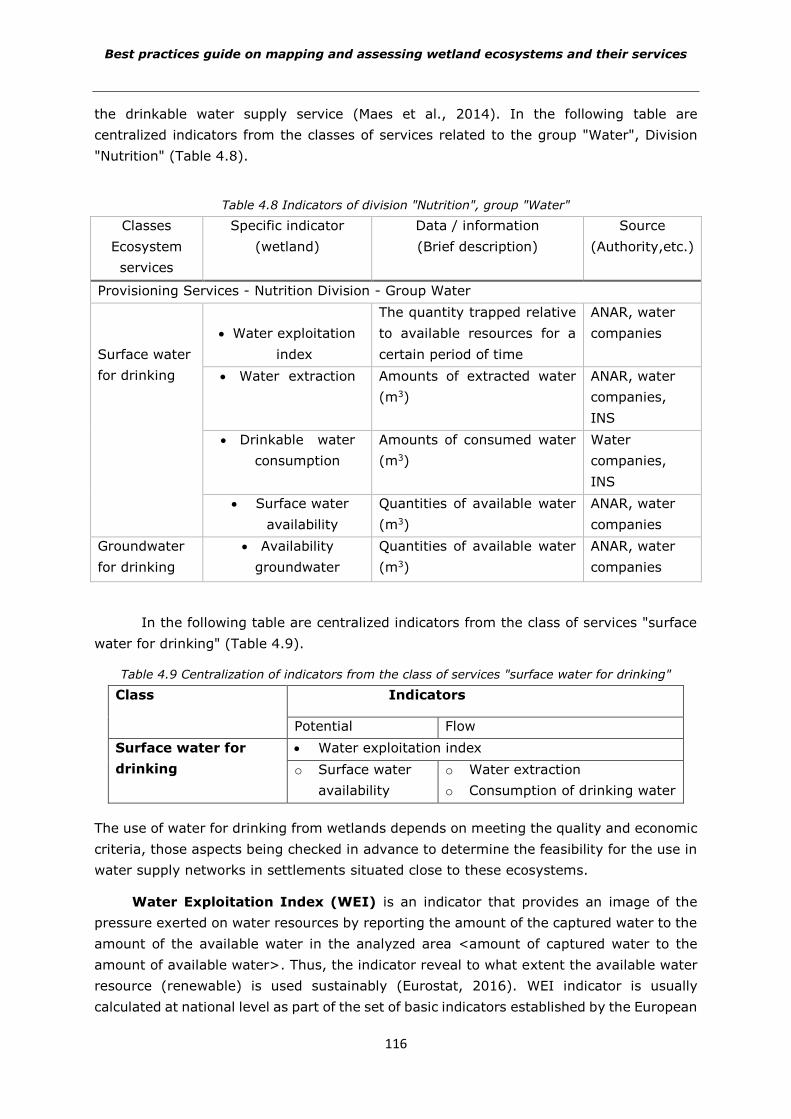
Best practices guide on mapping and assessing wetland ecosystems and their services
116
the drinkable water supply service (Maes et al., 2014). In the following table are
centralized indicators from the classes of services related to the group "Water", Division
"Nutrition" (Table 4.8).
Table 4.8 Indicators of division "Nutrition", group "Water"
Classes
Ecosystem
services
Specific indicator
(wetland)
Data / information
(Brief description)
Source
(Authority,etc.)
Provisioning Services - Nutrition Division - Group Water
Surface water
for drinking
Water exploitation
index
The quantity trapped relative
to available resources for a
certain period of time
ANAR, water
companies
Water extraction Amounts of extracted water
(m3)
ANAR, water
companies,
INS
Drinkable water
consumption
Amounts of consumed water
(m3)
Water
companies,
INS
Surface water
availability
Quantities of available water
(m3)
ANAR, water
companies
Groundwater
for drinking
Availability
groundwater
Quantities of available water
(m3)
ANAR, water
companies
In the following table are centralized indicators from the class of services "surface
water for drinking" (Table 4.9).
Table 4.9 Centralization of indicators from the class of services "surface water for drinking"
Class Indicators
Potential Flow
Surface water for
drinking
Water exploitation index
o Surface water
availability
o Water extraction
o Consumption of drinking water
The use of water for drinking from wetlands depends on meeting the quality and economic
criteria, those aspects being checked in advance to determine the feasibility for the use in
water supply networks in settlements situated close to these ecosystems.
Water Exploitation Index (WEI) is an indicator that provides an image of the
pressure exerted on water resources by reporting the amount of the captured water to the
amount of the available water in the analyzed area <amount of captured water to the
amount of available water>. Thus, the indicator reveal to what extent the available water
resource (renewable) is used sustainably (Eurostat, 2016). WEI indicator is usually
calculated at national level as part of the set of basic indicators established by the European
Best practices guide on mapping and assessing wetland ecosystems and their services
117
Environment Agency for the periodical reports of the Member States of the European Union.
Romania is in this ranking among the countries with an exploitation index of water below
the 20% threshold, in the last decade, indicating that the water resource is not subject to
significant quantitative pressures (Eurostat, 2016).
This indicator can be used also to represent the parameters defining the service of
water provisioning: resource availability and its use. The indicator can provide information
about the exploitation of water provisioning service in relation to resource availability. It is
noted that the indicator is calculated taking into account the cumulative water consumption
in all sectors using this resource.
WEI value calculated at the national level can hide some discrepancies between
different regions of the country. In the National Plan for the Hydrographic Basins in
Romania theresults of the WEI calculation are presented for each major hydrographic
basins in Romania. The values are variating between 2.68 % in Someș-Tisa basin and
43.33% in Prut-Bârlad. Thus, some areas located in the southern Romania, Dobrogea
region (bordering the Black Sea and Danube Delta) and part of Central Moldavian Plateau
is at risk of water scarcity and drought (National Administration of Romanian Waters,
2013).
WEI indicator presents limitations on the amount of water which is returned (for
example, water used for energy purposes is almost fully returned to the source from which
has been abstracted). Also, the indicator does not capture the spatial and temporal
differences within the analyzed area. Thus the WEI+ indicator was introduced, which aims
to analyze the use and availability of water resources including small areas (river basins
with inferior ranks, water body) and for periods smaller than a year (monthly or seasonal).
In the calculation of this indicator from the abstracted quantities of the examined area is
subtracted the returned quantity, after which the result is reported to the available
resource (Eurostat, 2016).
European Environment Agency (EEA, 2016) published a map representing WEI+
indicator, calculated at the level of the main sub-basins in the EU (according to the ECRINS
boundaries) for the summer season. The period for which the values where reported is
between 2000 and 2012 (Figure 4.2). On the same map, with representation of WEI+ for
the river basins, are overlapped also information about the population distribution in
localities (EEA, 2016).
The European Environment Agency has provided an application to map the evolution
of the value of the Water Exploitation Index at the level of the main river basins in Europe
(Figure 4.1), (EEA, 2015). Figure 4.2 extracts a WEI distribution for the main river basins
in Romania in the summer of 2012. The information on Surface Water Availability, Water
Extraction and Water Consumption is included in the WEI+ calculation and the calculation
method for these indicators is presented in the following sheets, belonging to the service
class "Surface water for drinking".
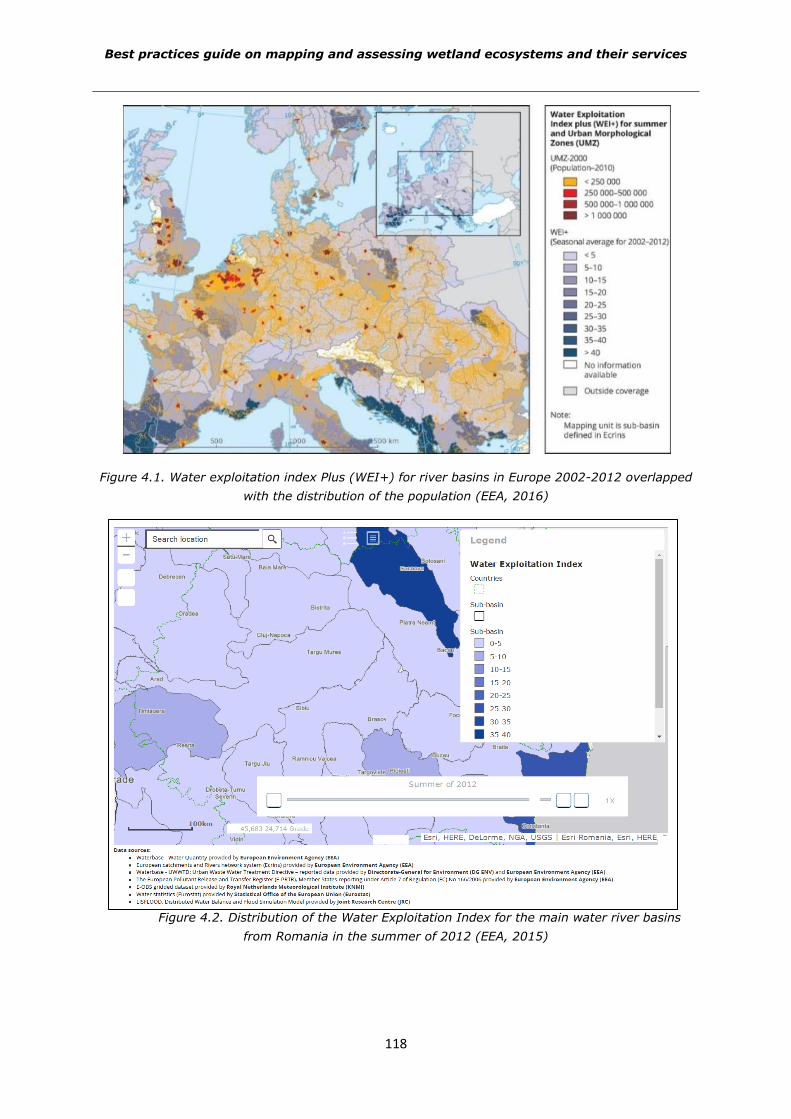
Best practices guide on mapping and assessing wetland ecosystems and their services
118
Figure 4.1. Water exploitation index Plus (WEI+) for river basins in Europe 2002-2012 overlapped
with the distribution of the population (EEA, 2016)
Figure 4.2. Distribution of the Water Exploitation Index for the main water river basins
from Romania in the summer of 2012 (EEA, 2015)
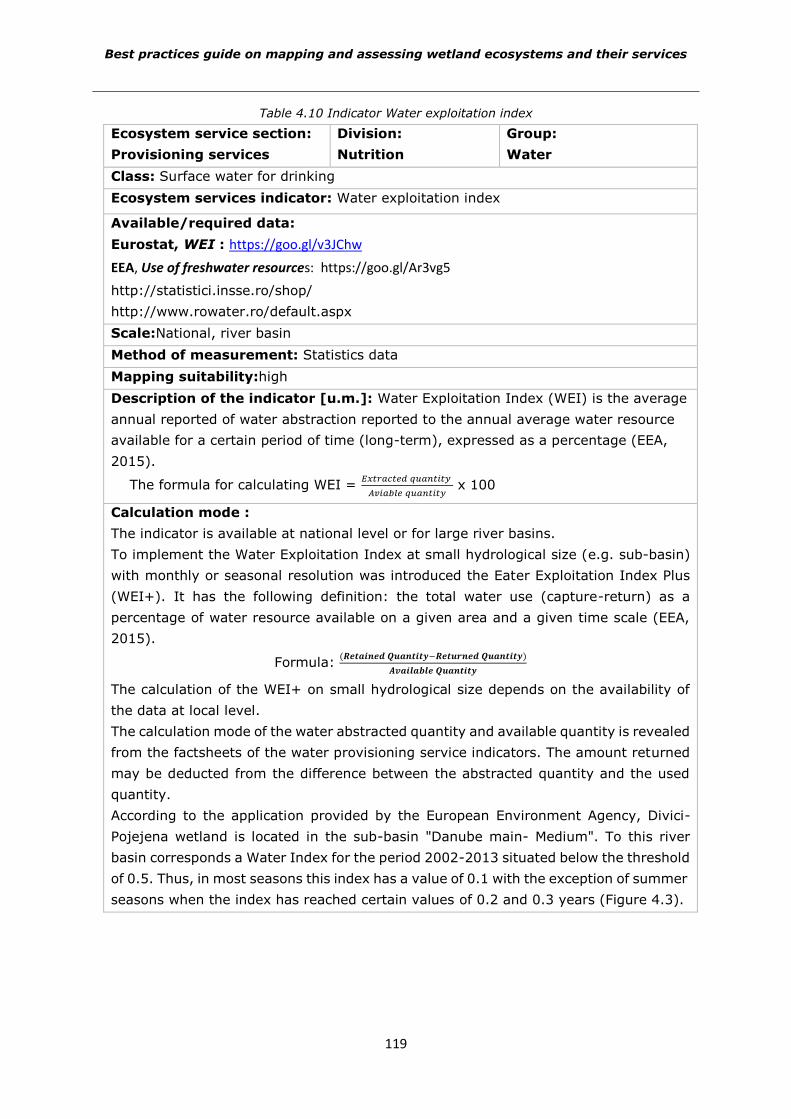
Best practices guide on mapping and assessing wetland ecosystems and their services
119
Table 4.10 Indicator Water exploitation index
Ecosystem service section:
Provisioning services
Division:
Nutrition
Group:
Water
Class: Surface water for drinking
Ecosystem services indicator: Water exploitation index
Available/required data:
Eurostat, WEI : https://goo.gl/v3JChw
EEA, Use of freshwater resources: https://goo.gl/Ar3vg5
http://statistici.insse.ro/shop/
http://www.rowater.ro/default.aspx
Scale:National, river basin
Method of measurement: Statistics data
Mapping suitability:high
Description of the indicator [u.m.]: Water Exploitation Index (WEI) is the average
annual reported of water abstraction reported to the annual average water resource
available for a certain period of time (long-term), expressed as a percentage (EEA,
2015).
The formula for calculating WEI = 𝐸𝑥𝑡𝑟𝑎𝑐𝑡𝑒𝑑 𝑞𝑢𝑎𝑛𝑡𝑖𝑡𝑦
𝐴𝑣𝑖𝑎𝑏𝑙𝑒 𝑞𝑢𝑎𝑛𝑡𝑖𝑡𝑦 x 100
Calculation mode :
The indicator is available at national level or for large river basins.
To implement the Water Exploitation Index at small hydrological size (e.g. sub-basin)
with monthly or seasonal resolution was introduced the Eater Exploitation Index Plus
(WEI+). It has the following definition: the total water use (capture-return) as a
percentage of water resource available on a given area and a given time scale (EEA,
2015).
Formula: (𝑹𝒆𝒕𝒂𝒊𝒏𝒆𝒅 𝑸𝒖𝒂𝒏𝒕𝒊𝒕𝒚−𝑹𝒆𝒕𝒖𝒓𝒏𝒆𝒅 𝑸𝒖𝒂𝒏𝒕𝒊𝒕𝒚)
𝑨𝒗𝒂𝒊𝒍𝒂𝒃𝒍𝒆 𝑸𝒖𝒂𝒏𝒕𝒊𝒕𝒚
The calculation of the WEI+ on small hydrological size depends on the availability of
the data at local level.
The calculation mode of the water abstracted quantity and available quantity is revealed
from the factsheets of the water provisioning service indicators. The amount returned
may be deducted from the difference between the abstracted quantity and the used
quantity.
According to the application provided by the European Environment Agency, Divici-
Pojejena wetland is located in the sub-basin "Danube main- Medium". To this river
basin corresponds a Water Index for the period 2002-2013 situated below the threshold
of 0.5. Thus, in most seasons this index has a value of 0.1 with the exception of summer
seasons when the index has reached certain values of 0.2 and 0.3 years (Figure 4.3).
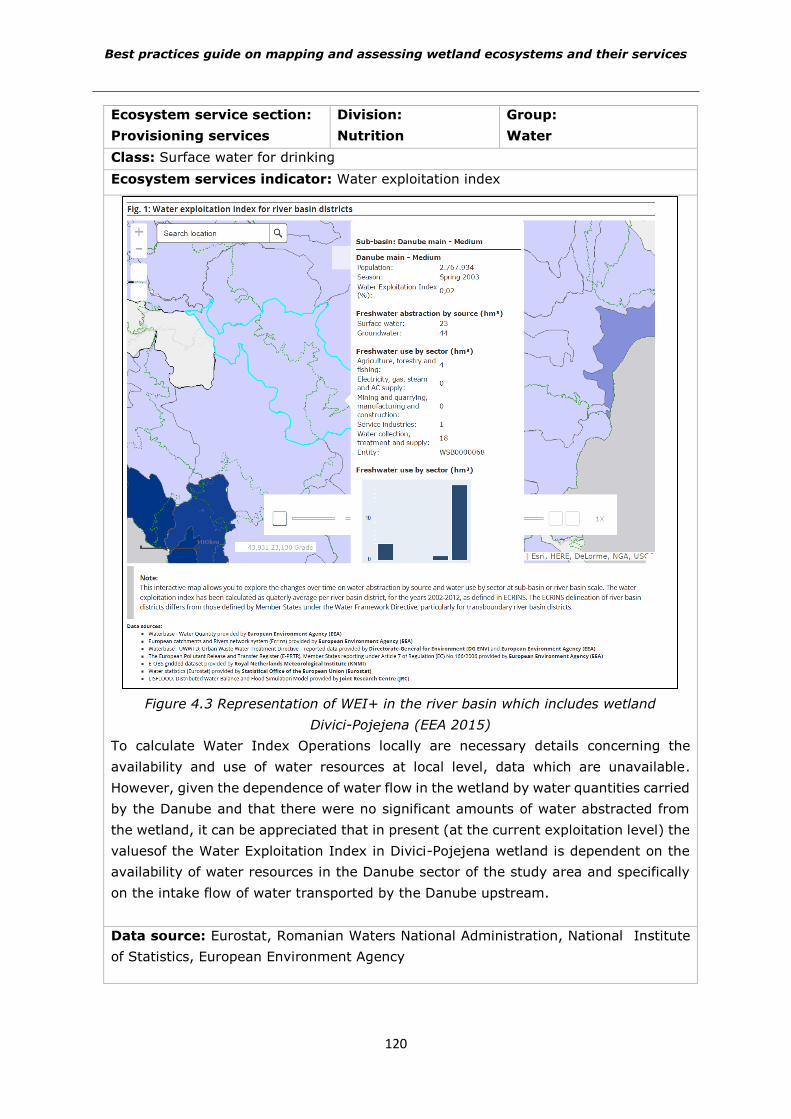
Best practices guide on mapping and assessing wetland ecosystems and their services
120
Ecosystem service section:
Provisioning services
Division:
Nutrition
Group:
Water
Class: Surface water for drinking
Ecosystem services indicator: Water exploitation index
Figure 4.3 Representation of WEI+ in the river basin which includes wetland
Divici-Pojejena (EEA 2015)
To calculate Water Index Operations locally are necessary details concerning the
availability and use of water resources at local level, data which are unavailable.
However, given the dependence of water flow in the wetland by water quantities carried
by the Danube and that there were no significant amounts of water abstracted from
the wetland, it can be appreciated that in present (at the current exploitation level) the
valuesof the Water Exploitation Index in Divici-Pojejena wetland is dependent on the
availability of water resources in the Danube sector of the study area and specifically
on the intake flow of water transported by the Danube upstream.
Data source: Eurostat, Romanian Waters National Administration, National Institute
of Statistics, European Environment Agency
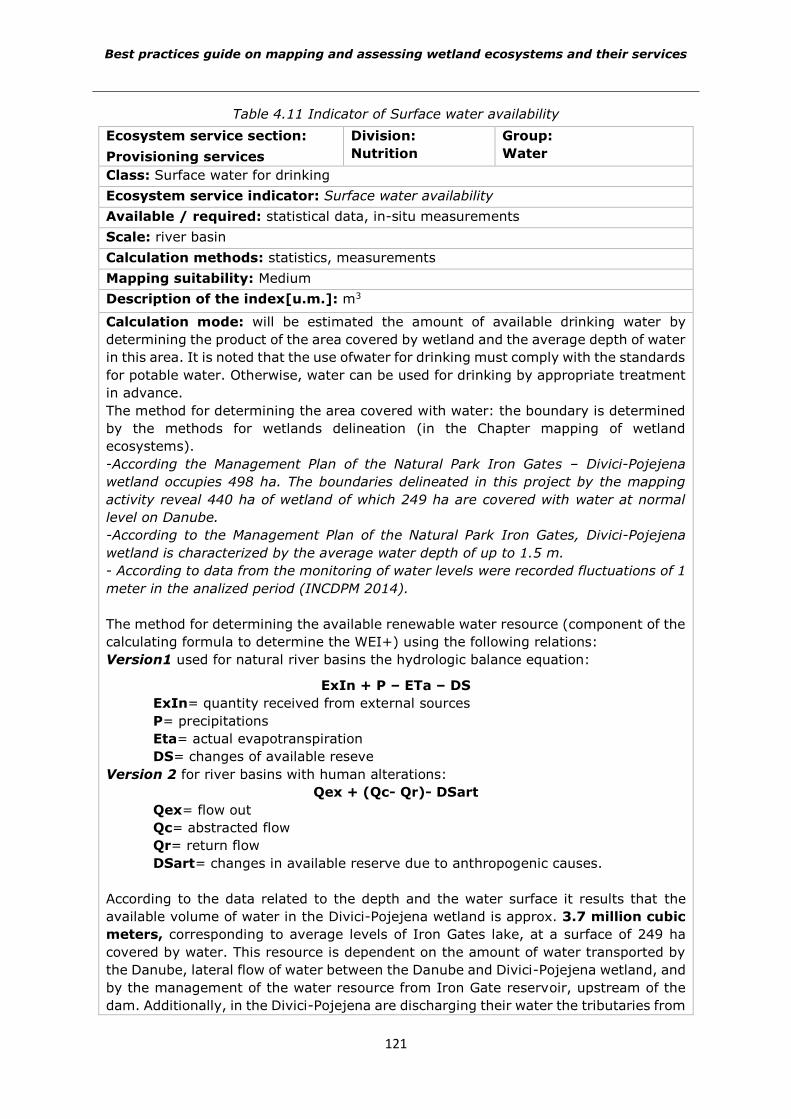
Best practices guide on mapping and assessing wetland ecosystems and their services
121
Table 4.11 Indicator of Surface water availability
Ecosystem service section:
Provisioning services
Division:
Nutrition
Group:
Water
Class: Surface water for drinking
Ecosystem service indicator: Surface water availability
Available / required: statistical data, in-situ measurements
Scale: river basin
Calculation methods: statistics, measurements
Mapping suitability: Medium
Description of the index[u.m.]: m3
Calculation mode: will be estimated the amount of available drinking water by
determining the product of the area covered by wetland and the average depth of water
in this area. It is noted that the use ofwater for drinking must comply with the standards
for potable water. Otherwise, water can be used for drinking by appropriate treatment
in advance.
The method for determining the area covered with water: the boundary is determined
by the methods for wetlands delineation (in the Chapter mapping of wetland
ecosystems).
-According the Management Plan of the Natural Park Iron Gates – Divici-Pojejena
wetland occupies 498 ha. The boundaries delineated in this project by the mapping
activity reveal 440 ha of wetland of which 249 ha are covered with water at normal
level on Danube.
-According to the Management Plan of the Natural Park Iron Gates, Divici-Pojejena
wetland is characterized by the average water depth of up to 1.5 m.
- According to data from the monitoring of water levels were recorded fluctuations of 1
meter in the analized period (INCDPM 2014).
The method for determining the available renewable water resource (component of the
calculating formula to determine the WEI+) using the following relations:
Version1 used for natural river basins the hydrologic balance equation:
ExIn + P – ETa – DS
ExIn= quantity received from external sources
P= precipitations
Eta= actual evapotranspiration
DS= changes of available reseve
Version 2 for river basins with human alterations:
Qex + (Qc- Qr)- DSart
Qex= flow out
Qc= abstracted flow
Qr= return flow
DSart= changes in available reserve due to anthropogenic causes.
According to the data related to the depth and the water surface it results that the
available volume of water in the Divici-Pojejena wetland is approx. 3.7 million cubic
meters, corresponding to average levels of Iron Gates lake, at a surface of 249 ha
covered by water. This resource is dependent on the amount of water transported by
the Danube, lateral flow of water between the Danube and Divici-Pojejena wetland, and
by the management of the water resource from Iron Gate reservoir, upstream of the
dam. Additionally, in the Divici-Pojejena are discharging their water the tributaries from
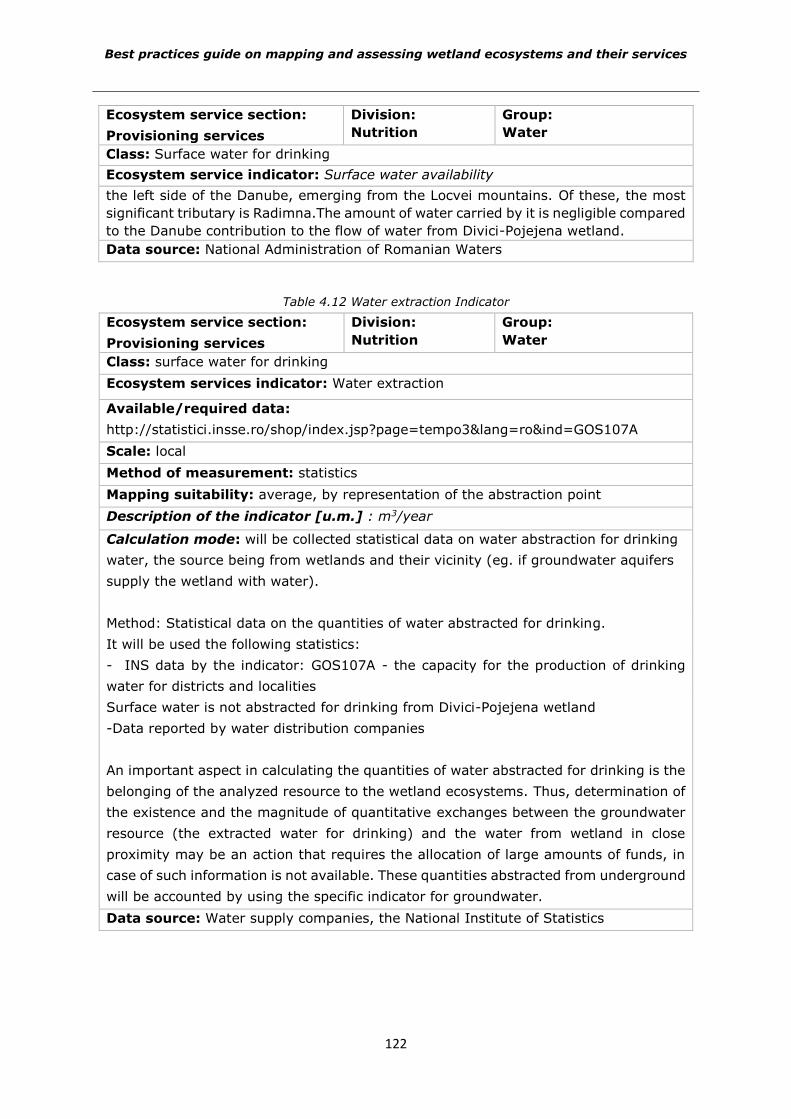
Best practices guide on mapping and assessing wetland ecosystems and their services
122
Ecosystem service section:
Provisioning services
Division:
Nutrition
Group:
Water
Class: Surface water for drinking
Ecosystem service indicator: Surface water availability
the left side of the Danube, emerging from the Locvei mountains. Of these, the most
significant tributary is Radimna.The amount of water carried by it is negligible compared
to the Danube contribution to the flow of water from Divici-Pojejena wetland.
Data source: National Administration of Romanian Waters
Table 4.12 Water extraction Indicator
Ecosystem service section:
Provisioning services
Division:
Nutrition
Group:
Water
Class: surface water for drinking
Ecosystem services indicator: Water extraction
Available/required data:
http://statistici.insse.ro/shop/index.jsp?page=tempo3&lang=ro&ind=GOS107A
Scale: local
Method of measurement: statistics
Mapping suitability: average, by representation of the abstraction point
Description of the indicator [u.m.] : m3/year
Calculation mode: will be collected statistical data on water abstraction for drinking
water, the source being from wetlands and their vicinity (eg. if groundwater aquifers
supply the wetland with water).
Method: Statistical data on the quantities of water abstracted for drinking.
It will be used the following statistics:
- INS data by the indicator: GOS107A - the capacity for the production of drinking
water for districts and localities
Surface water is not abstracted for drinking from Divici-Pojejena wetland
-Data reported by water distribution companies
An important aspect in calculating the quantities of water abstracted for drinking is the
belonging of the analyzed resource to the wetland ecosystems. Thus, determination of
the existence and the magnitude of quantitative exchanges between the groundwater
resource (the extracted water for drinking) and the water from wetland in close
proximity may be an action that requires the allocation of large amounts of funds, in
case of such information is not available. These quantities abstracted from underground
will be accounted by using the specific indicator for groundwater.
Data source: Water supply companies, the National Institute of Statistics
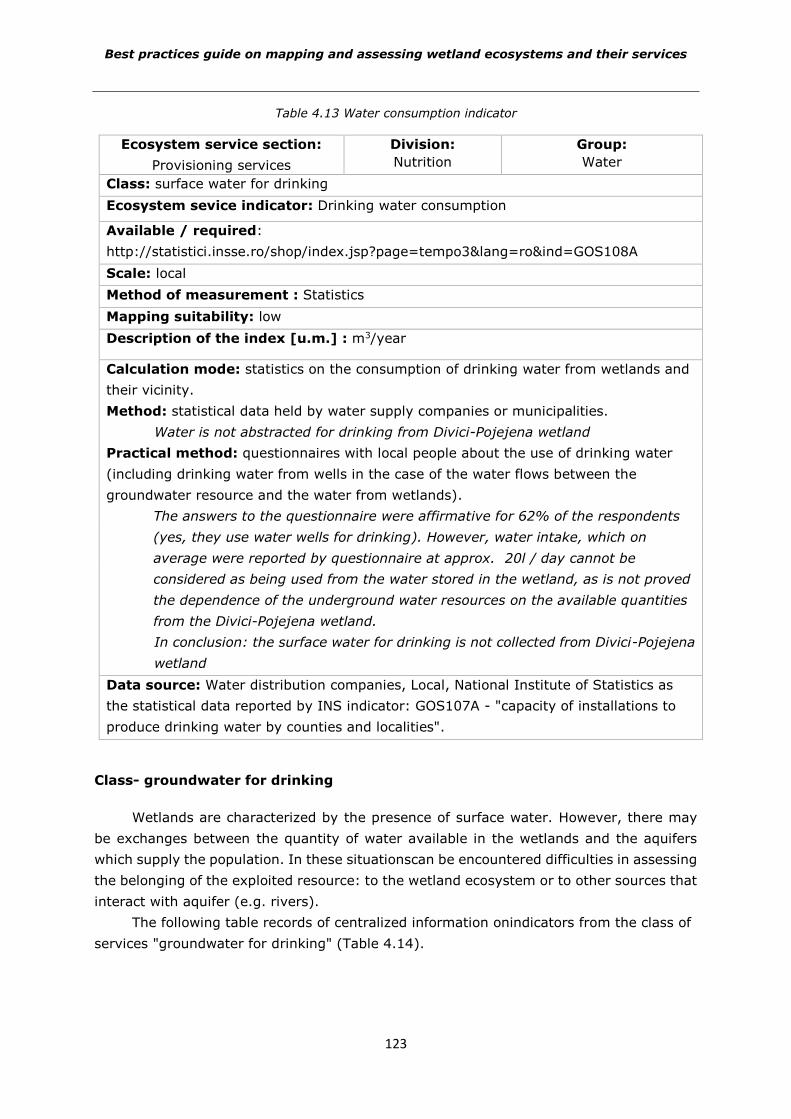
Best practices guide on mapping and assessing wetland ecosystems and their services
123
Table 4.13 Water consumption indicator
Class- groundwater for drinking
Wetlands are characterized by the presence of surface water. However, there may
be exchanges between the quantity of water available in the wetlands and the aquifers
which supply the population. In these situationscan be encountered difficulties in assessing
the belonging of the exploited resource: to the wetland ecosystem or to other sources that
interact with aquifer (e.g. rivers).
The following table records of centralized information onindicators from the class of
services "groundwater for drinking" (Table 4.14).
Ecosystem service section:
Provisioning services
Division:
Nutrition
Group:
Water
Class: surface water for drinking
Ecosystem sevice indicator: Drinking water consumption
Available / required:
http://statistici.insse.ro/shop/index.jsp?page=tempo3&lang=ro&ind=GOS108A
Scale: local
Method of measurement : Statistics
Mapping suitability: low
Description of the index [u.m.] : m3/year
Calculation mode: statistics on the consumption of drinking water from wetlands and
their vicinity.
Method: statistical data held by water supply companies or municipalities.
Water is not abstracted for drinking from Divici-Pojejena wetland
Practical method: questionnaires with local people about the use of drinking water
(including drinking water from wells in the case of the water flows between the
groundwater resource and the water from wetlands).
The answers to the questionnaire were affirmative for 62% of the respondents
(yes, they use water wells for drinking). However, water intake, which on
average were reported by questionnaire at approx. 20l / day cannot be
considered as being used from the water stored in the wetland, as is not proved
the dependence of the underground water resources on the available quantities
from the Divici-Pojejena wetland.
In conclusion: the surface water for drinking is not collected from Divici-Pojejena
wetland
Data source: Water distribution companies, Local, National Institute of Statistics as
the statistical data reported by INS indicator: GOS107A - "capacity of installations to
produce drinking water by counties and localities".
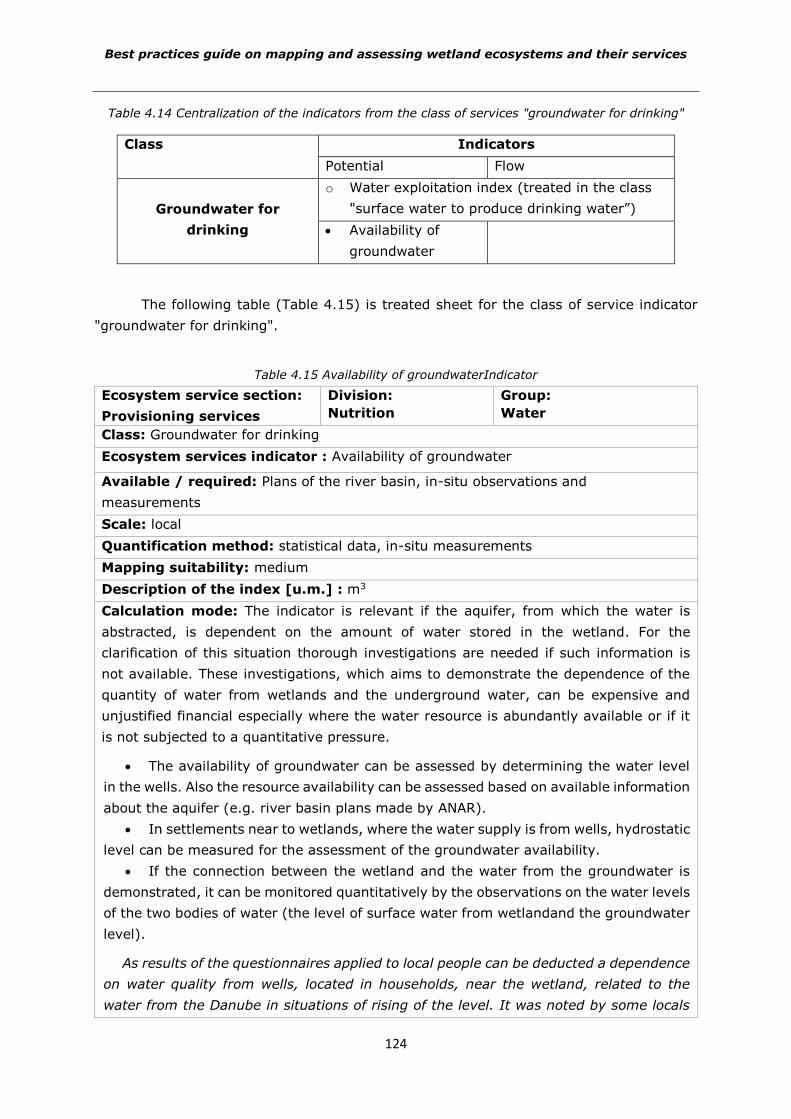
Best practices guide on mapping and assessing wetland ecosystems and their services
124
Table 4.14 Centralization of the indicators from the class of services "groundwater for drinking"
Class Indicators
Potential Flow
Groundwater for
drinking
o Water exploitation index (treated in the class
"surface water to produce drinking water”)
Availability of
groundwater
The following table (Table 4.15) is treated sheet for the class of service indicator
"groundwater for drinking".
Table 4.15 Availability of groundwaterIndicator
Ecosystem service section:
Provisioning services
Division:
Nutrition
Group:
Water
Class: Groundwater for drinking
Ecosystem services indicator : Availability of groundwater
Available / required: Plans of the river basin, in-situ observations and
measurements
Scale: local
Quantification method: statistical data, in-situ measurements
Mapping suitability: medium
Description of the index [u.m.] : m3
Calculation mode: The indicator is relevant if the aquifer, from which the water is
abstracted, is dependent on the amount of water stored in the wetland. For the
clarification of this situation thorough investigations are needed if such information is
not available. These investigations, which aims to demonstrate the dependence of the
quantity of water from wetlands and the underground water, can be expensive and
unjustified financial especially where the water resource is abundantly available or if it
is not subjected to a quantitative pressure.
The availability of groundwater can be assessed by determining the water level
in the wells. Also the resource availability can be assessed based on available information
about the aquifer (e.g. river basin plans made by ANAR).
In settlements near to wetlands, where the water supply is from wells, hydrostatic
level can be measured for the assessment of the groundwater availability.
If the connection between the wetland and the water from the groundwater is
demonstrated, it can be monitored quantitatively by the observations on the water levels
of the two bodies of water (the level of surface water from wetlandand the groundwater
level).
As results of the questionnaires applied to local people can be deducted a dependence
on water quality from wells, located in households, near the wetland, related to the
water from the Danube in situations of rising of the level. It was noted by some locals
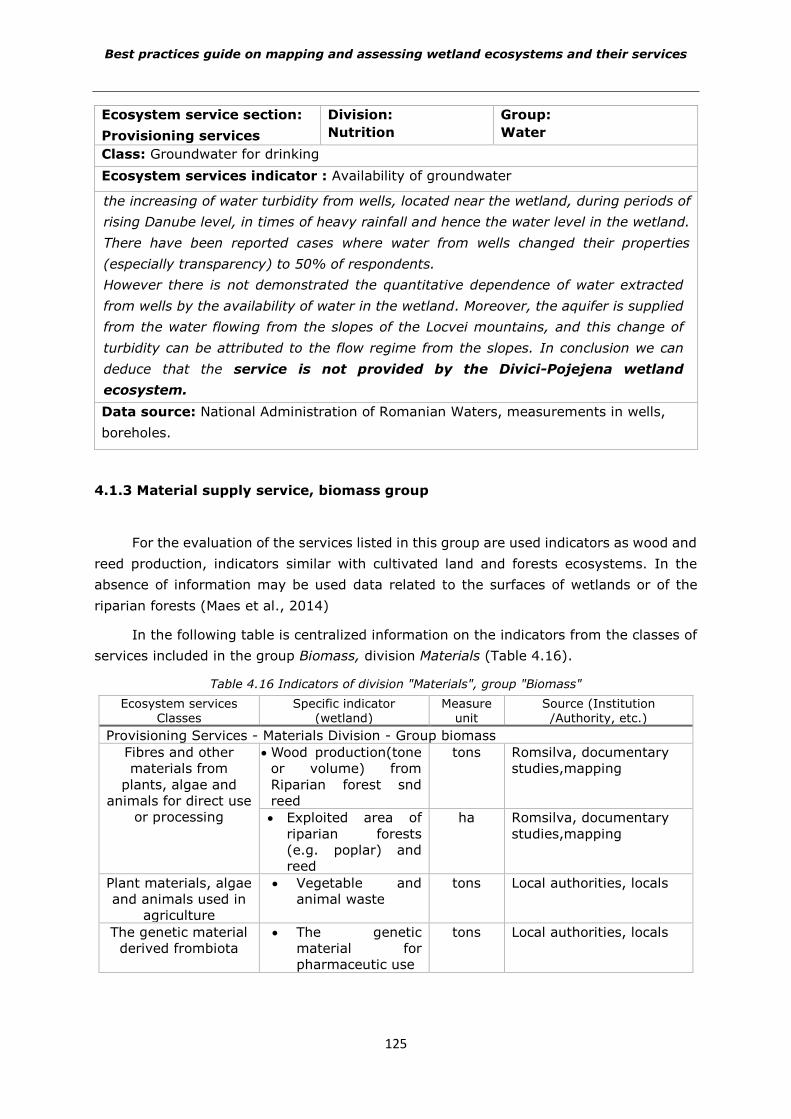
Best practices guide on mapping and assessing wetland ecosystems and their services
125
Ecosystem service section:
Provisioning services
Division:
Nutrition
Group:
Water
Class: Groundwater for drinking
Ecosystem services indicator : Availability of groundwater
the increasing of water turbidity from wells, located near the wetland, during periods of
rising Danube level, in times of heavy rainfall and hence the water level in the wetland.
There have been reported cases where water from wells changed their properties
(especially transparency) to 50% of respondents.
However there is not demonstrated the quantitative dependence of water extracted
from wells by the availability of water in the wetland. Moreover, the aquifer is supplied
from the water flowing from the slopes of the Locvei mountains, and this change of
turbidity can be attributed to the flow regime from the slopes. In conclusion we can
deduce that the service is not provided by the Divici-Pojejena wetland
ecosystem.
Data source: National Administration of Romanian Waters, measurements in wells,
boreholes.
4.1.3 Material supply service, biomass group
For the evaluation of the services listed in this group are used indicators as wood and
reed production, indicators similar with cultivated land and forests ecosystems. In the
absence of information may be used data related to the surfaces of wetlands or of the
riparian forests (Maes et al., 2014)
In the following table is centralized information on the indicators from the classes of
services included in the group Biomass, division Materials (Table 4.16).
Table 4.16 Indicators of division "Materials", group "Biomass"
Ecosystem services Classes
Specific indicator (wetland)
Measure unit
Source (Institution /Authority, etc.)
Provisioning Services - Materials Division - Group biomass
Fibres and other
materials from
plants, algae and
animals for direct use
or processing
Wood production(tone
or volume) from
Riparian forest snd
reed
tons Romsilva, documentary
studies,mapping
Exploited area of
riparian forests
(e.g. poplar) and
reed
ha Romsilva, documentary
studies,mapping
Plant materials, algae
and animals used in
agriculture
Vegetable and
animal waste
tons Local authorities, locals
The genetic material
derived frombiota
The genetic
material for
pharmaceutic use
tons Local authorities, locals
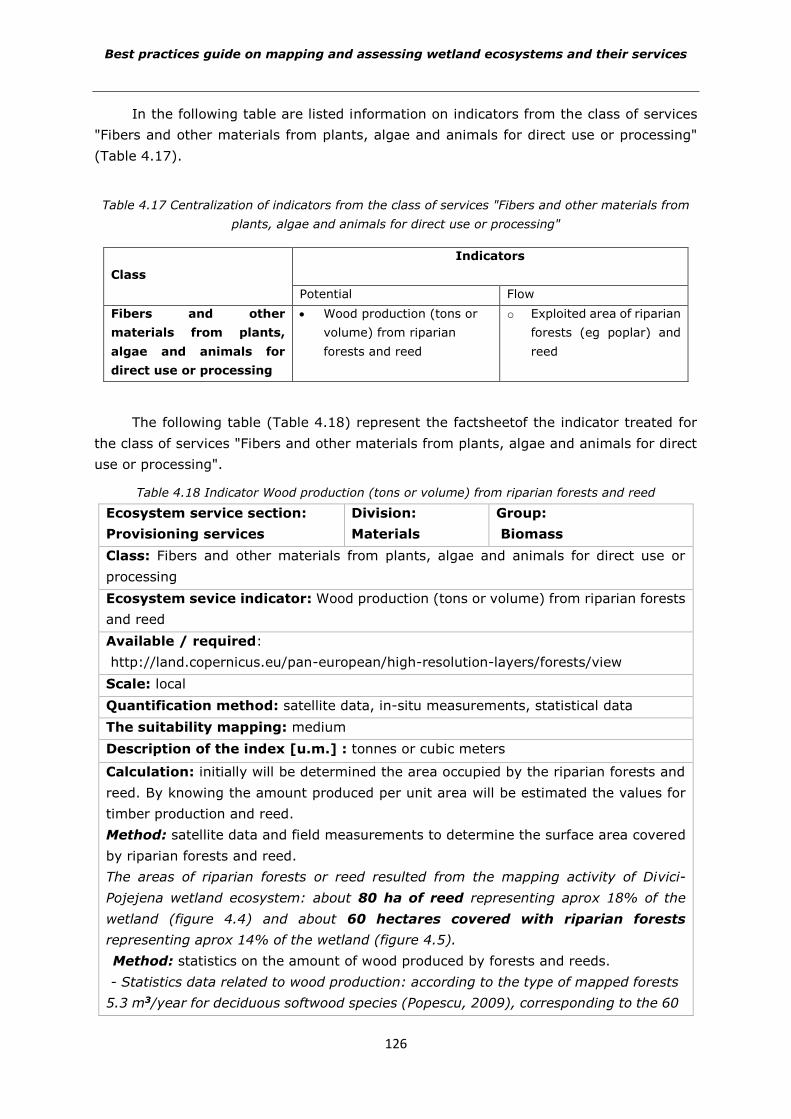
Best practices guide on mapping and assessing wetland ecosystems and their services
126
In the following table are listed information on indicators from the class of services
"Fibers and other materials from plants, algae and animals for direct use or processing"
(Table 4.17).
Table 4.17 Centralization of indicators from the class of services "Fibers and other materials from
plants, algae and animals for direct use or processing"
The following table (Table 4.18) represent the factsheetof the indicator treated for
the class of services "Fibers and other materials from plants, algae and animals for direct
use or processing".
Table 4.18 Indicator Wood production (tons or volume) from riparian forests and reed
Ecosystem service section:
Provisioning services
Division:
Materials
Group:
Biomass
Class: Fibers and other materials from plants, algae and animals for direct use or
processing
Ecosystem sevice indicator: Wood production (tons or volume) from riparian forests
and reed
Available / required:
http://land.copernicus.eu/pan-european/high-resolution-layers/forests/view
Scale: local
Quantification method: satellite data, in-situ measurements, statistical data
The suitability mapping: medium
Description of the index [u.m.] : tonnes or cubic meters
Calculation: initially will be determined the area occupied by the riparian forests and
reed. By knowing the amount produced per unit area will be estimated the values for
timber production and reed.
Method: satellite data and field measurements to determine the surface area covered
by riparian forests and reed.
The areas of riparian forests or reed resulted from the mapping activity of Divici-
Pojejena wetland ecosystem: about 80 ha of reed representing aprox 18% of the
wetland (figure 4.4) and about 60 hectares covered with riparian forests
representing aprox 14% of the wetland (figure 4.5).
Method: statistics on the amount of wood produced by forests and reeds.
- Statistics data related to wood production: according to the type of mapped forests
5.3 m3/year for deciduous softwood species (Popescu, 2009), corresponding to the 60
Class
Indicators
Potential Flow
Fibers and other
materials from plants,
algae and animals for
direct use or processing
Wood production (tons or
volume) from riparian
forests and reed
o Exploited area of riparian
forests (eg poplar) and
reed
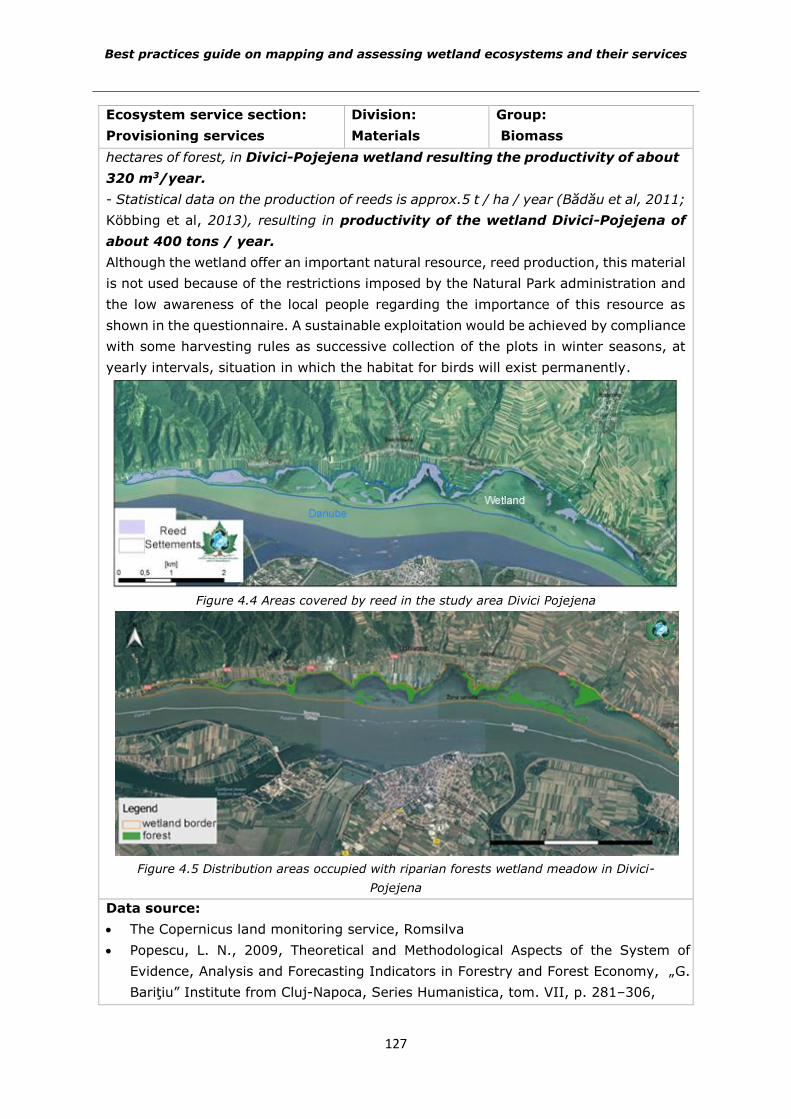
Best practices guide on mapping and assessing wetland ecosystems and their services
127
Ecosystem service section:
Provisioning services
Division:
Materials
Group:
Biomass
hectares of forest, in Divici-Pojejena wetland resulting the productivity of about
320 m3/year.
- Statistical data on the production of reeds is approx.5 t / ha / year (Bădău et al, 2011;
Köbbing et al, 2013), resulting in productivity of the wetland Divici-Pojejena of
about 400 tons / year.
Although the wetland offer an important natural resource, reed production, this material
is not used because of the restrictions imposed by the Natural Park administration and
the low awareness of the local people regarding the importance of this resource as
shown in the questionnaire. A sustainable exploitation would be achieved by compliance
with some harvesting rules as successive collection of the plots in winter seasons, at
yearly intervals, situation in which the habitat for birds will exist permanently.
Figure 4.4 Areas covered by reed in the study area Divici Pojejena
Figure 4.5 Distribution areas occupied with riparian forests wetland meadow in Divici-
Pojejena
Data source:
The Copernicus land monitoring service, Romsilva
Popescu, L. N., 2009, Theoretical and Methodological Aspects of the System of Evidence, Analysis and Forecasting Indicators in Forestry and Forest Economy, „G.
Bariţiu” Institute from Cluj-Napoca, Series Humanistica, tom. VII, p. 281–306,
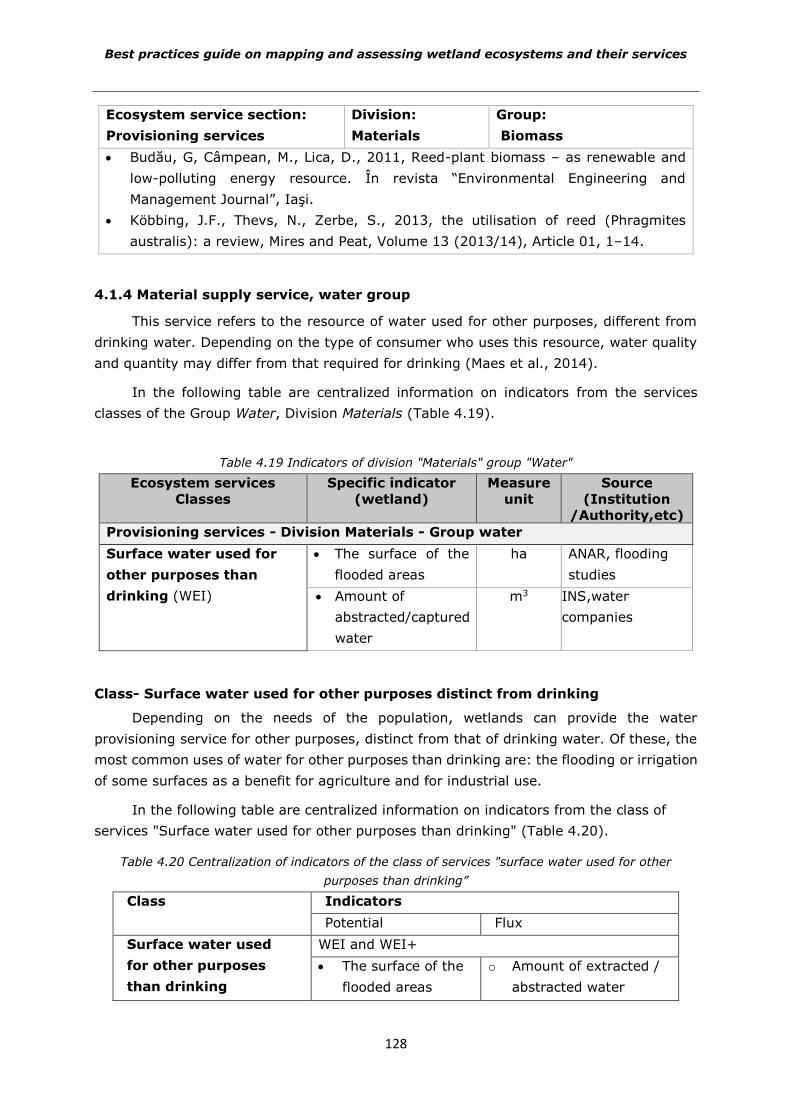
Best practices guide on mapping and assessing wetland ecosystems and their services
128
Ecosystem service section:
Provisioning services
Division:
Materials
Group:
Biomass
Budău, G, Câmpean, M., Lica, D., 2011, Reed-plant biomass – as renewable and
low-polluting energy resource. În revista “Environmental Engineering and
Management Journal”, Iaşi.
Köbbing, J.F., Thevs, N., Zerbe, S., 2013, the utilisation of reed (Phragmites
australis): a review, Mires and Peat, Volume 13 (2013/14), Article 01, 1–14.
4.1.4 Material supply service, water group
This service refers to the resource of water used for other purposes, different from
drinking water. Depending on the type of consumer who uses this resource, water quality
and quantity may differ from that required for drinking (Maes et al., 2014).
In the following table are centralized information on indicators from the services
classes of the Group Water, Division Materials (Table 4.19).
Table 4.19 Indicators of division "Materials" group "Water"
Ecosystem services
Classes
Specific indicator
(wetland)
Measure
unit
Source
(Institution
/Authority,etc)
Provisioning services - Division Materials - Group water
Surface water used for
other purposes than
drinking (WEI)
The surface of the
flooded areas
ha ANAR, flooding
studies
Amount of
abstracted/captured
water
m3 INS,water
companies
Class- Surface water used for other purposes distinct from drinking
Depending on the needs of the population, wetlands can provide the water
provisioning service for other purposes, distinct from that of drinking water. Of these, the
most common uses of water for other purposes than drinking are: the flooding or irrigation
of some surfaces as a benefit for agriculture and for industrial use.
In the following table are centralized information on indicators from the class of
services "Surface water used for other purposes than drinking" (Table 4.20).
Table 4.20 Centralization of indicators of the class of services "surface water used for other
purposes than drinking”
Class Indicators
Potential Flux
Surface water used
for other purposes
than drinking
WEI and WEI+
The surface of the
flooded areas
o Amount of extracted /
abstracted water
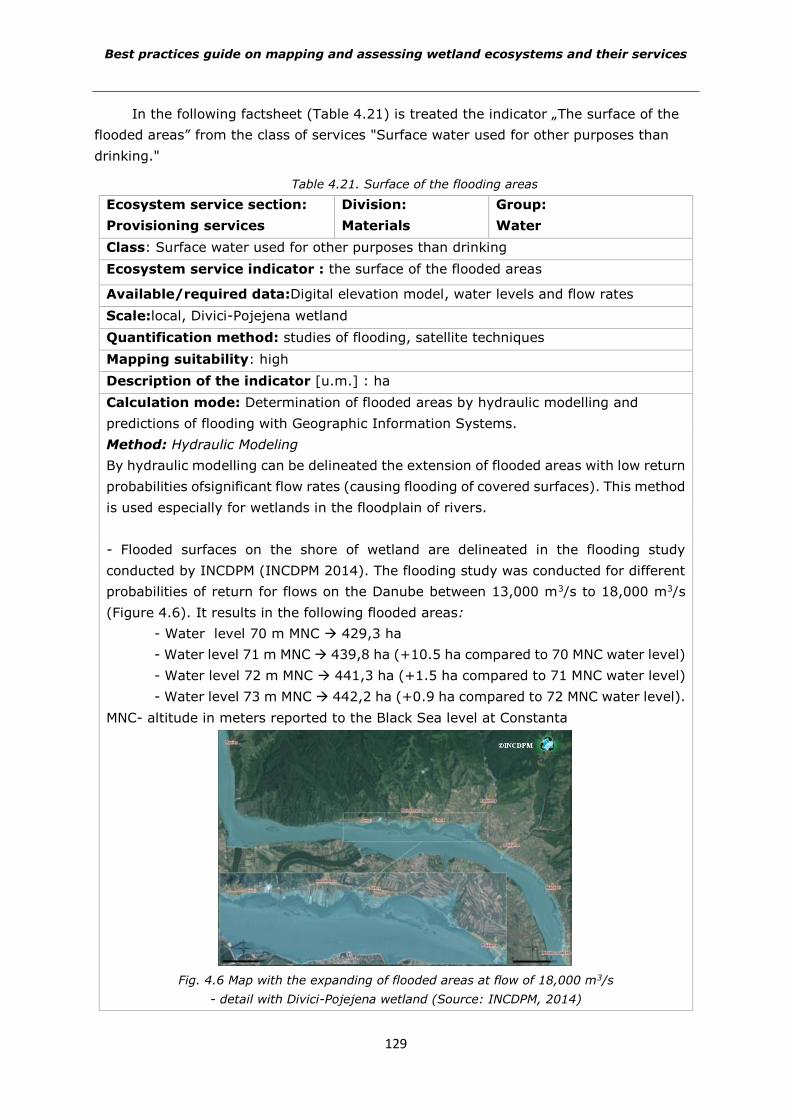
Best practices guide on mapping and assessing wetland ecosystems and their services
129
In the following factsheet (Table 4.21) is treated the indicator „The surface of the
flooded areas” from the class of services "Surface water used for other purposes than
drinking."
Table 4.21. Surface of the flooding areas
Ecosystem service section:
Provisioning services
Division:
Materials
Group:
Water
Class: Surface water used for other purposes than drinking
Ecosystem service indicator : the surface of the flooded areas
Available/required data:Digital elevation model, water levels and flow rates
Scale:local, Divici-Pojejena wetland
Quantification method: studies of flooding, satellite techniques
Mapping suitability: high
Description of the indicator [u.m.] : ha
Calculation mode: Determination of flooded areas by hydraulic modelling and
predictions of flooding with Geographic Information Systems.
Method: Hydraulic Modeling
By hydraulic modelling can be delineated the extension of flooded areas with low return
probabilities ofsignificant flow rates (causing flooding of covered surfaces). This method
is used especially for wetlands in the floodplain of rivers.
- Flooded surfaces on the shore of wetland are delineated in the flooding study
conducted by INCDPM (INCDPM 2014). The flooding study was conducted for different
probabilities of return for flows on the Danube between 13,000 m3/s to 18,000 m3/s
(Figure 4.6). It results in the following flooded areas:
- Water level 70 m MNC 429,3 ha
- Water level 71 m MNC 439,8 ha (+10.5 ha compared to 70 MNC water level)
- Water level 72 m MNC 441,3 ha (+1.5 ha compared to 71 MNC water level)
- Water level 73 m MNC 442,2 ha (+0.9 ha compared to 72 MNC water level).
MNC- altitude in meters reported to the Black Sea level at Constanta
Fig. 4.6 Map with the expanding of flooded areas at flow of 18,000 m3/s
- detail with Divici-Pojejena wetland (Source: INCDPM, 2014)
Best practices guide on mapping and assessing wetland ecosystems and their services
130
Ecosystem service section:
Provisioning services
Division:
Materials
Group:
Water
Class: Surface water used for other purposes than drinking
Ecosystem service indicator : the surface of the flooded areas
The most exposed areas corresponding to the land with low altitude, below 73 m MNC,
which are located near the villages Pojejena, Divici, Șușca and Belobreşca and also
areas covered by agricultural terrains.
Regarding of agricultural terrains flooding, this can be beneficial for irrigation and
improving of soil quality (by intake of nutrients). The phenomenon of flooding is
controlled by the water level imposed by the Iron Gates dam whose construction
determined the forming of the Divici-Pojejena wetland. Consequently, the operation of
the dam causes water level fluctuation in Divici-Pojejena wetland, respectively the
flooding of areas.
Method: Estimated flooding using Geographical Information Systems
A simplified method for estimating the flooded areas consist in determining the extent
of such areas by knowing the terrain altitudes (digital model of terrain) and water level
recorded in case of flooding (historical floods)
By using Geographic Information Systems (GIS) the submerged surface can be
deduced in the events of flooding. This method is reduced only to the variation of the
water level, excluding the hydrodynamic elements (flows and velocities of water). The
method may be useful in the case of wetlands characterized by standing water.
- Is not the case of using this method in Divici Pojejena wetland given the
availability of data from the study of flooding?
Data source: flooding studies, topographic maps
4.1.5 Energy supply service, group of biomass based energy sources
Wetlands can provide the service of energy supply from plants that are growing in
this ecosystem and can be a resource for domestic heating fuel or for other purposes.
Among these plants, the main are: wood produced by riparian forests, reeds and
submerged and floating hydrophilic plants.
The amount of firewood produced by riparian forests is a service that can be
estimated in the same way that this service is quantified in case of forest ecosystems. The
reed and the submerged or floating aquatic plants can be used for energy production based
on plants (Akula, 2013).
The quantification mode of this service is similar to the services group "Biomass"
from the division "Materials" (Maes et al., 2014). In the following table are centralized
indicators of the services class from the group "Biomass based energy sources", Division
"Energy" (Table 4.22).
Best practices guide on mapping and assessing wetland ecosystems and their services
131
Table 4.22 Indicators of division "Energy", group "Biomass based energy sources"
Ecosystem
services
Classes
Specific indicator
(wetland)
Measure unit Source (Institution
/Authority,etc.)
Provisioning Services - Energy Division - Group Biomass based energy sources
Plant-based
resources
Firewood produce by
riparian forests
tons Romsilva
Aquatic Plants tons Observations in-situ
In the following table (Table 4.23) is treated the indicator “Aquatic plants” of the
services class "Plant-based resources".
Table 4.23 Indicator aquatic plants
Section ecosystem
service:
provisioning services
Division:
Energy division
Group:
Biomass based energy
sources
Class: Plant-based resources
Ecosystem service indicator: Aquatic plants
Available/required data: surface covered with plants, percentage of coverage per
unit area
Scale: local, wetland Divici- Pojejena
Quantification method: satellite data, in-situ measurements, statistical data
Mapping suitability: Medium
Description of the index[u.m.]: tons
Calculation mode: Assessment of aquatic plants which have potential for the
production of energy from biomass is done by determining the area occupied by the
plants, and the quantity per unit of area.
Method: satellite data to determine areas covered with aquatic plants. \
The areas covered with aquatic plants results from the activity of mapping the Divici-
Pojejena wetland ecosystem: 120 ha of aquatic habitats covered with standing
water favouring the development in excess of invasive species.
Method: in situ observations related to the coverage of the water surface species
with invasive character. Estimated rates of sustainable exploitation of reeds are done
by means of remote sensing and field verification (Hanganu, 1995-2002).
NOTE: Currently there are not used aquatic plants from wetland Divici-
Pojejena for energy production.
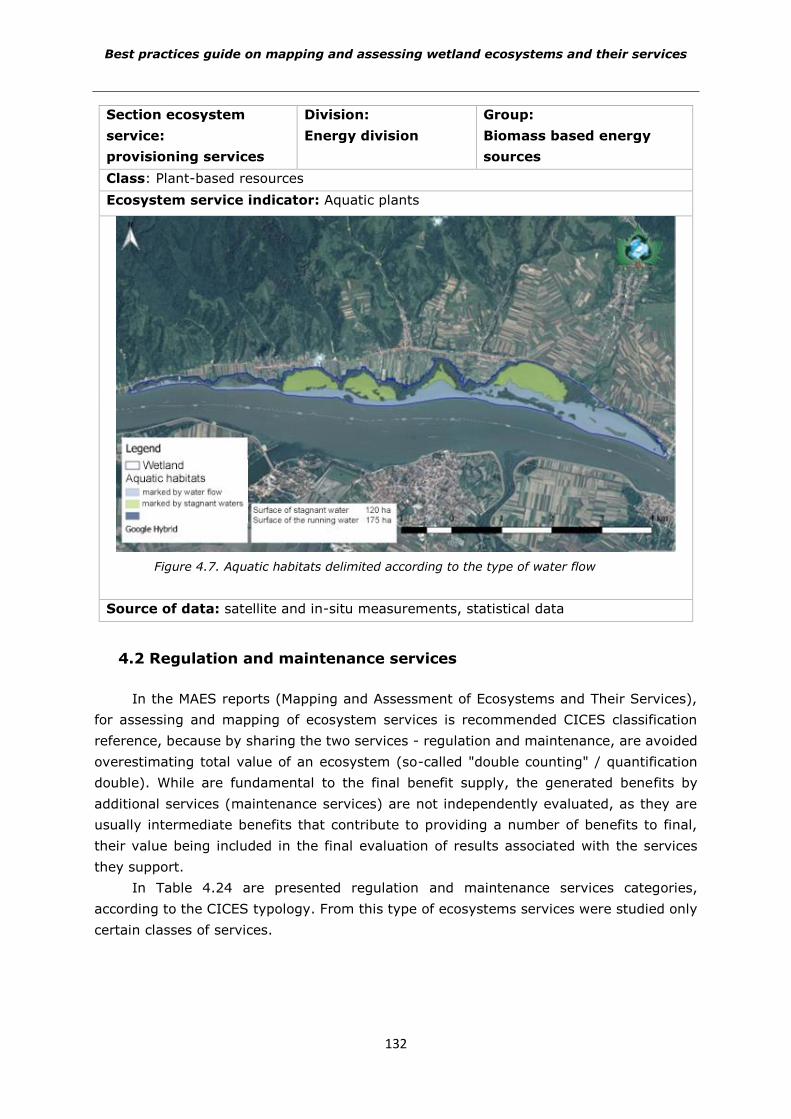
Best practices guide on mapping and assessing wetland ecosystems and their services
132
Section ecosystem
service:
provisioning services
Division:
Energy division
Group:
Biomass based energy
sources
Class: Plant-based resources
Ecosystem service indicator: Aquatic plants
Figure 4.7. Aquatic habitats delimited according to the type of water flow
Source of data: satellite and in-situ measurements, statistical data
4.2 Regulation and maintenance services
In the MAES reports (Mapping and Assessment of Ecosystems and Their Services),
for assessing and mapping of ecosystem services is recommended CICES classification
reference, because by sharing the two services - regulation and maintenance, are avoided
overestimating total value of an ecosystem (so-called "double counting" / quantification
double). While are fundamental to the final benefit supply, the generated benefits by
additional services (maintenance services) are not independently evaluated, as they are
usually intermediate benefits that contribute to providing a number of benefits to final,
their value being included in the final evaluation of results associated with the services
they support.
In Table 4.24 are presented regulation and maintenance services categories,
according to the CICES typology. From this type of ecosystems services were studied only
certain classes of services.
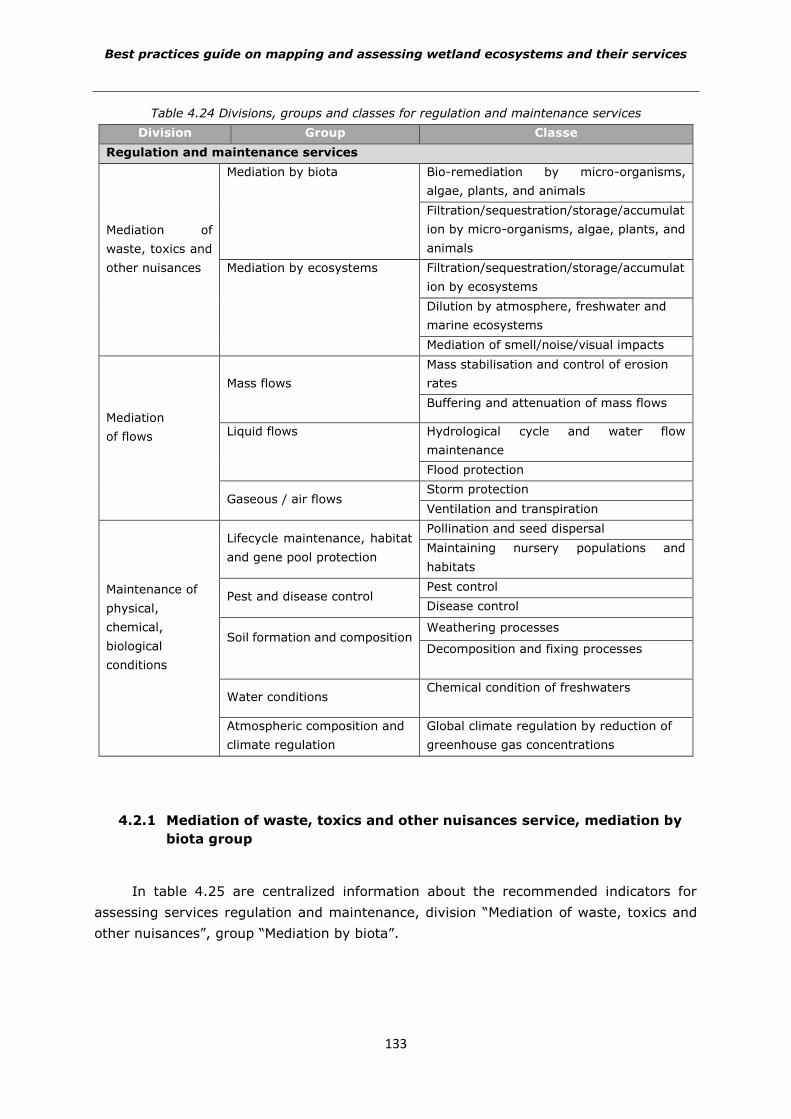
Best practices guide on mapping and assessing wetland ecosystems and their services
133
Table 4.24 Divisions, groups and classes for regulation and maintenance services
Division Group Classe
Regulation and maintenance services
Mediation of
waste, toxics and
other nuisances
Mediation by biota Bio-remediation by micro-organisms,
algae, plants, and animals
Filtration/sequestration/storage/accumulat
ion by micro-organisms, algae, plants, and
animals
Mediation by ecosystems Filtration/sequestration/storage/accumulat
ion by ecosystems
Dilution by atmosphere, freshwater and
marine ecosystems
Mediation of smell/noise/visual impacts
Mediation
of flows
Mass flows
Mass stabilisation and control of erosion
rates
Buffering and attenuation of mass flows
Liquid flows Hydrological cycle and water flow
maintenance
Flood protection
Gaseous / air flows Storm protection
Ventilation and transpiration
Maintenance of
physical,
chemical,
biological
conditions
Lifecycle maintenance, habitat
and gene pool protection
Pollination and seed dispersal
Maintaining nursery populations and
habitats
Pest and disease control Pest control
Disease control
Soil formation and composition Weathering processes
Decomposition and fixing processes
Water conditions Chemical condition of freshwaters
Atmospheric composition and
climate regulation
Global climate regulation by reduction of
greenhouse gas concentrations
4.2.1 Mediation of waste, toxics and other nuisances service, mediation by
biota group
In table 4.25 are centralized information about the recommended indicators for
assessing services regulation and maintenance, division “Mediation of waste, toxics and
other nuisances”, group “Mediation by biota”.
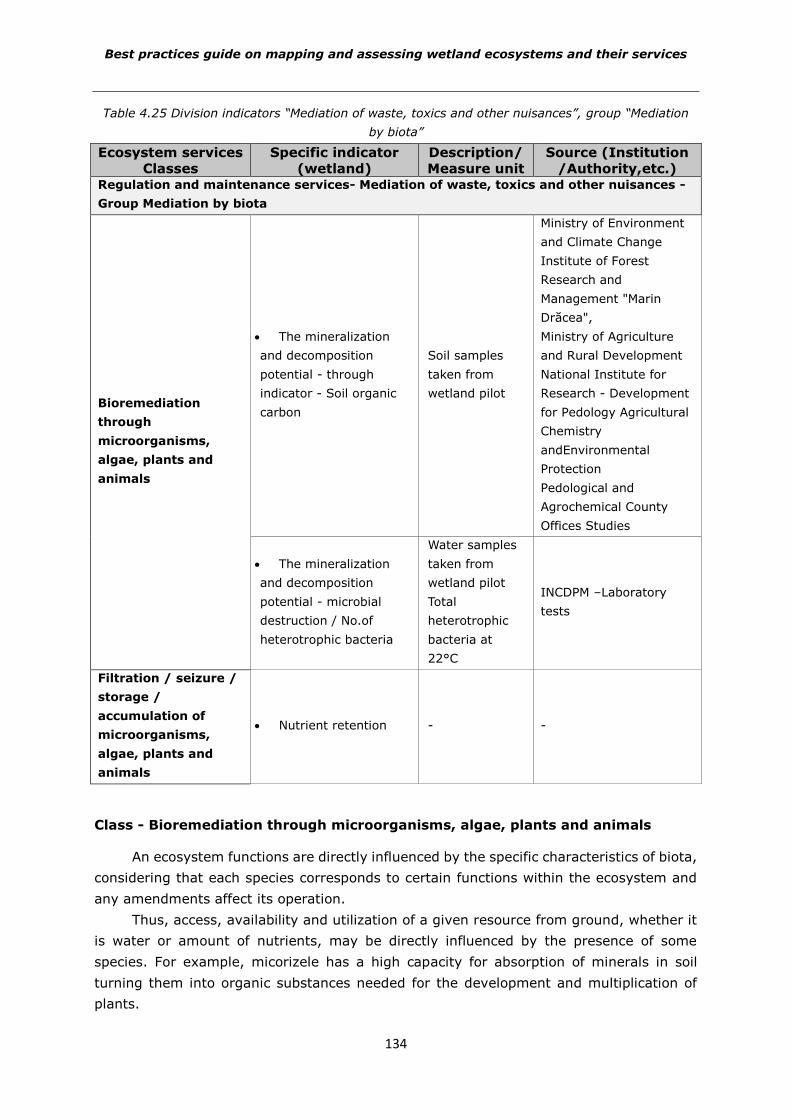
Best practices guide on mapping and assessing wetland ecosystems and their services
134
Table 4.25 Division indicators “Mediation of waste, toxics and other nuisances”, group “Mediation
by biota”
Ecosystem services
Classes
Specific indicator
(wetland)
Description/
Measure unit
Source (Institution
/Authority,etc.) Regulation and maintenance services- Mediation of waste, toxics and other nuisances -
Group Mediation by biota
Bioremediation
through
microorganisms,
algae, plants and
animals
The mineralization
and decomposition
potential - through
indicator - Soil organic
carbon
Soil samples
taken from
wetland pilot
Ministry of Environment
and Climate Change
Institute of Forest
Research and
Management "Marin
Drăcea",
Ministry of Agriculture
and Rural Development
National Institute for
Research - Development
for Pedology Agricultural
Chemistry
andEnvironmental
Protection
Pedological and
Agrochemical County
Offices Studies
The mineralization
and decomposition
potential - microbial
destruction / No.of
heterotrophic bacteria
Water samples
taken from
wetland pilot
Total
heterotrophic
bacteria at
22°C
INCDPM –Laboratory
tests
Filtration / seizure /
storage /
accumulation of
microorganisms,
algae, plants and
animals
Nutrient retention - -
Class - Bioremediation through microorganisms, algae, plants and animals
An ecosystem functions are directly influenced by the specific characteristics of biota,
considering that each species corresponds to certain functions within the ecosystem and
any amendments affect its operation.
Thus, access, availability and utilization of a given resource from ground, whether it
is water or amount of nutrients, may be directly influenced by the presence of some
species. For example, micorizele has a high capacity for absorption of minerals in soil
turning them into organic substances needed for the development and multiplication of
plants.
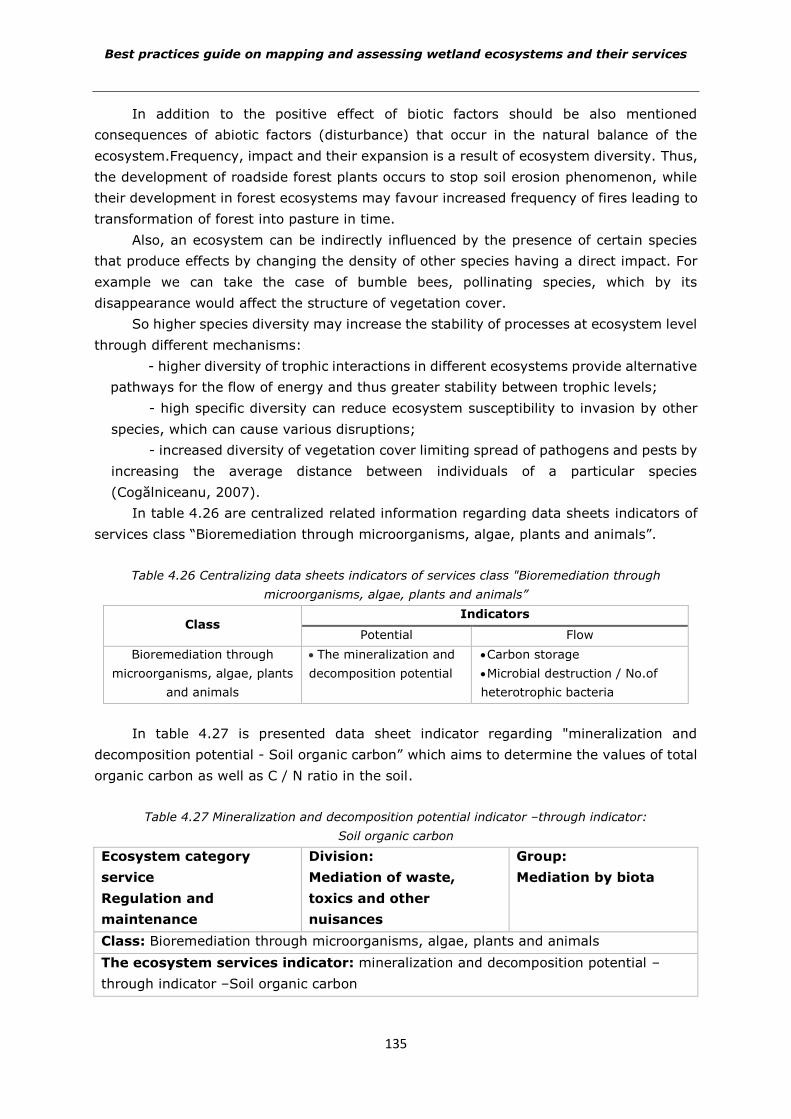
Best practices guide on mapping and assessing wetland ecosystems and their services
135
In addition to the positive effect of biotic factors should be also mentioned
consequences of abiotic factors (disturbance) that occur in the natural balance of the
ecosystem.Frequency, impact and their expansion is a result of ecosystem diversity. Thus,
the development of roadside forest plants occurs to stop soil erosion phenomenon, while
their development in forest ecosystems may favour increased frequency of fires leading to
transformation of forest into pasture in time.
Also, an ecosystem can be indirectly influenced by the presence of certain species
that produce effects by changing the density of other species having a direct impact. For
example we can take the case of bumble bees, pollinating species, which by its
disappearance would affect the structure of vegetation cover.
So higher species diversity may increase the stability of processes at ecosystem level
through different mechanisms:
- higher diversity of trophic interactions in different ecosystems provide alternative
pathways for the flow of energy and thus greater stability between trophic levels;
- high specific diversity can reduce ecosystem susceptibility to invasion by other
species, which can cause various disruptions;
- increased diversity of vegetation cover limiting spread of pathogens and pests by
increasing the average distance between individuals of a particular species
(Cogălniceanu, 2007).
In table 4.26 are centralized related information regarding data sheets indicators of
services class “Bioremediation through microorganisms, algae, plants and animals”.
Table 4.26 Centralizing data sheets indicators of services class "Bioremediation through
microorganisms, algae, plants and animals”
Class Indicators
Potential Flow
Bioremediation through
microorganisms, algae, plants
and animals
The mineralization and
decomposition potential
Carbon storage
Microbial destruction / No.of
heterotrophic bacteria
In table 4.27 is presented data sheet indicator regarding "mineralization and
decomposition potential - Soil organic carbon” which aims to determine the values of total
organic carbon as well as C / N ratio in the soil.
Table 4.27 Mineralization and decomposition potential indicator –through indicator:
Soil organic carbon
Ecosystem category
service
Regulation and
maintenance
Division:
Mediation of waste,
toxics and other
nuisances
Group:
Mediation by biota
Class: Bioremediation through microorganisms, algae, plants and animals
The ecosystem services indicator: mineralization and decomposition potential –
through indicator –Soil organic carbon
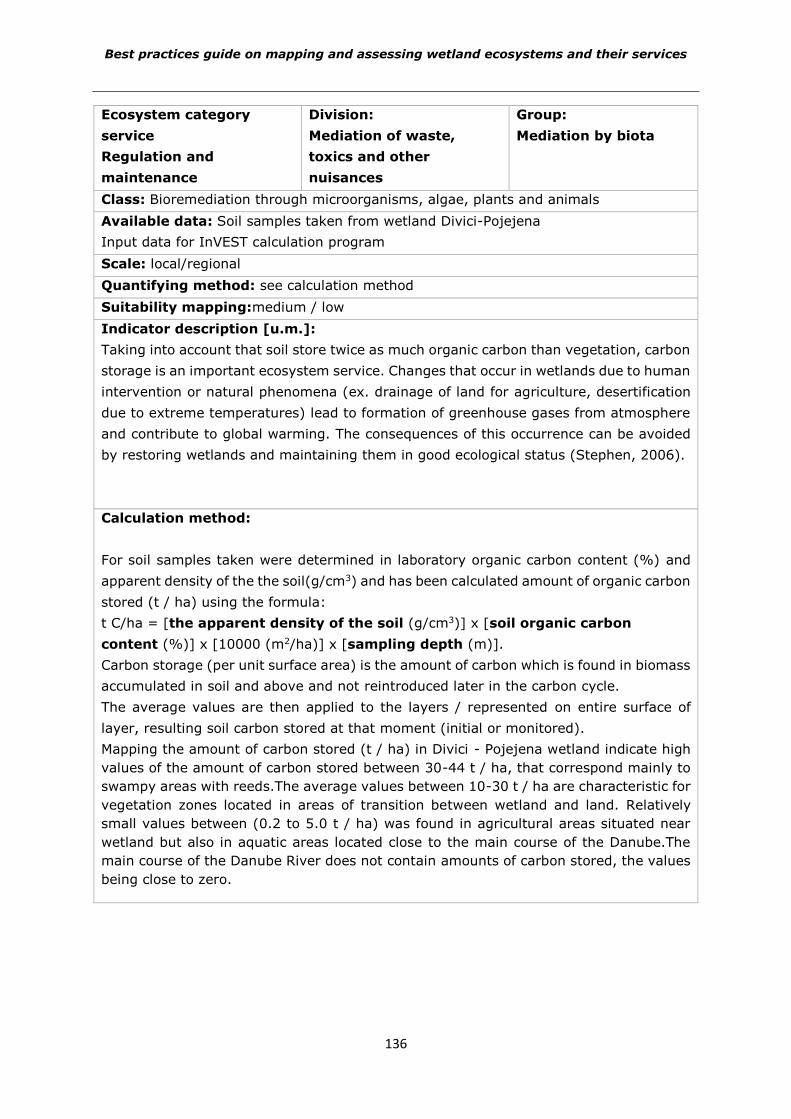
Best practices guide on mapping and assessing wetland ecosystems and their services
136
Ecosystem category
service
Regulation and
maintenance
Division:
Mediation of waste,
toxics and other
nuisances
Group:
Mediation by biota
Class: Bioremediation through microorganisms, algae, plants and animals
Available data: Soil samples taken from wetland Divici-Pojejena
Input data for InVEST calculation program
Scale: local/regional
Quantifying method: see calculation method
Suitability mapping:medium / low
Indicator description [u.m.]:
Taking into account that soil store twice as much organic carbon than vegetation, carbon
storage is an important ecosystem service. Changes that occur in wetlands due to human
intervention or natural phenomena (ex. drainage of land for agriculture, desertification
due to extreme temperatures) lead to formation of greenhouse gases from atmosphere
and contribute to global warming. The consequences of this occurrence can be avoided
by restoring wetlands and maintaining them in good ecological status (Stephen, 2006).
Calculation method:
For soil samples taken were determined in laboratory organic carbon content (%) and
apparent density of the the soil(g/cm3) and has been calculated amount of organic carbon
stored (t / ha) using the formula:
t C/ha = [the apparent density of the soil (g/cm3)] x [soil organic carbon
content (%)] x [10000 (m2/ha)] x [sampling depth (m)].
Carbon storage (per unit surface area) is the amount of carbon which is found in biomass
accumulated in soil and above and not reintroduced later in the carbon cycle.
The average values are then applied to the layers / represented on entire surface of
layer, resulting soil carbon stored at that moment (initial or monitored).
Mapping the amount of carbon stored (t / ha) in Divici - Pojejena wetland indicate high
values of the amount of carbon stored between 30-44 t / ha, that correspond mainly to
swampy areas with reeds.The average values between 10-30 t / ha are characteristic for
vegetation zones located in areas of transition between wetland and land. Relatively
small values between (0.2 to 5.0 t / ha) was found in agricultural areas situated near
wetland but also in aquatic areas located close to the main course of the Danube.The
main course of the Danube River does not contain amounts of carbon stored, the values
being close to zero.
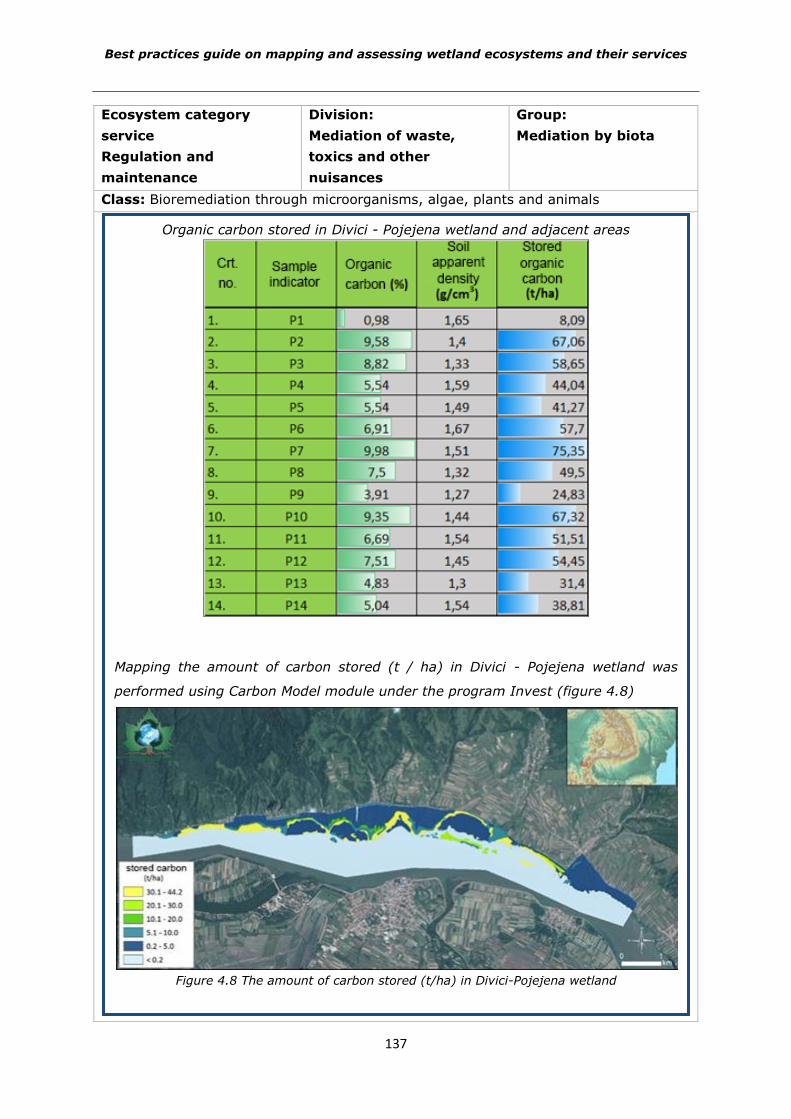
Best practices guide on mapping and assessing wetland ecosystems and their services
137
Ecosystem category
service
Regulation and
maintenance
Division:
Mediation of waste,
toxics and other
nuisances
Group:
Mediation by biota
Class: Bioremediation through microorganisms, algae, plants and animals
Organic carbon stored in Divici - Pojejena wetland and adjacent areas
Mapping the amount of carbon stored (t / ha) in Divici - Pojejena wetland was
performed using Carbon Model module under the program Invest (figure 4.8)
Figure 4.8 The amount of carbon stored (t/ha) in Divici-Pojejena wetland
Best practices guide on mapping and assessing wetland ecosystems and their services
138
Ecosystem category
service
Regulation and
maintenance
Division:
Mediation of waste,
toxics and other
nuisances
Group:
Mediation by biota
Class: Bioremediation through microorganisms, algae, plants and animals
Data source:
- Ministry of Environment and Climate Change Institute of Forest Research and
Management "Marin Drăcea"
- Ministry of Agriculture and Rural Development
- Institute for Research - Development for Pedology, Agricultural Chemistry and
Environmental Protection -Annual report concerning the state of soil quality
- Pedological and Agrochemical County Offices Studies- Annual Report concerning the
state of soil quality at county level; Agrochemical studies in addition to pedological
studies necessary for organization and implementation of National Integrated
Monitoring System of Soil and action program presence in vulnerable areas and / or
potentially vulnerable to pollution by nitrates from agricultural sources.
In table 4.28 ispresented the appropriate data sheet of indicator: “mineralization and
decomposition potential –microbial destruction /no. heterotrophic bacteria”. By analyzing
this indicator was followed the dynamics establishment regarding the number and number
density of heterotrophic bacteria in water samples taken from Divici – Pojejena wetland.
Table 4.28 Mineralization and decomposition potential indicator – Microbial destruction/ No. of
heterotrophic bacteria
Ecosystem category service:
Regulation and
maintainance services
Division:Mediation of
waste, toxics and other
nuisances
Group:
Mediation by biota
Class: Bioremediation through microorganisms, algae, plants and animals
The ecosystem service indicator: mineralization and decomposition potential –
microbial destruction/ No. of heterotrophic bacteria
Available data: Test results INCDPM
Scale: local/regional
Quantifying method: see de calculation method
Suitability mapping: medium / low
Indicator description [u.m.]: no. bacteria/100ml
Biochemical transformations of organic matter dissolved and particulate by bacteria and
fungi action are essential nutrients for dynamic movement and energy flow in aquatic
ecosystems. These microorganisms regenerate "in situ" nutrients, which are then used
by primary producers (Zarnea, 1994).
Organic matter from aquatic ecosystems is of indigenous origin, coming from
phytoplankton and macro vegetation or allochthonous permeated especially in dissolved
form.
Best practices guide on mapping and assessing wetland ecosystems and their services
139
Ecosystem category service:
Regulation and
maintainance services
Division:Mediation of
waste, toxics and other
nuisances
Group:
Mediation by biota
Class: Bioremediation through microorganisms, algae, plants and animals
The ecosystem service indicator: mineralization and decomposition potential –
microbial destruction/ No. of heterotrophic bacteria
By dying of photosynthesizeor organisms organic matter is decomposed, C reduced
being oxidized by bacteria and fungi to CO2, and a percentage between 1-10% is
consumed by phytophagous (Simon Gruiţă, 2005).
Organic carbon in aquatic ecosystems is found dissolved or in particulate form. Bacteria
and fungi assimilates dissolved organic compounds, each of them being obtained by
enzymatic hydrolysis of particulate organic matter, which causes its decomposition in
substrates that can penetrate through specific permeases the bacterial cell (Findlay, et
al, 2003). The hydrolysis step is limited by synthesis rate of required enzymes. The
organic compounds are subsequently catabolized respectively oxidized to CO2, process
through which large amounts of organic matter are removed from the ecosystem, used
for production of bacterial biomass.
Degradation of organic matter go much slower when organic compounds are in excess
(supersaturation). In addition, carbohydrates, organic acids and amino acids are more
rapidly decomposed, face to total amount of dissolved organic matter (Gruiţă Simon,
2005).
Mineralization of organic matter through the respiratory metabolism consumes oxidant
of which nature varies according to the redox potential of the environment. In aerobic
environments, the molecular oxygen is used as electron acceptor, and aerobic
degradation is highly dependent on the chemical composition of organic matter.In
environments with insufficient amounts of dissolved oxygen take place a series of
successive reactions related to the decrease of redox potential. Simultaneously taking
place a series of fermentation processes (Ionică et all., 1996).
Because all reactions are due to microorganisms from the environment, there is a
zoning, where a vertical gradient from surface to the sediment, of bacterial populations
according to the dissolved oxygen concentration and redox potential. This zoning is as
follows: aerobic bacteria→denitrifying bacteria→sulphate reducing bacteria→
methanogenic bacteria (Ionică, et al, 1995).
The reactions sequence is more or less complete and importance of different areas is
highly variable. Anoxygenic areas can exist in the water volume, which applies to deep
layered lakes. However, a large proportion of decomposition occurs in aerobic waters
before sedimentation. Decomposition and mineralization of a wide variety of substrates
results in reintroduction of elements in the biogeochemical circuits (Zârnea, 1994).
Heterotrophic bacteria which grows to 220C is an indicator that provide general guidance
regarding the density of the mineralizing and decomposition bacteriaof organic matter
that are readily biodegradable. Also, total number of heterotrophic bacteria is an
intensity indicator regarding transformation of organic matter in aquatic and terrestrial
ecosystems until degradation of the final compounds (CO2, H2).
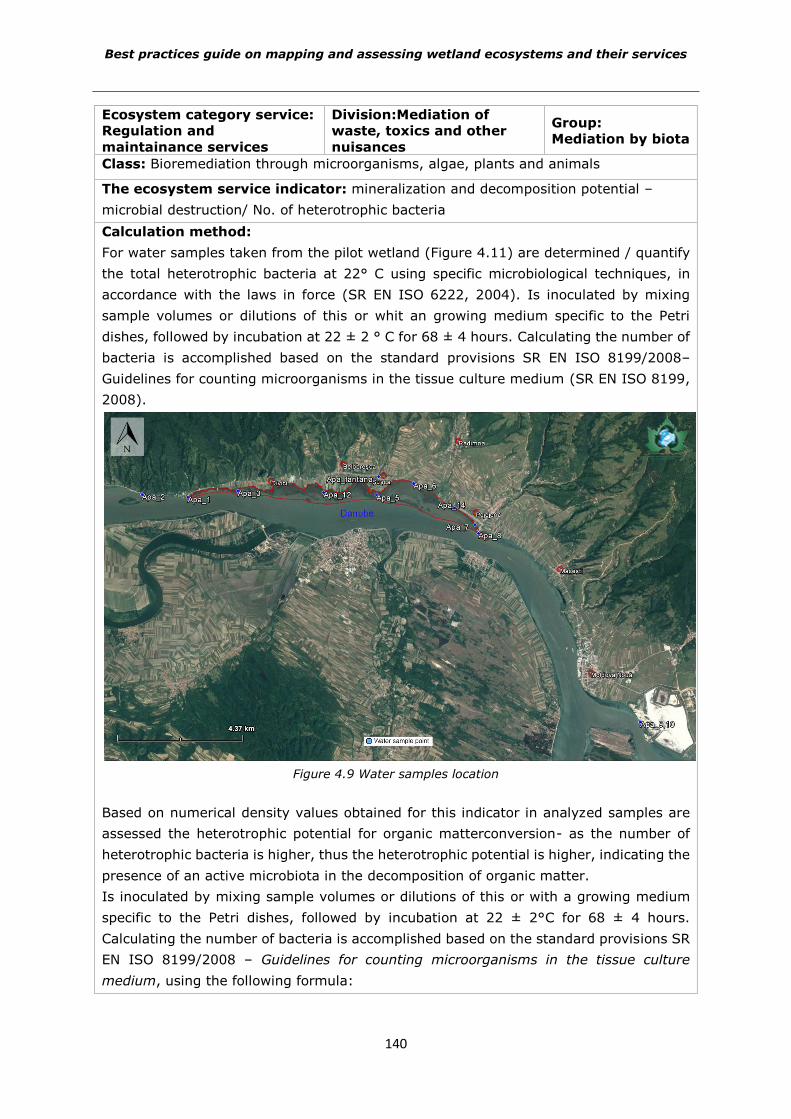
Best practices guide on mapping and assessing wetland ecosystems and their services
140
Ecosystem category service:
Regulation and
maintainance services
Division:Mediation of
waste, toxics and other
nuisances
Group:
Mediation by biota
Class: Bioremediation through microorganisms, algae, plants and animals
The ecosystem service indicator: mineralization and decomposition potential –
microbial destruction/ No. of heterotrophic bacteria
Calculation method:
For water samples taken from the pilot wetland (Figure 4.11) are determined / quantify
the total heterotrophic bacteria at 22° C using specific microbiological techniques, in
accordance with the laws in force (SR EN ISO 6222, 2004). Is inoculated by mixing
sample volumes or dilutions of this or whit an growing medium specific to the Petri
dishes, followed by incubation at 22 ± 2 ° C for 68 ± 4 hours. Calculating the number of
bacteria is accomplished based on the standard provisions SR EN ISO 8199/2008–
Guidelines for counting microorganisms in the tissue culture medium (SR EN ISO 8199,
2008).
Figure 4.9 Water samples location
Based on numerical density values obtained for this indicator in analyzed samples are
assessed the heterotrophic potential for organic matterconversion- as the number of
heterotrophic bacteria is higher, thus the heterotrophic potential is higher, indicating the
presence of an active microbiota in the decomposition of organic matter.
Is inoculated by mixing sample volumes or dilutions of this or with a growing medium
specific to the Petri dishes, followed by incubation at 22 ± 2°C for 68 ± 4 hours.
Calculating the number of bacteria is accomplished based on the standard provisions SR
EN ISO 8199/2008 – Guidelines for counting microorganisms in the tissue culture
medium, using the following formula:
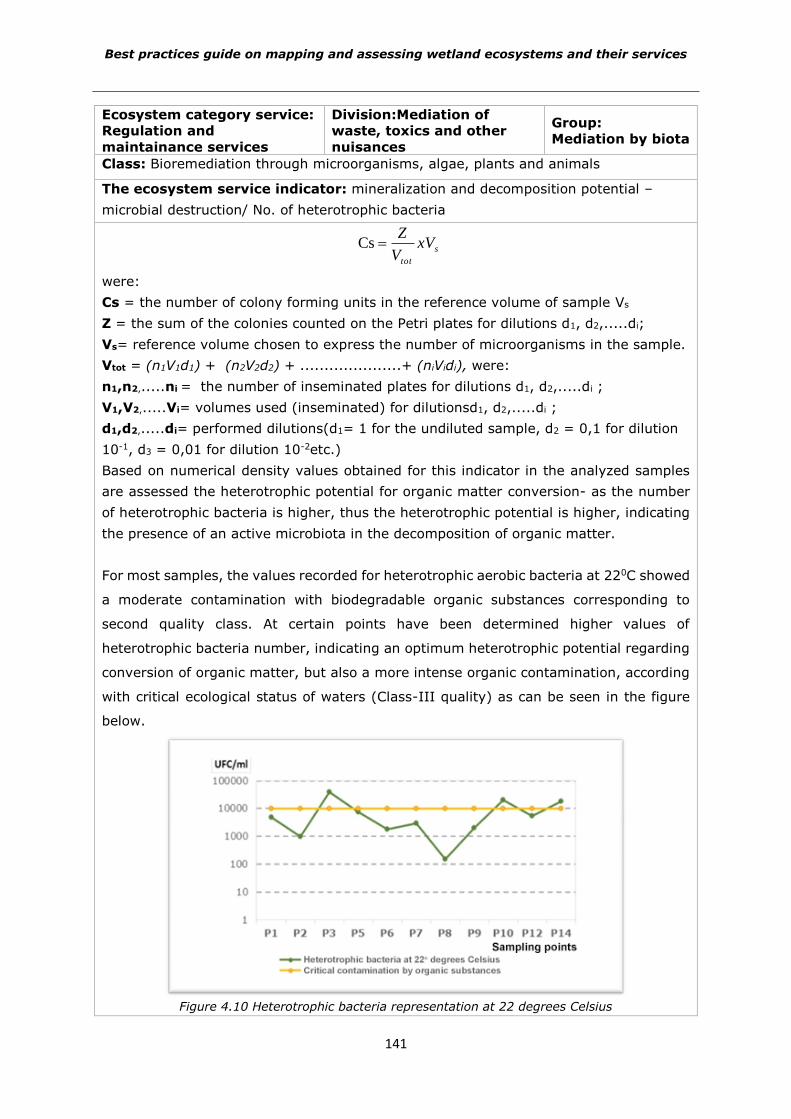
Best practices guide on mapping and assessing wetland ecosystems and their services
141
Ecosystem category service:
Regulation and
maintainance services
Division:Mediation of
waste, toxics and other
nuisances
Group:
Mediation by biota
Class: Bioremediation through microorganisms, algae, plants and animals
The ecosystem service indicator: mineralization and decomposition potential –
microbial destruction/ No. of heterotrophic bacteria
s
tot
xVV
Z Cs
were:
Cs = the number of colony forming units in the reference volume of sample Vs
Z = the sum of the colonies counted on the Petri plates for dilutions d1, d2,.....di;
Vs= reference volume chosen to express the number of microorganisms in the sample.
Vtot = (n1V1d1) + (n2V2d2) + .....................+ (niVidi), were:
n1,n2,.....ni = the number of inseminated plates for dilutions d1, d2,.....di ;
V1,V2,.....Vi= volumes used (inseminated) for dilutionsd1, d2,.....di ;
d1,d2,.....di= performed dilutions(d1= 1 for the undiluted sample, d2 = 0,1 for dilution
10-1, d3 = 0,01 for dilution 10-2etc.)
Based on numerical density values obtained for this indicator in the analyzed samples
are assessed the heterotrophic potential for organic matter conversion- as the number
of heterotrophic bacteria is higher, thus the heterotrophic potential is higher, indicating
the presence of an active microbiota in the decomposition of organic matter.
For most samples, the values recorded for heterotrophic aerobic bacteria at 220C showed
a moderate contamination with biodegradable organic substances corresponding to
second quality class. At certain points have been determined higher values of
heterotrophic bacteria number, indicating an optimum heterotrophic potential regarding
conversion of organic matter, but also a more intense organic contamination, according
with critical ecological status of waters (Class-III quality) as can be seen in the figure
below.
Figure 4.10 Heterotrophic bacteria representation at 22 degrees Celsius
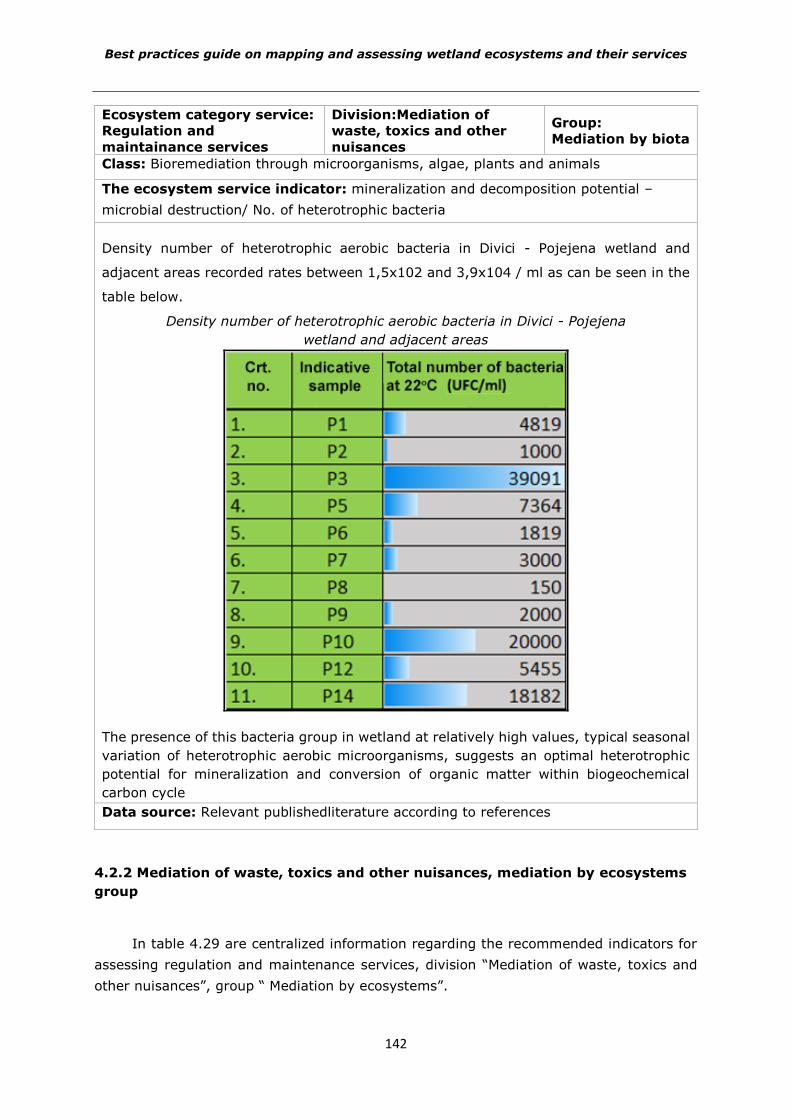
Best practices guide on mapping and assessing wetland ecosystems and their services
142
Ecosystem category service:
Regulation and
maintainance services
Division:Mediation of
waste, toxics and other
nuisances
Group:
Mediation by biota
Class: Bioremediation through microorganisms, algae, plants and animals
The ecosystem service indicator: mineralization and decomposition potential –
microbial destruction/ No. of heterotrophic bacteria
Density number of heterotrophic aerobic bacteria in Divici - Pojejena wetland and
adjacent areas recorded rates between 1,5x10² and 3,9x10⁴ / ml as can be seen in the
table below.
Density number of heterotrophic aerobic bacteria in Divici - Pojejena
wetland and adjacent areas
The presence of this bacteria group in wetland at relatively high values, typical seasonal
variation of heterotrophic aerobic microorganisms, suggests an optimal heterotrophic
potential for mineralization and conversion of organic matter within biogeochemical
carbon cycle
Data source: Relevant publishedliterature according to references
4.2.2 Mediation of waste, toxics and other nuisances, mediation by ecosystems
group
In table 4.29 are centralized information regarding the recommended indicators for
assessing regulation and maintenance services, division “Mediation of waste, toxics and
other nuisances”, group “ Mediation by ecosystems”.
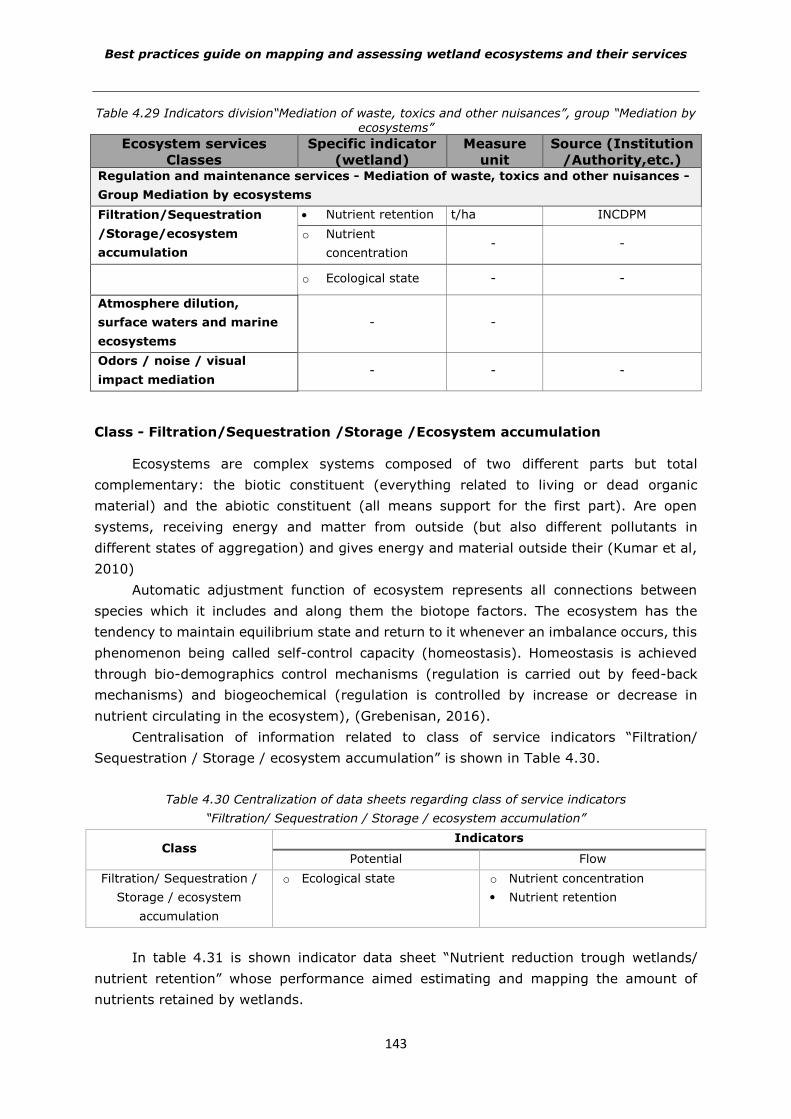
Best practices guide on mapping and assessing wetland ecosystems and their services
143
Table 4.29 Indicators division“Mediation of waste, toxics and other nuisances”, group “Mediation by ecosystems”
Ecosystem services
Classes
Specific indicator
(wetland)
Measure
unit
Source (Institution
/Authority,etc.) Regulation and maintenance services - Mediation of waste, toxics and other nuisances -
Group Mediation by ecosystems
Filtration/Sequestration
/Storage/ecosystem
accumulation
Nutrient retention t/ha INCDPM
o Nutrient
concentration- -
o Ecological state - -
Atmosphere dilution,
surface waters and marine
ecosystems
- -
Odors / noise / visual
impact mediation - - -
Class - Filtration/Sequestration /Storage /Ecosystem accumulation
Ecosystems are complex systems composed of two different parts but total
complementary: the biotic constituent (everything related to living or dead organic
material) and the abiotic constituent (all means support for the first part). Are open
systems, receiving energy and matter from outside (but also different pollutants in
different states of aggregation) and gives energy and material outside their (Kumar et al,
2010)
Automatic adjustment function of ecosystem represents all connections between
species which it includes and along them the biotope factors. The ecosystem has the
tendency to maintain equilibrium state and return to it whenever an imbalance occurs, this
phenomenon being called self-control capacity (homeostasis). Homeostasis is achieved
through bio-demographics control mechanisms (regulation is carried out by feed-back
mechanisms) and biogeochemical (regulation is controlled by increase or decrease in
nutrient circulating in the ecosystem), (Grebenisan, 2016).
Centralisation of information related to class of service indicators “Filtration/
Sequestration / Storage / ecosystem accumulation” is shown in Table 4.30.
Table 4.30 Centralization of data sheets regarding class of service indicators
“Filtration/ Sequestration / Storage / ecosystem accumulation”
Class Indicators
Potential Flow
Filtration/ Sequestration /
Storage / ecosystem
accumulation
o Ecological state o Nutrient concentration
Nutrient retention
In table 4.31 is shown indicator data sheet “Nutrient reduction trough wetlands/
nutrient retention” whose performance aimed estimating and mapping the amount of
nutrients retained by wetlands.
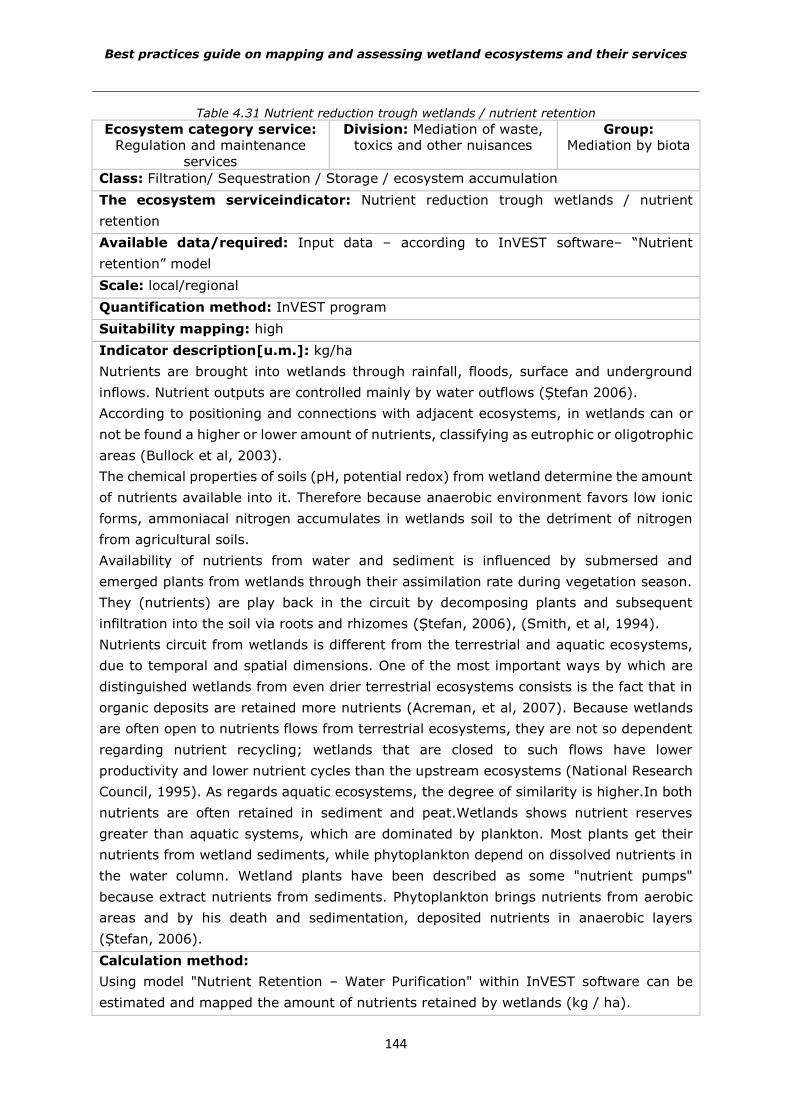
Best practices guide on mapping and assessing wetland ecosystems and their services
144
Table 4.31 Nutrient reduction trough wetlands / nutrient retention
Ecosystem category service:
Regulation and maintenance
services
Division: Mediation of waste,
toxics and other nuisances
Group:
Mediation by biota
Class: Filtration/ Sequestration / Storage / ecosystem accumulation
The ecosystem serviceindicator: Nutrient reduction trough wetlands / nutrient
retention
Available data/required: Input data – according to InVEST software– “Nutrient
retention” model
Scale: local/regional
Quantification method: InVEST program
Suitability mapping: high
Indicator description[u.m.]: kg/ha
Nutrients are brought into wetlands through rainfall, floods, surface and underground
inflows. Nutrient outputs are controlled mainly by water outflows (Ștefan 2006).
According to positioning and connections with adjacent ecosystems, in wetlands can or
not be found a higher or lower amount of nutrients, classifying as eutrophic or oligotrophic
areas (Bullock et al, 2003).
The chemical properties of soils (pH, potential redox) from wetland determine the amount
of nutrients available into it. Therefore because anaerobic environment favors low ionic
forms, ammoniacal nitrogen accumulates in wetlands soil to the detriment of nitrogen
from agricultural soils.
Availability of nutrients from water and sediment is influenced by submersed and
emerged plants from wetlands through their assimilation rate during vegetation season.
They (nutrients) are play back in the circuit by decomposing plants and subsequent
infiltration into the soil via roots and rhizomes (Ștefan, 2006), (Smith, et al, 1994).
Nutrients circuit from wetlands is different from the terrestrial and aquatic ecosystems,
due to temporal and spatial dimensions. One of the most important ways by which are
distinguished wetlands from even drier terrestrial ecosystems consists is the fact that in
organic deposits are retained more nutrients (Acreman, et al, 2007). Because wetlands
are often open to nutrients flows from terrestrial ecosystems, they are not so dependent
regarding nutrient recycling; wetlands that are closed to such flows have lower
productivity and lower nutrient cycles than the upstream ecosystems (National Research
Council, 1995). As regards aquatic ecosystems, the degree of similarity is higher.In both
nutrients are often retained in sediment and peat.Wetlands shows nutrient reserves
greater than aquatic systems, which are dominated by plankton. Most plants get their
nutrients from wetland sediments, while phytoplankton depend on dissolved nutrients in
the water column. Wetland plants have been described as some "nutrient pumps"
because extract nutrients from sediments. Phytoplankton brings nutrients from aerobic
areas and by his death and sedimentation, deposited nutrients in anaerobic layers
(Ștefan, 2006).
Calculation method:
Using model "Nutrient Retention – Water Purification" within InVEST software can be
estimated and mapped the amount of nutrients retained by wetlands (kg / ha).
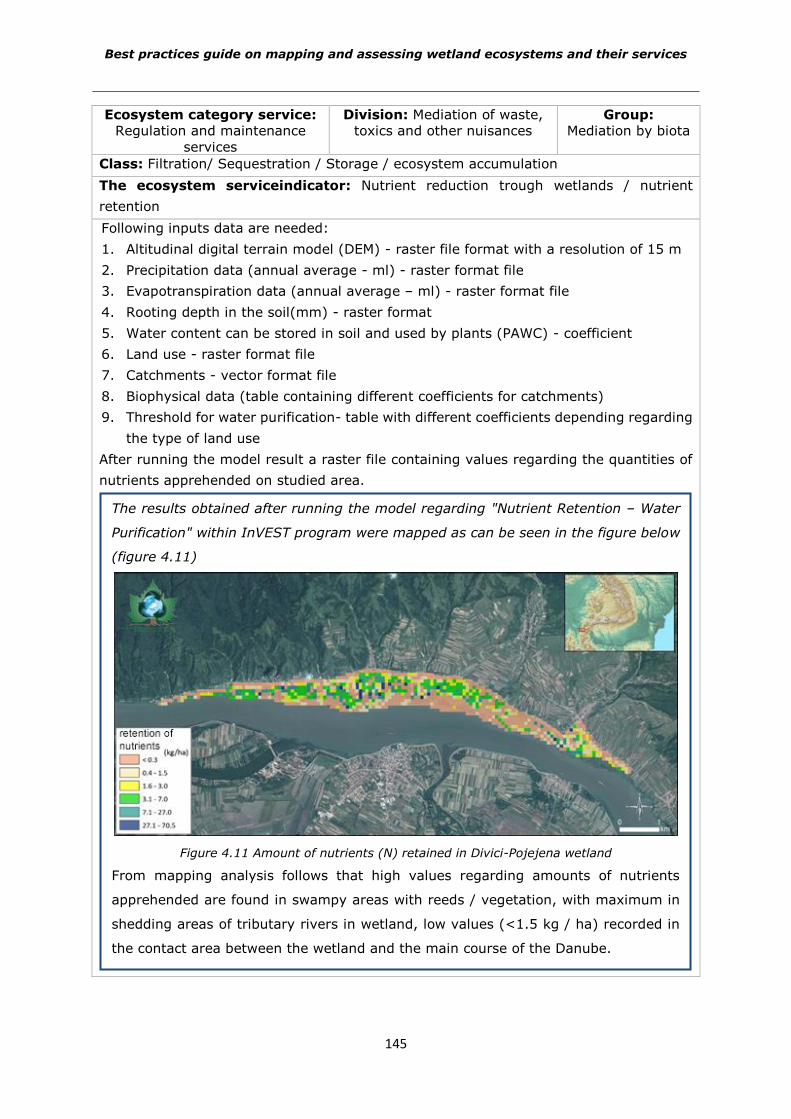
Best practices guide on mapping and assessing wetland ecosystems and their services
145
Ecosystem category service:
Regulation and maintenance
services
Division: Mediation of waste,
toxics and other nuisances
Group:
Mediation by biota
Class: Filtration/ Sequestration / Storage / ecosystem accumulation
The ecosystem serviceindicator: Nutrient reduction trough wetlands / nutrient
retention
Following inputs data are needed:
1. Altitudinal digital terrain model (DEM) - raster file format with a resolution of 15 m
2. Precipitation data (annual average - ml) - raster format file
3. Evapotranspiration data (annual average – ml) - raster format file
4. Rooting depth in the soil(mm) - raster format
5. Water content can be stored in soil and used by plants (PAWC) - coefficient
6. Land use - raster format file
7. Catchments - vector format file
8. Biophysical data (table containing different coefficients for catchments)
9. Threshold for water purification- table with different coefficients depending regarding
the type of land use
After running the model result a raster file containing values regarding the quantities of
nutrients apprehended on studied area.
The results obtained after running the model regarding "Nutrient Retention – Water
Purification" within InVEST program were mapped as can be seen in the figure below
(figure 4.11)
Figure 4.11 Amount of nutrients (N) retained in Divici-Pojejena wetland
From mapping analysis follows that high values regarding amounts of nutrients
apprehended are found in swampy areas with reeds / vegetation, with maximum in
shedding areas of tributary rivers in wetland, low values (<1.5 kg / ha) recorded in
the contact area between the wetland and the main course of the Danube.
Best practices guide on mapping and assessing wetland ecosystems and their services
146
Ecosystem category service:
Regulation and maintenance
services
Division: Mediation of waste,
toxics and other nuisances
Group:
Mediation by biota
Class: Filtration/ Sequestration / Storage / ecosystem accumulation
The ecosystem serviceindicator: Nutrient reduction trough wetlands / nutrient
retention
Data Source: Corine Land Cover, InVEST program,
http://data.naturalcapitalproject.org/nightly-
build/release_default/release_default/documentation/waterpurification.html
4.2.3 Mediation of flows service, mass flows group
In table 4.32 are centralized the information regarding the recommended indicators
for assessing control services and maintenance, "Mediation of flows" division, "mass flows
group".
Table 4.32 Indicators of "Mediation of flows" division, "Flows Table" group
Class
Ecosystem services
Specific indicator
(wetland)
Data / information
held
Source (Institution
/Authority, etc.)
Regulation and maintenance services -Mediation of flows" division, "Flows Table" group
Buffering / mass flow
neutralization and
mitigation
• sediment
retention
Geoelectrical
measurements and
boreholes
Laboratory tests
INCDPM
Mass stabilization and
erosion control rate - - -
Class - mass flow buffering / neutralization and mitigation
Information centralisation related to class of service indicators "mass flow buffering
/ neutralization and mitigation" is shown in Table 4.33.
Table 4.33 Centralization sheets of class service indicators "buffering / mass flow neutralization and
mitigation"
Class Indicators
Potential Flow
Mass flow buffering /
neutralization and
mitigation
• Sediment retention -
In table 4.34 is presented the sediment retention indicator sheet which aims at
estimating process of settling on the Danube, from Divici-Pojejena wetland.
Best practices guide on mapping and assessing wetland ecosystems and their services
147
Table 4.34 Sediment retention
Category ecosystem service:
Regulation and maintenance
services
Division:
Mediation of flows
Group:
Mass flows
Class: Mass flow buffering / neutralization and mitigation
The ecosystem services indicator: Sediment retention Divici-Pojojena
Available data: Geoelectrical measurements and boreholes
Scale: local
Quantifying method: see the calculation method
Mapping suitability:average
Indicator description [u.m.]: The sedimentation expressed in kg/s or g/s
Calculation method:
In the studied area the sedimentation process is influenced both by the Danube and
the direct tributaries of this area.
To estimate the sedimentation process in the impact study of the project
"studies"developed by INCDPM Bucharest between 2014 - 2015, prior to the
implementation of the present study, were performed geoelectrical measurements and
boreholes were collected and analyzed soil samples.
In the field campaigns samples were collected in suspension and dragged sediments
on tributary courses located in the area of interest. Transport of dragged sediments
across the width of the sections was monitored at important fluctuations, ranging from
0.16 g / s to 0.6 kg / s during floods (INCDPM, 2015). It was determined a total annual
quantity of sediments in suspension of the entire area study based on sediments in
suspension runoff in specific environments (0.5 t / ha / year), deposited in the wetland.
The annual quantity value of the sediments is 84269.6 tons and formed an average
thickness of 21.2 mm (evenly distribute on the wetland surface) (INCDPM, 2014).
Analysis of the existing information volume indicates an average deposit rate in the
entire area of the wetland of 5 cm per year, with an acceptable degree of confidence
(INCDPM, 2014).
Data sources: Progress reports and final report of the project "Studies for achieving
shore protection for wetland area Divici-Pojejena", INCDPM Bucharest, 2014
4.2.4 Mediation of flows service, liquid flows group
In table 4.35 are centralized the information regarding the recommended indicators
for assessing regulation and maintainance services, "Mediation of flows" division, "Liquid
flows" group.
Best practices guide on mapping and assessing wetland ecosystems and their services
148
Table 4.35 Indicators of "Mediation of flows" division, "Liquid flows" group
Category:
Ecosystem services
Specific indicator
(wetland)
Data /
information held
Institution/Authorit
y
Regulation and maintenance services - Mediation flows division - Liquid flows group
Hydrological cycle and
water flow
maintaining
Wetlands surface
area - -
Protection against
floods
Soil capacity
regarding water
retention
- -
Surface of
flooded areas
The total flooded
area in hectares
for various MNC
elevation
INCDPM
Recorded annual
floods - -
The conservation
status of riparian
from wetland areas
- -
Class -Protection against floods
Centralisation of information related to the class of service indicators "Protection
against floods" is shown in Table 4.36.
Table 4.36 Class of service indicators sheets centralization of "Protection against floods"
Class Indicators
Potential Flow
Surface of flooded areas
The conservation status of riparian
areas from wetlands
Soil capacity regarding water
retention
Recorded annual floods
In table 4.37 is presented the indicator sheet "surface flooded areas" that aims to
identify the maximum water level and extent of flooding in Divici-Pojejena wetland.
Table 4.37 Surface of flooded areas
Ecosystem service category:
Regulation and maintenance services
Division:
Mediation of flows
Group:
Liquid flows
Class: Protection against floods
The ecosystem services indicator: Surface of flooded areas
Available data: On-field measurements
Input data corresponding to the numerical modeling program
Data processing with geographical information systems
Scale: local
Quantifying method: flooding studies
Suitability mapping: average
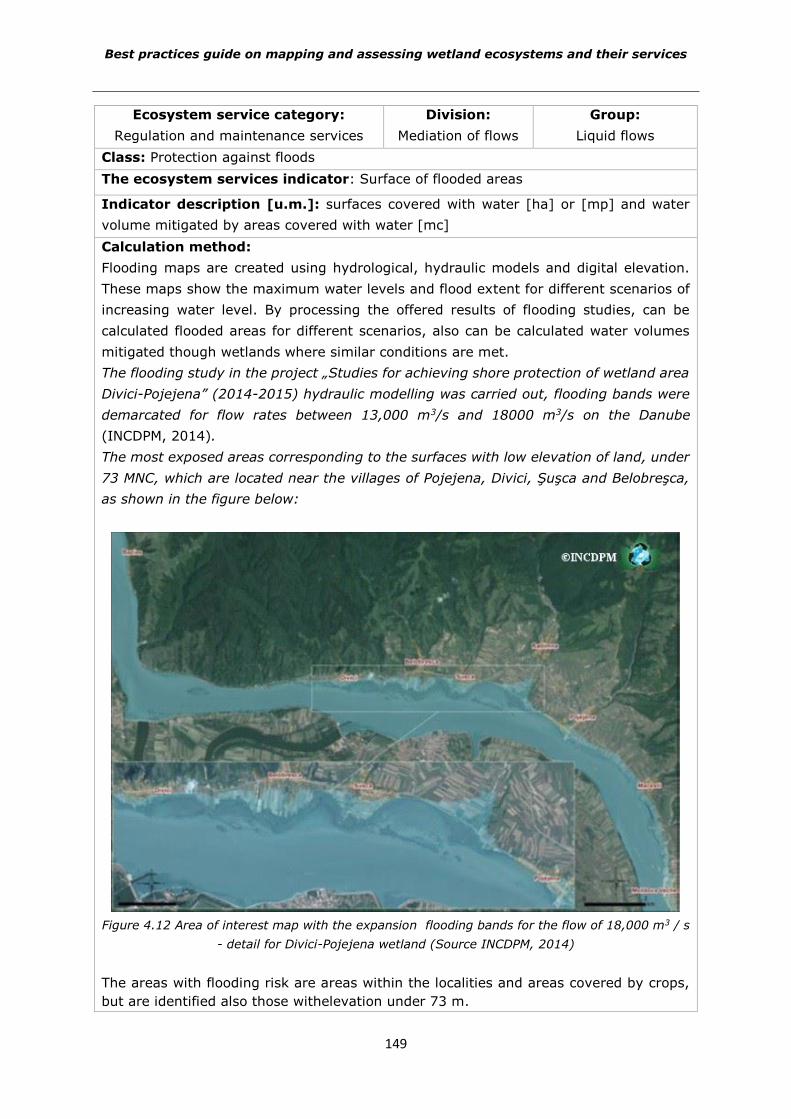
Best practices guide on mapping and assessing wetland ecosystems and their services
149
Ecosystem service category:
Regulation and maintenance services
Division:
Mediation of flows
Group:
Liquid flows
Class: Protection against floods
The ecosystem services indicator: Surface of flooded areas
Indicator description [u.m.]: surfaces covered with water [ha] or [mp] and water
volume mitigated by areas covered with water [mc]
Calculation method:
Flooding maps are created using hydrological, hydraulic models and digital elevation.
These maps show the maximum water levels and flood extent for different scenarios of
increasing water level. By processing the offered results of flooding studies, can be
calculated flooded areas for different scenarios, also can be calculated water volumes
mitigated though wetlands where similar conditions are met.
The flooding study in the project „Studies for achieving shore protection of wetland area
Divici-Pojejena” (2014-2015) hydraulic modelling was carried out, flooding bands were
demarcated for flow rates between 13,000 m3/s and 18000 m3/s on the Danube
(INCDPM, 2014).
The most exposed areas corresponding to the surfaces with low elevation of land, under
73 MNC, which are located near the villages of Pojejena, Divici, Şuşca and Belobreşca,
as shown in the figure below:
Figure 4.12 Area of interest map with the expansion flooding bands for the flow of 18,000 m3 / s
- detail for Divici-Pojejena wetland (Source INCDPM, 2014)
The areas with flooding risk are areas within the localities and areas covered by crops,
but are identified also those withelevation under 73 m.
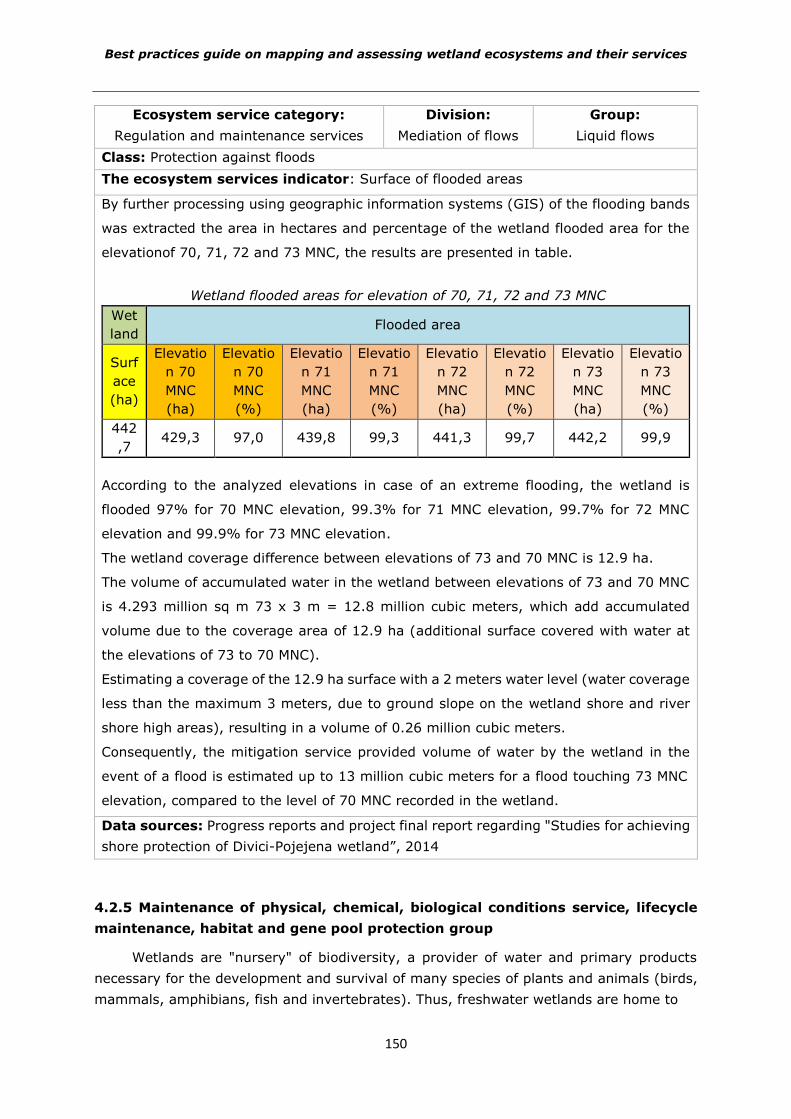
Best practices guide on mapping and assessing wetland ecosystems and their services
150
Ecosystem service category:
Regulation and maintenance services
Division:
Mediation of flows
Group:
Liquid flows
Class: Protection against floods
The ecosystem services indicator: Surface of flooded areas
By further processing using geographic information systems (GIS) of the flooding bands
was extracted the area in hectares and percentage of the wetland flooded area for the
elevationof 70, 71, 72 and 73 MNC, the results are presented in table.
Wetland flooded areas for elevation of 70, 71, 72 and 73 MNC
Wet
land Flooded area
Surf
ace
(ha)
Elevatio
n 70
MNC
(ha)
Elevatio
n 70
MNC
(%)
Elevatio
n 71
MNC
(ha)
Elevatio
n 71
MNC
(%)
Elevatio
n 72
MNC
(ha)
Elevatio
n 72
MNC
(%)
Elevatio
n 73
MNC
(ha)
Elevatio
n 73
MNC
(%)
442
,7 429,3 97,0 439,8 99,3 441,3 99,7 442,2 99,9
According to the analyzed elevations in case of an extreme flooding, the wetland is
flooded 97% for 70 MNC elevation, 99.3% for 71 MNC elevation, 99.7% for 72 MNC
elevation and 99.9% for 73 MNC elevation.
The wetland coverage difference between elevations of 73 and 70 MNC is 12.9 ha.
The volume of accumulated water in the wetland between elevations of 73 and 70 MNC
is 4.293 million sq m 73 x 3 m = 12.8 million cubic meters, which add accumulated
volume due to the coverage area of 12.9 ha (additional surface covered with water at
the elevations of 73 to 70 MNC).
Estimating a coverage of the 12.9 ha surface with a 2 meters water level (water coverage
less than the maximum 3 meters, due to ground slope on the wetland shore and river
shore high areas), resulting in a volume of 0.26 million cubic meters.
Consequently, the mitigation service provided volume of water by the wetland in the
event of a flood is estimated up to 13 million cubic meters for a flood touching 73 MNC
elevation, compared to the level of 70 MNC recorded in the wetland.
Data sources: Progress reports and project final report regarding "Studies for achieving
shore protection of Divici-Pojejena wetland”, 2014
4.2.5 Maintenance of physical, chemical, biological conditions service, lifecycle
maintenance, habitat and gene pool protection group
Wetlands are "nursery" of biodiversity, a provider of water and primary products
necessary for the development and survival of many species of plants and animals (birds,
mammals, amphibians, fish and invertebrates). Thus, freshwater wetlands are home to
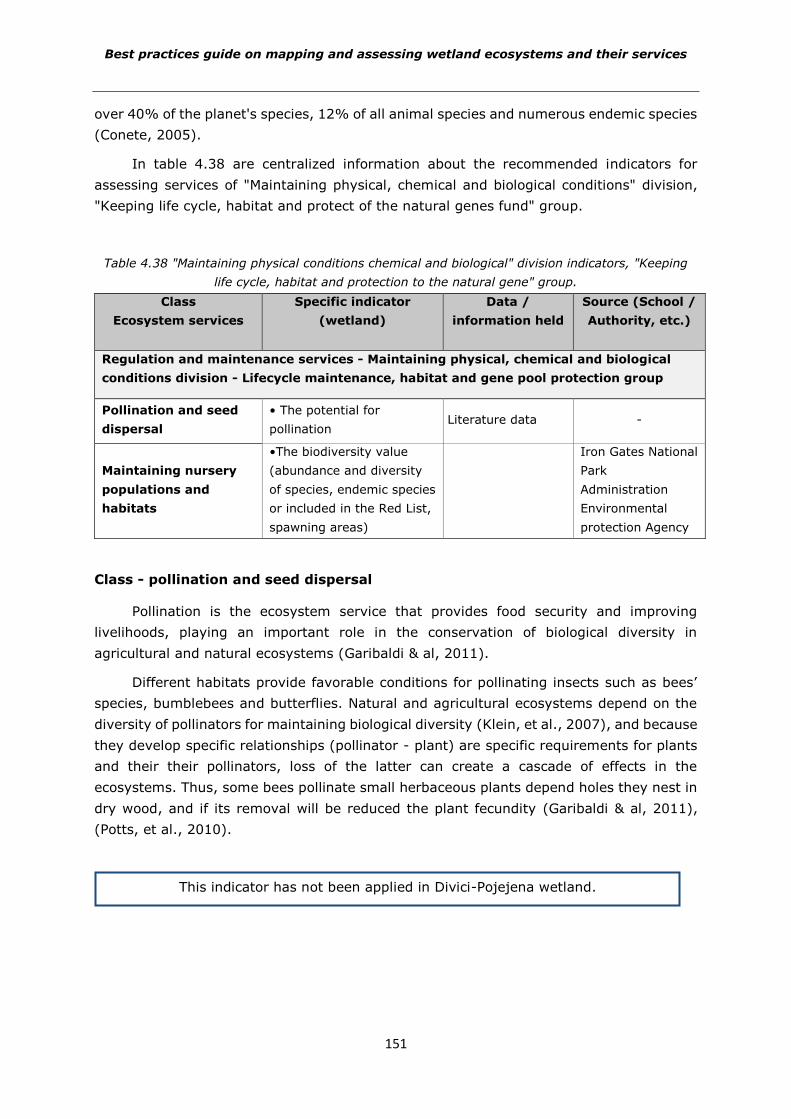
Best practices guide on mapping and assessing wetland ecosystems and their services
151
over 40% of the planet's species, 12% of all animal species and numerous endemic species
(Conete, 2005).
In table 4.38 are centralized information about the recommended indicators for
assessing services of "Maintaining physical, chemical and biological conditions" division,
"Keeping life cycle, habitat and protect of the natural genes fund" group.
Table 4.38 "Maintaining physical conditions chemical and biological" division indicators, "Keeping
life cycle, habitat and protection to the natural gene" group.
Class
Ecosystem services
Specific indicator
(wetland)
Data /
information held
Source (School /
Authority, etc.)
Regulation and maintenance services - Maintaining physical, chemical and biological
conditions division - Lifecycle maintenance, habitat and gene pool protection group
Pollination and seed
dispersal
• The potential for
pollination Literature data -
Maintaining nursery
populations and
habitats
•The biodiversity value
(abundance and diversity
of species, endemic species
or included in the Red List,
spawning areas)
Iron Gates National
Park
Administration
Environmental
protection Agency
Class - pollination and seed dispersal
Pollination is the ecosystem service that provides food security and improving
livelihoods, playing an important role in the conservation of biological diversity in
agricultural and natural ecosystems (Garibaldi & al, 2011).
Different habitats provide favorable conditions for pollinating insects such as bees’
species, bumblebees and butterflies. Natural and agricultural ecosystems depend on the
diversity of pollinators for maintaining biological diversity (Klein, et al., 2007), and because
they develop specific relationships (pollinator - plant) are specific requirements for plants
and their their pollinators, loss of the latter can create a cascade of effects in the
ecosystems. Thus, some bees pollinate small herbaceous plants depend holes they nest in
dry wood, and if its removal will be reduced the plant fecundity (Garibaldi & al, 2011),
(Potts, et al., 2010).
This indicator has not been applied in Divici-Pojejena wetland.
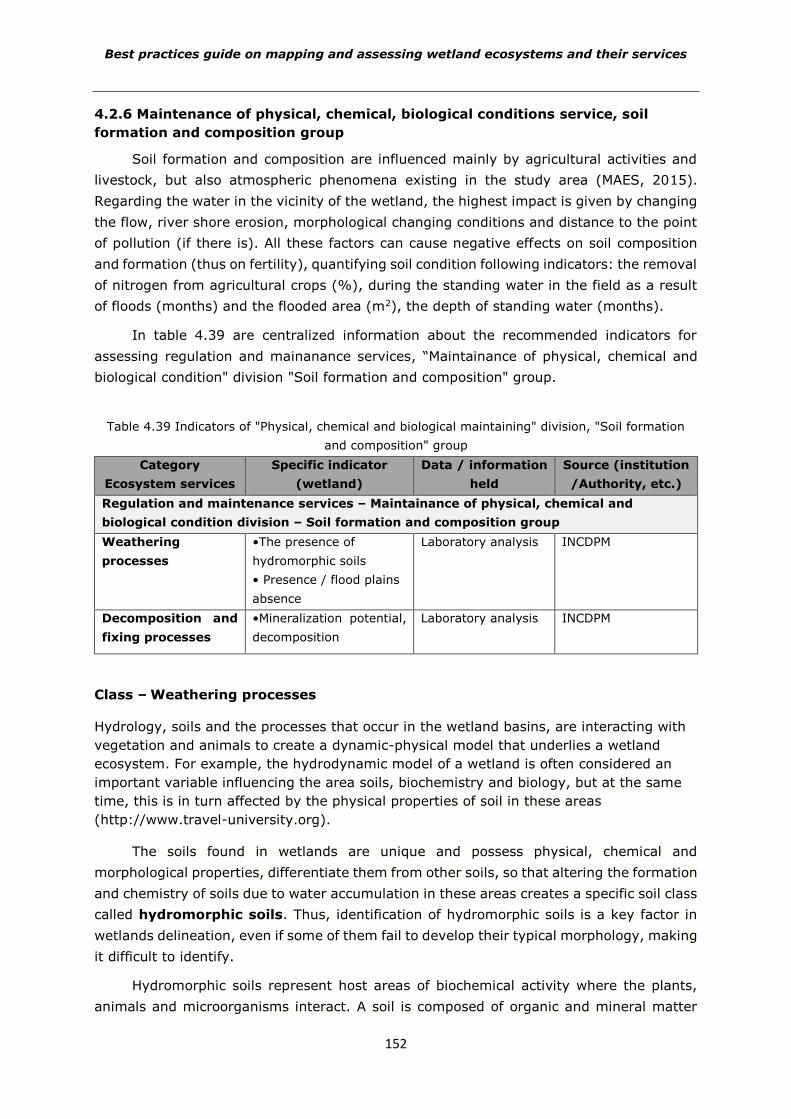
Best practices guide on mapping and assessing wetland ecosystems and their services
152
4.2.6 Maintenance of physical, chemical, biological conditions service, soil
formation and composition group
Soil formation and composition are influenced mainly by agricultural activities and
livestock, but also atmospheric phenomena existing in the study area (MAES, 2015).
Regarding the water in the vicinity of the wetland, the highest impact is given by changing
the flow, river shore erosion, morphological changing conditions and distance to the point
of pollution (if there is). All these factors can cause negative effects on soil composition
and formation (thus on fertility), quantifying soil condition following indicators: the removal
of nitrogen from agricultural crops (%), during the standing water in the field as a result
of floods (months) and the flooded area (m2), the depth of standing water (months).
In table 4.39 are centralized information about the recommended indicators for
assessing regulation and mainanance services, “Maintainance of physical, chemical and
biological condition" division "Soil formation and composition" group.
Table 4.39 Indicators of "Physical, chemical and biological maintaining" division, "Soil formation
and composition" group
Category
Ecosystem services
Specific indicator
(wetland)
Data / information
held
Source (institution
/Authority, etc.)
Regulation and maintenance services – Maintainance of physical, chemical and
biological condition division – Soil formation and composition group
Weathering
processes
•The presence of
hydromorphic soils
• Presence / flood plains
absence
Laboratory analysis INCDPM
Decomposition and
fixing processes
•Mineralization potential,
decomposition
Laboratory analysis INCDPM
Class – Weathering processes
Hydrology, soils and the processes that occur in the wetland basins, are interacting with
vegetation and animals to create a dynamic-physical model that underlies a wetland
ecosystem. For example, the hydrodynamic model of a wetland is often considered an
important variable influencing the area soils, biochemistry and biology, but at the same
time, this is in turn affected by the physical properties of soil in these areas
(http://www.travel-university.org).
The soils found in wetlands are unique and possess physical, chemical and
morphological properties, differentiate them from other soils, so that altering the formation
and chemistry of soils due to water accumulation in these areas creates a specific soil class
called hydromorphic soils. Thus, identification of hydromorphic soils is a key factor in
wetlands delineation, even if some of them fail to develop their typical morphology, making
it difficult to identify.
Hydromorphic soils represent host areas of biochemical activity where the plants,
animals and microorganisms interact. A soil is composed of organic and mineral matter
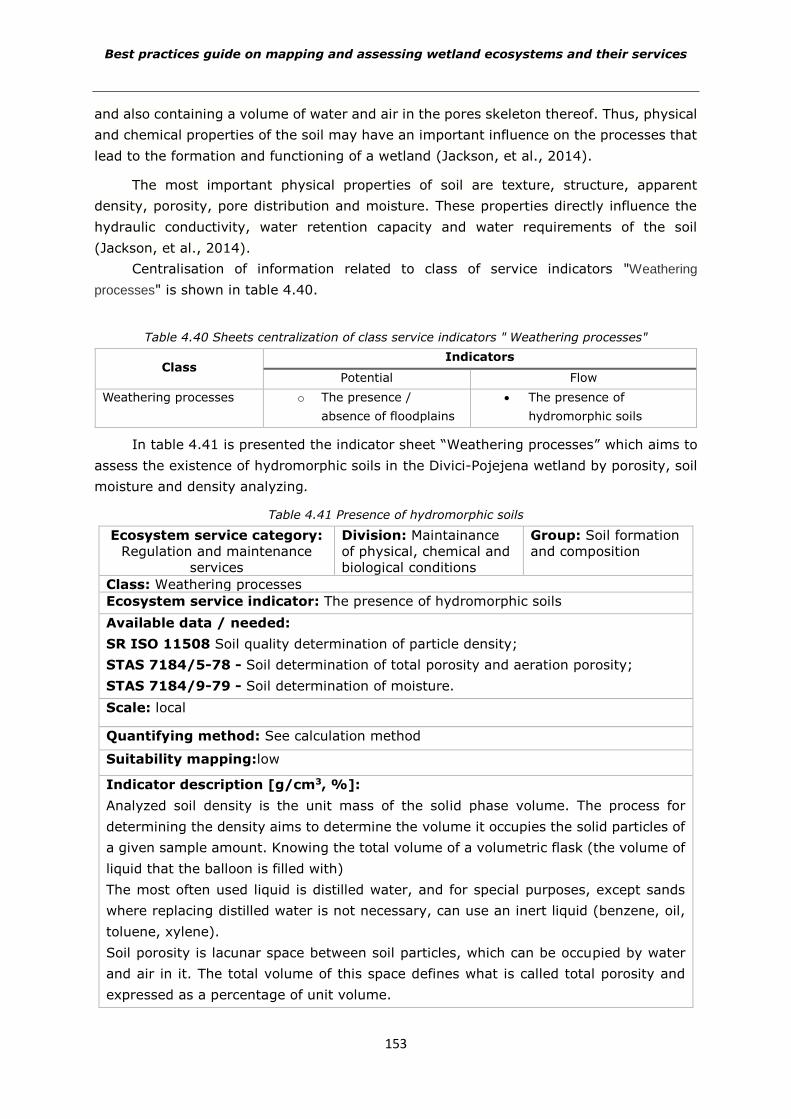
Best practices guide on mapping and assessing wetland ecosystems and their services
153
and also containing a volume of water and air in the pores skeleton thereof. Thus, physical
and chemical properties of the soil may have an important influence on the processes that
lead to the formation and functioning of a wetland (Jackson, et al., 2014).
The most important physical properties of soil are texture, structure, apparent
density, porosity, pore distribution and moisture. These properties directly influence the
hydraulic conductivity, water retention capacity and water requirements of the soil
(Jackson, et al., 2014).
Centralisation of information related to class of service indicators "Weathering
processes" is shown in table 4.40.
Table 4.40 Sheets centralization of class service indicators " Weathering processes"
Class Indicators
Potential Flow
Weathering processes o The presence /
absence of floodplains
The presence of
hydromorphic soils
In table 4.41 is presented the indicator sheet “Weathering processes” which aims to
assess the existence of hydromorphic soils in the Divici-Pojejena wetland by porosity, soil
moisture and density analyzing.
Table 4.41 Presence of hydromorphic soils
Ecosystem service category:
Regulation and maintenance
services
Division: Maintainance
of physical, chemical and
biological conditions
Group: Soil formation
and composition
Class: Weathering processes
Ecosystem service indicator: The presence of hydromorphic soils
Available data / needed:
SR ISO 11508 Soil quality determination of particle density;
STAS 7184/5-78 - Soil determination of total porosity and aeration porosity;
STAS 7184/9-79 - Soil determination of moisture.
Scale: local
Quantifying method: See calculation method
Suitability mapping:low
Indicator description [g/cm3, %]:
Analyzed soil density is the unit mass of the solid phase volume. The process for
determining the density aims to determine the volume it occupies the solid particles of
a given sample amount. Knowing the total volume of a volumetric flask (the volume of
liquid that the balloon is filled with)
The most often used liquid is distilled water, and for special purposes, except sands
where replacing distilled water is not necessary, can use an inert liquid (benzene, oil,
toluene, xylene).
Soil porosity is lacunar space between soil particles, which can be occupied by water
and air in it. The total volume of this space defines what is called total porosity and
expressed as a percentage of unit volume.
Best practices guide on mapping and assessing wetland ecosystems and their services
154
Ecosystem service category:
Regulation and maintenance
services
Division: Maintainance
of physical, chemical and
biological conditions
Group: Soil formation
and composition
Moisture as a physical factor may change quite significantly soil mechanical properties:
one and the same soil, depending on the content of water it can be hard or soft. Soil
moisture depends on climate, nature, soil inclination and vegetation. In addition to
temperature, soil humidity influences, to a large extent, the biological activity and
therefore the possibility of self-cleaning. Moisture in the soil is an important parameter
in assessing the dynamics of carbon and nitrogen in the soil, so that the processes of
decomposition and microbial metabolism increases with increasing of soil moisture and
temperature increase. Also in areas with a large surplus of rainfall and where ground
water is present at very low depths, meet hydromorphic soils (conditioned by
humidity).
Calculation method:
Soil samples density value is calculated based on the relationship:
)/( 3
21
cmgGGG
GDensity
where:
G – mass of the analyzed sample (g);
G1 – water full balloon mass (g);
G2 – balloon mass with test sample and water, (g);
– water density when determining, g/cm3.
The density of distilled water, may be considered equal to 0.998 g/cm3, changing
the volume depending on the temperature being negligible.
The total porosity calculation is based on relationship:
PT = 100· (1 – DA / D)
where: PT – total porosity(% v / v),
DA – apparent density (g / cm3),
D – density (g/cm3)
Soil moisture is characterized by water content in each unit of dry matter and is
determined by the ratio:
U % =
g
BA 100
A – the weight of the soil prior to drying in g;
B – the weight of the soil after drying at 1050C in g;
g – the weight of the soil taken into account, in g.
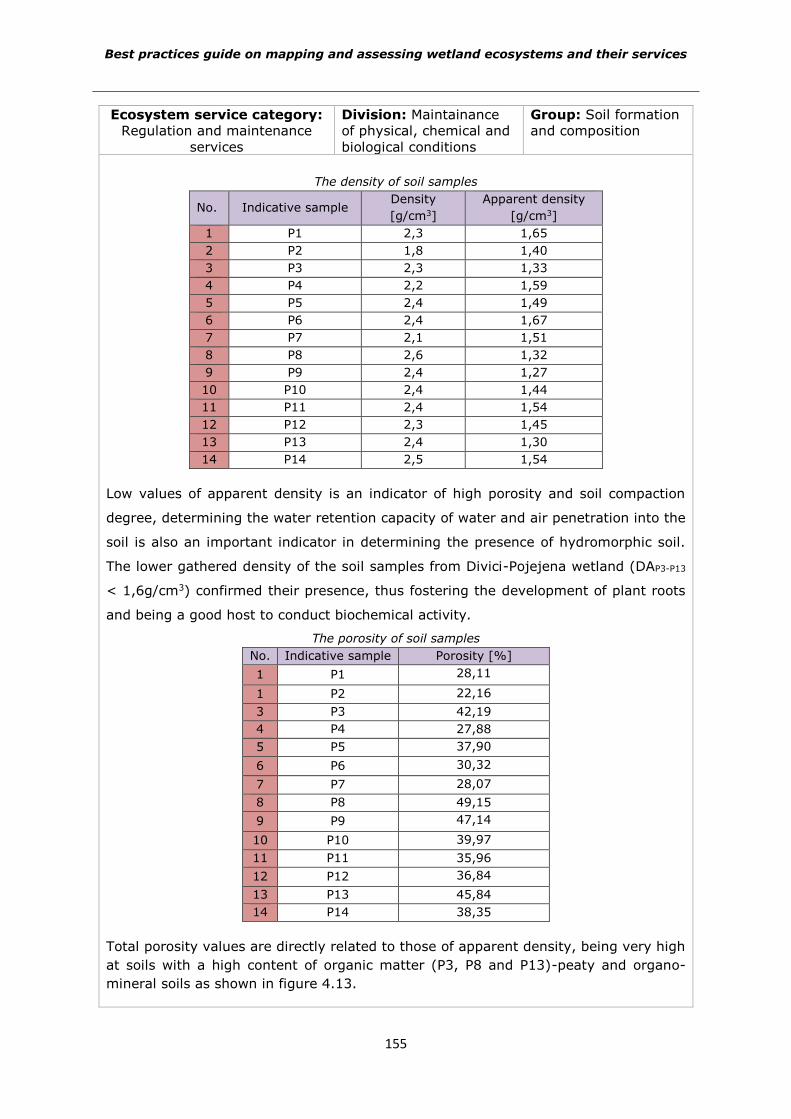
Best practices guide on mapping and assessing wetland ecosystems and their services
155
Ecosystem service category:
Regulation and maintenance
services
Division: Maintainance
of physical, chemical and
biological conditions
Group: Soil formation
and composition
The density of soil samples
No. Indicative sample Density
[g/cm3]
Apparent density
[g/cm3]
1 P1 2,3 1,65
2 P2 1,8 1,40
3 P3 2,3 1,33
4 P4 2,2 1,59
5 P5 2,4 1,49
6 P6 2,4 1,67
7 P7 2,1 1,51
8 P8 2,6 1,32
9 P9 2,4 1,27
10 P10 2,4 1,44
11 P11 2,4 1,54
12 P12 2,3 1,45
13 P13 2,4 1,30
14 P14 2,5 1,54
Low values of apparent density is an indicator of high porosity and soil compaction
degree, determining the water retention capacity of water and air penetration into the
soil is also an important indicator in determining the presence of hydromorphic soil.
The lower gathered density of the soil samples from Divici-Pojejena wetland (DAP3-P13
< 1,6g/cm3) confirmed their presence, thus fostering the development of plant roots
and being a good host to conduct biochemical activity.
The porosity of soil samples
No. Indicative sample Porosity [%]
1 P1 28,11
1 P2 22,16
3 P3 42,19
4 P4 27,88
5 P5 37,90
6 P6 30,32
7 P7 28,07
8 P8 49,15
9 P9 47,14
10 P10 39,97
11 P11 35,96
12 P12 36,84
13 P13 45,84
14 P14 38,35
Total porosity values are directly related to those of apparent density, being very high
at soils with a high content of organic matter (P3, P8 and P13)-peaty and organo-
mineral soils as shown in figure 4.13.
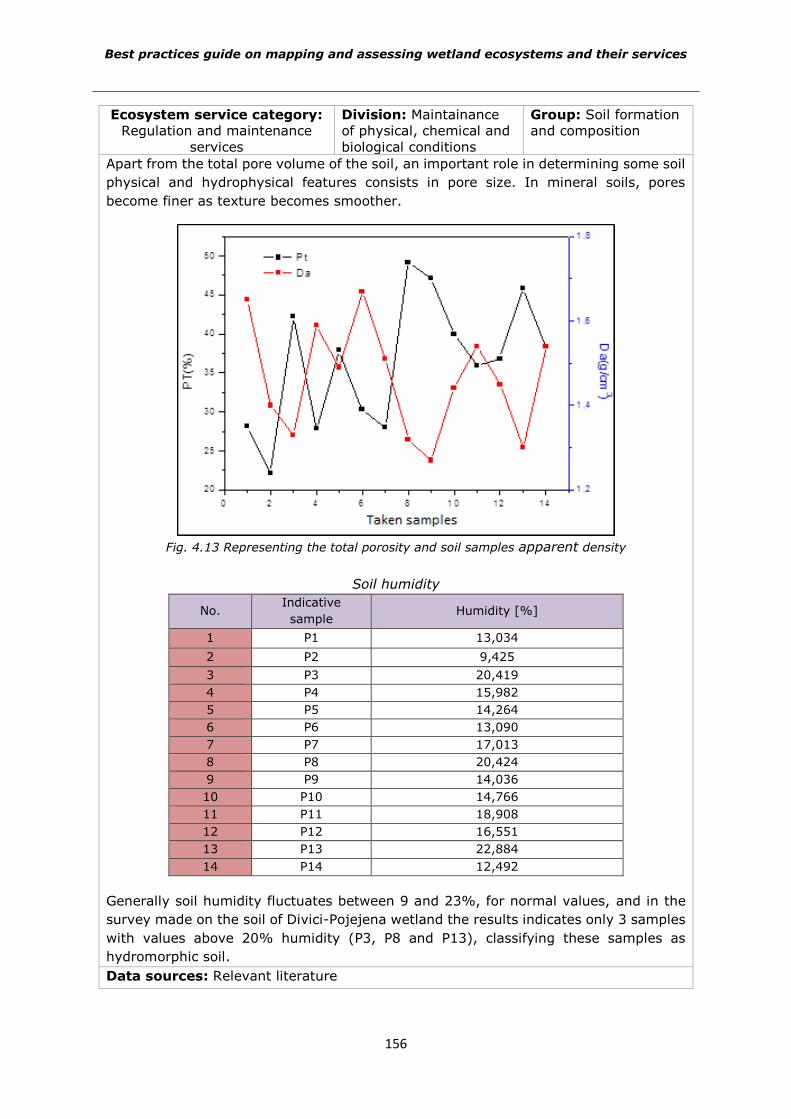
Best practices guide on mapping and assessing wetland ecosystems and their services
156
Ecosystem service category:
Regulation and maintenance
services
Division: Maintainance
of physical, chemical and
biological conditions
Group: Soil formation
and composition
Apart from the total pore volume of the soil, an important role in determining some soil
physical and hydrophysical features consists in pore size. In mineral soils, pores
become finer as texture becomes smoother.
Fig. 4.13 Representing the total porosity and soil samples apparent density
Soil humidity
No. Indicative
sample Humidity [%]
1 P1 13,034
2 P2 9,425
3 P3 20,419
4 P4 15,982
5 P5 14,264
6 P6 13,090
7 P7 17,013
8 P8 20,424
9 P9 14,036
10 P10 14,766
11 P11 18,908
12 P12 16,551
13 P13 22,884
14 P14 12,492
Generally soil humidity fluctuates between 9 and 23%, for normal values, and in the
survey made on the soil of Divici-Pojejena wetland the results indicates only 3 samples
with values above 20% humidity (P3, P8 and P13), classifying these samples as
hydromorphic soil.
Data sources: Relevant literature
Best practices guide on mapping and assessing wetland ecosystems and their services
157
Class -Decomposition and fixing processes
In table 4.42 are centralized information related to service class indicators "Processes
of decomposition and fixation”.
Table 4.42 Centralizing sheets with class of service indicators “Processes of decomposition and
fixation”
Class Indicators
Potential Flow
Processes of decomposition
and fixation
Mineralization and
decomposition
potential
Carbon storage
In table 4.43 is presented the indicator sheet “Mineralization and decomposition
potential - Organic carbon in soil” which aims to determine the values of total organic
carbon and the soil report C/N.
Table 4.43 Indicator of mineralization and decomposition potential – through the indicator: Soil
organic carbon
Ecosystem service category:
Regulation and maintenance
services
Division: Maintainance of
physical, chemical and
biological conditions
Group: Soil formation and
composition
Class: Decomposition and fixing processes
Ecosystem service indicator: Mineralization and decomposition potential – through the
indicator – Soil organic carbon
Available data: Laboratory analysis on soil samples
Scale: local/regional
Quantifying method: see the calculation method
Suitability mapping: average/low
Indicator description [u.m.]: Soil organic carbon content; %, g C/100 g sol, t C/ha
The content of organic matter in soil and sediments is mainly due to the submission of organic
suspensions phenomenon (organic matter and biogenic elements) and bioaccumulation
processes even at coarse textures. Factors involved in controlling the amount of soil organic
matter are: the decomposition rate of the material and the availability of decomposition sources.
In addition, the availability of organic carbon in the soil, as well it affects the water retention
capacity, soil fertility, compaction resistance, biodiversity and sensitivity to acidification or
alkalizing (Anon., n.d.).
Physico-chemical characteristics of organic soils:
Less density (0,2-0,3 g/cm3) and water retention capacity higher compared to mineral
soils (1-2 g/cm3); peat soils covered with moss have a density between 0,02-0,04 g/cm3;
Hydraulic conductivity lower than in mineral soils (with the exception of clay) (Anon.,
n.d.).
Calculation method:
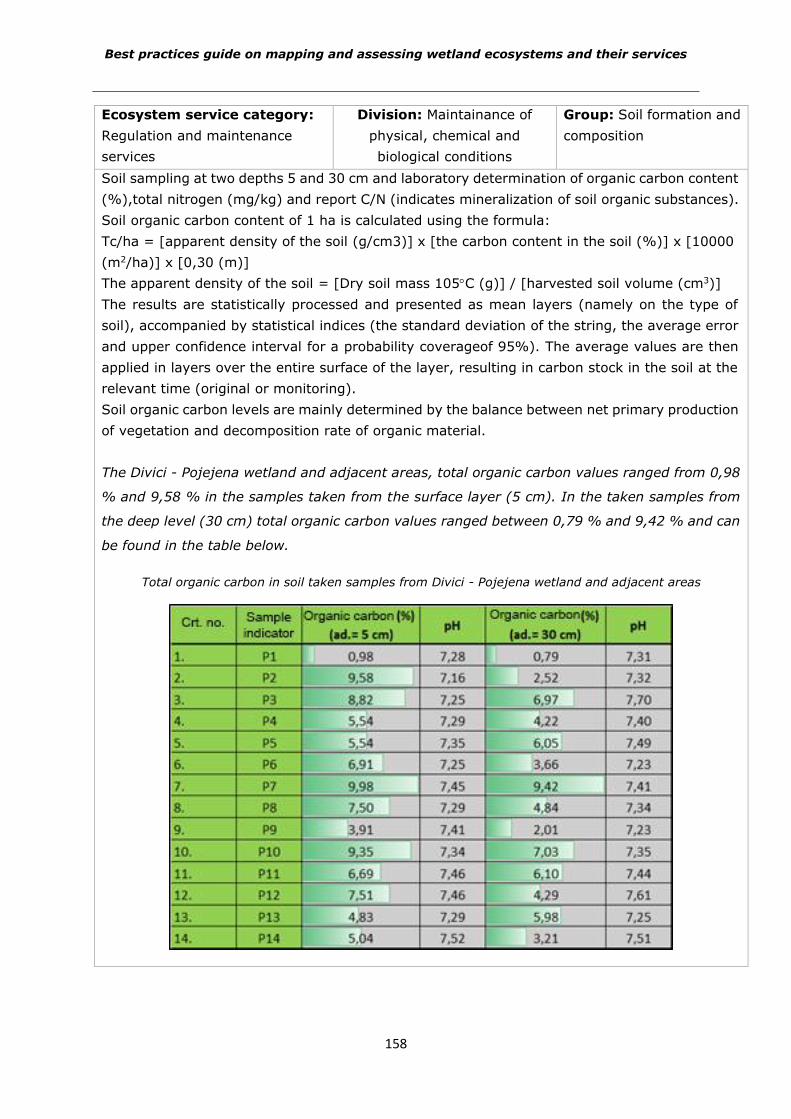
Best practices guide on mapping and assessing wetland ecosystems and their services
158
Ecosystem service category:
Regulation and maintenance
services
Division: Maintainance of
physical, chemical and
biological conditions
Group: Soil formation and
composition
Soil sampling at two depths 5 and 30 cm and laboratory determination of organic carbon content
(%),total nitrogen (mg/kg) and report C/N (indicates mineralization of soil organic substances).
Soil organic carbon content of 1 ha is calculated using the formula:
Tc/ha = [apparent density of the soil (g/cm3)] x [the carbon content in the soil (%)] x [10000
(m2/ha)] x [0,30 (m)]
The apparent density of the soil = [Dry soil mass 105°C (g)] / [harvested soil volume (cm3)]
The results are statistically processed and presented as mean layers (namely on the type of
soil), accompanied by statistical indices (the standard deviation of the string, the average error
and upper confidence interval for a probability coverageof 95%). The average values are then
applied in layers over the entire surface of the layer, resulting in carbon stock in the soil at the
relevant time (original or monitoring).
Soil organic carbon levels are mainly determined by the balance between net primary production
of vegetation and decomposition rate of organic material.
The Divici - Pojejena wetland and adjacent areas, total organic carbon values ranged from 0,98
% and 9,58 % in the samples taken from the surface layer (5 cm). In the taken samples from
the deep level (30 cm) total organic carbon values ranged between 0,79 % and 9,42 % and can
be found in the table below.
Total organic carbon in soil taken samples from Divici - Pojejena wetland and adjacent areas
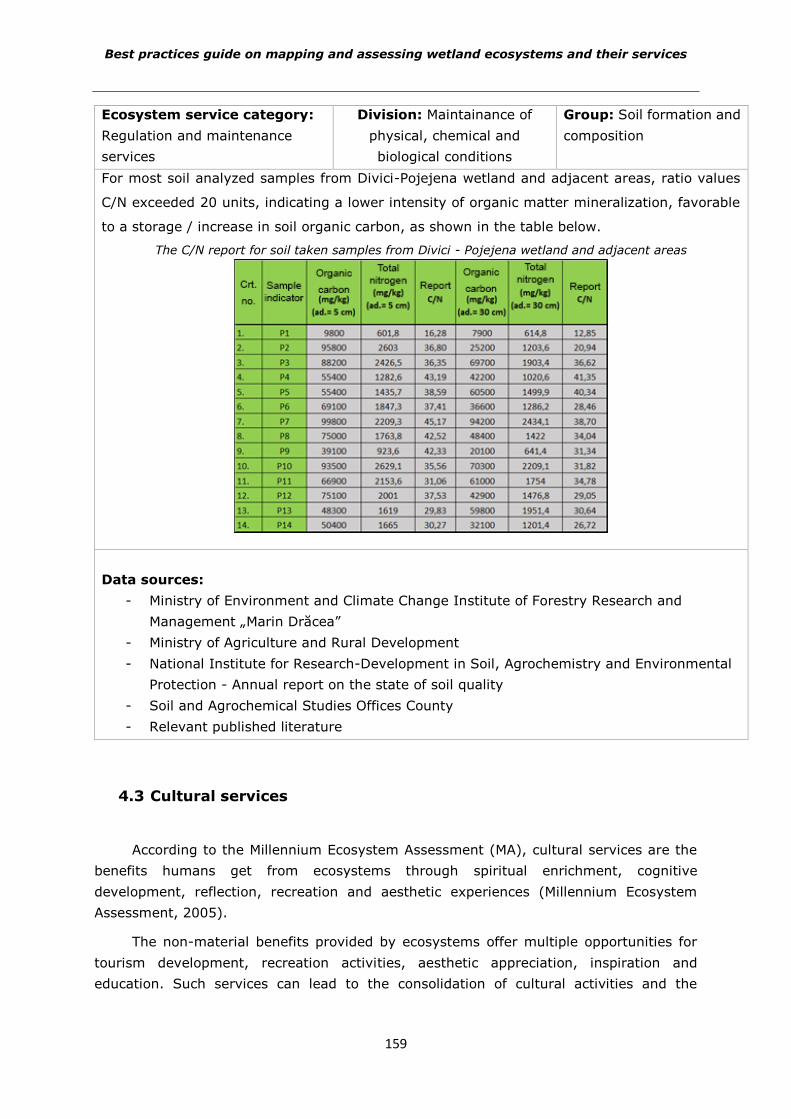
Best practices guide on mapping and assessing wetland ecosystems and their services
159
Ecosystem service category:
Regulation and maintenance
services
Division: Maintainance of
physical, chemical and
biological conditions
Group: Soil formation and
composition
For most soil analyzed samples from Divici-Pojejena wetland and adjacent areas, ratio values
C/N exceeded 20 units, indicating a lower intensity of organic matter mineralization, favorable
to a storage / increase in soil organic carbon, as shown in the table below.
The C/N report for soil taken samples from Divici - Pojejena wetland and adjacent areas
Data sources:
- Ministry of Environment and Climate Change Institute of Forestry Research and
Management „Marin Drăcea”
- Ministry of Agriculture and Rural Development
- National Institute for Research-Development in Soil, Agrochemistry and Environmental
Protection - Annual report on the state of soil quality
- Soil and Agrochemical Studies Offices County
- Relevant published literature
4.3 Cultural services
According to the Millennium Ecosystem Assessment (MA), cultural services are the
benefits humans get from ecosystems through spiritual enrichment, cognitive
development, reflection, recreation and aesthetic experiences (Millennium Ecosystem
Assessment, 2005).
The non-material benefits provided by ecosystems offer multiple opportunities for
tourism development, recreation activities, aesthetic appreciation, inspiration and
education. Such services can lead to the consolidation of cultural activities and the

Best practices guide on mapping and assessing wetland ecosystems and their services
160
enrichment of knowledge on social and natural sciences (e.g. biology, history, archeology,
etc.) (Millennium Ecosystem Assessment, 2005).
Assessment of cultural services depends on the characteristics of ecosystems and
how they are perceived by the population. The benefits people receive through cultural
services are closely related to their experiences during on-site visits and indirect
experiences (e.g. through watched films about nature). The evaluation of cultural services
requires an estimation of the number of people benefiting from them and the type of
interaction between person and the ecosystem (L. Hein et al., 2006).
Factors interested in cultural services may vary from individual scale to global scale.
For locals, an important cultural service is to improve the aesthetic, cultural, natural and
recreational qualities of their living environment. As the value of cultural services depends
on the cultural level of factors involved, different perceptions may arise regarding the use
of this type of service. Local stakeholders can pay particular attention to cultural heritage,
while at national or global level, they may have a special interest in nature conservation
and biodiversity (L. Hein et al., 2006).
Cultural services are not purely ecological phenomena, but are rather the result of
complex and dynamic relationships between ecosystems and humans, their economic
assessment being a subject of controversy over time (Plieninger et al., 2013).
According to the CICES classification (The Common Internațional Classification of
Ecosystem Services), cultural services include all the non-material benefits provided by
ecosystems and are divided into two major divisions:
• Physical and intellectual interactions with biota, ecosystems and
landscape
• Spiritual, symbolic and other interactions with biota, ecosystems and
the landscape (European Environment Agency, 2011).
In the following table are presented the divisions, groups and classes in which cultural
services are divided according to the CICES typology.
Table 4.44 Division, group, and cultural services classes
Division Group Class
Cultural Services
Physical and
intellectual
interactions with
biota, ecosystems
and landscape
Physical and
experimental
interactions
Experimental use of plants, animals and
landscapes under different
environmental conditions
Physical use of landscapes under
different environmental conditions
Interactive
and
representative
interactions
Scientific
Educational
Natural and cultural heritage
Recreation / leisure
Aesthetic
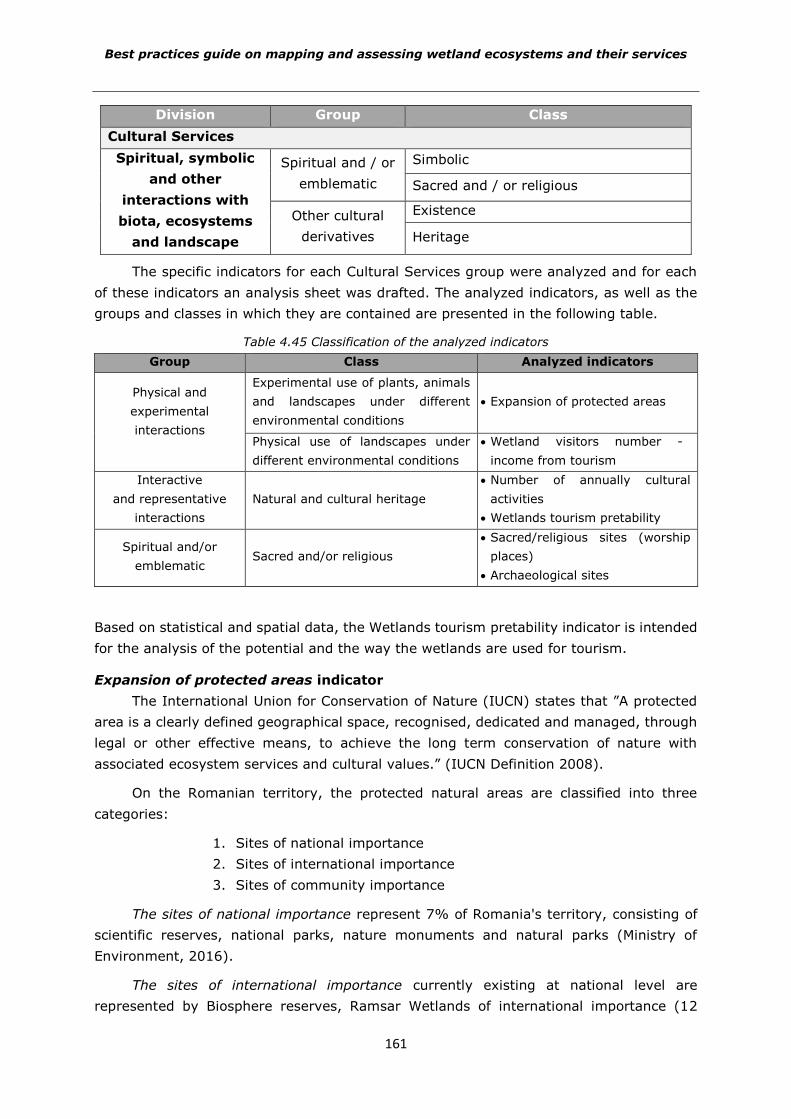
Best practices guide on mapping and assessing wetland ecosystems and their services
161
Division Group Class
Cultural Services
Spiritual, symbolic
and other
interactions with
biota, ecosystems
and landscape
Spiritual and / or
emblematic
Simbolic
Sacred and / or religious
Other cultural
derivatives
Existence
Heritage
The specific indicators for each Cultural Services group were analyzed and for each
of these indicators an analysis sheet was drafted. The analyzed indicators, as well as the
groups and classes in which they are contained are presented in the following table.
Table 4.45 Classification of the analyzed indicators
Group Class Analyzed indicators
Physical and
experimental
interactions
Experimental use of plants, animals
and landscapes under different
environmental conditions
Expansion of protected areas
Physical use of landscapes under
different environmental conditions
Wetland visitors number -
income from tourism
Interactive
and representative
interactions
Natural and cultural heritage
Number of annually cultural
activities
Wetlands tourism pretability
Spiritual and/or
emblematic Sacred and/or religious
Sacred/religious sites (worship
places)
Archaeological sites
Based on statistical and spatial data, the Wetlands tourism pretability indicator is intended
for the analysis of the potential and the way the wetlands are used for tourism.
Expansion of protected areas indicator
The International Union for Conservation of Nature (IUCN) states that ”A protected
area is a clearly defined geographical space, recognised, dedicated and managed, through
legal or other effective means, to achieve the long term conservation of nature with
associated ecosystem services and cultural values.” (IUCN Definition 2008).
On the Romanian territory, the protected natural areas are classified into three
categories:
1. Sites of national importance
2. Sites of international importance
3. Sites of community importance
The sites of national importance represent 7% of Romania's territory, consisting of
scientific reserves, national parks, nature monuments and natural parks (Ministry of
Environment, 2016).
The sites of international importance currently existing at national level are
represented by Biosphere reserves, Ramsar Wetlands of international importance (12
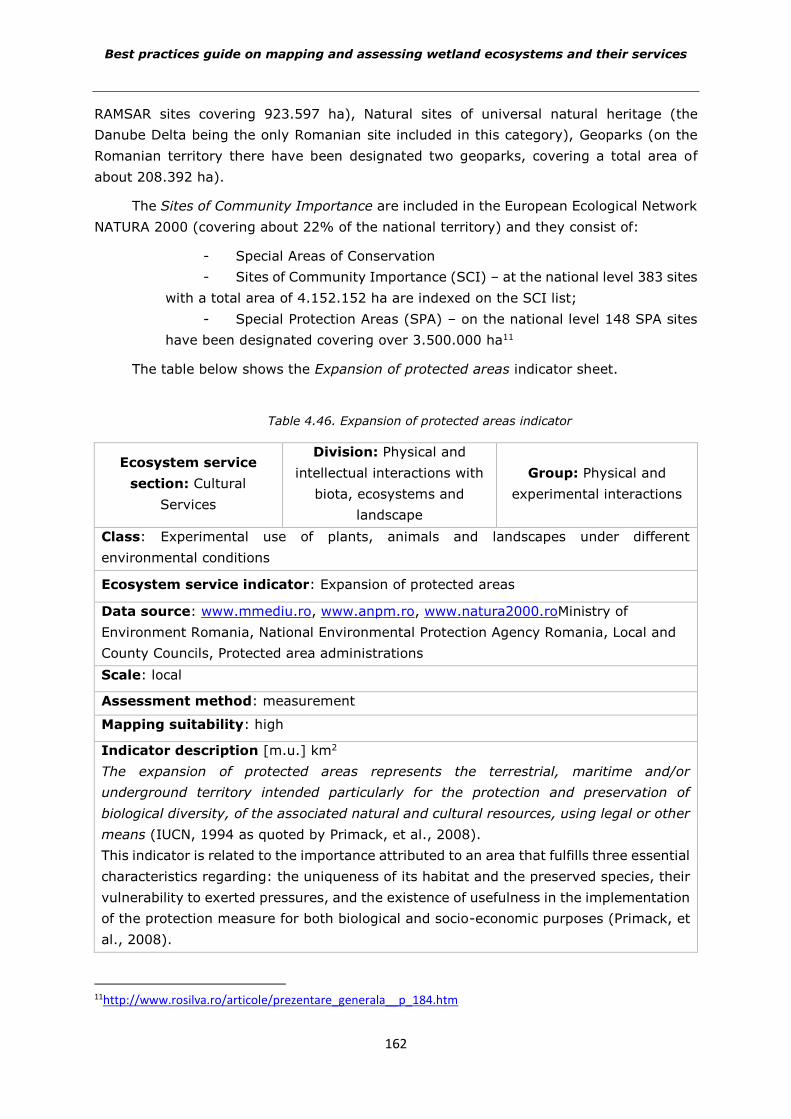
Best practices guide on mapping and assessing wetland ecosystems and their services
162
RAMSAR sites covering 923.597 ha), Natural sites of universal natural heritage (the
Danube Delta being the only Romanian site included in this category), Geoparks (on the
Romanian territory there have been designated two geoparks, covering a total area of
about 208.392 ha).
The Sites of Community Importance are included in the European Ecological Network
NATURA 2000 (covering about 22% of the national territory) and they consist of:
- Special Areas of Conservation
- Sites of Community Importance (SCI) – at the national level 383 sites
with a total area of 4.152.152 ha are indexed on the SCI list;
- Special Protection Areas (SPA) – on the national level 148 SPA sites
have been designated covering over 3.500.000 ha11
The table below shows the Expansion of protected areas indicator sheet.
Table 4.46. Expansion of protected areas indicator
Ecosystem service
section: Cultural
Services
Division: Physical and
intellectual interactions with
biota, ecosystems and
landscape
Group: Physical and
experimental interactions
Class: Experimental use of plants, animals and landscapes under different
environmental conditions
Ecosystem service indicator: Expansion of protected areas
Data source: www.mmediu.ro, www.anpm.ro, www.natura2000.roMinistry of
Environment Romania, National Environmental Protection Agency Romania, Local and
County Councils, Protected area administrations
Scale: local
Assessment method: measurement
Mapping suitability: high
Indicator description [m.u.] km2
The expansion of protected areas represents the terrestrial, maritime and/or
underground territory intended particularly for the protection and preservation of
biological diversity, of the associated natural and cultural resources, using legal or other
means (IUCN, 1994 as quoted by Primack, et al., 2008).
This indicator is related to the importance attributed to an area that fulfills three essential
characteristics regarding: the uniqueness of its habitat and the preserved species, their
vulnerability to exerted pressures, and the existence of usefulness in the implementation
of the protection measure for both biological and socio-economic purposes (Primack, et
al., 2008).
11http://www.rosilva.ro/articole/prezentare_generala__p_184.htm
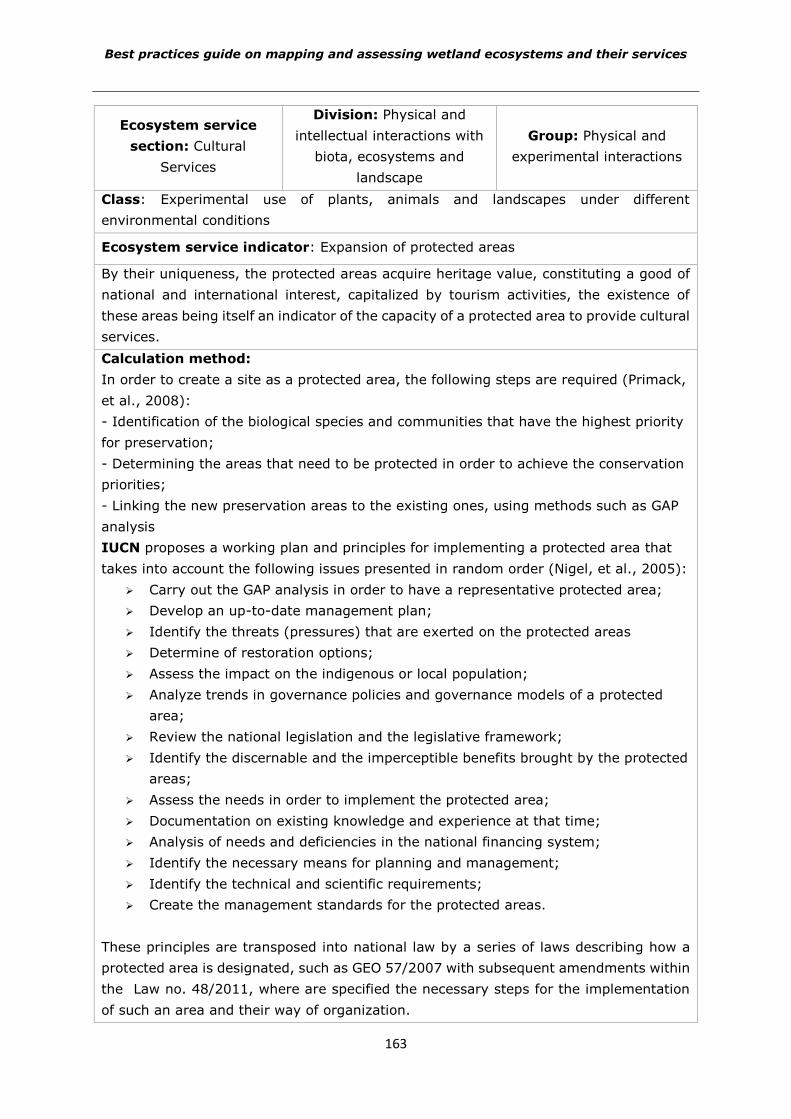
Best practices guide on mapping and assessing wetland ecosystems and their services
163
Ecosystem service
section: Cultural
Services
Division: Physical and
intellectual interactions with
biota, ecosystems and
landscape
Group: Physical and
experimental interactions
Class: Experimental use of plants, animals and landscapes under different
environmental conditions
Ecosystem service indicator: Expansion of protected areas
By their uniqueness, the protected areas acquire heritage value, constituting a good of
national and international interest, capitalized by tourism activities, the existence of
these areas being itself an indicator of the capacity of a protected area to provide cultural
services.
Calculation method:
In order to create a site as a protected area, the following steps are required (Primack,
et al., 2008):
- Identification of the biological species and communities that have the highest priority
for preservation;
- Determining the areas that need to be protected in order to achieve the conservation
priorities;
- Linking the new preservation areas to the existing ones, using methods such as GAP
analysis
IUCN proposes a working plan and principles for implementing a protected area that
takes into account the following issues presented in random order (Nigel, et al., 2005):
Carry out the GAP analysis in order to have a representative protected area;
Develop an up-to-date management plan;
Identify the threats (pressures) that are exerted on the protected areas
Determine of restoration options;
Assess the impact on the indigenous or local population;
Analyze trends in governance policies and governance models of a protected
area;
Review the national legislation and the legislative framework;
Identify the discernable and the imperceptible benefits brought by the protected
areas;
Assess the needs in order to implement the protected area;
Documentation on existing knowledge and experience at that time;
Analysis of needs and deficiencies in the national financing system;
Identify the necessary means for planning and management;
Identify the technical and scientific requirements;
Create the management standards for the protected areas.
These principles are transposed into national law by a series of laws describing how a
protected area is designated, such as GEO 57/2007 with subsequent amendments within
the Law no. 48/2011, where are specified the necessary steps for the implementation
of such an area and their way of organization.
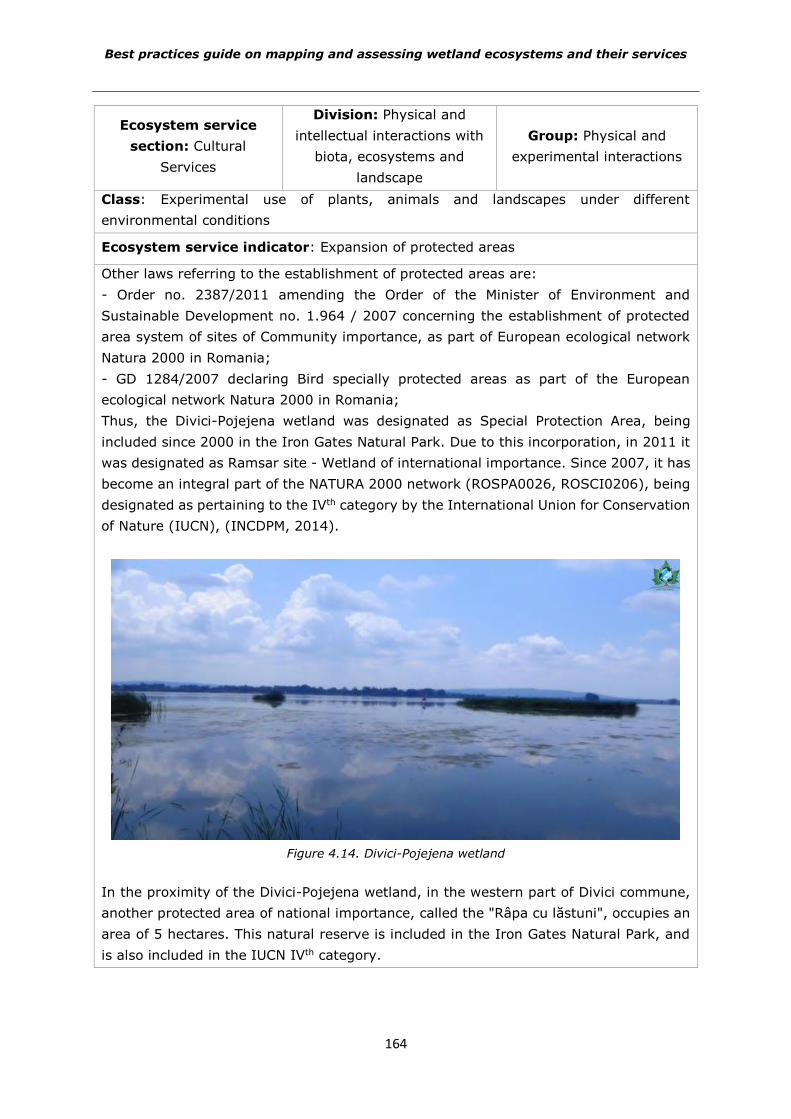
Best practices guide on mapping and assessing wetland ecosystems and their services
164
Ecosystem service
section: Cultural
Services
Division: Physical and
intellectual interactions with
biota, ecosystems and
landscape
Group: Physical and
experimental interactions
Class: Experimental use of plants, animals and landscapes under different
environmental conditions
Ecosystem service indicator: Expansion of protected areas
Other laws referring to the establishment of protected areas are:
- Order no. 2387/2011 amending the Order of the Minister of Environment and
Sustainable Development no. 1.964 / 2007 concerning the establishment of protected
area system of sites of Community importance, as part of European ecological network
Natura 2000 in Romania;
- GD 1284/2007 declaring Bird specially protected areas as part of the European
ecological network Natura 2000 in Romania;
Thus, the Divici-Pojejena wetland was designated as Special Protection Area, being
included since 2000 in the Iron Gates Natural Park. Due to this incorporation, in 2011 it
was designated as Ramsar site - Wetland of international importance. Since 2007, it has
become an integral part of the NATURA 2000 network (ROSPA0026, ROSCI0206), being
designated as pertaining to the IVth category by the International Union for Conservation
of Nature (IUCN), (INCDPM, 2014).
Figure 4.14. Divici-Pojejena wetland
In the proximity of the Divici-Pojejena wetland, in the western part of Divici commune,
another protected area of national importance, called the "Râpa cu lăstuni", occupies an
area of 5 hectares. This natural reserve is included in the Iron Gates Natural Park, and
is also included in the IUCN IVth category.
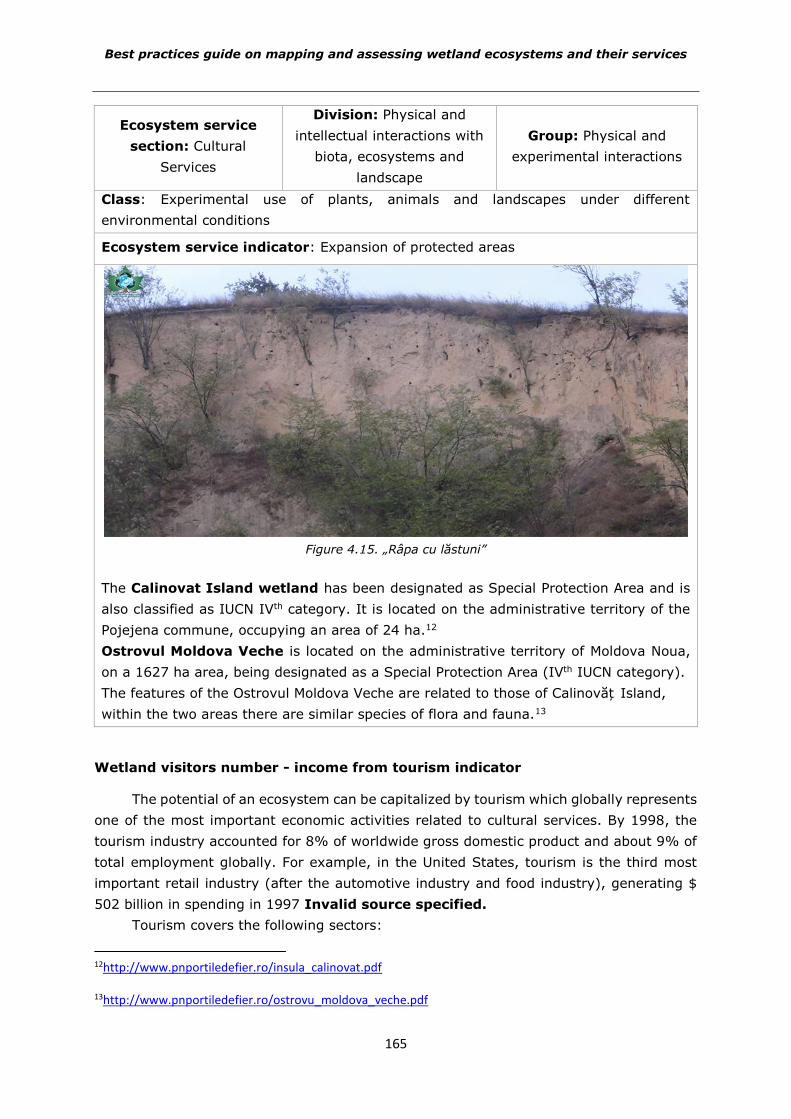
Best practices guide on mapping and assessing wetland ecosystems and their services
165
Ecosystem service
section: Cultural
Services
Division: Physical and
intellectual interactions with
biota, ecosystems and
landscape
Group: Physical and
experimental interactions
Class: Experimental use of plants, animals and landscapes under different
environmental conditions
Ecosystem service indicator: Expansion of protected areas
Figure 4.15. „Râpa cu lăstuni”
The Calinovat Island wetland has been designated as Special Protection Area and is
also classified as IUCN IVth category. It is located on the administrative territory of the
Pojejena commune, occupying an area of 24 ha.12
Ostrovul Moldova Veche is located on the administrative territory of Moldova Noua,
on a 1627 ha area, being designated as a Special Protection Area (IVth IUCN category).
The features of the Ostrovul Moldova Veche are related to those of Calinovăț Island,
within the two areas there are similar species of flora and fauna.13
Wetland visitors number - income from tourism indicator
The potential of an ecosystem can be capitalized by tourism which globally represents
one of the most important economic activities related to cultural services. By 1998, the
tourism industry accounted for 8% of worldwide gross domestic product and about 9% of
total employment globally. For example, in the United States, tourism is the third most
important retail industry (after the automotive industry and food industry), generating $
502 billion in spending in 1997 Invalid source specified.
Tourism covers the following sectors:
12http://www.pnportiledefier.ro/insula_calinovat.pdf
13http://www.pnportiledefier.ro/ostrovu_moldova_veche.pdf
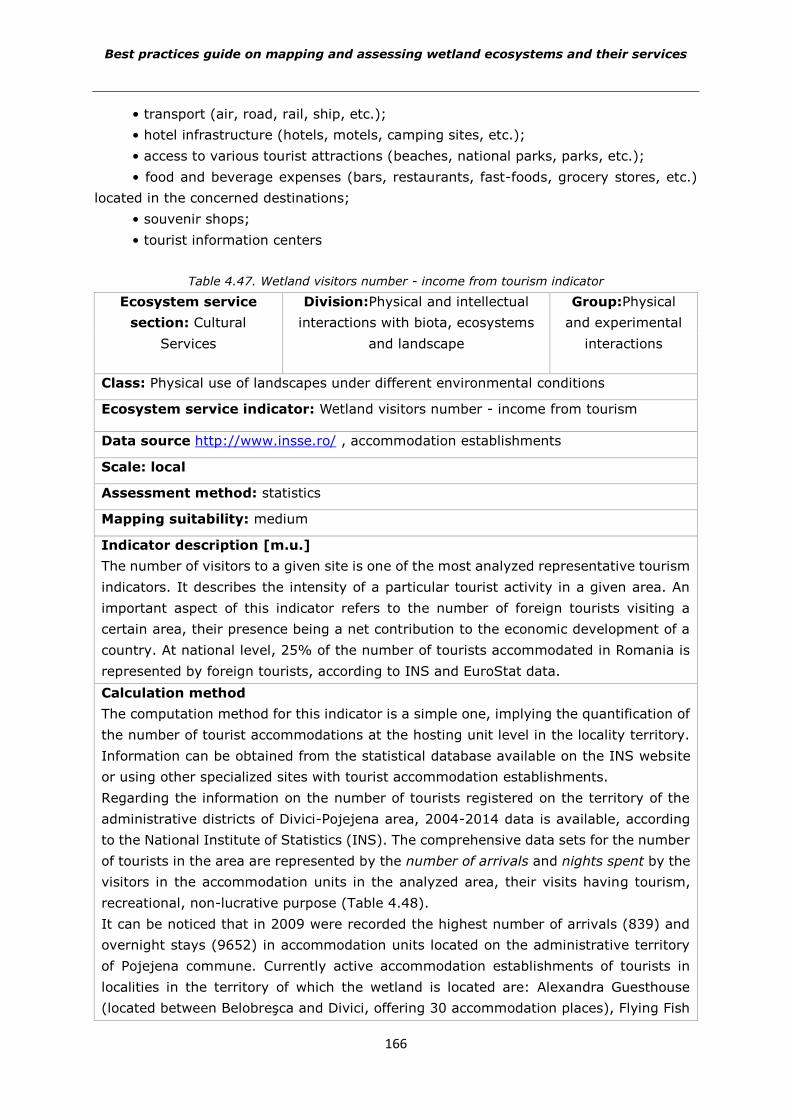
Best practices guide on mapping and assessing wetland ecosystems and their services
166
• transport (air, road, rail, ship, etc.);
• hotel infrastructure (hotels, motels, camping sites, etc.);
• access to various tourist attractions (beaches, national parks, parks, etc.);
• food and beverage expenses (bars, restaurants, fast-foods, grocery stores, etc.)
located in the concerned destinations;
• souvenir shops;
• tourist information centers
Table 4.47. Wetland visitors number - income from tourism indicator
Ecosystem service
section: Cultural
Services
Division:Physical and intellectual
interactions with biota, ecosystems
and landscape
Group:Physical
and experimental
interactions
Class: Physical use of landscapes under different environmental conditions
Ecosystem service indicator: Wetland visitors number - income from tourism
Data source http://www.insse.ro/ , accommodation establishments
Scale: local
Assessment method: statistics
Mapping suitability: medium
Indicator description [m.u.]
The number of visitors to a given site is one of the most analyzed representative tourism
indicators. It describes the intensity of a particular tourist activity in a given area. An
important aspect of this indicator refers to the number of foreign tourists visiting a
certain area, their presence being a net contribution to the economic development of a
country. At national level, 25% of the number of tourists accommodated in Romania is
represented by foreign tourists, according to INS and EuroStat data.
Calculation method
The computation method for this indicator is a simple one, implying the quantification of
the number of tourist accommodations at the hosting unit level in the locality territory.
Information can be obtained from the statistical database available on the INS website
or using other specialized sites with tourist accommodation establishments.
Regarding the information on the number of tourists registered on the territory of the
administrative districts of Divici-Pojejena area, 2004-2014 data is available, according
to the National Institute of Statistics (INS). The comprehensive data sets for the number
of tourists in the area are represented by the number of arrivals and nights spent by the
visitors in the accommodation units in the analyzed area, their visits having tourism,
recreational, non-lucrative purpose (Table 4.48).
It can be noticed that in 2009 were recorded the highest number of arrivals (839) and
overnight stays (9652) in accommodation units located on the administrative territory
of Pojejena commune. Currently active accommodation establishments of tourists in
localities in the territory of which the wetland is located are: Alexandra Guesthouse
(located between Belobreşca and Divici, offering 30 accommodation places), Flying Fish
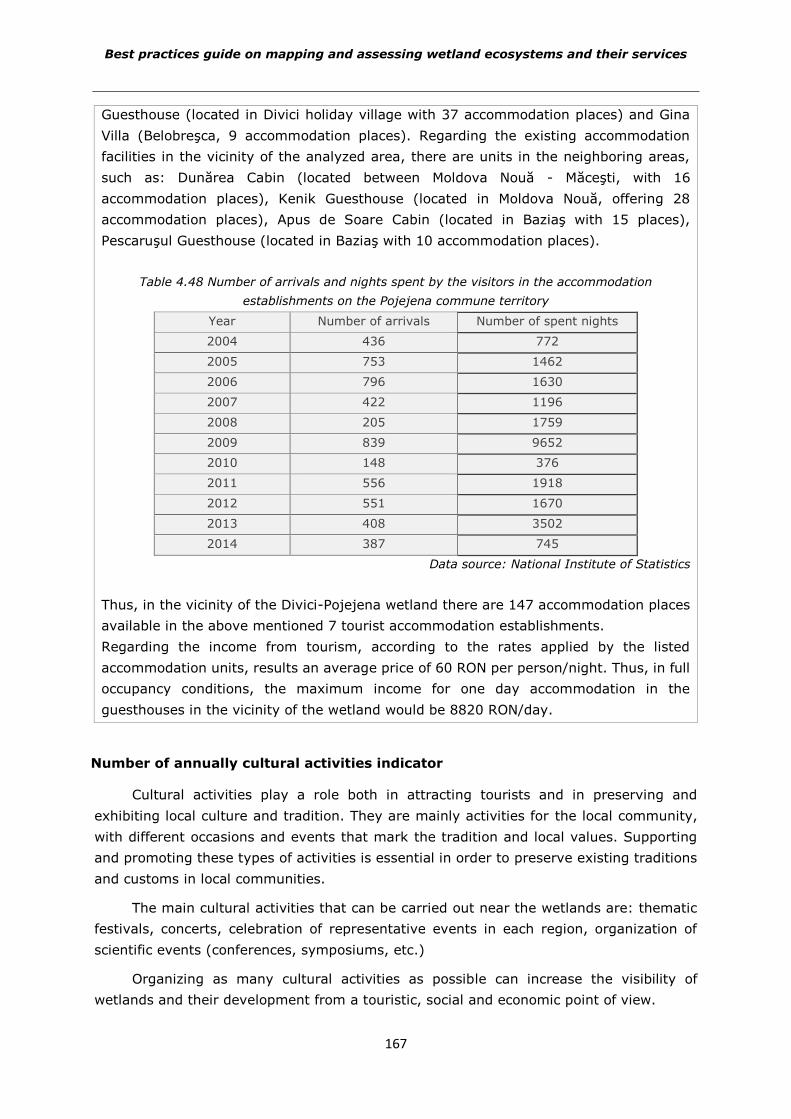
Best practices guide on mapping and assessing wetland ecosystems and their services
167
Guesthouse (located in Divici holiday village with 37 accommodation places) and Gina
Villa (Belobreşca, 9 accommodation places). Regarding the existing accommodation
facilities in the vicinity of the analyzed area, there are units in the neighboring areas,
such as: Dunărea Cabin (located between Moldova Nouă - Măceşti, with 16
accommodation places), Kenik Guesthouse (located in Moldova Nouă, offering 28
accommodation places), Apus de Soare Cabin (located in Baziaş with 15 places),
Pescaruşul Guesthouse (located in Baziaş with 10 accommodation places).
Table 4.48 Number of arrivals and nights spent by the visitors in the accommodation
establishments on the Pojejena commune territory
Year Number of arrivals Number of spent nights
2004 436 772
2005 753 1462
2006 796 1630
2007 422 1196
2008 205 1759
2009 839 9652
2010 148 376
2011 556 1918
2012 551 1670
2013 408 3502
2014 387 745
Data source: National Institute of Statistics
Thus, in the vicinity of the Divici-Pojejena wetland there are 147 accommodation places
available in the above mentioned 7 tourist accommodation establishments.
Regarding the income from tourism, according to the rates applied by the listed
accommodation units, results an average price of 60 RON per person/night. Thus, in full
occupancy conditions, the maximum income for one day accommodation in the
guesthouses in the vicinity of the wetland would be 8820 RON/day.
Number of annually cultural activities indicator
Cultural activities play a role both in attracting tourists and in preserving and
exhibiting local culture and tradition. They are mainly activities for the local community,
with different occasions and events that mark the tradition and local values. Supporting
and promoting these types of activities is essential in order to preserve existing traditions
and customs in local communities.
The main cultural activities that can be carried out near the wetlands are: thematic
festivals, concerts, celebration of representative events in each region, organization of
scientific events (conferences, symposiums, etc.)
Organizing as many cultural activities as possible can increase the visibility of
wetlands and their development from a touristic, social and economic point of view.
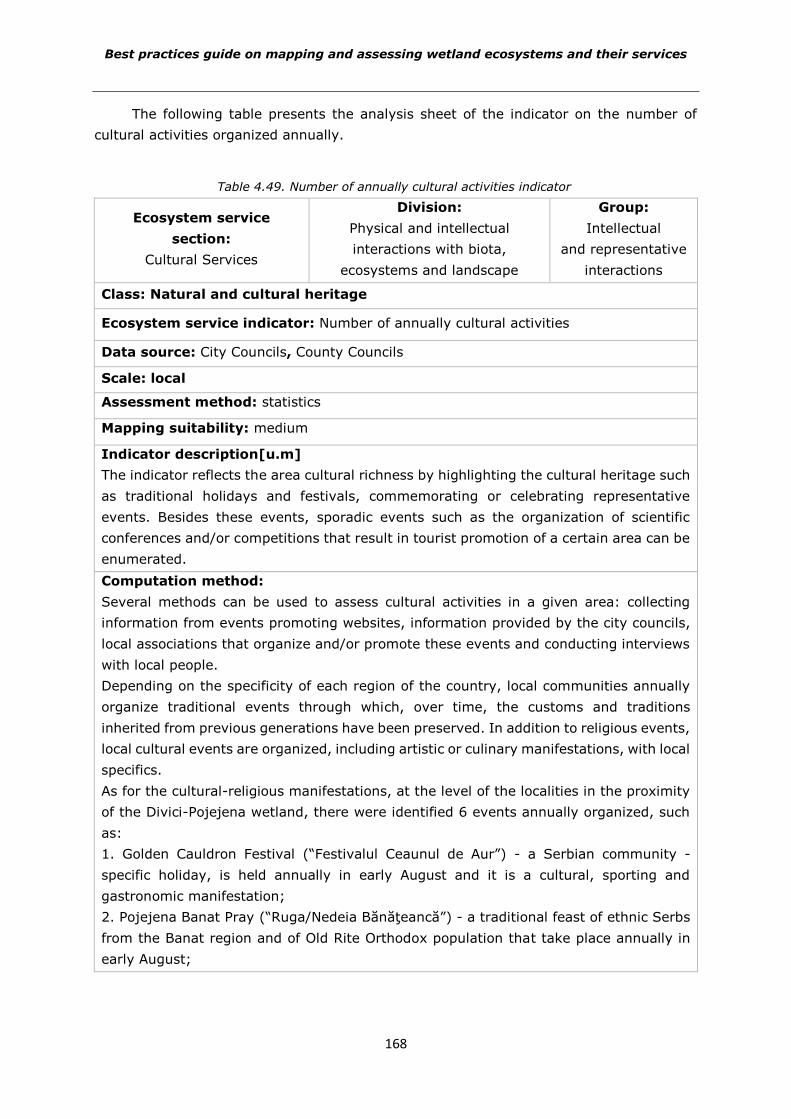
Best practices guide on mapping and assessing wetland ecosystems and their services
168
The following table presents the analysis sheet of the indicator on the number of
cultural activities organized annually.
Table 4.49. Number of annually cultural activities indicator
Ecosystem service
section:
Cultural Services
Division:
Physical and intellectual
interactions with biota,
ecosystems and landscape
Group:
Intellectual
and representative
interactions
Class: Natural and cultural heritage
Ecosystem service indicator: Number of annually cultural activities
Data source: City Councils, County Councils
Scale: local
Assessment method: statistics
Mapping suitability: medium
Indicator description[u.m]
The indicator reflects the area cultural richness by highlighting the cultural heritage such
as traditional holidays and festivals, commemorating or celebrating representative
events. Besides these events, sporadic events such as the organization of scientific
conferences and/or competitions that result in tourist promotion of a certain area can be
enumerated.
Computation method:
Several methods can be used to assess cultural activities in a given area: collecting
information from events promoting websites, information provided by the city councils,
local associations that organize and/or promote these events and conducting interviews
with local people.
Depending on the specificity of each region of the country, local communities annually
organize traditional events through which, over time, the customs and traditions
inherited from previous generations have been preserved. In addition to religious events,
local cultural events are organized, including artistic or culinary manifestations, with local
specifics.
As for the cultural-religious manifestations, at the level of the localities in the proximity
of the Divici-Pojejena wetland, there were identified 6 events annually organized, such
as:
1. Golden Cauldron Festival (“Festivalul Ceaunul de Aur”) - a Serbian community -
specific holiday, is held annually in early August and it is a cultural, sporting and
gastronomic manifestation;
2. Pojejena Banat Pray (“Ruga/Nedeia Bănăţeancă”) - a traditional feast of ethnic Serbs
from the Banat region and of Old Rite Orthodox population that take place annually in
early August;
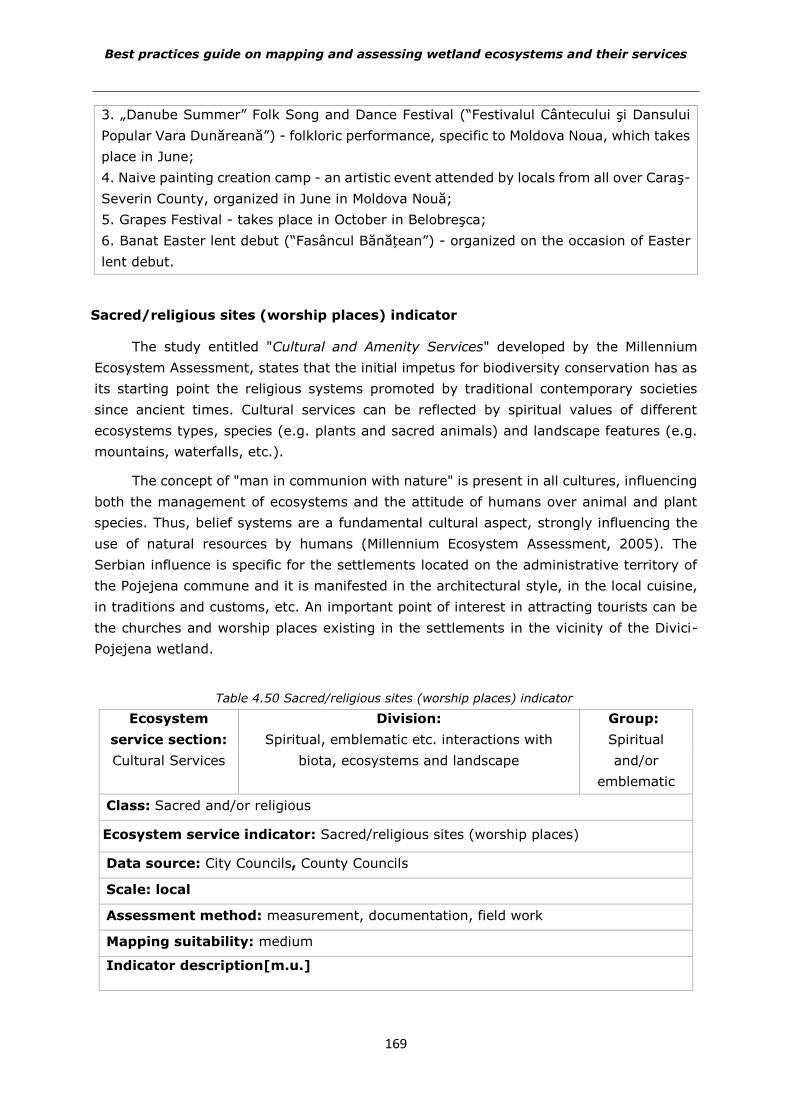
Best practices guide on mapping and assessing wetland ecosystems and their services
169
3. „Danube Summer” Folk Song and Dance Festival (“Festivalul Cântecului şi Dansului
Popular Vara Dunăreană”) - folkloric performance, specific to Moldova Noua, which takes
place in June;
4. Naive painting creation camp - an artistic event attended by locals from all over Caraş-
Severin County, organized in June in Moldova Nouă;
5. Grapes Festival - takes place in October in Belobreşca;
6. Banat Easter lent debut (“Fasâncul Bănățean”) - organized on the occasion of Easter
lent debut.
Sacred/religious sites (worship places) indicator
The study entitled "Cultural and Amenity Services" developed by the Millennium
Ecosystem Assessment, states that the initial impetus for biodiversity conservation has as
its starting point the religious systems promoted by traditional contemporary societies
since ancient times. Cultural services can be reflected by spiritual values of different
ecosystems types, species (e.g. plants and sacred animals) and landscape features (e.g.
mountains, waterfalls, etc.).
The concept of "man in communion with nature" is present in all cultures, influencing
both the management of ecosystems and the attitude of humans over animal and plant
species. Thus, belief systems are a fundamental cultural aspect, strongly influencing the
use of natural resources by humans (Millennium Ecosystem Assessment, 2005). The
Serbian influence is specific for the settlements located on the administrative territory of
the Pojejena commune and it is manifested in the architectural style, in the local cuisine,
in traditions and customs, etc. An important point of interest in attracting tourists can be
the churches and worship places existing in the settlements in the vicinity of the Divici-
Pojejena wetland.
Table 4.50 Sacred/religious sites (worship places) indicator
Ecosystem
service section:
Cultural Services
Division:
Spiritual, emblematic etc. interactions with
biota, ecosystems and landscape
Group:
Spiritual
and/or
emblematic
Class: Sacred and/or religious
Ecosystem service indicator: Sacred/religious sites (worship places)
Data source: City Councils, County Councils
Scale: local
Assessment method: measurement, documentation, field work
Mapping suitability: medium
Indicator description[m.u.]
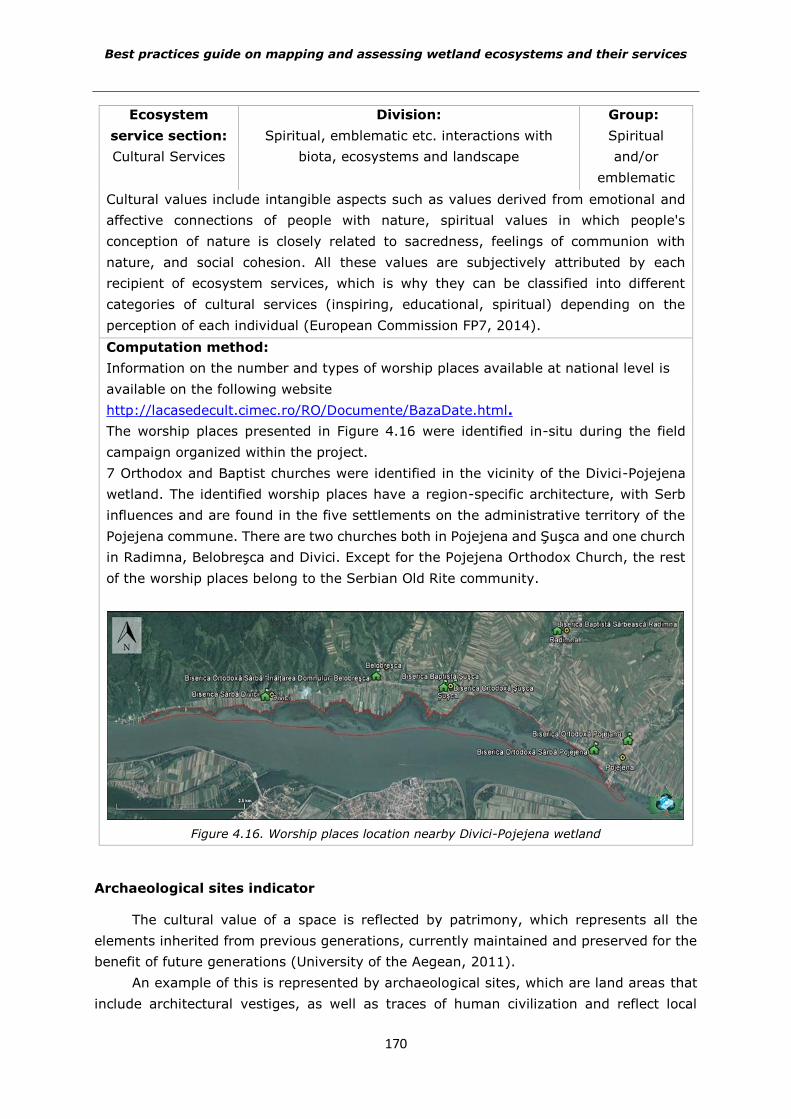
Best practices guide on mapping and assessing wetland ecosystems and their services
170
Ecosystem
service section:
Cultural Services
Division:
Spiritual, emblematic etc. interactions with
biota, ecosystems and landscape
Group:
Spiritual
and/or
emblematic
Cultural values include intangible aspects such as values derived from emotional and
affective connections of people with nature, spiritual values in which people's
conception of nature is closely related to sacredness, feelings of communion with
nature, and social cohesion. All these values are subjectively attributed by each
recipient of ecosystem services, which is why they can be classified into different
categories of cultural services (inspiring, educational, spiritual) depending on the
perception of each individual (European Commission FP7, 2014).
Computation method:
Information on the number and types of worship places available at national level is
available on the following website
http://lacasedecult.cimec.ro/RO/Documente/BazaDate.html.
The worship places presented in Figure 4.16 were identified in-situ during the field
campaign organized within the project.
7 Orthodox and Baptist churches were identified in the vicinity of the Divici-Pojejena
wetland. The identified worship places have a region-specific architecture, with Serb
influences and are found in the five settlements on the administrative territory of the
Pojejena commune. There are two churches both in Pojejena and Şuşca and one church
in Radimna, Belobreşca and Divici. Except for the Pojejena Orthodox Church, the rest
of the worship places belong to the Serbian Old Rite community.
Figure 4.16. Worship places location nearby Divici-Pojejena wetland
Archaeological sites indicator
The cultural value of a space is reflected by patrimony, which represents all the
elements inherited from previous generations, currently maintained and preserved for the
benefit of future generations (University of the Aegean, 2011).
An example of this is represented by archaeological sites, which are land areas that
include architectural vestiges, as well as traces of human civilization and reflect local
Best practices guide on mapping and assessing wetland ecosystems and their services
171
cultures. These sites are of particular historic importance and can be used as tourist
attraction means by organizing campaigns to promote them locally or nationally.
In the following table, the Archeological sites indicator sheet is presented, describing
the main sites identified near the Divici-Pojejena wetland.
Table 4.51 Archaeological sites indicator
Ecosystem service
section:
Cultural Services
Division:
Physical and intellectual
interactions with biota,
ecosystems and landscape
Group:
Intellectual
and representative
interactions
Class: Sacred and/or religious
Ecosystem service indicator: Archaeological sites
Data source: Public authorities, NGOs, Custodians or administrators of protected
areas, local population, tour operators
Scale: local
Assessment method: documentation, field studies
Mapping suitability: medium
Indicator description [u.m.]:
This indicator refers to the presence of sites of archaeological heritage value in a
given area.
Computation method:
The archaeological sites were inventoried on the basis of questionnaires applied to local
population, local authorities and tour operators.
The attraction of a tourist area consists of existing landscapes and recreational activities
that can be carried out within that area. Based on the questionnaires applied to the
tourists present in the Divici-Pojejena wetland, it has emerged the fact that the main
recreational activities they prefer to carry out are hiking and nature visits, considering
this area of particular importance to them.
From the heritage-historical point of view, 5 archaeological sites were identified in the
area, such as:
1. The "Grad" fortification of Divici - is located in the Danube Gorge, between river km
1065-1066 and occupies an area of 7000 m2.
2. The Roman castrum camp at Pojejena (figure 4.17) located on the plateau behind
the Orthodox Church in Pojejena, dating back to the 2nd century AD.
3. The Poreca Point, located 1 km west of Divici to Baziaş - shows traces of Neolithic
settlements.
4. The Cusatac point, located in Divici – Hallstatt ceramics and slag were discovered
within this site.
5. The Potoc Point, located to the east by Divici - within this site was discovered pottery
belonging to the Bronze and Iron Age.
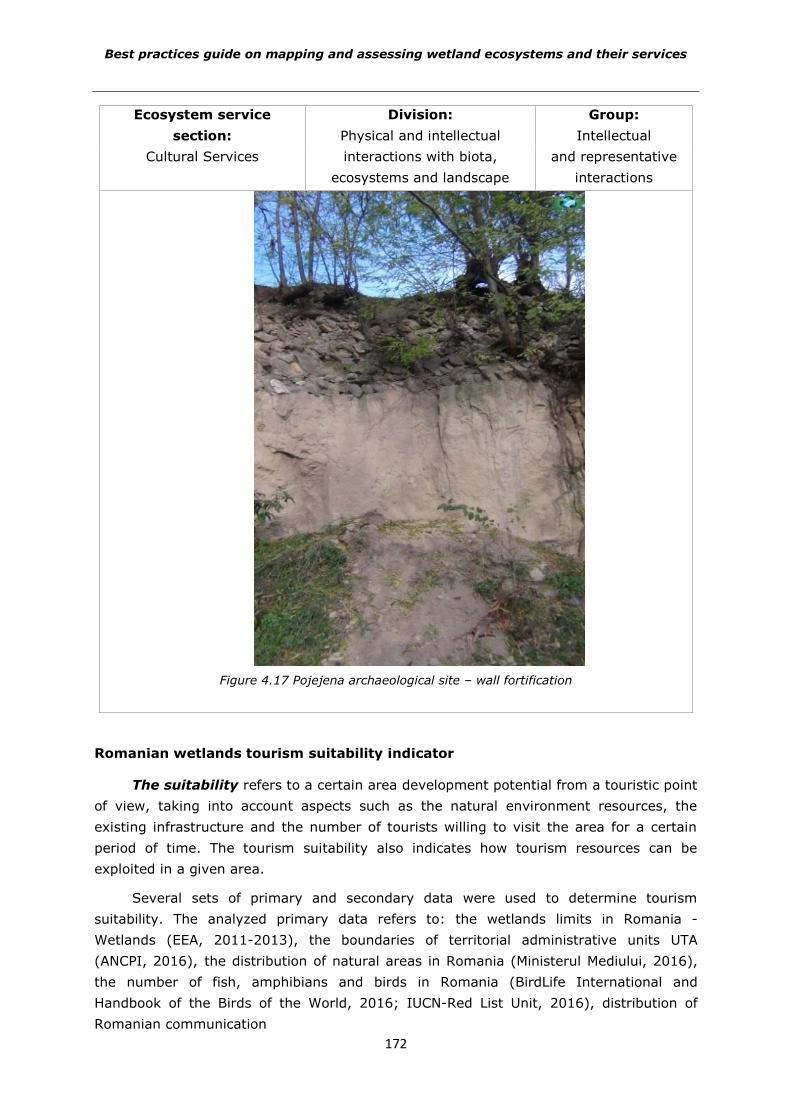
Best practices guide on mapping and assessing wetland ecosystems and their services
172
Ecosystem service
section:
Cultural Services
Division:
Physical and intellectual
interactions with biota,
ecosystems and landscape
Group:
Intellectual
and representative
interactions
Figure 4.17 Pojejena archaeological site – wall fortification
Romanian wetlands tourism suitability indicator
The suitability refers to a certain area development potential from a touristic point
of view, taking into account aspects such as the natural environment resources, the
existing infrastructure and the number of tourists willing to visit the area for a certain
period of time. The tourism suitability also indicates how tourism resources can be
exploited in a given area.
Several sets of primary and secondary data were used to determine tourism
suitability. The analyzed primary data refers to: the wetlands limits in Romania -
Wetlands (EEA, 2011-2013), the boundaries of territorial administrative units UTA (ANCPI, 2016), the distribution of natural areas in Romania (Ministerul Mediului, 2016),
the number of fish, amphibians and birds in Romania (BirdLife International and
Handbook of the Birds of the World, 2016; IUCN-Red List Unit, 2016), distribution of
Romanian communication
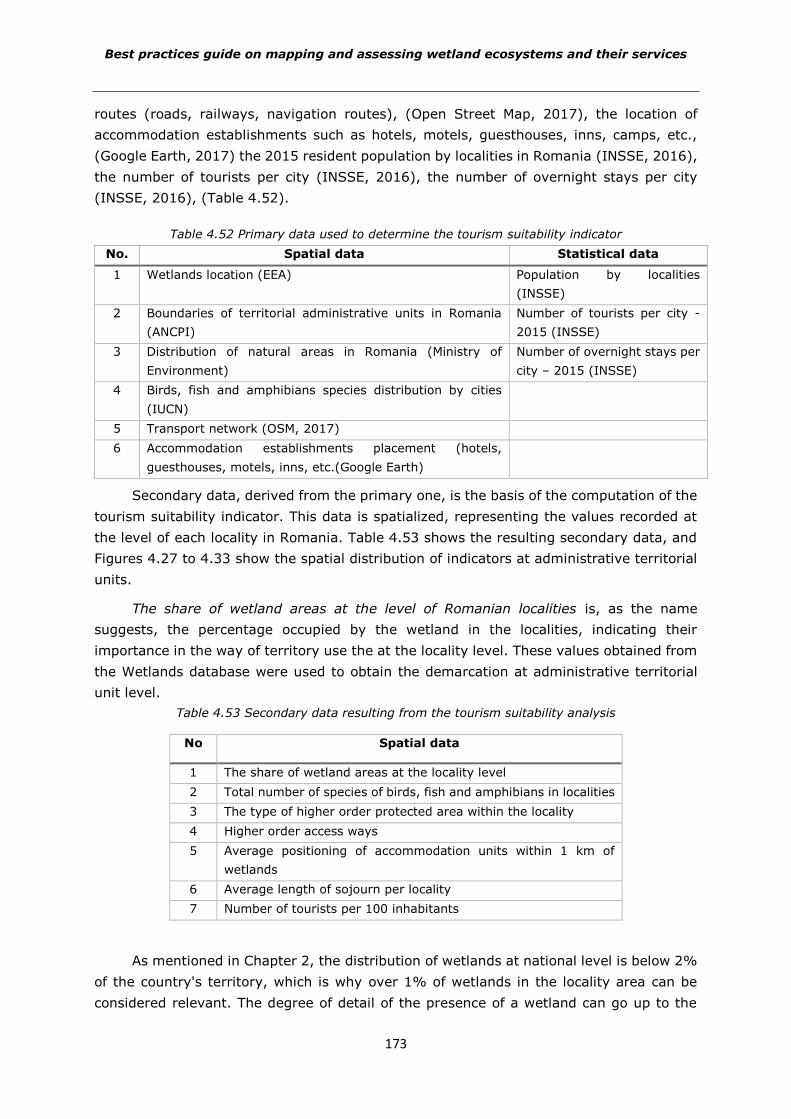
Best practices guide on mapping and assessing wetland ecosystems and their services
173
routes (roads, railways, navigation routes), (Open Street Map, 2017), the location of
accommodation establishments such as hotels, motels, guesthouses, inns, camps, etc.,
(Google Earth, 2017) the 2015 resident population by localities in Romania (INSSE, 2016),
the number of tourists per city (INSSE, 2016), the number of overnight stays per city
(INSSE, 2016), (Table 4.52).
Table 4.52 Primary data used to determine the tourism suitability indicator
No. Spatial data Statistical data
1 Wetlands location (EEA) Population by localities
(INSSE)
2 Boundaries of territorial administrative units in Romania
(ANCPI)
Number of tourists per city -
2015 (INSSE)
3 Distribution of natural areas in Romania (Ministry of
Environment)
Number of overnight stays per
city – 2015 (INSSE)
4 Birds, fish and amphibians species distribution by cities
(IUCN)
5 Transport network (OSM, 2017)
6 Accommodation establishments placement (hotels,
guesthouses, motels, inns, etc.(Google Earth)
Secondary data, derived from the primary one, is the basis of the computation of the
tourism suitability indicator. This data is spatialized, representing the values recorded at
the level of each locality in Romania. Table 4.53 shows the resulting secondary data, and
Figures 4.27 to 4.33 show the spatial distribution of indicators at administrative territorial
units.
The share of wetland areas at the level of Romanian localities is, as the name
suggests, the percentage occupied by the wetland in the localities, indicating their
importance in the way of territory use the at the locality level. These values obtained from
the Wetlands database were used to obtain the demarcation at administrative territorial
unit level.
Table 4.53 Secondary data resulting from the tourism suitability analysis
No Spatial data
1 The share of wetland areas at the locality level
2 Total number of species of birds, fish and amphibians in localities
3 The type of higher order protected area within the locality
4 Higher order access ways
5 Average positioning of accommodation units within 1 km of
wetlands
6 Average length of sojourn per locality
7 Number of tourists per 100 inhabitants
As mentioned in Chapter 2, the distribution of wetlands at national level is below 2%
of the country's territory, which is why over 1% of wetlands in the locality area can be
considered relevant. The degree of detail of the presence of a wetland can go up to the
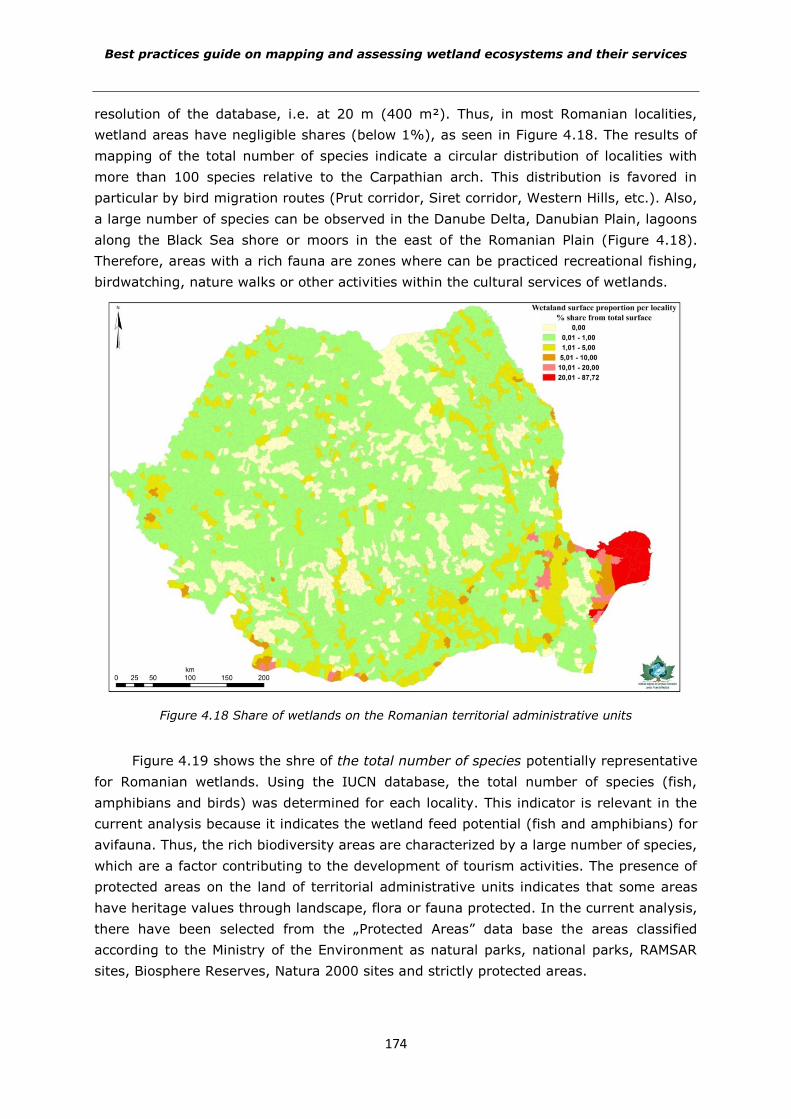
Best practices guide on mapping and assessing wetland ecosystems and their services
174
resolution of the database, i.e. at 20 m (400 m²). Thus, in most Romanian localities,
wetland areas have negligible shares (below 1%), as seen in Figure 4.18. The results of
mapping of the total number of species indicate a circular distribution of localities with
more than 100 species relative to the Carpathian arch. This distribution is favored in
particular by bird migration routes (Prut corridor, Siret corridor, Western Hills, etc.). Also,
a large number of species can be observed in the Danube Delta, Danubian Plain, lagoons
along the Black Sea shore or moors in the east of the Romanian Plain (Figure 4.18).
Therefore, areas with a rich fauna are zones where can be practiced recreational fishing,
birdwatching, nature walks or other activities within the cultural services of wetlands.
Figure 4.18 Share of wetlands on the Romanian territorial administrative units
Figure 4.19 shows the shre of the total number of species potentially representative
for Romanian wetlands. Using the IUCN database, the total number of species (fish,
amphibians and birds) was determined for each locality. This indicator is relevant in the
current analysis because it indicates the wetland feed potential (fish and amphibians) for
avifauna. Thus, the rich biodiversity areas are characterized by a large number of species,
which are a factor contributing to the development of tourism activities. The presence of
protected areas on the land of territorial administrative units indicates that some areas
have heritage values through landscape, flora or fauna protected. In the current analysis,
there have been selected from the „Protected Areas” data base the areas classified
according to the Ministry of the Environment as natural parks, national parks, RAMSAR
sites, Biosphere Reserves, Natura 2000 sites and strictly protected areas.
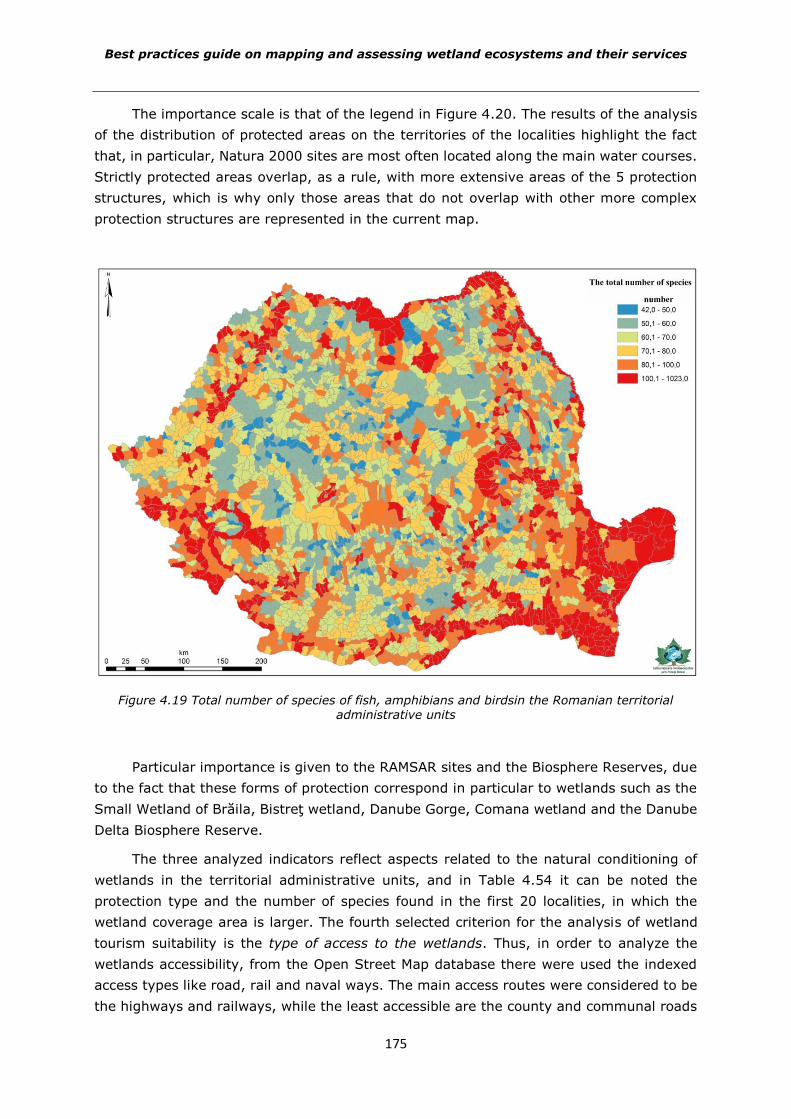
Best practices guide on mapping and assessing wetland ecosystems and their services
175
The importance scale is that of the legend in Figure 4.20. The results of the analysis
of the distribution of protected areas on the territories of the localities highlight the fact
that, in particular, Natura 2000 sites are most often located along the main water courses.
Strictly protected areas overlap, as a rule, with more extensive areas of the 5 protection
structures, which is why only those areas that do not overlap with other more complex
protection structures are represented in the current map.
Figure 4.19 Total number of species of fish, amphibians and birdsin the Romanian territorial administrative units
Particular importance is given to the RAMSAR sites and the Biosphere Reserves, due
to the fact that these forms of protection correspond in particular to wetlands such as the
Small Wetland of Brăila, Bistreţ wetland, Danube Gorge, Comana wetland and the Danube
Delta Biosphere Reserve.
The three analyzed indicators reflect aspects related to the natural conditioning of
wetlands in the territorial administrative units, and in Table 4.54 it can be noted the
protection type and the number of species found in the first 20 localities, in which the
wetland coverage area is larger. The fourth selected criterion for the analysis of wetland
tourism suitability is the type of access to the wetlands. Thus, in order to analyze the
wetlands accessibility, from the Open Street Map database there were used the indexed
access types like road, rail and naval ways. The main access routes were considered to be
the highways and railways, while the least accessible are the county and communal roads
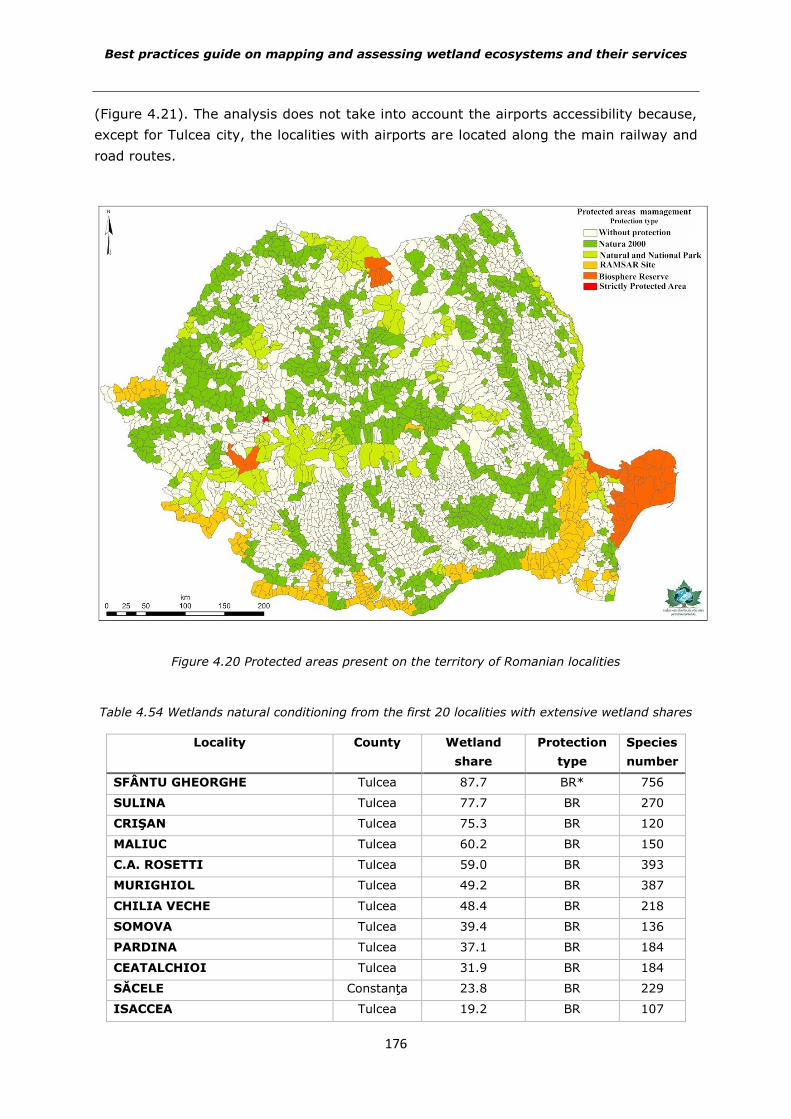
Best practices guide on mapping and assessing wetland ecosystems and their services
176
(Figure 4.21). The analysis does not take into account the airports accessibility because,
except for Tulcea city, the localities with airports are located along the main railway and
road routes.
Figure 4.20 Protected areas present on the territory of Romanian localities
Table 4.54 Wetlands natural conditioning from the first 20 localities with extensive wetland shares
Locality County Wetland
share
Protection
type
Species
number
SFÂNTU GHEORGHE Tulcea 87.7 BR* 756
SULINA Tulcea 77.7 BR 270
CRIŞAN Tulcea 75.3 BR 120
MALIUC Tulcea 60.2 BR 150
C.A. ROSETTI Tulcea 59.0 BR 393
MURIGHIOL Tulcea 49.2 BR 387
CHILIA VECHE Tulcea 48.4 BR 218
SOMOVA Tulcea 39.4 BR 136
PARDINA Tulcea 37.1 BR 184
CEATALCHIOI Tulcea 31.9 BR 184
SĂCELE Constanţa 23.8 BR 229
ISACCEA Tulcea 19.2 BR 107
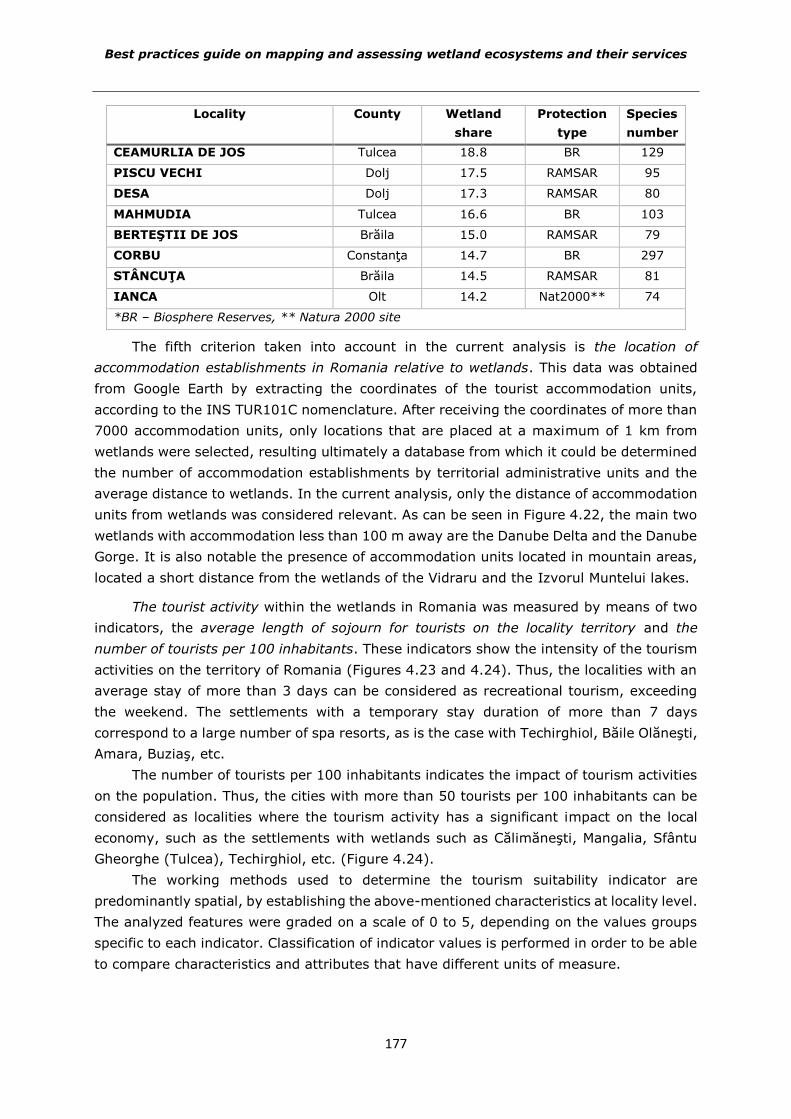
Best practices guide on mapping and assessing wetland ecosystems and their services
177
Locality County Wetland
share
Protection
type
Species
number
CEAMURLIA DE JOS Tulcea 18.8 BR 129
PISCU VECHI Dolj 17.5 RAMSAR 95
DESA Dolj 17.3 RAMSAR 80
MAHMUDIA Tulcea 16.6 BR 103
BERTEŞTII DE JOS Brăila 15.0 RAMSAR 79
CORBU Constanţa 14.7 BR 297
STÂNCUŢA Brăila 14.5 RAMSAR 81
IANCA Olt 14.2 Nat2000** 74
*BR – Biosphere Reserves, ** Natura 2000 site
The fifth criterion taken into account in the current analysis is the location of
accommodation establishments in Romania relative to wetlands. This data was obtained
from Google Earth by extracting the coordinates of the tourist accommodation units,
according to the INS TUR101C nomenclature. After receiving the coordinates of more than
7000 accommodation units, only locations that are placed at a maximum of 1 km from
wetlands were selected, resulting ultimately a database from which it could be determined
the number of accommodation establishments by territorial administrative units and the
average distance to wetlands. In the current analysis, only the distance of accommodation
units from wetlands was considered relevant. As can be seen in Figure 4.22, the main two
wetlands with accommodation less than 100 m away are the Danube Delta and the Danube
Gorge. It is also notable the presence of accommodation units located in mountain areas,
located a short distance from the wetlands of the Vidraru and the Izvorul Muntelui lakes.
The tourist activity within the wetlands in Romania was measured by means of two
indicators, the average length of sojourn for tourists on the locality territory and the
number of tourists per 100 inhabitants. These indicators show the intensity of the tourism
activities on the territory of Romania (Figures 4.23 and 4.24). Thus, the localities with an
average stay of more than 3 days can be considered as recreational tourism, exceeding
the weekend. The settlements with a temporary stay duration of more than 7 days
correspond to a large number of spa resorts, as is the case with Techirghiol, Băile Olăneşti,
Amara, Buziaş, etc.
The number of tourists per 100 inhabitants indicates the impact of tourism activities
on the population. Thus, the cities with more than 50 tourists per 100 inhabitants can be
considered as localities where the tourism activity has a significant impact on the local
economy, such as the settlements with wetlands such as Călimăneşti, Mangalia, Sfântu
Gheorghe (Tulcea), Techirghiol, etc. (Figure 4.24).
The working methods used to determine the tourism suitability indicator are
predominantly spatial, by establishing the above-mentioned characteristics at locality level.
The analyzed features were graded on a scale of 0 to 5, depending on the values groups
specific to each indicator. Classification of indicator values is performed in order to be able
to compare characteristics and attributes that have different units of measure.
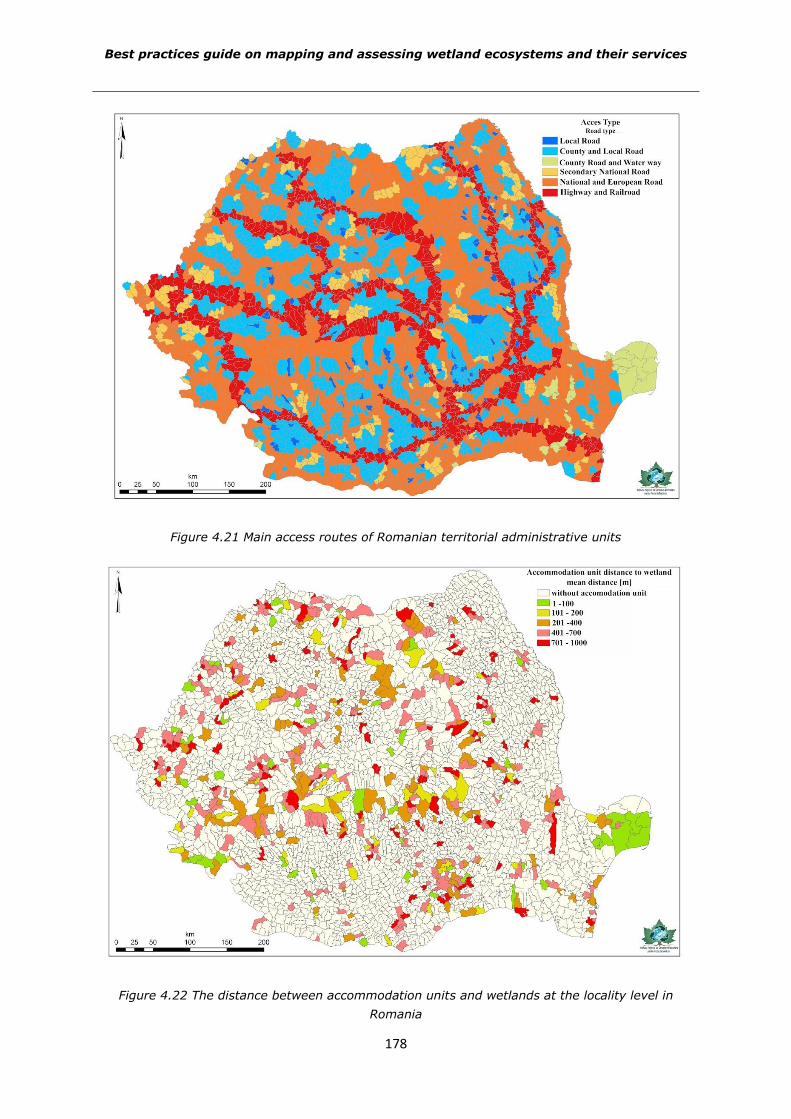
Best practices guide on mapping and assessing wetland ecosystems and their services
178
Figure 4.21 Main access routes of Romanian territorial administrative units
Figure 4.22 The distance between accommodation units and wetlands at the locality level in
Romania
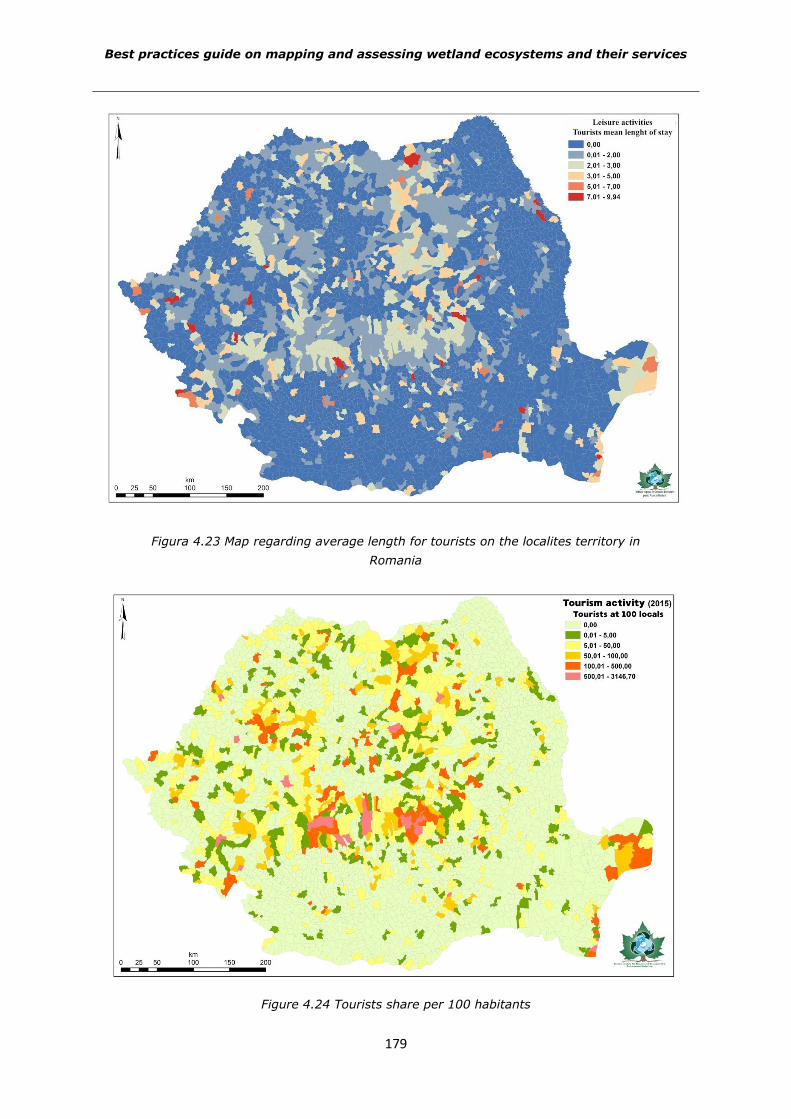
Best practices guide on mapping and assessing wetland ecosystems and their services
179
Figura 4.23 Map regarding average length for tourists on the localites territory in
Romania
Figure 4.24 Tourists share per 100 habitants
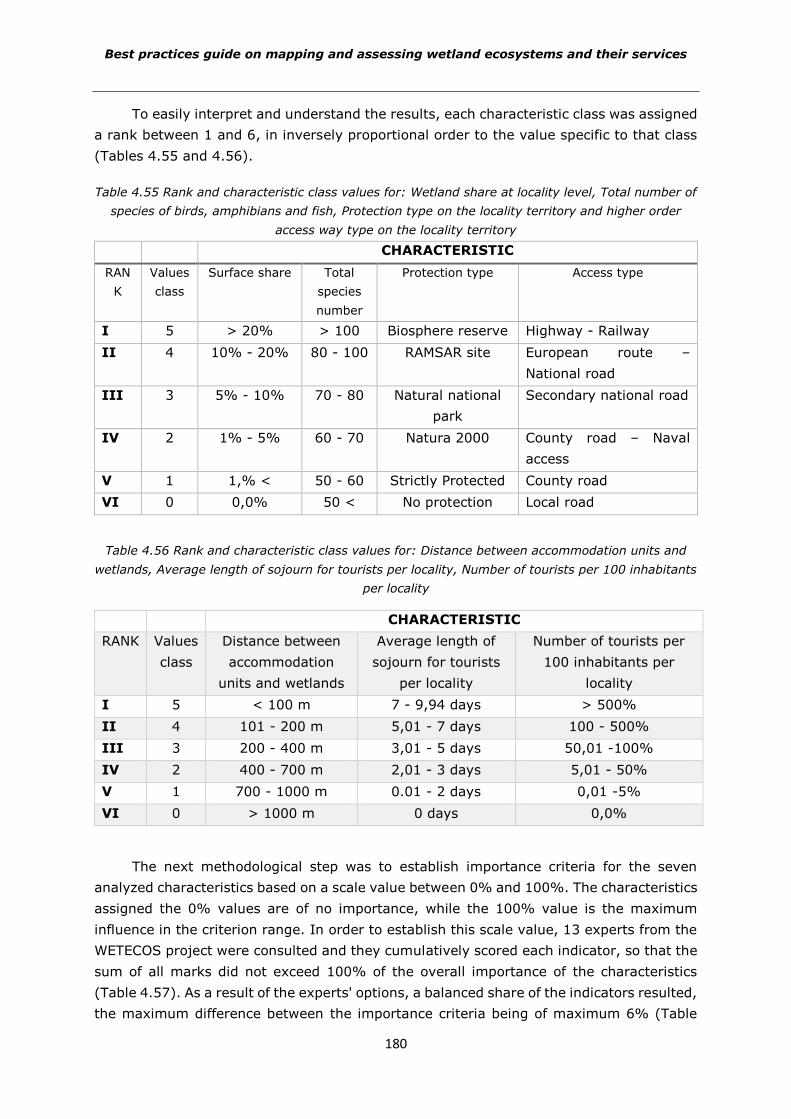
Best practices guide on mapping and assessing wetland ecosystems and their services
180
To easily interpret and understand the results, each characteristic class was assigned
a rank between 1 and 6, in inversely proportional order to the value specific to that class
(Tables 4.55 and 4.56).
Table 4.55 Rank and characteristic class values for: Wetland share at locality level, Total number of
species of birds, amphibians and fish, Protection type on the locality territory and higher order
access way type on the locality territory
CHARACTERISTIC
RAN
K
Values
class
Surface share Total
species
number
Protection type Access type
I 5 > 20% > 100 Biosphere reserve Highway - Railway
II 4 10% - 20% 80 - 100 RAMSAR site European route –
National road
III 3 5% - 10% 70 - 80 Natural national
park
Secondary national road
IV 2 1% - 5% 60 - 70 Natura 2000 County road – Naval
access
V 1 1,% < 50 - 60 Strictly Protected County road
VI 0 0,0% 50 < No protection Local road
Table 4.56 Rank and characteristic class values for: Distance between accommodation units and
wetlands, Average length of sojourn for tourists per locality, Number of tourists per 100 inhabitants
per locality
CHARACTERISTIC
RANK Values
class
Distance between
accommodation
units and wetlands
Average length of
sojourn for tourists
per locality
Number of tourists per
100 inhabitants per
locality
I 5 < 100 m 7 - 9,94 days > 500%
II 4 101 - 200 m 5,01 - 7 days 100 - 500%
III 3 200 - 400 m 3,01 - 5 days 50,01 -100%
IV 2 400 - 700 m 2,01 - 3 days 5,01 - 50%
V 1 700 - 1000 m 0.01 - 2 days 0,01 -5%
VI 0 > 1000 m 0 days 0,0%
The next methodological step was to establish importance criteria for the seven
analyzed characteristics based on a scale value between 0% and 100%. The characteristics
assigned the 0% values are of no importance, while the 100% value is the maximum
influence in the criterion range. In order to establish this scale value, 13 experts from the
WETECOS project were consulted and they cumulatively scored each indicator, so that the
sum of all marks did not exceed 100% of the overall importance of the characteristics
(Table 4.57). As a result of the experts' options, a balanced share of the indicators resulted,
the maximum difference between the importance criteria being of maximum 6% (Table
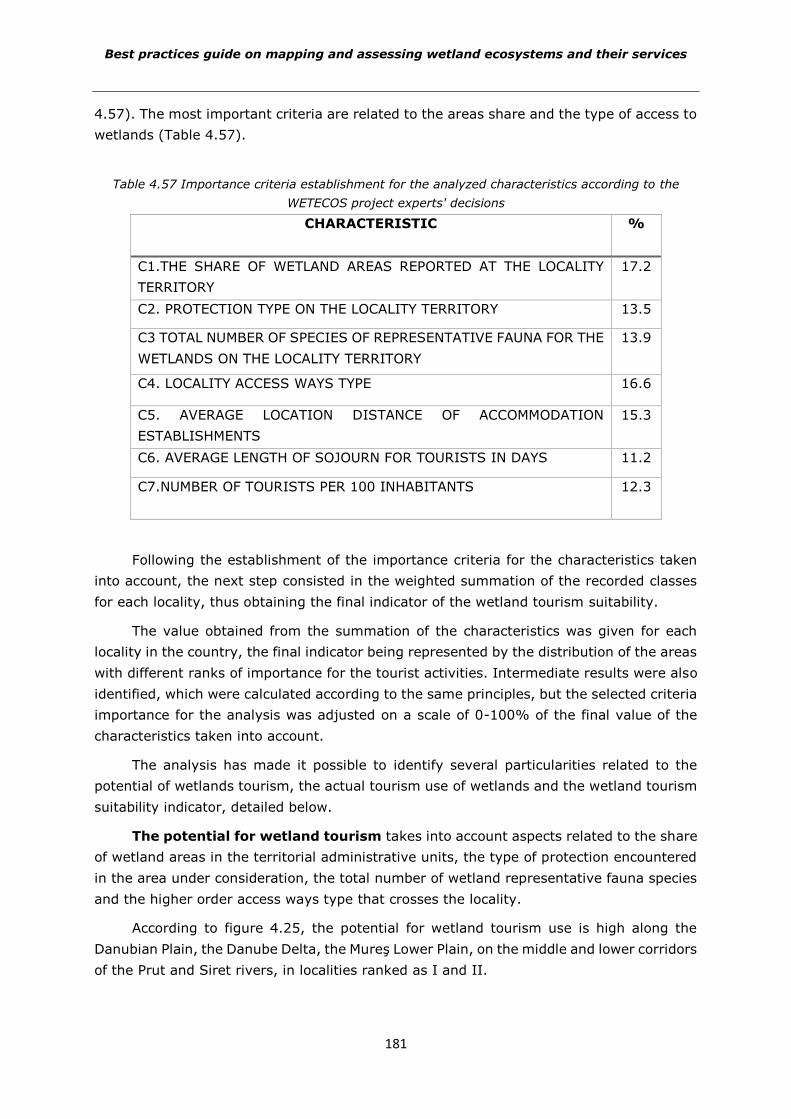
Best practices guide on mapping and assessing wetland ecosystems and their services
181
4.57). The most important criteria are related to the areas share and the type of access to
wetlands (Table 4.57).
Table 4.57 Importance criteria establishment for the analyzed characteristics according to the
WETECOS project experts' decisions
CHARACTERISTIC %
C1.THE SHARE OF WETLAND AREAS REPORTED AT THE LOCALITY
TERRITORY
17.2
C2. PROTECTION TYPE ON THE LOCALITY TERRITORY 13.5
C3 TOTAL NUMBER OF SPECIES OF REPRESENTATIVE FAUNA FOR THE
WETLANDS ON THE LOCALITY TERRITORY
13.9
C4. LOCALITY ACCESS WAYS TYPE 16.6
C5. AVERAGE LOCATION DISTANCE OF ACCOMMODATION
ESTABLISHMENTS
15.3
C6. AVERAGE LENGTH OF SOJOURN FOR TOURISTS IN DAYS 11.2
C7.NUMBER OF TOURISTS PER 100 INHABITANTS 12.3
Following the establishment of the importance criteria for the characteristics taken
into account, the next step consisted in the weighted summation of the recorded classes
for each locality, thus obtaining the final indicator of the wetland tourism suitability.
The value obtained from the summation of the characteristics was given for each
locality in the country, the final indicator being represented by the distribution of the areas
with different ranks of importance for the tourist activities. Intermediate results were also
identified, which were calculated according to the same principles, but the selected criteria
importance for the analysis was adjusted on a scale of 0-100% of the final value of the
characteristics taken into account.
The analysis has made it possible to identify several particularities related to the
potential of wetlands tourism, the actual tourism use of wetlands and the wetland tourism
suitability indicator, detailed below.
The potential for wetland tourism takes into account aspects related to the share
of wetland areas in the territorial administrative units, the type of protection encountered
in the area under consideration, the total number of wetland representative fauna species
and the higher order access ways type that crosses the locality.
According to figure 4.25, the potential for wetland tourism use is high along the
Danubian Plain, the Danube Delta, the Mureş Lower Plain, on the middle and lower corridors
of the Prut and Siret rivers, in localities ranked as I and II.
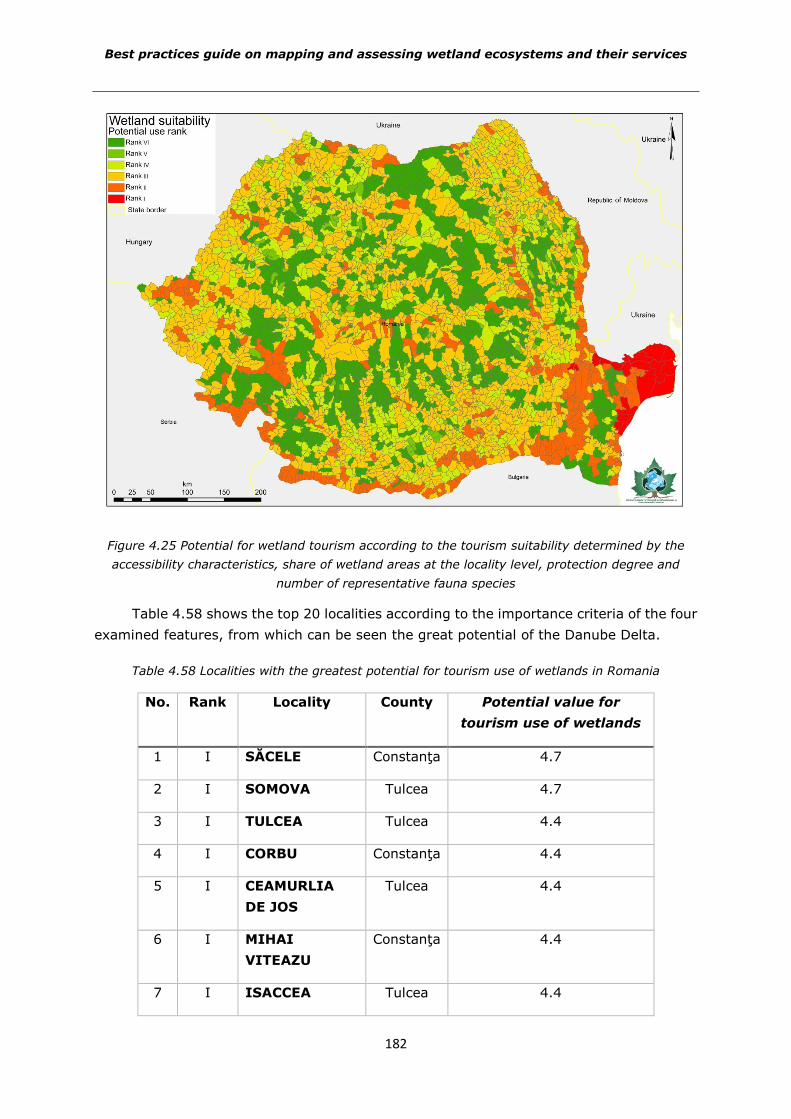
Best practices guide on mapping and assessing wetland ecosystems and their services
182
Figure 4.25 Potential for wetland tourism according to the tourism suitability determined by the
accessibility characteristics, share of wetland areas at the locality level, protection degree and
number of representative fauna species
Table 4.58 shows the top 20 localities according to the importance criteria of the four
examined features, from which can be seen the great potential of the Danube Delta.
Table 4.58 Localities with the greatest potential for tourism use of wetlands in Romania
No. Rank Locality County Potential value for
tourism use of wetlands
1 I SĂCELE Constanţa 4.7
2 I SOMOVA Tulcea 4.7
3 I TULCEA Tulcea 4.4
4 I CORBU Constanţa 4.4
5 I CEAMURLIA
DE JOS
Tulcea 4.4
6 I MIHAI
VITEAZU
Constanţa 4.4
7 I ISACCEA Tulcea 4.4
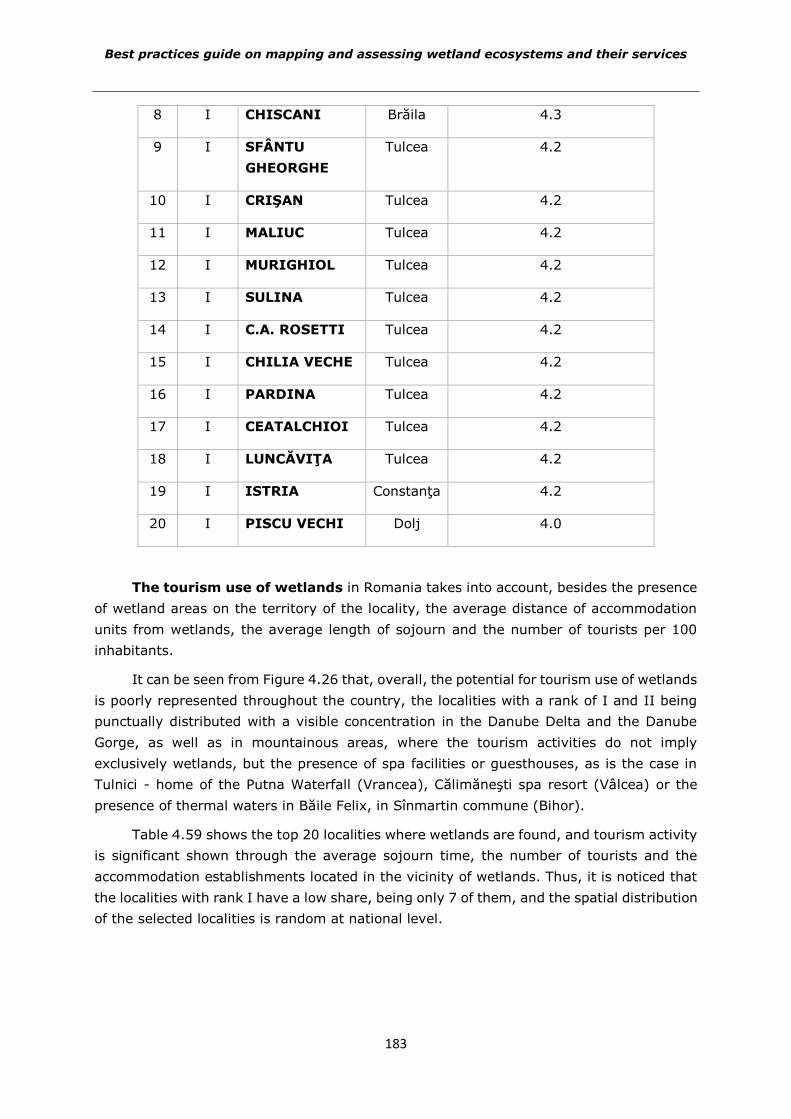
Best practices guide on mapping and assessing wetland ecosystems and their services
183
8 I CHISCANI Brăila 4.3
9 I SFÂNTU
GHEORGHE
Tulcea 4.2
10 I CRIŞAN Tulcea 4.2
11 I MALIUC Tulcea 4.2
12 I MURIGHIOL Tulcea 4.2
13 I SULINA Tulcea 4.2
14 I C.A. ROSETTI Tulcea 4.2
15 I CHILIA VECHE Tulcea 4.2
16 I PARDINA Tulcea 4.2
17 I CEATALCHIOI Tulcea 4.2
18 I LUNCĂVIŢA Tulcea 4.2
19 I ISTRIA Constanţa 4.2
20 I PISCU VECHI Dolj 4.0
The tourism use of wetlands in Romania takes into account, besides the presence
of wetland areas on the territory of the locality, the average distance of accommodation
units from wetlands, the average length of sojourn and the number of tourists per 100
inhabitants.
It can be seen from Figure 4.26 that, overall, the potential for tourism use of wetlands
is poorly represented throughout the country, the localities with a rank of I and II being
punctually distributed with a visible concentration in the Danube Delta and the Danube
Gorge, as well as in mountainous areas, where the tourism activities do not imply
exclusively wetlands, but the presence of spa facilities or guesthouses, as is the case in
Tulnici - home of the Putna Waterfall (Vrancea), Călimăneşti spa resort (Vâlcea) or the
presence of thermal waters in Băile Felix, in Sînmartin commune (Bihor).
Table 4.59 shows the top 20 localities where wetlands are found, and tourism activity
is significant shown through the average sojourn time, the number of tourists and the
accommodation establishments located in the vicinity of wetlands. Thus, it is noticed that
the localities with rank I have a low share, being only 7 of them, and the spatial distribution
of the selected localities is random at national level.
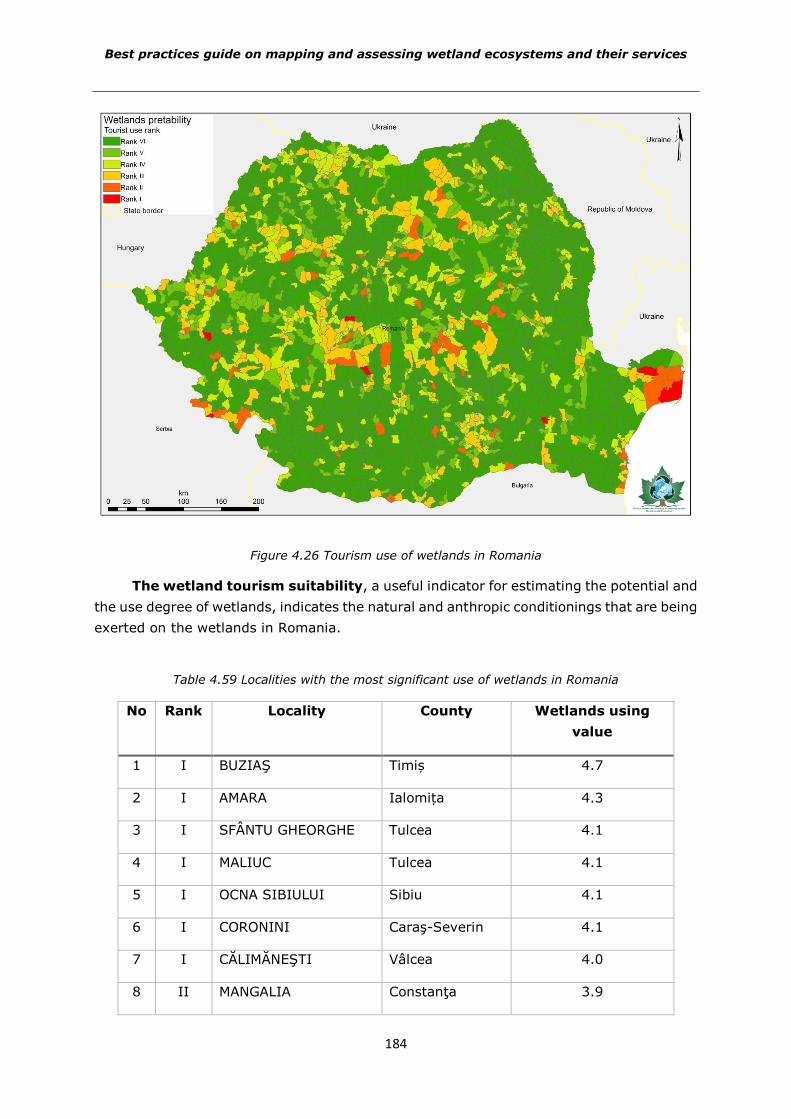
Best practices guide on mapping and assessing wetland ecosystems and their services
184
Figure 4.26 Tourism use of wetlands in Romania
The wetland tourism suitability, a useful indicator for estimating the potential and
the use degree of wetlands, indicates the natural and anthropic conditionings that are being
exerted on the wetlands in Romania.
Table 4.59 Localities with the most significant use of wetlands in Romania
No Rank Locality County Wetlands using
value
1 I BUZIAŞ Timiș 4.7
2 I AMARA Ialomița 4.3
3 I SFÂNTU GHEORGHE Tulcea 4.1
4 I MALIUC Tulcea 4.1
5 I OCNA SIBIULUI Sibiu 4.1
6 I CORONINI Caraş-Severin 4.1
7 I CĂLIMĂNEŞTI Vâlcea 4.0
8 II MANGALIA Constanţa 3.9
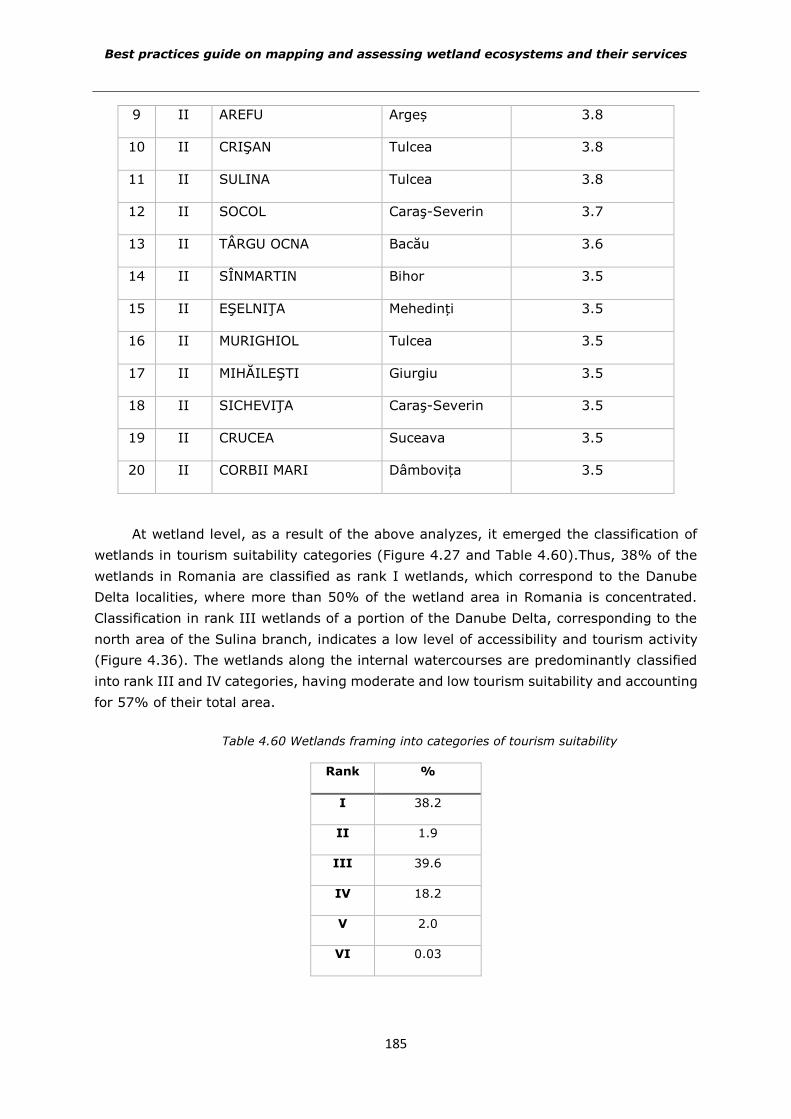
Best practices guide on mapping and assessing wetland ecosystems and their services
185
9 II AREFU Argeș 3.8
10 II CRIŞAN Tulcea 3.8
11 II SULINA Tulcea 3.8
12 II SOCOL Caraş-Severin 3.7
13 II TÂRGU OCNA Bacău 3.6
14 II SÎNMARTIN Bihor 3.5
15 II EŞELNIŢA Mehedinți 3.5
16 II MURIGHIOL Tulcea 3.5
17 II MIHĂILEŞTI Giurgiu 3.5
18 II SICHEVIŢA Caraş-Severin 3.5
19 II CRUCEA Suceava 3.5
20 II CORBII MARI Dâmbovița 3.5
At wetland level, as a result of the above analyzes, it emerged the classification of
wetlands in tourism suitability categories (Figure 4.27 and Table 4.60).Thus, 38% of the
wetlands in Romania are classified as rank I wetlands, which correspond to the Danube
Delta localities, where more than 50% of the wetland area in Romania is concentrated.
Classification in rank III wetlands of a portion of the Danube Delta, corresponding to the
north area of the Sulina branch, indicates a low level of accessibility and tourism activity
(Figure 4.36). The wetlands along the internal watercourses are predominantly classified
into rank III and IV categories, having moderate and low tourism suitability and accounting
for 57% of their total area.
Table 4.60 Wetlands framing into categories of tourism suitability
Rank %
I 38.2
II 1.9
III 39.6
IV 18.2
V 2.0
VI 0.03
Best practices guide on mapping and assessing wetland ecosystems and their services
186
Thus, by weighted summation of the values of the seven characteristics, for each
locality, was obtained the tourism suitability classes at the national level.Figure 4.29 shows
the distribution of the localities' suitability rank for the use of wetlands. Thus, it is observed
that the Danube Delta (Sfântu Gheorghe, Sulina, Maliuc, Crişan) are the only ones included
in category I of suitability (Rank I) while the rest of the localities, with high values of this
indicator, being classified in the second category (Rank II).
In Romania, the Danube corridor has a high potential for wetlands use, especially in
the Danube Lower Plain, where several localities with moderate tourism suitability potential
are concentrated. Also, the heavily populated areas have moderate suitability due to the
developed infrastructure, as is the case with Bucharest, Iaşi, Timişoara, etc. Table 4.61
shows the top 20 localities, according to the tourism suitability value. It can be noticed
that they are mostly included in category II of suitability for tourist activities. The localities
in the Danube Delta have the greatest tourism suitability, followed by those in the Danube
Gorge and the Black Sea Coast. Also, it is noticed that a number of localities fall into
category III due to the natural conditioning, such as those in Mureş Plain (Arad County)
and the localities of Sibiu County, as a result of a cumulative natural and tourism factors
(Figure 4.37).
At national level, only 1.5% of the country's localities have high tourism suitability
values, which means that wetlands occupy areas of over 10% of their territory, their
accessibility is good, and tourism is important for the local economy. The moderate
suitability of localities for tourism activities is found in 13% of the territorial administrative
units, this category being the one with potential for tourism development (Table 4.62). In
Romania, wetlands are poorly valorized relating to tourism activities, except for two areas:
the Danube Delta between Sulina branch and the Razim-Sinoe lakes, and the Danube
Gorge. The course of the Danube, downstream of the Iron Gates to the Black Sea, on the
left side of the Sulina branch and south of the Chilia branch, is characterized by a modest
suitability for tourism activities, being the main corridor in which the wetlands could
develop. The localities close to Bucharest are characterized by a moderate wetland tourism
suitability, which is favored by the presence of a developed access and accommodation
infrastructure, such as Comana or Snagov communes.

Best practices guide on mapping and assessing wetland ecosystems and their services
187
Figure 4.27 Wetland tourism suitability in Romania
Figure 4.28 Wetland localities tourism suitability in Romania
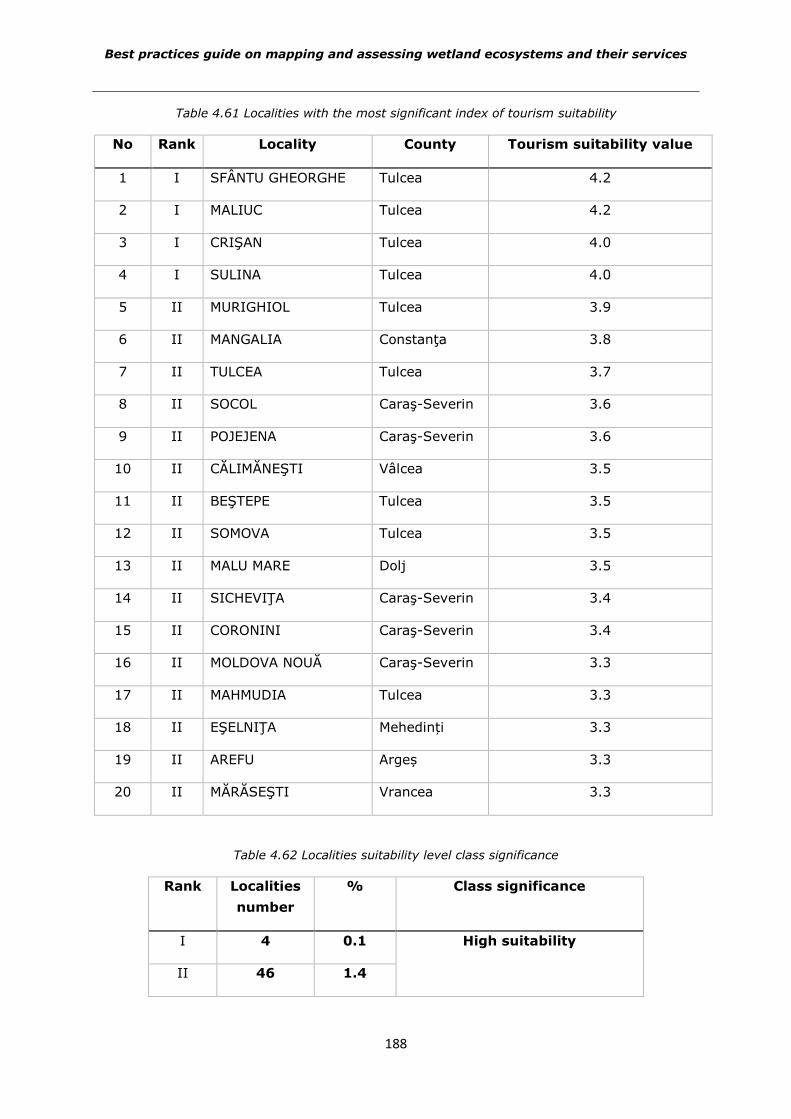
Best practices guide on mapping and assessing wetland ecosystems and their services
188
Table 4.61 Localities with the most significant index of tourism suitability
No Rank Locality County Tourism suitability value
1 I SFÂNTU GHEORGHE Tulcea 4.2
2 I MALIUC Tulcea 4.2
3 I CRIŞAN Tulcea 4.0
4 I SULINA Tulcea 4.0
5 II MURIGHIOL Tulcea 3.9
6 II MANGALIA Constanţa 3.8
7 II TULCEA Tulcea 3.7
8 II SOCOL Caraş-Severin 3.6
9 II POJEJENA Caraş-Severin 3.6
10 II CĂLIMĂNEŞTI Vâlcea 3.5
11 II BEŞTEPE Tulcea 3.5
12 II SOMOVA Tulcea 3.5
13 II MALU MARE Dolj 3.5
14 II SICHEVIŢA Caraş-Severin 3.4
15 II CORONINI Caraş-Severin 3.4
16 II MOLDOVA NOUĂ Caraş-Severin 3.3
17 II MAHMUDIA Tulcea 3.3
18 II EŞELNIŢA Mehedinți 3.3
19 II AREFU Argeș 3.3
20 II MĂRĂSEŞTI Vrancea 3.3
Table 4.62 Localities suitability level class significance
Rank Localities
number
% Class significance
I 4 0.1 High suitability
II 46 1.4
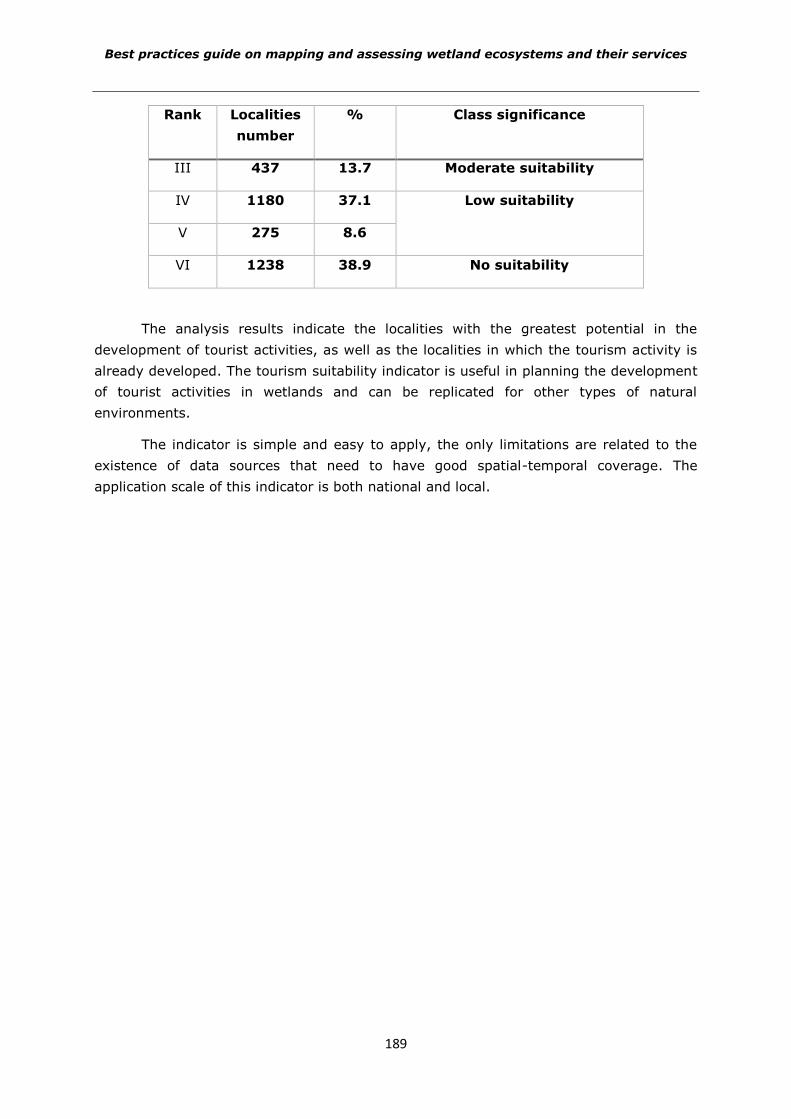
Best practices guide on mapping and assessing wetland ecosystems and their services
189
Rank Localities
number
% Class significance
III 437 13.7 Moderate suitability
IV 1180 37.1 Low suitability
V 275 8.6
VI 1238 38.9 No suitability
The analysis results indicate the localities with the greatest potential in the
development of tourist activities, as well as the localities in which the tourism activity is
already developed. The tourism suitability indicator is useful in planning the development
of tourist activities in wetlands and can be replicated for other types of natural
environments.
The indicator is simple and easy to apply, the only limitations are related to the
existence of data sources that need to have good spatial-temporal coverage. The
application scale of this indicator is both national and local.
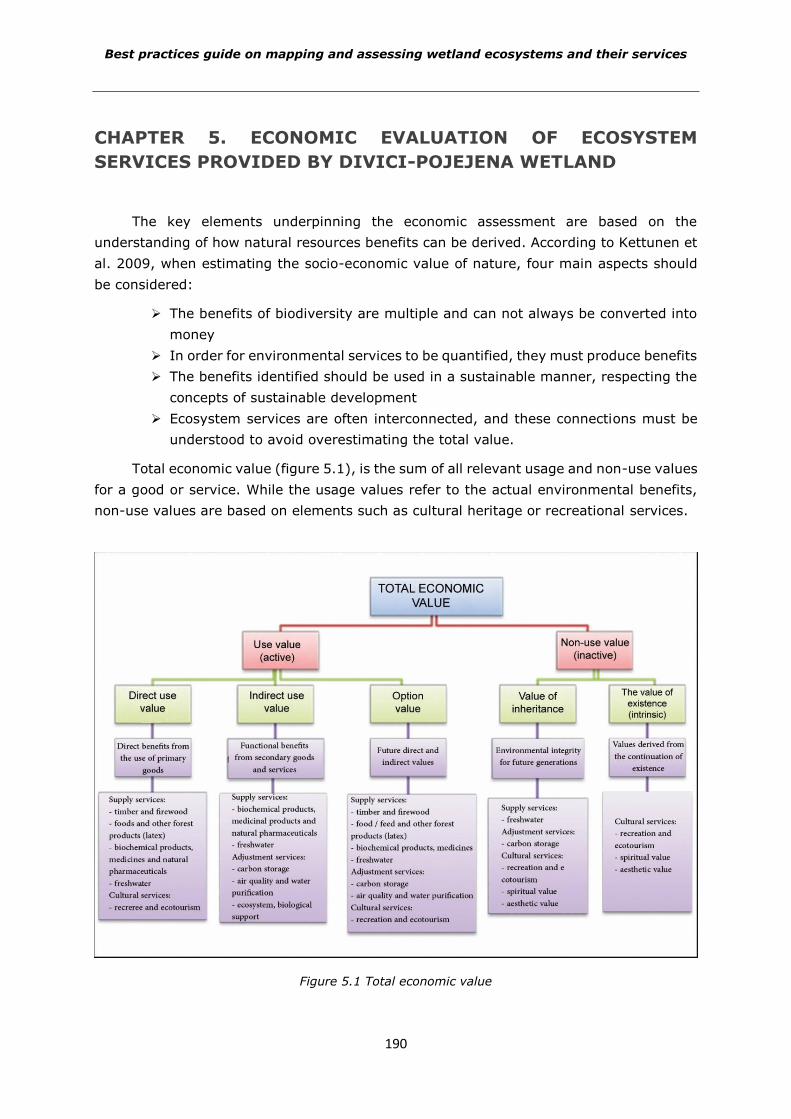
Best practices guide on mapping and assessing wetland ecosystems and their services
190
CHAPTER 5. ECONOMIC EVALUATION OF ECOSYSTEM
SERVICES PROVIDED BY DIVICI-POJEJENA WETLAND
The key elements underpinning the economic assessment are based on the
understanding of how natural resources benefits can be derived. According to Kettunen et
al. 2009, when estimating the socio-economic value of nature, four main aspects should
be considered:
The benefits of biodiversity are multiple and can not always be converted into
money
In order for environmental services to be quantified, they must produce benefits
The benefits identified should be used in a sustainable manner, respecting the
concepts of sustainable development
Ecosystem services are often interconnected, and these connections must be
understood to avoid overestimating the total value.
Total economic value (figure 5.1), is the sum of all relevant usage and non-use values
for a good or service. While the usage values refer to the actual environmental benefits,
non-use values are based on elements such as cultural heritage or recreational services.
Figure 5.1 Total economic value
Best practices guide on mapping and assessing wetland ecosystems and their services
191
Economic assessment of ecosystem services is carried out using a variety of methods
and techniques, which uses primary or secondary data, depending on their availability. For
example, by analyzing market prices, a service can be assigned a value, while methods
that do not use this concept typically describe a hypothetical market on which certain
scenarios are established (Grădinariu, 2013).
In terms of economic analysis of Divici-Pojejena wetland ecosystem services, two
methods were applied:
qualitative assessment
quantitative evaluation - the method of transferring benefits
(Benefit Transfer - BT).
5.1 Qualitative approach for assessing Divici-Pojejena wetland
ecosystem services
The region of the Divici-Pojejena wetland is characterized by a vast cultural diversity,
but facing a demographic aging process, population earning a low income. The National
Institute of Statistics (INS) estimates that in 2014, the population of Pojejena village was
3,022 inhabitants, with a downward trend from year to year andas a result of a low birth
rate and population migration from the region to bigger cities. According to the data
obtained from the National Institute of Statistics (INS), the monthly average total income
per household in 2015 was RON 2 795.02, or approximately USD 687.
According to the data from Pojejena City Hall, the main categories of land use in
Pojejena are agricultural land (47 %), forest land (44 %) and water-related (6%).
Nowadays, the main crops are maize, wheat and rye, potato and vegetable crops.
Agriculture is the main economic industry of the area, but tourism is considered to have
broad economic potential due to the natural environment of the wetland (Sava, 2011).
A qualitative approach to valuation of ecosystem services can be an alternative and
a supplement to a quantitative approach. Alone, the qualitative methods are useful when
possible changes need to be assessed or rated in order to make decisions (Busch et al.
2012).The main strength of a qualitative approach is that it can be used to express the
multi-dimensional nature of human well-being (rather than just one monetary dimension),
! Estimates of the transfer value in this study are based on limited
data obtained from qualitative analysis, as well as a series of
assumptions. Therefore, the results obtained should be considered as
initial assessments of the economic contribution of ecosystem services
provided by the wetland Divici-Pojejena, which can be based on more
detailed analyzes.
Best practices guide on mapping and assessing wetland ecosystems and their services
192
which is particularly useful when it comes to symbolic, cultural and spiritual sides of
ecosystem services. In this case, qualitative assessment provides the information needed
for monetary analysis, so interviews and questionnaires applied to the main target groups
have provided a starting point.As is also pointed out in the paper by Hein and others, 2006,
one of the most important steps to make a comprehensive qualitative assessment, is the
identification and involvement of relevant target groups. In this way, can be obtain
essential information about the most relevant ecosystem services in that area, it can be
identify exchange markets, as well as the main strategic goals outlined, in a medium and
long term. An extremely important aspect is related to the fact that target groups can
provide distinct information about the same ecosystem service, depending on the
perception and knowledge of each (Hein et. al., 2006; Maynard et al. 2015). Thus, the
analysis of the economic and socio-cultural aspects of the area is a key element, in order
to analyze the potential interests and conflicts that may arise in that area (Pascual et al.
2010). For example, based on a study in a wetland in the Netherlands (Hein et al. 2007),
it was revealed that the decision-makers in the area had different interests in its
administration, so that the recreation service was considered to be the most important by
local representatives, while nature conservation was the basic aspect at national level. The
same study concluded that local decision makers tend to attach greater importance to
supply services, while regulation and maintenance services also cultural services are of
greater importance to national decision makers.
The qualitative assessment of the Divici-Pojejena wetland has been used to increase
the understanding of the value offered by ecosystem services and to analyze how different
decision makers perceive and estimate these services. In general, economic benefits in
wetlands are classified as direct or indirect use values and as non-use values (Brander et
al., 2006). Direct uses refer to services that can be "consumed" directly, for example food
products, while indirect uses refer to the functions offered by the local ecosystem, such as
flood protection.
Values of non-use are intangible and site-specific (Oglethorpe and Miliadou, 2000),
being often related to the aesthetic properties of the area (Pascual et al., 2010). Values of
non-use are sometimes divided into different concepts, referring to the inheritance value,
the value of existence and the altruistic value. Thus, the altruistic value refers to the
satisfaction people have with knowing that the ecosystem is protected and provides
services, while the inheritance value and the value of existence refers to the possibility of
using ecosystem services, either for your own needs (option), either for future generations
(inheritance).
For the qualitative evaluation of ecosystem services provided by the Divici-Pojejena
wetland, two focus groups, one in Oslo, where the experts from the project participated,
and one in Pojejena, with relevant decision-makers (representatives of city hall, of the
Iron Gates Natural Park and the National Environmental Guard - Caraş-Severin County
Commissariat) and locals. As a general conclusion, has resulted that the area hasa great
potential for development, but there is limited awareness of the goods and services that
are offered by it. Following the discussions, it has been established that the ecosystem
Best practices guide on mapping and assessing wetland ecosystems and their services
193
service offered by the area and present the greatest potential, refers to the observation of
birds. Not to be neglected is the existing archaeological and cultural diversity, which can
provide favorable conditions for tourism development and implicitly the economic growth
of the area.
The direct use values could not be clearly defined, especially since, for example, the
use of fish for consumption is restricted by the strict protection regime in the area. Another
example of an ecosystem service that has potential for use, but which is not exploited by
locals, consists of using reed in traditional constructions. Among other ecosystem services
highlighted by experts, includes regulation and maintenance services such as flood
protection and coastal erosion. Following discussions with representatives of local
authorities, in the framework of the workshop organized in July 2016 within the WETECOS
project, it was concluded that the wetland is characterized by rich biodiversity and serves
as a habitat for important flora and fauna species. As in most cases, it was established that
decision makers assign different functions and values to the analyzed wet area. For
example, representative of the Iron Gates Natural Park, which manages the wetland,
considers that the local population is not sufficiently involved in the protection of the area,
not knowing its protected area status. This may also be due to a lack of communication
between authorities and locals, who don’t know exactly the restrictions imposed and
fishing, for example, within the wetland area, although this is totally forbidden. The Iron
Gates National Park representatives built a bird watching observation point as well as being
placed panels to inform the population about the types of birds and the importance of
protecting them.According to the park rangers, however, the observation point is hardly
visited at all.In response to these issues, there arenow several programs from the Iron
Gates National Park that aim to raise the awareness, particularly among school children.
Further, according to a poll organized by Park representatives, showed that awareness
about the wetland was increasing (Ciocănea et. al., 2016). On the other hand, contrary to
the point of view regarding representatives of Iron Gates Natural Park, the local authorities
consider that the many restrictions imposed on the area limit its development in terms of
tourism.
During the same period questionnaires were applied to the local population, these
including opinions on the following topics: knowledge about the wetland, use of the
wetland, and likeability of the wetland. A second round of interviews was conducted in
October 2016, forty responses were received in total. A synthesis of those responses
resulted in the following:
details about the size, borders/limits and regulation of the wetland are not
particularly well known among local inhabitants.
majority of the informants find the wetland “attractive” and half of them thinks that
it is sufficiently protected and in a good state.
almost everybody consider the wetland as a tourist attraction because of its flora
and fauna.
large majority considers the wetland as a place for recreation.
Best practices guide on mapping and assessing wetland ecosystems and their services
194
few of the respondents use any plant material from the wetland (medicinal
purposes).
5.2 Quantitative approach for assessing Divici-Pojejena wetland
ecosystem services
For the quantitative assessment of ecosystem services generated by the
wetland Divici-Pojejena we usedthe benefit transfer (BT) methodology, a commonly used
alternative to primary valuation attempts (Hanley et al., 2007; Turner et al., 2011;
Schägner et al., 2013; Richardson et al., 2015). The Benefit Transfer method is widely
used and refers to environmental benefit estimates from existing cases (i.e., the study
sites) that are transferred to a newcase study (i.e., the policy site) (Brouwer, 2000).This
method although used since the 1950’s (Bergstrom and DeCivita, 1999; Ruckelshaus et
al., 2015), is still under revision and the knowledge gaps about the benefit transfer are still
identified and discussed (Kaul et al., 2013; Johnston et al., 2015). However, the method
is increasingly, along with greater knowledge and understanding on how to decrease
transfer errors (Brouwer et al., 2015). At the moment, are used four main benefit transfer
methodologies?
- benefit estimate transfer
- benefit function transfer
- meta-analysis transfer
- preference calibration transfer (Rosenberger and Loomis, 2017).
Each of these transfer methodologies can be used to transfer benefit estimates
obtained from various benefit estimation methodologies, such as travel cost, contingent
valuation, and hedonic valuation (Johnston et al., 2015).
A thorough literature review presented turned out that there is no primary study
that could accurately reflect all the particular details of the Divici-Pojejena wetland, in
terms of geographic location and species (flora and fauna) present in the area. Thus, it
was ultimately chosen as a mode of analysis the meta-regression model by Woodward and
Wui (2001) as a basis for evaluation of assets and services in the Divici-Pojejena wetland.
Woodward and Wui (2001) evaluate the relative value of different wetland
services, using as a case study a number of 39 coastal wetlands. From these cases they
identified the main functions, the economically valuable of ecological services, and the
techniques for quantification ss can be seen in the table 5.1.
Building on this conceptual framework, the examined variables segregate into five
main categories (Tablel 5.2):
socioeconomic variables (year)
size (in acres)
type of the wetland (coastal or not)
functions (eco-services and products)
methodology used in the various studies.
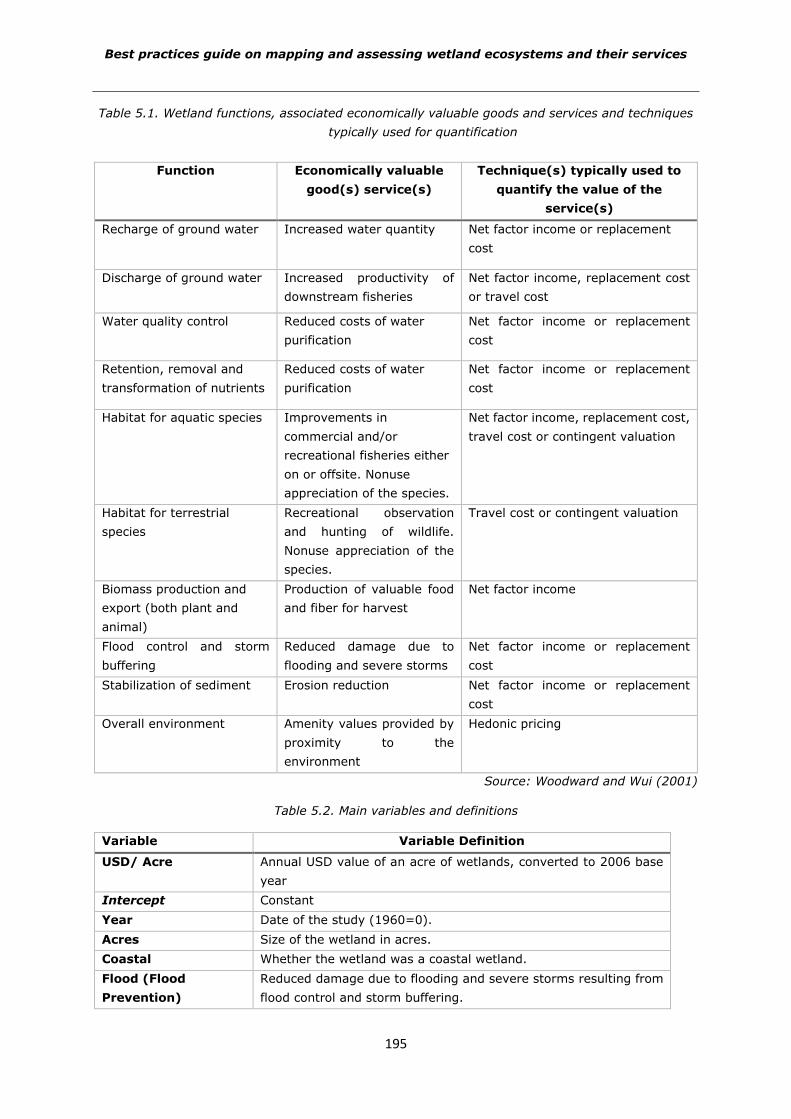
Best practices guide on mapping and assessing wetland ecosystems and their services
195
Table 5.1. Wetland functions, associated economically valuable goods and services and techniques
typically used for quantification
Function Economically valuable
good(s) service(s)
Technique(s) typically used to
quantify the value of the
service(s)
Recharge of ground water Increased water quantity Net factor income or replacement
cost
Discharge of ground water Increased productivity of
downstream fisheries
Net factor income, replacement cost
or travel cost
Water quality control Reduced costs of water
purification
Net factor income or replacement
cost
Retention, removal and
transformation of nutrients
Reduced costs of water
purification
Net factor income or replacement
cost
Habitat for aquatic species Improvements in
commercial and/or
recreational fisheries either
on or offsite. Nonuse
appreciation of the species.
Net factor income, replacement cost,
travel cost or contingent valuation
Habitat for terrestrial
species
Recreational observation
and hunting of wildlife.
Nonuse appreciation of the
species.
Travel cost or contingent valuation
Biomass production and
export (both plant and
animal)
Production of valuable food
and fiber for harvest
Net factor income
Flood control and storm
buffering
Reduced damage due to
flooding and severe storms
Net factor income or replacement
cost
Stabilization of sediment Erosion reduction Net factor income or replacement
cost
Overall environment Amenity values provided by
proximity to the
environment
Hedonic pricing
Source: Woodward and Wui (2001)
Table 5.2. Main variables and definitions
Variable Variable Definition
USD/ Acre Annual USD value of an acre of wetlands, converted to 2006 base
year
Intercept Constant
Year Date of the study (1960=0).
Acres Size of the wetland in acres.
Coastal Whether the wetland was a coastal wetland.
Flood (Flood
Prevention)
Reduced damage due to flooding and severe storms resulting from
flood control and storm buffering.
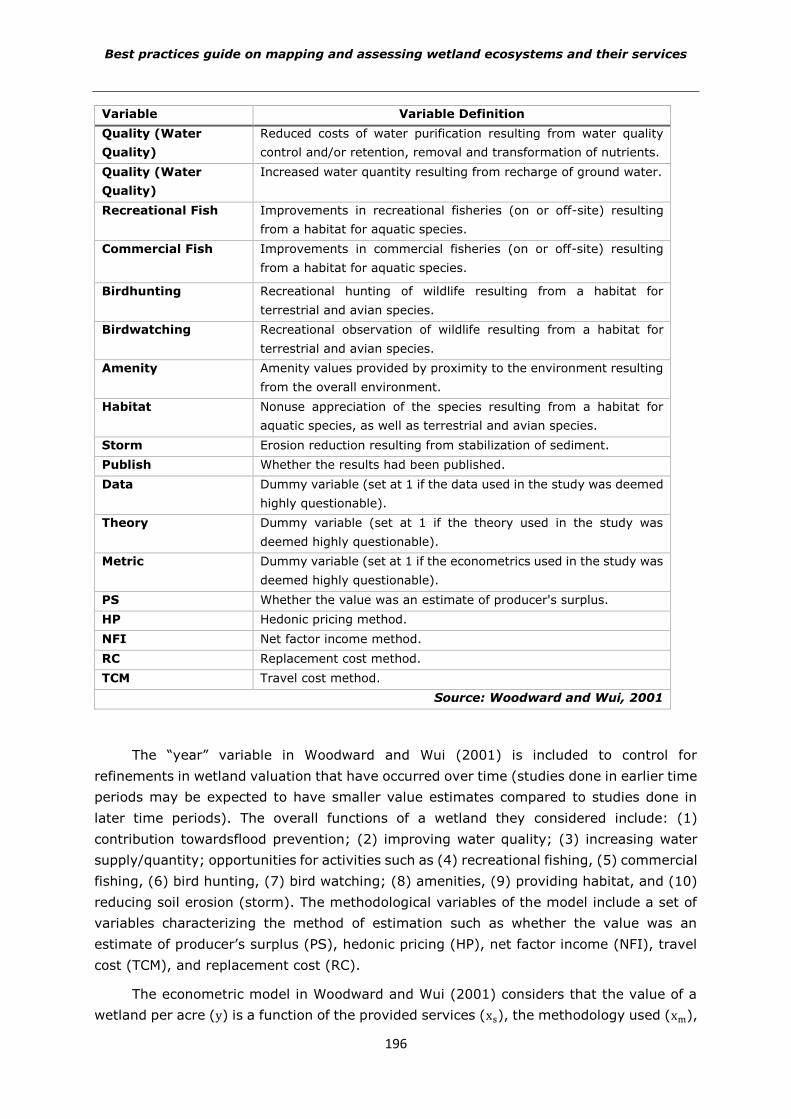
Best practices guide on mapping and assessing wetland ecosystems and their services
196
Variable Variable Definition
Quality (Water
Quality)
Reduced costs of water purification resulting from water quality
control and/or retention, removal and transformation of nutrients.
Quality (Water
Quality)
Increased water quantity resulting from recharge of ground water.
Recreational Fish Improvements in recreational fisheries (on or off-site) resulting
from a habitat for aquatic species.
Commercial Fish Improvements in commercial fisheries (on or off-site) resulting
from a habitat for aquatic species.
Birdhunting Recreational hunting of wildlife resulting from a habitat for
terrestrial and avian species.
Birdwatching Recreational observation of wildlife resulting from a habitat for
terrestrial and avian species.
Amenity Amenity values provided by proximity to the environment resulting
from the overall environment.
Habitat Nonuse appreciation of the species resulting from a habitat for
aquatic species, as well as terrestrial and avian species.
Storm Erosion reduction resulting from stabilization of sediment.
Publish Whether the results had been published.
Data Dummy variable (set at 1 if the data used in the study was deemed
highly questionable).
Theory Dummy variable (set at 1 if the theory used in the study was
deemed highly questionable).
Metric Dummy variable (set at 1 if the econometrics used in the study was
deemed highly questionable).
PS Whether the value was an estimate of producer's surplus.
HP Hedonic pricing method.
NFI Net factor income method.
RC Replacement cost method.
TCM Travel cost method.
Source: Woodward and Wui, 2001
The “year” variable in Woodward and Wui (2001) is included to control for
refinements in wetland valuation that have occurred over time (studies done in earlier time
periods may be expected to have smaller value estimates compared to studies done in
later time periods). The overall functions of a wetland they considered include: (1)
contribution towardsflood prevention; (2) improving water quality; (3) increasing water
supply/quantity; opportunities for activities such as (4) recreational fishing, (5) commercial
fishing, (6) bird hunting, (7) bird watching; (8) amenities, (9) providing habitat, and (10)
reducing soil erosion (storm). The methodological variables of the model include a set of
variables characterizing the method of estimation such as whether the value was an
estimate of producer’s surplus (PS), hedonic pricing (HP), net factor income (NFI), travel
cost (TCM), and replacement cost (RC).
The econometric model in Woodward and Wui (2001) considers that the value of a
wetland per acre (y) is a function of the provided services (xs), the methodology used (xm),
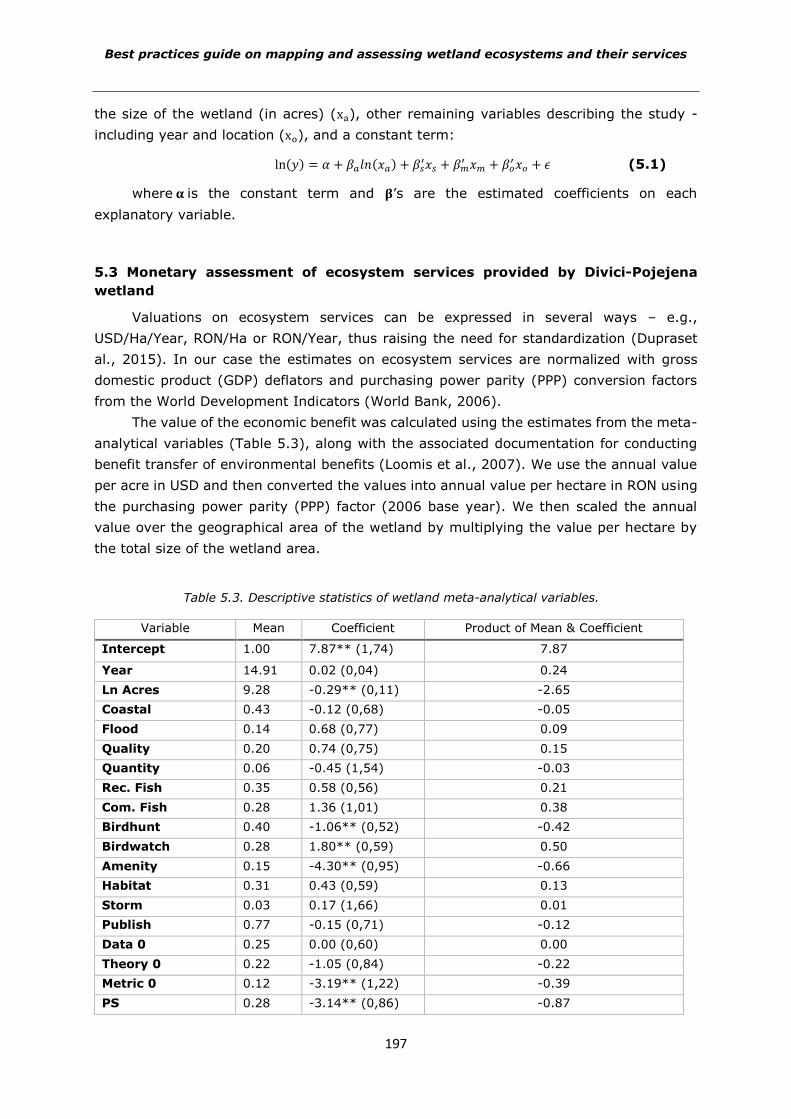
Best practices guide on mapping and assessing wetland ecosystems and their services
197
the size of the wetland (in acres) (xa), other remaining variables describing the study -
including year and location (xo), and a constant term:
ln(𝑦) = 𝛼 + 𝛽𝑎𝑙𝑛(𝑥𝑎) + 𝛽𝑠′𝑥𝑠 + 𝛽𝑚
′ 𝑥𝑚 + 𝛽𝑜′ 𝑥𝑜 + 𝜖 (5.1)
where 𝛂 is the constant term and 𝛃’s are the estimated coefficients on each
explanatory variable.
5.3 Monetary assessment of ecosystem services provided by Divici-Pojejena
wetland
Valuations on ecosystem services can be expressed in several ways – e.g.,
USD/Ha/Year, RON/Ha or RON/Year, thus raising the need for standardization (Dupraset
al., 2015). In our case the estimates on ecosystem services are normalized with gross
domestic product (GDP) deflators and purchasing power parity (PPP) conversion factors
from the World Development Indicators (World Bank, 2006).
The value of the economic benefit was calculated using the estimates from the meta-
analytical variables (Table 5.3), along with the associated documentation for conducting
benefit transfer of environmental benefits (Loomis et al., 2007). We use the annual value
per acre in USD and then converted the values into annual value per hectare in RON using
the purchasing power parity (PPP) factor (2006 base year). We then scaled the annual
value over the geographical area of the wetland by multiplying the value per hectare by
the total size of the wetland area.
Table 5.3. Descriptive statistics of wetland meta-analytical variables.
Variable Mean Coefficient Product of Mean & Coefficient
Intercept 1.00 7.87** (1,74) 7.87
Year 14.91 0.02 (0,04) 0.24
Ln Acres 9.28 -0.29** (0,11) -2.65
Coastal 0.43 -0.12 (0,68) -0.05
Flood 0.14 0.68 (0,77) 0.09
Quality 0.20 0.74 (0,75) 0.15
Quantity 0.06 -0.45 (1,54) -0.03
Rec. Fish 0.35 0.58 (0,56) 0.21
Com. Fish 0.28 1.36 (1,01) 0.38
Birdhunt 0.40 -1.06** (0,52) -0.42
Birdwatch 0.28 1.80** (0,59) 0.50
Amenity 0.15 -4.30** (0,95) -0.66
Habitat 0.31 0.43 (0,59) 0.13
Storm 0.03 0.17 (1,66) 0.01
Publish 0.77 -0.15 (0,71) -0.12
Data 0 0.25 0.00 (0,60) 0.00
Theory 0 0.22 -1.05 (0,84) -0.22
Metric 0 0.12 -3.19** (1,22) -0.39
PS 0.28 -3.14** (0,86) -0.87
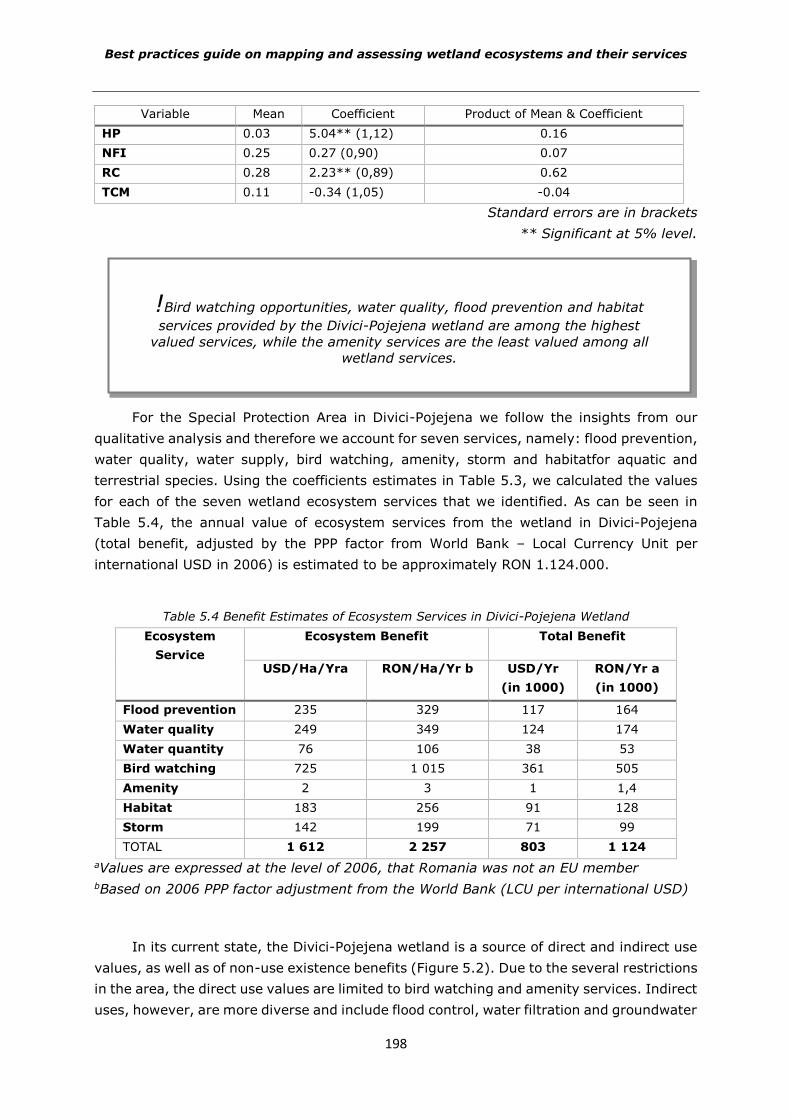
Best practices guide on mapping and assessing wetland ecosystems and their services
198
Variable Mean Coefficient Product of Mean & Coefficient
HP 0.03 5.04** (1,12) 0.16
NFI 0.25 0.27 (0,90) 0.07
RC 0.28 2.23** (0,89) 0.62
TCM 0.11 -0.34 (1,05) -0.04
Standard errors are in brackets
** Significant at 5% level.
For the Special Protection Area in Divici-Pojejena we follow the insights from our
qualitative analysis and therefore we account for seven services, namely: flood prevention,
water quality, water supply, bird watching, amenity, storm and habitatfor aquatic and
terrestrial species. Using the coefficients estimates in Table 5.3, we calculated the values
for each of the seven wetland ecosystem services that we identified. As can be seen in
Table 5.4, the annual value of ecosystem services from the wetland in Divici-Pojejena
(total benefit, adjusted by the PPP factor from World Bank – Local Currency Unit per
international USD in 2006) is estimated to be approximately RON 1.124.000.
Table 5.4 Benefit Estimates of Ecosystem Services in Divici-Pojejena Wetland
Ecosystem
Service
Ecosystem Benefit Total Benefit
USD/Ha/Yra RON/Ha/Yr b USD/Yr
(in 1000)
RON/Yr a
(in 1000)
Flood prevention 235 329 117 164
Water quality 249 349 124 174
Water quantity 76 106 38 53
Bird watching 725 1 015 361 505
Amenity 2 3 1 1,4
Habitat 183 256 91 128
Storm 142 199 71 99
TOTAL 1 612 2 257 803 1 124
aValues are expressed at the level of 2006, that Romania was not an EU member
bBased on 2006 PPP factor adjustment from the World Bank (LCU per international USD)
In its current state, the Divici-Pojejena wetland is a source of direct and indirect use
values, as well as of non-use existence benefits (Figure 5.2). Due to the several restrictions
in the area, the direct use values are limited to bird watching and amenity services. Indirect
uses, however, are more diverse and include flood control, water filtration and groundwater
!Bird watching opportunities, water quality, flood prevention and habitat
services provided by the Divici-Pojejena wetland are among the highest
valued services, while the amenity services are the least valued among all
wetland services.
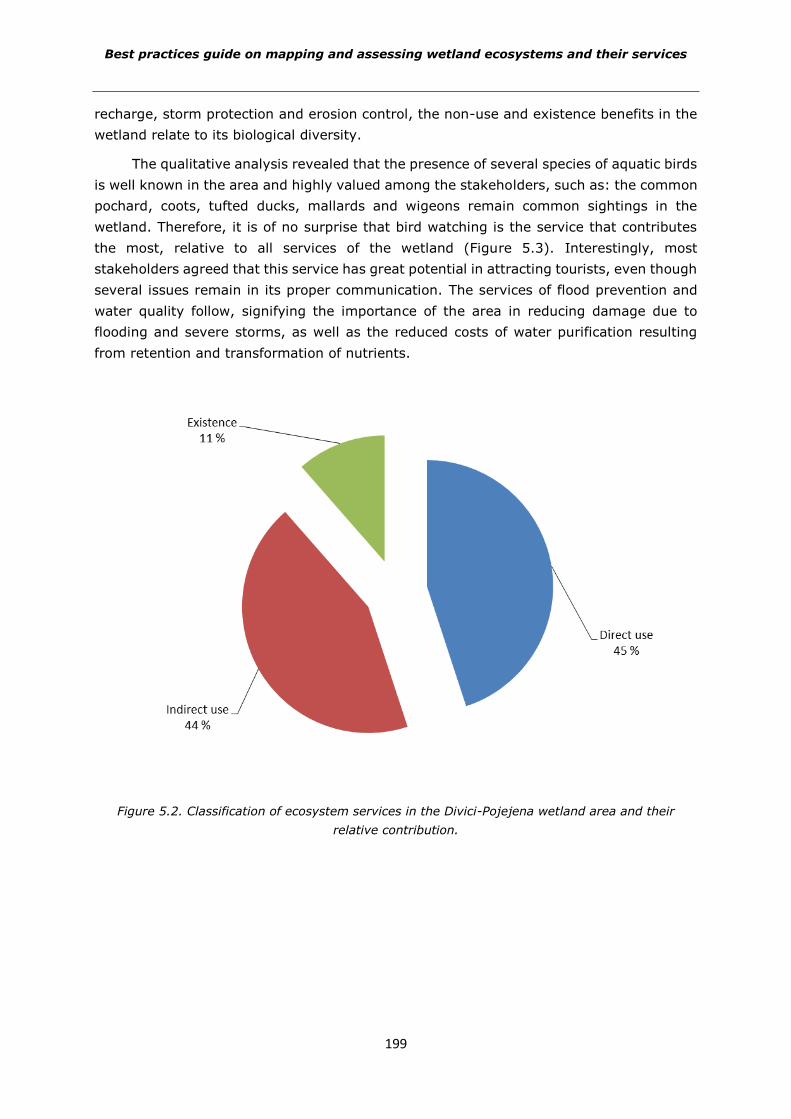
Best practices guide on mapping and assessing wetland ecosystems and their services
199
recharge, storm protection and erosion control, the non-use and existence benefits in the
wetland relate to its biological diversity.
The qualitative analysis revealed that the presence of several species of aquatic birds
is well known in the area and highly valued among the stakeholders, such as: the common
pochard, coots, tufted ducks, mallards and wigeons remain common sightings in the
wetland. Therefore, it is of no surprise that bird watching is the service that contributes
the most, relative to all services of the wetland (Figure 5.3). Interestingly, most
stakeholders agreed that this service has great potential in attracting tourists, even though
several issues remain in its proper communication. The services of flood prevention and
water quality follow, signifying the importance of the area in reducing damage due to
flooding and severe storms, as well as the reduced costs of water purification resulting
from retention and transformation of nutrients.
Figure 5.2. Classification of ecosystem services in the Divici-Pojejena wetland area and their
relative contribution.
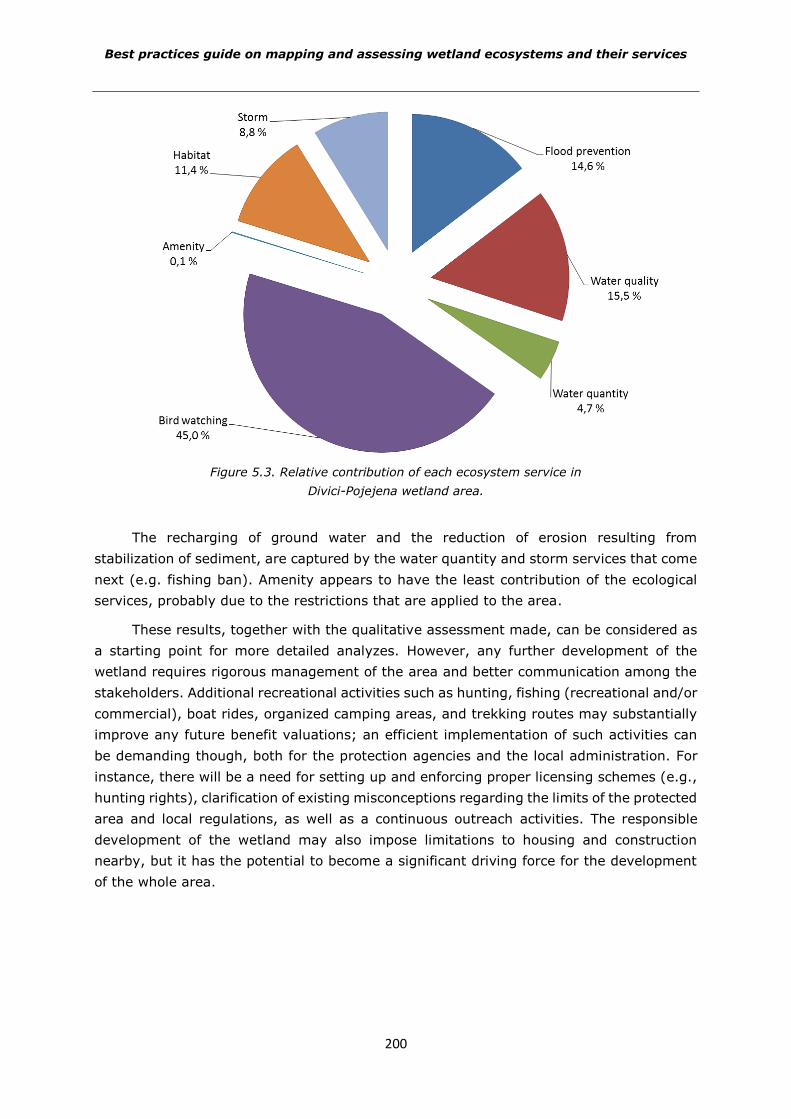
Best practices guide on mapping and assessing wetland ecosystems and their services
200
Figure 5.3. Relative contribution of each ecosystem service in
Divici-Pojejena wetland area.
The recharging of ground water and the reduction of erosion resulting from
stabilization of sediment, are captured by the water quantity and storm services that come
next (e.g. fishing ban). Amenity appears to have the least contribution of the ecological
services, probably due to the restrictions that are applied to the area.
These results, together with the qualitative assessment made, can be considered as
a starting point for more detailed analyzes. However, any further development of the
wetland requires rigorous management of the area and better communication among the
stakeholders. Additional recreational activities such as hunting, fishing (recreational and/or
commercial), boat rides, organized camping areas, and trekking routes may substantially
improve any future benefit valuations; an efficient implementation of such activities can
be demanding though, both for the protection agencies and the local administration. For
instance, there will be a need for setting up and enforcing proper licensing schemes (e.g.,
hunting rights), clarification of existing misconceptions regarding the limits of the protected
area and local regulations, as well as a continuous outreach activities. The responsible
development of the wetland may also impose limitations to housing and construction
nearby, but it has the potential to become a significant driving force for the development
of the whole area.
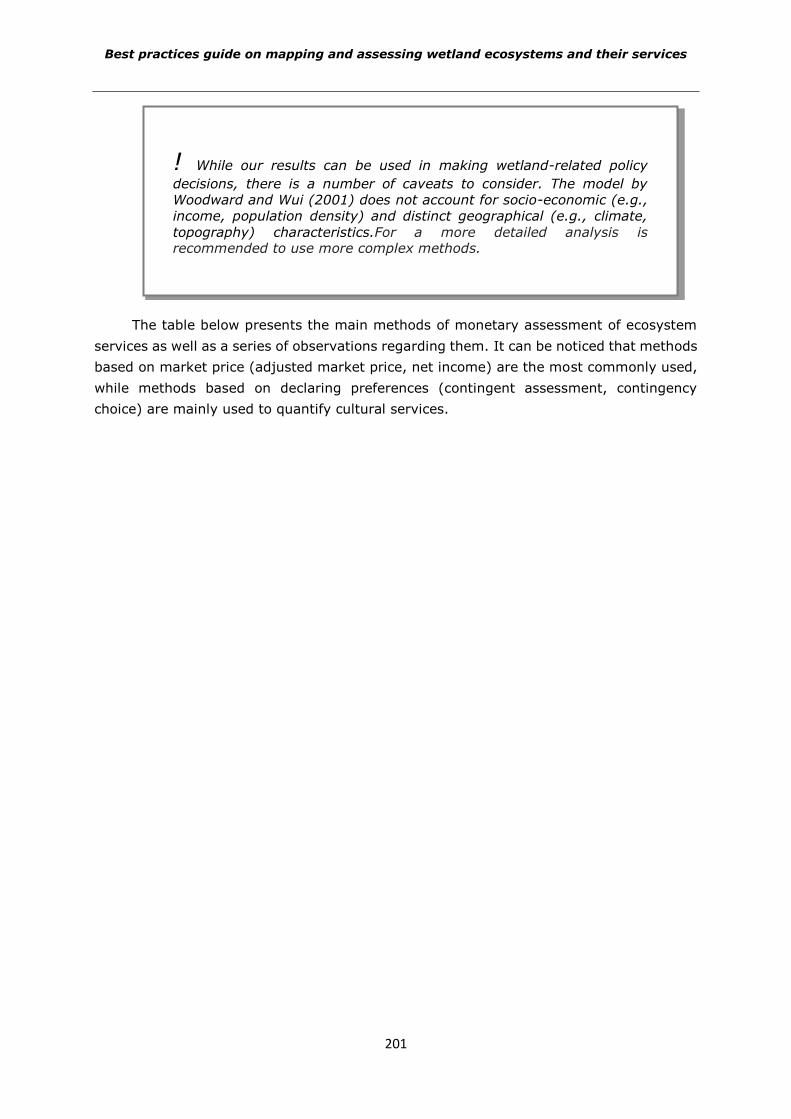
Best practices guide on mapping and assessing wetland ecosystems and their services
201
The table below presents the main methods of monetary assessment of ecosystem
services as well as a series of observations regarding them. It can be noticed that methods
based on market price (adjusted market price, net income) are the most commonly used,
while methods based on declaring preferences (contingent assessment, contingency
choice) are mainly used to quantify cultural services.
! While our results can be used in making wetland-related policy
decisions, there is a number of caveats to consider. The model by
Woodward and Wui (2001) does not account for socio-economic (e.g.,
income, population density) and distinct geographical (e.g., climate,
topography) characteristics.For a more detailed analysis is recommended to use more complex methods.
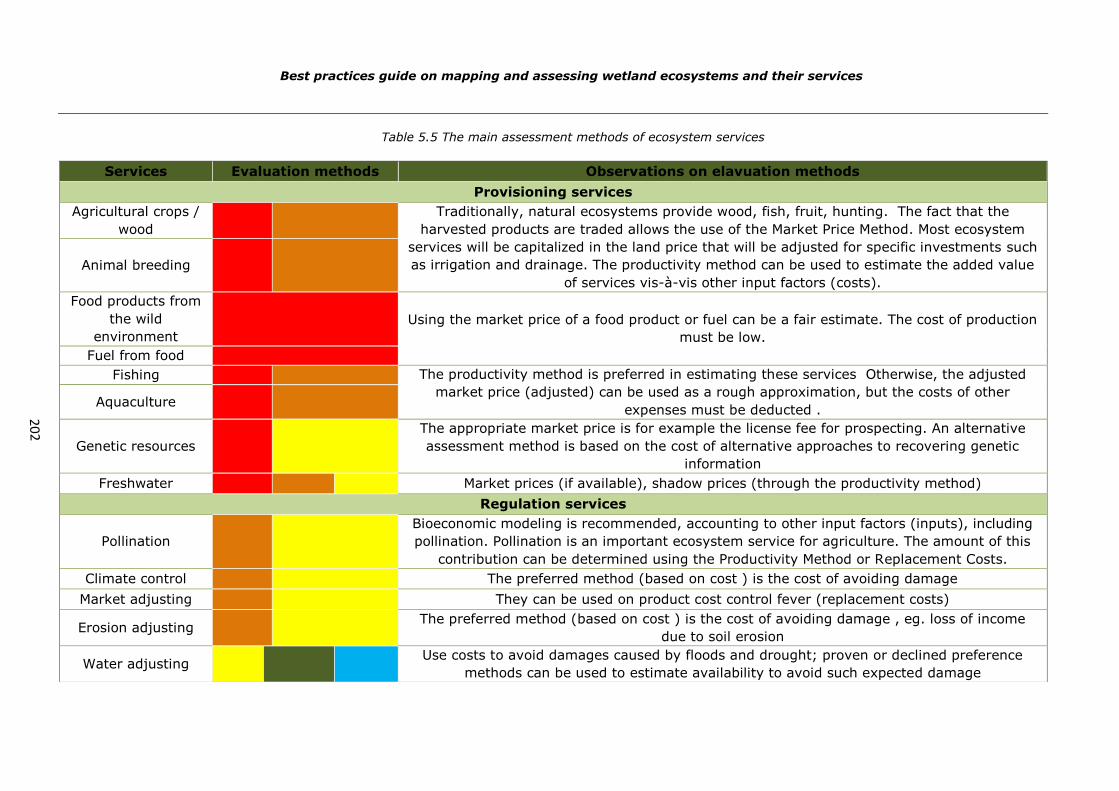
20
2
Table 5.5 The main assessment methods of ecosystem services
Services Evaluation methods Observations on elavuation methods
Provisioning services
Agricultural crops /
wood
Traditionally, natural ecosystems provide wood, fish, fruit, hunting. The fact that the
harvested products are traded allows the use of the Market Price Method. Most ecosystem
services will be capitalized in the land price that will be adjusted for specific investments such
as irrigation and drainage. The productivity method can be used to estimate the added value
of services vis-à-vis other input factors (costs).
Animal breeding
Food products from
the wild
environment
Using the market price of a food product or fuel can be a fair estimate. The cost of production
must be low.
Fuel from food
Fishing The productivity method is preferred in estimating these services Otherwise, the adjusted
market price (adjusted) can be used as a rough approximation, but the costs of other
expenses must be deducted . Aquaculture
Genetic resources
The appropriate market price is for example the license fee for prospecting. An alternative
assessment method is based on the cost of alternative approaches to recovering genetic
information
Freshwater Market prices (if available), shadow prices (through the productivity method)
Regulation services
Pollination
Bioeconomic modeling is recommended, accounting to other input factors (inputs), including
pollination. Pollination is an important ecosystem service for agriculture. The amount of this
contribution can be determined using the Productivity Method or Replacement Costs.
Climate control The preferred method (based on cost ) is the cost of avoiding damage
Market adjusting They can be used on product cost control fever (replacement costs)
Erosion adjusting The preferred method (based on cost ) is the cost of avoiding damage , eg. loss of income
due to soil erosion
Water adjusting Use costs to avoid damages caused by floods and drought; proven or declined preference
methods can be used to estimate availability to avoid such expected damage
Best practices guide on mapping and assessing wetland ecosystems and their services
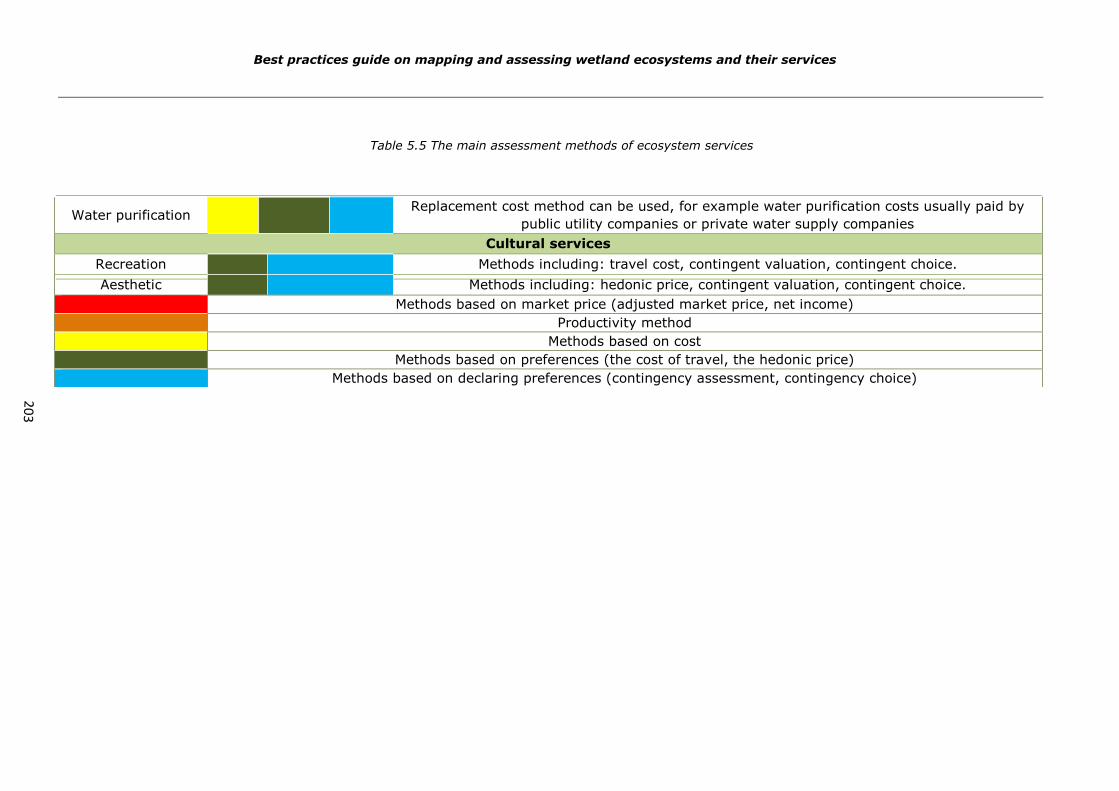
20
3
Water purification Replacement cost method can be used, for example water purification costs usually paid by
public utility companies or private water supply companies
Cultural services
Recreation Methods including: travel cost, contingent valuation, contingent choice.
Aesthetic Methods including: hedonic price, contingent valuation, contingent choice.
Methods based on market price (adjusted market price, net income)
Productivity method
Methods based on cost
Methods based on preferences (the cost of travel, the hedonic price)
Methods based on declaring preferences (contingency assessment, contingency choice)
Best practices guide on mapping and assessing wetland ecosystems and their services
Table 5.5 The main assessment methods of ecosystem services
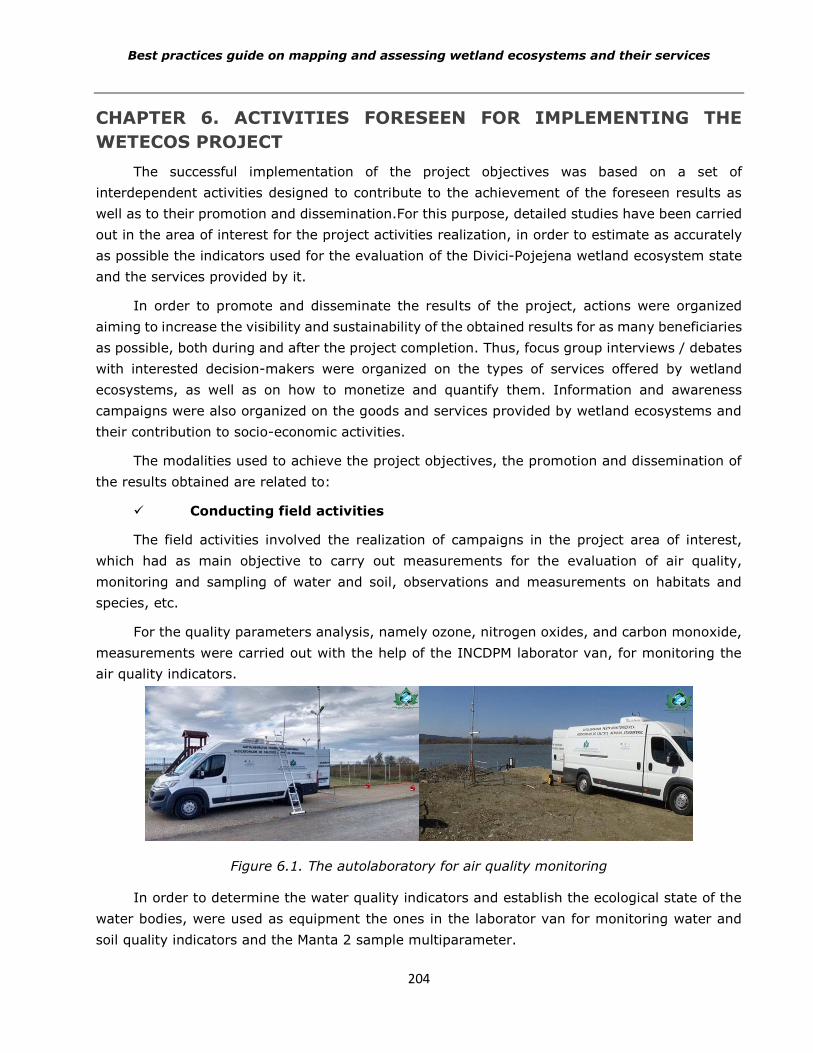
Best practices guide on mapping and assessing wetland ecosystems and their services
204
CHAPTER 6. ACTIVITIES FORESEEN FOR IMPLEMENTING THE
WETECOS PROJECT
The successful implementation of the project objectives was based on a set of
interdependent activities designed to contribute to the achievement of the foreseen results as
well as to their promotion and dissemination.For this purpose, detailed studies have been carried
out in the area of interest for the project activities realization, in order to estimate as accurately
as possible the indicators used for the evaluation of the Divici-Pojejena wetland ecosystem state
and the services provided by it.
In order to promote and disseminate the results of the project, actions were organized
aiming to increase the visibility and sustainability of the obtained results for as many beneficiaries
as possible, both during and after the project completion. Thus, focus group interviews / debates
with interested decision-makers were organized on the types of services offered by wetland
ecosystems, as well as on how to monetize and quantify them. Information and awareness
campaigns were also organized on the goods and services provided by wetland ecosystems and
their contribution to socio-economic activities.
The modalities used to achieve the project objectives, the promotion and dissemination of
the results obtained are related to:
Conducting field activities
The field activities involved the realization of campaigns in the project area of interest,
which had as main objective to carry out measurements for the evaluation of air quality,
monitoring and sampling of water and soil, observations and measurements on habitats and
species, etc.
For the quality parameters analysis, namely ozone, nitrogen oxides, and carbon monoxide,
measurements were carried out with the help of the INCDPM laborator van, for monitoring the
air quality indicators.
Figure 6.1. The autolaboratory for air quality monitoring
In order to determine the water quality indicators and establish the ecological state of the
water bodies, were used as equipment the ones in the laborator van for monitoring water and
soil quality indicators and the Manta 2 sample multiparameter.
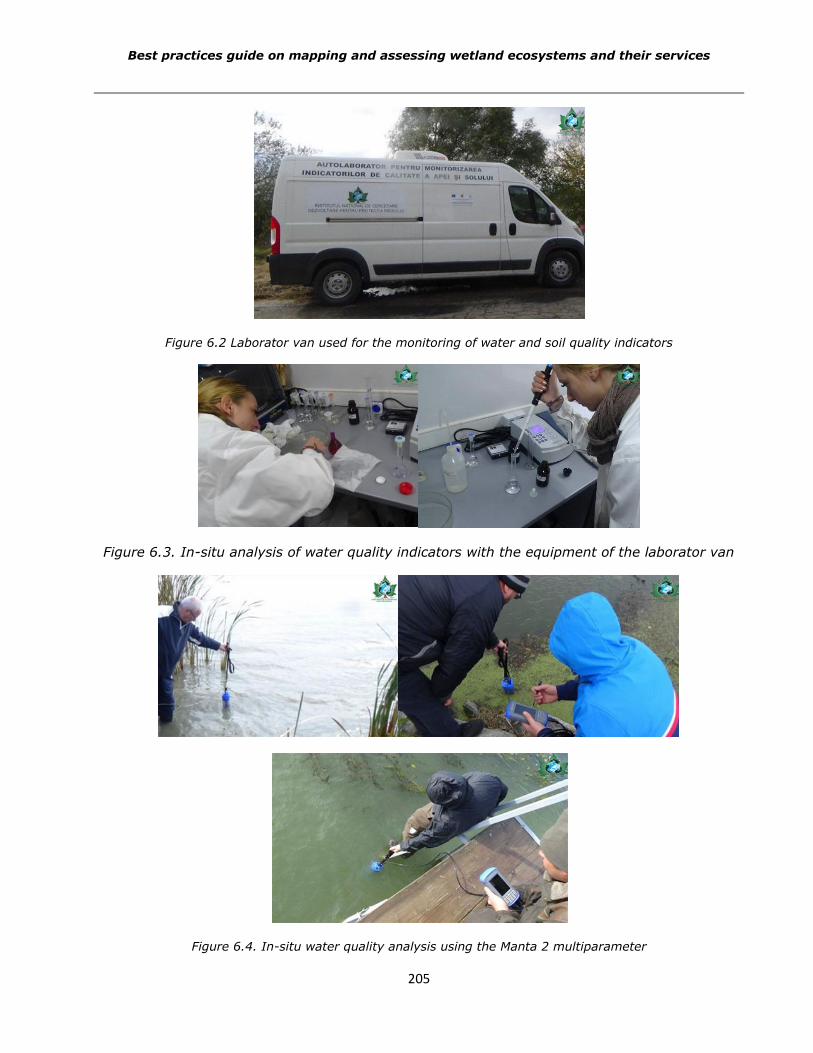
Best practices guide on mapping and assessing wetland ecosystems and their services
205
Figure 6.2 Laborator van used for the monitoring of water and soil quality indicators
Figure 6.3. In-situ analysis of water quality indicators with the equipment of the laborator van
Figure 6.4. In-situ water quality analysis using the Manta 2 multiparameter
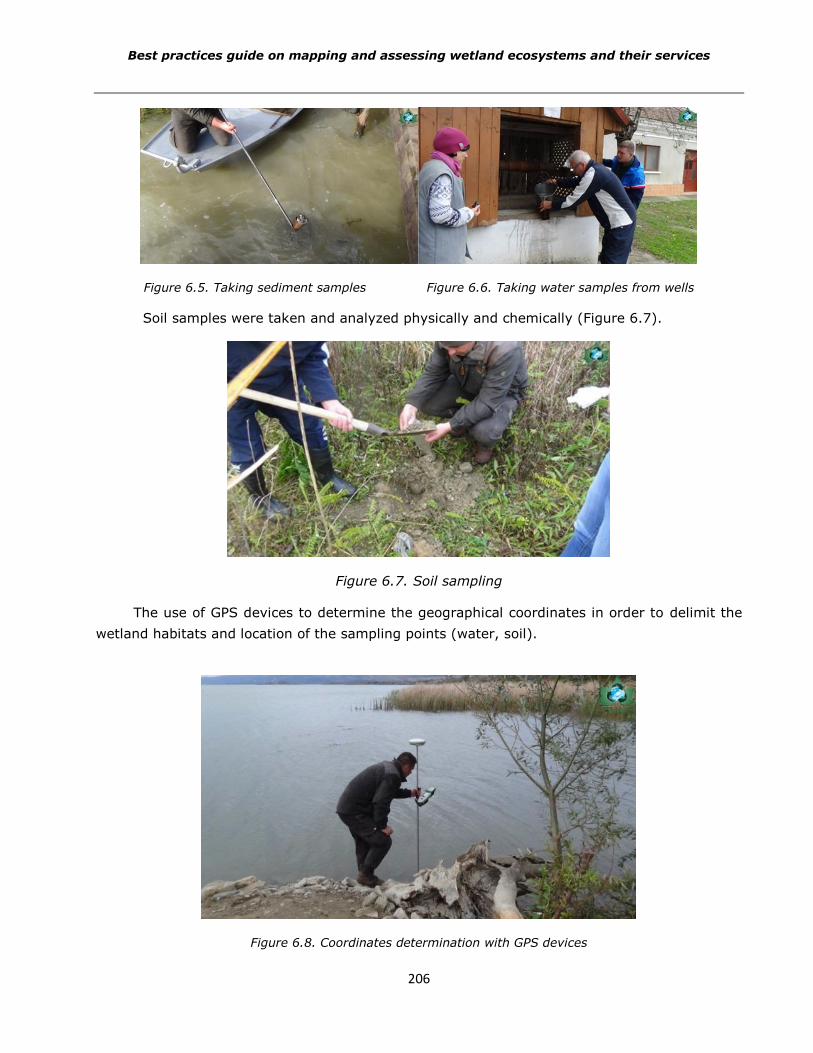
Best practices guide on mapping and assessing wetland ecosystems and their services
206
Figure 6.5. Taking sediment samples Figure 6.6. Taking water samples from wells
Soil samples were taken and analyzed physically and chemically (Figure 6.7).
Figure 6.7. Soil sampling
The use of GPS devices to determine the geographical coordinates in order to delimit the
wetland habitats and location of the sampling points (water, soil).
Figure 6.8. Coordinates determination with GPS devices
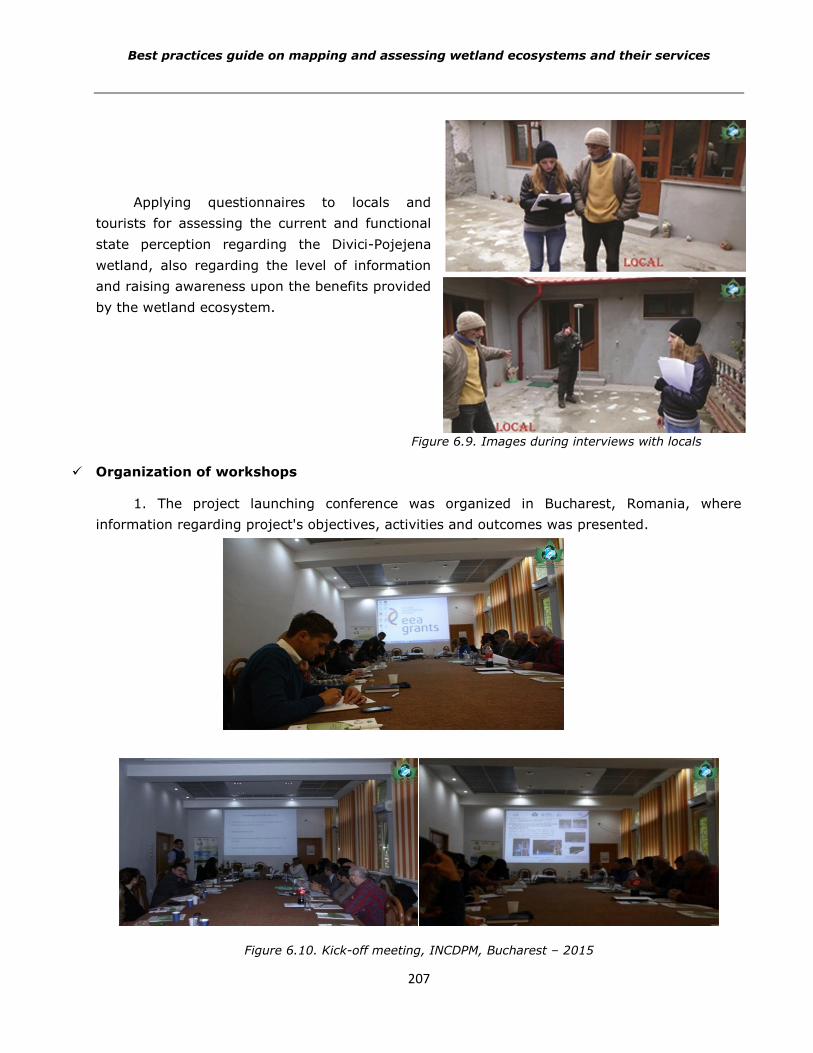
Best practices guide on mapping and assessing wetland ecosystems and their services
207
Applying questionnaires to locals and
tourists for assessing the current and functional
state perception regarding the Divici-Pojejena
wetland, also regarding the level of information
and raising awareness upon the benefits provided
by the wetland ecosystem.
Figure 6.9. Images during interviews with locals
Organization of workshops
1. The project launching conference was organized in Bucharest, Romania, where
information regarding project's objectives, activities and outcomes was presented.
Figure 6.10. Kick-off meeting, INCDPM, Bucharest – 2015
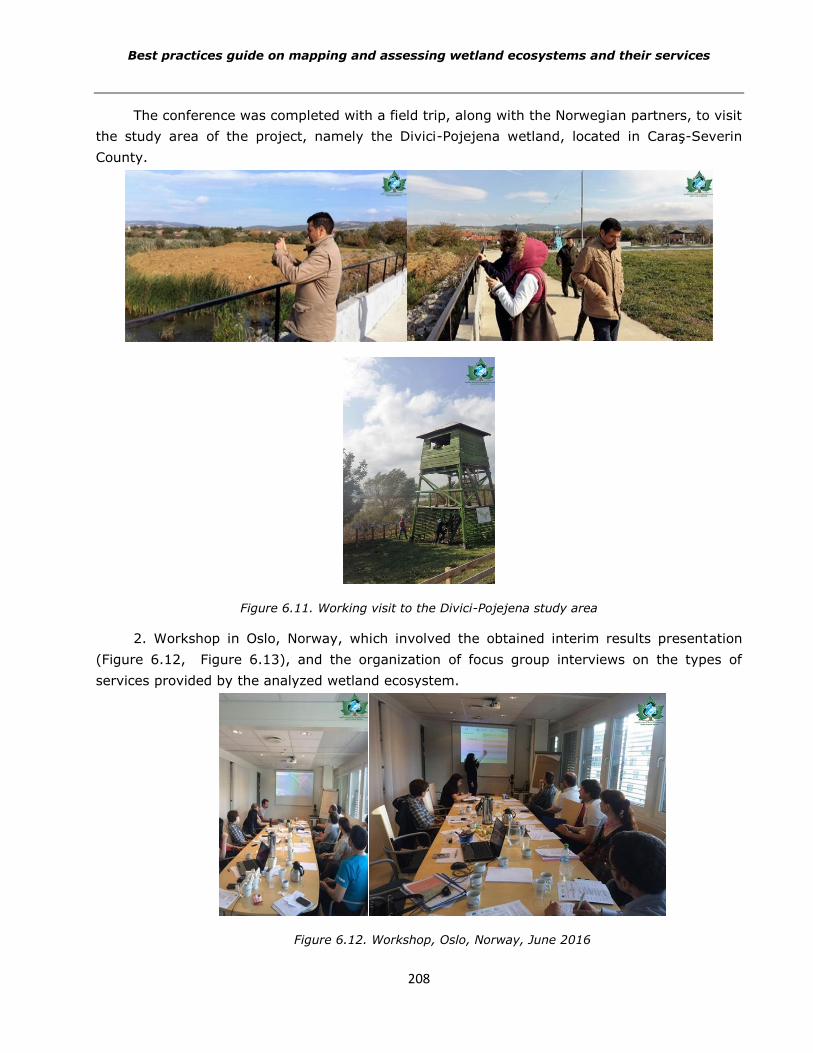
Best practices guide on mapping and assessing wetland ecosystems and their services
208
The conference was completed with a field trip, along with the Norwegian partners, to visit
the study area of the project, namely the Divici-Pojejena wetland, located in Caraş-Severin
County.
Figure 6.11. Working visit to the Divici-Pojejena study area
2. Workshop in Oslo, Norway, which involved the obtained interim results presentation
(Figure 6.12, Figure 6.13), and the organization of focus group interviews on the types of
services provided by the analyzed wetland ecosystem.
Figure 6.12. Workshop, Oslo, Norway, June 2016
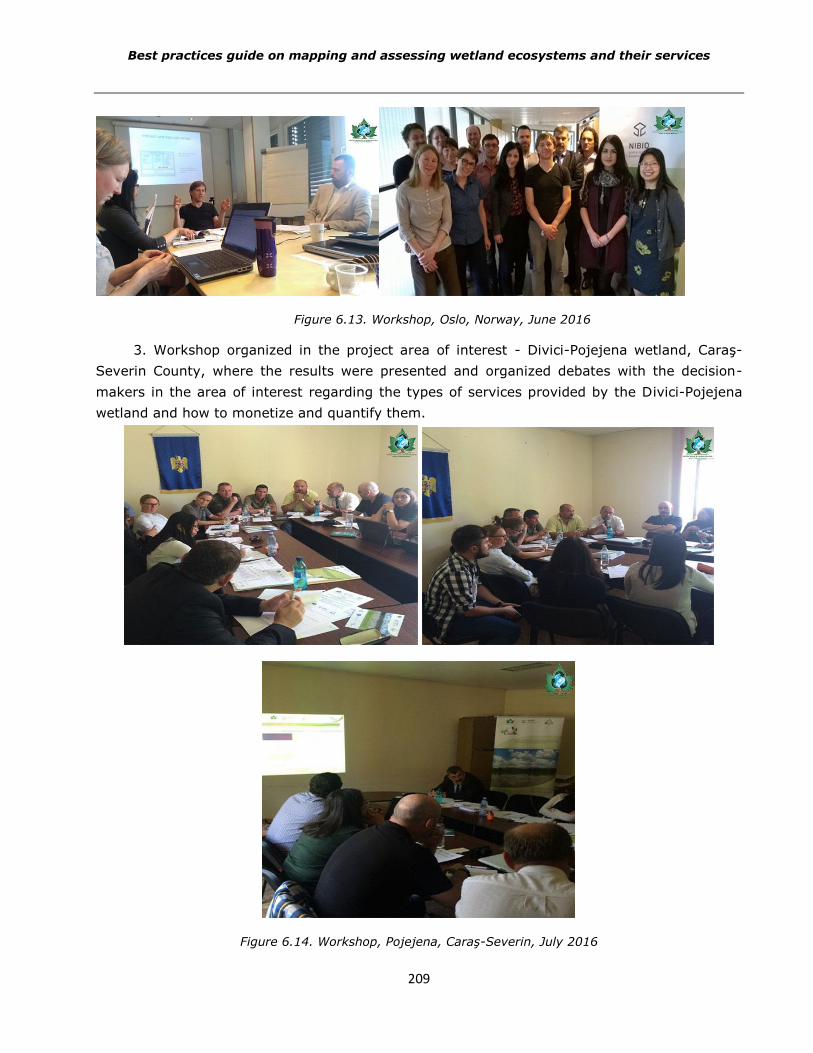
Best practices guide on mapping and assessing wetland ecosystems and their services
209
Figure 6.13. Workshop, Oslo, Norway, June 2016
3. Workshop organized in the project area of interest - Divici-Pojejena wetland, Caraş-
Severin County, where the results were presented and organized debates with the decision-
makers in the area of interest regarding the types of services provided by the Divici-Pojejena
wetland and how to monetize and quantify them.
Figure 6.14. Workshop, Pojejena, Caraş-Severin, July 2016
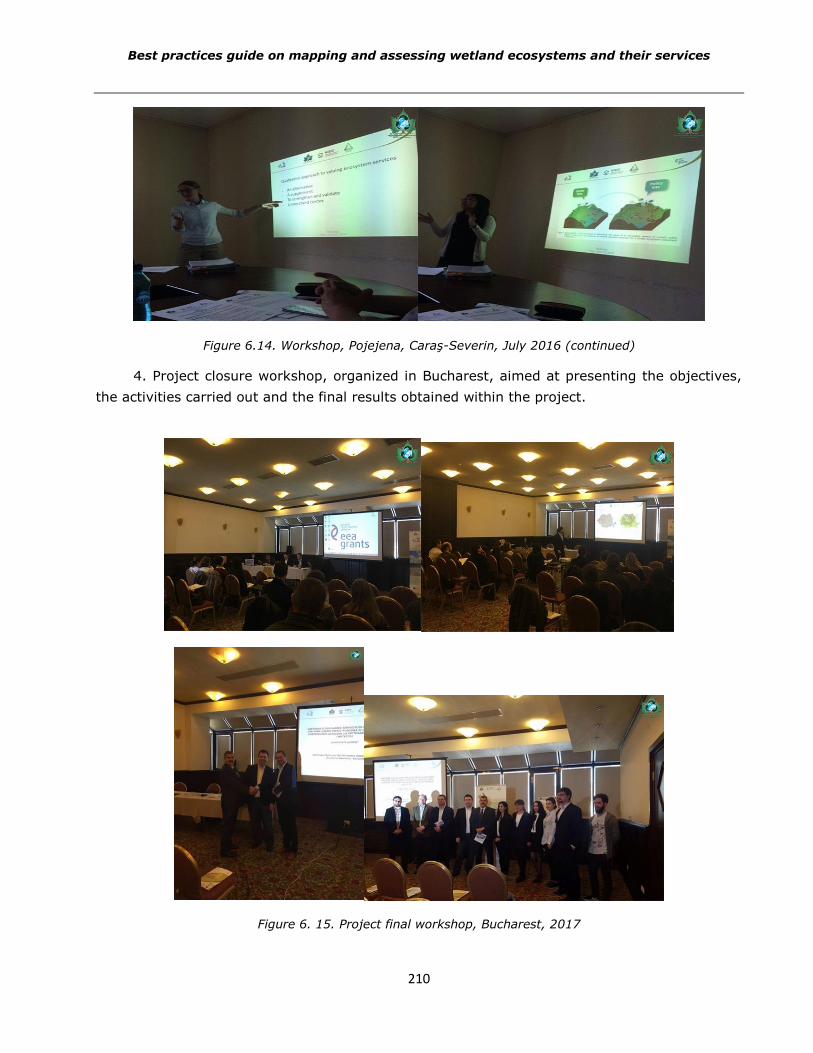
Best practices guide on mapping and assessing wetland ecosystems and their services
210
Figure 6.14. Workshop, Pojejena, Caraş-Severin, July 2016 (continued)
4. Project closure workshop, organized in Bucharest, aimed at presenting the objectives,
the activities carried out and the final results obtained within the project.
Figure 6. 15. Project final workshop, Bucharest, 2017
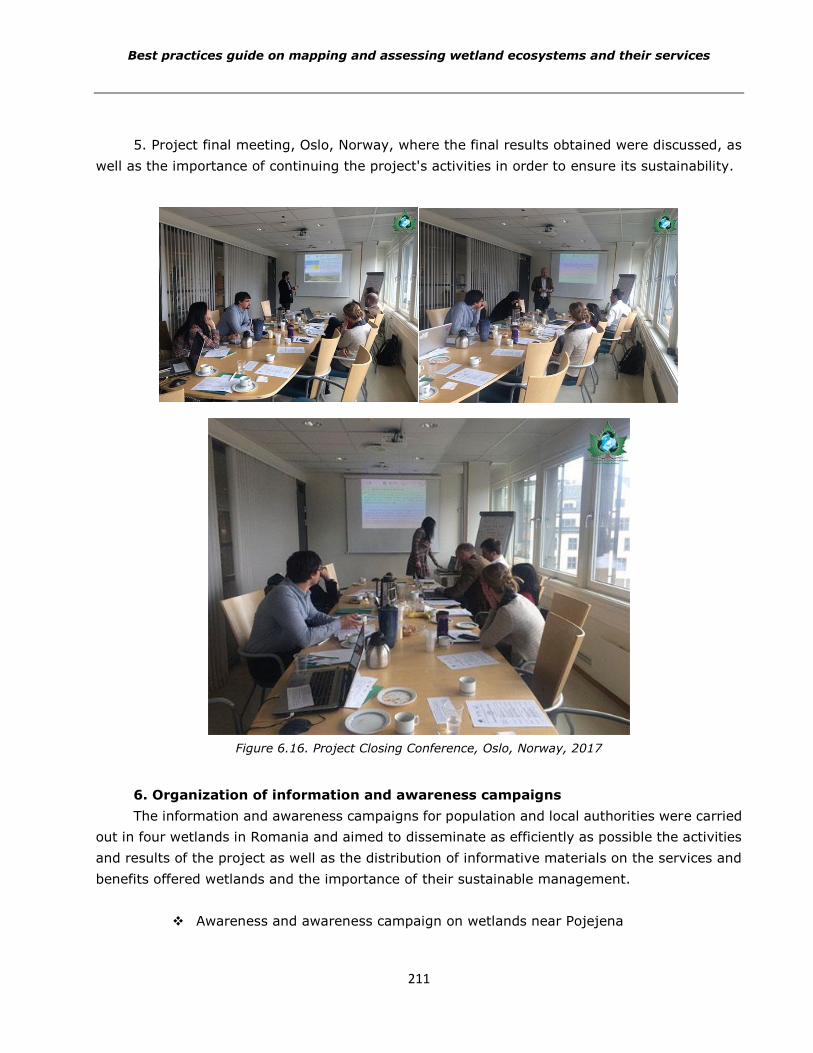
Best practices guide on mapping and assessing wetland ecosystems and their services
211
5. Project final meeting, Oslo, Norway, where the final results obtained were discussed, as
well as the importance of continuing the project's activities in order to ensure its sustainability.
Figure 6.16. Project Closing Conference, Oslo, Norway, 2017
6. Organization of information and awareness campaigns
The information and awareness campaigns for population and local authorities were carried
out in four wetlands in Romania and aimed to disseminate as efficiently as possible the activities
and results of the project as well as the distribution of informative materials on the services and
benefits offered wetlands and the importance of their sustainable management.
Awareness and awareness campaign on wetlands near Pojejena
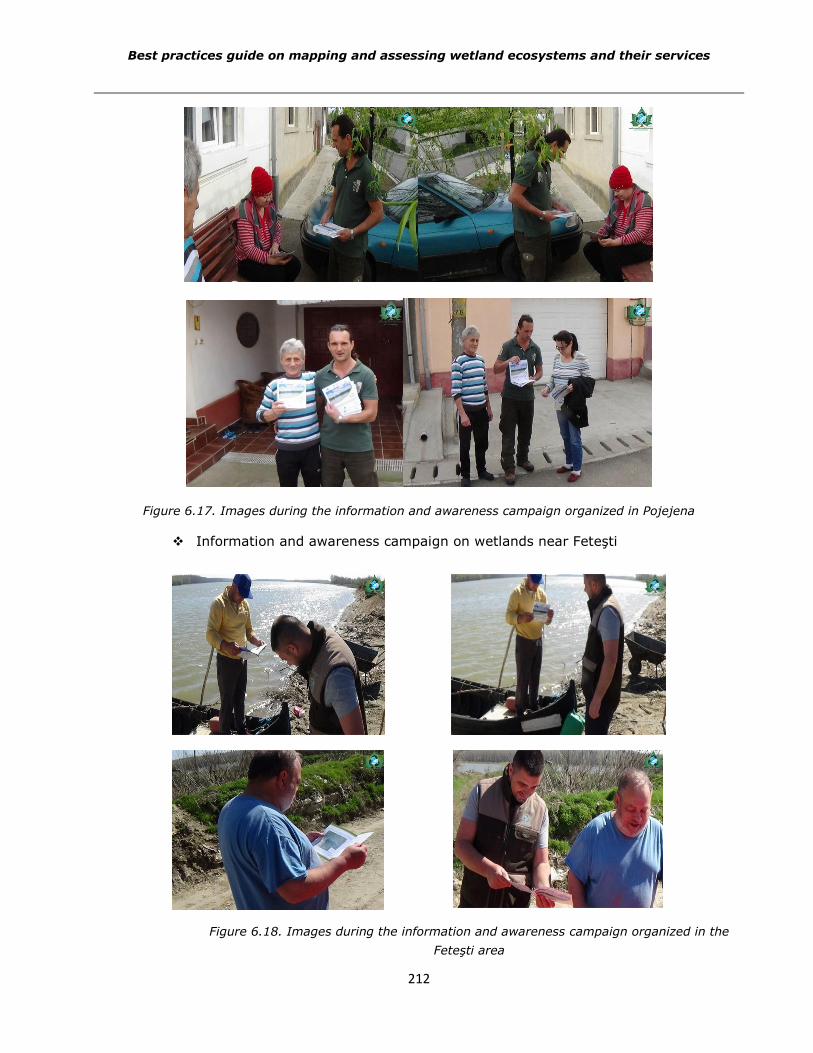
Best practices guide on mapping and assessing wetland ecosystems and their services
212
Figure 6.17. Images during the information and awareness campaign organized in Pojejena
Information and awareness campaign on wetlands near Feteşti
Figure 6.18. Images during the information and awareness campaign organized in the
Feteşti area
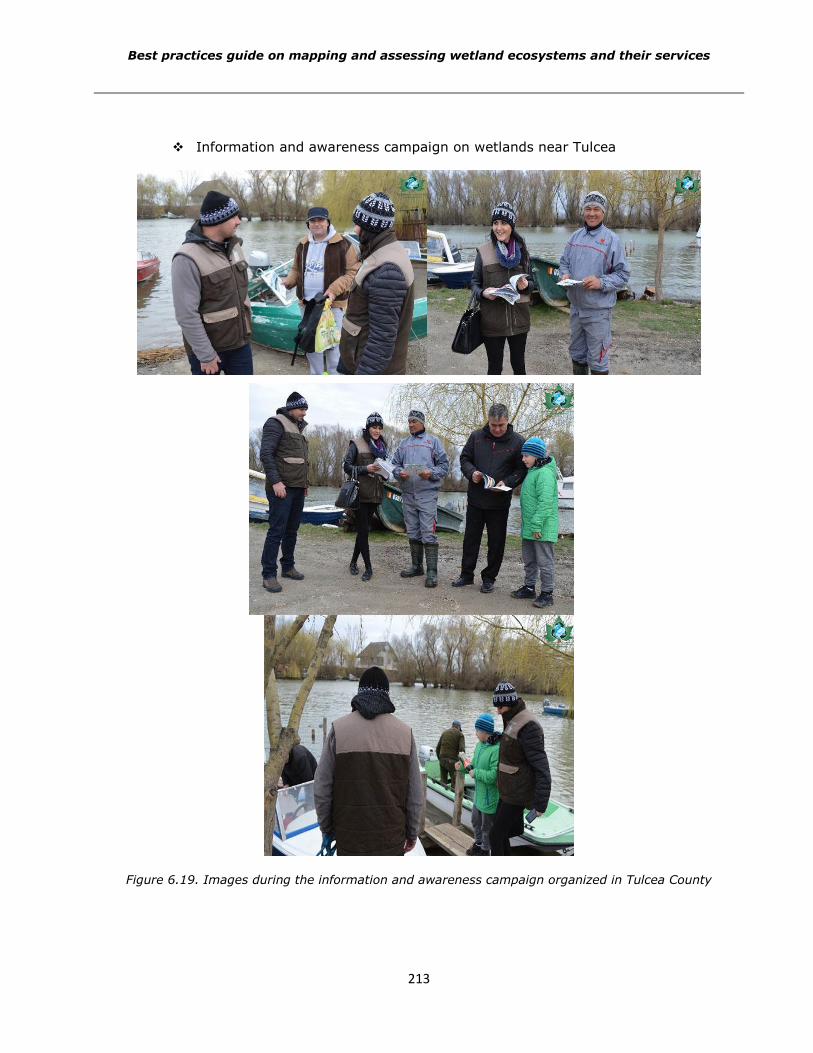
Best practices guide on mapping and assessing wetland ecosystems and their services
213
Information and awareness campaign on wetlands near Tulcea
Figure 6.19. Images during the information and awareness campaign organized in Tulcea County
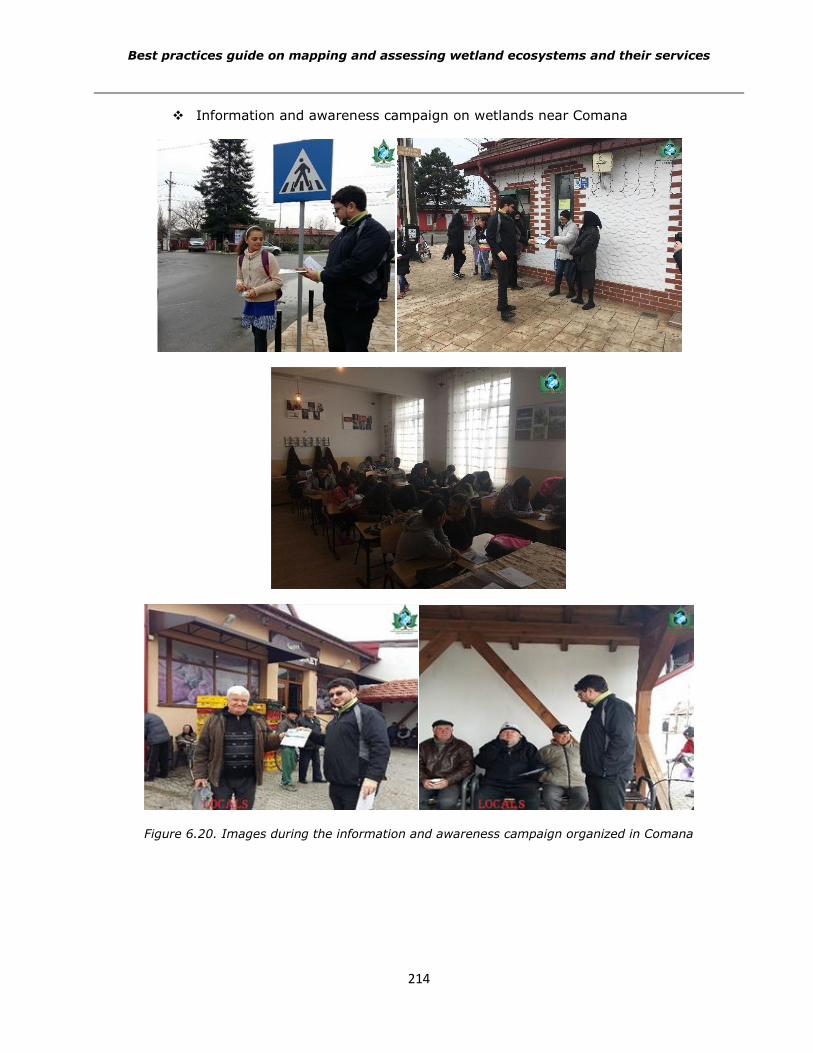
Best practices guide on mapping and assessing wetland ecosystems and their services
214
Information and awareness campaign on wetlands near Comana
Figure 6.20. Images during the information and awareness campaign organized in Comana
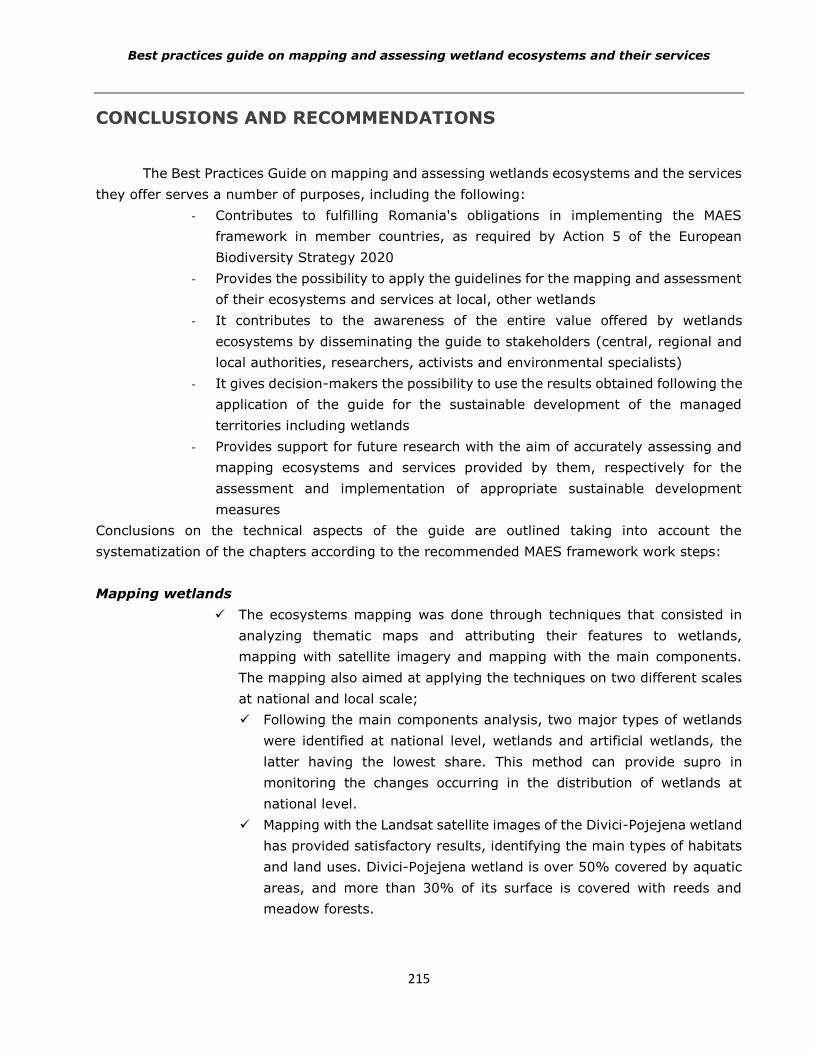
Best practices guide on mapping and assessing wetland ecosystems and their services
215
CONCLUSIONS AND RECOMMENDATIONS
The Best Practices Guide on mapping and assessing wetlands ecosystems and the services
they offer serves a number of purposes, including the following:
- Contributes to fulfilling Romania's obligations in implementing the MAES
framework in member countries, as required by Action 5 of the European
Biodiversity Strategy 2020
- Provides the possibility to apply the guidelines for the mapping and assessment
of their ecosystems and services at local, other wetlands
- It contributes to the awareness of the entire value offered by wetlands
ecosystems by disseminating the guide to stakeholders (central, regional and
local authorities, researchers, activists and environmental specialists)
- It gives decision-makers the possibility to use the results obtained following the
application of the guide for the sustainable development of the managed
territories including wetlands
- Provides support for future research with the aim of accurately assessing and
mapping ecosystems and services provided by them, respectively for the
assessment and implementation of appropriate sustainable development
measures
Conclusions on the technical aspects of the guide are outlined taking into account the
systematization of the chapters according to the recommended MAES framework work steps:
Mapping wetlands
The ecosystems mapping was done through techniques that consisted in
analyzing thematic maps and attributing their features to wetlands,
mapping with satellite imagery and mapping with the main components.
The mapping also aimed at applying the techniques on two different scales
at national and local scale;
Following the main components analysis, two major types of wetlands
were identified at national level, wetlands and artificial wetlands, the
latter having the lowest share. This method can provide supro in
monitoring the changes occurring in the distribution of wetlands at
national level.
Mapping with the Landsat satellite images of the Divici-Pojejena wetland
has provided satisfactory results, identifying the main types of habitats
and land uses. Divici-Pojejena wetland is over 50% covered by aquatic
areas, and more than 30% of its surface is covered with reeds and
meadow forests.
Best practices guide on mapping and assessing wetland ecosystems and their services
216
Wetland condition
Pressures on wetlands and in particular for the Divici-Pojejena wetland
were quantified on the basis of specific indicators for the main
categories: habitat change, climate change, over-exploitation, invasive
species, and pollution and nutrient enrichment. On the basis of the
analyzed indicators it can be concluded that the Divici-Pojejena wetland
is characterized by a large fragmentation of the component habitats,
while the land occupancy was insignificantly modified during the
analyzed period: 2006-2014. With regard to pressures from climate
change, the analysis shows their influence on wetlands by the
distribution of rainfall and the average air temperature. The wetland
compared to the current period, where no significant impact of the
climate change phenomenon has been signaled, may suffer in a future
temporal horizon, various modifications that may disrupt the ecosystem
specific to the analyzed area. Identifying the number of invasive species
for the wetland Divici-Pojejena consisted in taking over and processing
the data existing in previous local studies and attesting to their presence
following field trips to conduct scientific fishing and investigations on
plants and vertebrates. Regarding the pressures caused by pollution and
nutrient enrichment, indicators corresponding to air, water and soil
factors were quantified. The pressures caused by exploitation have been
identified on the basis of indicators for intensive land use, water
resource exploitation, fishing, reed harvesting, tourism and recreation.
The results of the analysis show that the use of land in the Divici-
Pojejena wetland area, the practice of unorganized tourism and
poaching pose a threat to the wetland.
The assessment of ecosystem components consisted ofindicators
quantification such as those related to water and soil quality, water
quantity as well as status, distribution and trends of species and
habitats. These indicators illustrate the cumulative effect of pressures
on the ecosystem over time.
The relationships between pressures and ecosystem components can be
traced on the basis of the indicators presented, and on the basis of the
results, measures can be taken to improve the state.
Ecosystem services
Provisioning services: The analysis shows that the population does not
benefit from these dervishes of the wetland ecosystem, its potential to
offer goods as unknown (as in the case of reed), unexploited (in the
Best practices guide on mapping and assessing wetland ecosystems and their services
217
case of water and wood) or forbidden for exploitation (in the case of
fisheries).
Regulation and maintenance services: the most representative services
are carbon sequestration, nutrient retention, and abundance of species.
The indicators of these services were mostly quantified by field
measurements and observations, lacking data sources.
Cultural services: The data needed to analyze these services are
accessible and easy to interpret, except for some space-time coverage
limitations. From the analysis based on the tourist eligibility indicator it
follows that in Romania the wetlands are poorly capitalized are the
aspect of tourism activities, with the exception of two areas, the Danube
Delta between the Sulina branch and the Razim-Sinoe lakes and the
Danube Delta.
- Economic assessment of ecosystem services
The annual value of the ecosystem services in the wetland Divici-
Pojejena is estimated to be approximately 1,124,000 RON.
Recomandations
Establishment of sustainability limits for the exploitation of ecosystem services: it
is necessary to release the potential offered by these ecosystems without
endangering the ecosystem status components. It is the case of fishing, the
exploitation of over-reared and invasive aquatic plants and plants, activities for
which good practices and indicators with thresholds that can not be exceeded can
be established. The subsequent challenge will consist of following and observing
these practices and limits.
Assessing and integrating the demand and needs of the population is one of the
issues that require attention in ecosystem assessment. For example, we report the
need to protect the population against natural hazards which, in the case of
settlements situated in the proximity of the wetland Divici-Pojejena, may represent
a risk for the elimination of which it is necessary to adopt solutions. This type of
solution must be considered in an integrated way, taking into account both the
protection aspects of ecosystems and the requirements and needs of the
population, namely the economic factor.
The case study is an example of applying and extrapolating the methodology to
other wetland ecosystems. Local scale analysis is relevant to the "bottom-up"
approach of the ecosystem services evaluation process at regional and national
level by extrapolating the results. Also, the case study may be useful for top-down
approach (from national to regional or local) to assess the effects of measures (eg
legislative measures for the exploitation and protection of ecosystems) and
Best practices guide on mapping and assessing wetland ecosystems and their services
218
calibration of assessment methods for the ecosystems and the services provided
by them.
The results of the analysis presented in this guide contribute to a better understanding of the
requirements established by the MAES framework through local evaluation and identification of
data gaps as well as identifying the need for harmonization with the nationally assessed
indicators. Thus, this guide contributes to the process of mapping and assessing ecosystems and
services as well as integrating the analysis of the status of ecosystems with the services they
offer.
Best practices guide on mapping and assessing wetland ecosystems and their services
219
REFERENCES
Academy of the Socialist Republic of Romania, 1969. Geography of the Romanian Danube Valley.
Bucharest: Editura Academiei R.S.R ..
Acreman M.C. [et al.],Hydrological science and wetland restoration - some case studies from
Europe [Journal]// Hydrology and Earth System Sciences. - 2007.- 1: Vol. 11.- pp. 158-169.
Adamowicz, Wiktor L. 2004. “What’s It Worth? An Examination of Historical Trends and Future
Directions in Environmental Valuation*” The Australian Journal of Agricultural and Resource
Economics 48 (3). Blackwell Publishing Asia Pty Ltd: 419–43.
Akula, V. R., 2013. Wetland biomass - suitable for biogas production?. Halmstad, Sweden: Master
thesis in Applied environmental Science.
ANCPI, 2016. Updated administrative boundaries. Bucharest: s.n.
Antonescu, C. S., Water Biology, Didactic and Pedagogical Publishing House, 1963
Bailey, Robert G. „Delineation of Ecosystem Regions.” Environmental Management (Springer-
Verlag New York Inc) 7, nr. 4 (1983): 365-373.
Bailey, Robert G. A Genetic Approach to Mapping Ecosystems. Rockey Mountain Research Station:
USDA Forest Service, 2007.
Banko, G. et al., 2013. Developing conceptual framework for ecosystem mapping, Malaga: EEA.
BARBIER, E. B., ACREMAN, M. & KNOWLER, D., 1997. Economic Valuation of Wetlands: A guide
for policy makers and planners, Gland, Switzerland: Ramsar Convention Bureau.
Berca Mihai, Problems of soil ecology [Book] .- [s.l.]: www.cartesiarte.ro online edition, 2008.
Bergstrom, J. C. and De Civita, P. (1999), Status of Benefits Transfer in the United States and
Canada: A Review. Canadian Journal of Agricultural Economics, 47:79–87.
BirdLife International and Handbook of the Birds of the World, 2016. Bird species distribution
maps of the world. Version 6.0., s.l.: s.n.
Blaschke, T., 2010. Object based image analysis for remote sensin. ISPRS Journal of
Photogrammetry and Remote Sensing, Volumul 65, pp. 2-16.
Bogdan, M. A., 2009. Remote sensing - Fundamental notions and principles. Bucharest:
University Publishing House of Bucharest.
Best practices guide on mapping and assessing wetland ecosystems and their services
220
Boger, A; Littig, B.; Menz, W. (2009): Interviewing Experts. Palgrave Macmillan.
Brander LM, Florax RJG, Vermaat JE (2006) The empirics of wetland valuation: a comprehensive
summary and a meta-analysis of the literature. Environ Resour Econ 33:223–250.
Brouwer, R. 2000. Environmental value transfer: state of the art and future prospects. Ecological
Economics, 32:137–152.
Brouwer, R., Martin-Ortega, J., Dekker, T., Sardonini, L., Andreu, J., Kontogianni, A., Skourtos,
M., Raggi, M., Viaggi, D., Pulido-Velazquez, M., Rolfe, J. and Windle, J. (2015), Improving value
transfer through socio-economic adjustments in a multi-country choice experiment of water
conservation alternatives. Australian Journal of Agricultural Resource Economics, 59: 458–478.
Budău, G, Câmpean, M., Lica, D., 2011, Reed-plant biomass – as renewable and low-polluting
energy resource. În revista “Environmental Engineering and Management Journal”, Iaşi.
Bularda, M. & Vişinescu, I., 2014. Conclusions of the Symposium: Boundary Danube Enclosures
- Present Problems. Brăila, Braila Agricultural Research and Development Station
Bullock A. and Acreman M.The role of wetlands in the hydrological cycle [Journal]// Hydrology
and Earth System Sciences.- 2003.- 3: Vol. 7.- pp. 358-389.
Busch, Malte, Alessandra La Notte, Valérie Laporte, and Markus Erhard. 2012. “Potentials of
Quantitative and Qualitative Approaches to Assessing Ecosystem Services.” Ecological Indicators
21: 89–103
Captain, N., 2016. International Day of Wetlands, APM Bucharest. Available at:
https://www.google.ro/url?sa=t&rct=j&q=&esrc=s&source=web&cd=2&cad=rja&uact=8&ved=
0ahUKEwiqzdjhv4HLAhXJ8XIKHUWsBAsQFggkMAE&url=http%3A%2F%2Fapmbuc.anpm.ro%2F
documents%2F16241%2F3657522%2FZonele%2Bumede%2B2016.ppt%2F990996fc-9927-
405b-ba34-0cd53455d5a6&usg
Chițu, Z., Șandric, I., Mihai , B. & Săvulescu, I., 2009. Evaluation of landslide susceptibility using
multivariate statistical methods: a case study in the Prahova subcarpathians, Romania.
Proceedings in Landslide Process: from geomorphological mapping to dynamic modelling, pp.
265-270.
Choi, H. & Sirakaya, E., 2006. Sustainability indicators for managing communitytourism. Tourism
Management, Volumul 27, pp. 1274-1289.
Ciobotaru, N. et al., 2016. Mapping Romanian wetlands - a geopgraphical approach. Water
Resources and Wetlands, 8-10 September, 1(3), pp. 220-227.
Best practices guide on mapping and assessing wetland ecosystems and their services
221
Ciocănea, Cristiana Maria, Carmen Sorescu, Mirela Ianoşi and Vasile Bagrinovschi. 2016.
“Assessing Public Perception on Protected Areas in Iron Gates Natural Park.” Procedia
Environmental Sciences 32. Elsevier: 70–79.
Ciucă, M., 1956. Le Paludisme en Roumanie de 1949 a 1955. Bulletin of World Health
Organization, Volumul 15, pp. 725-751.
Cogălniceanu Dan.Ecology and Environmental Protection [Book] .- Bucharest: Ministry of
Education and Research, 2007.
Conete Denisa.Diversity of Birds in Wetlands [Journal] // ECOS- Piteşti: [s.n.], 2005.- pp. 122-
125
Copernicus -EEA, 2015. Copernicus Land Monitoring Services. [Interactiv] Available at:
http://land.copernicus.eu/local/riparian-zones/view [Accesat Noiembrie 2015].
Corine land cover methodology and illustrations. 1994.
http://www.eea.europa.eu/publications/COR0-part1 (accesat 2015)
Costanza, R., dArge, R., de Groot, R., Farber, S., Grasso, M., Hannon, B., Limburg, K., Naeem,
S., Oneill, R.V., Paruelo, J., Raskin, R.G., Sutton, P., van den Belt, M., 1997. The value of the
world’s ecosystem services and natural capital. Nature 387, 253–260.
Council Directive 92/42 / EEC of 21 May 1992 on the conservation of natural habitats and of wild
fauna and flora
De Groot R, Fisher B, Christie M, Aronson J, Braat L, Gowdy J, Haines-Young R, Maltby E, Neuville
A, Polasky S, Portela R and Ring I (2010) Integrating the Ecological and Economic Dimensions in
Biodiversity and Ecosystem Service valuation. In: Pushpam K (ed.) The Economics of Ecosystems
and Biodiversity: Ecological and Economic Foundations, 9-40
de Martonne, E., 1926. Géographie physique. Aréisme et indice d'aridité. Gauthier-Villars, 2(9),
pp. 798-800.
de Martonne, E., 1926. Une nouvelle fonction climatologique: L’indice d’aridité. La Meteorologie,
pp. 449-458.
Decision no. 1081, 2013. National Strategy and Action Plan for Biodiversity Conservation 2014-
2020.
Decision no. 2151/2004 on establishing the protected natural area regime for new areas.
Best practices guide on mapping and assessing wetland ecosystems and their services
222
Demšar, U. et al., 2013. Principal component analysis on spatial data: an overview. Annals of the
Association of American Geographers, 103(1), pp. 106-128.
Directive 2000/60 / EC of the European Parliament and of the Council of 23 October 2000
establishing a framework for Community action in the field of water policy.
Donita, N., Popescu, A., Paucă-Comănescu, M., Mihăilescu, S., 2005. HABITATELE DIN ROMÂNIA.
Bucharest: Silvica Technical Publishing House.
EC, 2017. Official site. Available at: http://ec.europa.eu/
EEA, 1994. Corine land cover methodology and illustrations. [Interactiv] Available at:
http://www.eea.europa.eu/publications/COR0-part1. [Accesat 2015].
EEA, 1999. Environmental indicators:Typology and overview. Technical report No 25. Disponibil
la: http://reports.eea.eu.int/TEC25/en/tab_content_RLR.
EEA, 2007. CLC2006 technical guidelines, Copenhagen: European Environment Agency.
EEA, 2011-2013. Copernicus Land - Wetlands. [Interactiv] Available at:
http://land.copernicus.eu/pan-european/high-resolution-layers/wetlands/view. [Accesat 07
2016].
EEA, 2012. Technical report No 11/2012 - Streamlining European biodiversity indicators 2020:
Building a future on lessons learnt from the SEBI 2010 process, ISSN 1725-2237
EEA, 2013. Copernicus Land Monitoring Services. [Interactiv] Available at:
http://land.copernicus.eu/in-situ/eu-dem-derived-products/eu-dem.
EEA, 2013. Towards a Pan-European Ecosystem Assessment Methodology (ETC-SIA 2013), Final
Report, Spain.
EEA, 2015. Report No 5- Air quality in Europe, ISSN 1977-8449.
EEA, 2015. Technical Report No 6/2015. European ecosystem assessment - concept, data, and
implementation. Contribution to Target 2 Action 5 Mapping and Assessment of Ecosystems and
their Services (MAES) of the EU Biodiversity Strategy to 2020, Luxembourg.
EEA, 2015. www.eea.europa.eu. Available at: http://www.eea.europa.eu/data-and-
maps/indicators/use-of-freshwater-resources-2/assessment-1. [Accesat 25 03 2016]
EEA, 2016. Mapping and assessing the condition of Europe's ecosystems: progress and
challenges, EEA Report, No 3/2016
Best practices guide on mapping and assessing wetland ecosystems and their services
223
EEA, 2016. www.eea.europa.eu. Available at: http://www.eea.europa.eu/data-and-
maps/figures/water-exploitation-index-plus-wei. [Accesat 25 03 2016].
EEA. CLC2006 technical guidelines. Copenhagen: European Environment Agency, 2007
Elements of Ecology. Biotope. Biocoenosis. [Online] // www.eco-research.eu.- 03 2017.-
http://www.eco-research.eu/CURS%202%203%20ECO.pdf.
Emerton, L., 1998. Economic tools of valuing wetlands in East Africa. IUCN Eastern Africa
Programme, Economics and Biodiversity Programme., Nairobi: IUCN Eastern Africa Regional
Office.
European Commission newsletter, 2011. EU Biodiversity Strategy for 2020 December 2011.
European Commission, Our life insurance, our natural capital: an EU biodiversity strategy to 2020,
COM (2011) 244 final, Brussels, 2011.
European Commission, Water Scarcity & Droughts in the European Union, 2009
European Environment Agency, European Environment - Status and Perspective 2015: Synthesis
Report, Part 2, European Trend Evaluation, Copenhagen. AEM, 2015.
Eurostat, 2016. Available at: http://ec.europa.eu/eurostat/tgm/web/table/description.jsp.
[Accesat 02 03 2016]
Fahrig, L., 2003. Effects of habitat fragmentation on biodiversity. Annual review of ecology,
evolution, and systematics, 34(1), pp. 487-515
Findlay S. [et al.]Metabolic and structural response of hyporheic microbial communities to
variations in supply of dissolved organic matter [Journal]// Limnol. Oceanogr.. - 2003.- 4: Vol.
48.- pp. 1608-1617.
Gafta, D., Mpontford, J.O., 2008. Natura 2000 Habitats Interpretation Handbook in Romania,
PHARE Project "Implementation of the NATURA 2000 network in Romania".
Garcia-Nieto, A. et al., 2016. Collaborative mapping of ecosystem services: The role of
stakeholder's profile. Ecosystem Services, 13(2015), pp. 141-152.
Garibaldi L.A. and al et, Stability of pollination services decreases with isolation from natural
areas despite honey bee visits [Journal] // Ecology Letters. - 2011. - Vol. 14. - pp. 1062-1072.
Gâștescu, P. & Ciupitu, D., 2016. The wetlands - categories, functions, ecological reconstruction
and special management with special reference to Romania. Water resources and wetalnds, 1(3),
pp. 194-197.
Best practices guide on mapping and assessing wetland ecosystems and their services
224
Global Surface Water Explorer Application by Joint Research Center https://global-surface-
water.appspot.com/.
Google Earth, 2017. GoogleEarth Products - Places. s.l.:s.n.
GRĂDINARU, Giani, Methods and Techniques for Quantifying the Value of Ecosystem Services -
Romanian Statistical Review, 2013, Issue 5, p12-44. 33p.
Grizzetti, B., Lanzanova, D., Liquete, C. & Reynaud, A., 2015. Cook- book for water ecosystem
service assessment and valuation. Institute for Environment and Sustainability ed. Ispra: EC -
Joint Research Center.
Haines-Young, R. & Potschin, M., 2010. Proposal for a common international classification of
ecosystem goods and services (CICES) for integrated environmental and economic accounting.
s.l.:Department of Economic and Social Affairs Statistical division, United Nations
(ESA/STAT/AC.217-UNCEEA/5/7/Bk).
Halmy, Marwa Waseem, Paul Gessler, Jeffrey Hicke, și Boshra Salem. „Land use/land cover
change detection and prediction in the north-western coastal desert of Egypt using Markov-CA.”
Applied Geography, nr. 63 (2015): 101-112.
Hanganu, J., 1995-2002. Studies for the evaluation of natural vegetal resources on the territory
of RBDD, s.l .: Studies conducted at INCDDD Tulcea.
Hijmans, R. J. et al., 2005. Very high resolution interpolated climate surfaces for global land
areas. International Journal of Climatology, pp. 1965-1978.
Hung Lee, T. & Hsieh, H.-P., 2016. Indicators of sustainable tourism: A case study from a Taiwan’s
wetland. Ecological Indicators, Volumul 67, p. 779–787.
INCDPM, 2014. Studies for achieving shore protection of wetland area Divici-Pojejena,
Bucharest, 2014-2015
INCDPM, 2014. Studii privind apărarea de mal în zona umedă Divici-Pojejena, București, 2014-
2015
INSSE, 2016. Arrivals of tourists in tourist accommodation structures by types of structures, by
counties and localities - TUR104E 2015, Bucharest: s.n.
INSSE, 2016. Overnight stays in tourist accommodation structures by types of structures,
counties and localities, on Monday - TUR105H, Bucharest: s.n.
INSSE, 2016. Population by residence on January 1 - POP107D, Bucharest: s.n.
Best practices guide on mapping and assessing wetland ecosystems and their services
225
Ionica Doina and Simon-Gruita Alexandra, New Methodological Approaches in Microbial Ecology
on Quantification of Microbial Communities Biomass [Journal] // St. circle. Biol., Biol. Anim .-
1995.- 2: Vol. 47.- pp. 141-144.
Ionica Doina, Simon-Gruita Alexandra and Nicolescu Dorina. Organic matter decomposition in
some aquatic ecosystems in the Danube Delta (1994-1995) [Journal] // Annals of the Institute.
Delta Dunării.- 1996.- pp. 277-282.
IPCA, 2003. Map of soil texture 1: 200000, s.l .: s.n.
IPCC, 2007: Climate Change 2007: Synthesis Report. Contribution of Working Groups I, II and
III to the Fourth Assessment Report of the Intergovernmental Panel on Climate Change [Core
Writing Team, Pachauri, R.K and Reisinger, A. (eds.)]. IPCC, Geneva, Switzerland, 104 pp
Island University of Rhode NE-1038 [Online]. - 08 2016. -
http://web.uri.edu/nera/files/NE1038.pdf.
IUCN - Red List Unit, 2016. UCN Red List Data Freshwater Fish - Amphibians , Cambridge: s.n.
Jackson C. Rhett, Thompson James A. and Kolka Randall K. [Book Section] // Wetland Soils,
Hydrology, and Geomorphology.- 2014.
Johnston, R. J., R. S. Rosenberger, J. Rolfe and R. Brouwer (2015). Benefit Transfer of
Environmental and Resource Values: A Guide for Researchers and Practitioners. Dordrecht,
Springer Netherlands.
Jordan, I., 2005. Geography of Romania. Bucharest: Romanian Academy Publishing House.
Klein A.M. [et al.]Importance of pollinators în changing landscapes for world crops [Conference]//
Proceedings of the Royal Society B: Biological Sciences.- 2007.- Vol. 274.- pp. 303-313.
Köbbing, J.F. , Thevs, N., Zerbe, S., 2013, The utilisation of reed (Phragmites australis): a review,
Mires and Peat, Volume 13 (2013/14), Article 01, 1–14.
Kumar P. and et. al. The Economics of Ecosystems and Biodiversity Ecological and Economic
Foundations [Book]. - London : Earthscan, 2010.
Langanke, T. et al., 2013. GIO land (GMES/Copernicus initial operations land) High Resolution
Layers (HRLs) - summary of product specifications, s.l.: EEA - Copernicus.
LIFE10 NAT / RO / 000740, 2013, Sources of degradation of wetlands in the Natural Gates Natural
Park, University of Bucharest -CCMESI, APM Caras-Severin, Administration of the Iron Gate
Natural Park, Reşiţa, www.cormoran.portiledefier.ro
Best practices guide on mapping and assessing wetland ecosystems and their services
226
Maes, J., et al, 2013. Mapping and Assessment of Ecosystem and their Services. An analytical
framework for ecosystem assessments under Action 5 of the EU biodiversity strategy to 2020.
Environment. Luxembourg: publication office of the European Union.
Maes, J., et al, 2014- Indicators for ecosystem assessments under Action 5 of the EU Biodiversity
Strategy to 2020, ISBN 978-92-79-36161-6 doi: 10.2779/75203
Maes, J., et al, 2015. Mapping and Assessment of Ecosystems and their Services: Trends in
ecosystems and ecosystem services in the European Union between 2000 and 2010, European
Commission, EUR 27143 EN – Joint Research Centre – Institute for Environment and
Sustainability.
Maes, J., et al., 2014. Mapping and Assessment of Ecosystems and their Services. Indicators and
guidelines for ecosystem assessments under Action 5 of the EU Biodiversity Strategy to 2020.
Luxembourg: Publications office of the European Union.
Management Plan of the Iron Gates Natural Park, approved by H.G. 1048/2013 published in the
Official Gazette no. 119 of 18 February 2014 Part I
Markus Erhard, Anne Teller, Joachim Maes, Andrus Meiner, Pam Berry, Alison Smith, Ric Eales,
Liza Papadopoulou, Annemarie Bastrup-Birk , Eva Ivits, Eva Royo Gelabert, Gorm Dige, Jan-Erik
Petersen, Johnny Reker, Marie Cugny-Seguin, Peter Kristensen, Ronan Uhel, Christine Estreguil,
Marco Fritz, Patrick Murphy, Nicholas Banfield, Ole Ostermann, Dania Abdul Malak, Ana Marín ,
Christoph Schröder, Sophie Conde, Celia Garcia-Feced , Doug Evans, Ben Delbaere, Sandra
Naumann, McKenna Davis, Holger Gerdes, Andreas Graf, Arjen Boon, Beth Stoker, Andrzej
Mizgajski , Fernando Santos Martin , Andre Jol, Anke Lükewille, Beate Werner, Carlos Romao,
Daniel Desaulty, Frank Wugt Larsen , Geertrui Louwagie, Nihat Zal, Sylwia Gawronska, Trine
Christiansen - Mapping and Assessment of Ecosystems and their Services 3rd Report –Mapping
and assessing the condition of Europe’s ecosystems: Progress and challenges, ISBN 978-92-79-
55019-5, 2016
Matei, M. et al., 2016. Assessment of Ecosystem Conditions in Romania Using MAES
Methodology. Case Study: Divici-Pojejena Wetland. CEBU, ICBENS-229.
Matei, M. et al., 2016. Assessment of Pressures Caused by Climate Changes on Wetlands in
Romania Based on MAES Framework. International Journal of Environmental Science, Volumul
12016, pp. 265-271.
Matei, M. et al., 2017. Flood Protective Measures in Divici-Pojejena Wetlands, Caraș-Severin
County, Romania. Journal of Environmental Protection and Ecology,18(1).
Best practices guide on mapping and assessing wetland ecosystems and their services
227
McGarigal, K. & Marks, B. J., 1995. FRAGSTATS: spatial pattern analysis program for quantifying
landscape structure, Portland, OR:: Gen. Tech. Rep. PNW-GTR-351.
Mcinnes, R. & Everard, M., 2017. apid Assessment of Wetland Ecosystem Services (RAWES): An
example from Colombo, Sri Lanka. Ecosystem Services, Volumul 25, p. 89–105.
Millennium Ecosystem Assessment, 2005. Cultural and Amenity Services. În: Ecosystems and
Human Well-being: Current State and Trends. s.l.:s.n., pp. 455-476,
http://www.millenniumassessment.org/en/index.html.
Ministry of Environment and Climate Change, 2014. Wetlands and Agriculture: Partners for
Development". Available at: http://www.ddbra.ro/media/ARBDD
material%20informativ%20ziua%20ramsar%202014.pdf
Ministry of Environment, 2016. PRESS RELEASE WORLD WEDDING DAY
Ministry of Environment, 2016. Protected areas - GIS data. Bucharest: s.n.
Moss, D., 2015. EUNIS Habitat Classification 2012 - a revision of the habitat classification
descriptions. [Interactiv]. Available at:
http://www.eea.europa.eu/themes/biodiversity/eunis/eunis-habitat-classification#tab-
documents. Accesat 2015].
Muica, C. & Zavoianu, I., 1996. The ecological consequences of privatisation in Romanian
agriculture. GeoJournal, 2(38), pp. 207-2012.
National Administration - Romanian Waters, 2013. National plan for river basin management in
Romania - Synthesis, Bucharest: INHGA.
National Agency for Environmental Protection, Annual Report on the Environment in Romania,
2014, Bucharest, 2015.
National Research Council Wetlands: Characteristics and Boundaries [Report].- Washington:
National Academies Press, 1995.
National Strategic Plan for Fisheries, 2007-2013
NIS, TEMPO Online database, http://statistici.insse.ro/shop/index.jsp?page=tempo3
Oglethorpe, David R., and Despina Miliadou. 2000. “Economic Valuation of the Non-Use Attributes
of a Wetland: A Case-Study for Lake Kerkini.” Journal of Environmental Planning and Management
43 (6). Taylor & Francis Group: 755–67.
OpenStreetMap, 2017. OSM - Romania Database.
Best practices guide on mapping and assessing wetland ecosystems and their services
228
Operational Program for Fisheries - Romania, 2007-2013
ORDER no. 161 of 16 February 2006 for the approval of the Normative regarding the classification
of surface water quality in order to establish the ecological status of the water bodies.
Pascual, Unai, Roldan Muradian, Luke Brander, Erik Gómez-Baggethun, Berta Martín-López,
Madhu Verma, Paul Armsworth, et al. 2010. “The Economics of Valuing Ecosystem Services and
Biodiversity.” In Kumar, P. (Ed.), The Economics of Ecosystems and Biodiversity Ecological and
Economic Foundations (pp.183-255), London and Washington: Earthscan from Routledge.
Pekel, J.F., Cottam, A., Gorelick, N., Belward, A. S., 2016, High-resolution mapping of global
surface water and its long-term changes, Nature, 2016/12/15/print, 540, Macmillan Publishers
Limited, part of Springer Nature, http://dx.doi.org/10.1038/nature20584,10.1038/nature20584
Petrișor, A. I., Ianoș, I., Iurea, D. & Vădianu, M. N., 2012. Applications of Principal Component
Analysis Integrated with GIS. Procedia Environmental Sciences, 17(2012), pp. 247-256.
Pintilescu, C., 2007. Multivariate statistical analysis. Iasi: FIBAS.
Popescu, L. N., 2009, Theoretical and Methodological Aspects of the System of Evidence, Analysis
and Forecasting Indicators in Forestry and the Forest Economy, Year. Inst. Of Ist. "G. Bariţiu
"University of Cluj-Napoca, Series Humanistica, tom. VII, pp. 281-306,
Potts S. G. [et al.]Global pollinator declines: trends, impacts and drivers [Journal] // Trends în
ecology & evolution.- 2010.- 6: Vol. 25.- pp. 345-353.
Primack, R., Patroescu, M., Rozylowicz, L. & Ioja, C., 2008. Fundamentals of Biological Diversity
Conservation. Bucharest: AGIR Publishing House.
Pringle, C. et al., 1995. Environmental problems of the Danube Delta. Ekistics, 62(140), pp. 370-
372.
Rabe, S.-E.et al., 2016. National ecosystem services mapping at multiple scales - The German
exemplar. Ecological Indicators, 70(2016), pp. 357-372.
ROLE OF ORGANIC MATERIAL IN SOIL FERTILITY [Online] // Scritube. - March 08, 2017.-
http://www.scritub.com/economie/agriculture/ROLL-MATERIEI-ORGANICE-IN-FER34782.php.
Romanescu, G., 2004. Wetlands - between preservation and eradication. Geographical Seminar
"D. Cantemir ", pp. 23-24.
Best practices guide on mapping and assessing wetland ecosystems and their services
229
Romanescu, G., Stoleriu, C. & Zaharia, C., 2011. Territorial Repartition and Ecological Importance
of Wetlands in Moldova (Romania). Journal of Environmental Science and Engineering, 11(5), pp.
1335-1444.
Science for Environment Policy (2015) Ecosystem Services and the Environment. In-depth Report
11 produced for the European Commission, DG Environment by the Science Communication Unit,
UWE, Bristol. Disponibil la: http://ec.europa.eu/science-environment-policy
Simon-Gruiţă Alexandra, Research on microbial trophic network in eutrophic aquatic ecosystems
[Journal] // Journal of Political Science and Scientometry.- 2005.- Vol. Special Issue.- ISSN: 582-
1218
Smith R. L., Marnie L.C. and Brooks M.H.Autotrophic, hydrogen-oxidizing, denitrifying bacteria in
groundwater, potential agents for bioremediation of nitrate contamination [Journal] // Appl.
Environm. Microbiol.- 1994.- Vol. 60.- pp. 1949-1955.
Smith, L. I., 2002. A tutorial on Principal Components Analysis. [Interactiv]. Available at:
http://www.cs.otago.ac.nz/cosc453/student_tutorials/principal_components.pdf
[Accesat 12 2015].
Spircu, L., 2005. Data analysis: economic applications. 1 ed. Bucharest: ASE Publishing House.
SR EN 26777: 2002 / C91-2006, Water quality. Determination of nitrates.
SR EN ISO 6222Quality of water - Counting of microorganisms of culture - Colony counting by
sowing in agar culture medium [Report] .- Bucharest: ASRO, 2004.
SR EN ISO 8199Quality of water - Guidelines for counting microorganisms in the culture medium
[Report] .- Bucharest: ASRO, 2008.
SR ISO 10381/98, Soil quality. Sampling.
SR ISO 10390/94, Soil quality. Determination of pH.
SR ISO 11047/99, Soil quality. Determination of metals from soil extracts in royal water, methods
by atomic flame absorption spectrometry and electrothermal atomization.
SR ISO 11464/98, Soil quality. Pre-treatment of specimens for physico-chemical analysis.
SR ISO 11466/99, Soil quality. Extraction of soluble microelements (Cd, Cu, Cr, Mn, Ni, Pb, Zn)
in royal water.
SR ISO 6332 / C91-2006, Water quality. Determination of iron content.
Best practices guide on mapping and assessing wetland ecosystems and their services
230
SR ISO 6332-1996, Water quality. Determination of iron content.
Staraş, M., 2001. Restoration programme in the Danube Delta: achievements, benefits and
constraints.-River Restoration in Europe. Practical approaches.- RIZA rapport nr.: 2001.023. s.l.,
s.n., pp. Proceedings: 95-101.
Stefan I. D. Contributions to Functional Analysis of the Greek Ecosystems Complex, License Work.
[Report] .- Bucharest: University of Bucharest, 2006.
TEEB, 2008. The Economics of Ecosystems and Biodiversity: An interim report. european
Commission, brussels. Disponibil la: www.teebweb.org
TEEB, 2010. The Economics of Ecosystems and Biodiversity: Ecological and Economic
Foundations. London and Washington: Editor: Kumar P.. Earthscan.
Tempfli, K., Kerle, N., Huurneman, G. C. & Janssen, L. L., 2001. Principles of Remote Sensing -
an introductory textbook. Enschede: The International Institute for Geo-Information Science and
Earth Observation (ITC).
The Ramsar Convention, 1971. Available at: www.ramsar.org
Török, Z., 1999. Standard sheet for characterization of wetlands. PETARDA, 1 (4), pp. 2-16.
Torok, Z., 2000. Wetlands in Romania - types, importance. PETARDA, 1 (5), pp. 2-15.
Tsaur, S., Lin, Y. & Lin, J., 2006. Evaluating ecotourism sustainability from theintegrated
perspective of resource, community and tourism. Tourism Management, Volumul 27, pp. 640-
653.
Turner R. K., Morse-Jones S. and Fisher B., 2010, ‘Ecosystem valuation — A sequential decision
support system and quality assessment issues’, Annals of the New York Academy of Sciences,
(1185) 79–101
Turpie, J. A., Joubert, H., van Zyl, B. & Harding, T. L., 2001. Valuation of open space in the Cape
Metropolitan Area: a pilot study to demonstrate the application of environmental and resource
economics methods for the assessment of open space values in two case study areas: Metro
South and Metro South-east., Cape Town, South Africa: City of Cape Town.
Vadineanu, A. et al., 2003. Past and future management of Lower Danube Wetlands System: a
bioeconomic appraisal. Journal of Interdisciplinary Economics, 14(4), pp. 415-447.
Vartolomei, F., 2012. Wetland management and restoration projects in the lower Prut basin
related to effects of anthropogenic activities. Water resources and wetlands, 1(1), pp. 203-208.
Best practices guide on mapping and assessing wetland ecosystems and their services
231
Water Law - LAW no. 107 of September 25, 1996.
Wold, S., Kim, E. & Paul, G., 1987. Principal component analysis. Chemometrics and intelligent
laboratory systems, 2(1-3), pp. 37-52.
Woodward, R. T., and Y-S Wui (2001). The economic value of wetland services: a meta-analysis.
Ecological Economics, 37: 257–270. Available online at,
http://dare.agsci.colostate.edu/outreach/tools/#BTT
Zaharia, L. & Beltrando, G., 2009. Variabilité et tendances de la pluviométrie et des débits de
crue dans la région de la Courbure de l’Arc carpatique (Roumanie). Geographia Technica, pp.
471-476.
[Online]. - 08 2016. - http://edafologia.ugr.es/hidro/mcrperfw.htm.
[Online].- 08 2016.- http://www.travel-
university.org/general/geography/soils/hydromorphic.html.
[Online].-https://www.nrcs.usda.gov/Internet/FSE_DOCUMENTS/nrcs142p2_053260.pdf.
[Online],
http://ec.europa.eu/environment/pubs/pdf/factsheets/biodiversity_2020/2020%20Biodiversity
%20Factsheet_RO.pdf
[Online],
http://ec.europa.eu/environment/pubs/pdf/factsheets/Ecosystems%20goods%20and%20Servic
es/Ecosystem_RO.pdf
[Online], http://www.eea.europa.eu/data-and-maps/indicators/about/eea-indicators
http://www.ramsar.org/about/the-importance-of-wetlands
Best practices guide on mapping and assessing wetland ecosystems and their services
232
The project ”MAPPING AND ASSESSMENT OF THE ECOSYSTEM SERVICES IN DIVICI-POJEJENA
WETLAND AND IDENTIFICATION OF THEIR CONTRIBUTION TO THE ECONOMIC SECTORS
(WETECOS)” twith a total value of 497,897.91 EURO is funded under the RO02 Biodiversity and
Ecosystem Services Program through the EEA Grants 2009-2014 with a non-refundable amount
of € 423,213.22 plus € 74,684.69 co-financing from the state budget, through the Ministry of
Environment - Program Operator.The project was carried out during the period September 2015
to March 2017 and had as general objective the mapping and assessment of ecosystem services
in the wetland area Divici-Pojejena through the customized use of the European Union (EU)
recommendations for Romania, stipulated in the Mapping and Assessment of Ecosystem Services
(MAES) reports.
"The content of this material does not necessarily represent the official position of the EEA
Financial Mechanism 2009-2014"
For official information on EEA Grants, go towww.eeagrants.org, www.eeagrants.ro