Journal of Accessibility and Design for All
(CC) JACCES, 2015 - 5(1): 27-46. ISSN: 2013-7087
BENEFIT COMPARISON OF CAPTIONED ONLINE COURSES
FOR AMERICAN, INTERNATIONAL, AND DEAF/HARD OF
HEARING STUDENTS: FROM THE VIEWPOINT OF
INDIVIDUAL VALUE AND TOTAL VALUE
Manako Yabe, MSW
Department of Disability and Human Development, University of Illinois at Chicago
1 ORCID: orcid.org/0000-0002-8365-9454
1640 West Roosevelt Road, Room 214, Chicago, IL, 60608 Received: 2014-09-09 | Accepted: 2014-12-05| Published: 2015-05-25
Abstract: This study evaluated benefits toward Captioned Online Courses
(COC) among American, International, and Deaf/Hard of Hearing (DHH)
students from two California universities. As a result, COC were not just
viewed as accommodations for DHH students, but also as providing benefits
for American and International students. Study results indicated that
international students showed higher individual value for COC than the other
groups. American students had the smallest individual value but presented
the larger total value toward COC than the other groups due to their
comprising the largest population at both universities. The aggregate total
value for all groups was approximately $2,000,000.00, which would
represent the cost of conducting 370 classes at the lowest price of $2.00 per
minute. These results indicate the possibility of expanding future COC as
Universal Design model for postsecondary educational institutions.
Keywords: Universal design; captioned online courses; English as second
language learners; deaf and hard of hearing; contingent valuation; economic
value.
Benefit Comparison of Captioned Online Courses for American, International, and Deaf/Hard of Hearing Students 27
Journal of Accessibility and Design for All
(CC) JACCES, 2015 - 5(1): 27-46. ISSN: 2013-7087
Introduction
Statement of the Problem
The development of Information Technology has influenced Deaf and Hard of
Hearing (DHH) people’s social environment, even as DHH people have
experienced a lack of access to voice information and communication
(Shinohara & Wobbrock, 2011). Information Technology improvements,
including cochlear implants, hearing aids, videophones, relay services and
other technologies, have changed DHH people’s lifestyles, while also
producing a new issue; the lack of accessibility of electronic resources
(Burgstahler, 2002; Hilzensauer, 2008). Human rights laws for people with
disabilities, such as Section 508 of the U.S. Rehabilitation Act (U.S.
Department of Education, 2013), and the Web Content Accessibility
Guideline (WCAG) 2.0 (W3C, 2012), require accessibility services for
electronic resources, such as adding captions to online videos. Section 508
of the U.S. Rehabilitation Act requires to access to electronic resources at
federal educational institutions (U.S. Department of Education, 2013), while
WCAG 2.0, an international guideline for federal and private educational
intuitions regarding access to electronic resources for reference purposes
(W3C, 2012).
The researcher conducted email interviews with six universities regarding
universal design awareness, and 14 universities regarding universally
captioning access on campus. Some major universities have found
themselves unable to provide for DHH students’ accommodations prior to the
DHH students’ enrolling in and registering for specific courses. Interpreters
must have specifically-trained skills in order to translate technical terms on
an academic level, so it is challenging to find an interpreter who fits a DHH
student’s need for all classrooms. Other DHH students may prefer captioning
services, but, at times, captionists may not provide sufficient accessibility
services due to the lag time when typing quick dialogs such as class
discussions or films.
28 Manako Yabe
Journal of Accessibility and Design for All
(CC) JACCES, 2015 - 5(1): 27-46. ISSN: 2013-7087
Specifically for captions in online classes, the researcher obtained estimated
prices for online lectures with captions from 10 captioning agencies. The
cost of adding captions to online videos ranges from $0.62 to $8.00 per
minute, and from $35.00 to $480.00 per hour. The cost depends on the
duration of the video lecture, the speed and quality of sound, the type of
media, the length of submission, the transcript request, and any discounts.
As a part of federal educational laws, colleges and universities, which
receive federal money are required to cover the costs of captioning services
to make videos accessible to DHH students (U.S. Department of Education,
2013). Unfortunately, producing captioned videos requires higher per capita
costs, even for only one DHH student. This issue may be a cause for the lack
of popularity of online video lectures with caption since the costs for
producing captioned online videos may be higher than the profits for those
who produce them.
From another viewpoint, that of a Universal Design approach, the benefit of
captioning is considered for not only those who are DHH, but also for
International and American students who are English as Second Language
(ESL) learners to provide materials without experiencing language barriers
(Zanon, 2006). The concept of Universal Design is to design institutions,
products, and technological information to ensure that all people have
access to information without any barriers (Udo & Fels, 2009). Existing
literature already indicates positive educational and learning outcomes for
DHH and ESL students through the use of captioned videos or captioned
televisions (Huang & Eskey, 2000; Bowe & Kaufman, 2001; Markham, Peter,
& McCarthy, 2001; Lewis & Jackson, 2001; Danan, 2004; Rowland, 2007;
Holmes, Rutledge & Gauthier, 2009). However, little research is available
which presents the benefits of captioning services and the educational
outcomes for American students who are hearing and native speakers.
Purpose of the Study
When considering the popularization of COC, a discussion regarding the high
cost of captioning services is unavoidable. As a part of this consideration,
Benefit Comparison of Captioned Online Courses for American, International, and Deaf/Hard of Hearing Students 29

Journal of Accessibility and Design for All
(CC) JACCES, 2015 - 5(1): 27-46. ISSN: 2013-7087
the purpose of the study is to present a new perspective regarding the
introduction of Captioned Online Courses (COC), defined as online video
lectures with captions, for college students in the following four groups: (a)
American Native Speakers, (b) American ESL Learners, (c) International
Students, and (d) DHH Students.
As a matter of course, the individual value toward COC is expected to be
divided between a group that has higher value toward COC and another
group that has lower value toward COC. However, from the viewpoint of
popularity of COC, a total amount gathered from individual values is more
important than the individual value. The total value toward COC could be
significantly affected by a number of individual values, rather than only the
group that has highest singular value toward COC. If the results of this study
reveal that the American groups which are hearing and occupy a majority of
the total student population might have great value toward COC for better
learning in English, this could become the catalyst and power to popularize
COC.
Therefore, this study proposes taking two approaches: (1) estimating the
individual value of COC for each group: American Native Speakers, American
ESL Learners, International Students, and DHH Students, and (2) estimating
the total value of COC for each cluster, which is measured as the individual
value multiplied by the number for the group. In this way, the benefit of
COC may be considered for not only the DHH group, but also for the
American and International groups who can hear. To make this point clear,
two hypotheses are presented below.
Research Question and Hypotheses
This study leads with one research question: Which group of American,
International, and DHH students receives a large benefit from Captioned
Online Courses? Two hypotheses are adapted as follows:
Hypothesis One: The International group has a higher individual value for
COC than that of the other groups. The first hypothesis presents the ranking
of individual values as International > DHH > American ESL Learners >
30 Manako Yabe
Journal of Accessibility and Design for All
(CC) JACCES, 2015 - 5(1): 27-46. ISSN: 2013-7087
American Native Speakers. The International students may have more
personal value for COC because they want to improve their listening and
reading skills in English. The DHH group may include two types: DHH
students who are signers and who prefer to take an online class with an
interpreter, and other DHH students who are non-signers and who prefer to
take COC. The American group also includes two types: American ESL
Learners and American Native Speakers. American ESL Learners may have
more particular value for COC than American Native Speakers because they
may prefer to watch captions rather than listening since their second
language is English. Other American Native Speakers may prefer to listen
rather than watching captions as their mother tongue. Both groups may
place special value on COC for better learning opportunities.
Hypothesis Two: The American group’s total value for COC is higher than the
other groups. The second hypothesis presents the ranking of the total value
as American > International > DHH. Due to limited data access, this study
integrates the two types of Americans as one group for data analysis. Even if
the individual value of the American group is less than that of other groups,
the population of the American group is much larger than that of the other
groups, so the total value of the American students for COC is expected to
be larger than that of other groups. Even if the individual value of the
International group is higher than that of other groups, the population of the
International group is smaller than the American group, so the total value of
the International students for COC is expected to be second after American
group. The population of DHH group is much smaller than that of the other
groups, so the total value for the DHH students is expected to be lower than
the other groups.
If these hypotheses are accepted, COC should be strongly recommended, not
just for the DHH group for reasonable accommodation, but also for the
larger populations of the American and International groups for better
learning opportunities.
Benefit Comparison of Captioned Online Courses for American, International, and Deaf/Hard of Hearing Students 31

Journal of Accessibility and Design for All
(CC) JACCES, 2015 - 5(1): 27-46. ISSN: 2013-7087
Methodology
Questionnaire
The target population consists of four categories: (a) American students who
are native speakers, (b) American students who are ESL learners, (c)
International students, and (d) DHH students attending a California Private
University (CPU) and a California State University (CSU). All subjects are
over 18 years old. An online survey link was forwarded to each of the groups
via mass email.
The questionnaire was divided into three main parts: Part A, Introduction;
Part B, Benefit Evaluation Questions; and Part C, Students’ Backgrounds. In
the questionnaire, Part B estimates each group’s individual values and asks
about their willingness to pay (WTP) for a captioned online course at their
maximum rate of averaged tuition fees per year. This study uses Contingent
Valuation Method (CVM), which is widely used for a majority of
environmental economic research (Mitchell & Carson, 1989; Carson, 2000;
Bateman et al., 2002). The theoretical framework of CVM was adapted to
estimate the economic profits to be gained from these groups in regards to
COC. CVM evaluates WTP to get better services, and this study examines
WTP for taking COC. Check List CVM, which is used in this survey, is useful
for a small sample population (Mitchell & Carson, 1989; Bateman et al.,
2002). The Check List CVM presents a series of different values that users
would be willing to pay, and asks participants to check the item in the values
list that most closely resembles their opinions (Bateman et al., 2002). The
Part B, Evaluation Question represents as follows:
Imagine that your selected course has two optional online
class choices: (a) a captioned video online lecture and (b) a
non-captioned video online lecture. What percent would
you be willing to pay for a captioned online class rather than
for a non-captioned online class? Please remember that the
payment for captioned online classes is withdrawn from our
budget.
32 Manako Yabe
Journal of Accessibility and Design for All
(CC) JACCES, 2015 - 5(1): 27-46. ISSN: 2013-7087
• Even if the two classes are given for the same fee, I
do not want to take a captioned online class.
• If the two classes are given for the same fee, I want
to take a captioned online class.
• If the percentage is under 2% in additional fees, I
want to take a captioned online class.
• If the percentage is under 3%...
• If the percentage is under 5%...
• If the percentage is under 7%...
• If the percentage is under 10%...
• If the percentage is under 15%...
• If the percentage is under 20%...
• If the percentage is under 30%...
• Other ( ) %
• Don’t know
ANOVA for Examining Hypothesis One
Survey questions for Hypothesis One such as the Part B, Evaluation Question
sample above were analyzed using a one-way analysis of variance (ANOVA)
and multiple comparisons in SPSS Version 20.0 (IBM, 2011). The statistical
analyses were used to compare the differences in WTP for each of the four
groups. This study used WTP Rates as a scale of individual value, defined as
the increased tuition rate toward COC per alternative choice. In other
words, WTP Rates refers to the percentage that students would be willing to
pay for COC in additional tuition fees.
Benefit Comparison of Captioned Online Courses for American, International, and Deaf/Hard of Hearing Students 33

Journal of Accessibility and Design for All
(CC) JACCES, 2015 - 5(1): 27-46. ISSN: 2013-7087
Calculation of Total Value for Examining Hypothesis Two
The total value of WTP for each group is calculated by multiplying the mean
of the WTP Rates by the amount of each of the target populations per
campus, and by the return rates, in order to prevent overestimation of the
responders’ total values. This study estimates the respondents’ total values
by multiplying the return rates, which means the WTP of non-respondents is
assumed to be $0. This study compared each group’s total value toward
COC, and ranking and estimating the total costs per campus as a whole.
Results
Overview of Survey
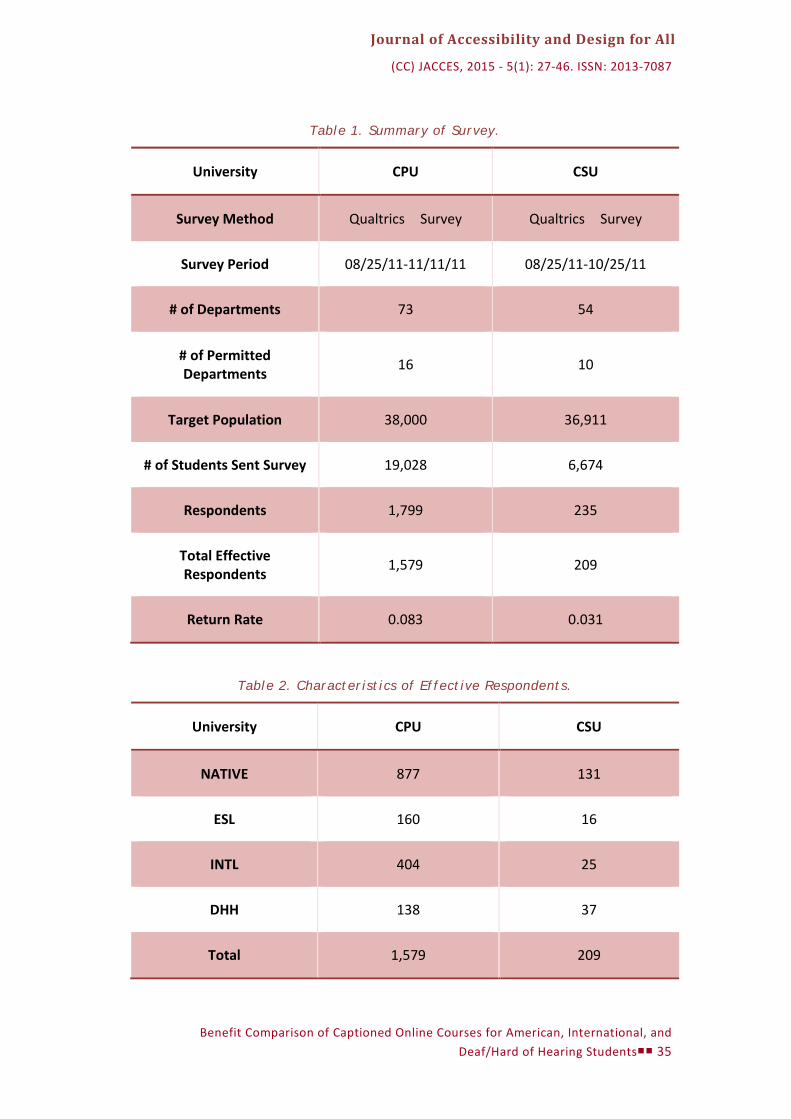
The researcher contacted all of the CPU’s and CSU’s departments for survey
permission, and obtained permission from 16 out of 73 of the CPU’s
departments, and 10 out of 54 of the CSU’s departments. As the survey link
was sent via mass email, it is unknown how many students received the
survey link from these departments. Excluding the 248 uncompleted
responses, the total response rate consisted of 1,579 responses from the
CPU, and 207 responses from the CSU. All data information of students was
divided into four groups based on the answers of Part C, Student
Backgrounds, for identifying how respondents’ backgrounds influence their
individual values toward COC. The return rates were: 8.30% at the CPU, and
3.10% at the CSU (See Table 1). Table 2 shows different characteristics of
four groups: American Native Speakers (NATIVE), American English as Second
Language Learners (ESL), International Students (INTL), and DHH Students
(DHH) (See Table 2).
34 Manako Yabe
Journal of Accessibility and Design for All
(CC) JACCES, 2015 - 5(1): 27-46. ISSN: 2013-7087
Table 1. Summary of Survey.
University CPU CSU
Survey Method Qualtrics Survey Qualtrics Survey
Survey Period 08/25/11-11/11/11 08/25/11-10/25/11
# of Departments 73 54
# of Permitted Departments 16 10
Target Population 38,000 36,911
# of Students Sent Survey 19,028 6,674
Respondents 1,799 235
Total Effective Respondents 1,579 209
Return Rate 0.083 0.031
Table 2. Characteristics of Effective Respondents.
University CPU CSU
NATIVE 877 131
ESL 160 16
INTL 404 25
DHH 138 37
Total 1,579 209
Benefit Comparison of Captioned Online Courses for American, International, and Deaf/Hard of Hearing Students 35

Journal of Accessibility and Design for All
(CC) JACCES, 2015 - 5(1): 27-46. ISSN: 2013-7087
Individual Value for COC
WTP rates for the four groups by combined campuses. The first approach
is One-way ANOVA to compare with the single value for each of the four
groups, combining the data from the CPU and CSU. WTP Rates is the
increased tuition fee rate toward COC. Table 3 presents the differences
among the means of the WTP Rates toward COC, as a scale of individual
value, varied: American ESL Learners at 3.431%, International Students at
2.016%, DHH Students at 1.741%, and American Native Speakers at 0.942%.
The result represents that at least one group has shown a different WTP Rate
compared to the rest of groups’ WTP Rates at a rate of p < .01 ***.
Table 3. One Way ANOVA: Comparison in Four Groups.
Descriptive Variables NATIVE ESL INTL DHH p value
WTP Rates 0.942 3.431 2.016 1.741 0.000 ***
N 934 159 411 162 Not applicable
Therefore, to examine the full detail of the differences of WTP Rates for the
four groups, Table 4 presents multiple comparisons for the WTP Rates for
each of the four groups. The WTP Rate of American Native Speakers was
statistically significant from that of American ESL Learners and International
Students, at a rate of p <.01***. Also, the WTP Rate of American ESL
Learners was statistically significant from that of International Students and
DHH Students, at a rate of p <.01 ***.
36 Manako Yabe
Journal of Accessibility and Design for All
(CC) JACCES, 2015 - 5(1): 27-46. ISSN: 2013-7087
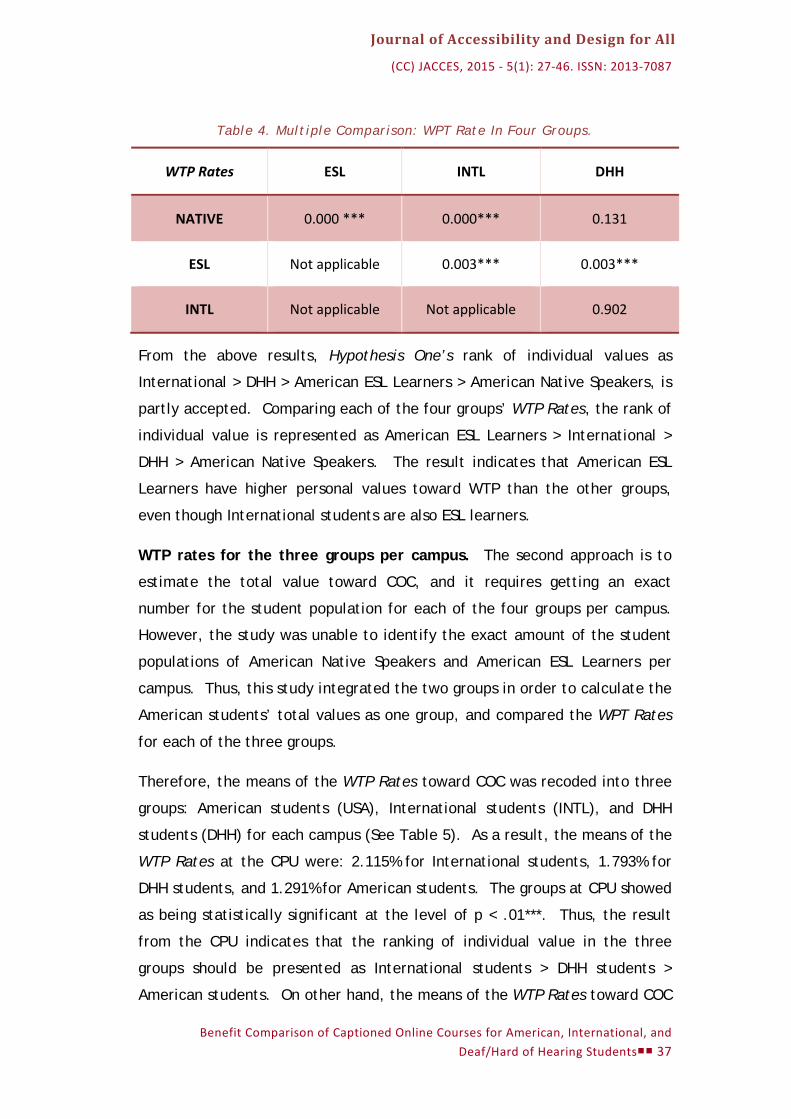
Table 4. Multiple Comparison: WPT Rate In Four Groups.
WTP Rates ESL INTL DHH
NATIVE 0.000 *** 0.000*** 0.131
ESL Not applicable 0.003*** 0.003***
INTL Not applicable Not applicable 0.902
From the above results, Hypothesis One’s rank of individual values as
International > DHH > American ESL Learners > American Native Speakers, is
partly accepted. Comparing each of the four groups’ WTP Rates, the rank of
individual value is represented as American ESL Learners > International >
DHH > American Native Speakers. The result indicates that American ESL
Learners have higher personal values toward WTP than the other groups,
even though International students are also ESL learners.
WTP rates for the three groups per campus. The second approach is to
estimate the total value toward COC, and it requires getting an exact
number for the student population for each of the four groups per campus.
However, the study was unable to identify the exact amount of the student
populations of American Native Speakers and American ESL Learners per
campus. Thus, this study integrated the two groups in order to calculate the
American students’ total values as one group, and compared the WPT Rates
for each of the three groups.
Therefore, the means of the WTP Rates toward COC was recoded into three
groups: American students (USA), International students (INTL), and DHH
students (DHH) for each campus (See Table 5). As a result, the means of the
WTP Rates at the CPU were: 2.115% for International students, 1.793% for
DHH students, and 1.291% for American students. The groups at CPU showed
as being statistically significant at the level of p < .01***. Thus, the result
from the CPU indicates that the ranking of individual value in the three
groups should be presented as International students > DHH students >
American students. On other hand, the means of the WTP Rates toward COC
Benefit Comparison of Captioned Online Courses for American, International, and Deaf/Hard of Hearing Students 37
Journal of Accessibility and Design for All
(CC) JACCES, 2015 - 5(1): 27-46. ISSN: 2013-7087
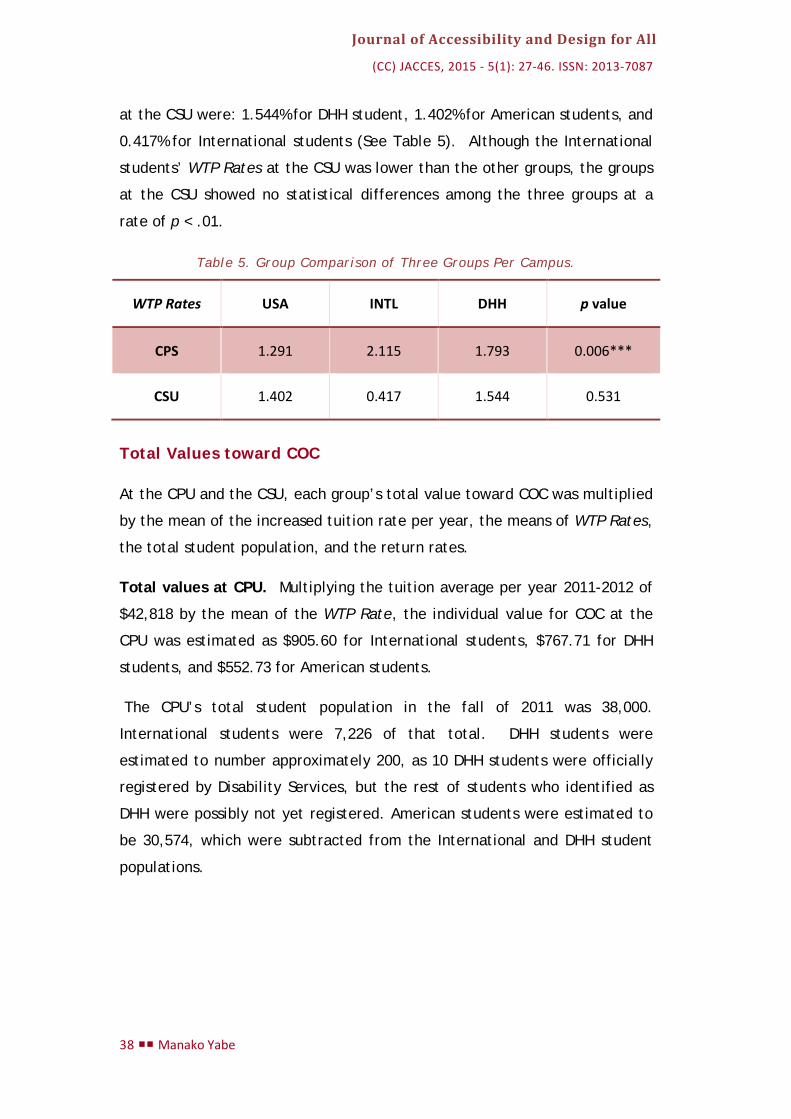
at the CSU were: 1.544% for DHH student, 1.402% for American students, and
0.417% for International students (See Table 5). Although the International
students’ WTP Rates at the CSU was lower than the other groups, the groups
at the CSU showed no statistical differences among the three groups at a
rate of p < .01.
Table 5. Group Comparison of Three Groups Per Campus.
WTP Rates USA INTL DHH p value
CPS 1.291 2.115 1.793 0.006***
CSU 1.402 0.417 1.544 0.531
Total Values toward COC
At the CPU and the CSU, each group’s total value toward COC was multiplied
by the mean of the increased tuition rate per year, the means of WTP Rates,
the total student population, and the return rates.
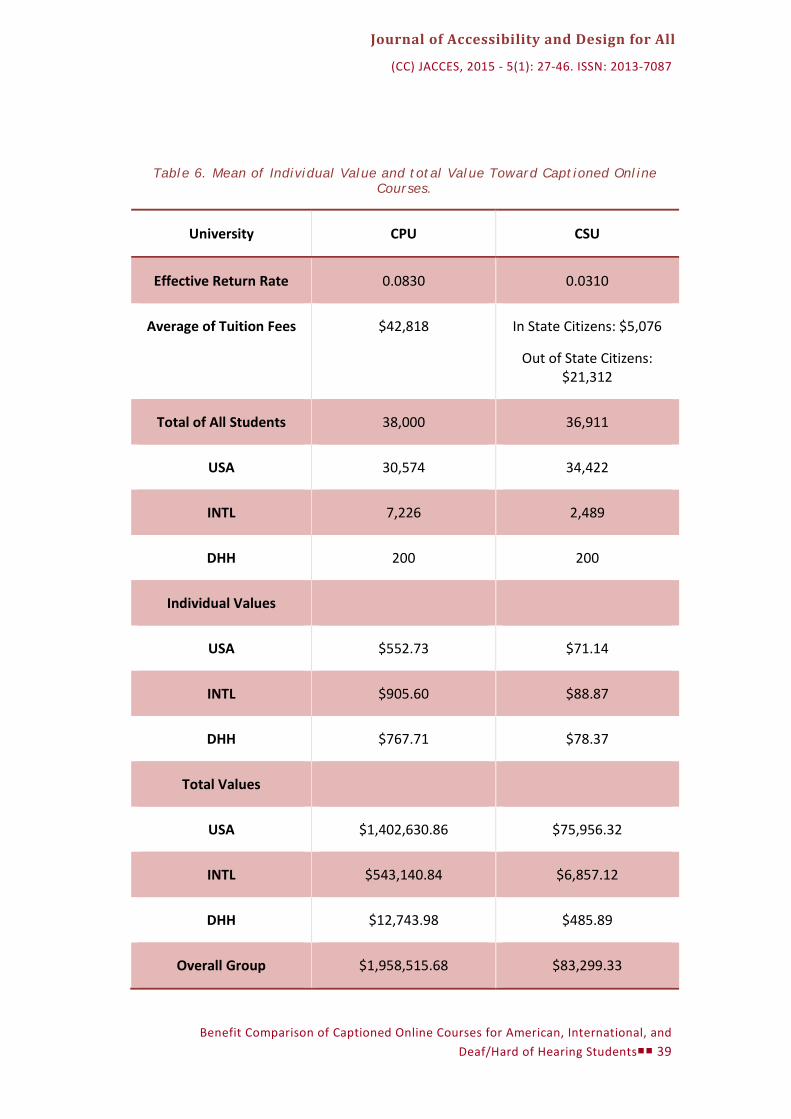
Total values at CPU. Multiplying the tuition average per year 2011-2012 of
$42,818 by the mean of the WTP Rate, the individual value for COC at the
CPU was estimated as $905.60 for International students, $767.71 for DHH
students, and $552.73 for American students.
The CPU’s total student population in the fall of 2011 was 38,000.
International students were 7,226 of that total. DHH students were
estimated to number approximately 200, as 10 DHH students were officially
registered by Disability Services, but the rest of students who identified as
DHH were possibly not yet registered. American students were estimated to
be 30,574, which were subtracted from the International and DHH student
populations.
38 Manako Yabe
Journal of Accessibility and Design for All
(CC) JACCES, 2015 - 5(1): 27-46. ISSN: 2013-7087
Table 6. Mean of Individual Value and total Value Toward Captioned Online Courses.
University CPU CSU
Effective Return Rate 0.0830 0.0310
Average of Tuition Fees $42,818 In State Citizens: $5,076
Out of State Citizens: $21,312
Total of All Students 38,000 36,911
USA 30,574 34,422
INTL 7,226 2,489
DHH 200 200
Individual Values
USA $552.73 $71.14
INTL $905.60 $88.87
DHH $767.71 $78.37
Total Values
USA $1,402,630.86 $75,956.32
INTL $543,140.84 $6,857.12
DHH $12,743.98 $485.89
Overall Group $1,958,515.68 $83,299.33
Benefit Comparison of Captioned Online Courses for American, International, and Deaf/Hard of Hearing Students 39

Journal of Accessibility and Design for All
(CC) JACCES, 2015 - 5(1): 27-46. ISSN: 2013-7087
This study also calculated the return rates, dividing the respondent rate by
the number of students who were sent the survey, calculating the total
values multiplied by the return rates, in order to avoid overestimation
regarding the total values for COC. The return rates were shown to be:
8.30% at CPU, and 3.10% at CSU (See Table 1’s Recollection Rate section).
Overall, considering return rate and calculating the total value per group at
the CPU revealed that values toward COC were: $1,402,630.86 for American
students, $543,140.84 for International students, and $12,743.98 for DHH
students. The overall total value for all groups was $1,958,515.68 (See
Table 6).
Total values at CSU. The in-state tuition average per year 2011-2012 was
$5,076.00 for American and DHH students and the non-in-state tuition
average per year was $21,312.00 for International students. In the same
manner as the calculation for the CPU, the estimated individual values for
COC at the CSU were obtained, resulting in: $71.14 for American students,
$88.87 for International students, and $78.37 for DHH students.
The CSU’s total student population in the fall of 2011 was 36,911, and
International students represented 2,489 of that total. DHH students were
estimated to number approximately 200 with 163 DHH students were
registered by DHH Services, but the rest of students who identified as DHH
were possibly not yet registered. American students were estimated to total
34,442, and were subtracted from the International and DHH student
populations.
Considering return rate and calculating the total value per group for the CSU
reveals that the values for COC were: $75,956.32 for American students,
$6,857.12 for International students and $485.89 for DHH students. The
overall total value for all groups was $83,299.33 (See Table 6).
40 Manako Yabe
Journal of Accessibility and Design for All
(CC) JACCES, 2015 - 5(1): 27-46. ISSN: 2013-7087
Discussion
Individual Values of COC in the All Groups
First, this study combined the results from the CPU and CSU and compared
them with the WPT Rates for each of the four groups: American Native
Speakers, American ESL Learners, International, and DHH. This study
assumed the original ranking of individual value as International > DHH >
American ESL Learners > American Native Speakers. However, the actual
rank of individual value was: American ESL Learners > International > DHH >
American Native Speakers.
The results indicate that American ESL Learners have higher individual values
toward COC than the other groups, even though International students are
also ESL learners. American ESL learners and International students may
have similar reasons for wanting to take COC in order to improve their
listening skills in English, while DHH students may have other reasons, such
as wanting full access to speech information. American Native Speakers had
lower individual values than the other groups, as they may not need often to
depend on captioning.
Second, the individual values for the four groups by combined campuses as a
result of a one-way ANOVA were shown as being statistically significant.
However, the individual values by dividing into three groups per campus in a
one-way ANOVA was shown to be statistically significant at the CPU, but not
at the CSU. The main cause for this was insufficient sampling size for data
analysis: 147 for American students, 37 for DHH students, and 25 for
International students at the CSU, as compared with a sufficient sampling
size at the CPU: 1037 for American students, 404 for International students
and 138 for DHH students (See Table 1’s Effective Respondent section).
Therefore, Table 1 and Table 2 represent a statistically significant difference
for the group comparisons by combined campuses due to the sufficient
sampling size of the CPU.
Benefit Comparison of Captioned Online Courses for American, International, and Deaf/Hard of Hearing Students 41
Journal of Accessibility and Design for All
(CC) JACCES, 2015 - 5(1): 27-46. ISSN: 2013-7087
Furthermore, compared to the population rate of American Native Speakers,
the population rate of American ESL Learners was smaller, comprising 15.40%
of the total American group at the CPU and 10.90% of the total American
group at the CSU who were ESL.
As a result, integrating the two groups of American Native Speakers and
American ESL Learners, this study found that the American group was
affected by a vast majority of in population of American Native Speakers. In
addition, 88% of the total respondent rate was occupied by CPU’s student
population. Therefore, the results from the four groups were affected by
the large majority of the CPU’s population. In summary, the data analysis
for Americans was influenced by a majority of American Native Speakers and
the data analysis for the combined universities was impacted by CPU
respondents.
Total Values of COC
The American students’ mean of the WTP Rate is lower than that of the
International students and the DHH students. However, a large number for
the American student population rate resulted in higher American students’
total value regarding COC than for the other groups’ total values. The
population ratios of absolute values between American and International
students from the two universities could apply to other California State
Universities or all universities in the United States which have similar
population ratio.
This study considered the return rates in order to avoid overestimation of
the total values for COC. The aggregate total value for all groups from the
CPU and the CSU was evaluated to be approximately $1,900,000.00 per year
and $83,000.00 per year respectively, despite having a 91.70% no response
rate at the CPU and a 96.90% no response rate at the CSU. In addition, the
online survey was sent to only 16 of 73 departments at the CPU and 10 of 54
departments at the CSU. A higher collection would be realized if the online
survey had been sent to all of the departments at both the CPU and the CSU.
At that rate, the overall total values may be expected to be over
$2,000,000.00 throughout year, and not just per year.
42 Manako Yabe
Journal of Accessibility and Design for All
(CC) JACCES, 2015 - 5(1): 27-46. ISSN: 2013-7087
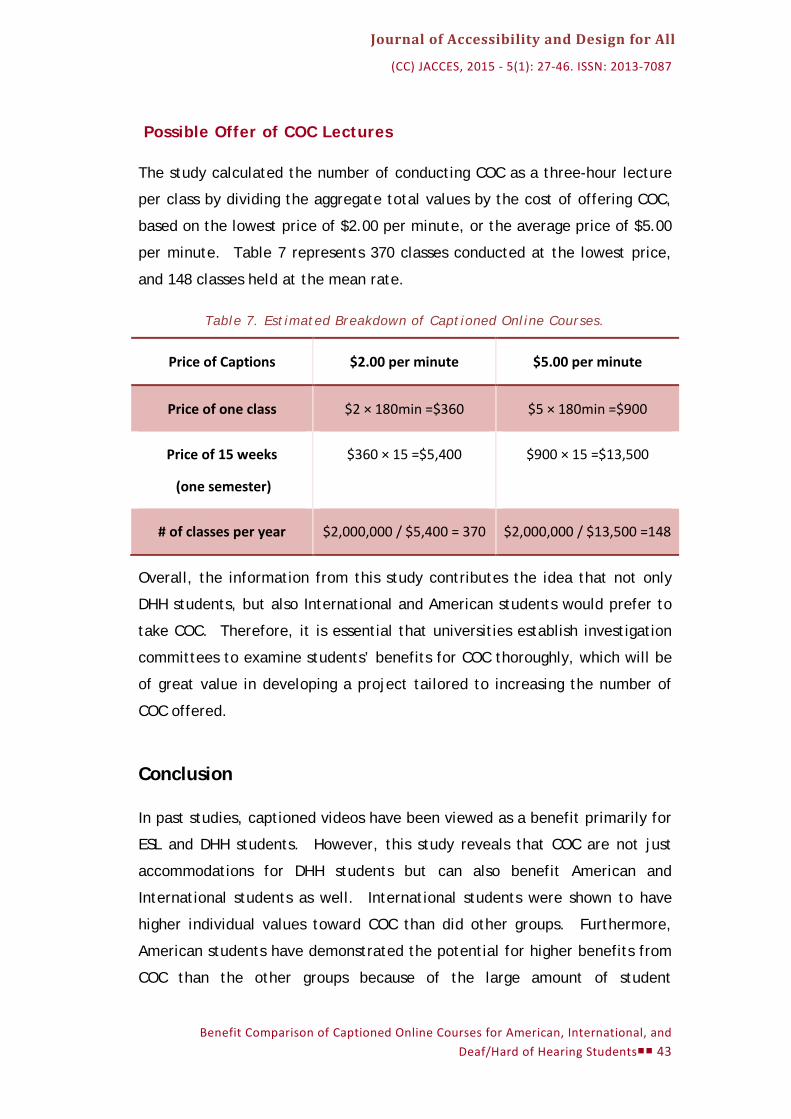
Possible Offer of COC Lectures
The study calculated the number of conducting COC as a three-hour lecture
per class by dividing the aggregate total values by the cost of offering COC,
based on the lowest price of $2.00 per minute, or the average price of $5.00
per minute. Table 7 represents 370 classes conducted at the lowest price,
and 148 classes held at the mean rate.
Table 7. Estimated Breakdown of Captioned Online Courses.
Price of Captions $2.00 per minute $5.00 per minute
Price of one class $2 × 180min =$360 $5 × 180min =$900
Price of 15 weeks
(one semester)
$360 × 15 =$5,400 $900 × 15 =$13,500
# of classes per year $2,000,000 / $5,400 = 370 $2,000,000 / $13,500 =148
Overall, the information from this study contributes the idea that not only
DHH students, but also International and American students would prefer to
take COC. Therefore, it is essential that universities establish investigation
committees to examine students’ benefits for COC thoroughly, which will be
of great value in developing a project tailored to increasing the number of
COC offered.
Conclusion
In past studies, captioned videos have been viewed as a benefit primarily for
ESL and DHH students. However, this study reveals that COC are not just
accommodations for DHH students but can also benefit American and
International students as well. International students were shown to have
higher individual values toward COC than did other groups. Furthermore,
American students have demonstrated the potential for higher benefits from
COC than the other groups because of the large amount of student
Benefit Comparison of Captioned Online Courses for American, International, and Deaf/Hard of Hearing Students 43
Journal of Accessibility and Design for All
(CC) JACCES, 2015 - 5(1): 27-46. ISSN: 2013-7087
population. Assuming the WTP of non-respondents to be $0, regardless of
the lower return rates of 8.30% at the CPU and 3.10% at the CSU, the total
value for the populations from all groups at both universities was estimated
at approximately $2,000,000.00 per year, which would cover the cost of
conducting 370 classes at the lowest price of $2.00 per minute or 148 classes
at the average price of $5.00 per minute.
The effectiveness of this project contributes to the promotion of the
Universal Design model for postsecondary educational institutions. Offering
COC to International students in other countries, or to American students in
other states, may help improve their academic achievement, as compared to
students who do not partake in COC. The more American students who are
interested in taking COC, the more tuition income supports the budget
necessary for providing COC, which generates positive feedback. In
addition, development of an online course curriculum that offers COC
internationally may lead to COC becoming popular with a large number of
International students.
More importantly, COC is an essential accessibility service for students who
have slight or mild hearing loss and who are non-signers. Despite the fact,
Disability Services at the CPU registered only 10 DHH students, the survey
collection identified 138 students who reported slight or mild hearing loss.
That is, DHH students who have slight or mild hearing loss may not register
Disability Services at universities.
Unfortunately, although this research analyzed the expected educational and
economic valuations toward COC, there were limitations. The survey
collection rates were 8.30% at the CPU and 3.10% at the CSU, so a university
would need to examine all of the students’ values toward COC thoroughly.
The online survey was conducted with college students, and most of the
responders were possibly interested in taking COC, which represents the
characteristics of these subjects. If most of the subjects were enrolled at
California State Universities, the study may show different results. This
study estimated the effectiveness of COC popularization economically, but
whether the total value of COC is higher than the costs of captioning services
has yet to be discussed.
44 Manako Yabe
Journal of Accessibility and Design for All
(CC) JACCES, 2015 - 5(1): 27-46. ISSN: 2013-7087
References
Bateman, I. et al. (2002). Economic valuation with stated preference [1]techniques: A manual. Cheltenham, UK: Edward Elgar Publishing, Inc.
Bowe, F., & Kaufman, A. (2001). Captioned media: Teacher perceptions of [2]potential values for students with no hearing impairments. A National Survey of Special Educators, 1-8. Retrieved from http://www.dcmp.org/caai/nadh51.pdf.
Burgstahler, S. (2002). Distance learning: Universal design, universal access. [3]
Association for the Advancement of Computing in Education Journal, 10(1), 32-61. Retrieved from http://www.editlib.org/p/17776/
Carson, T. R. (2000). Contingent valuation: A user’s guide. Environment [4]Science & Technology, 34(8), 1413-1418. doi: 10.1021/es990728j.
Danan, M. (2004). Captioning and subtitling: Undervalued language learning [5]strategies. Meta: Translators’ Journal, 49(1), 67-77. doi: 10.7202/009021ar.
Hilzensauer, M. (2008). Information technology for deaf people. Intelligent [6]paradigms for assistive and preventive healthcare, 19(7), 183-206. doi:10.1007/11418337_7.
Holmes, K.P., Rutledge, S., & Gauthier, L.R. (2009). Understanding the [7]cultural-linguistic divide in American classrooms: Language learning strategies for a diverse student population. Reading Horizons, 49(4), 285-300. Retrieved
from http://scholarworks.wmich.edu/reading_horizons/vol49/iss4/4.
Huang, H., & Eskey, D. (2000). The effects of closed captioned television [8]on the listening comprehension of intermediate English as a second language (ESL) students. Educational Technology Systems, 28(1), 75-96. doi: 10.2190/RG06-LYWB-216Y-R27G.
IBM SPSS Statistics (Version 20.0) [Software]. New York: International [9]Business Machines Corporation.
Lewis, M.S., & Jackson, D.W. (2001). Television literacy: comprehension of [10]program content using closed captions for the deaf. Journal of Deaf Studies and Deaf Education, 6(1), 43-53. doi: 10.1093/deafed/6.1.43.
Markham, P.L., Peter, L. A., & McCarthy, T.J. (2001). The effects of native [11]language vs. target language captions on foreign language captions on
Benefit Comparison of Captioned Online Courses for American, International, and Deaf/Hard of Hearing Students 45
Journal of Accessibility and Design for All
(CC) JACCES, 2015 - 5(1): 27-46. ISSN: 2013-7087
foreign language students’ DVD video comprehension. Foreign Language Annal, 34(5), 439-445. doi: 10.1111/j.1944-9720.2001.tb02083.x.
Mitchell, R., & Carson, R. (1989). Using surveys to value public goods: The [12]
contingent valuation method. Washington, D.C.: Resources for the Future.
Rowland, J.L. (2007). Closed-captioned video and the ESL classroom: A [13]multi-sensory approach. MPAEA Journal of Adult Education, 36(2), 35- 39. Retrieved from http://files.eric.ed.gov/fulltext/EJ891068.pdf.
Shinohara, K., & Wobbrock, J. (2011). In the shadow of misperception: [14]Assistive technology use and social interaction. CHI '11 Proceedings of the 2011 Annual Conference on Human Factors in Computing Systems, 705-714. doi: 10.1145/1978942.1979044.
Udo, J., & Fels, D. (2010). The rogue poster-children of universal design: [15]Closed captioning and audio description. Journal of Engineer Design, 21 (2-3), 207-221. doi: 10.1080/09544820903310691.
U.S. Department of Education. (2013). Assistive technology sections 504 [16]
and 508 of the rehabilitation act of 1973. Retrieved from http://www2.ed.gov/policy/gen/guid/assistivetech.html.
W3C. (2012). Web Content Accessibility Guidelines (WCAG) Overview. [17]Retrieved from http://www.w3.org/WAI/intro/wcag.php.
Zanon, N.T. (2006). Using subtitles to enhance foreign language learning. [18]Porta Linguarum, 6, 41-52. Retrieved from http://dialnet.unirioja.es/descarga/articulo/2371555.pdf.
46 Manako Yabe

238 Authors
JACCES ISSN: 2013-7087
www.jacces.org
Twitter: @Journal_JACCES LinkedIn: JACCES page
©© Journal of Accessibility and Design for All, 2015
Article's contents are provided on an Attribution-NonCommercial 3.0 Creative commons license. Readers are allowed to copy, distribute and communicate article's
contents, provided the author's and Journal of Accessibility and Design for All's names are included. It must not be used for commercial purposes. To see the complete license
contents, please visit http://creativecommons.org/licenses/by-nc/3.0/.
JACCES is committed to providing accessible publication to all, regardless of technology or ability. Present document grants strong accessibility since it applies to
WCAG 2.0 and PDF/UA recommendations. Evaluation tool used has been Adobe Acrobat® Accessibility Checker. If you encounter problems accessing content of this
document, you can contact us at [email protected].