BURGLARY IN AUSTIN
Austin Public Safety Commission
March 7, 2011

Introduction
Local neighborhood associations in Austin have expressed concerns about an increase in residential burglary
While not “newsworthy,” burglaries are common and the average citizen is at risk of victimization
Residential burglary is a serious crime, and victims can suffer from both financial loss and psychological harm

70% Residential 30% Nonresidential
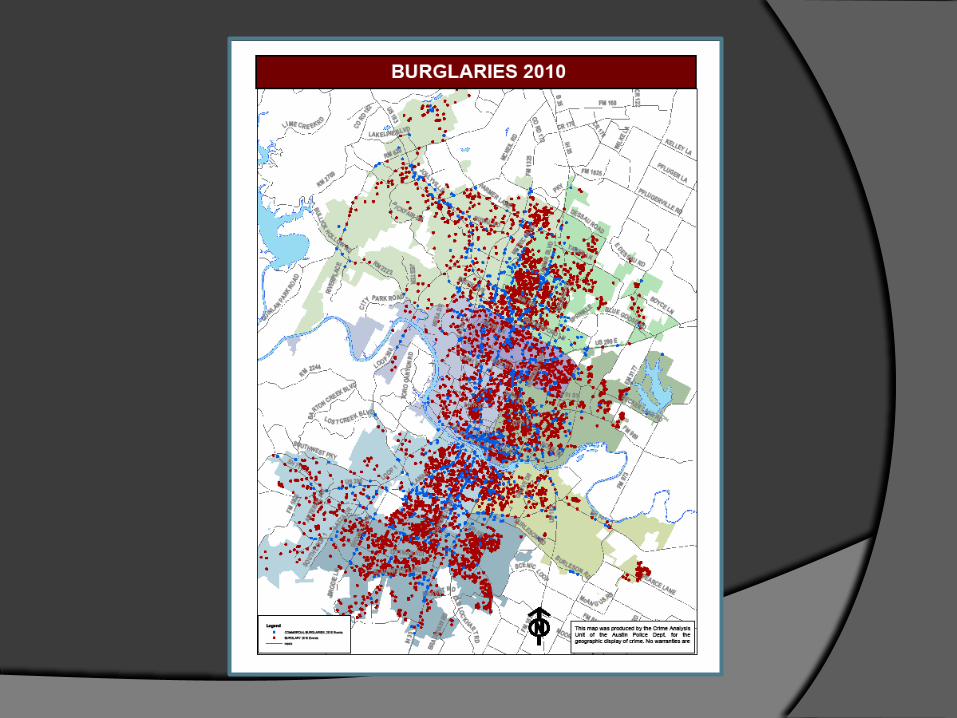
US Cities 500,000 to 999,999
Texas Austin0
200
400
600
800
1,000
1,200
Comparative Burglary Rates

2000 2001 2002 2003 2004 2005 2006 2007 2008 20090
200
400
600
800
1,000
1,200
Austin Burglary Rates*
AllResidentialNonresidential
*Based on APD data (26% population growth in Austin).
+26%
+33%
+11%
2000 2001 2002 2003 2004 2005 2006 2007 2008 20090
200
400
600
800
1,000
1,200
1,400
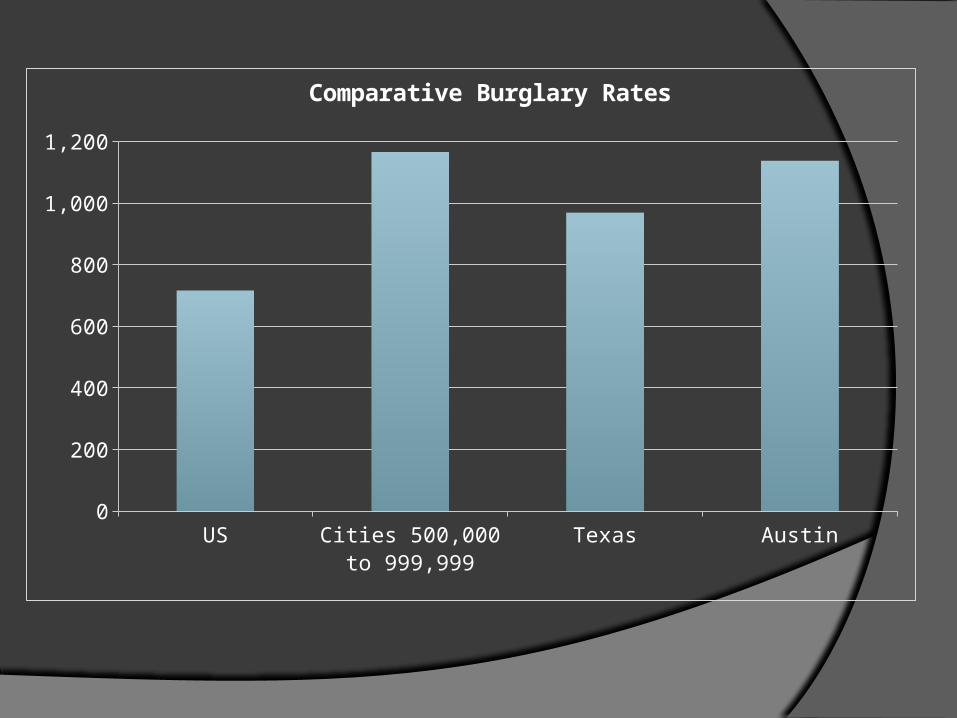
Comparative Burglary Rates by Year
US
Cities 500,000 to 999,999
Texas
Austin
-1%
-4%
-2%
+26%

2000 2001 2002 2003 2004 2005 2006 2007 2008 2009$0
$500
$1,000
$1,500
$2,000
$2,500
Austin Burglary Losses*
AllResidentialNonresidentialInflation (US)
+86%
+8%
+23%
+48%
*Does not include indirect (+71%) or CJS costs.

2000 2001 2002 2003 2004 2005 2006 2007 2008 2009$0
$2,000,000
$4,000,000
$6,000,000
$8,000,000
$10,000,000
$12,000,000
$14,000,000
$16,000,000
Austin Burglary Total Losses
+102%
Total Loss $102,000,000 • 72% Residential • 28% Nonresidential

2000 2001 2002 2003 2004 2005 2006 2007 2008 20090%
2%
4%
6%
8%
10%
Austin Burglary Clearance Rate
-44%
Austin 5%US average 13%
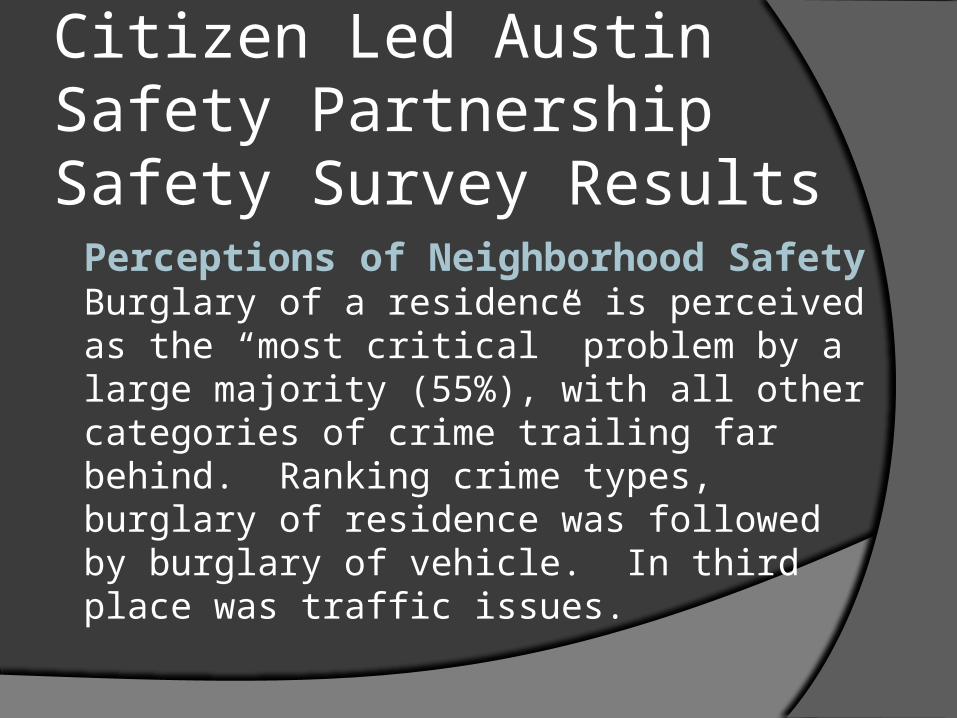
Citizen Led Austin Safety Partnership Safety Survey Results
Perceptions of Neighborhood SafetyBurglary of a residence is perceived as the “most critical” problem by a large majority (55%), with all other categories of crime trailing far behind. Ranking crime types, burglary of residence was followed by burglary of vehicle. In third place was traffic issues.

Most Critical Neighborhood Safety Issue

Ranking of Neighborhood Safety Issues by Severity

What can APD do to Make Your Neighborhood Safer?

Conclusions
Burglary is considered the most critical crime problem in Austin
Austin’s burglary rate is typical, but getting worse – over the past decade, the residential burglary rate increased 33%
During the same time, APD’s clearance rate for solved burglaries dropped in half, to 5%
Burglary is an expensive crime – last year it cost the citizens of Austin over $14 million
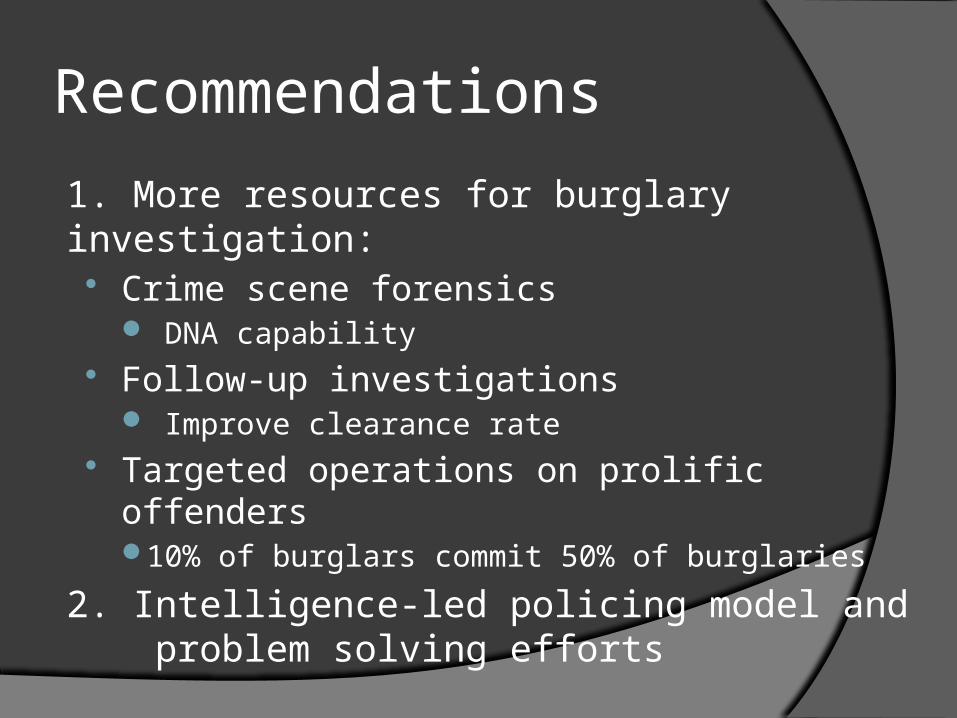
Recommendations
1. More resources for burglary investigation: Crime scene forensics
DNA capability Follow-up investigations
Improve clearance rate Targeted operations on prolific offenders
10% of burglars commit 50% of burglaries
2. Intelligence-led policing model and problem solving efforts