POUR L'OBTENTION DU GRADE DE DOCTEUR ÈS SCIENCES
acceptée sur proposition du jury:
Prof. M. Pauly, président du juryProf. P. Dillenbourg, directeur de thèseProf. N. Rouillon Couture, rapporteuse
Prof. D. Abrahamson, rapporteurDr M. Salzmann, rapporteur
Augmented Reality to Facilitate a Conceptual Understanding of Statics in Vocational Education
THÈSE NO 8290 (2018)
ÉCOLE POLYTECHNIQUE FÉDÉRALE DE LAUSANNE
PRÉSENTÉE LE 16 MARS 2018
À LA FACULTÉ INFORMATIQUE ET COMMUNICATIONS
LABORATOIRE D'ERGONOMIE ÉDUCATIVE
PROGRAMME DOCTORAL EN INFORMATIQUE ET COMMUNICATIONS
Suisse2018
PAR
Lorenzo LUCIGNANO

Acknowledgements
I would like to express my gratitude to the people who contributed in the development of both
this research and to its final form. First and foremost, it has been a pleasure to work under the
supervision of Prof. Pierre Dillenbourg. During these last four years Pierre has been a source
of advices and suggestions, and almost every meeting we had was an occasion that inspired
me to pursue my research.
I am grateful to the members of jury, Prof. Dor Abrahamson, Prof. Nadine Rouillon Couture
and Prof. Mathieu Salzmann, whose comments offered different perspectives on this work
and allowed me to refine the final manuscript.
The quality of the first two chapters has improved thanks to the careful review of Hamed
Alavi, who contributed also to the design of the experiment described in Chapter 5. Hamed’s
contribution went far beyond the scope of this manuscript: the conversation with him were
stimulating and something that broadened my views.
Someone to whom I owe more than a couple of beers is Kshitij Sharma. I learned a lot from
him. Besides being a friend, Kshitij is the person who introduced me to experimental design,
statistical analysis, eye-tracking methods, cognitive theories and much more. I would have
had harder times without his guidance.
I am thankful to Mina Shirvani, who helped me in running most of the studies and who was
always available for discussions about results. Apart from the research contributions, I am
more than happy I could share this PhD with her from the beginning to the end.
Serena Operetto, my girlfriend, has the merit of having proofread this manuscript. Despite her
different academic background, she has been very patience in reading every single chapter.
Her efforts significantly improved my writing and her help has been often necessary to put in
words my thoughts.
If I had the chance to involve vocational apprentices in two studies, it is because I met five car-
pentry teachers who believed in our vision of innovating carpentry training: Urs Felder, Joseph
Durer and August Muehlebach from the Berufsbildungszentrum Bau und Gewerbe voca-
tional school in Luzern; Philippe Ogay and Pascal Wulliamoz from the Centre d’Enseignement
i
Acknowledgements
Professionnel de Morges.
The study of Chapter 5 has been done in collaboration with Sophia Schwär and Dr. Beat
Schwendimann. Khalil Mrini, Louis Faucon and Thibault Asselborn helped me running the
last study (Chapter 8). The application described in Chapter 6 for drawing structures has been
developed by Sebastien Chevalley and Jonathan Collaud as part of their semester projects.
I would also like to mention those who have been part of my PhD life, whether they were
directly involved in my research or not. I have been lucky to join CHILI and to be surrounded
by colleagues and friends with whom I enjoyed sharing my time. Hamed Alavi, Thibault
Asselborn, Daniela Caballero, Florence Colomb, Louis Faucon, Julia Fink, Kevin Gonyop,
Thanasis Hadzilacos, Stian Håklev, Alexis Jacq, Wafa Johal, Łukasz Kidzinski, Kshitij, Khalil
Mrini, Jennifer Olsen, Catharine Oertel, Ayberk Özgür, Arzu Göneysu Özgür, Luis Prieto,
Mirko Raca, Mina Shirvani, Himanshu Verma, Elmira Yadollahi, Jessica Dehler Zufferey and
Guillaume Zufferey. Thank you for the funny conversations at lunch, birthday bombing, the
beer-breaks, the ping-pong matches, the concerts and much more!
To the Piovano family, Livio, Emmy, Victor, Caterina and Daan. You have been present and
encouraging even before I landed in Switzerland. You welcomed me in your family and
constantly supported me thought these 4 years. I could count on you in every moment. It gets
difficult to articulate what this meant to me: it was inestimable.
There have been moments when I had the impression to become detached from my home. It
is only thanks to my parents and my sister that this burden of being away has been relieved.
Thank you for everlasting and palpable love. Once more I show my gratitude to Serena for
coping with my moods, for cheering me up, for the effort that you put in understanding me,
both literally and figuratively.
Lausanne, 2018-02-02 Lorenzo Lucignano
This research has been funded by the Swiss State Secretariat for Education, Research and
Innovation (SERI).
ii
Abstract
At the core of the contribution of this dissertation there is an augmented reality (AR) environ-
ment, StaticAR, that supports the process of learning the fundamentals of statics in vocational
classrooms, particularly in carpentry ones. Vocational apprentices are expected to develop an
intuition of these topics rather than a formal comprehension. We have explored the potentials
of the AR technology for this pedagogical challenge. Furthermore, we have investigated the
role of physical objects in mixed-reality systems when they are implemented as tangible user
interfaces (TUIs) or when they serve as a background for the augmentation in handheld AR.
This thesis includes four studies. In the first study, we used eye-tracking methods to look
for evidence of the benefits associated to TUIs in the learning context. We designed a 3D
modelling task and compared users’ performance when they completed it using a TUI or a
GUI. The gaze measures that we analysed further confirmed the positive impact that TUIs
can have on the learners’ experience and enforced the empirical basis for their adoption in
learning applications.
The second study evaluated whether the physical interaction with models of carpentry struc-
tures could lead to a better understanding of statics principles. Apprentices engaged in a
learning activity in which they could manipulate physical models that were mechanically
augmented, allowing for exploring how structures react to external loads. The analysis of ap-
prentices’ performance and their gaze behaviors highlighted the absence of clear advantages
in exploring statics through manipulation. This study also showed that the manipulation
might prevent students from noticing aspects relevant for solving statics problems.
From the second study we obtained guidelines to design StaticAR which implements the
magic-lens metaphor: a tablet augments a small-scale structure with information about
its structural behavior. The structure is only a background for the augmentation and its
manipulation does not trigger any function, so in the third study we asked to what extent it
was important to have it. We rephrased this question as whether users would look directly at
the structure instead of seeing it only through a tablet. Our findings suggested that a shift of
attention from the screen to the physical object (a structure in our case) might occur in order
to sustain users’ spatial orientation when they change positions. In addition, the properties of
the gaze shift (e.g. duration) could depend on the features of the task (e.g. difficulty) and of
the setup (e.g. stability of the augmentation).
iii
Acknowledgements
The focus of our last study was the digital representation of the forces that act in a loaded
structure. From the second study we observed that the physical manipulation failed to help
apprentices understanding the way the forces interact with each other. To overcome this issue,
our solution was to combine an intuitive representation (springs) with a slightly more formal
one (arrows) which would show both the nature of the forces and the interaction between
them. In this study apprentices used the two representations to collaboratively solve statics
problems. Even though apprentices had difficulties in interpreting the two representations,
there were cases in which they gained a correct intuition of statics principles from them.
In this thesis, besides describing the designed system and the studies, implications for future
directions are discussed.
Key words: Augmented Reality, Learning Technologies, Qualitative Statics, Vocational Training,
Tangible User Interfaces, Physical Interaction, Magic-lens Augmented Reality
iv
Abstract
Il fulcro di questa tesi è un ambiente di realtà aumentata (RA), StaticAR, che supporta l’ap-
prendimento della statica nel contesto della formazione professionale dei carpentieri. Gli
studenti di carpenteria dovrebbero sviluppare un intuizione di questi argomenti piuttosto
che una comprensione formale. Abbiamo quindi esplorato il potenziale della RA per questa
contesto pedagogico. Inoltre, abbiamo studiato il ruolo degli oggetti fisici nei sistemi a realtà
mista, sia come interfacce utente tangibile (TUI) sia quando servono da sfondo per la RA su
dispositivi tablet.
Questa tesi comprende quattro studi. Nel primo studio abbiamo usato metodi di oculometria
per cercare prove dei benefici associati alle TUI nel contesto dell’apprendimento. Abbiamo
progettato un’attività di modellizzazione 3D e confrontato le prestazioni degli utenti quando
l’hanno completata utilizzando una TUI o una GUI. Le misure ottenute hanno ulteriormente
confermato l’impatto positivo che le TUI possono avere sull’esperienza degli studenti.
Nel secondo studio abbiamo valutato se l’interazione fisica con modelli di strutture possa
portare a una migliore comprensione dei principi di statica. Ventiquattro studenti hanno
partecipato ad un’attività in cui potevano manipolare dei modelli fisici dotati di componenti
meccanici che consentivano di esplorare come le strutture reagiscono ai carichi. L’analisi
delle prestazioni e dei movimenti oculari degli apprendisti ha evidenziato l’assenza di chiari
vantaggi nell’esplorazione della statica attraverso la manipolazione, che invece impedirebbe
agli studenti di notare aspetti rilevanti per risolvere problemi di statica.
Dal secondo studio abbiamo ottenuto le linee guida per progettare StaticAR come un sistema
magic-lens: un tablet “arricchisce” una struttura su scala ridotta con le informazioni sul suo
comportamento strutturale. La struttura è solo uno sfondo per l’RA e la sua manipolazione non
innesca alcuna funzione. Quindi, nel terzo studio ci siamo chiesti se fosse importante avere
la struttura. Più precisamente, abbiamo esplorato in quali circostanze gli utenti guardano
direttamente la struttura invece di vederla attraverso il tablet. I risultati suggeriscono che
uno spostamento dello sguardo dallo schermo all’oggetto fisico (una struttura nel nostro
caso) si verifica quando gli utenti cambiano posizione al fine di sostenere il loro orientamento
spaziale. Inoltre, le proprietà di tale spostamento dello sguardo (p.es. la durata) dipendono
dalle caratteristiche del compito che si sta svolgendo (p.es. la difficoltà) e della RA (p.es. la
stabilità).
v
Acknowledgements
Infine ci siamo concentrati sulla rappresentazione digitale delle forze presenti in una struttura.
Nel secondo studio abbiamo osservato che la manipolazione fisica non ha aiutato gli studenti
a comprendere come le forze interagiscono tra loro. La nostra soluzione è stata quella di
combinare una rappresentazione intuitiva (molle) con una leggermente più formale (frecce), in
modo da mostrare sia la natura delle forze sia l’interazione tra loro. Nel quarto studio, ventidue
studenti hanno utilizzato le due rappresentazioni e collaborato per risolvere dei problemi di
statica. Anche se hanno avuto difficoltà nell’interpretazione delle due rappresentazioni, ci
sono stati casi in cui gli studenti hanno mostrato una corretta intuizione dei principi di statica.
In questa tesi, oltre a descrivere il sistema progettato e gli studi, sono discusse anche implica-
zioni per direzioni di ricerca future.
Parole chiave: Realtà Aumentata, Tecnologie per l’Apprendimento, Approccio Qualitativo
alla Statica, Formazione Professionale, Interfaccia Utente Tangibile, Interazione Fisica, Realtà
Aumentata Magic-lens
vi
Contents
Acknowledgements i
Abstract iii
Abstract v
Contents vii
List of figures xiii
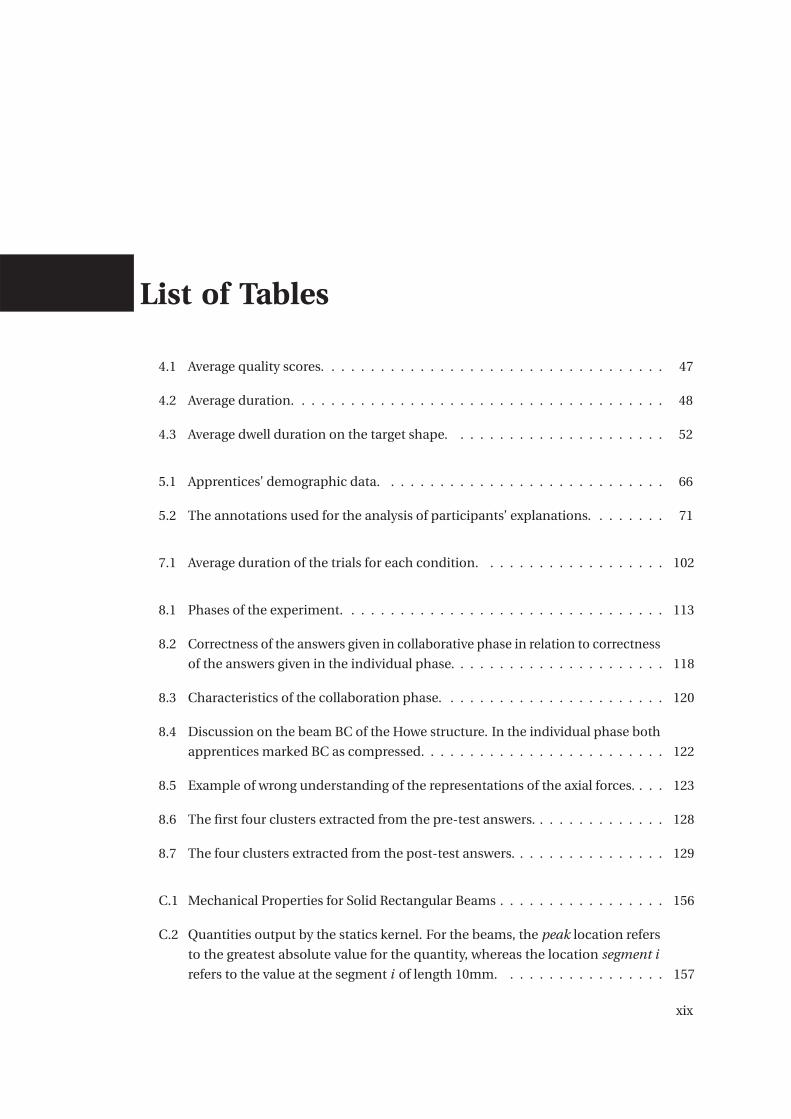
List of tables xix
1 Introduction 1
1.1 Motivation . . . . . . . . . . . . . . . . . . . . . . . . . . . . . . . . . . . . . . . . . 1
1.2 Research Objectives . . . . . . . . . . . . . . . . . . . . . . . . . . . . . . . . . . . 3
1.3 Thesis Roadmap . . . . . . . . . . . . . . . . . . . . . . . . . . . . . . . . . . . . . . 4
2 Related Work and Research Methodology 5
2.1 Qualitative or Conceptual Understanding of Physics Concepts . . . . . . . . . . 5
2.1.1 Technology-Enhanced Approaches for Learning Statics . . . . . . . . . . 7
2.2 Augmented Reality . . . . . . . . . . . . . . . . . . . . . . . . . . . . . . . . . . . . 10
2.2.1 Augmented Reality in the Learning Domain . . . . . . . . . . . . . . . . . 15
2.3 Refined Research Objectives . . . . . . . . . . . . . . . . . . . . . . . . . . . . . . 25
vii
Contents
2.3.1 Research Approach . . . . . . . . . . . . . . . . . . . . . . . . . . . . . . . . 26
2.3.2 Eye-Tracking Terminology . . . . . . . . . . . . . . . . . . . . . . . . . . . . 27
2.3.3 Pedagogical Framework . . . . . . . . . . . . . . . . . . . . . . . . . . . . . 28
3 Research Context 31
3.1 The Swiss Vocational Education System . . . . . . . . . . . . . . . . . . . . . . . . 31
3.1.1 School and Company: a Stormy Relationship . . . . . . . . . . . . . . . . 32
3.2 Carpentry Training in Switzerland . . . . . . . . . . . . . . . . . . . . . . . . . . . 35
3.2.1 The Role of Statics and Vocational Teachers’ Experience . . . . . . . . . . 35
3.2.2 Carpentry Structures: a Brief Introduction to Trusses and Frames . . . . 38
3.3 Conclusions . . . . . . . . . . . . . . . . . . . . . . . . . . . . . . . . . . . . . . . . 39
4 Study I: TUI Benefits through the Eye-Tracking Lens 41
4.1 Introduction . . . . . . . . . . . . . . . . . . . . . . . . . . . . . . . . . . . . . . . . 41
4.2 Experimental Setup . . . . . . . . . . . . . . . . . . . . . . . . . . . . . . . . . . . . 43
4.2.1 The Cutting Activity: a CAD Task to Train Carpenters’ Spatial Abilities . . 43
4.2.2 Experimental Conditions and Implementation . . . . . . . . . . . . . . . 43
4.2.3 Participants and Procedure . . . . . . . . . . . . . . . . . . . . . . . . . . . 45
4.3 Statistical Analysis and Findings . . . . . . . . . . . . . . . . . . . . . . . . . . . . 47
4.3.1 User Performance and Action Analysis . . . . . . . . . . . . . . . . . . . . 47
4.3.2 Gaze Analysis . . . . . . . . . . . . . . . . . . . . . . . . . . . . . . . . . . . 49
4.3.3 Findings from the Interviews . . . . . . . . . . . . . . . . . . . . . . . . . . 54
4.4 Discussion . . . . . . . . . . . . . . . . . . . . . . . . . . . . . . . . . . . . . . . . . 55
4.5 Conclusions . . . . . . . . . . . . . . . . . . . . . . . . . . . . . . . . . . . . . . . . 57
5 Study II: Gaining an Intuition of Statics from Physical Manipulation 59
5.1 Introduction . . . . . . . . . . . . . . . . . . . . . . . . . . . . . . . . . . . . . . . . 59
5.2 Experimental Setup . . . . . . . . . . . . . . . . . . . . . . . . . . . . . . . . . . . . 62
viii
Contents
5.2.1 Qualitative Truss Analysis: the Tension-Compression Task . . . . . . . . . 62
5.2.2 Experimental Conditions and Materials . . . . . . . . . . . . . . . . . . . . 62
5.2.3 Participants and Procedure . . . . . . . . . . . . . . . . . . . . . . . . . . . 65
5.3 Statistical Analysis and Findings . . . . . . . . . . . . . . . . . . . . . . . . . . . . 67
5.4 Discussion . . . . . . . . . . . . . . . . . . . . . . . . . . . . . . . . . . . . . . . . . 76
5.5 Conclusion . . . . . . . . . . . . . . . . . . . . . . . . . . . . . . . . . . . . . . . . . 79
6 StaticAR: Qualitative Statics through Augmented Reality 81
6.1 Technical Setup and Features . . . . . . . . . . . . . . . . . . . . . . . . . . . . . . 81
6.2 Creating Resources for the ’Erfahrraum’ Model . . . . . . . . . . . . . . . . . . . 93
6.3 Conclusions . . . . . . . . . . . . . . . . . . . . . . . . . . . . . . . . . . . . . . . . 94
7 Study III: Shifting the Gaze Between the Physical Object and Its Digital Representa-
tion 95
7.1 Introduction . . . . . . . . . . . . . . . . . . . . . . . . . . . . . . . . . . . . . . . . 95
7.2 Research Hypotheses . . . . . . . . . . . . . . . . . . . . . . . . . . . . . . . . . . . 96
7.3 Experimental Setup . . . . . . . . . . . . . . . . . . . . . . . . . . . . . . . . . . . . 98
7.3.1 Compression-Tension Task . . . . . . . . . . . . . . . . . . . . . . . . . . . 98
7.3.2 Experimental Conditions and Implementation . . . . . . . . . . . . . . . 98
7.3.3 Participants and Procedure . . . . . . . . . . . . . . . . . . . . . . . . . . . 99
7.4 Statistical Analysis and Findings . . . . . . . . . . . . . . . . . . . . . . . . . . . . 100
7.4.1 Descriptive Statistics . . . . . . . . . . . . . . . . . . . . . . . . . . . . . . . 102
7.5 Discussion . . . . . . . . . . . . . . . . . . . . . . . . . . . . . . . . . . . . . . . . . 106
7.6 Conclusions . . . . . . . . . . . . . . . . . . . . . . . . . . . . . . . . . . . . . . . . 109
8 Study IV: Evaluating a Visual Representation of Forces in a Collaborative Task 111
8.1 Introduction . . . . . . . . . . . . . . . . . . . . . . . . . . . . . . . . . . . . . . . . 111
8.2 Experimental Setup . . . . . . . . . . . . . . . . . . . . . . . . . . . . . . . . . . . . 112
ix
Contents
8.2.1 Participants . . . . . . . . . . . . . . . . . . . . . . . . . . . . . . . . . . . . 112
8.2.2 Procedure and Materials . . . . . . . . . . . . . . . . . . . . . . . . . . . . . 113
8.3 Statistical Analysis and Findings . . . . . . . . . . . . . . . . . . . . . . . . . . . . 116
8.4 Discussion . . . . . . . . . . . . . . . . . . . . . . . . . . . . . . . . . . . . . . . . . 130
8.5 Conclusions . . . . . . . . . . . . . . . . . . . . . . . . . . . . . . . . . . . . . . . . 134
9 General Discussion 135
9.1 Roadmap of the Results . . . . . . . . . . . . . . . . . . . . . . . . . . . . . . . . . 135
9.2 Contributions . . . . . . . . . . . . . . . . . . . . . . . . . . . . . . . . . . . . . . . 136
9.2.1 Fostering an Intuitive Understanding of Statics . . . . . . . . . . . . . . . 136
9.2.2 The role of physical objects in AR systems . . . . . . . . . . . . . . . . . . 138
9.3 Limitations . . . . . . . . . . . . . . . . . . . . . . . . . . . . . . . . . . . . . . . . . 139
9.4 Future Research Directions . . . . . . . . . . . . . . . . . . . . . . . . . . . . . . . 140
Appendices 143
A Appendix to Chapter 4 145
A.1 Questionnaire . . . . . . . . . . . . . . . . . . . . . . . . . . . . . . . . . . . . . . . 145
A.2 Paper Folding Test . . . . . . . . . . . . . . . . . . . . . . . . . . . . . . . . . . . . 146
B Appendix to Chapter 5 147
B.1 Presentation Page . . . . . . . . . . . . . . . . . . . . . . . . . . . . . . . . . . . . . 147
B.2 Demographic Data . . . . . . . . . . . . . . . . . . . . . . . . . . . . . . . . . . . . 148
B.3 Presentation of the Mental Rotation Test . . . . . . . . . . . . . . . . . . . . . . . 149
B.4 Statics Knowledge Test . . . . . . . . . . . . . . . . . . . . . . . . . . . . . . . . . . 150
C Appendix to Chapter 6 155
Bibliography 159
x

Contents
Curriculum Vitae 179
xi

List of Figures
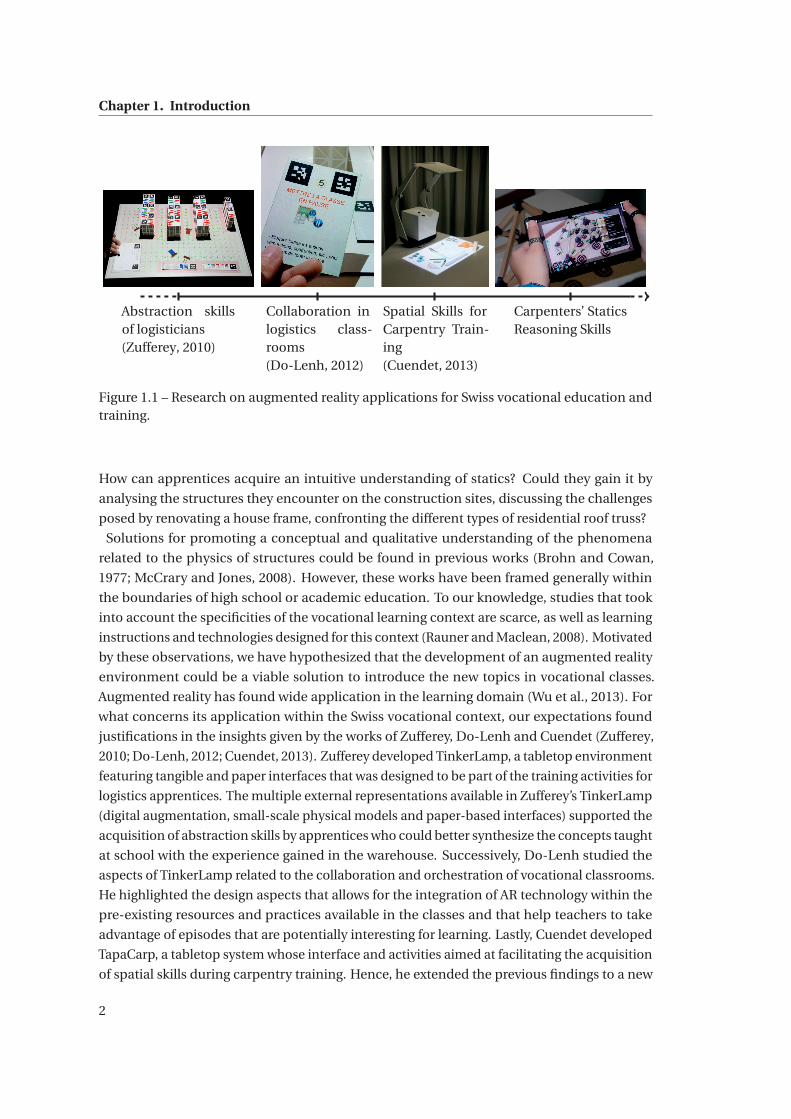
1.1 Research on augmented reality applications for Swiss vocational education and
training. . . . . . . . . . . . . . . . . . . . . . . . . . . . . . . . . . . . . . . . . . . 2
2.1 Brohn’s diagrammatic representation of the effect of a vertical force on a frame. 8
2.2 Armfield Ltd. tool for exploring structural behavior. . . . . . . . . . . . . . . . . . 8
2.3 EasyStatics: truss analysis example. . . . . . . . . . . . . . . . . . . . . . . . . . . 9
2.4 Catastrophe from Expedition Workshed. . . . . . . . . . . . . . . . . . . . . . . . 9
2.5 Augmentation of a supported beam from (Rodrigues et al., 2008). . . . . . . . . 10
2.6 Tangible user interfaces for physically-based deformation (Takouachet et al.,
2012). . . . . . . . . . . . . . . . . . . . . . . . . . . . . . . . . . . . . . . . . . . . . 10
2.7 Finite element analysis displayed on real-world objects (Huang et al., 2015). . . 10
2.8 A scene from “Who Framed Roger Rabbit?”. . . . . . . . . . . . . . . . . . . . . . 11
2.9 A scene from “Tron”. . . . . . . . . . . . . . . . . . . . . . . . . . . . . . . . . . . . 11
2.10 Reality-Virtuality Continuum from (Milgram et al., 1994). . . . . . . . . . . . . . 11
2.11 Vision-based tracking methods. . . . . . . . . . . . . . . . . . . . . . . . . . . . . 13
2.12 An illustration of the different locations of the displays, of the places where the
digital information could be shown (solid line) and of the two types of overlay
(planar or curved). Adapted from (Bimber and Raskar, 2006). . . . . . . . . . . . 14
2.13 Components of spatial cognition. Adapted from (Slijepcevic, 2013). . . . . . . . 16
2.14 Three AR systems for developing spatial abilities. . . . . . . . . . . . . . . . . . . 18
2.15 The tabletop system for learning about the behavior of light (Price and Falcão,
2009). . . . . . . . . . . . . . . . . . . . . . . . . . . . . . . . . . . . . . . . . . . . . 19
xiii
List of Figures
2.16 AR-Jam, an augmented storybook (Hornecker, 2012). . . . . . . . . . . . . . . . . 19
2.17 Ainsworth’s functional taxonomy of multiple representations (Ainsworth, 2006). 21
2.18 View management technique from (Tatzgern et al., 2014). . . . . . . . . . . . . . 22
2.19 Attention funnel technique from (Biocca et al., 2006). . . . . . . . . . . . . . . . 22
2.20 Thinker Environment: a learning environment for apprentices in logistics (Zuf-
ferey, 2010). . . . . . . . . . . . . . . . . . . . . . . . . . . . . . . . . . . . . . . . . 24
2.21 AR tabletop for creating concept-maps (Do-Lenh et al., 2009). . . . . . . . . . . 24
2.22 Eye-Tracking Events (text from Neuromancer, William Gibson, 1984). . . . . . . 27
2.23 SMI Eye Tracking Glasses specifications. . . . . . . . . . . . . . . . . . . . . . . . 27
3.1 The Swiss educational system and its possible paths. . . . . . . . . . . . . . . . . 31
3.2 Erfahrraum: a pedagogical model to inform the design of technology-enhanced
VET learning activities (Schwendimann et al., 2015). . . . . . . . . . . . . . . . . 33
3.3 Realto: online learning platform for vocational education (Realto). . . . . . . . . 34
3.4 Activities and tools for introducing topics related to mechanics. . . . . . . . . . 37
3.5 A scissors truss (credits: Montana Reclaimed Lumber Co). . . . . . . . . . . . . . 38
3.6 An example of frame: EPFL ArtLab (credits: espazium.ch). . . . . . . . . . . . . . 38
4.1 Example of a partial execution of the cutting activity. . . . . . . . . . . . . . . . . 43
4.2 E-TapaCarp setup for running TUI-based activities. . . . . . . . . . . . . . . . . . 44
4.3 The two interfaces. Same color corresponds same function in both implementa-
tions. . . . . . . . . . . . . . . . . . . . . . . . . . . . . . . . . . . . . . . . . . . . . 45
4.4 Styrofoam models. . . . . . . . . . . . . . . . . . . . . . . . . . . . . . . . . . . . . 46
4.5 Number of fragments created. . . . . . . . . . . . . . . . . . . . . . . . . . . . . . 48
4.6 Areas of interest. . . . . . . . . . . . . . . . . . . . . . . . . . . . . . . . . . . . . . 50
4.7 Proportions of dwells for each representation-AOI. . . . . . . . . . . . . . . . . . 50
4.8 Percentages of UI events happening while the users are looking at the block. . . 51
4.9 Transitions among the AOIs. . . . . . . . . . . . . . . . . . . . . . . . . . . . . . . 53
xiv
List of Figures
4.10 The two possible approaches for creating the shape 1. . . . . . . . . . . . . . . . 54
5.1 Prototype of a physical model to explore statics. . . . . . . . . . . . . . . . . . . . 60
5.2 Details of the spring mechanism. . . . . . . . . . . . . . . . . . . . . . . . . . . . . 61
5.3 A hinged joint. . . . . . . . . . . . . . . . . . . . . . . . . . . . . . . . . . . . . . . . 61
5.4 Wooden strip to lock the spring mechanism. . . . . . . . . . . . . . . . . . . . . . 61
5.5 Example of question item from the statics knowledge test. . . . . . . . . . . . . . 64
5.6 The eight trials used in the experiment. . . . . . . . . . . . . . . . . . . . . . . . . 64
5.7 The setup of the experiment. . . . . . . . . . . . . . . . . . . . . . . . . . . . . . . 67
5.8 Participants’ scores in pre-test, intervention and post-test. . . . . . . . . . . . . 68
5.9 Relative Learning Gain. . . . . . . . . . . . . . . . . . . . . . . . . . . . . . . . . . 68
5.10 Task duration for each trial. . . . . . . . . . . . . . . . . . . . . . . . . . . . . . . . 69
5.11 Apprentices’ scores in the intervention phase. . . . . . . . . . . . . . . . . . . . . 70
5.12 Ratio of correct answers for each phase and force type. . . . . . . . . . . . . . . . 73
5.13 Percentage of fixations on the joints. . . . . . . . . . . . . . . . . . . . . . . . . . . 74
5.14 Kullback-Leibler divergence of the apprentices’ distribution of fixations com-
pared to the experts’ one. . . . . . . . . . . . . . . . . . . . . . . . . . . . . . . . . 75
5.15 Saliency map for model 4. . . . . . . . . . . . . . . . . . . . . . . . . . . . . . . . . 75
5.16 Saliency map for model 5. . . . . . . . . . . . . . . . . . . . . . . . . . . . . . . . . 75
6.1 StaticAR. . . . . . . . . . . . . . . . . . . . . . . . . . . . . . . . . . . . . . . . . . . 82
6.2 Examples of roof models available in carpentry schools. . . . . . . . . . . . . . . 83
6.3 Hexagonal tile. . . . . . . . . . . . . . . . . . . . . . . . . . . . . . . . . . . . . . . . 84
6.4 The utility to create the configuration file containing the positions of the fiducial
markers. . . . . . . . . . . . . . . . . . . . . . . . . . . . . . . . . . . . . . . . . . . 84
6.5 Comparison between marker detection libraries. . . . . . . . . . . . . . . . . . . 85
6.6 Example of configuration file describing a structure. . . . . . . . . . . . . . . . . 87
xv
List of Figures
6.7 Class diagram of the entities constituting StaticAR. The model classes are de-
picted in blue (top) whereas the related view classes are in white (bottom). . . . 88
6.8 Frame3DD benchmark. . . . . . . . . . . . . . . . . . . . . . . . . . . . . . . . . . 89
6.9 The main augmentation displayed in StaticAR. . . . . . . . . . . . . . . . . . . . 90
6.10 The tab views for editing the loads, the property of the beams and the supports
at the joints. . . . . . . . . . . . . . . . . . . . . . . . . . . . . . . . . . . . . . . . . 91
6.11 Complementary representations of the forces acting at a joint, global deforma-
tion and stresses in the beams. . . . . . . . . . . . . . . . . . . . . . . . . . . . . . 92
6.12 Application for drawing structures at the workplace. . . . . . . . . . . . . . . . . 93
7.1 Compression-Tension Task implementation. . . . . . . . . . . . . . . . . . . . . . 98
7.2 Experimental conditions. . . . . . . . . . . . . . . . . . . . . . . . . . . . . . . . . 99
7.3 Experimental materials and procedure. . . . . . . . . . . . . . . . . . . . . . . . . 101
7.4 Percentage of fixations on the real-world structures. . . . . . . . . . . . . . . . . 103
7.5 Normalized histogram of the fixation on the structure with respect to the nor-
malized trial time. . . . . . . . . . . . . . . . . . . . . . . . . . . . . . . . . . . . . . 103
7.6 Distribution of the tablet positions around the real-world structures. . . . . . . 104
7.7 Temporal distribution of the shift towards the physical structure in relation to
the change of position. High density in the central part suggests a temporal
proximity between changing position and looking at the structure. . . . . . . . . 105
7.8 Participants physically interacting with the structures. . . . . . . . . . . . . . . . 107
8.1 The four structures used in the compression-tension task. . . . . . . . . . . . . . 115
8.2 Representation of forces by springs or arrows. . . . . . . . . . . . . . . . . . . . . 115
8.3 The answer sheet attached to the tablet. . . . . . . . . . . . . . . . . . . . . . . . 115
8.4 Scores in pre-test and post-test. The single dash line connects the scores of a
single participant. . . . . . . . . . . . . . . . . . . . . . . . . . . . . . . . . . . . . . 117
8.5 Distribution of correct answers in the pre-test and post-test. . . . . . . . . . . . 117
8.6 Distribution of correct answers in the compression-tension task. . . . . . . . . . 118
8.7 Dominance in the collaboration phase. . . . . . . . . . . . . . . . . . . . . . . . . 119
xvi
List of Figures
8.8 Relation between similarity of the pair based on the pre-test and the ratio of
correct answers given to the questions participants did not agree on. . . . . . . 119
8.9 Body gestures complementing the explanations. . . . . . . . . . . . . . . . . . . 121
8.10 Direction of the forces due to external loads. Some apprentices related the
direction of the force to the orientation of the digital mesh. . . . . . . . . . . . . 123
8.11 Displacement of the joints in the structure Howe (red). Six apprentices imagined
that the joint F would slide on the right following the joint H (orange arrows). . 123
8.12 Misuse of the arrow notation in the post-test. . . . . . . . . . . . . . . . . . . . . 125
8.13 Transitions from the clusters found in the pre-test to the ones found in the
post-test. . . . . . . . . . . . . . . . . . . . . . . . . . . . . . . . . . . . . . . . . . . 127
8.14 Orchestration graph for a future scenario that includes the compression-tension
task. . . . . . . . . . . . . . . . . . . . . . . . . . . . . . . . . . . . . . . . . . . . . . 132
8.15 Orchestration graph for PFL scenario about the concept of zero-force members. 134
9.1 Relative learning gains in the studies of chapters 5 and 8 . . . . . . . . . . . . . . 137
C.1 Input image used for the comparison of the marker detection libraries. . . . . . 155
xvii

List of Tables
4.1 Average quality scores. . . . . . . . . . . . . . . . . . . . . . . . . . . . . . . . . . . 47
4.2 Average duration. . . . . . . . . . . . . . . . . . . . . . . . . . . . . . . . . . . . . . 48
4.3 Average dwell duration on the target shape. . . . . . . . . . . . . . . . . . . . . . 52
5.1 Apprentices’ demographic data. . . . . . . . . . . . . . . . . . . . . . . . . . . . . 66
5.2 The annotations used for the analysis of participants’ explanations. . . . . . . . 71
7.1 Average duration of the trials for each condition. . . . . . . . . . . . . . . . . . . 102
8.1 Phases of the experiment. . . . . . . . . . . . . . . . . . . . . . . . . . . . . . . . . 113
8.2 Correctness of the answers given in collaborative phase in relation to correctness
of the answers given in the individual phase. . . . . . . . . . . . . . . . . . . . . . 118
8.3 Characteristics of the collaboration phase. . . . . . . . . . . . . . . . . . . . . . . 120
8.4 Discussion on the beam BC of the Howe structure. In the individual phase both
apprentices marked BC as compressed. . . . . . . . . . . . . . . . . . . . . . . . . 122
8.5 Example of wrong understanding of the representations of the axial forces. . . . 123
8.6 The first four clusters extracted from the pre-test answers. . . . . . . . . . . . . . 128
8.7 The four clusters extracted from the post-test answers. . . . . . . . . . . . . . . . 129
C.1 Mechanical Properties for Solid Rectangular Beams . . . . . . . . . . . . . . . . . 156
C.2 Quantities output by the statics kernel. For the beams, the peak location refers
to the greatest absolute value for the quantity, whereas the location segment i
refers to the value at the segment i of length 10mm. . . . . . . . . . . . . . . . . 157
xix

List of Tables
C.3 Stress Types and the Formulas used to compete the stress in relation to the
material. . . . . . . . . . . . . . . . . . . . . . . . . . . . . . . . . . . . . . . . . . . 157
xx
1 Introduction
1.1 Motivation
The brochure of the Holzbau-Schweiz, a large association of Swiss carpentry industrialists, de-
clares that “no other country provides a better training in wooden carpentry than Switzerland
does” (Holzbau-Schweiz, b). The training is mostly based on the alternation between school
and workplace: apprentices spend part of the week at the vocational school and the rest at
the companies with which they have a contract. In 2013 a new ordinance related to carpentry
apprenticeship was issued (Holzbau-Schweiz, c). The ordinance extended the apprenticeship
duration from 3 years to 4 years in order to meet the requirements of the job market. Among
the eleven new training topics that have become part of the curriculum, one is statics and
physics of structures.
Carpenters who have completed the four-year apprenticeships are not supposed to check the
stability and safety of the structures they work on. However, they are responsible for the correct
execution of jobs, following the instructions received from carpentry foremen, architects or
engineers. In a report about the principal causes of failures in timber constructions from
the division of structural engineering of the Lund University (Frühwald and Thelandersson,
2008), the authors found that 19.7% of the failures are due to errors during the erection of the
structures on the construction site. Even though Switzerland was not included in this report,
it implicitly shows the reasons why a correct intuitive understanding of statics is a necessary
competence to be acquired during the apprenticeship.
The relevance of statics has been increased rather than introduced from scratch. The old
curriculum mostly encompassed the analysis of simple systems (e.g. a cantilever beam) and
the principles of mechanical properties of materials. For these introductory topics, teachers
could rely on a variety of physical materials and practical examples to complement their
lessons, and, consequently, apprentices could appreciate the concreteness of what is written
in their textbooks. The practical approach, however, does not suit well complex scenarios,
thus the need for new tools that could assist teachers and students to meet the new learning
objectives.
1
Chapter 1. Introduction
Abstraction skillsof logisticians(Zufferey, 2010)
Collaboration inlogistics class-rooms(Do-Lenh, 2012)
Spatial Skills forCarpentry Train-ing(Cuendet, 2013)
Carpenters’ StaticsReasoning Skills
Figure 1.1 – Research on augmented reality applications for Swiss vocational education andtraining.
How can apprentices acquire an intuitive understanding of statics? Could they gain it by
analysing the structures they encounter on the construction sites, discussing the challenges
posed by renovating a house frame, confronting the different types of residential roof truss?
Solutions for promoting a conceptual and qualitative understanding of the phenomena
related to the physics of structures could be found in previous works (Brohn and Cowan,
1977; McCrary and Jones, 2008). However, these works have been framed generally within
the boundaries of high school or academic education. To our knowledge, studies that took
into account the specificities of the vocational learning context are scarce, as well as learning
instructions and technologies designed for this context (Rauner and Maclean, 2008). Motivated
by these observations, we have hypothesized that the development of an augmented reality
environment could be a viable solution to introduce the new topics in vocational classes.
Augmented reality has found wide application in the learning domain (Wu et al., 2013). For
what concerns its application within the Swiss vocational context, our expectations found
justifications in the insights given by the works of Zufferey, Do-Lenh and Cuendet (Zufferey,
2010; Do-Lenh, 2012; Cuendet, 2013). Zufferey developed TinkerLamp, a tabletop environment
featuring tangible and paper interfaces that was designed to be part of the training activities for
logistics apprentices. The multiple external representations available in Zufferey’s TinkerLamp
(digital augmentation, small-scale physical models and paper-based interfaces) supported the
acquisition of abstraction skills by apprentices who could better synthesize the concepts taught
at school with the experience gained in the warehouse. Successively, Do-Lenh studied the
aspects of TinkerLamp related to the collaboration and orchestration of vocational classrooms.
He highlighted the design aspects that allows for the integration of AR technology within the
pre-existing resources and practices available in the classes and that help teachers to take
advantage of episodes that are potentially interesting for learning. Lastly, Cuendet developed
TapaCarp, a tabletop system whose interface and activities aimed at facilitating the acquisition
of spatial skills during carpentry training. Hence, he extended the previous findings to a new
2
1.2. Research Objectives
profession and also provided a contribution to the research about the benefits of tangible
interaction in AR learning technologies.
The work described in this thesis concerns the adoption of augmented reality for the purpose
of a new pedagogical challenge.
This work has given us the opportunity to investigate aspects of AR technologies that are
not strictly related to the learning context. In particular, we investigated how the presence
of physical objects impacts users’ experience in mixed-reality systems. Physical objects can
provide input (e.g. Tangible User Interfaces) and, in such a case, the design of their appearance
goes hand in hand with the design of their functions in the digital space. This implies the
need for guidelines to explore the design space, as well as the need for empirical studies upon
which refining these guidelines (Marshall, 2007; Antle and Wise, 2013). Even when the physical
surroundings are not explicitly meant to be functional in the AR experience, their presence
has an impact on the users’ perception of the space, whether it is the physical space or the
augmented space. Understanding how users move between and within these spaces is crucial
to better characterize the technologies that populate the mixed reality continuum. It can also
contribute to the implementation of mechanisms that sustain users’ perception in immersive
digital environments.
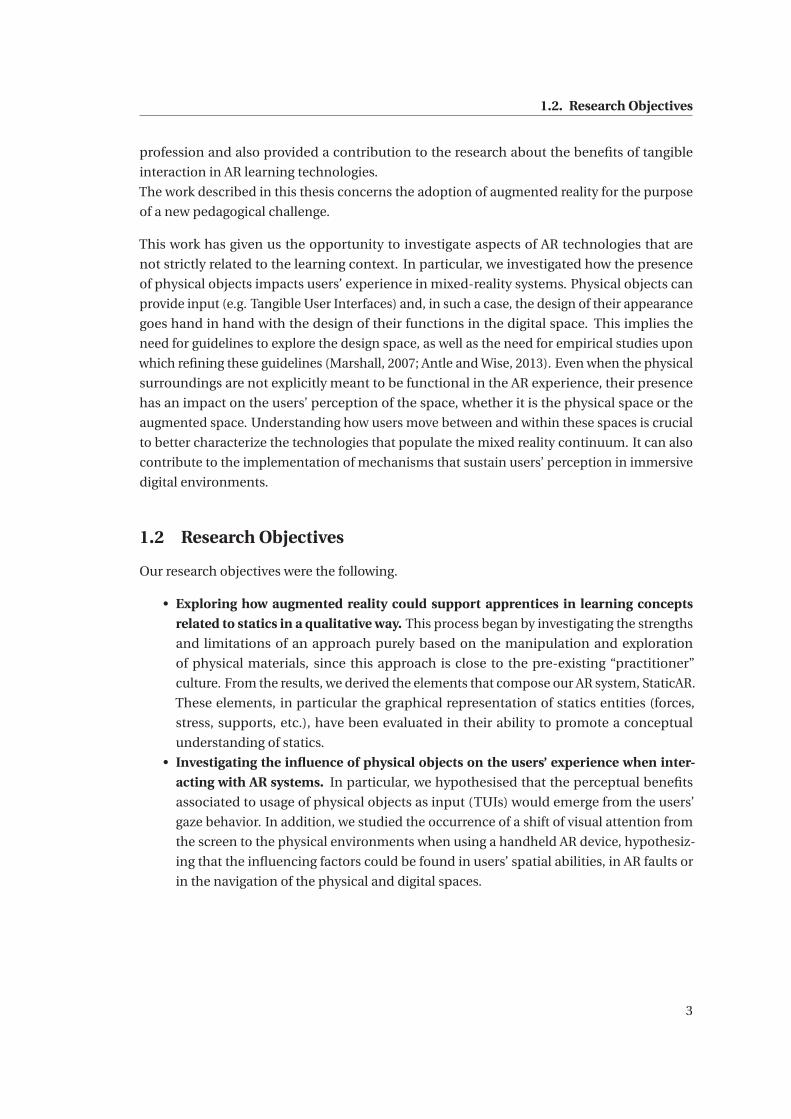
1.2 Research Objectives
Our research objectives were the following.
• Exploring how augmented reality could support apprentices in learning concepts
related to statics in a qualitative way. This process began by investigating the strengths
and limitations of an approach purely based on the manipulation and exploration
of physical materials, since this approach is close to the pre-existing “practitioner”
culture. From the results, we derived the elements that compose our AR system, StaticAR.
These elements, in particular the graphical representation of statics entities (forces,
stress, supports, etc.), have been evaluated in their ability to promote a conceptual
understanding of statics.
• Investigating the influence of physical objects on the users’ experience when inter-
acting with AR systems. In particular, we hypothesised that the perceptual benefits
associated to usage of physical objects as input (TUIs) would emerge from the users’
gaze behavior. In addition, we studied the occurrence of a shift of visual attention from
the screen to the physical environments when using a handheld AR device, hypothesiz-
ing that the influencing factors could be found in users’ spatial abilities, in AR faults or
in the navigation of the physical and digital spaces.
3
Chapter 1. Introduction
1.3 Thesis Roadmap
The next chapter clarifies the concept of qualitative understanding and provides an overview
of the pedagogical practices and technologies employed to promote it in the fields of statics
and analysis of structural behavior. This chapter presents also the features of the augmented
reality technology, along with the bases for its adoption as a learning technology. The last
part of the chapter introduces the research methodology and the terminology related to the
eye-tracking methods which have been used in three of the studies we conducted.
Chapter 3 completes the introduction by presenting the Swiss vocational eduction system
and the dual approach school-workplace. It also describes our research framed within Dual-T
project, a research program founded by the Swiss State Secretariat for Education, Research
and Innovation. In a nutshell, the program aims at bridging the dual contexts of vocational
education, school and workplace, through technologies that allow apprentices to share their
experiences between these two contexts. Finally, the carpentry training and the role of statics
in it, including the suggestions and recommendations of the teachers collected during these
four years, conclude this chapter.
The studies that have been conducted are described in chapters 4, 5, 7 and 8. The first study
and the third one (chapters 4 and 7) investigated aspects related to the usage of physical
entities in AR systems based respectively on tangible interaction and on handheld devices.
The study in chapter 5 explored the effectiveness of hands-on strategies for our learning
objectives. Based on the results of the study we designed StaticAR, which is presented in
chapter 6. In chapter 8, StaticAR has been used to run a collaborative activity involving pairs
of apprentices. This last study explored how apprentices statics’ reasoning was affected by the
graphical representations displayed by StaticAR and it identified common difficulties among
the learners.
The main findings of our work, its limitations and the future research directions that derived
from it are finally summarized in chapter 9.
4
2 Related Work and Research Methodol-ogy
The work presented in this thesis has been built upon multiple areas of research which
can be categorized in the two macro blocks of Learning Science and Human-Computer
Interaction. The first section of this chapter reviews the works that are relevant to qualitative
physics, statics and structural behavior, which belong mostly to educational research in STEM
fields (engineering, architecture, etc.). The second section is dedicated to Augmented Reality,
including a parenthesis on tangible interaction and Tangible User Interfaces. This section
provides an introduction to such technologies and outlines the bases for the adoption of
augmented reality in the educational domain. The last section concludes this chapter by
recalling our research objectives and explains their contribution to previous works. Moreover,
it presents the research methodology and the eye-tracking terminology that we used in three
of our studies.
2.1 Qualitative or Conceptual Understanding of Physics Concepts
Throughout this thesis, the use of terms like qualitative, intuitive or conceptual understanding
of physics concepts is recurrent and almost interchangeable. Hence an analysis of their
meaning is essential for a better understanding of the topic.
The word qualitative usually opposes to quantitative and denotes an understanding through
reasoning processes that relies on discrete representations of the physics behaviors rather
than on continuous quantities (Bredeweg and Struss, 2003). Reformulating the example of
Forbus about how a moka pot works (Forbus, 1990), the answer given by most people denotes
a qualitative understanding of such process. People usually know that the bottom chamber
should be filled with water that gets heated up and generates steam. They probably know that
the steam pushes the water and so the coffee comes out. As a consequence, people are aware
of the danger of explosions in case the two parts are not tight, although a safety valve is present.
This knowledge is not associated to the myriad of equations describing the thermodynamics
process, yet it is powerful enough to correctly describe the process and to achieve the goal of
making coffee.
5
Chapter 2. Related Work and Research Methodology
In this thesis, the adjective intuitive has often a positive value, however unusual this might
seem to the reader. In cognitive science literature, this term could be found as synonymous of
naïve or folk knowledge which have been used mainly with a negative connotation to indicate
the body of common-sense beliefs that learners exhibit (Keil, 2003). The negative connotation
comes from the fact that these beliefs (or intuitions) are identified with the pre-existing
erroneous conceptual knowledge which represent the main obstacle to the development of a
correct understanding (Vosniadou, 2002). Conversely, I use the expression gaining an intuitive
understanding to denote the acquisition of a correct and informal common-sense knowledge,
as the one reported by Roschelle and Greeno when describing how experienced physicists
approach a physics problem (Roschelle and Greeno, 1987), and to refer to development of the
ability to rapidly evoke particular aspects relevant to the problem and its solution observed by
Lakin (Larkin et al., 1980).
Conceptual understanding appears often together with qualitative reasoning within the ed-
ucational literature. Although the word conceptual is widely employed, it refers to a vague
idea of deep knowledge which has not been clearly defined yet (Sands, 2014). Scott, Asoko,
and Leach (Scott et al., 2007) defined concepts as “basic units of knowledge that can be accu-
mulated, gradually refined, and combined to form ever richer cognitive structures”. Similarly,
Rittle-Johnson (Rittle-Johnson, 2006) explained “conceptual knowledge as the understanding
principles governing a domain and the interrelations between units of knowledge in a domain”,
which is opposed to procedural knowledge, namely the ability to perform actions in order to
solve a problem in a familiar context.
Without going any further on the general discussion about the meaning of conceptual, in
regards to statics and structural behaviour the term will refer to the mastering of structural
knowledge as seen by Pier Luigi Nervi:
The mastering of structural knowledge is not synonymous with the knowledge of
those mathematical developments which today constitute the so-called theory
of structures. It is the result of a physical understanding of the complex behavior
of a building, coupled with an intuitive interpretation of theoretical calculations.
((Pedron, 2006, citation of Pier Luigi Nervi,1956))
It is noteworthy that this interpretation does not neglect the quantitative aspect, but it rather
suggests conceptual understanding as a necessary complement and precondition to the
successful interpretation of the numerical results.
What are the difficulties in gaining qualitative understandings of statics? Typical mistakes are
related to the identification of the external forces acting on a single body, to the description
of how the forces from multiple bodies interact with each other, or to the specification of the
conditions for the static equilibrium (Steif and Dantzler, 2005; Call et al., 2015; Yilmaz, 2010).
The difficulties in correctly achieving these tasks can be traced back to the misconceptions
associated to Newtonian mechanics. Hestenes and colleagues delineated a taxonomy of com-
mon misconceptions exhibited by students in (Hestenes et al., 1992). From their taxonomy the
6
2.1. Qualitative or Conceptual Understanding of Physics Concepts
authors derived the “Force Concept Inventory”, a tool to assess the conceptual understanding
of forces and motion. The origin of many of these beliefs is related to what is observed during
the everyday experience. For instance, a widely known misconception is that the motion of a
body implies the presence of an active force. The justification is that bodies are naturally at
rest in the daily experience and that they move only when pushed or pulled. Another example
related to the 3rd law of Newton is the common belief that the force exerted by a large body on
a small one is stronger than the reaction force exerted by the small body.
The fact that these misconceptions are so rooted in the everyday phenomena makes them
difficult to replace and it poses a challenge to learners who have to solve a conflict between a
new piece of information and the pre-existing knowledge. Ploetzner and VanLehn (Ploetzner
and VanLehn, 1997) attributed the failure in gaining qualitative knowledge to three possible
causes: (1) important information could not have been presented to learners; (2) learners
could not have had enough time to familiarize with a new concept; (3) students might not
have engaged enough in the learning activity in order to accommodate the new piece of
information within their pre-knowledge in order to solve possible misconceptions. The first
two issues can be addressed by improving the instructional materials, for example adopting
alternative representations for the same concept (de Dios Jiménez-Valladares and Perales-
Palacios, 2001; Hinrichs, 2005; Savinainen et al., 2013). The latter requires the adoption of
teaching strategies promoting a conceptual change. The success of any educational strategies
(e.g. collaborative activities, problem-based works, etc. ) depends on the extent to which the
learners’ misconceptions and misunderstanding emerge during the learning activity and how
their change is promoted (Guzzetti et al., 1993; Schroeder et al., 2007).
2.1.1 Technology-Enhanced Approaches for Learning Statics
According to Brohn and Cowan (Brohn and Cowan, 1977), qualitative understanding is “un-
likely to be learnt as a by-product of quantitative analysis. It is worthy of consideration and
treatment in its own right, and requires special attention”. Among the available textbooks that
approach the subject from such angle, it is worth to mention Brohn’s Understanding Structural
Analysis (Brohn, 2008). The book has been structured as a series of worked exercises about
different topics (trusses, frames, arches, etc.) in which the author created a graphical language
and diagrammatic exploration in order to guide the learner in analysing structural behavior
(Figure 2.1). Interestingly, in the recent years, the book became also part of a commercial
educational tool for teaching structural analysis by Armfield Ltd (Armfield, Figure 2.2). The
tool features a software that uses the same visual language adopted in the book to represent
the effects of loads on the structures. In addition, sensors and actuators could be interfaced
with the software in order to setup hands-on experiments.
This kind of integration of active learning sessions along with the traditional textbook-based
ones is perceived to be particularly useful by students who crave for “seeing” what they
learn on the books. As a consequence, some universities have reformed their curricula to
accommodate this need. At the EPFL, the course “Structures I” is provided in form of MOOC
7
Chapter 2. Related Work and Research Methodology
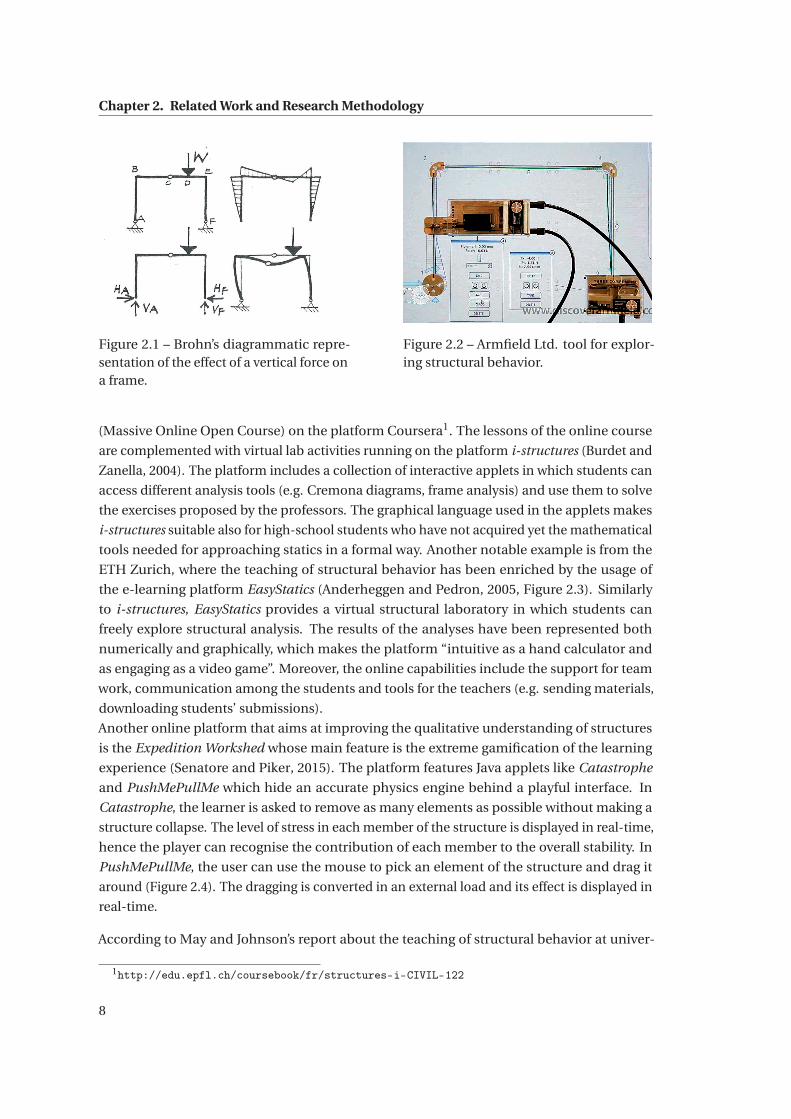
Figure 2.1 – Brohn’s diagrammatic repre-sentation of the effect of a vertical force ona frame.
Figure 2.2 – Armfield Ltd. tool for explor-ing structural behavior.
(Massive Online Open Course) on the platform Coursera1. The lessons of the online course
are complemented with virtual lab activities running on the platform i-structures (Burdet and
Zanella, 2004). The platform includes a collection of interactive applets in which students can
access different analysis tools (e.g. Cremona diagrams, frame analysis) and use them to solve
the exercises proposed by the professors. The graphical language used in the applets makes
i-structures suitable also for high-school students who have not acquired yet the mathematical
tools needed for approaching statics in a formal way. Another notable example is from the
ETH Zurich, where the teaching of structural behavior has been enriched by the usage of
the e-learning platform EasyStatics (Anderheggen and Pedron, 2005, Figure 2.3). Similarly
to i-structures, EasyStatics provides a virtual structural laboratory in which students can
freely explore structural analysis. The results of the analyses have been represented both
numerically and graphically, which makes the platform “intuitive as a hand calculator and
as engaging as a video game”. Moreover, the online capabilities include the support for team
work, communication among the students and tools for the teachers (e.g. sending materials,
downloading students’ submissions).
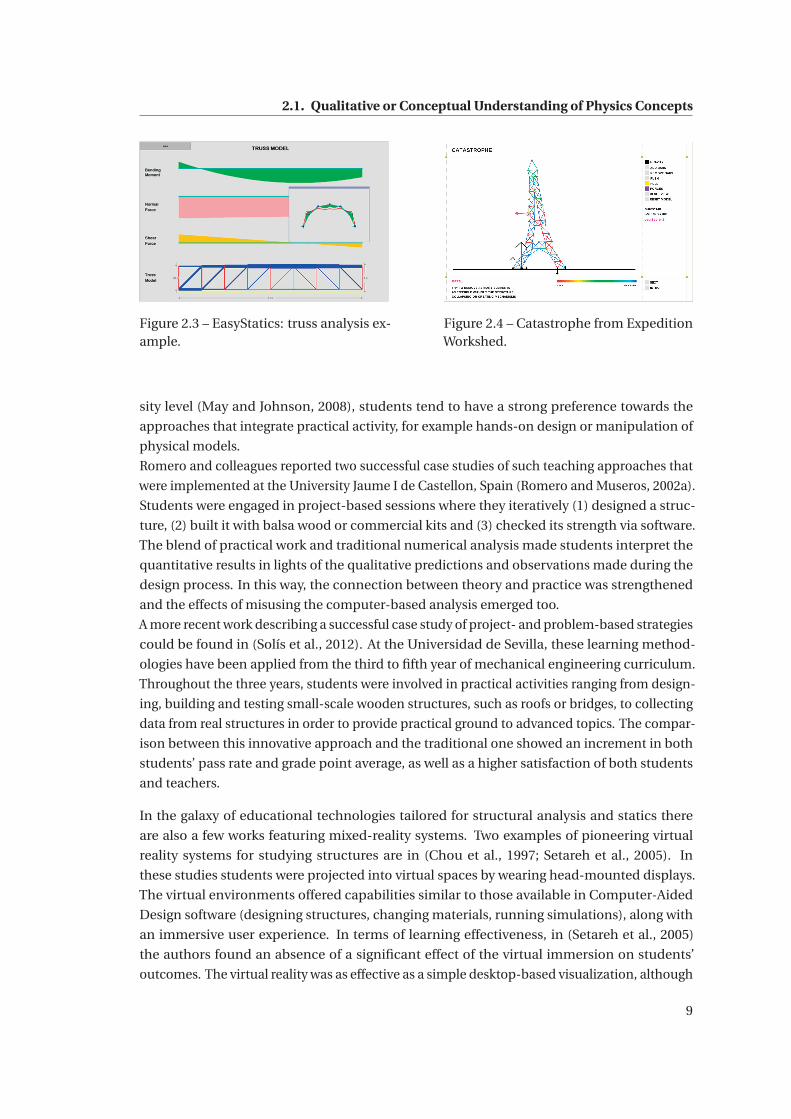
Another online platform that aims at improving the qualitative understanding of structures
is the Expedition Workshed whose main feature is the extreme gamification of the learning
experience (Senatore and Piker, 2015). The platform features Java applets like Catastrophe
and PushMePullMe which hide an accurate physics engine behind a playful interface. In
Catastrophe, the learner is asked to remove as many elements as possible without making a
structure collapse. The level of stress in each member of the structure is displayed in real-time,
hence the player can recognise the contribution of each member to the overall stability. In
PushMePullMe, the user can use the mouse to pick an element of the structure and drag it
around (Figure 2.4). The dragging is converted in an external load and its effect is displayed in
real-time.
According to May and Johnson’s report about the teaching of structural behavior at univer-
1http://edu.epfl.ch/coursebook/fr/structures-i-CIVIL-122
8
2.1. Qualitative or Conceptual Understanding of Physics Concepts
Figure 2.3 – EasyStatics: truss analysis ex-ample.
Figure 2.4 – Catastrophe from ExpeditionWorkshed.
sity level (May and Johnson, 2008), students tend to have a strong preference towards the
approaches that integrate practical activity, for example hands-on design or manipulation of
physical models.
Romero and colleagues reported two successful case studies of such teaching approaches that
were implemented at the University Jaume I de Castellon, Spain (Romero and Museros, 2002a).
Students were engaged in project-based sessions where they iteratively (1) designed a struc-
ture, (2) built it with balsa wood or commercial kits and (3) checked its strength via software.
The blend of practical work and traditional numerical analysis made students interpret the
quantitative results in lights of the qualitative predictions and observations made during the
design process. In this way, the connection between theory and practice was strengthened
and the effects of misusing the computer-based analysis emerged too.
A more recent work describing a successful case study of project- and problem-based strategies
could be found in (Solís et al., 2012). At the Universidad de Sevilla, these learning method-
ologies have been applied from the third to fifth year of mechanical engineering curriculum.
Throughout the three years, students were involved in practical activities ranging from design-
ing, building and testing small-scale wooden structures, such as roofs or bridges, to collecting
data from real structures in order to provide practical ground to advanced topics. The compar-
ison between this innovative approach and the traditional one showed an increment in both
students’ pass rate and grade point average, as well as a higher satisfaction of both students
and teachers.
In the galaxy of educational technologies tailored for structural analysis and statics there
are also a few works featuring mixed-reality systems. Two examples of pioneering virtual
reality systems for studying structures are in (Chou et al., 1997; Setareh et al., 2005). In
these studies students were projected into virtual spaces by wearing head-mounted displays.
The virtual environments offered capabilities similar to those available in Computer-Aided
Design software (designing structures, changing materials, running simulations), along with
an immersive user experience. In terms of learning effectiveness, in (Setareh et al., 2005)
the authors found an absence of a significant effect of the virtual immersion on students’
outcomes. The virtual reality was as effective as a simple desktop-based visualization, although
9
Chapter 2. Related Work and Research Methodology
more engaging and more natural to interact with.
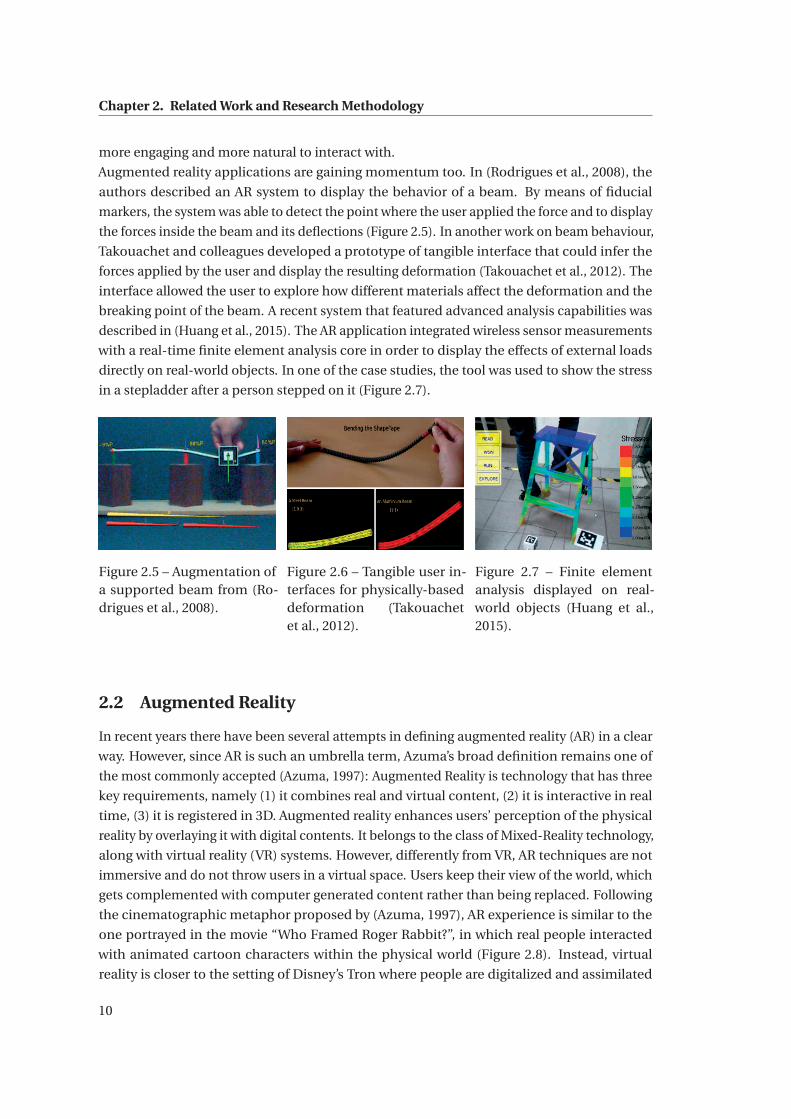
Augmented reality applications are gaining momentum too. In (Rodrigues et al., 2008), the
authors described an AR system to display the behavior of a beam. By means of fiducial
markers, the system was able to detect the point where the user applied the force and to display
the forces inside the beam and its deflections (Figure 2.5). In another work on beam behaviour,
Takouachet and colleagues developed a prototype of tangible interface that could infer the
forces applied by the user and display the resulting deformation (Takouachet et al., 2012). The
interface allowed the user to explore how different materials affect the deformation and the
breaking point of the beam. A recent system that featured advanced analysis capabilities was
described in (Huang et al., 2015). The AR application integrated wireless sensor measurements
with a real-time finite element analysis core in order to display the effects of external loads
directly on real-world objects. In one of the case studies, the tool was used to show the stress
in a stepladder after a person stepped on it (Figure 2.7).
Figure 2.5 – Augmentation ofa supported beam from (Ro-drigues et al., 2008).
Figure 2.6 – Tangible user in-terfaces for physically-baseddeformation (Takouachetet al., 2012).
Figure 2.7 – Finite elementanalysis displayed on real-world objects (Huang et al.,2015).
2.2 Augmented Reality
In recent years there have been several attempts in defining augmented reality (AR) in a clear
way. However, since AR is such an umbrella term, Azuma’s broad definition remains one of
the most commonly accepted (Azuma, 1997): Augmented Reality is technology that has three
key requirements, namely (1) it combines real and virtual content, (2) it is interactive in real
time, (3) it is registered in 3D. Augmented reality enhances users’ perception of the physical
reality by overlaying it with digital contents. It belongs to the class of Mixed-Reality technology,
along with virtual reality (VR) systems. However, differently from VR, AR techniques are not
immersive and do not throw users in a virtual space. Users keep their view of the world, which
gets complemented with computer generated content rather than being replaced. Following
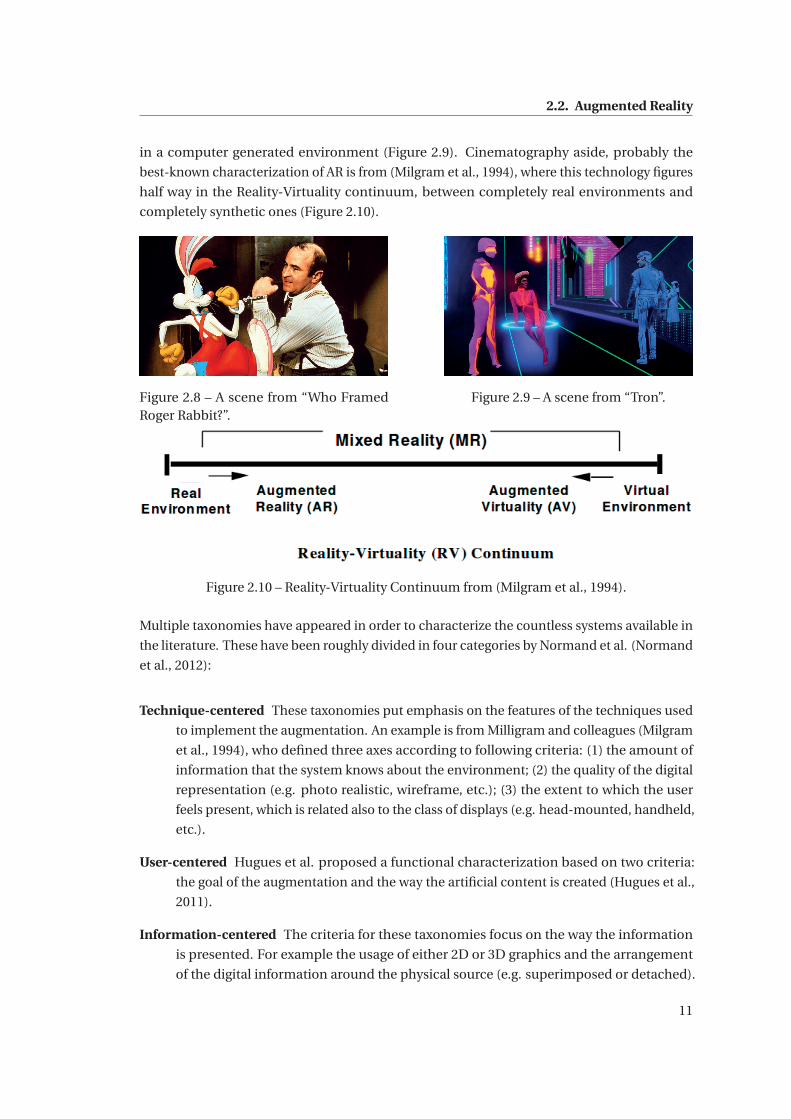
the cinematographic metaphor proposed by (Azuma, 1997), AR experience is similar to the
one portrayed in the movie “Who Framed Roger Rabbit?”, in which real people interacted
with animated cartoon characters within the physical world (Figure 2.8). Instead, virtual
reality is closer to the setting of Disney’s Tron where people are digitalized and assimilated
10
2.2. Augmented Reality
in a computer generated environment (Figure 2.9). Cinematography aside, probably the
best-known characterization of AR is from (Milgram et al., 1994), where this technology figures
half way in the Reality-Virtuality continuum, between completely real environments and
completely synthetic ones (Figure 2.10).
Figure 2.8 – A scene from “Who FramedRoger Rabbit?”.
Figure 2.9 – A scene from “Tron”.
Figure 2.10 – Reality-Virtuality Continuum from (Milgram et al., 1994).
Multiple taxonomies have appeared in order to characterize the countless systems available in
the literature. These have been roughly divided in four categories by Normand et al. (Normand
et al., 2012):
Technique-centered These taxonomies put emphasis on the features of the techniques used
to implement the augmentation. An example is from Milligram and colleagues (Milgram
et al., 1994), who defined three axes according to following criteria: (1) the amount of
information that the system knows about the environment; (2) the quality of the digital
representation (e.g. photo realistic, wireframe, etc.); (3) the extent to which the user
feels present, which is related also to the class of displays (e.g. head-mounted, handheld,
etc.).
User-centered Hugues et al. proposed a functional characterization based on two criteria:
the goal of the augmentation and the way the artificial content is created (Hugues et al.,
2011).
Information-centered The criteria for these taxonomies focus on the way the information
is presented. For example the usage of either 2D or 3D graphics and the arrangement
of the digital information around the physical source (e.g. superimposed or detached).
11
Chapter 2. Related Work and Research Methodology
Tönnis, Plecher and Klinker considered also a temporal dimension which differenti-
ates augmentations that are updated continuously in time (e.g. car speedometer) or
discretely in time (e.g. GPS indications) (Tönnis et al., 2013).
Interaction-centred These last taxonomies encompass the works focusing on the interaction
paradigms. For instance, Mackay built her classification on the target of the augmen-
tation (Mackay, 1998): the user (e.g. wearable devices), the objects (e.g. tangible or
paper-based interaction) or the physical surrounding (e.g. projection in public spaces,
collaborative augmented workspaces).
In the same article (Normand et al., 2012), Normand and colleagues have also proposed a syn-
thesis of these classification criteria in their taxonomy which includes four axes: (a) temporal
base, which distinguishes augmentation related to situations in the past (e.g. archaeological
sites), present, future (e.g. augmentation of construction sites) or imaginary situations; (b)
tracking degrees of freedom; (c) augmentation type, which can be mediated or direct; (d)
the rendering modalities axis, which considers interaction paradigms complementary to the
visual one, such as haptic, voice, olfactory, collaborative, etc. The last three axes are now
discussed in more details.
Tracking Methods Tracking techniques are basically of two natures. They can be sensor
based, which rely on position sensors like geomagnetic field sensor, inertial measurement unit
or GPS, and vision based, which make use of computer vision techniques on camera streams.
Depending on the hardware availability, some tracking approaches are hybrid and fuse data
from sensors and cameras to improve the performance.
Sensor-based approaches provide location-based information when the important aspect is to
know the position and orientation of the user rather than what the user is observing. Besides
being largely used in commercial applications, sensor-based systems are widely found in
the educational domain to implement enhanced context teaching strategies. These strategies
encourage students to make connections between what is taught and their environment
which can be, for instance, the school or the city. An example is the EcoMOBILE experience
(Kamarainen et al., 2013) which implemented a form of outdoor activity for learning ecosystem
science concepts during which students localized hotspots using the GPS and collected data
that were lately used in the classroom discussion.
Vision based techniques involve computer vision methods for recognising, tracking and
estimating the pose of objects in the scene. The usual pipeline for monocular model-based
3D tracking of rigid objects consists in (1) detecting (or tracking) features in the image; (2)
matching these features with the ones extracted from the target objects beforehand, whose 3D
positions are known; (3) compute the 3D positions of the objects (Lepetit et al., 2005). Vision
based techniques could be subdivided in three classes based on the variations in the previous
steps (Zhou et al., 2008):
12
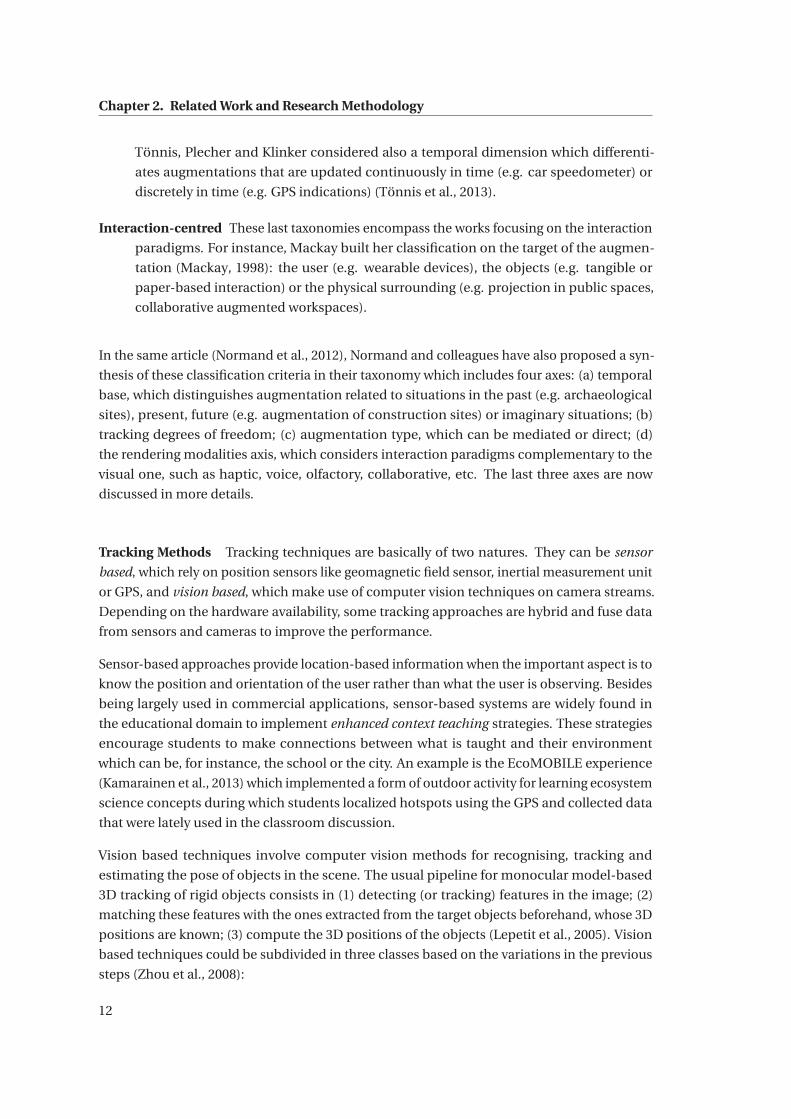
2.2. Augmented Reality
(a) AR based on fiducial markerdetection in an application forteaching geometry (Bonnardet al., 2012a).
(b) Markerless AR for animatingmuseums paintings (Lu et al.,2014).
(c) Model-Based AR using a 3Dmesh for improving the tracking(Vacchetti et al., 2004a).
Figure 2.11 – Vision-based tracking methods.
Marker-based The detection is narrowed down to the identification of particular landmarks
(fiducial markers) in the image whose appearance is very distinctive. Fiducial markers
offer a robust tracking and 3D pose estimation, although they need to be placed in the
environment in advance and might be aesthetically unpleasant.
Natural Features-based These algorithms are similar to the previous one, except that they
are based on the detection of unique features in the objects being tracked, such as
points of high contrast and lines visible on textured objects. An initialization phase is
usually required to create the set of visual features describing the target objects and
their correspondences with 3D points. During the tracking, the goal of the algorithms is
to find those features in the input images. By matching the features from the camera
image with the features previously known, it is possible to retrieve the pose of the object.
The main advantage of these approaches is that the environment is not altered by the
introduction of artificial elements. However, in order to extract features, the target
objects should present rich textures. Moreover, the detection could be affected by the
quality of the input image and by environmental changes like lighting conditions.
Model-based These algorithms make use of models of the object to be detected, such as 3D
mesh or the 2D silhouette of the object to be detected. Combined with the extraction
of natural features, these algorithms usually improved the robustness of the pose esti-
mation and the tolerance to mismatches (Vacchetti et al., 2004b). Furthermore, they
could also deal with the detection of texture-less objects through the detection of lines
and edges (Wang et al., 2017). The main drawback is the necessity of having a prior 3D
model of the target object. Some recent works overcame this limitation by employing
visual-SLAM algorithms for reconstructing the scene (Li et al., 2017) or depth sensors
(Park et al., 2011).
Displays and Information Location In Normand and colleagues’ taxonomy, mediated and
direct argumentation describe respectively applications in which the content is provided
13
Chapter 2. Related Work and Research Methodology
RealObjectProjector
Projector
Projector
Head-Attached Handheld Spatial
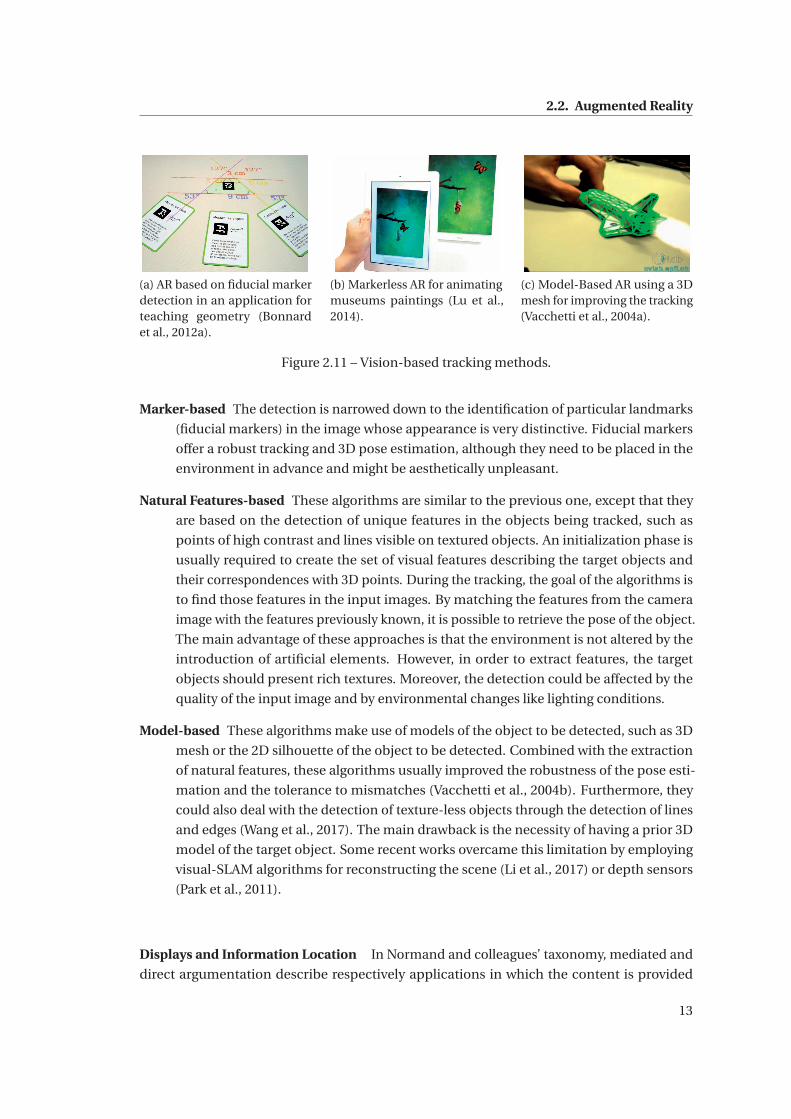
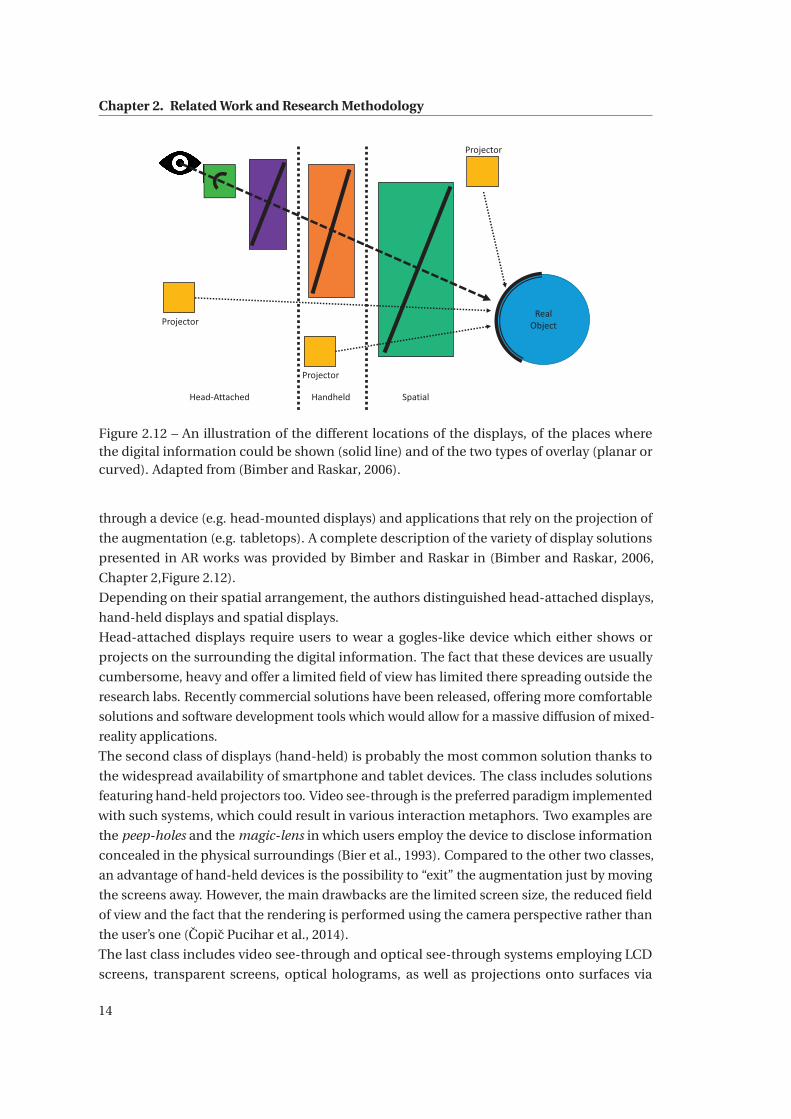
Figure 2.12 – An illustration of the different locations of the displays, of the places wherethe digital information could be shown (solid line) and of the two types of overlay (planar orcurved). Adapted from (Bimber and Raskar, 2006).
through a device (e.g. head-mounted displays) and applications that rely on the projection of
the augmentation (e.g. tabletops). A complete description of the variety of display solutions
presented in AR works was provided by Bimber and Raskar in (Bimber and Raskar, 2006,
Chapter 2,Figure 2.12).
Depending on their spatial arrangement, the authors distinguished head-attached displays,
hand-held displays and spatial displays.
Head-attached displays require users to wear a gogles-like device which either shows or
projects on the surrounding the digital information. The fact that these devices are usually
cumbersome, heavy and offer a limited field of view has limited there spreading outside the
research labs. Recently commercial solutions have been released, offering more comfortable
solutions and software development tools which would allow for a massive diffusion of mixed-
reality applications.
The second class of displays (hand-held) is probably the most common solution thanks to
the widespread availability of smartphone and tablet devices. The class includes solutions
featuring hand-held projectors too. Video see-through is the preferred paradigm implemented
with such systems, which could result in various interaction metaphors. Two examples are
the peep-holes and the magic-lens in which users employ the device to disclose information
concealed in the physical surroundings (Bier et al., 1993). Compared to the other two classes,
an advantage of hand-held devices is the possibility to “exit” the augmentation just by moving
the screens away. However, the main drawbacks are the limited screen size, the reduced field
of view and the fact that the rendering is performed using the camera perspective rather than
the user’s one (Copic Pucihar et al., 2014).
The last class includes video see-through and optical see-through systems employing LCD
screens, transparent screens, optical holograms, as well as projections onto surfaces via
14
2.2. Augmented Reality
projectors. Spatial displays make the AR experience shareable among multiple people, thus
they are suitable for collaborative working and learning environments or for art exhibitions
(Clay et al., 2014). The augmentation becomes accessible from different points of views, which
facilitate the development of common ground and enables simultaneous control (Caballero
et al., 2014).
Regarding the perceptual issues experienced by the users depending on the display types,
Kruijff and colleagues made a synthesis of the perceptual trade-offs across common displays
that is reported in (Kruijff et al., 2010).
Tangible Interaction The last axis of the taxonomy is related to the interaction paradigms
that complement the visual experience. As it is not the scope of this paragraph to cover the
innumerable solutions reported in the literature, I will leave this topic behind and I will rather
take the opportunity to introduce a popular solution: tangible interaction.
Tangible interaction encompasses the techniques in which the digital information is embed-
ded in physical artefacts and/or is manipulated through them (Shaer and Hornecker, 2010).
Historically, the metaphor of physically manipulating the intangible data could be traced back
to the work of Fitzmaurice and the one of Hiroshi and Ullmer (Fitzmaurice and Buxton, 1997;
Ishii and Ullmer, 1997). The former coined the term Graspable Interface whereas the latter
extended it by introducing the term of tangible user interfaces (TUIs). Hiroshi and Ullmer’s
idea of Tangible Bits consisted in three key concepts: (1) coupling the bits with the atoms
in order to make data graspable; (2) turn any physical surface into an interactive interface;
(3) augment the peripheral space in order to make users aware of background information
too. Tangible tools bind their digital and physical representations by sharing properties like
geometry, shape, color or position relative to other entities.
TUIs do not always feature strongly within accounts of augmented reality, even though they
are both located in proximity on the left side of the Reality-Virtuality continuum and they
often overlap. The original definition was very broad and in recent years the borders of what
could be considered a tangible UI became even more blurred. For instance, Hornecker and
Buur (Hornecker and Buur, 2006) made a distinction between tangible interaction and TUIs,
suggesting that the former is a broader term which also includes bodily interaction.
An extensive review of tangible interfaces, taxonomies and related research areas is offered in
(Shaer and Hornecker, 2010). The purpose of this brief introduction was to present the concept
of TUIs which has been the focus of our first study. Furthermore, the benefits associated to
tangible interaction are discussed in the following section.
2.2.1 Augmented Reality in the Learning Domain
In technology-enhanced learning literature, AR learning environments have been presented
along with a variety of instructional and learning approaches (e.g. inquiry-based learning,
problem-based learning, game-based learning) (Wu et al., 2013). The following sections
present a summary of the perspectives providing both the foundations to the adoption of the
15
Chapter 2. Related Work and Research Methodology
augmented reality in the educational practices and several design guidelines.
Spatial Cognition
There is a general agreement in considering the learning benefits of augmented reality appli-
cations and TUIs in reference to the support that these technologies offer to the users’ spatial
cognition.
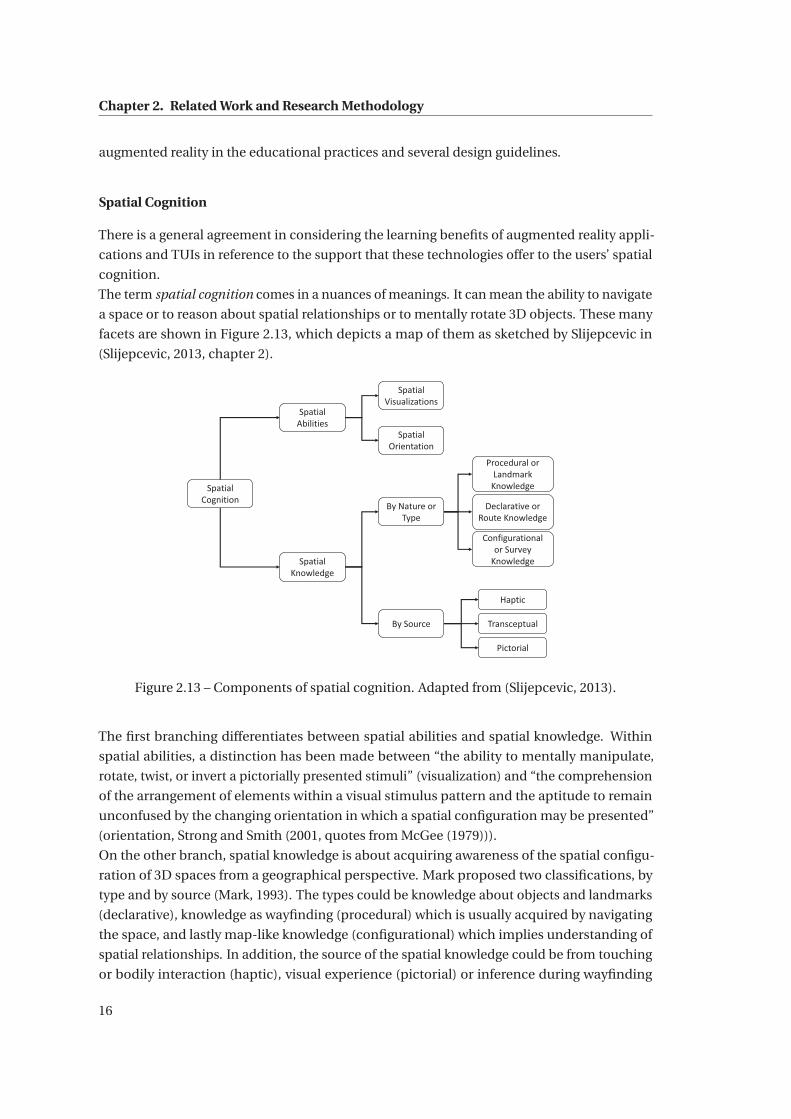
The term spatial cognition comes in a nuances of meanings. It can mean the ability to navigate
a space or to reason about spatial relationships or to mentally rotate 3D objects. These many
facets are shown in Figure 2.13, which depicts a map of them as sketched by Slijepcevic in
(Slijepcevic, 2013, chapter 2).
Spatial Abilities
Spatial Visualizations
Spatial Orientation
Spatial Knowledge
By Nature or Type
By Source
Procedural or Landmark
Knowledge
Declarative or Route Knowledge
Configurational or Survey
Knowledge
Haptic
Pictorial
Transceptual
Spatial Cognition
Figure 2.13 – Components of spatial cognition. Adapted from (Slijepcevic, 2013).
The first branching differentiates between spatial abilities and spatial knowledge. Within
spatial abilities, a distinction has been made between “the ability to mentally manipulate,
rotate, twist, or invert a pictorially presented stimuli” (visualization) and “the comprehension
of the arrangement of elements within a visual stimulus pattern and the aptitude to remain
unconfused by the changing orientation in which a spatial configuration may be presented”
(orientation, Strong and Smith (2001, quotes from McGee (1979))).
On the other branch, spatial knowledge is about acquiring awareness of the spatial configu-
ration of 3D spaces from a geographical perspective. Mark proposed two classifications, by
type and by source (Mark, 1993). The types could be knowledge about objects and landmarks
(declarative), knowledge as wayfinding (procedural) which is usually acquired by navigating
the space, and lastly map-like knowledge (configurational) which implies understanding of
spatial relationships. In addition, the source of the spatial knowledge could be from touching
or bodily interaction (haptic), visual experience (pictorial) or inference during wayfinding
16
2.2. Augmented Reality
(transperceptual).
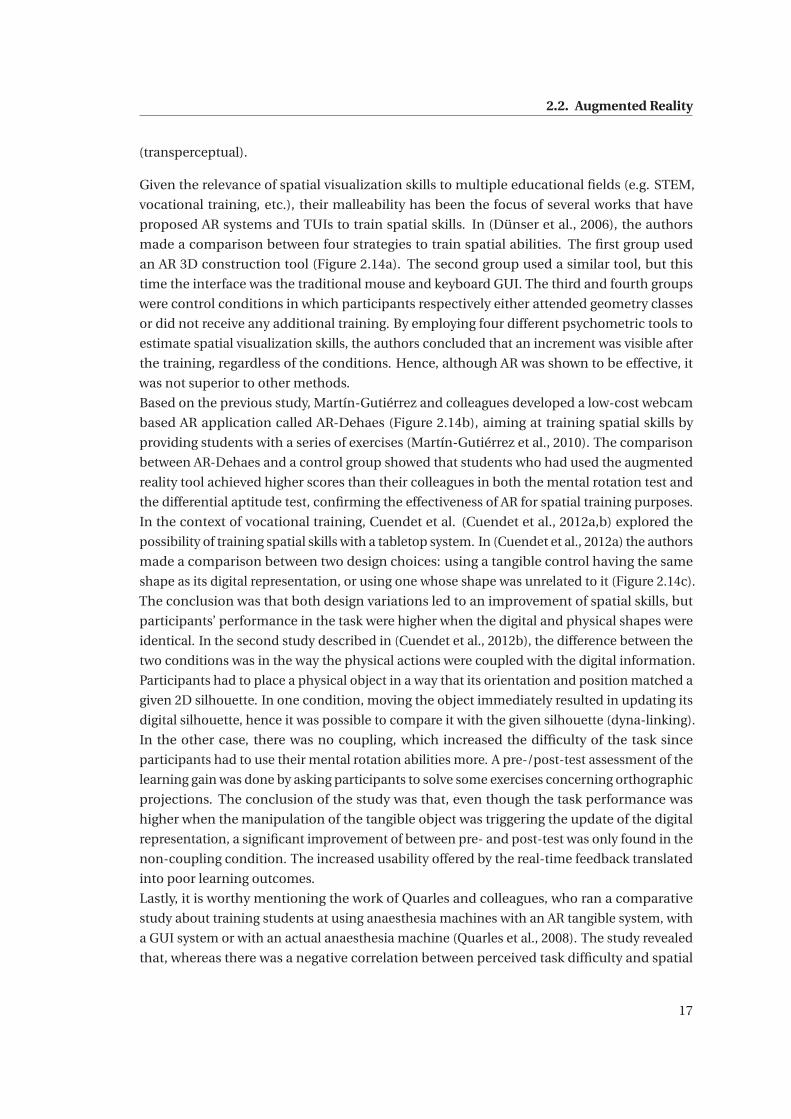
Given the relevance of spatial visualization skills to multiple educational fields (e.g. STEM,
vocational training, etc.), their malleability has been the focus of several works that have
proposed AR systems and TUIs to train spatial skills. In (Dünser et al., 2006), the authors
made a comparison between four strategies to train spatial abilities. The first group used
an AR 3D construction tool (Figure 2.14a). The second group used a similar tool, but this
time the interface was the traditional mouse and keyboard GUI. The third and fourth groups
were control conditions in which participants respectively either attended geometry classes
or did not receive any additional training. By employing four different psychometric tools to
estimate spatial visualization skills, the authors concluded that an increment was visible after
the training, regardless of the conditions. Hence, although AR was shown to be effective, it
was not superior to other methods.
Based on the previous study, Martín-Gutiérrez and colleagues developed a low-cost webcam
based AR application called AR-Dehaes (Figure 2.14b), aiming at training spatial skills by
providing students with a series of exercises (Martín-Gutiérrez et al., 2010). The comparison
between AR-Dehaes and a control group showed that students who had used the augmented
reality tool achieved higher scores than their colleagues in both the mental rotation test and
the differential aptitude test, confirming the effectiveness of AR for spatial training purposes.
In the context of vocational training, Cuendet et al. (Cuendet et al., 2012a,b) explored the
possibility of training spatial skills with a tabletop system. In (Cuendet et al., 2012a) the authors
made a comparison between two design choices: using a tangible control having the same
shape as its digital representation, or using one whose shape was unrelated to it (Figure 2.14c).
The conclusion was that both design variations led to an improvement of spatial skills, but
participants’ performance in the task were higher when the digital and physical shapes were
identical. In the second study described in (Cuendet et al., 2012b), the difference between the
two conditions was in the way the physical actions were coupled with the digital information.
Participants had to place a physical object in a way that its orientation and position matched a
given 2D silhouette. In one condition, moving the object immediately resulted in updating its
digital silhouette, hence it was possible to compare it with the given silhouette (dyna-linking).
In the other case, there was no coupling, which increased the difficulty of the task since
participants had to use their mental rotation abilities more. A pre-/post-test assessment of the
learning gain was done by asking participants to solve some exercises concerning orthographic
projections. The conclusion of the study was that, even though the task performance was
higher when the manipulation of the tangible object was triggering the update of the digital
representation, a significant improvement of between pre- and post-test was only found in the
non-coupling condition. The increased usability offered by the real-time feedback translated
into poor learning outcomes.
Lastly, it is worthy mentioning the work of Quarles and colleagues, who ran a comparative
study about training students at using anaesthesia machines with an AR tangible system, with
a GUI system or with an actual anaesthesia machine (Quarles et al., 2008). The study revealed
that, whereas there was a negative correlation between perceived task difficulty and spatial
17
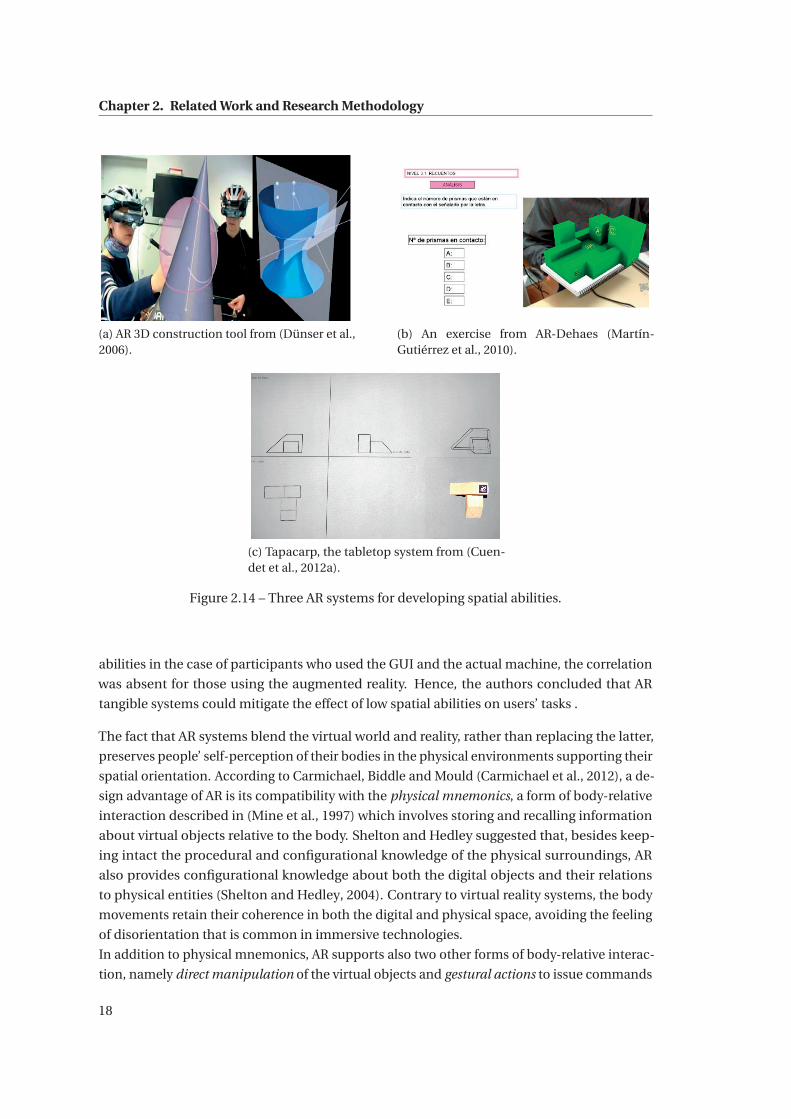
Chapter 2. Related Work and Research Methodology
(a) AR 3D construction tool from (Dünser et al.,2006).
(b) An exercise from AR-Dehaes (Martín-Gutiérrez et al., 2010).
(c) Tapacarp, the tabletop system from (Cuen-det et al., 2012a).
Figure 2.14 – Three AR systems for developing spatial abilities.
abilities in the case of participants who used the GUI and the actual machine, the correlation
was absent for those using the augmented reality. Hence, the authors concluded that AR
tangible systems could mitigate the effect of low spatial abilities on users’ tasks .
The fact that AR systems blend the virtual world and reality, rather than replacing the latter,
preserves people’ self-perception of their bodies in the physical environments supporting their
spatial orientation. According to Carmichael, Biddle and Mould (Carmichael et al., 2012), a de-
sign advantage of AR is its compatibility with the physical mnemonics, a form of body-relative
interaction described in (Mine et al., 1997) which involves storing and recalling information
about virtual objects relative to the body. Shelton and Hedley suggested that, besides keep-
ing intact the procedural and configurational knowledge of the physical surroundings, AR
also provides configurational knowledge about both the digital objects and their relations
to physical entities (Shelton and Hedley, 2004). Contrary to virtual reality systems, the body
movements retain their coherence in both the digital and physical space, avoiding the feeling
of disorientation that is common in immersive technologies.
In addition to physical mnemonics, AR supports also two other forms of body-relative interac-
tion, namely direct manipulation of the virtual objects and gestural actions to issue commands
18
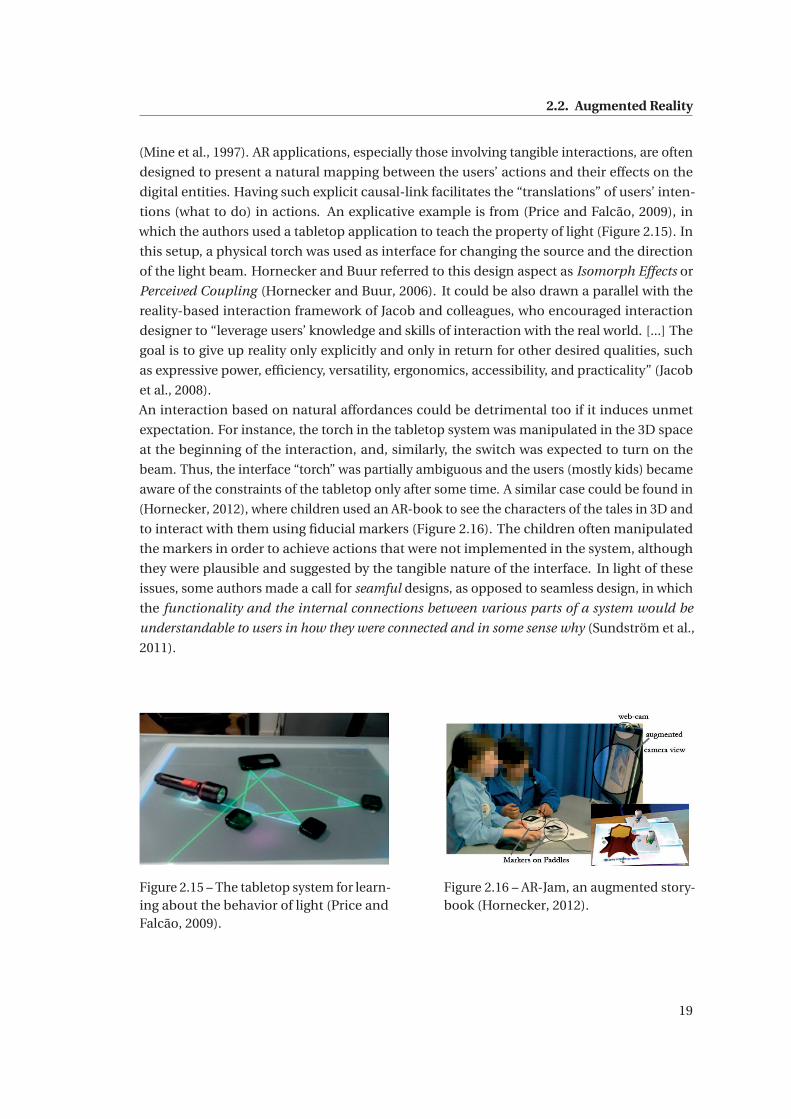
2.2. Augmented Reality
(Mine et al., 1997). AR applications, especially those involving tangible interactions, are often
designed to present a natural mapping between the users’ actions and their effects on the
digital entities. Having such explicit causal-link facilitates the “translations” of users’ inten-
tions (what to do) in actions. An explicative example is from (Price and Falcão, 2009), in
which the authors used a tabletop application to teach the property of light (Figure 2.15). In
this setup, a physical torch was used as interface for changing the source and the direction
of the light beam. Hornecker and Buur referred to this design aspect as Isomorph Effects or
Perceived Coupling (Hornecker and Buur, 2006). It could be also drawn a parallel with the
reality-based interaction framework of Jacob and colleagues, who encouraged interaction
designer to “leverage users’ knowledge and skills of interaction with the real world. [...] The
goal is to give up reality only explicitly and only in return for other desired qualities, such
as expressive power, efficiency, versatility, ergonomics, accessibility, and practicality” (Jacob
et al., 2008).
An interaction based on natural affordances could be detrimental too if it induces unmet
expectation. For instance, the torch in the tabletop system was manipulated in the 3D space
at the beginning of the interaction, and, similarly, the switch was expected to turn on the
beam. Thus, the interface “torch” was partially ambiguous and the users (mostly kids) became
aware of the constraints of the tabletop only after some time. A similar case could be found in
(Hornecker, 2012), where children used an AR-book to see the characters of the tales in 3D and
to interact with them using fiducial markers (Figure 2.16). The children often manipulated
the markers in order to achieve actions that were not implemented in the system, although
they were plausible and suggested by the tangible nature of the interface. In light of these
issues, some authors made a call for seamful designs, as opposed to seamless design, in which
the functionality and the internal connections between various parts of a system would be
understandable to users in how they were connected and in some sense why (Sundström et al.,
2011).
Figure 2.15 – The tabletop system for learn-ing about the behavior of light (Price andFalcão, 2009).
Figure 2.16 – AR-Jam, an augmented story-book (Hornecker, 2012).
19
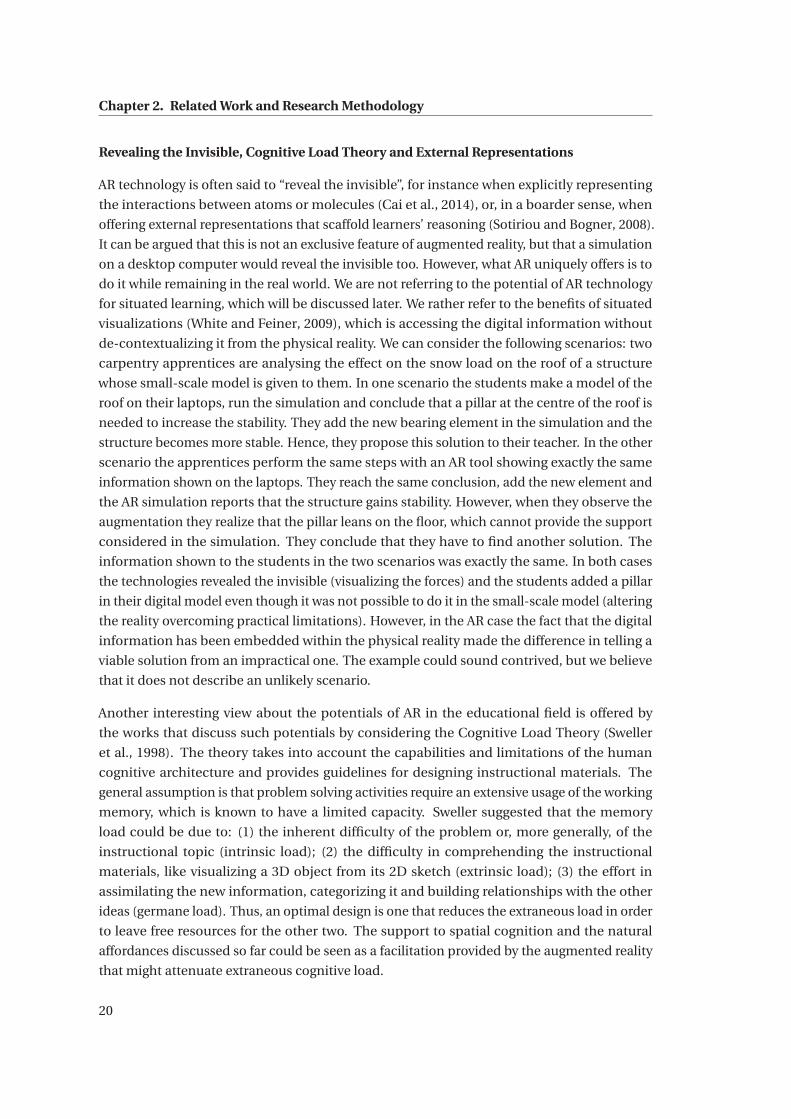
Chapter 2. Related Work and Research Methodology
Revealing the Invisible, Cognitive Load Theory and External Representations
AR technology is often said to “reveal the invisible”, for instance when explicitly representing
the interactions between atoms or molecules (Cai et al., 2014), or, in a boarder sense, when
offering external representations that scaffold learners’ reasoning (Sotiriou and Bogner, 2008).
It can be argued that this is not an exclusive feature of augmented reality, but that a simulation
on a desktop computer would reveal the invisible too. However, what AR uniquely offers is to
do it while remaining in the real world. We are not referring to the potential of AR technology
for situated learning, which will be discussed later. We rather refer to the benefits of situated
visualizations (White and Feiner, 2009), which is accessing the digital information without
de-contextualizing it from the physical reality. We can consider the following scenarios: two
carpentry apprentices are analysing the effect on the snow load on the roof of a structure
whose small-scale model is given to them. In one scenario the students make a model of the
roof on their laptops, run the simulation and conclude that a pillar at the centre of the roof is
needed to increase the stability. They add the new bearing element in the simulation and the
structure becomes more stable. Hence, they propose this solution to their teacher. In the other
scenario the apprentices perform the same steps with an AR tool showing exactly the same
information shown on the laptops. They reach the same conclusion, add the new element and
the AR simulation reports that the structure gains stability. However, when they observe the
augmentation they realize that the pillar leans on the floor, which cannot provide the support
considered in the simulation. They conclude that they have to find another solution. The
information shown to the students in the two scenarios was exactly the same. In both cases
the technologies revealed the invisible (visualizing the forces) and the students added a pillar
in their digital model even though it was not possible to do it in the small-scale model (altering
the reality overcoming practical limitations). However, in the AR case the fact that the digital
information has been embedded within the physical reality made the difference in telling a
viable solution from an impractical one. The example could sound contrived, but we believe
that it does not describe an unlikely scenario.
Another interesting view about the potentials of AR in the educational field is offered by
the works that discuss such potentials by considering the Cognitive Load Theory (Sweller
et al., 1998). The theory takes into account the capabilities and limitations of the human
cognitive architecture and provides guidelines for designing instructional materials. The
general assumption is that problem solving activities require an extensive usage of the working
memory, which is known to have a limited capacity. Sweller suggested that the memory
load could be due to: (1) the inherent difficulty of the problem or, more generally, of the
instructional topic (intrinsic load); (2) the difficulty in comprehending the instructional
materials, like visualizing a 3D object from its 2D sketch (extrinsic load); (3) the effort in
assimilating the new information, categorizing it and building relationships with the other
ideas (germane load). Thus, an optimal design is one that reduces the extraneous load in order
to leave free resources for the other two. The support to spatial cognition and the natural
affordances discussed so far could be seen as a facilitation provided by the augmented reality
that might attenuate extraneous cognitive load.
20
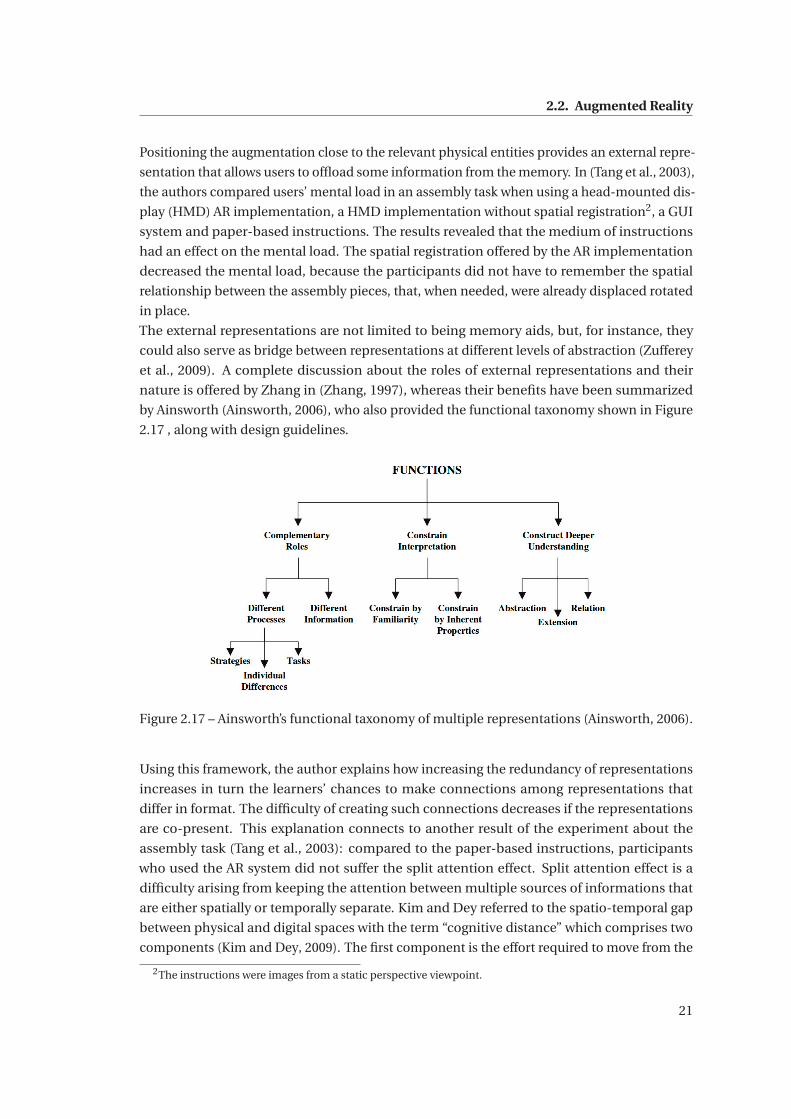
2.2. Augmented Reality
Positioning the augmentation close to the relevant physical entities provides an external repre-
sentation that allows users to offload some information from the memory. In (Tang et al., 2003),
the authors compared users’ mental load in an assembly task when using a head-mounted dis-
play (HMD) AR implementation, a HMD implementation without spatial registration2, a GUI
system and paper-based instructions. The results revealed that the medium of instructions
had an effect on the mental load. The spatial registration offered by the AR implementation
decreased the mental load, because the participants did not have to remember the spatial
relationship between the assembly pieces, that, when needed, were already displaced rotated
in place.
The external representations are not limited to being memory aids, but, for instance, they
could also serve as bridge between representations at different levels of abstraction (Zufferey
et al., 2009). A complete discussion about the roles of external representations and their
nature is offered by Zhang in (Zhang, 1997), whereas their benefits have been summarized
by Ainsworth (Ainsworth, 2006), who also provided the functional taxonomy shown in Figure
2.17 , along with design guidelines.
Figure 2.17 – Ainsworth’s functional taxonomy of multiple representations (Ainsworth, 2006).
Using this framework, the author explains how increasing the redundancy of representations
increases in turn the learners’ chances to make connections among representations that
differ in format. The difficulty of creating such connections decreases if the representations
are co-present. This explanation connects to another result of the experiment about the
assembly task (Tang et al., 2003): compared to the paper-based instructions, participants
who used the AR system did not suffer the split attention effect. Split attention effect is a
difficulty arising from keeping the attention between multiple sources of informations that
are either spatially or temporally separate. Kim and Dey referred to the spatio-temporal gap
between physical and digital spaces with the term “cognitive distance” which comprises two
components (Kim and Dey, 2009). The first component is the effort required to move from the
2The instructions were images from a static perspective viewpoint.
21
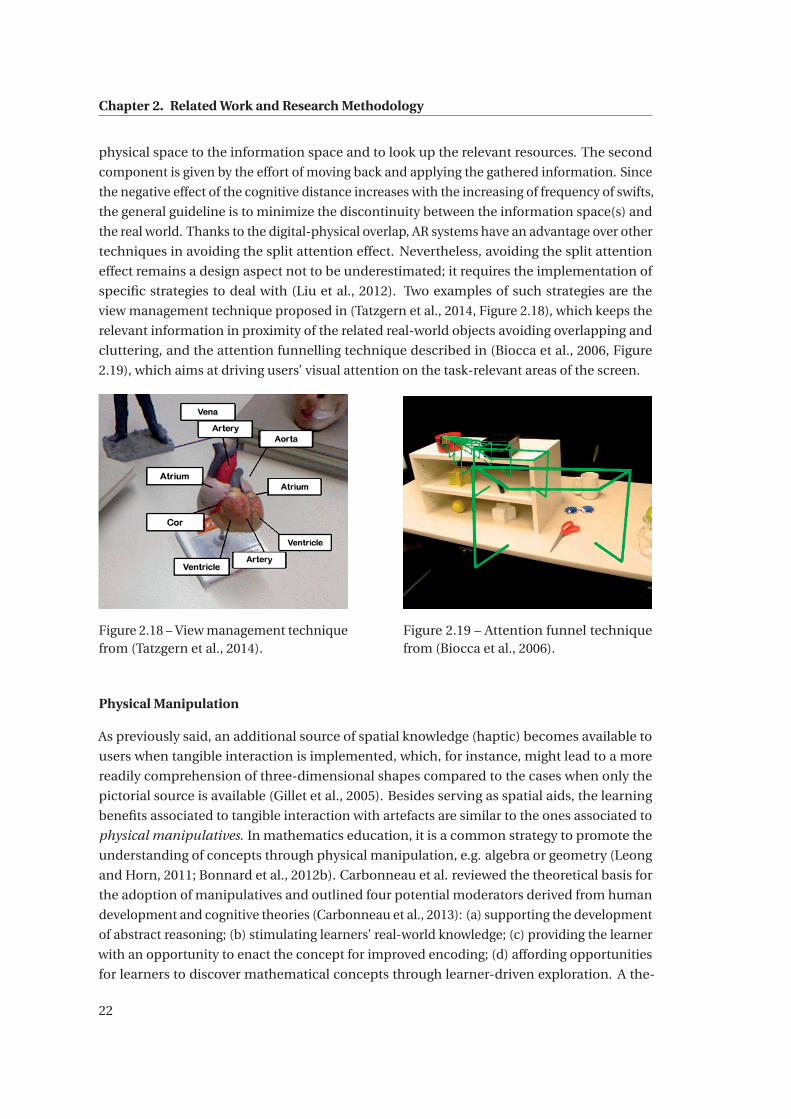
Chapter 2. Related Work and Research Methodology
physical space to the information space and to look up the relevant resources. The second
component is given by the effort of moving back and applying the gathered information. Since
the negative effect of the cognitive distance increases with the increasing of frequency of swifts,
the general guideline is to minimize the discontinuity between the information space(s) and
the real world. Thanks to the digital-physical overlap, AR systems have an advantage over other
techniques in avoiding the split attention effect. Nevertheless, avoiding the split attention
effect remains a design aspect not to be underestimated; it requires the implementation of
specific strategies to deal with (Liu et al., 2012). Two examples of such strategies are the
view management technique proposed in (Tatzgern et al., 2014, Figure 2.18), which keeps the
relevant information in proximity of the related real-world objects avoiding overlapping and
cluttering, and the attention funnelling technique described in (Biocca et al., 2006, Figure
2.19), which aims at driving users’ visual attention on the task-relevant areas of the screen.
Figure 2.18 – View management techniquefrom (Tatzgern et al., 2014).
Figure 2.19 – Attention funnel techniquefrom (Biocca et al., 2006).
Physical Manipulation
As previously said, an additional source of spatial knowledge (haptic) becomes available to
users when tangible interaction is implemented, which, for instance, might lead to a more
readily comprehension of three-dimensional shapes compared to the cases when only the
pictorial source is available (Gillet et al., 2005). Besides serving as spatial aids, the learning
benefits associated to tangible interaction with artefacts are similar to the ones associated to
physical manipulatives. In mathematics education, it is a common strategy to promote the
understanding of concepts through physical manipulation, e.g. algebra or geometry (Leong
and Horn, 2011; Bonnard et al., 2012b). Carbonneau et al. reviewed the theoretical basis for
the adoption of manipulatives and outlined four potential moderators derived from human
development and cognitive theories (Carbonneau et al., 2013): (a) supporting the development
of abstract reasoning; (b) stimulating learners’ real-world knowledge; (c) providing the learner
with an opportunity to enact the concept for improved encoding; (d) affording opportunities
for learners to discover mathematical concepts through learner-driven exploration. A the-
22
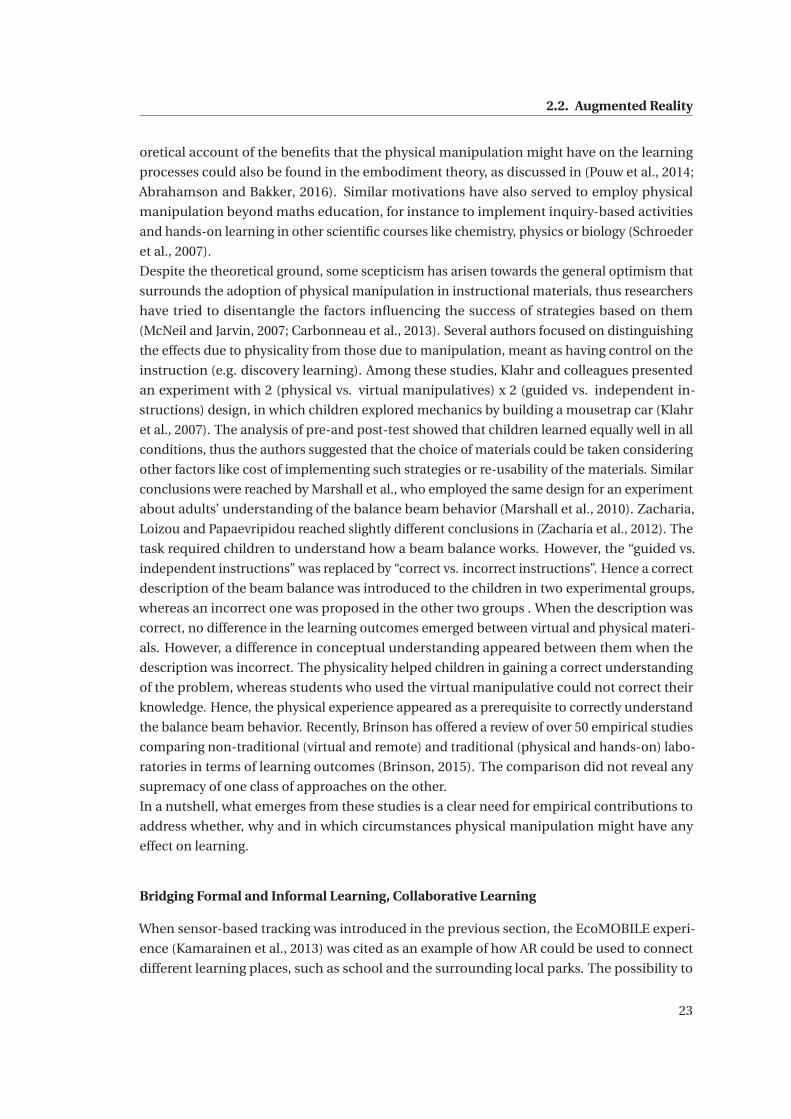
2.2. Augmented Reality
oretical account of the benefits that the physical manipulation might have on the learning
processes could also be found in the embodiment theory, as discussed in (Pouw et al., 2014;
Abrahamson and Bakker, 2016). Similar motivations have also served to employ physical
manipulation beyond maths education, for instance to implement inquiry-based activities
and hands-on learning in other scientific courses like chemistry, physics or biology (Schroeder
et al., 2007).
Despite the theoretical ground, some scepticism has arisen towards the general optimism that
surrounds the adoption of physical manipulation in instructional materials, thus researchers
have tried to disentangle the factors influencing the success of strategies based on them
(McNeil and Jarvin, 2007; Carbonneau et al., 2013). Several authors focused on distinguishing
the effects due to physicality from those due to manipulation, meant as having control on the
instruction (e.g. discovery learning). Among these studies, Klahr and colleagues presented
an experiment with 2 (physical vs. virtual manipulatives) x 2 (guided vs. independent in-
structions) design, in which children explored mechanics by building a mousetrap car (Klahr
et al., 2007). The analysis of pre-and post-test showed that children learned equally well in all
conditions, thus the authors suggested that the choice of materials could be taken considering
other factors like cost of implementing such strategies or re-usability of the materials. Similar
conclusions were reached by Marshall et al., who employed the same design for an experiment
about adults’ understanding of the balance beam behavior (Marshall et al., 2010). Zacharia,
Loizou and Papaevripidou reached slightly different conclusions in (Zacharia et al., 2012). The
task required children to understand how a beam balance works. However, the “guided vs.
independent instructions” was replaced by “correct vs. incorrect instructions”. Hence a correct
description of the beam balance was introduced to the children in two experimental groups,
whereas an incorrect one was proposed in the other two groups . When the description was
correct, no difference in the learning outcomes emerged between virtual and physical materi-
als. However, a difference in conceptual understanding appeared between them when the
description was incorrect. The physicality helped children in gaining a correct understanding
of the problem, whereas students who used the virtual manipulative could not correct their
knowledge. Hence, the physical experience appeared as a prerequisite to correctly understand
the balance beam behavior. Recently, Brinson has offered a review of over 50 empirical studies
comparing non-traditional (virtual and remote) and traditional (physical and hands-on) labo-
ratories in terms of learning outcomes (Brinson, 2015). The comparison did not reveal any
supremacy of one class of approaches on the other.
In a nutshell, what emerges from these studies is a clear need for empirical contributions to
address whether, why and in which circumstances physical manipulation might have any
effect on learning.
Bridging Formal and Informal Learning, Collaborative Learning
When sensor-based tracking was introduced in the previous section, the EcoMOBILE experi-
ence (Kamarainen et al., 2013) was cited as an example of how AR could be used to connect
different learning places, such as school and the surrounding local parks. The possibility to
23
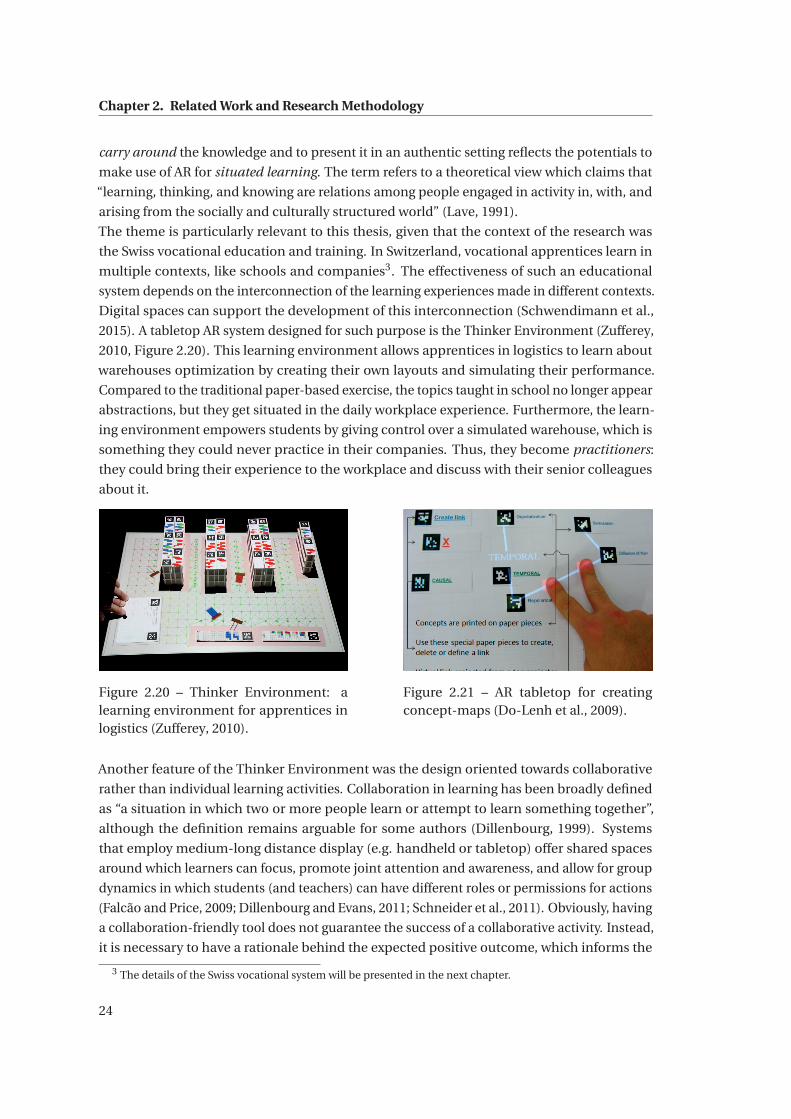
Chapter 2. Related Work and Research Methodology
carry around the knowledge and to present it in an authentic setting reflects the potentials to
make use of AR for situated learning. The term refers to a theoretical view which claims that
“learning, thinking, and knowing are relations among people engaged in activity in, with, and
arising from the socially and culturally structured world” (Lave, 1991).
The theme is particularly relevant to this thesis, given that the context of the research was
the Swiss vocational education and training. In Switzerland, vocational apprentices learn in
multiple contexts, like schools and companies3. The effectiveness of such an educational
system depends on the interconnection of the learning experiences made in different contexts.
Digital spaces can support the development of this interconnection (Schwendimann et al.,
2015). A tabletop AR system designed for such purpose is the Thinker Environment (Zufferey,
2010, Figure 2.20). This learning environment allows apprentices in logistics to learn about
warehouses optimization by creating their own layouts and simulating their performance.
Compared to the traditional paper-based exercise, the topics taught in school no longer appear
abstractions, but they get situated in the daily workplace experience. Furthermore, the learn-
ing environment empowers students by giving control over a simulated warehouse, which is
something they could never practice in their companies. Thus, they become practitioners:
they could bring their experience to the workplace and discuss with their senior colleagues
about it.
Figure 2.20 – Thinker Environment: alearning environment for apprentices inlogistics (Zufferey, 2010).
Figure 2.21 – AR tabletop for creatingconcept-maps (Do-Lenh et al., 2009).
Another feature of the Thinker Environment was the design oriented towards collaborative
rather than individual learning activities. Collaboration in learning has been broadly defined
as “a situation in which two or more people learn or attempt to learn something together”,
although the definition remains arguable for some authors (Dillenbourg, 1999). Systems
that employ medium-long distance display (e.g. handheld or tabletop) offer shared spaces
around which learners can focus, promote joint attention and awareness, and allow for group
dynamics in which students (and teachers) can have different roles or permissions for actions
(Falcão and Price, 2009; Dillenbourg and Evans, 2011; Schneider et al., 2011). Obviously, having
a collaboration-friendly tool does not guarantee the success of a collaborative activity. Instead,
it is necessary to have a rationale behind the expected positive outcome, which informs the
3 The details of the Swiss vocational system will be presented in the next chapter.
24
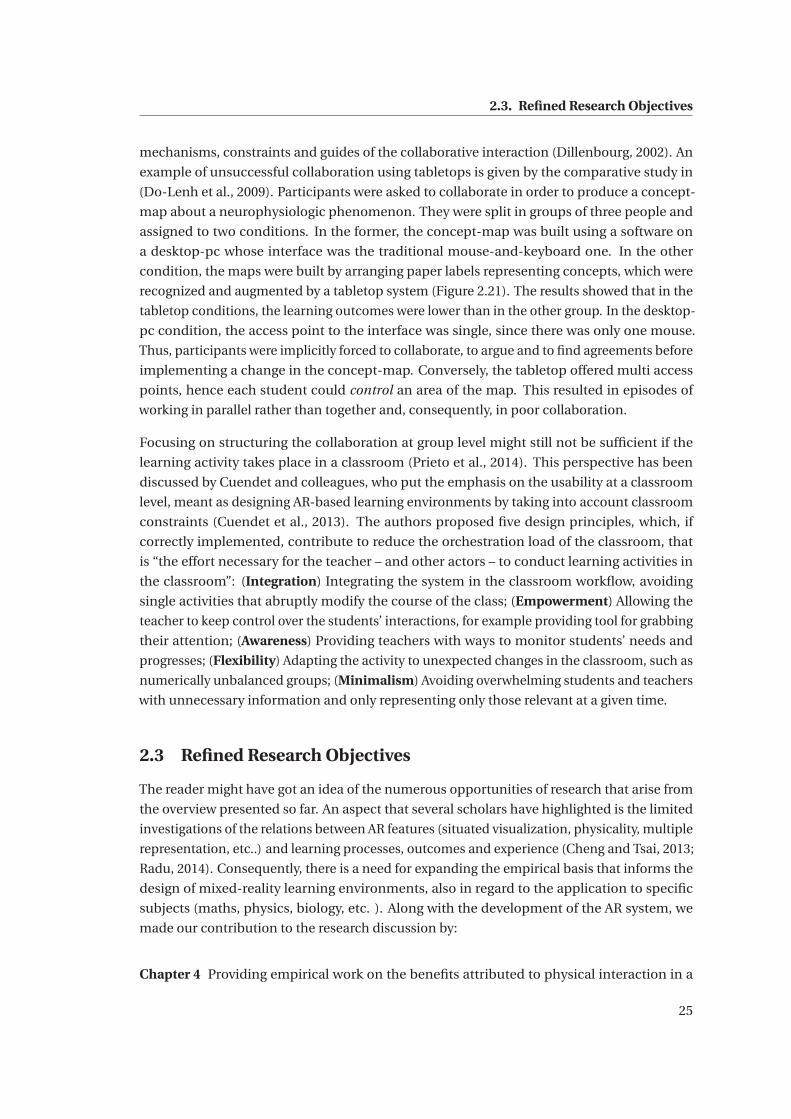
2.3. Refined Research Objectives
mechanisms, constraints and guides of the collaborative interaction (Dillenbourg, 2002). An
example of unsuccessful collaboration using tabletops is given by the comparative study in
(Do-Lenh et al., 2009). Participants were asked to collaborate in order to produce a concept-
map about a neurophysiologic phenomenon. They were split in groups of three people and
assigned to two conditions. In the former, the concept-map was built using a software on
a desktop-pc whose interface was the traditional mouse-and-keyboard one. In the other
condition, the maps were built by arranging paper labels representing concepts, which were
recognized and augmented by a tabletop system (Figure 2.21). The results showed that in the
tabletop conditions, the learning outcomes were lower than in the other group. In the desktop-
pc condition, the access point to the interface was single, since there was only one mouse.
Thus, participants were implicitly forced to collaborate, to argue and to find agreements before
implementing a change in the concept-map. Conversely, the tabletop offered multi access
points, hence each student could control an area of the map. This resulted in episodes of
working in parallel rather than together and, consequently, in poor collaboration.
Focusing on structuring the collaboration at group level might still not be sufficient if the
learning activity takes place in a classroom (Prieto et al., 2014). This perspective has been
discussed by Cuendet and colleagues, who put the emphasis on the usability at a classroom
level, meant as designing AR-based learning environments by taking into account classroom
constraints (Cuendet et al., 2013). The authors proposed five design principles, which, if
correctly implemented, contribute to reduce the orchestration load of the classroom, that
is “the effort necessary for the teacher – and other actors – to conduct learning activities in
the classroom”: (Integration) Integrating the system in the classroom workflow, avoiding
single activities that abruptly modify the course of the class; (Empowerment) Allowing the
teacher to keep control over the students’ interactions, for example providing tool for grabbing
their attention; (Awareness) Providing teachers with ways to monitor students’ needs and
progresses; (Flexibility) Adapting the activity to unexpected changes in the classroom, such as
numerically unbalanced groups; (Minimalism) Avoiding overwhelming students and teachers
with unnecessary information and only representing only those relevant at a given time.
2.3 Refined Research Objectives
The reader might have got an idea of the numerous opportunities of research that arise from
the overview presented so far. An aspect that several scholars have highlighted is the limited
investigations of the relations between AR features (situated visualization, physicality, multiple
representation, etc..) and learning processes, outcomes and experience (Cheng and Tsai, 2013;
Radu, 2014). Consequently, there is a need for expanding the empirical basis that informs the
design of mixed-reality learning environments, also in regard to the application to specific
subjects (maths, physics, biology, etc. ). Along with the development of the AR system, we
made our contribution to the research discussion by:
Chapter 4 Providing empirical work on the benefits attributed to physical interaction in a
25
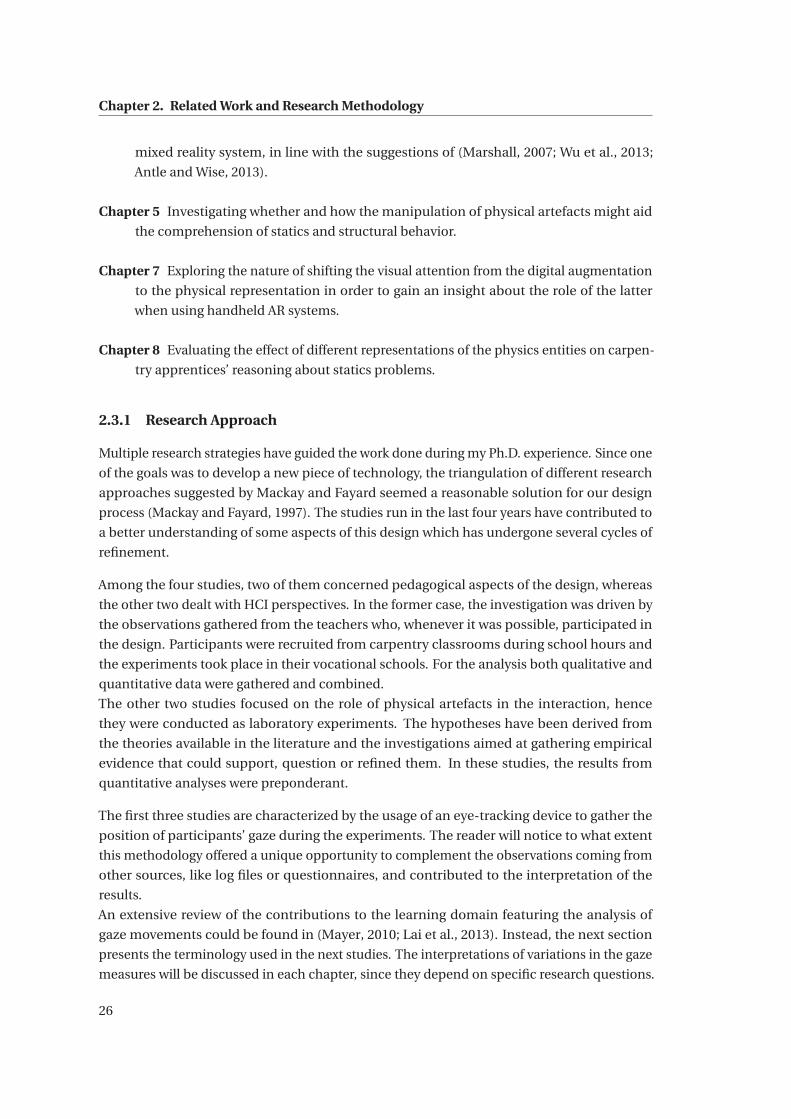
Chapter 2. Related Work and Research Methodology
mixed reality system, in line with the suggestions of (Marshall, 2007; Wu et al., 2013;
Antle and Wise, 2013).
Chapter 5 Investigating whether and how the manipulation of physical artefacts might aid
the comprehension of statics and structural behavior.
Chapter 7 Exploring the nature of shifting the visual attention from the digital augmentation
to the physical representation in order to gain an insight about the role of the latter
when using handheld AR systems.
Chapter 8 Evaluating the effect of different representations of the physics entities on carpen-
try apprentices’ reasoning about statics problems.
2.3.1 Research Approach
Multiple research strategies have guided the work done during my Ph.D. experience. Since one
of the goals was to develop a new piece of technology, the triangulation of different research
approaches suggested by Mackay and Fayard seemed a reasonable solution for our design
process (Mackay and Fayard, 1997). The studies run in the last four years have contributed to
a better understanding of some aspects of this design which has undergone several cycles of
refinement.
Among the four studies, two of them concerned pedagogical aspects of the design, whereas
the other two dealt with HCI perspectives. In the former case, the investigation was driven by
the observations gathered from the teachers who, whenever it was possible, participated in
the design. Participants were recruited from carpentry classrooms during school hours and
the experiments took place in their vocational schools. For the analysis both qualitative and
quantitative data were gathered and combined.
The other two studies focused on the role of physical artefacts in the interaction, hence
they were conducted as laboratory experiments. The hypotheses have been derived from
the theories available in the literature and the investigations aimed at gathering empirical
evidence that could support, question or refined them. In these studies, the results from
quantitative analyses were preponderant.
The first three studies are characterized by the usage of an eye-tracking device to gather the
position of participants’ gaze during the experiments. The reader will notice to what extent
this methodology offered a unique opportunity to complement the observations coming from
other sources, like log files or questionnaires, and contributed to the interpretation of the
results.
An extensive review of the contributions to the learning domain featuring the analysis of
gaze movements could be found in (Mayer, 2010; Lai et al., 2013). Instead, the next section
presents the terminology used in the next studies. The interpretations of variations in the gaze
measures will be discussed in each chapter, since they depend on specific research questions.
26
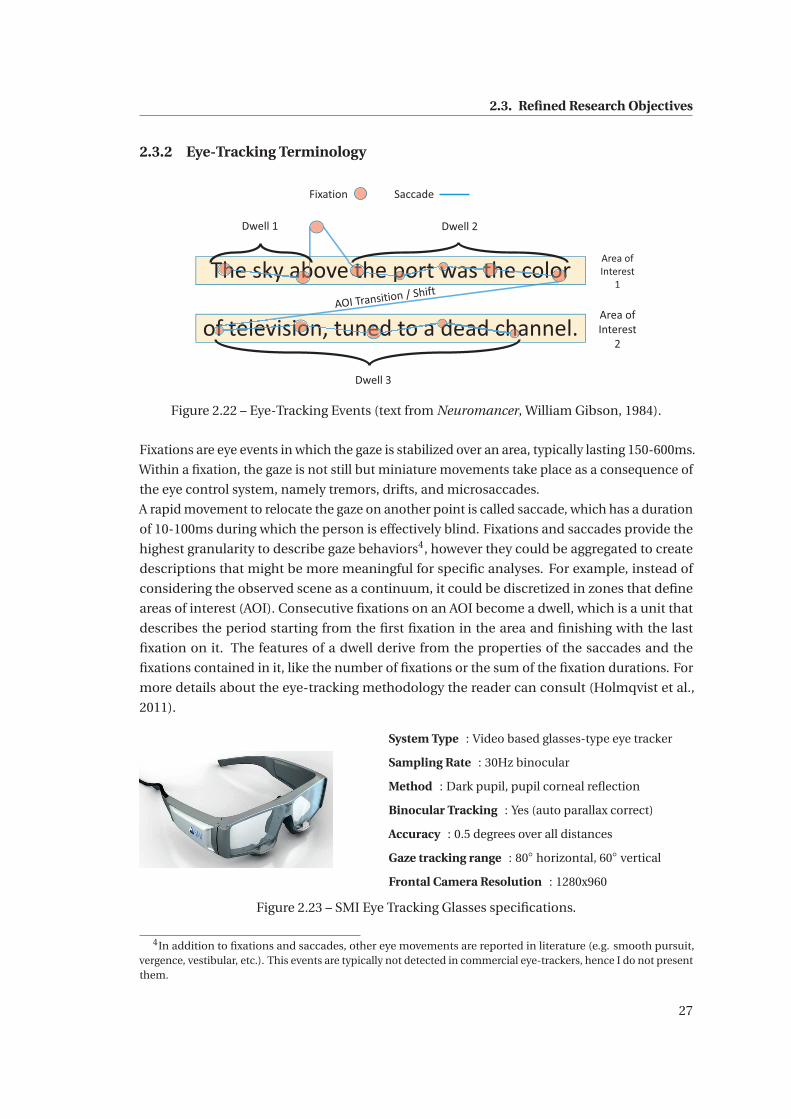
2.3. Refined Research Objectives
2.3.2 Eye-Tracking Terminology
The sky above the port was the color
of television, tuned to a dead channel.f televi
Th ab p w th or
ff deio ha
he sky abb ort was he colo
television, tun d to a dead ch
Fixation Saccade
Area of Interest
1
Area of Interest
2
Dwell 3
he pth
Dwell 1 Dwell 2
Figure 2.22 – Eye-Tracking Events (text from Neuromancer, William Gibson, 1984).
Fixations are eye events in which the gaze is stabilized over an area, typically lasting 150-600ms.
Within a fixation, the gaze is not still but miniature movements take place as a consequence of
the eye control system, namely tremors, drifts, and microsaccades.
A rapid movement to relocate the gaze on another point is called saccade, which has a duration
of 10-100ms during which the person is effectively blind. Fixations and saccades provide the
highest granularity to describe gaze behaviors4, however they could be aggregated to create
descriptions that might be more meaningful for specific analyses. For example, instead of
considering the observed scene as a continuum, it could be discretized in zones that define
areas of interest (AOI). Consecutive fixations on an AOI become a dwell, which is a unit that
describes the period starting from the first fixation in the area and finishing with the last
fixation on it. The features of a dwell derive from the properties of the saccades and the
fixations contained in it, like the number of fixations or the sum of the fixation durations. For
more details about the eye-tracking methodology the reader can consult (Holmqvist et al.,
2011).
System Type : Video based glasses-type eye tracker
Sampling Rate : 30Hz binocular
Method : Dark pupil, pupil corneal reflection
Binocular Tracking : Yes (auto parallax correct)
Accuracy : 0.5 degrees over all distances
Gaze tracking range : 80◦ horizontal, 60◦ vertical
Frontal Camera Resolution : 1280x960
Figure 2.23 – SMI Eye Tracking Glasses specifications.
4In addition to fixations and saccades, other eye movements are reported in literature (e.g. smooth pursuit,vergence, vestibular, etc.). This events are typically not detected in commercial eye-trackers, hence I do not presentthem.
27
Chapter 2. Related Work and Research Methodology
In all the experiments, participants wore the mobile eye tracking device SMI Eye Tracking
Glasses, featuring binocular pupil tracking at 30Hz (Figure 2.23). The eye-tracking raw data
were exported using the software SMI BeGaze and successively the gaze events were associated
to the areas of interest defined in each experiment.
2.3.3 Pedagogical Framework
In the design of our technology we adopted a constructive stance, believing that the develop-
ment of a qualitative understanding of statics requires to engage learners in rich sense-making
activities. An intuitive knowledge of such topic requires to be constructed through active learn-
ing processes in the sense that “learner engages in appropriate cognitive processing during
learning (e.g., selecting relevant incoming information, organizing it into a coherent mental
structure, and integrating it with relevant prior knowledge)”(Mayer, 2009). Our technology
is meant to be integrated in a pedagogical activity to support such appropriate cognitive
processes. It does not prescribe a specific pedagogy and, as such, it can serve both active
instructional methods, such as guided discovery or collaborative activities, and passive ones
(e.g. principled presentations).
The studies presented in this thesis concerned discovery-based activities which we imagined to
complement traditional class sessions. When we evaluated our design choices, an immediate
learning outcome consisted in the evaluation of students’ performance in statics problem
solving exercises before, during and after a given activity. This kind of assessment allowed us
to gain insights about learners’ difficulties and common mistakes. However, since our learning
objective could not be achieved through single interventions, our activities often did not lead
to significant learning improvements.
Hence, the correctness of the students’ solutions could not be the only desired outcome. We
investigated also how the discovery was affected by the design variations, for example, in terms
of similarity between novices and experts in solving statics problems or according to the quality
of the verbalization of learners’ reasoning. We have previously mentioned that an obstacle
to the construction of a correct intuition of statics and, more broadly, physics is represented
by the body of misconceptions built from everyday observations. Hence, a successful design
would be one that challenges students’ prior knowledge and help to identify analogies or
crucial differences between case scenarios. Engaging learners in an exploratory activity makes
them generate their own ways of framing problems, ideas, explanations and solutions. These
productions would be often incorrect or suboptimal and they would lead to a unsuccessful
attempt to solve the given problems. Nevertheless, the rationale for having such generative
phase could be found in the preparation for future learning (PFL) principles(Bransford and
Schwartz, 1999). According to the PFL framework, before introducing learners to the correct
methods and solutions, students should engage in activities meant to stimulate their curiosity
and to build a type of prior knowledge called perceptual differentiation. The term refers, for
instance, to the ability of distinguishing meaningful details in the description of a problem
from irrelevant features. Students develop this ability by analysing and comparing cases that
28

2.3. Refined Research Objectives
are carefully designed for such purpose (contrasting cases). These cases could be generated
by the learners through an exploratory activity, but the important aspect is that learners
eventually confront their productions with the canonical solutions (Schwartz and Martin,
2004; Kapur, 2008). In this way, learners can deeply appreciate such solutions and understand
the issues that led to their formulation. The PFL framework has found application in the design
of learning activities about statistics, physics and neuroscience(Schwartz and Martin, 2004;
Schwartz et al., 2011; Schneider et al., 2013b). Recently Schneider has discussed the potential of
mixed-reality technologies to implement technology-enhanced PFL sequences which leverage
on the aforementioned learning benefits (support to spatial cognition, multiple representation,
physicality, etc.) to scaffold the generation of hypotheses by the learners (Schneider, 2017).
We did not follow the PFL guidelines, since our activities were more open-ended than tradi-
tional PFL ones. Furthermore, due to practical constraints, the exploration was not followed
by a phase of direct instruction. Even so, we have found in the PFL principles a constructivist-
oriented way of assessing the potential of our AR-based learning tool. It could operate under
the same assumptions: fostering learners’ intuitions about statics in order to prepare them for
what will be taught in a later stage.
29

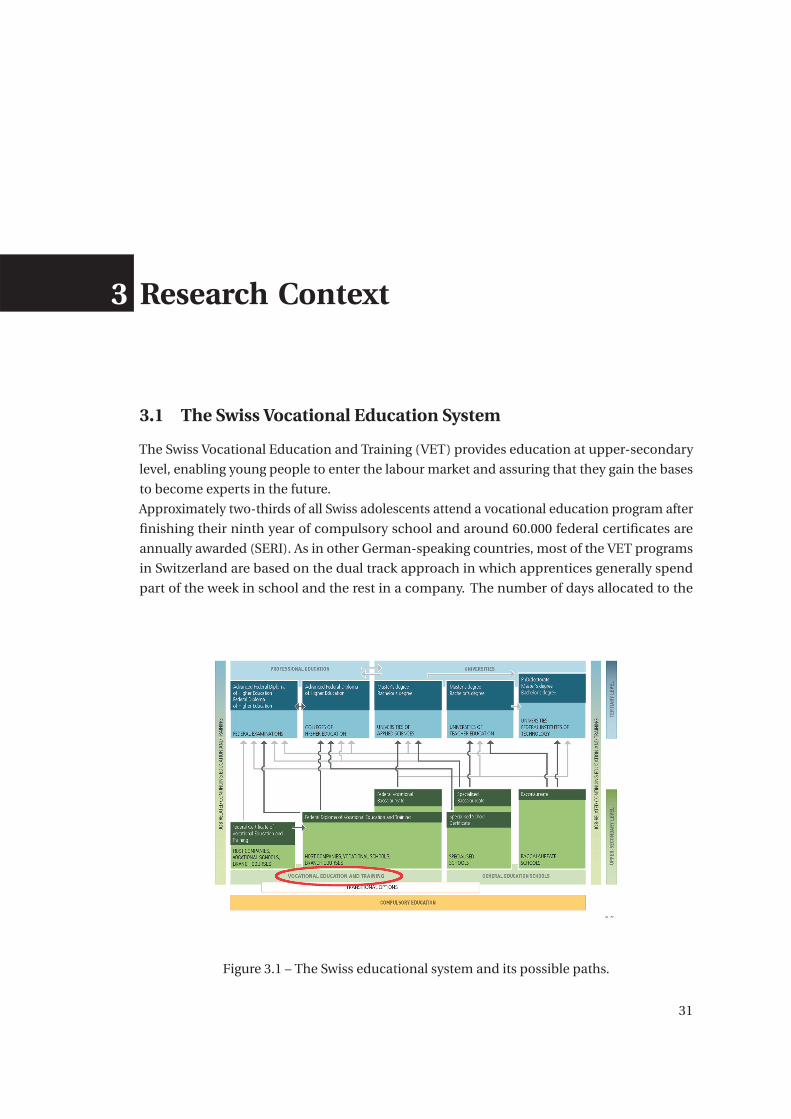
3 Research Context
3.1 The Swiss Vocational Education System
The Swiss Vocational Education and Training (VET) provides education at upper-secondary
level, enabling young people to enter the labour market and assuring that they gain the bases
to become experts in the future.
Approximately two-thirds of all Swiss adolescents attend a vocational education program after
finishing their ninth year of compulsory school and around 60.000 federal certificates are
annually awarded (SERI). As in other German-speaking countries, most of the VET programs
in Switzerland are based on the dual track approach in which apprentices generally spend
part of the week in school and the rest in a company. The number of days allocated to the
Figure 3.1 – The Swiss educational system and its possible paths.
31
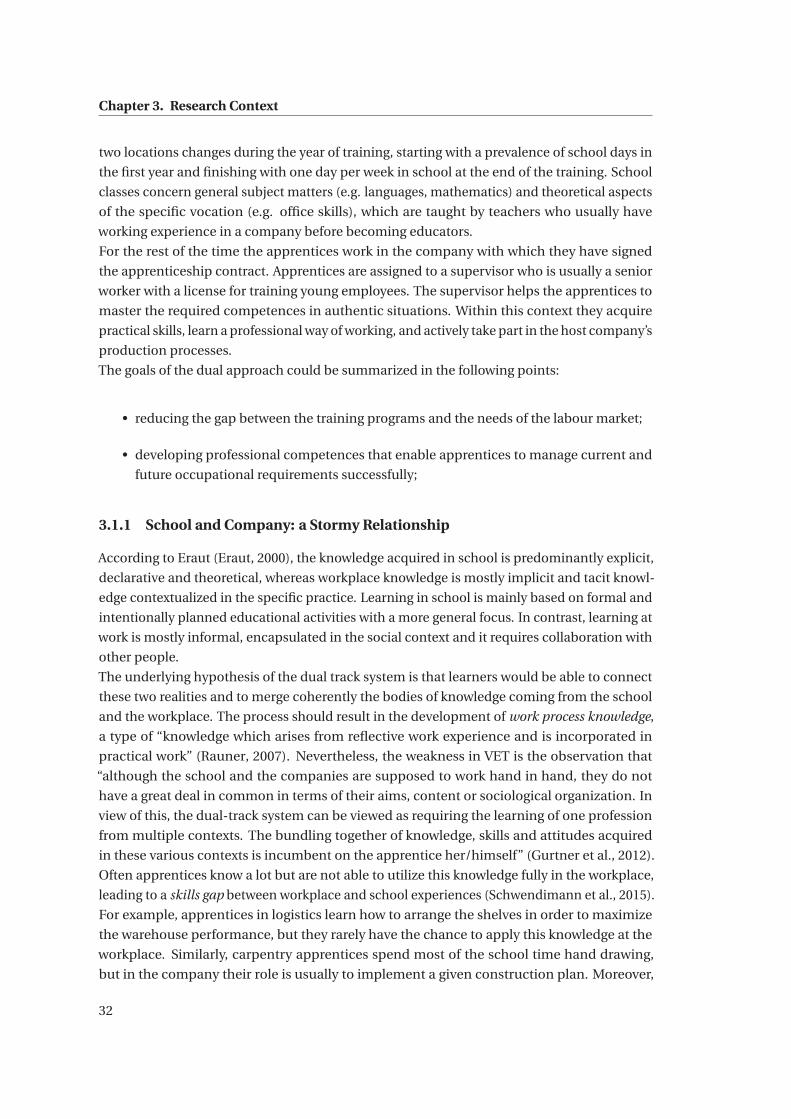
Chapter 3. Research Context
two locations changes during the year of training, starting with a prevalence of school days in
the first year and finishing with one day per week in school at the end of the training. School
classes concern general subject matters (e.g. languages, mathematics) and theoretical aspects
of the specific vocation (e.g. office skills), which are taught by teachers who usually have
working experience in a company before becoming educators.
For the rest of the time the apprentices work in the company with which they have signed
the apprenticeship contract. Apprentices are assigned to a supervisor who is usually a senior
worker with a license for training young employees. The supervisor helps the apprentices to
master the required competences in authentic situations. Within this context they acquire
practical skills, learn a professional way of working, and actively take part in the host company’s
production processes.
The goals of the dual approach could be summarized in the following points:
• reducing the gap between the training programs and the needs of the labour market;
• developing professional competences that enable apprentices to manage current and
future occupational requirements successfully;
3.1.1 School and Company: a Stormy Relationship
According to Eraut (Eraut, 2000), the knowledge acquired in school is predominantly explicit,
declarative and theoretical, whereas workplace knowledge is mostly implicit and tacit knowl-
edge contextualized in the specific practice. Learning in school is mainly based on formal and
intentionally planned educational activities with a more general focus. In contrast, learning at
work is mostly informal, encapsulated in the social context and it requires collaboration with
other people.
The underlying hypothesis of the dual track system is that learners would be able to connect
these two realities and to merge coherently the bodies of knowledge coming from the school
and the workplace. The process should result in the development of work process knowledge,
a type of “knowledge which arises from reflective work experience and is incorporated in
practical work” (Rauner, 2007). Nevertheless, the weakness in VET is the observation that
“although the school and the companies are supposed to work hand in hand, they do not
have a great deal in common in terms of their aims, content or sociological organization. In
view of this, the dual-track system can be viewed as requiring the learning of one profession
from multiple contexts. The bundling together of knowledge, skills and attitudes acquired
in these various contexts is incumbent on the apprentice her/himself” (Gurtner et al., 2012).
Often apprentices know a lot but are not able to utilize this knowledge fully in the workplace,
leading to a skills gap between workplace and school experiences (Schwendimann et al., 2015).
For example, apprentices in logistics learn how to arrange the shelves in order to maximize
the warehouse performance, but they rarely have the chance to apply this knowledge at the
workplace. Similarly, carpentry apprentices spend most of the school time hand drawing,
but in the company their role is usually to implement a given construction plan. Moreover,
32
3.1. The Swiss Vocational Education System
depending on the company they are hired by, apprentices might have or not have the chance to
make some experiences. For instance, a carpenter working for a company that manufactures
timbers will never go to a construction site and place a scaffold.
The research presented in this thesis constitutes one direction of the Dual-T project (Dual-T),
which aims at bridging the gaps between the multiple vocational contexts. Assuming that the
differences between school and workplace are essential to the success of the dual model, the
project considers the necessity of boundary crossing spaces to integrate what is learned in both
places without trying to suppress their specificities. An aspect of the project is to investigate
the features of learning technologies that could enable to bridge the gap between school and
workplace, as well as between the stakeholders who belong to these locations. It also explores
learning activities that are relevant to the contexts of vocational education and that could
benefit from technology enhanced learning. The central hypothesis of Dual-T is that digital
technologies can create a reflection space that connects workplace experience to classroom
activities. This hypothesis is translated in the concept of the Erfahrraum (combining the Ger-
man words experience and space), which describes multiple technologies and activities that
create a shared space to foster learning through reflection. Through the systematic reflection
of their experiences, apprentices integrate practical and theoretical knowledge. Thanks to the
reflection space created by the Erfahrraum knowledge can be communicated back and forth
from one context to another and shared with all actors (Schwendimann et al., 2015, Figure
3.2).
Figure 3.2 – Erfahrraum: a pedagogical model to inform the design of technology-enhancedVET learning activities (Schwendimann et al., 2015).
The implementation of the Erfahrraum principles could be found in the learning platform
33
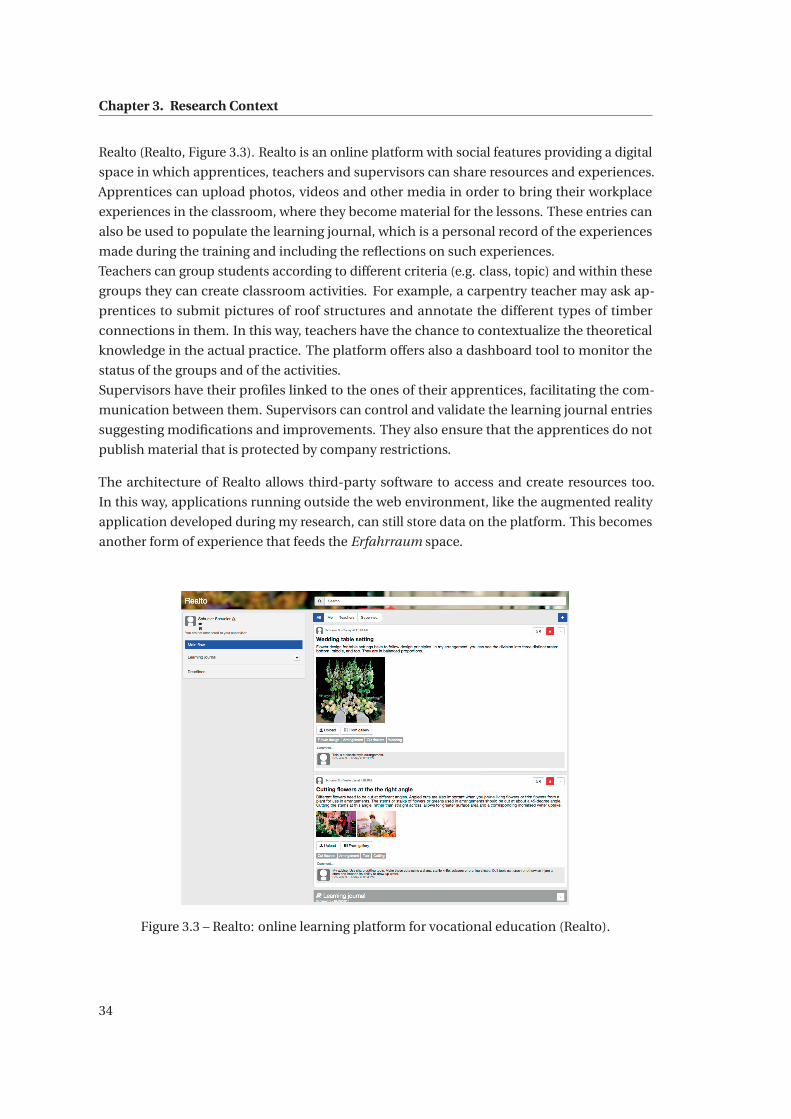
Chapter 3. Research Context
Realto (Realto, Figure 3.3). Realto is an online platform with social features providing a digital
space in which apprentices, teachers and supervisors can share resources and experiences.
Apprentices can upload photos, videos and other media in order to bring their workplace
experiences in the classroom, where they become material for the lessons. These entries can
also be used to populate the learning journal, which is a personal record of the experiences
made during the training and including the reflections on such experiences.
Teachers can group students according to different criteria (e.g. class, topic) and within these
groups they can create classroom activities. For example, a carpentry teacher may ask ap-
prentices to submit pictures of roof structures and annotate the different types of timber
connections in them. In this way, teachers have the chance to contextualize the theoretical
knowledge in the actual practice. The platform offers also a dashboard tool to monitor the
status of the groups and of the activities.
Supervisors have their profiles linked to the ones of their apprentices, facilitating the com-
munication between them. Supervisors can control and validate the learning journal entries
suggesting modifications and improvements. They also ensure that the apprentices do not
publish material that is protected by company restrictions.
The architecture of Realto allows third-party software to access and create resources too.
In this way, applications running outside the web environment, like the augmented reality
application developed during my research, can still store data on the platform. This becomes
another form of experience that feeds the Erfahrraum space.
Figure 3.3 – Realto: online learning platform for vocational education (Realto).
34
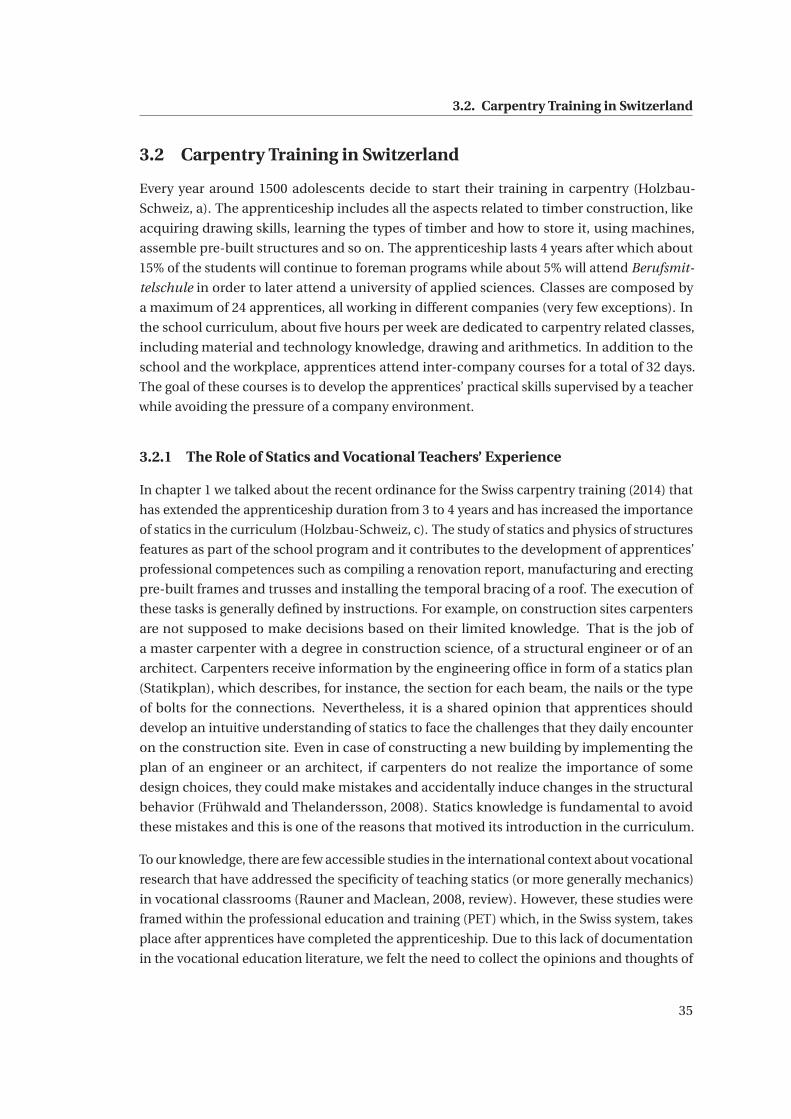
3.2. Carpentry Training in Switzerland
3.2 Carpentry Training in Switzerland
Every year around 1500 adolescents decide to start their training in carpentry (Holzbau-
Schweiz, a). The apprenticeship includes all the aspects related to timber construction, like
acquiring drawing skills, learning the types of timber and how to store it, using machines,
assemble pre-built structures and so on. The apprenticeship lasts 4 years after which about
15% of the students will continue to foreman programs while about 5% will attend Berufsmit-
telschule in order to later attend a university of applied sciences. Classes are composed by
a maximum of 24 apprentices, all working in different companies (very few exceptions). In
the school curriculum, about five hours per week are dedicated to carpentry related classes,
including material and technology knowledge, drawing and arithmetics. In addition to the
school and the workplace, apprentices attend inter-company courses for a total of 32 days.
The goal of these courses is to develop the apprentices’ practical skills supervised by a teacher
while avoiding the pressure of a company environment.
3.2.1 The Role of Statics and Vocational Teachers’ Experience
In chapter 1 we talked about the recent ordinance for the Swiss carpentry training (2014) that
has extended the apprenticeship duration from 3 to 4 years and has increased the importance
of statics in the curriculum (Holzbau-Schweiz, c). The study of statics and physics of structures
features as part of the school program and it contributes to the development of apprentices’
professional competences such as compiling a renovation report, manufacturing and erecting
pre-built frames and trusses and installing the temporal bracing of a roof. The execution of
these tasks is generally defined by instructions. For example, on construction sites carpenters
are not supposed to make decisions based on their limited knowledge. That is the job of
a master carpenter with a degree in construction science, of a structural engineer or of an
architect. Carpenters receive information by the engineering office in form of a statics plan
(Statikplan), which describes, for instance, the section for each beam, the nails or the type
of bolts for the connections. Nevertheless, it is a shared opinion that apprentices should
develop an intuitive understanding of statics to face the challenges that they daily encounter
on the construction site. Even in case of constructing a new building by implementing the
plan of an engineer or an architect, if carpenters do not realize the importance of some
design choices, they could make mistakes and accidentally induce changes in the structural
behavior (Frühwald and Thelandersson, 2008). Statics knowledge is fundamental to avoid
these mistakes and this is one of the reasons that motived its introduction in the curriculum.
To our knowledge, there are few accessible studies in the international context about vocational
research that have addressed the specificity of teaching statics (or more generally mechanics)
in vocational classrooms (Rauner and Maclean, 2008, review). However, these studies were
framed within the professional education and training (PET) which, in the Swiss system, takes
place after apprentices have completed the apprenticeship. Due to this lack of documentation
in the vocational education literature, we felt the need to collect the opinions and thoughts of
35
Chapter 3. Research Context
several carpentry teachers before jumping in the implementation of any technology. Eight
teachers from three different schools were willing to share their experiences about teaching
this topic and explore new solutions. Considering that the adoption of 4-year apprenticeship
has started in the fall semester of 2014 and that our research started around the same time,
the observations that follow refer to teachers’ experiences in the former 3-year curriculum.
Statics is typically introduced to apprentices together with the general topics related to me-
chanics and the strength of materials, such as mass, forces, lever or pulleys. These topics are
covered in approximately 15 lessons (45 minutes each). In addition to the textbook, which
often presents the topics in a theoretical and abstract way, teachers devote part of their time in
creating practical examples and hand-on activities. For instance, a folding ruler in the shape
of a portal frame is used to demonstrate the effects of sideways forces (e.g. wind); in order to
show the effect of the gravity force on the members of a triangular truss, teachers make pairs
of apprentices and ask them to lean forward and push off each other; the same exercise could
be used to illustrate the action-reaction principle by putting soap under the shoes of one of the
apprentices, who will slide sideways. “We are practitioners!” is the teachers’ motto, marking
the importance to show practical examples, to manipulate, to play, to try. The hands-on and
embodied approach does not scale for presenting more advanced scenarios and it does not
necessarily guarantee that apprentices would learn the new concepts.
The time spent on actual structural behavior is a small portion and it includes mostly ex-
amples of simple beam systems or trusses. These sessions are structured in three steps: (1)
showing real-life scenarios, like the design of a new building, an example of failure, etc.; (2) the
teacher demonstrates on the blackboard the important structural aspects and the procedures
to compute forces, stress or correct dimensioning of the structure elements; (3) the students
replicate the procedures using a worksheet.
As regards the difficulties exhibited by apprentices, according to one of the teachers who has
been lecturing foreman carpenters in advanced statics1, carpenters who joined his courses had
difficulties in visualizing how loads act on structures (converting individual loads to line-loads
or area-loads) but also in making sense of the formulas for bending and deformation. The
problem seems to arise from both the visualization skills needed to build mental models of
these physical entities in 3D and the grounding of the subject in concrete workplace examples.
Hence, considering a long-term horizon, the acquisition of a conceptual understanding during
the apprenticeship might be helpful to the carpenters who will seek for higher educational
diplomas too.
The general domain constraints from the teachers can be summarized in the following points:
Avoid formalisms and present concrete examples The mathematical reasoning developed
during the apprenticeship is generally oriented to the execution of the professional
1Advanced statics and quantitative methods are taught in professional courses after completing the apprentice-ship. The course usually include 35-40 lessons about statics and structural analysis.
36
3.2. Carpentry Training in Switzerland
(a) Two people push off each other in order to“feel” the action-reaction principle.
(b) A deformable beam made of glued layers ofpolyurethane foam.
(c) A pulley system. On the top, a simple beamwith two supports. The two load cells show howa load is distributed between the two supports.
(d) A small hydraulic press to test the strengthof several materials.
Figure 3.4 – Activities and tools for introducing topics related to mechanics.
tasks. In class, teachers develop concrete problems in order to stimulate apprentices’
explanations and solutions 2. In this way, there would be higher chances for students to
recall intuitions they might have had while working.
Minimize the downtime Time is a scarce resource in vocational schools. The materials for
the course are ready to be used and generally available in the classroom or in a storage
room literally distant a couple of minutes from the class. This means that, for example, a
physical model has to be quickly assembled/disassembled because teachers only need
it briefly and then store it away. Teachers showed a positive attitude towards having
an AR application running on the students smart-phones since it would not require to
move the class to a computer lab.
Design for physical robustness Physical and bodily interactions are at the core of the carpen-
try learning experience. Students are surrounded by models that they can dismantle,
manipulate and test. This requires physical prototypes and products to be sturdy.
2Similar observations were made by Millroy in (Millroy, 1991).
37
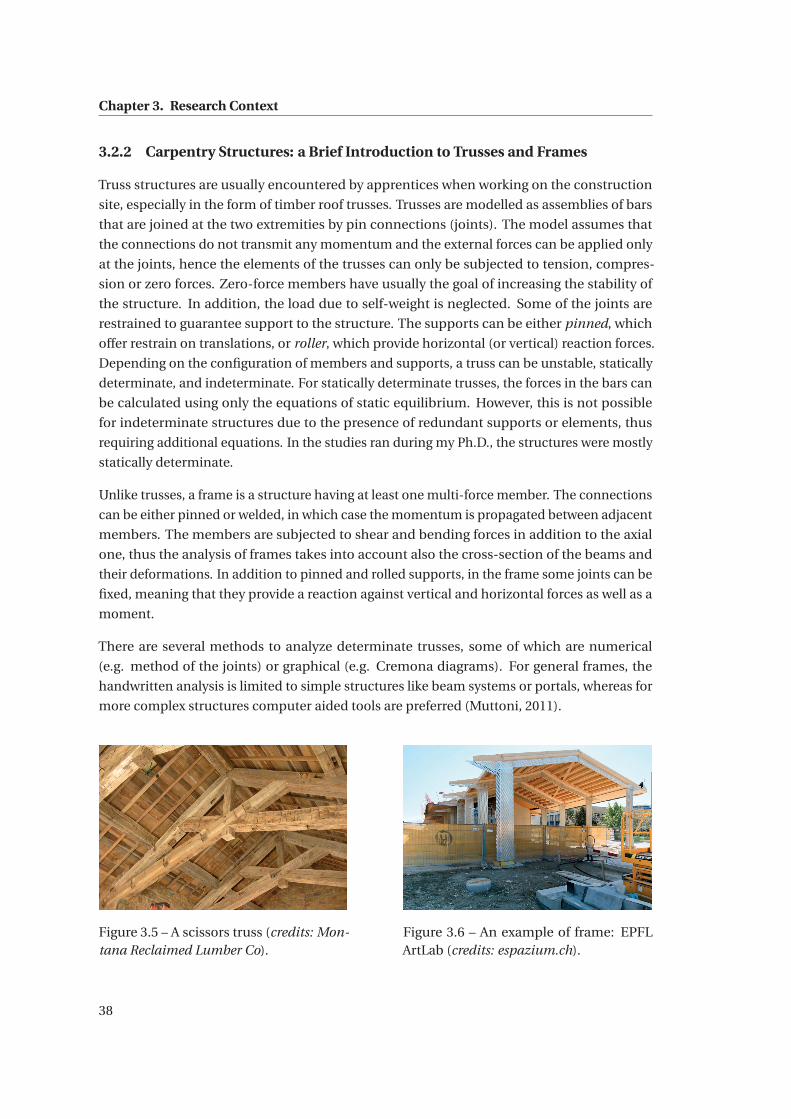
Chapter 3. Research Context
3.2.2 Carpentry Structures: a Brief Introduction to Trusses and Frames
Truss structures are usually encountered by apprentices when working on the construction
site, especially in the form of timber roof trusses. Trusses are modelled as assemblies of bars
that are joined at the two extremities by pin connections (joints). The model assumes that
the connections do not transmit any momentum and the external forces can be applied only
at the joints, hence the elements of the trusses can only be subjected to tension, compres-
sion or zero forces. Zero-force members have usually the goal of increasing the stability of
the structure. In addition, the load due to self-weight is neglected. Some of the joints are
restrained to guarantee support to the structure. The supports can be either pinned, which
offer restrain on translations, or roller, which provide horizontal (or vertical) reaction forces.
Depending on the configuration of members and supports, a truss can be unstable, statically
determinate, and indeterminate. For statically determinate trusses, the forces in the bars can
be calculated using only the equations of static equilibrium. However, this is not possible
for indeterminate structures due to the presence of redundant supports or elements, thus
requiring additional equations. In the studies ran during my Ph.D., the structures were mostly
statically determinate.
Unlike trusses, a frame is a structure having at least one multi-force member. The connections
can be either pinned or welded, in which case the momentum is propagated between adjacent
members. The members are subjected to shear and bending forces in addition to the axial
one, thus the analysis of frames takes into account also the cross-section of the beams and
their deformations. In addition to pinned and rolled supports, in the frame some joints can be
fixed, meaning that they provide a reaction against vertical and horizontal forces as well as a
moment.
There are several methods to analyze determinate trusses, some of which are numerical
(e.g. method of the joints) or graphical (e.g. Cremona diagrams). For general frames, the
handwritten analysis is limited to simple structures like beam systems or portals, whereas for
more complex structures computer aided tools are preferred (Muttoni, 2011).
Figure 3.5 – A scissors truss (credits: Mon-tana Reclaimed Lumber Co).
Figure 3.6 – An example of frame: EPFLArtLab (credits: espazium.ch).
38
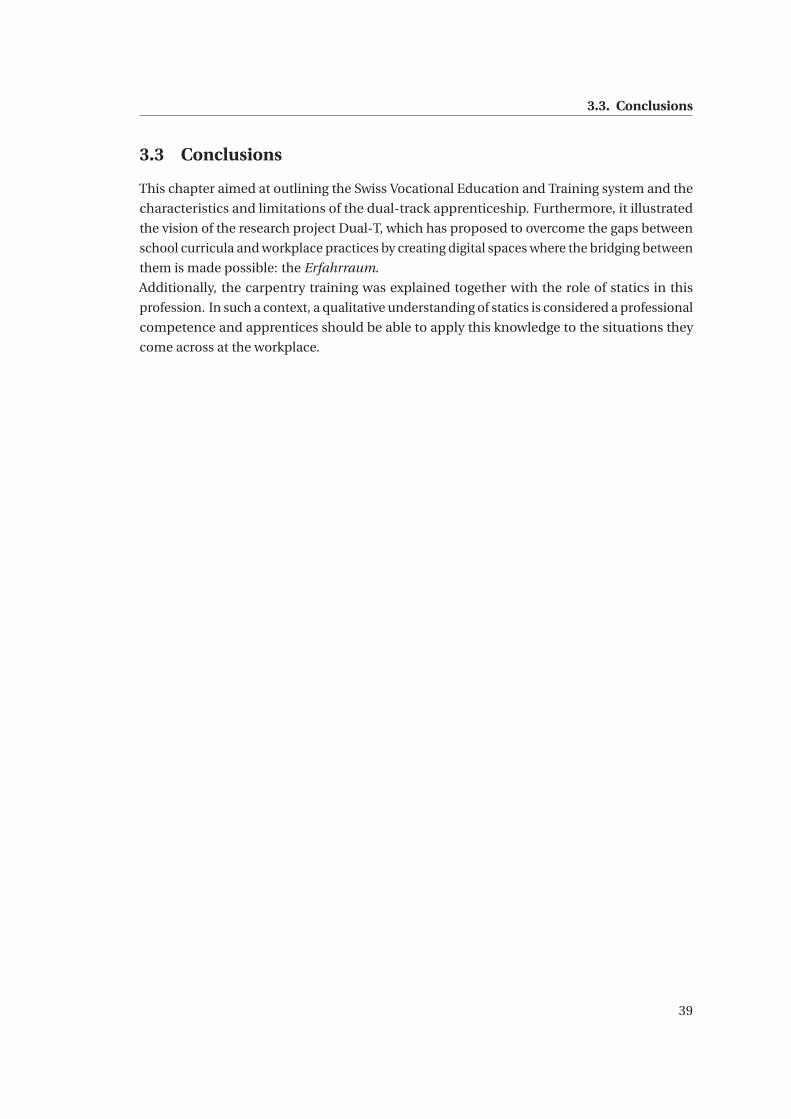
3.3. Conclusions
3.3 Conclusions
This chapter aimed at outlining the Swiss Vocational Education and Training system and the
characteristics and limitations of the dual-track apprenticeship. Furthermore, it illustrated
the vision of the research project Dual-T, which has proposed to overcome the gaps between
school curricula and workplace practices by creating digital spaces where the bridging between
them is made possible: the Erfahrraum.
Additionally, the carpentry training was explained together with the role of statics in this
profession. In such a context, a qualitative understanding of statics is considered a professional
competence and apprentices should be able to apply this knowledge to the situations they
come across at the workplace.
39

4 Study I: TUI Benefits through theEye-Tracking Lens
4.1 Introduction
In this chapter we present an eye-tracking study which aimed at comparing the effects of
TUI and GUI when solving a task involving spatial reasoning. Chronologically, the theme of
statics in carpentry training emerged towards the end of this study. This broadened the study
of Cuendet about using tangible interfaces for enhancing carpenters’ spatial skills (Cuendet,
2013). Nevertheless, this work is not disconnected from the rest of our research, since it treated
a central subject of this thesis: the impact of physical artefacts in mixed-reality experiences.
As discussed in chapter 3, several authors have shown that TUIs are better suited to support the
users’ spatial reasoning compared to GUIs. The putative benefits are based on the hypothesis
that the physicality of the tools scaffolds the process of building mental models of the entities
that the users manipulate and of their spatial relationships (Marshall, 2007). Moreover, a
tangible representation is supposed to provide an intermediate level of abstraction between
real objects and their representations on the screen (Zufferey et al., 2009).
I use the term “putative” because there is still an on-going discussion in the TUI research com-
munity about the lack of empirical studies that could support the aforementioned hypotheses
and about the development of a theoretically grounded framework that could account for
those benefits (Antle and Wise, 2013).
To our knowledge, at the time this study was run, in 2014, the application of the eye-tracking
methodology to TUI research was novel, although it was already widespread in other HCI
research fields. The eye-tracking literature encompasses a variety of theories that link the
differences in users’ mental processes with variations at gaze level. Hence we decided to
investigate the differences (if any) that arise in users’ gaze behaviour when using either TUIs or
GUIs. We designed the following comparative study in which we asked participants to perform
a Computer Aided Design (CAD) activity with either a tangible or a graphical interface. Due to
a lack of previous works combining gaze analysis and tangible interfaces, we were not sure
which gaze variables would have exhibited a difference between the two interaction styles.
This motivated the exploratory nature of the work that is presented in this chapter. The study
41
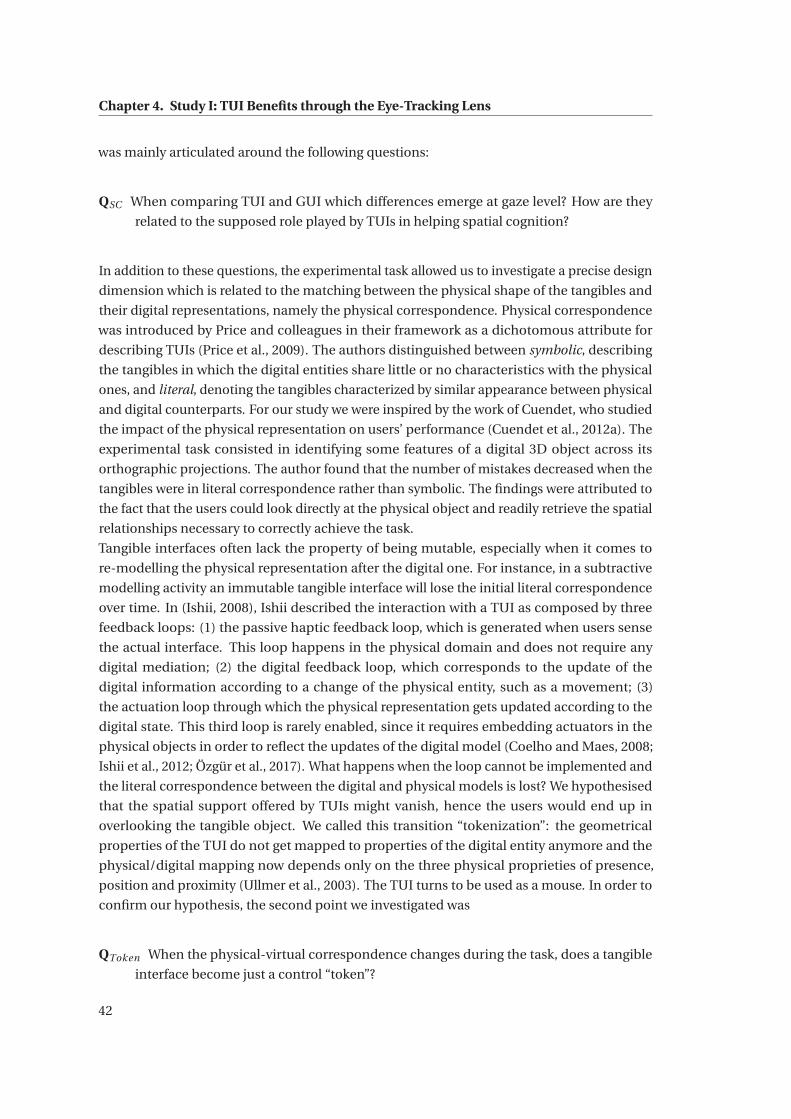
Chapter 4. Study I: TUI Benefits through the Eye-Tracking Lens
was mainly articulated around the following questions:
QSC When comparing TUI and GUI which differences emerge at gaze level? How are they
related to the supposed role played by TUIs in helping spatial cognition?
In addition to these questions, the experimental task allowed us to investigate a precise design
dimension which is related to the matching between the physical shape of the tangibles and
their digital representations, namely the physical correspondence. Physical correspondence
was introduced by Price and colleagues in their framework as a dichotomous attribute for
describing TUIs (Price et al., 2009). The authors distinguished between symbolic, describing
the tangibles in which the digital entities share little or no characteristics with the physical
ones, and literal, denoting the tangibles characterized by similar appearance between physical
and digital counterparts. For our study we were inspired by the work of Cuendet, who studied
the impact of the physical representation on users’ performance (Cuendet et al., 2012a). The
experimental task consisted in identifying some features of a digital 3D object across its
orthographic projections. The author found that the number of mistakes decreased when the
tangibles were in literal correspondence rather than symbolic. The findings were attributed to
the fact that the users could look directly at the physical object and readily retrieve the spatial
relationships necessary to correctly achieve the task.
Tangible interfaces often lack the property of being mutable, especially when it comes to
re-modelling the physical representation after the digital one. For instance, in a subtractive
modelling activity an immutable tangible interface will lose the initial literal correspondence
over time. In (Ishii, 2008), Ishii described the interaction with a TUI as composed by three
feedback loops: (1) the passive haptic feedback loop, which is generated when users sense
the actual interface. This loop happens in the physical domain and does not require any
digital mediation; (2) the digital feedback loop, which corresponds to the update of the
digital information according to a change of the physical entity, such as a movement; (3)
the actuation loop through which the physical representation gets updated according to the
digital state. This third loop is rarely enabled, since it requires embedding actuators in the
physical objects in order to reflect the updates of the digital model (Coelho and Maes, 2008;
Ishii et al., 2012; Özgür et al., 2017). What happens when the loop cannot be implemented and
the literal correspondence between the digital and physical models is lost? We hypothesised
that the spatial support offered by TUIs might vanish, hence the users would end up in
overlooking the tangible object. We called this transition “tokenization”: the geometrical
properties of the TUI do not get mapped to properties of the digital entity anymore and the
physical/digital mapping now depends only on the three physical proprieties of presence,
position and proximity (Ullmer et al., 2003). The TUI turns to be used as a mouse. In order to
confirm our hypothesis, the second point we investigated was
QToken When the physical-virtual correspondence changes during the task, does a tangible
interface become just a control “token”?
42
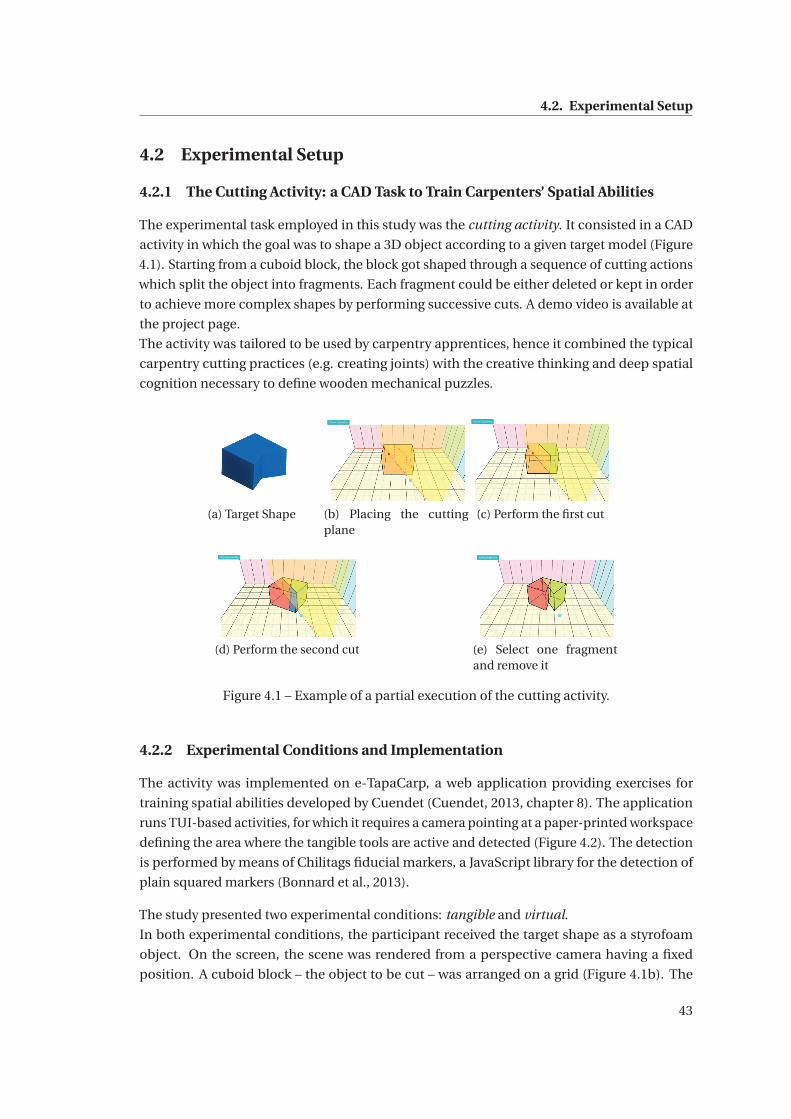
4.2. Experimental Setup
4.2 Experimental Setup
4.2.1 The Cutting Activity: a CAD Task to Train Carpenters’ Spatial Abilities
The experimental task employed in this study was the cutting activity. It consisted in a CAD
activity in which the goal was to shape a 3D object according to a given target model (Figure
4.1). Starting from a cuboid block, the block got shaped through a sequence of cutting actions
which split the object into fragments. Each fragment could be either deleted or kept in order
to achieve more complex shapes by performing successive cuts. A demo video is available at
the project page.
The activity was tailored to be used by carpentry apprentices, hence it combined the typical
carpentry cutting practices (e.g. creating joints) with the creative thinking and deep spatial
cognition necessary to define wooden mechanical puzzles.
(a) Target Shape (b) Placing the cuttingplane
(c) Perform the first cut
(d) Perform the second cut (e) Select one fragmentand remove it
Figure 4.1 – Example of a partial execution of the cutting activity.
4.2.2 Experimental Conditions and Implementation
The activity was implemented on e-TapaCarp, a web application providing exercises for
training spatial abilities developed by Cuendet (Cuendet, 2013, chapter 8). The application
runs TUI-based activities, for which it requires a camera pointing at a paper-printed workspace
defining the area where the tangible tools are active and detected (Figure 4.2). The detection
is performed by means of Chilitags fiducial markers, a JavaScript library for the detection of
plain squared markers (Bonnard et al., 2013).
The study presented two experimental conditions: tangible and virtual.
In both experimental conditions, the participant received the target shape as a styrofoam
object. On the screen, the scene was rendered from a perspective camera having a fixed
position. A cuboid block – the object to be cut – was arranged on a grid (Figure 4.1b). The
43
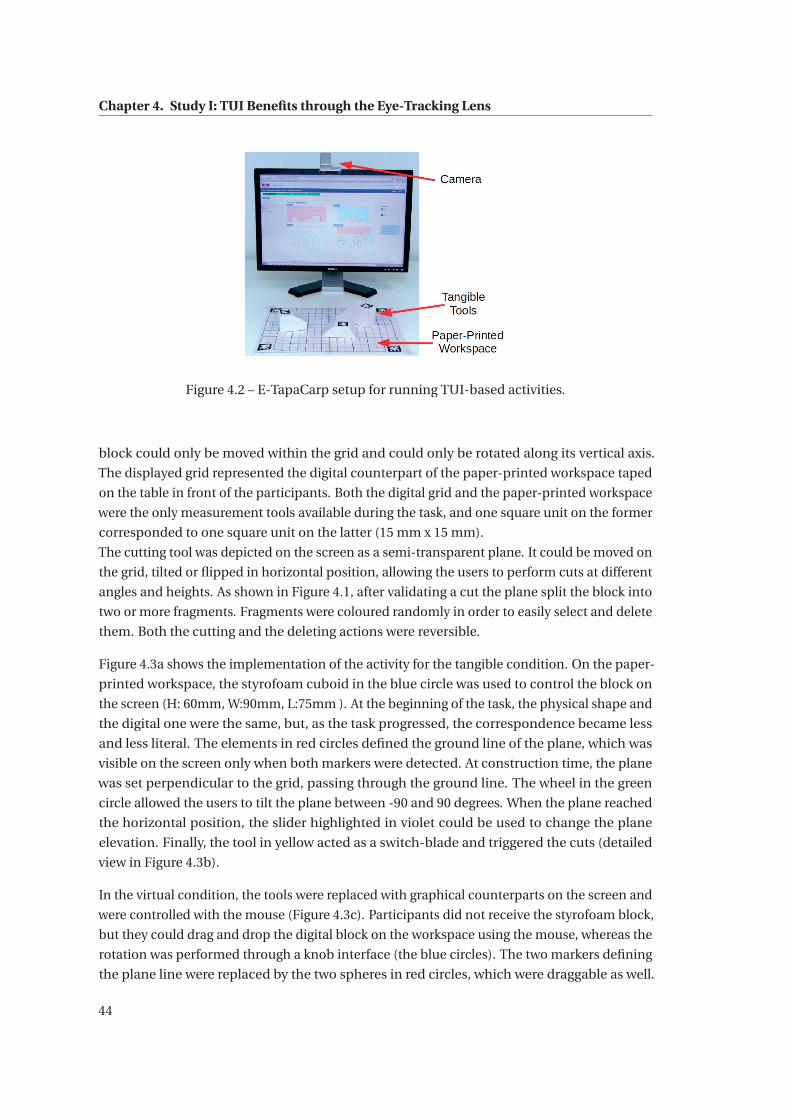
Chapter 4. Study I: TUI Benefits through the Eye-Tracking Lens
Figure 4.2 – E-TapaCarp setup for running TUI-based activities.
block could only be moved within the grid and could only be rotated along its vertical axis.
The displayed grid represented the digital counterpart of the paper-printed workspace taped
on the table in front of the participants. Both the digital grid and the paper-printed workspace
were the only measurement tools available during the task, and one square unit on the former
corresponded to one square unit on the latter (15 mm x 15 mm).
The cutting tool was depicted on the screen as a semi-transparent plane. It could be moved on
the grid, tilted or flipped in horizontal position, allowing the users to perform cuts at different
angles and heights. As shown in Figure 4.1, after validating a cut the plane split the block into
two or more fragments. Fragments were coloured randomly in order to easily select and delete
them. Both the cutting and the deleting actions were reversible.
Figure 4.3a shows the implementation of the activity for the tangible condition. On the paper-
printed workspace, the styrofoam cuboid in the blue circle was used to control the block on
the screen (H: 60mm, W:90mm, L:75mm ). At the beginning of the task, the physical shape and
the digital one were the same, but, as the task progressed, the correspondence became less
and less literal. The elements in red circles defined the ground line of the plane, which was
visible on the screen only when both markers were detected. At construction time, the plane
was set perpendicular to the grid, passing through the ground line. The wheel in the green
circle allowed the users to tilt the plane between -90 and 90 degrees. When the plane reached
the horizontal position, the slider highlighted in violet could be used to change the plane
elevation. Finally, the tool in yellow acted as a switch-blade and triggered the cuts (detailed
view in Figure 4.3b).
In the virtual condition, the tools were replaced with graphical counterparts on the screen and
were controlled with the mouse (Figure 4.3c). Participants did not receive the styrofoam block,
but they could drag and drop the digital block on the workspace using the mouse, whereas the
rotation was performed through a knob interface (the blue circles). The two markers defining
the plane line were replaced by the two spheres in red circles, which were draggable as well.
44
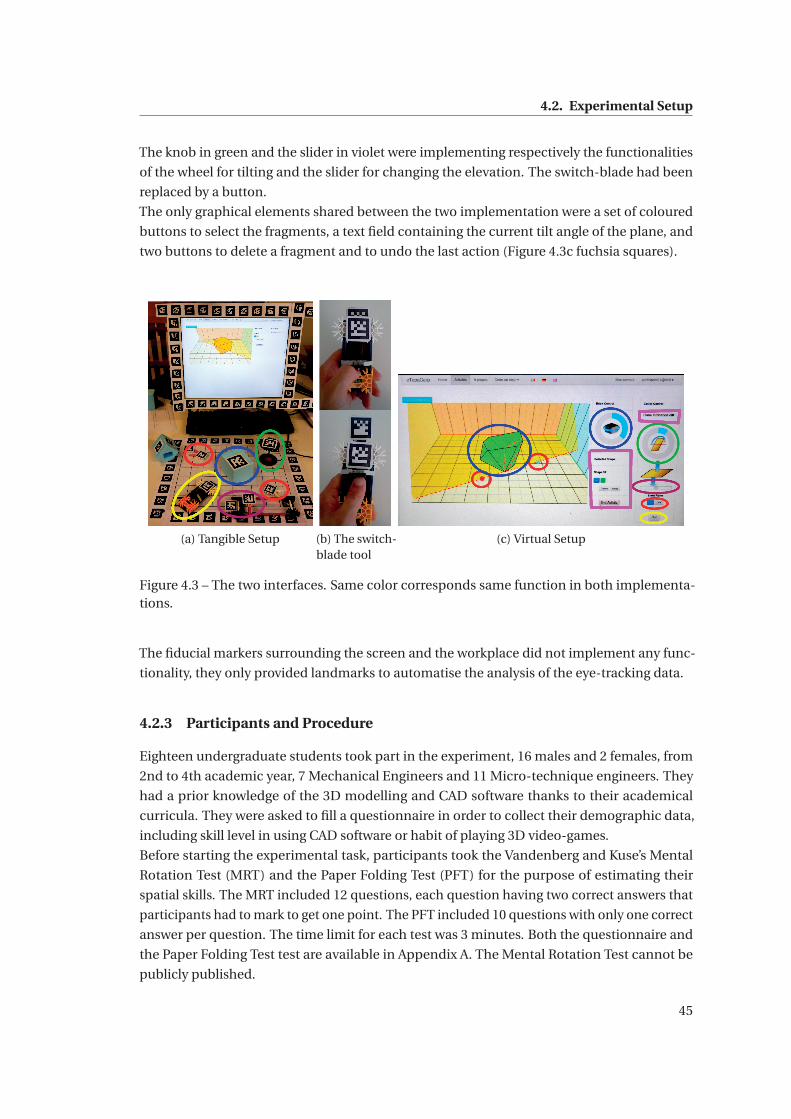
4.2. Experimental Setup
The knob in green and the slider in violet were implementing respectively the functionalities
of the wheel for tilting and the slider for changing the elevation. The switch-blade had been
replaced by a button.
The only graphical elements shared between the two implementation were a set of coloured
buttons to select the fragments, a text field containing the current tilt angle of the plane, and
two buttons to delete a fragment and to undo the last action (Figure 4.3c fuchsia squares).
(a) Tangible Setup (b) The switch-blade tool
(c) Virtual Setup
Figure 4.3 – The two interfaces. Same color corresponds same function in both implementa-tions.
The fiducial markers surrounding the screen and the workplace did not implement any func-
tionality, they only provided landmarks to automatise the analysis of the eye-tracking data.
4.2.3 Participants and Procedure
Eighteen undergraduate students took part in the experiment, 16 males and 2 females, from
2nd to 4th academic year, 7 Mechanical Engineers and 11 Micro-technique engineers. They
had a prior knowledge of the 3D modelling and CAD software thanks to their academical
curricula. They were asked to fill a questionnaire in order to collect their demographic data,
including skill level in using CAD software or habit of playing 3D video-games.
Before starting the experimental task, participants took the Vandenberg and Kuse’s Mental
Rotation Test (MRT) and the Paper Folding Test (PFT) for the purpose of estimating their
spatial skills. The MRT included 12 questions, each question having two correct answers that
participants had to mark to get one point. The PFT included 10 questions with only one correct
answer per question. The time limit for each test was 3 minutes. Both the questionnaire and
the Paper Folding Test test are available in Appendix A. The Mental Rotation Test cannot be
publicly published.
45
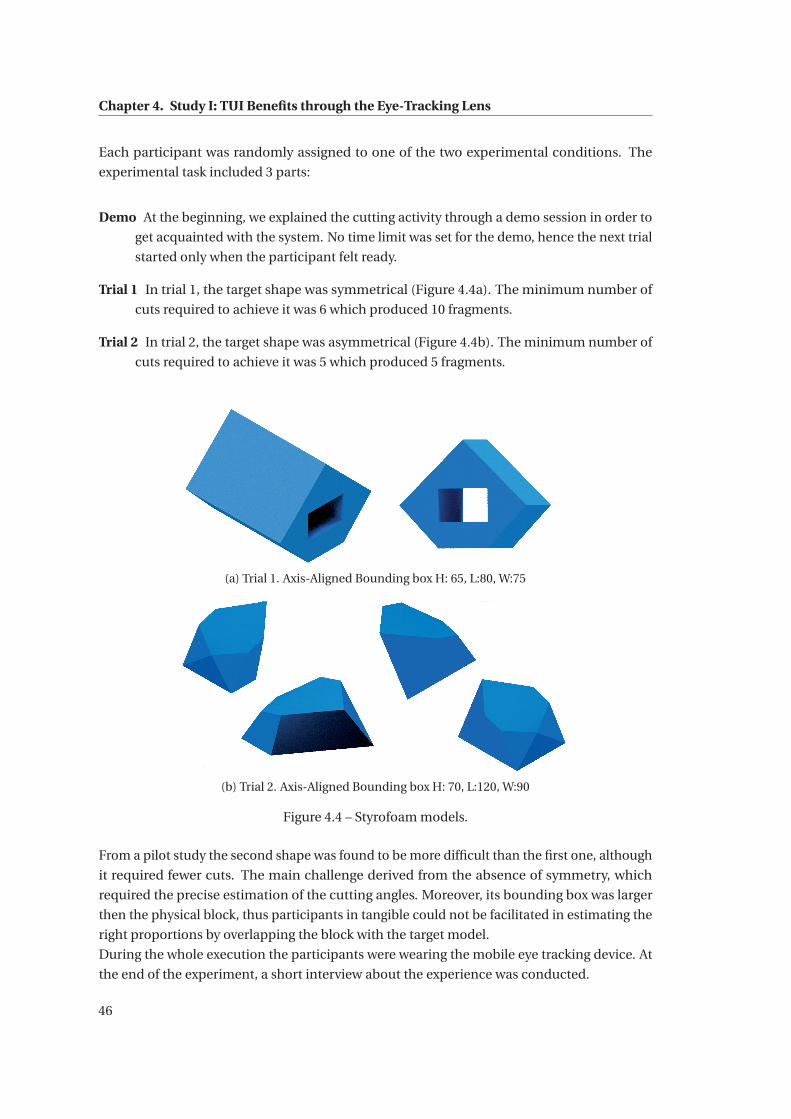
Chapter 4. Study I: TUI Benefits through the Eye-Tracking Lens
Each participant was randomly assigned to one of the two experimental conditions. The
experimental task included 3 parts:
Demo At the beginning, we explained the cutting activity through a demo session in order to
get acquainted with the system. No time limit was set for the demo, hence the next trial
started only when the participant felt ready.
Trial 1 In trial 1, the target shape was symmetrical (Figure 4.4a). The minimum number of
cuts required to achieve it was 6 which produced 10 fragments.
Trial 2 In trial 2, the target shape was asymmetrical (Figure 4.4b). The minimum number of
cuts required to achieve it was 5 which produced 5 fragments.
(a) Trial 1. Axis-Aligned Bounding box H: 65, L:80, W:75
(b) Trial 2. Axis-Aligned Bounding box H: 70, L:120, W:90
Figure 4.4 – Styrofoam models.
From a pilot study the second shape was found to be more difficult than the first one, although
it required fewer cuts. The main challenge derived from the absence of symmetry, which
required the precise estimation of the cutting angles. Moreover, its bounding box was larger
then the physical block, thus participants in tangible could not be facilitated in estimating the
right proportions by overlapping the block with the target model.
During the whole execution the participants were wearing the mobile eye tracking device. At
the end of the experiment, a short interview about the experience was conducted.
46
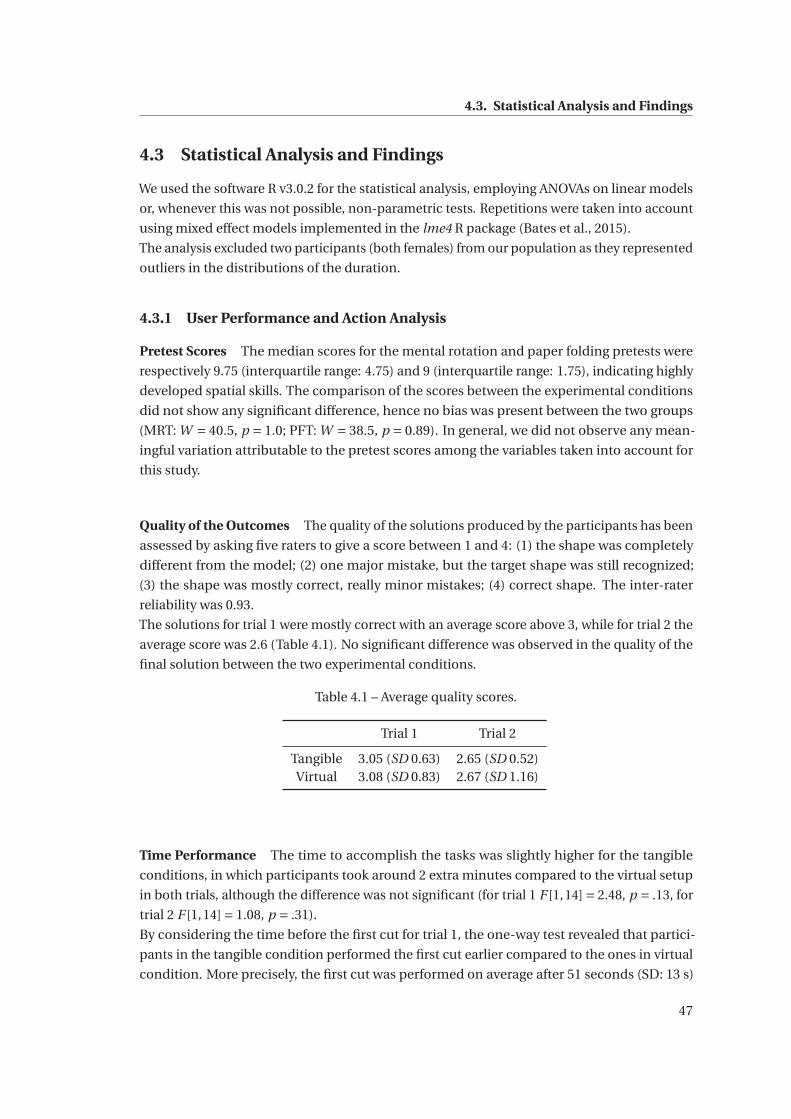
4.3. Statistical Analysis and Findings
4.3 Statistical Analysis and Findings
We used the software R v3.0.2 for the statistical analysis, employing ANOVAs on linear models
or, whenever this was not possible, non-parametric tests. Repetitions were taken into account
using mixed effect models implemented in the lme4 R package (Bates et al., 2015).
The analysis excluded two participants (both females) from our population as they represented
outliers in the distributions of the duration.
4.3.1 User Performance and Action Analysis
Pretest Scores The median scores for the mental rotation and paper folding pretests were
respectively 9.75 (interquartile range: 4.75) and 9 (interquartile range: 1.75), indicating highly
developed spatial skills. The comparison of the scores between the experimental conditions
did not show any significant difference, hence no bias was present between the two groups
(MRT: W = 40.5, p = 1.0; PFT: W = 38.5, p = 0.89). In general, we did not observe any mean-
ingful variation attributable to the pretest scores among the variables taken into account for
this study.
Quality of the Outcomes The quality of the solutions produced by the participants has been
assessed by asking five raters to give a score between 1 and 4: (1) the shape was completely
different from the model; (2) one major mistake, but the target shape was still recognized;
(3) the shape was mostly correct, really minor mistakes; (4) correct shape. The inter-rater
reliability was 0.93.
The solutions for trial 1 were mostly correct with an average score above 3, while for trial 2 the
average score was 2.6 (Table 4.1). No significant difference was observed in the quality of the
final solution between the two experimental conditions.
Table 4.1 – Average quality scores.
Trial 1 Trial 2
Tangible 3.05 (SD 0.63) 2.65 (SD 0.52)Virtual 3.08 (SD 0.83) 2.67 (SD 1.16)
Time Performance The time to accomplish the tasks was slightly higher for the tangible
conditions, in which participants took around 2 extra minutes compared to the virtual setup
in both trials, although the difference was not significant (for trial 1 F [1,14]= 2.48, p = .13, for
trial 2 F [1,14]= 1.08, p = .31).
By considering the time before the first cut for trial 1, the one-way test revealed that partici-
pants in the tangible condition performed the first cut earlier compared to the ones in virtual
condition. More precisely, the first cut was performed on average after 51 seconds (SD: 13 s)
47
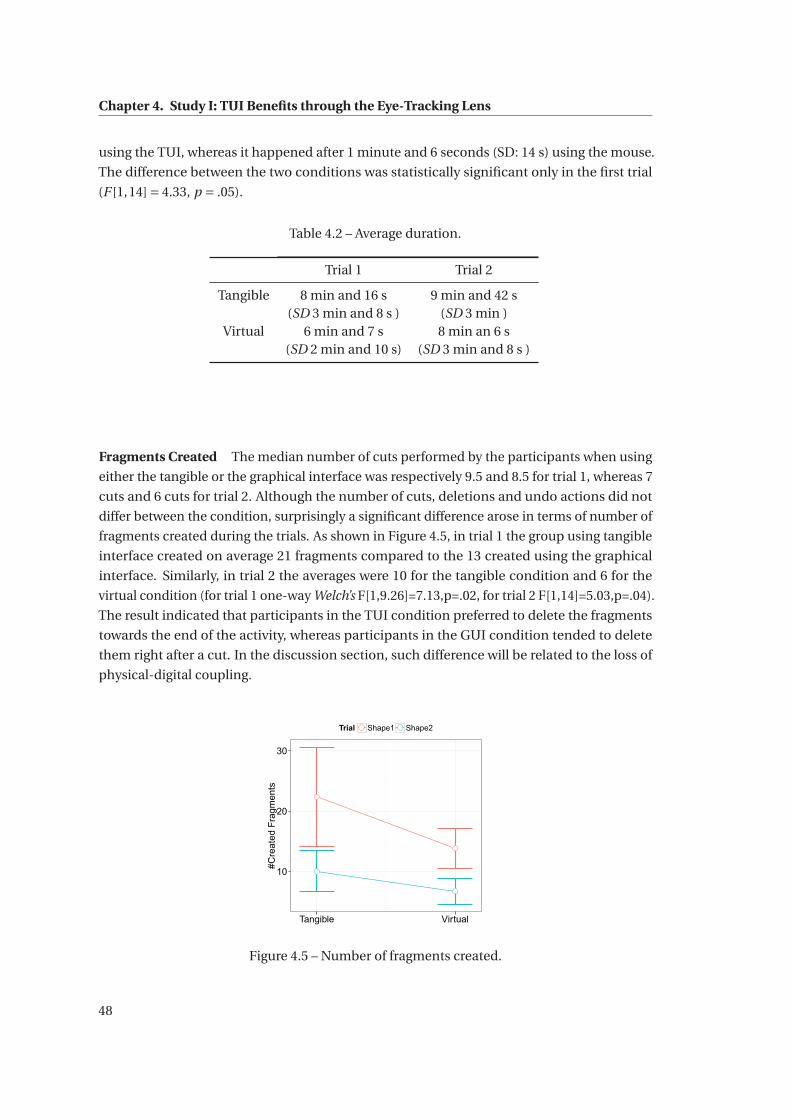
Chapter 4. Study I: TUI Benefits through the Eye-Tracking Lens
using the TUI, whereas it happened after 1 minute and 6 seconds (SD: 14 s) using the mouse.
The difference between the two conditions was statistically significant only in the first trial
(F [1,14]= 4.33, p = .05).
Table 4.2 – Average duration.
Trial 1 Trial 2
Tangible 8 min and 16 s 9 min and 42 s(SD 3 min and 8 s ) (SD 3 min )
Virtual 6 min and 7 s 8 min an 6 s(SD 2 min and 10 s) (SD 3 min and 8 s )
Fragments Created The median number of cuts performed by the participants when using
either the tangible or the graphical interface was respectively 9.5 and 8.5 for trial 1, whereas 7
cuts and 6 cuts for trial 2. Although the number of cuts, deletions and undo actions did not
differ between the condition, surprisingly a significant difference arose in terms of number of
fragments created during the trials. As shown in Figure 4.5, in trial 1 the group using tangible
interface created on average 21 fragments compared to the 13 created using the graphical
interface. Similarly, in trial 2 the averages were 10 for the tangible condition and 6 for the
virtual condition (for trial 1 one-way Welch’s F[1,9.26]=7.13,p=.02, for trial 2 F[1,14]=5.03,p=.04).
The result indicated that participants in the TUI condition preferred to delete the fragments
towards the end of the activity, whereas participants in the GUI condition tended to delete
them right after a cut. In the discussion section, such difference will be related to the loss of
physical-digital coupling.
10
20
30
Tangible Virtual
#Cre
ated
Fra
gmen
ts
Trial Shape1 Shape2
Figure 4.5 – Number of fragments created.
48
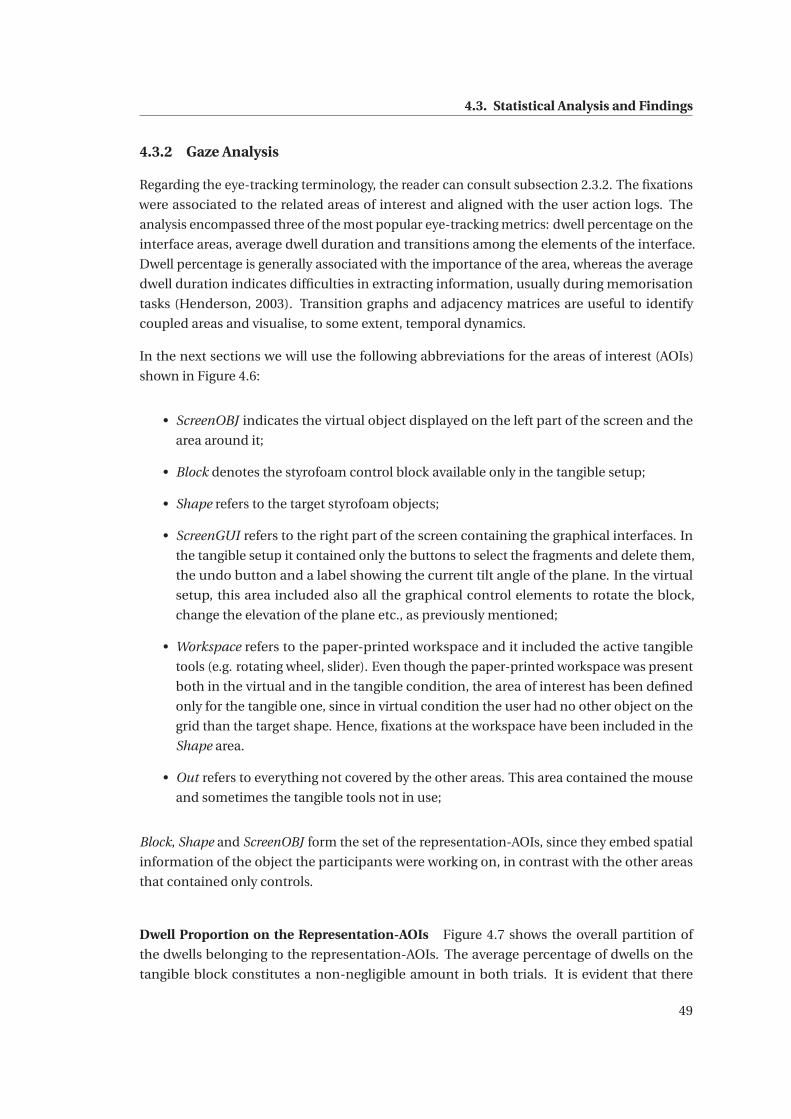
4.3. Statistical Analysis and Findings
4.3.2 Gaze Analysis
Regarding the eye-tracking terminology, the reader can consult subsection 2.3.2. The fixations
were associated to the related areas of interest and aligned with the user action logs. The
analysis encompassed three of the most popular eye-tracking metrics: dwell percentage on the
interface areas, average dwell duration and transitions among the elements of the interface.
Dwell percentage is generally associated with the importance of the area, whereas the average
dwell duration indicates difficulties in extracting information, usually during memorisation
tasks (Henderson, 2003). Transition graphs and adjacency matrices are useful to identify
coupled areas and visualise, to some extent, temporal dynamics.
In the next sections we will use the following abbreviations for the areas of interest (AOIs)
shown in Figure 4.6:
• ScreenOBJ indicates the virtual object displayed on the left part of the screen and the
area around it;
• Block denotes the styrofoam control block available only in the tangible setup;
• Shape refers to the target styrofoam objects;
• ScreenGUI refers to the right part of the screen containing the graphical interfaces. In
the tangible setup it contained only the buttons to select the fragments and delete them,
the undo button and a label showing the current tilt angle of the plane. In the virtual
setup, this area included also all the graphical control elements to rotate the block,
change the elevation of the plane etc., as previously mentioned;
• Workspace refers to the paper-printed workspace and it included the active tangible
tools (e.g. rotating wheel, slider). Even though the paper-printed workspace was present
both in the virtual and in the tangible condition, the area of interest has been defined
only for the tangible one, since in virtual condition the user had no other object on the
grid than the target shape. Hence, fixations at the workspace have been included in the
Shape area.
• Out refers to everything not covered by the other areas. This area contained the mouse
and sometimes the tangible tools not in use;
Block, Shape and ScreenOBJ form the set of the representation-AOIs, since they embed spatial
information of the object the participants were working on, in contrast with the other areas
that contained only controls.
Dwell Proportion on the Representation-AOIs Figure 4.7 shows the overall partition of
the dwells belonging to the representation-AOIs. The average percentage of dwells on the
tangible block constitutes a non-negligible amount in both trials. It is evident that there
49
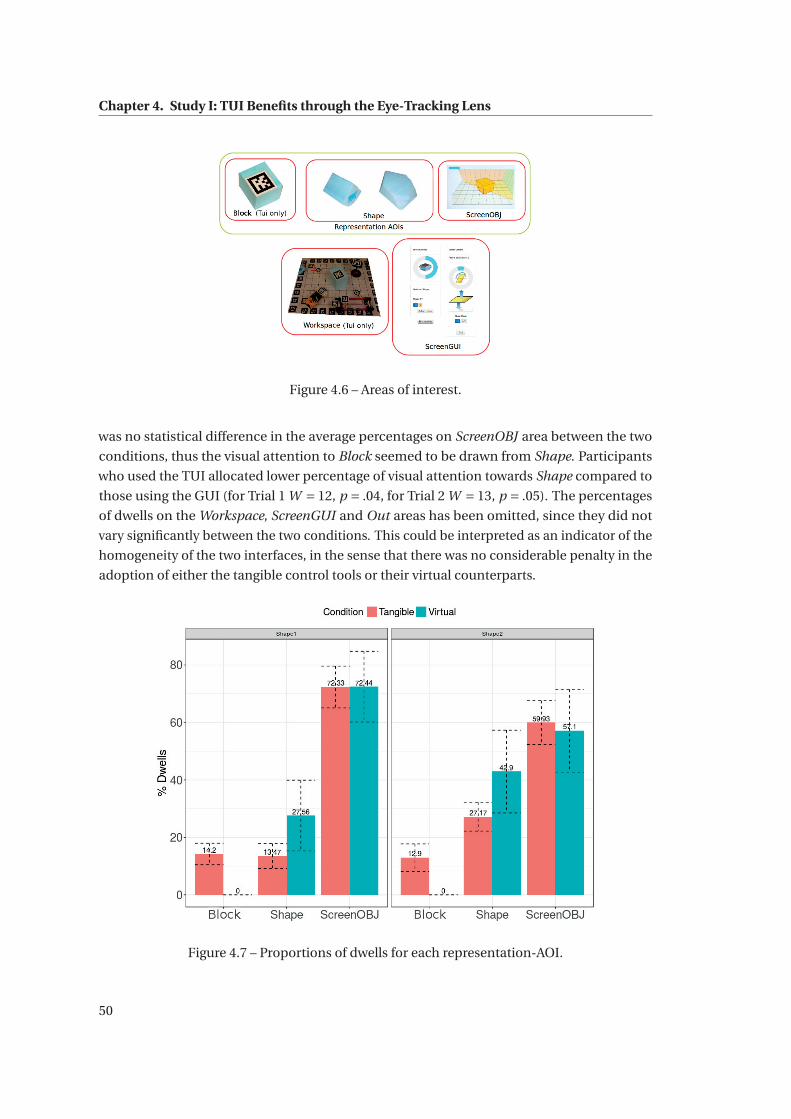
Chapter 4. Study I: TUI Benefits through the Eye-Tracking Lens
Figure 4.6 – Areas of interest.
was no statistical difference in the average percentages on ScreenOBJ area between the two
conditions, thus the visual attention to Block seemed to be drawn from Shape. Participants
who used the TUI allocated lower percentage of visual attention towards Shape compared to
those using the GUI (for Trial 1 W = 12, p = .04, for Trial 2 W = 13, p = .05). The percentages
of dwells on the Workspace, ScreenGUI and Out areas has been omitted, since they did not
vary significantly between the two conditions. This could be interpreted as an indicator of the
homogeneity of the two interfaces, in the sense that there was no considerable penalty in the
adoption of either the tangible control tools or their virtual counterparts.
Figure 4.7 – Proportions of dwells for each representation-AOI.
50
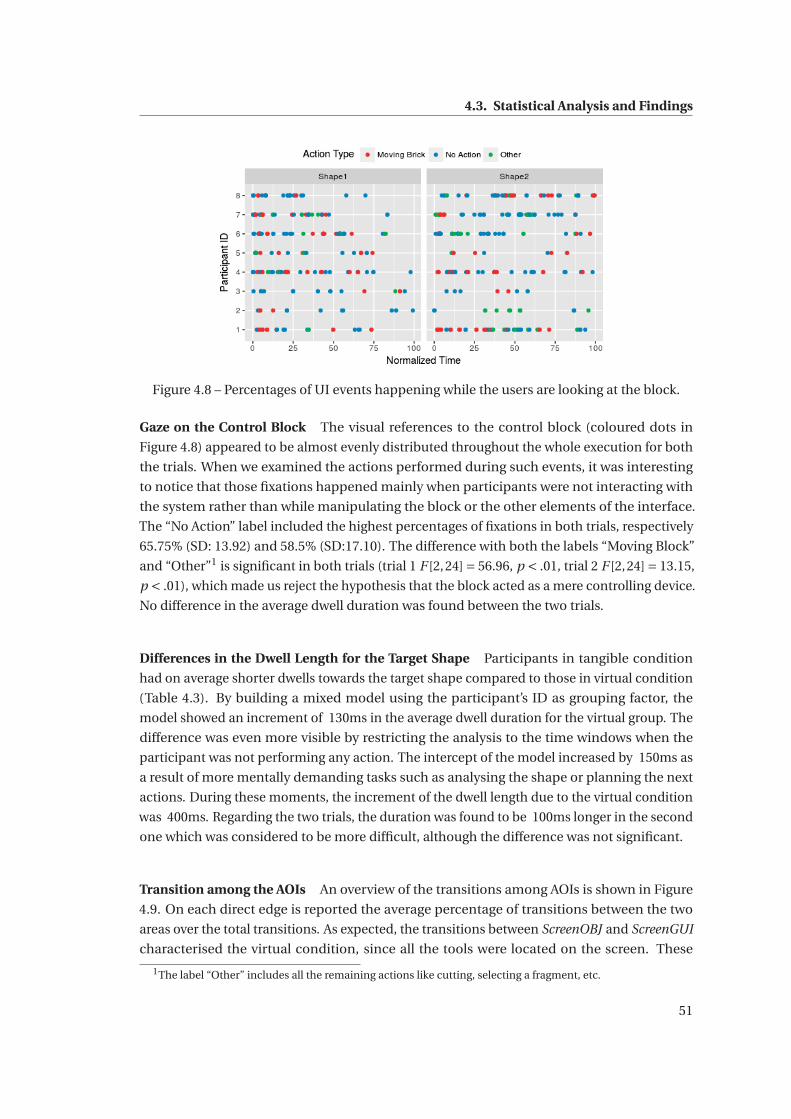
4.3. Statistical Analysis and Findings
Figure 4.8 – Percentages of UI events happening while the users are looking at the block.
Gaze on the Control Block The visual references to the control block (coloured dots in
Figure 4.8) appeared to be almost evenly distributed throughout the whole execution for both
the trials. When we examined the actions performed during such events, it was interesting
to notice that those fixations happened mainly when participants were not interacting with
the system rather than while manipulating the block or the other elements of the interface.
The “No Action” label included the highest percentages of fixations in both trials, respectively
65.75% (SD: 13.92) and 58.5% (SD:17.10). The difference with both the labels “Moving Block”
and “Other”1 is significant in both trials (trial 1 F [2,24]= 56.96, p < .01, trial 2 F [2,24]= 13.15,
p < .01), which made us reject the hypothesis that the block acted as a mere controlling device.
No difference in the average dwell duration was found between the two trials.
Differences in the Dwell Length for the Target Shape Participants in tangible condition
had on average shorter dwells towards the target shape compared to those in virtual condition
(Table 4.3). By building a mixed model using the participant’s ID as grouping factor, the
model showed an increment of 130ms in the average dwell duration for the virtual group. The
difference was even more visible by restricting the analysis to the time windows when the
participant was not performing any action. The intercept of the model increased by 150ms as
a result of more mentally demanding tasks such as analysing the shape or planning the next
actions. During these moments, the increment of the dwell length due to the virtual condition
was 400ms. Regarding the two trials, the duration was found to be 100ms longer in the second
one which was considered to be more difficult, although the difference was not significant.
Transition among the AOIs An overview of the transitions among AOIs is shown in Figure
4.9. On each direct edge is reported the average percentage of transitions between the two
areas over the total transitions. As expected, the transitions between ScreenOBJ and ScreenGUI
characterised the virtual condition, since all the tools were located on the screen. These
1The label “Other” includes all the remaining actions like cutting, selecting a fragment, etc.
51
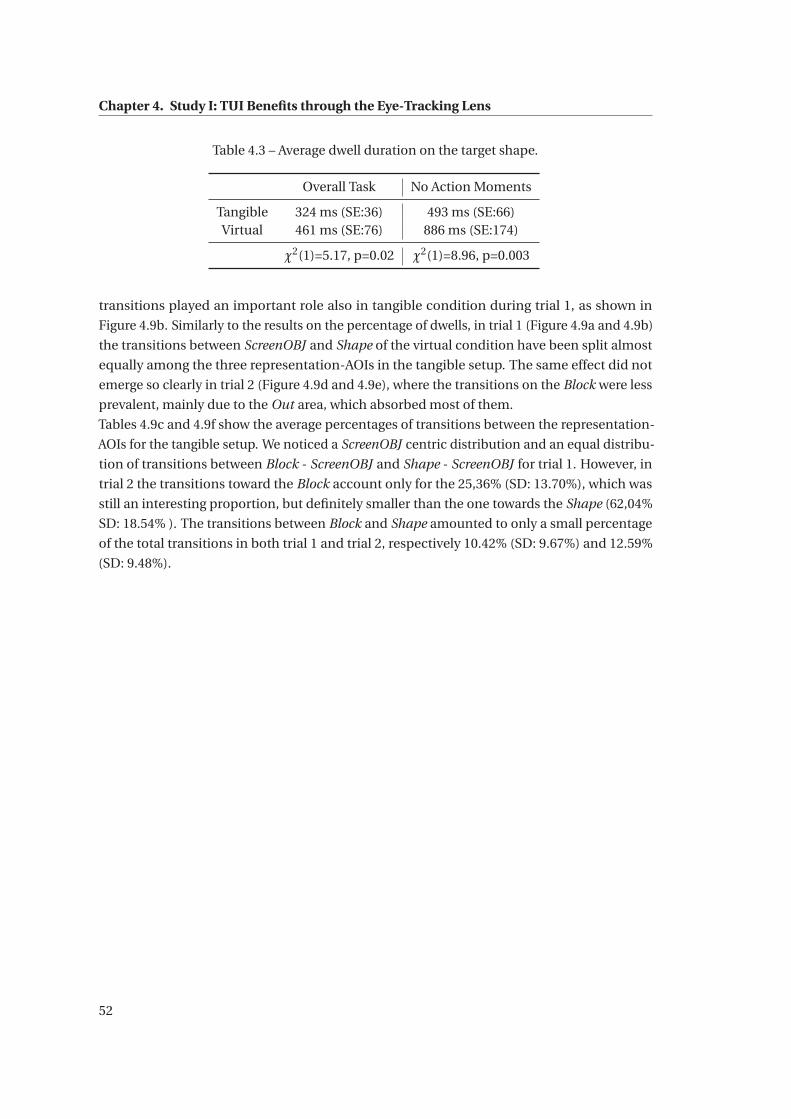
Chapter 4. Study I: TUI Benefits through the Eye-Tracking Lens
Table 4.3 – Average dwell duration on the target shape.
Overall Task No Action Moments
Tangible 324 ms (SE:36) 493 ms (SE:66)Virtual 461 ms (SE:76) 886 ms (SE:174)
χ2(1)=5.17, p=0.02 χ2(1)=8.96, p=0.003
transitions played an important role also in tangible condition during trial 1, as shown in
Figure 4.9b. Similarly to the results on the percentage of dwells, in trial 1 (Figure 4.9a and 4.9b)
the transitions between ScreenOBJ and Shape of the virtual condition have been split almost
equally among the three representation-AOIs in the tangible setup. The same effect did not
emerge so clearly in trial 2 (Figure 4.9d and 4.9e), where the transitions on the Block were less
prevalent, mainly due to the Out area, which absorbed most of them.
Tables 4.9c and 4.9f show the average percentages of transitions between the representation-
AOIs for the tangible setup. We noticed a ScreenOBJ centric distribution and an equal distribu-
tion of transitions between Block - ScreenOBJ and Shape - ScreenOBJ for trial 1. However, in
trial 2 the transitions toward the Block account only for the 25,36% (SD: 13.70%), which was
still an interesting proportion, but definitely smaller than the one towards the Shape (62,04%
SD: 18.54% ). The transitions between Block and Shape amounted to only a small percentage
of the total transitions in both trial 1 and trial 2, respectively 10.42% (SD: 9.67%) and 12.59%
(SD: 9.48%).
52
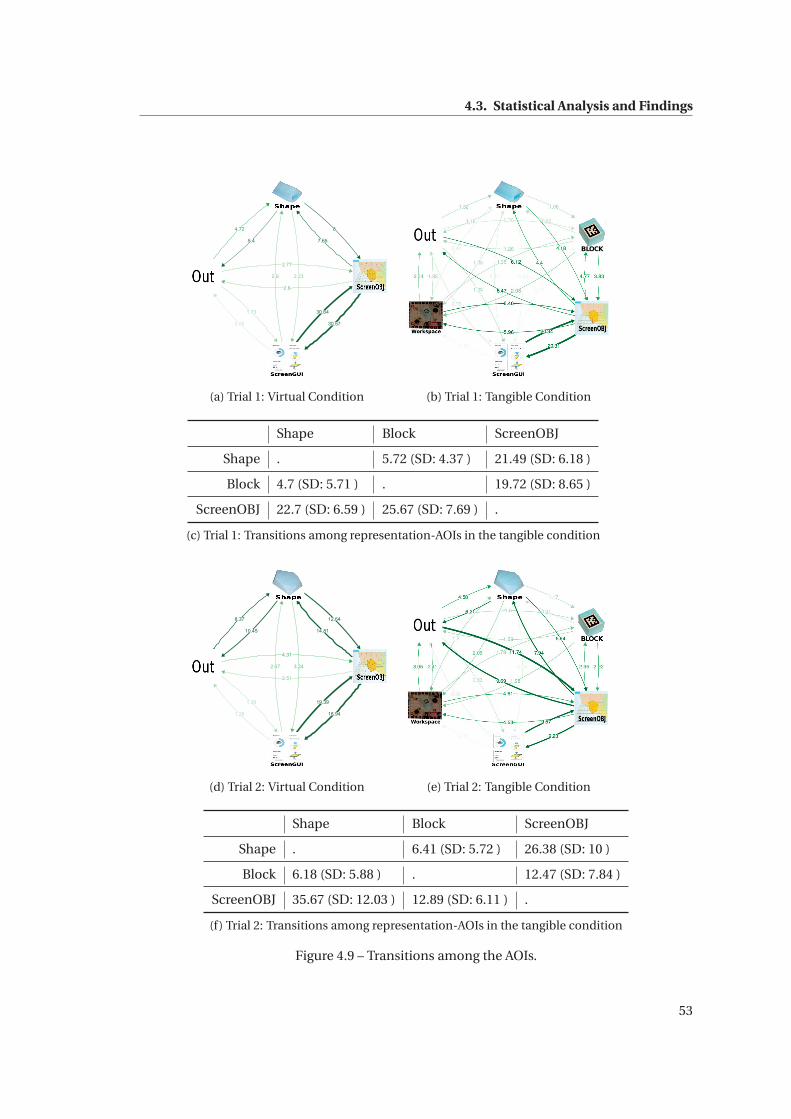
4.3. Statistical Analysis and Findings
0.88
1.73
2.232.6
2.77
2.8
4.72
5.4 7.65
8
30.57
30.64
(a) Trial 1: Virtual Condition
BLOCK
(b) Trial 1: Tangible Condition
Shape Block ScreenOBJ
Shape . 5.72 (SD: 4.37 ) 21.49 (SD: 6.18 )
Block 4.7 (SD: 5.71 ) . 19.72 (SD: 8.65 )
ScreenOBJ 22.7 (SD: 6.59 ) 25.67 (SD: 7.69 ) .
(c) Trial 1: Transitions among representation-AOIs in the tangible condition
1.26
1.39
2.51
2.67 3.24
4.31
8.37
10.45
12.64
14.81
18.94
19.39
(d) Trial 2: Virtual Condition (e) Trial 2: Tangible Condition
Shape Block ScreenOBJ
Shape . 6.41 (SD: 5.72 ) 26.38 (SD: 10 )
Block 6.18 (SD: 5.88 ) . 12.47 (SD: 7.84 )
ScreenOBJ 35.67 (SD: 12.03 ) 12.89 (SD: 6.11 ) .
(f) Trial 2: Transitions among representation-AOIs in the tangible condition
Figure 4.9 – Transitions among the AOIs.
53
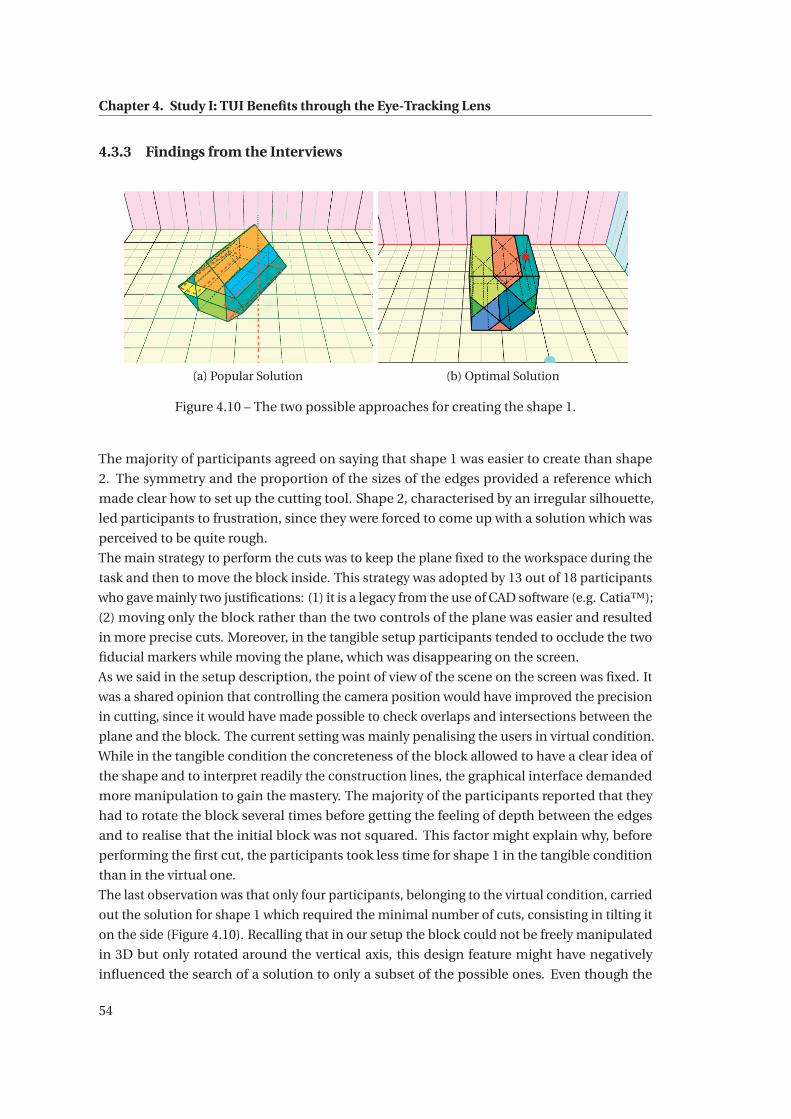
Chapter 4. Study I: TUI Benefits through the Eye-Tracking Lens
4.3.3 Findings from the Interviews
(a) Popular Solution (b) Optimal Solution
Figure 4.10 – The two possible approaches for creating the shape 1.
The majority of participants agreed on saying that shape 1 was easier to create than shape
2. The symmetry and the proportion of the sizes of the edges provided a reference which
made clear how to set up the cutting tool. Shape 2, characterised by an irregular silhouette,
led participants to frustration, since they were forced to come up with a solution which was
perceived to be quite rough.
The main strategy to perform the cuts was to keep the plane fixed to the workspace during the
task and then to move the block inside. This strategy was adopted by 13 out of 18 participants
who gave mainly two justifications: (1) it is a legacy from the use of CAD software (e.g. Catia™);
(2) moving only the block rather than the two controls of the plane was easier and resulted
in more precise cuts. Moreover, in the tangible setup participants tended to occlude the two
fiducial markers while moving the plane, which was disappearing on the screen.
As we said in the setup description, the point of view of the scene on the screen was fixed. It
was a shared opinion that controlling the camera position would have improved the precision
in cutting, since it would have made possible to check overlaps and intersections between the
plane and the block. The current setting was mainly penalising the users in virtual condition.
While in the tangible condition the concreteness of the block allowed to have a clear idea of
the shape and to interpret readily the construction lines, the graphical interface demanded
more manipulation to gain the mastery. The majority of the participants reported that they
had to rotate the block several times before getting the feeling of depth between the edges
and to realise that the initial block was not squared. This factor might explain why, before
performing the first cut, the participants took less time for shape 1 in the tangible condition
than in the virtual one.
The last observation was that only four participants, belonging to the virtual condition, carried
out the solution for shape 1 which required the minimal number of cuts, consisting in tilting it
on the side (Figure 4.10). Recalling that in our setup the block could not be freely manipulated
in 3D but only rotated around the vertical axis, this design feature might have negatively
influenced the search of a solution to only a subset of the possible ones. Even though the
54
4.4. Discussion
number is too small to get any conclusion, the effect might have been larger in the tangible
condition in which the presence of the tangible block could have limited the identification of
alternative representations and, consequently, the deeper exploitation of the mental rotation
ability.
4.4 Discussion
QSC When comparing TUI and GUI which differences emerge at gaze level? How are they
related to the supposed role played by TUIs in helping spatial cognition?
The lower percentage of dwells on the Shape area in the tangible condition compared to the
virtual one was related to a partial shift of the visual attention towards the physical block. The
role of the block went beyond that of physical control. Participants were referring to it mainly
during the intervals when no action was performed, which were likely to be moments while
they were reasoning about the task or evaluating the current status. Neither the percentage
of dwells on the block nor their average duration were affected by the trial, thus we could
assume that looking at the block did not depend on the difficulty of the task, but it rather
responded to the users’ periodic needs for perceptual cues. The needs were coming mostly
from the ambiguity of the digital scene. From the transition graphs it could be noticed that
the transitions between Block and Shape in TUI were quite rare, whereas the centrality of the
ScreenOBJ emerged. The perceptual benefit associated to the block would arise from the direct
alignment between the physical and digital realms, which provided a bridge between these
two spaces. What the users perceived in the physical world was also mapped in the digital one.
Thus, the TUI eased the extraction of spatial information perceived through both eyes and
hands (Marshall, 2007). In the pure GUI condition, spatial properties were provided through
artefacts (e.g. depth was obtained using dashed lines), which required the additional cognitive
step of decoding the order of surfaces and lines from their rendered properties.
We would have expected more Block-Shape transitions in the first trial, since the target shape
could be inscribed in the block, whereas in the second trial there was no benefit in directly
comparing the two objects due to the target shape being larger than the block. However,
no difference emerged. This suggested that the two areas, Block and Shape, appeared to be
perceived as diametrically opposed stages of the task, respectively the initial state and the
final one. Also the transitions between them were mostly passing through the current task
state, which was given by the ScreenOBJ area.
Another variation between the two experimental conditions was found in the average dwell
duration for the Shape area. Recalling the interpretation of this metrics from the eye-tracking
literature, the shorter dwells in the tangible condition revealed less difficulty in “processing”
the target shape. Processing the target shape could be decomposed in two steps: understand-
ing the shape and defining an execution plan to create its features in the digital model. In
our opinion, there was no evidence that participants who used the TUI were facilitated in
understanding the target shape compared to those using the graphical interface, since the
55
Chapter 4. Study I: TUI Benefits through the Eye-Tracking Lens
pretest scores were similar and the populations were equivalent in terms of demographic
data. Hence, the benefits of the tangible setup could be found in an easier translation of
the users’ execution plan into interface actions. The appearance of both the block and the
other tangible tools provided affordances that made the recognition of related functions more
immediate ( Hornecker and Buur (2006)’s Isomorph effects ) which would provide another
explanation for the shorter time before the first cut in tangible condition. Similarly, the fact
that the block represented a bounding box of its digital counterpart, allowed the participants
to mimic the effect of cutting with their hands, for example masking part of it to have a better
feeling of the final outcome. This "specificity" is absent in the graphical user interface, which is
a composition of instances of general purpose elements, such as buttons or sliders. In addition,
the mapping tool-function may have been facilitated by the unconstrained collocation of the
tangibles in the workspace, which allowed participants to create their own “layout” for the
tools, for example placing the cutter on the right or the wheel in the top left corners.
QToken When the physical-virtual correspondence changes during the task, does a tangible
interface become just a control “token”?
In spite of the fact that the literal correspondence became partial after each cut, the eye-gaze
data showed the distribution of dwells toward the block throughout the whole experiment.
This indicated that participants kept on looking at the control block and, consequently, the
hypothesis that the tangible block becomes a "token" was not confirmed. Surprisingly, we
observed that TUI participants actively acted in order to preserve the reference between
the physical block and its virtual representation on the screen. The significantly higher
average number of fragments created when using TUIs suggested an adaptation of the users
to overcome the limitation of the interface. In fact, given that the average number of cuts
did not differ in both conditions, the difference resulted from the TUI participants’ tendency
to keep most of the fragments till the end and to delete the unnecessary ones afterwards.
Differently from the operational mode exhibited by GUI participants, this strategy clearly
prevented the loss of digital-physical coupling. What were the properties that the participants
were preserving? For instance, how did it matter in our implementation? The one-to-one
mapping between the dimensions of the control block and its digital counterparts? The answer
to these questions would require a more exhaustive study in which the independent variable
could be related to geometrical properties or to the spatial relationship of the tangibles.
However, this study pointed out that the extent to which a physical entity is in a state of
literal correspondence with its digital representation could be defined by the mapping of the
properties as well as by the temporal evolution of this same mapping. Furthermore, we saw
that relaxing the correspondence over time had an impact on users’ behaviour which could be
or not be desirable according to the application domain.
This study was not exempt from limitations. Although the experimental task was designed
for vocational apprentices, we could not conduct the study in an authentic setup but in a
laboratory setting, recruiting undergraduate students. Participants were representative of a
56
4.5. Conclusions
population having high spatial abilities and acquainted with both the use of CAD applications
and 3D computer graphics. On one hand this factor limited the novelty effect due to the
use of a new technology. However, to some extent, the highly skilled population might have
prevented us from finding some additional effects and more solid conclusions about how
tangibles scaffold spatial thinking.
4.5 Conclusions
To sum up, this chapter compared the effects of TUIs and GUIs on spatial reasoning from the
eye-tracking perspective. Some of the typical cognitive advantages of tangibles that are usually
reported in the TUI literature found support from the quantitative data of the participants’
gaze behaviours. The difference in the gaze properties on some areas of interest provided us
with clear indications on where and when the facilitation happened.
The successful application of the eye-tracking methodology encouraged its adoption as re-
search tool to study the cognitive effects of tangibles or, more broadly, of physical entities
when they are digitally represented in any mixed-reality system. This study provided us the
premise to collect gaze data in the following two studies too.
57

5 Study II: Gaining an Intuition of Stat-ics from Physical Manipulation
5.1 Introduction
At the time our interest was drawn by bringing statics in the vocational classrooms, the meet-
ings we had with the carpentry teachers helped us in outlining the type of features an AR
system should have for such a purpose. It seemed natural to begin with the analysis of truss
structures, since these are one of the most common structures present in carpentry practice.
As described in the chapter 3, a truss is a structure composed by straight elements joined
together at their extremities. Analysing a truss consists in identifying the axial forces acting
in the members for a given loading condition: if the force tends to shorten the member it
is a compressive force. A force that tends to elongate the member is called a tensile force.
Additionally, there could be some members which support no load, the so-called zero-force
members. These are often used to increase the stability of the truss.
Employing physical models and augmented reality through tablets and smart-phones looked
promising to us and to the teachers. The implementation of hands-on activities to explore
statics and structural behavior is generally considered to be a fruitful practice. It is widely
adopted by instructors since it allows them to create explicit connections between the subjects
being taught and the applications in real-life scenarios.
The types of physical materials adopted in statics courses could be roughly categorized on a
spectrum that goes from rigid to interactive models. Rigid models are small-scale representa-
tions of structures made of softwood, aluminium or other materials and typically used to test
the effects of external loads, such as deformation or bending (Yazici and Seçkin, 2014; Solís
et al., 2012; Romero and Museros, 2002b). Given the rigidity of the materials, usually those
effects are quite imperceptible unless the limits of the materials’ strength are exceeded which
might damage the model. Interactive models try to overcome these limitations by embedding
components into the models in order to magnify the phenomena. For instance, in case of
truss analysis, the representation of axial forces could be done qualitatively by integrating
springs in the truss beams, as in the solutions proposed by (Bigoni et al., 2012; Oliveira, 2008);
alternatively, electronic sensors could be used to measure the forces (Dodge et al., 2011). Com-
pared to rigid models, the interactive ones offer a higher degree of manipulation, thus they are
59
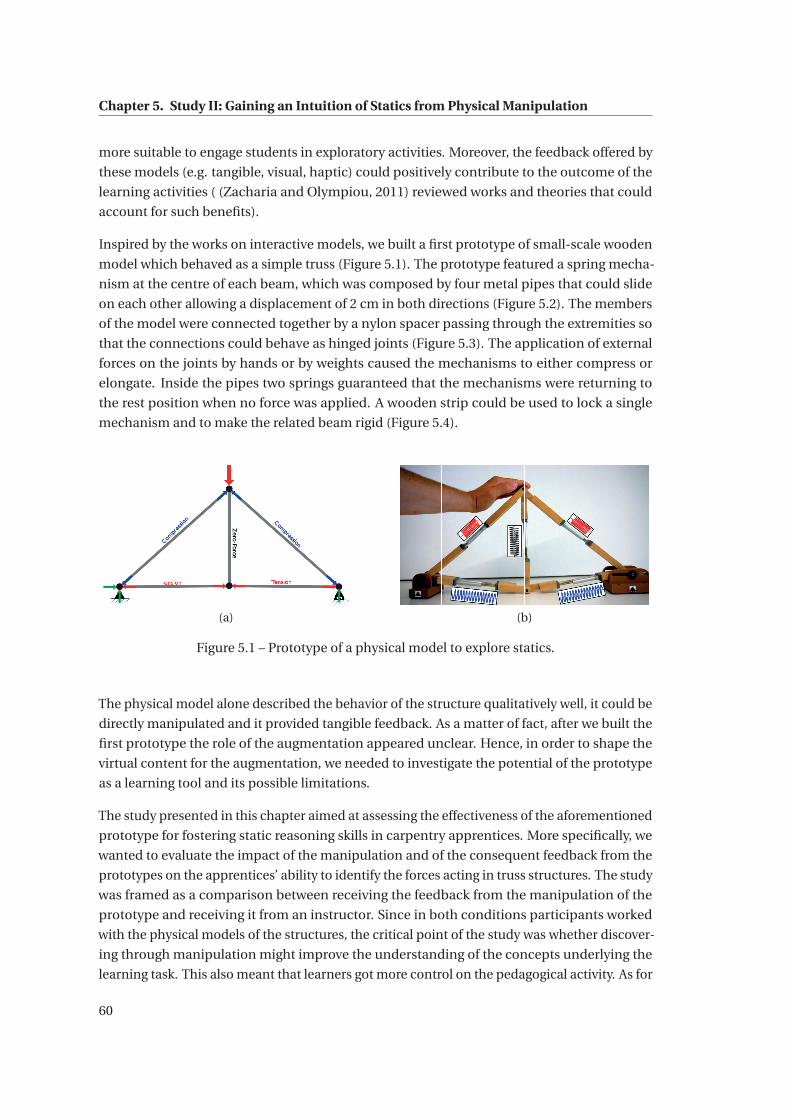
Chapter 5. Study II: Gaining an Intuition of Statics from Physical Manipulation
more suitable to engage students in exploratory activities. Moreover, the feedback offered by
these models (e.g. tangible, visual, haptic) could positively contribute to the outcome of the
learning activities ( (Zacharia and Olympiou, 2011) reviewed works and theories that could
account for such benefits).
Inspired by the works on interactive models, we built a first prototype of small-scale wooden
model which behaved as a simple truss (Figure 5.1). The prototype featured a spring mecha-
nism at the centre of each beam, which was composed by four metal pipes that could slide
on each other allowing a displacement of 2 cm in both directions (Figure 5.2). The members
of the model were connected together by a nylon spacer passing through the extremities so
that the connections could behave as hinged joints (Figure 5.3). The application of external
forces on the joints by hands or by weights caused the mechanisms to either compress or
elongate. Inside the pipes two springs guaranteed that the mechanisms were returning to
the rest position when no force was applied. A wooden strip could be used to lock a single
mechanism and to make the related beam rigid (Figure 5.4).
(a) (b)
Figure 5.1 – Prototype of a physical model to explore statics.
The physical model alone described the behavior of the structure qualitatively well, it could be
directly manipulated and it provided tangible feedback. As a matter of fact, after we built the
first prototype the role of the augmentation appeared unclear. Hence, in order to shape the
virtual content for the augmentation, we needed to investigate the potential of the prototype
as a learning tool and its possible limitations.
The study presented in this chapter aimed at assessing the effectiveness of the aforementioned
prototype for fostering static reasoning skills in carpentry apprentices. More specifically, we
wanted to evaluate the impact of the manipulation and of the consequent feedback from the
prototypes on the apprentices’ ability to identify the forces acting in truss structures. The study
was framed as a comparison between receiving the feedback from the manipulation of the
prototype and receiving it from an instructor. Since in both conditions participants worked
with the physical models of the structures, the critical point of the study was whether discover-
ing through manipulation might improve the understanding of the concepts underlying the
learning task. This also meant that learners got more control on the pedagogical activity. As for
60
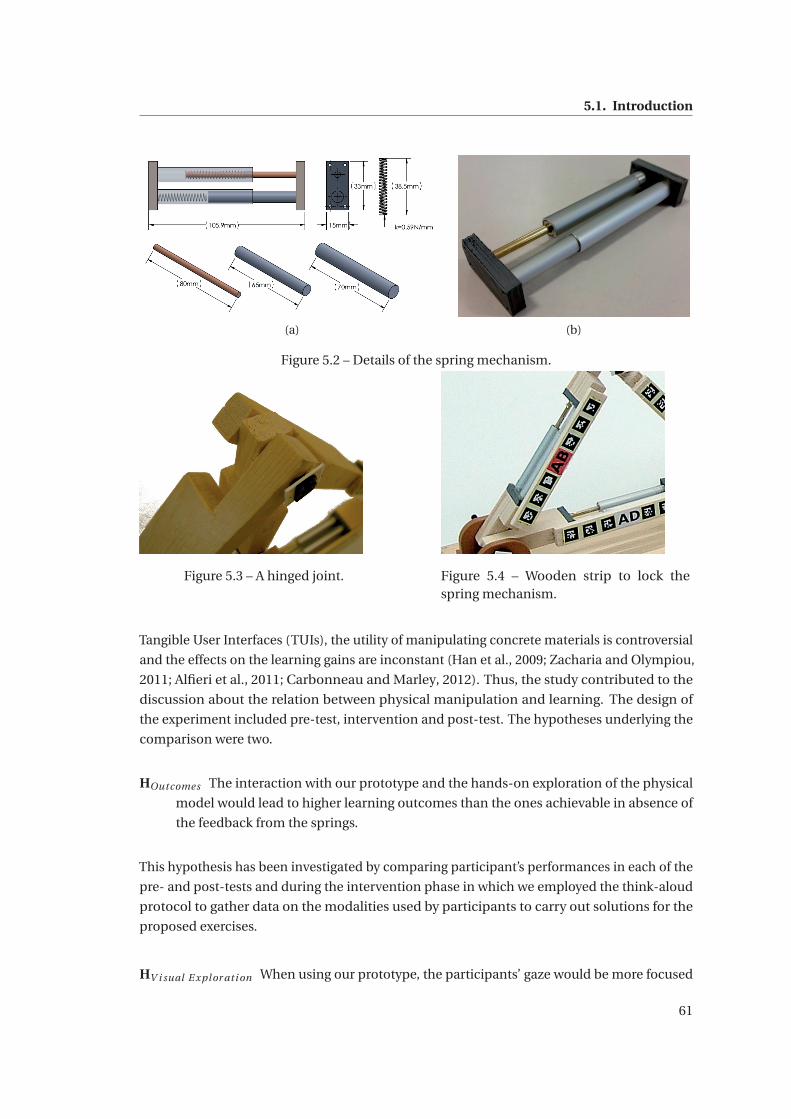
5.1. Introduction
(a) (b)
Figure 5.2 – Details of the spring mechanism.
Figure 5.3 – A hinged joint. Figure 5.4 – Wooden strip to lock thespring mechanism.
Tangible User Interfaces (TUIs), the utility of manipulating concrete materials is controversial
and the effects on the learning gains are inconstant (Han et al., 2009; Zacharia and Olympiou,
2011; Alfieri et al., 2011; Carbonneau and Marley, 2012). Thus, the study contributed to the
discussion about the relation between physical manipulation and learning. The design of
the experiment included pre-test, intervention and post-test. The hypotheses underlying the
comparison were two.
HOutcomes The interaction with our prototype and the hands-on exploration of the physical
model would lead to higher learning outcomes than the ones achievable in absence of
the feedback from the springs.
This hypothesis has been investigated by comparing participant’s performances in each of the
pre- and post-tests and during the intervention phase in which we employed the think-aloud
protocol to gather data on the modalities used by participants to carry out solutions for the
proposed exercises.
HV i sual E xpl or ati on When using our prototype, the participants’ gaze would be more focused
61
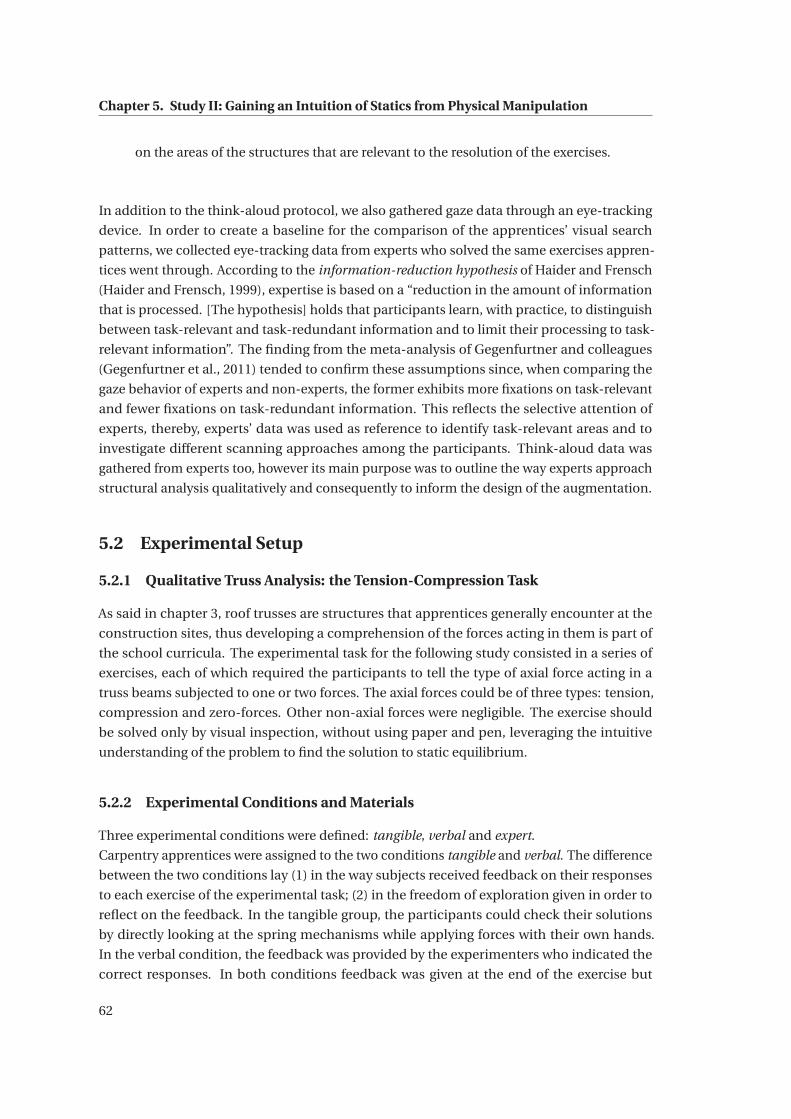
Chapter 5. Study II: Gaining an Intuition of Statics from Physical Manipulation
on the areas of the structures that are relevant to the resolution of the exercises.
In addition to the think-aloud protocol, we also gathered gaze data through an eye-tracking
device. In order to create a baseline for the comparison of the apprentices’ visual search
patterns, we collected eye-tracking data from experts who solved the same exercises appren-
tices went through. According to the information-reduction hypothesis of Haider and Frensch
(Haider and Frensch, 1999), expertise is based on a “reduction in the amount of information
that is processed. [The hypothesis] holds that participants learn, with practice, to distinguish
between task-relevant and task-redundant information and to limit their processing to task-
relevant information”. The finding from the meta-analysis of Gegenfurtner and colleagues
(Gegenfurtner et al., 2011) tended to confirm these assumptions since, when comparing the
gaze behavior of experts and non-experts, the former exhibits more fixations on task-relevant
and fewer fixations on task-redundant information. This reflects the selective attention of
experts, thereby, experts’ data was used as reference to identify task-relevant areas and to
investigate different scanning approaches among the participants. Think-aloud data was
gathered from experts too, however its main purpose was to outline the way experts approach
structural analysis qualitatively and consequently to inform the design of the augmentation.
5.2 Experimental Setup
5.2.1 Qualitative Truss Analysis: the Tension-Compression Task
As said in chapter 3, roof trusses are structures that apprentices generally encounter at the
construction sites, thus developing a comprehension of the forces acting in them is part of
the school curricula. The experimental task for the following study consisted in a series of
exercises, each of which required the participants to tell the type of axial force acting in a
truss beams subjected to one or two forces. The axial forces could be of three types: tension,
compression and zero-forces. Other non-axial forces were negligible. The exercise should
be solved only by visual inspection, without using paper and pen, leveraging the intuitive
understanding of the problem to find the solution to static equilibrium.
5.2.2 Experimental Conditions and Materials
Three experimental conditions were defined: tangible, verbal and expert.
Carpentry apprentices were assigned to the two conditions tangible and verbal. The difference
between the two conditions lay (1) in the way subjects received feedback on their responses
to each exercise of the experimental task; (2) in the freedom of exploration given in order to
reflect on the feedback. In the tangible group, the participants could check their solutions
by directly looking at the spring mechanisms while applying forces with their own hands.
In the verbal condition, the feedback was provided by the experimenters who indicated the
correct responses. In both conditions feedback was given at the end of the exercise but
62
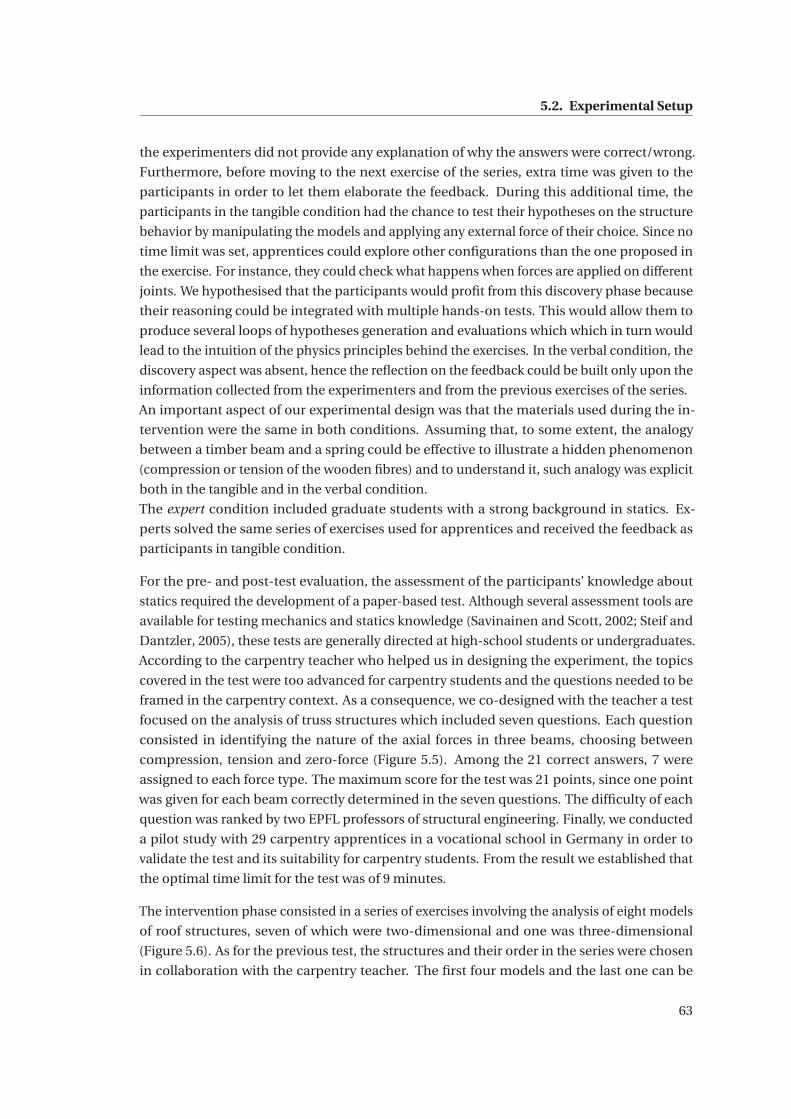
5.2. Experimental Setup
the experimenters did not provide any explanation of why the answers were correct/wrong.
Furthermore, before moving to the next exercise of the series, extra time was given to the
participants in order to let them elaborate the feedback. During this additional time, the
participants in the tangible condition had the chance to test their hypotheses on the structure
behavior by manipulating the models and applying any external force of their choice. Since no
time limit was set, apprentices could explore other configurations than the one proposed in
the exercise. For instance, they could check what happens when forces are applied on different
joints. We hypothesised that the participants would profit from this discovery phase because
their reasoning could be integrated with multiple hands-on tests. This would allow them to
produce several loops of hypotheses generation and evaluations which which in turn would
lead to the intuition of the physics principles behind the exercises. In the verbal condition, the
discovery aspect was absent, hence the reflection on the feedback could be built only upon the
information collected from the experimenters and from the previous exercises of the series.
An important aspect of our experimental design was that the materials used during the in-
tervention were the same in both conditions. Assuming that, to some extent, the analogy
between a timber beam and a spring could be effective to illustrate a hidden phenomenon
(compression or tension of the wooden fibres) and to understand it, such analogy was explicit
both in the tangible and in the verbal condition.
The expert condition included graduate students with a strong background in statics. Ex-
perts solved the same series of exercises used for apprentices and received the feedback as
participants in tangible condition.
For the pre- and post-test evaluation, the assessment of the participants’ knowledge about
statics required the development of a paper-based test. Although several assessment tools are
available for testing mechanics and statics knowledge (Savinainen and Scott, 2002; Steif and
Dantzler, 2005), these tests are generally directed at high-school students or undergraduates.
According to the carpentry teacher who helped us in designing the experiment, the topics
covered in the test were too advanced for carpentry students and the questions needed to be
framed in the carpentry context. As a consequence, we co-designed with the teacher a test
focused on the analysis of truss structures which included seven questions. Each question
consisted in identifying the nature of the axial forces in three beams, choosing between
compression, tension and zero-force (Figure 5.5). Among the 21 correct answers, 7 were
assigned to each force type. The maximum score for the test was 21 points, since one point
was given for each beam correctly determined in the seven questions. The difficulty of each
question was ranked by two EPFL professors of structural engineering. Finally, we conducted
a pilot study with 29 carpentry apprentices in a vocational school in Germany in order to
validate the test and its suitability for carpentry students. From the result we established that
the optimal time limit for the test was of 9 minutes.
The intervention phase consisted in a series of exercises involving the analysis of eight models
of roof structures, seven of which were two-dimensional and one was three-dimensional
(Figure 5.6). As for the previous test, the structures and their order in the series were chosen
in collaboration with the carpentry teacher. The first four models and the last one can be
63
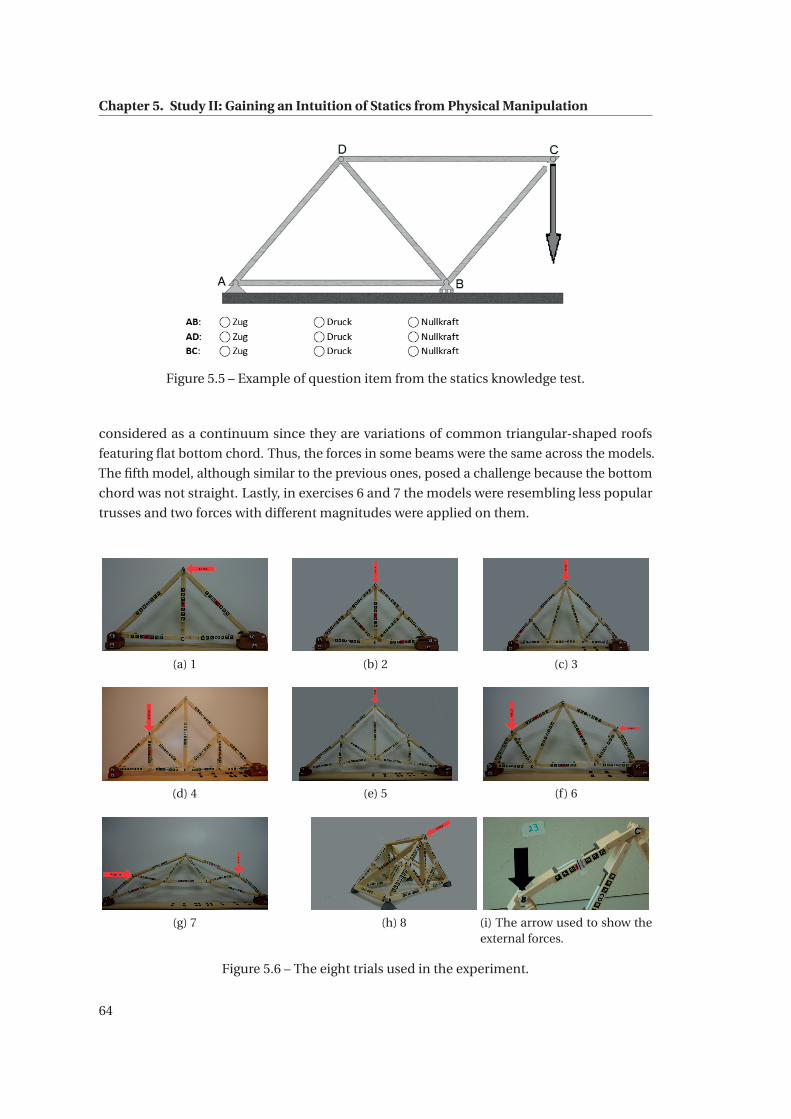
Chapter 5. Study II: Gaining an Intuition of Statics from Physical Manipulation
Figure 5.5 – Example of question item from the statics knowledge test.
considered as a continuum since they are variations of common triangular-shaped roofs
featuring flat bottom chord. Thus, the forces in some beams were the same across the models.
The fifth model, although similar to the previous ones, posed a challenge because the bottom
chord was not straight. Lastly, in exercises 6 and 7 the models were resembling less popular
trusses and two forces with different magnitudes were applied on them.
(a) 1 (b) 2 (c) 3
(d) 4 (e) 5 (f) 6
(g) 7 (h) 8 (i) The arrow used to show theexternal forces.
Figure 5.6 – The eight trials used in the experiment.
64
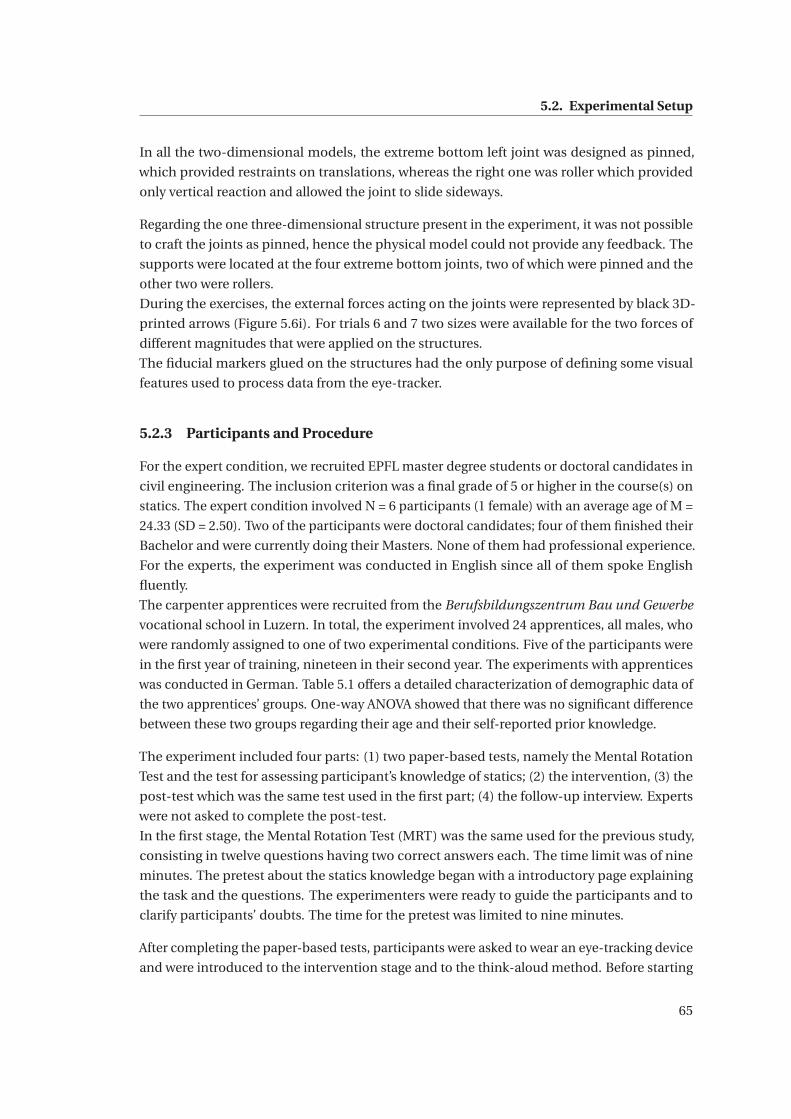
5.2. Experimental Setup
In all the two-dimensional models, the extreme bottom left joint was designed as pinned,
which provided restraints on translations, whereas the right one was roller which provided
only vertical reaction and allowed the joint to slide sideways.
Regarding the one three-dimensional structure present in the experiment, it was not possible
to craft the joints as pinned, hence the physical model could not provide any feedback. The
supports were located at the four extreme bottom joints, two of which were pinned and the
other two were rollers.
During the exercises, the external forces acting on the joints were represented by black 3D-
printed arrows (Figure 5.6i). For trials 6 and 7 two sizes were available for the two forces of
different magnitudes that were applied on the structures.
The fiducial markers glued on the structures had the only purpose of defining some visual
features used to process data from the eye-tracker.
5.2.3 Participants and Procedure
For the expert condition, we recruited EPFL master degree students or doctoral candidates in
civil engineering. The inclusion criterion was a final grade of 5 or higher in the course(s) on
statics. The expert condition involved N = 6 participants (1 female) with an average age of M =
24.33 (SD = 2.50). Two of the participants were doctoral candidates; four of them finished their
Bachelor and were currently doing their Masters. None of them had professional experience.
For the experts, the experiment was conducted in English since all of them spoke English
fluently.
The carpenter apprentices were recruited from the Berufsbildungszentrum Bau und Gewerbe
vocational school in Luzern. In total, the experiment involved 24 apprentices, all males, who
were randomly assigned to one of two experimental conditions. Five of the participants were
in the first year of training, nineteen in their second year. The experiments with apprentices
was conducted in German. Table 5.1 offers a detailed characterization of demographic data of
the two apprentices’ groups. One-way ANOVA showed that there was no significant difference
between these two groups regarding their age and their self-reported prior knowledge.
The experiment included four parts: (1) two paper-based tests, namely the Mental Rotation
Test and the test for assessing participant’s knowledge of statics; (2) the intervention, (3) the
post-test which was the same test used in the first part; (4) the follow-up interview. Experts
were not asked to complete the post-test.
In the first stage, the Mental Rotation Test (MRT) was the same used for the previous study,
consisting in twelve questions having two correct answers each. The time limit was of nine
minutes. The pretest about the statics knowledge began with a introductory page explaining
the task and the questions. The experimenters were ready to guide the participants and to
clarify participants’ doubts. The time for the pretest was limited to nine minutes.
After completing the paper-based tests, participants were asked to wear an eye-tracking device
and were introduced to the intervention stage and to the think-aloud method. Before starting
65
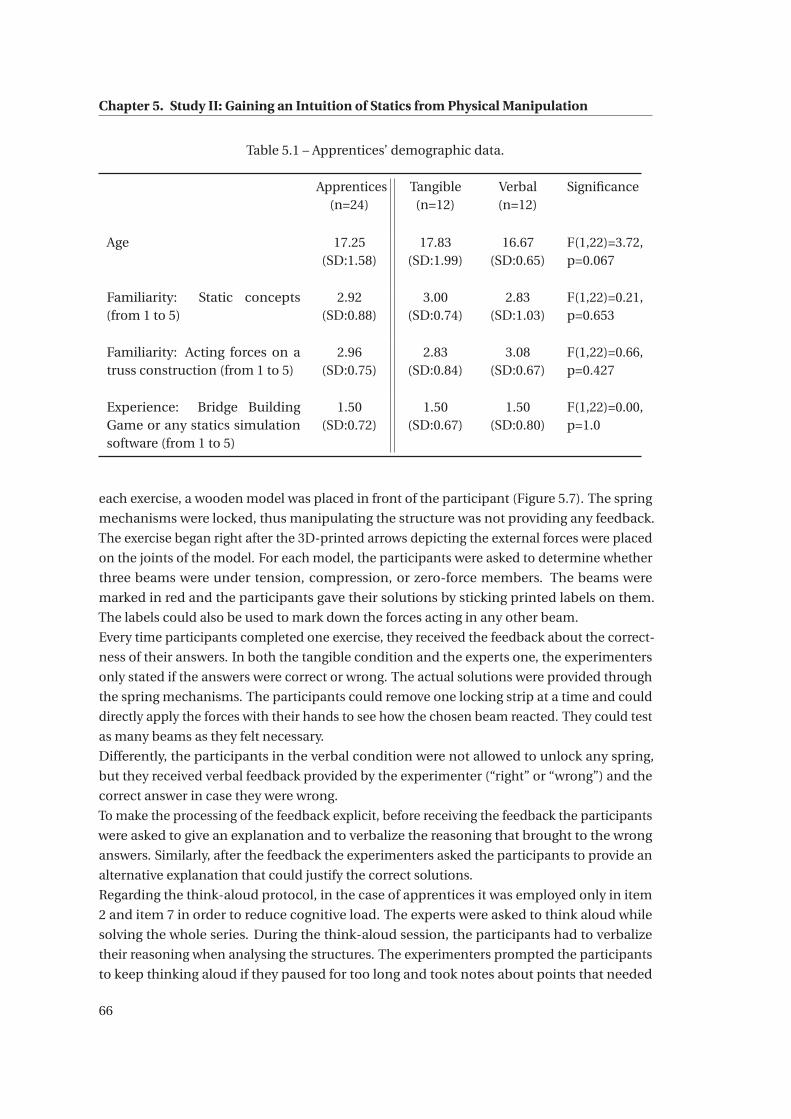
Chapter 5. Study II: Gaining an Intuition of Statics from Physical Manipulation
Table 5.1 – Apprentices’ demographic data.
Apprentices(n=24)
Tangible(n=12)
Verbal(n=12)
Significance
Age 17.25(SD:1.58)
17.83(SD:1.99)
16.67(SD:0.65)
F(1,22)=3.72,p=0.067
Familiarity: Static concepts(from 1 to 5)
2.92(SD:0.88)
3.00(SD:0.74)
2.83(SD:1.03)
F(1,22)=0.21,p=0.653
Familiarity: Acting forces on atruss construction (from 1 to 5)
2.96(SD:0.75)
2.83(SD:0.84)
3.08(SD:0.67)
F(1,22)=0.66,p=0.427
Experience: Bridge BuildingGame or any statics simulationsoftware (from 1 to 5)
1.50(SD:0.72)
1.50(SD:0.67)
1.50(SD:0.80)
F(1,22)=0.00,p=1.0
each exercise, a wooden model was placed in front of the participant (Figure 5.7). The spring
mechanisms were locked, thus manipulating the structure was not providing any feedback.
The exercise began right after the 3D-printed arrows depicting the external forces were placed
on the joints of the model. For each model, the participants were asked to determine whether
three beams were under tension, compression, or zero-force members. The beams were
marked in red and the participants gave their solutions by sticking printed labels on them.
The labels could also be used to mark down the forces acting in any other beam.
Every time participants completed one exercise, they received the feedback about the correct-
ness of their answers. In both the tangible condition and the experts one, the experimenters
only stated if the answers were correct or wrong. The actual solutions were provided through
the spring mechanisms. The participants could remove one locking strip at a time and could
directly apply the forces with their hands to see how the chosen beam reacted. They could test
as many beams as they felt necessary.
Differently, the participants in the verbal condition were not allowed to unlock any spring,
but they received verbal feedback provided by the experimenter (“right” or “wrong”) and the
correct answer in case they were wrong.
To make the processing of the feedback explicit, before receiving the feedback the participants
were asked to give an explanation and to verbalize the reasoning that brought to the wrong
answers. Similarly, after the feedback the experimenters asked the participants to provide an
alternative explanation that could justify the correct solutions.
Regarding the think-aloud protocol, in the case of apprentices it was employed only in item
2 and item 7 in order to reduce cognitive load. The experts were asked to think aloud while
solving the whole series. During the think-aloud session, the participants had to verbalize
their reasoning when analysing the structures. The experimenters prompted the participants
to keep thinking aloud if they paused for too long and took notes about points that needed
66
5.3. Statistical Analysis and Findings
clarification. These open points were straightened out during the follow-up interview.
After completing the intervention stage, the apprentices completed the post-test, which was
identical to the pre-test. The experiment ended with a semi-structured interview which
revolved mostly around the participants’ approaches to determine the forces acting on the
beams. The open questions noted by the experimenters during the intervention were clarified
and the participants were also asked if the feedback they received (tangible or verbal) was
helpful to understand the acting forces and to improve the performance. Furthermore, the
feedback about the prototype and its usability were gathered, as well as what the participants
thought to be the role of statics in their working daily practice. The whole experiment took
approximately 1 hours and 10 minutes for the apprentices, versus 45 minutes for the experts.
Figure 5.7 – The setup of the experiment.
5.3 Statistical Analysis and Findings
The software employed for the statistical analysis were R v3.1 (R2014) and IBM SPSS Statistics
2013.
Apprentices’ Performances In the pre- and post-test, the participants received one point
for each beam correctly determined, hence the maximum score was 21. The score in the
intervention phase was computed in the same way and the maximum score was 24. The scores
shown in Figure 5.8 have been normalized between 0 and 3 in order to make comparisons
between pre-test, intervention and post-test.
The effect of the phase (pre-test, intervention or post-test) was statistically significant, due to
the average score in the intervention phase being lower than the scores in the pre and post
67
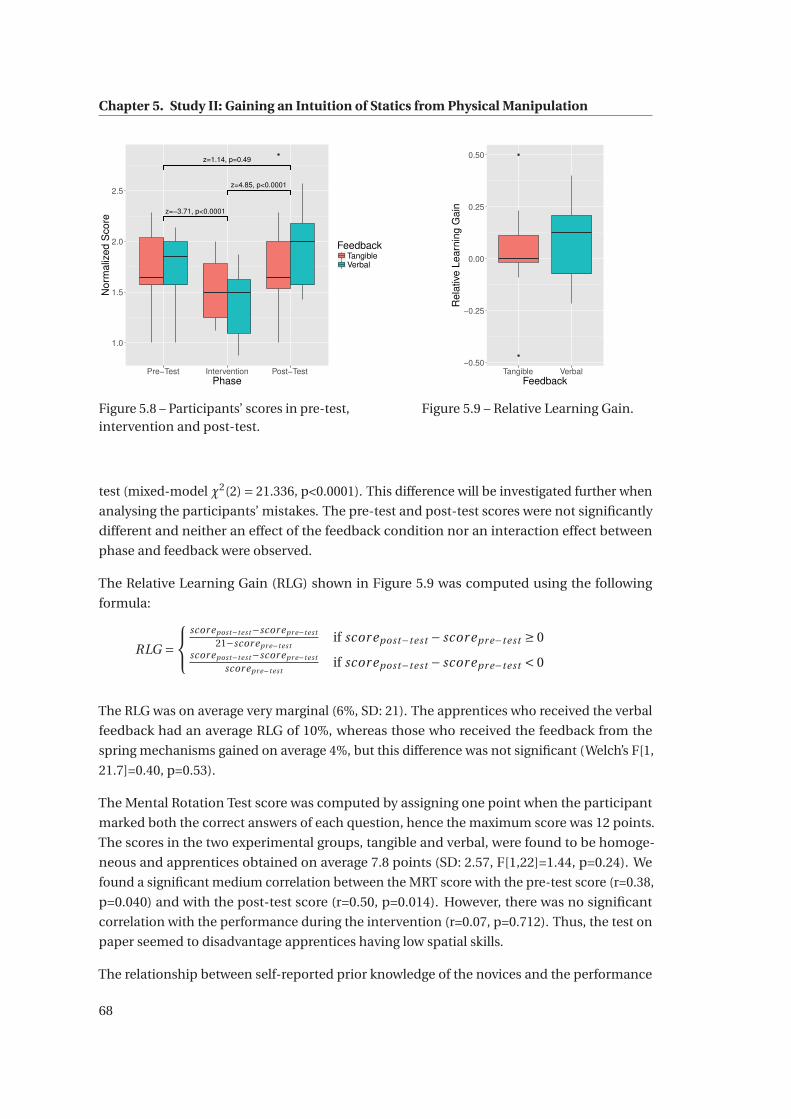
Chapter 5. Study II: Gaining an Intuition of Statics from Physical Manipulation
z=−3.71, p<0.0001
z=1.14, p=0.49
z=4.85, p<0.0001
1.0
1.5
2.0
2.5
Pre−Test Intervention Post−TestPhase
Nor
mal
ized
Sco
re
FeedbackTangibleVerbal
Figure 5.8 – Participants’ scores in pre-test,intervention and post-test.
−0.50
−0.25
0.00
0.25
0.50
Tangible VerbalFeedback
Rel
ativ
e Le
arni
ng G
ain
Figure 5.9 – Relative Learning Gain.
test (mixed-model χ2(2)= 21.336, p<0.0001). This difference will be investigated further when
analysing the participants’ mistakes. The pre-test and post-test scores were not significantly
different and neither an effect of the feedback condition nor an interaction effect between
phase and feedback were observed.
The Relative Learning Gain (RLG) shown in Figure 5.9 was computed using the following
formula:
RLG =⎧⎨⎩
scor epost−test−scor epr e−test
21−scor epr e−testif scor epost−test − scor epr e−test ≥ 0
scor epost−test−scor epr e−test
scor epr e−testif scor epost−test − scor epr e−test < 0
The RLG was on average very marginal (6%, SD: 21). The apprentices who received the verbal
feedback had an average RLG of 10%, whereas those who received the feedback from the
spring mechanisms gained on average 4%, but this difference was not significant (Welch’s F[1,
21.7]=0.40, p=0.53).
The Mental Rotation Test score was computed by assigning one point when the participant
marked both the correct answers of each question, hence the maximum score was 12 points.
The scores in the two experimental groups, tangible and verbal, were found to be homoge-
neous and apprentices obtained on average 7.8 points (SD: 2.57, F[1,22]=1.44, p=0.24). We
found a significant medium correlation between the MRT score with the pre-test score (r=0.38,
p=0.040) and with the post-test score (r=0.50, p=0.014). However, there was no significant
correlation with the performance during the intervention (r=0.07, p=0.712). Thus, the test on
paper seemed to disadvantage apprentices having low spatial skills.
The relationship between self-reported prior knowledge of the novices and the performance
68
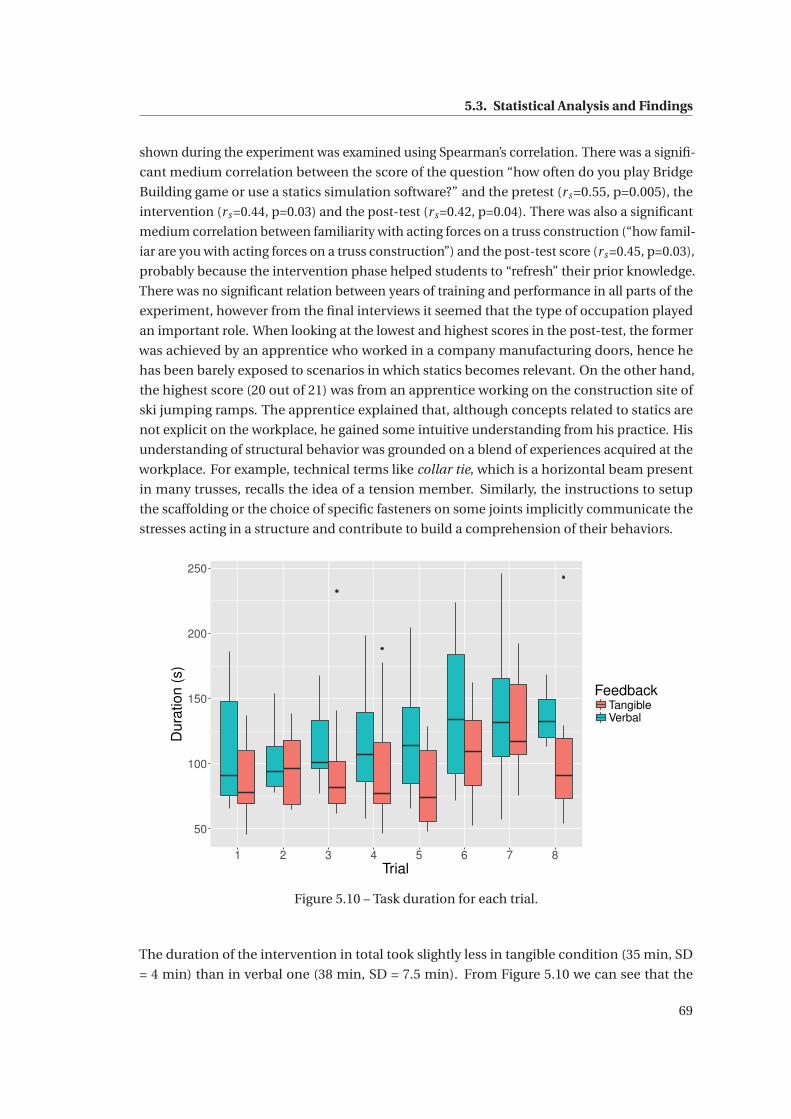
5.3. Statistical Analysis and Findings
shown during the experiment was examined using Spearman’s correlation. There was a signifi-
cant medium correlation between the score of the question “how often do you play Bridge
Building game or use a statics simulation software?” and the pretest (rs=0.55, p=0.005), the
intervention (rs=0.44, p=0.03) and the post-test (rs=0.42, p=0.04). There was also a significant
medium correlation between familiarity with acting forces on a truss construction (“how famil-
iar are you with acting forces on a truss construction”) and the post-test score (rs=0.45, p=0.03),
probably because the intervention phase helped students to “refresh” their prior knowledge.
There was no significant relation between years of training and performance in all parts of the
experiment, however from the final interviews it seemed that the type of occupation played
an important role. When looking at the lowest and highest scores in the post-test, the former
was achieved by an apprentice who worked in a company manufacturing doors, hence he
has been barely exposed to scenarios in which statics becomes relevant. On the other hand,
the highest score (20 out of 21) was from an apprentice working on the construction site of
ski jumping ramps. The apprentice explained that, although concepts related to statics are
not explicit on the workplace, he gained some intuitive understanding from his practice. His
understanding of structural behavior was grounded on a blend of experiences acquired at the
workplace. For example, technical terms like collar tie, which is a horizontal beam present
in many trusses, recalls the idea of a tension member. Similarly, the instructions to setup
the scaffolding or the choice of specific fasteners on some joints implicitly communicate the
stresses acting in a structure and contribute to build a comprehension of their behaviors.
50
100
150
200
250
1 2 3 4 5 6 7 8Trial
Dur
atio
n (s
)
FeedbackTangibleVerbal
Figure 5.10 – Task duration for each trial.
The duration of the intervention in total took slightly less in tangible condition (35 min, SD
= 4 min) than in verbal one (38 min, SD = 7.5 min). From Figure 5.10 we can see that the
69
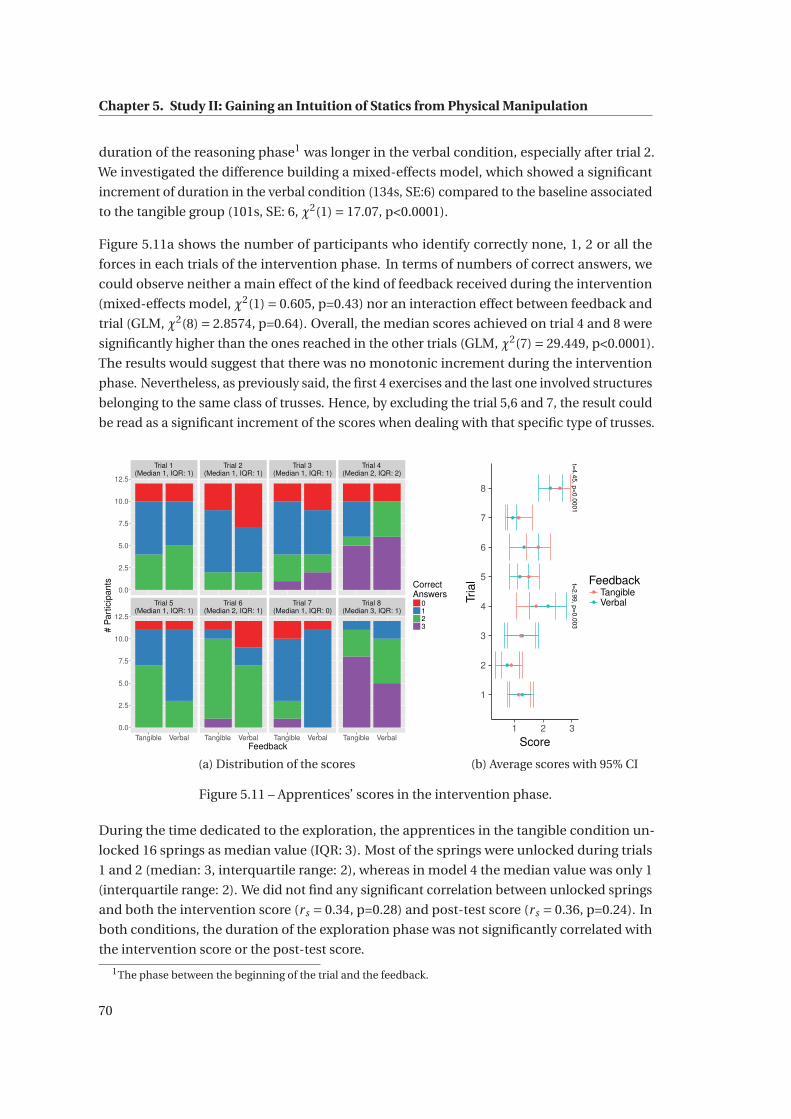
Chapter 5. Study II: Gaining an Intuition of Statics from Physical Manipulation
duration of the reasoning phase1 was longer in the verbal condition, especially after trial 2.
We investigated the difference building a mixed-effects model, which showed a significant
increment of duration in the verbal condition (134s, SE:6) compared to the baseline associated
to the tangible group (101s, SE: 6, χ2(1)= 17.07, p<0.0001).
Figure 5.11a shows the number of participants who identify correctly none, 1, 2 or all the
forces in each trials of the intervention phase. In terms of numbers of correct answers, we
could observe neither a main effect of the kind of feedback received during the intervention
(mixed-effects model, χ2(1)= 0.605, p=0.43) nor an interaction effect between feedback and
trial (GLM, χ2(8)= 2.8574, p=0.64). Overall, the median scores achieved on trial 4 and 8 were
significantly higher than the ones reached in the other trials (GLM, χ2(7)= 29.449, p<0.0001).
The results would suggest that there was no monotonic increment during the intervention
phase. Nevertheless, as previously said, the first 4 exercises and the last one involved structures
belonging to the same class of trusses. Hence, by excluding the trial 5,6 and 7, the result could
be read as a significant increment of the scores when dealing with that specific type of trusses.
Trial 5(Median 1, IQR: 1)
Trial 6(Median 2, IQR: 1)
Trial 7(Median 1, IQR: 0)
Trial 8(Median 3, IQR: 1)
Trial 1(Median 1, IQR: 1)
Trial 2(Median 1, IQR: 1)
Trial 3(Median 1, IQR: 1)
Trial 4(Median 2, IQR: 2)
Tangible Verbal Tangible Verbal Tangible Verbal Tangible Verbal
0.0
2.5
5.0
7.5
10.0
12.5
0.0
2.5
5.0
7.5
10.0
12.5
Feedback
# P
artic
ipan
ts CorrectAnswers
0123
(a) Distribution of the scores
t=2.99, p=
0.003t=
4.45, p<0.0001
1
2
3
4
5
6
7
8
1 2 3
Score
Tria
l FeedbackTangibleVerbal
(b) Average scores with 95% CI
Figure 5.11 – Apprentices’ scores in the intervention phase.
During the time dedicated to the exploration, the apprentices in the tangible condition un-
locked 16 springs as median value (IQR: 3). Most of the springs were unlocked during trials
1 and 2 (median: 3, interquartile range: 2), whereas in model 4 the median value was only 1
(interquartile range: 2). We did not find any significant correlation between unlocked springs
and both the intervention score (rs = 0.34, p=0.28) and post-test score (rs = 0.36, p=0.24). In
both conditions, the duration of the exploration phase was not significantly correlated with
the intervention score or the post-test score.
1The phase between the beginning of the trial and the feedback.
70
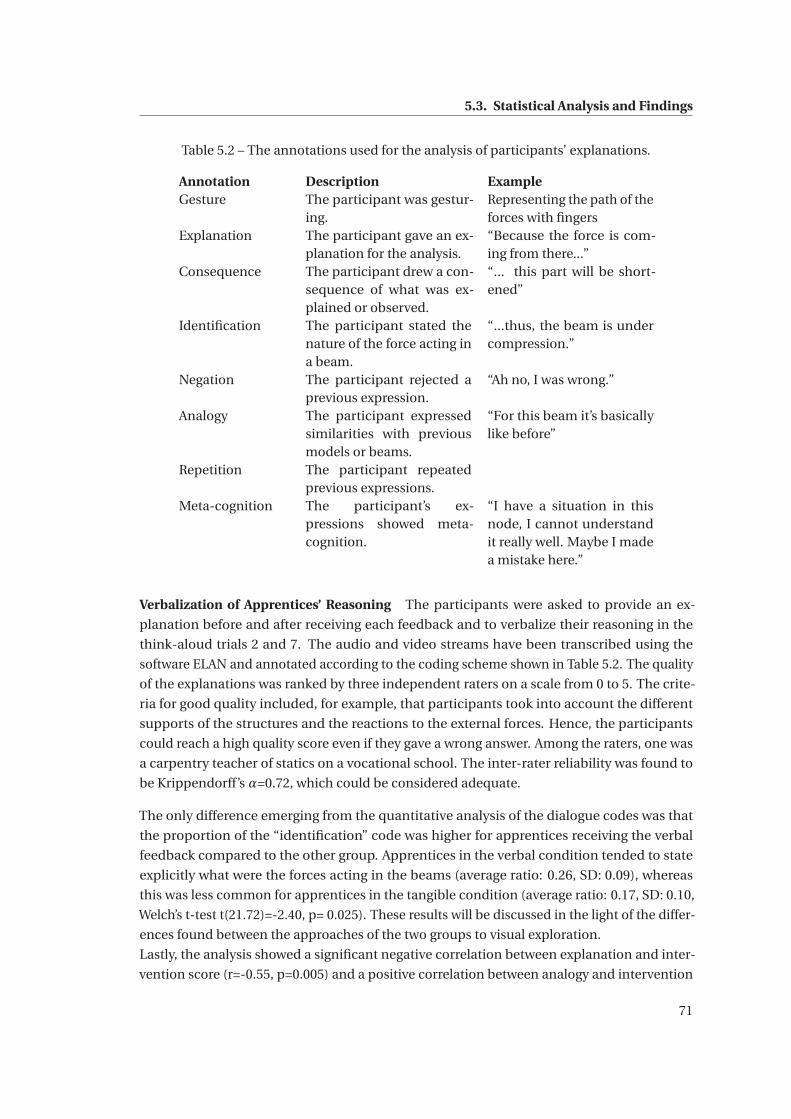
5.3. Statistical Analysis and Findings
Table 5.2 – The annotations used for the analysis of participants’ explanations.
Annotation Description ExampleGesture The participant was gestur-
ing.Representing the path of theforces with fingers
Explanation The participant gave an ex-planation for the analysis.
“Because the force is com-ing from there...”
Consequence The participant drew a con-sequence of what was ex-plained or observed.
“... this part will be short-ened”
Identification The participant stated thenature of the force acting ina beam.
“...thus, the beam is undercompression.”
Negation The participant rejected aprevious expression.
“Ah no, I was wrong.”
Analogy The participant expressedsimilarities with previousmodels or beams.
“For this beam it’s basicallylike before”
Repetition The participant repeatedprevious expressions.
Meta-cognition The participant’s ex-pressions showed meta-cognition.
“I have a situation in thisnode, I cannot understandit really well. Maybe I madea mistake here.”
Verbalization of Apprentices’ Reasoning The participants were asked to provide an ex-
planation before and after receiving each feedback and to verbalize their reasoning in the
think-aloud trials 2 and 7. The audio and video streams have been transcribed using the
software ELAN and annotated according to the coding scheme shown in Table 5.2. The quality
of the explanations was ranked by three independent raters on a scale from 0 to 5. The crite-
ria for good quality included, for example, that participants took into account the different
supports of the structures and the reactions to the external forces. Hence, the participants
could reach a high quality score even if they gave a wrong answer. Among the raters, one was
a carpentry teacher of statics on a vocational school. The inter-rater reliability was found to
be Krippendorff’s α=0.72, which could be considered adequate.
The only difference emerging from the quantitative analysis of the dialogue codes was that
the proportion of the “identification” code was higher for apprentices receiving the verbal
feedback compared to the other group. Apprentices in the verbal condition tended to state
explicitly what were the forces acting in the beams (average ratio: 0.26, SD: 0.09), whereas
this was less common for apprentices in the tangible condition (average ratio: 0.17, SD: 0.10,
Welch’s t-test t(21.72)=-2.40, p= 0.025). These results will be discussed in the light of the differ-
ences found between the approaches of the two groups to visual exploration.
Lastly, the analysis showed a significant negative correlation between explanation and inter-
vention score (r=-0.55, p=0.005) and a positive correlation between analogy and intervention
71
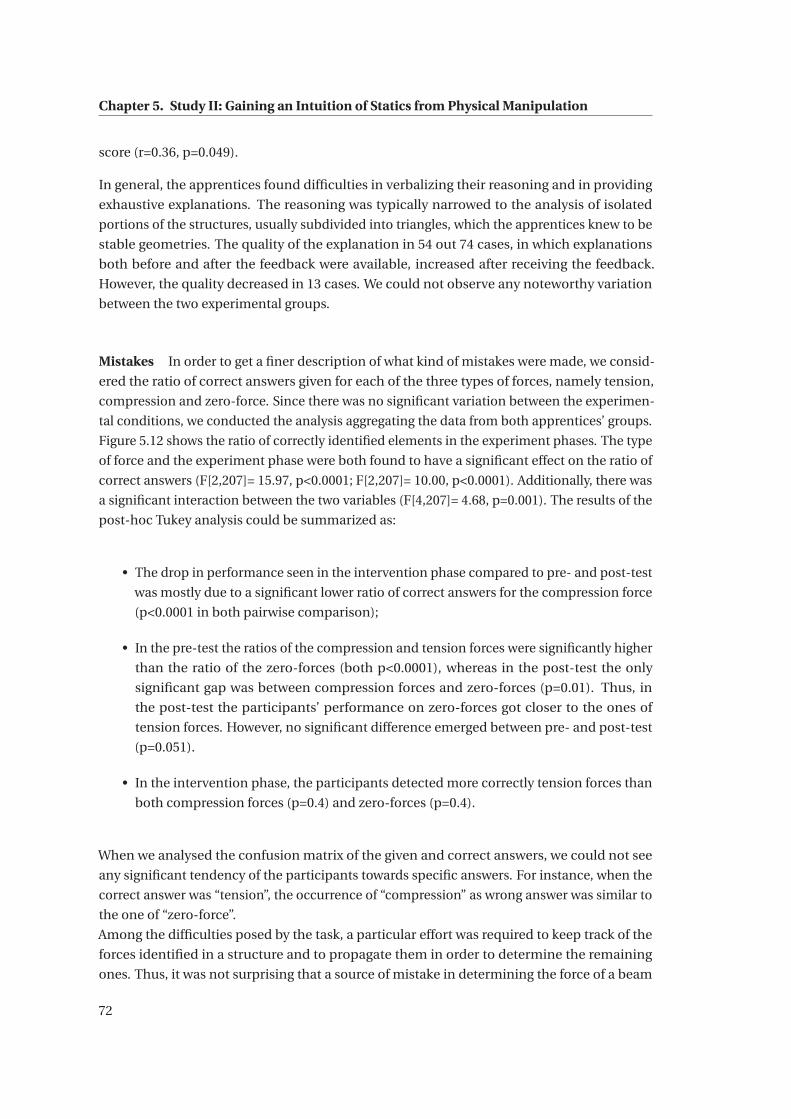
Chapter 5. Study II: Gaining an Intuition of Statics from Physical Manipulation
score (r=0.36, p=0.049).
In general, the apprentices found difficulties in verbalizing their reasoning and in providing
exhaustive explanations. The reasoning was typically narrowed to the analysis of isolated
portions of the structures, usually subdivided into triangles, which the apprentices knew to be
stable geometries. The quality of the explanation in 54 out 74 cases, in which explanations
both before and after the feedback were available, increased after receiving the feedback.
However, the quality decreased in 13 cases. We could not observe any noteworthy variation
between the two experimental groups.
Mistakes In order to get a finer description of what kind of mistakes were made, we consid-
ered the ratio of correct answers given for each of the three types of forces, namely tension,
compression and zero-force. Since there was no significant variation between the experimen-
tal conditions, we conducted the analysis aggregating the data from both apprentices’ groups.
Figure 5.12 shows the ratio of correctly identified elements in the experiment phases. The type
of force and the experiment phase were both found to have a significant effect on the ratio of
correct answers (F[2,207]= 15.97, p<0.0001; F[2,207]= 10.00, p<0.0001). Additionally, there was
a significant interaction between the two variables (F[4,207]= 4.68, p=0.001). The results of the
post-hoc Tukey analysis could be summarized as:
• The drop in performance seen in the intervention phase compared to pre- and post-test
was mostly due to a significant lower ratio of correct answers for the compression force
(p<0.0001 in both pairwise comparison);
• In the pre-test the ratios of the compression and tension forces were significantly higher
than the ratio of the zero-forces (both p<0.0001), whereas in the post-test the only
significant gap was between compression forces and zero-forces (p=0.01). Thus, in
the post-test the participants’ performance on zero-forces got closer to the ones of
tension forces. However, no significant difference emerged between pre- and post-test
(p=0.051).
• In the intervention phase, the participants detected more correctly tension forces than
both compression forces (p=0.4) and zero-forces (p=0.4).
When we analysed the confusion matrix of the given and correct answers, we could not see
any significant tendency of the participants towards specific answers. For instance, when the
correct answer was “tension”, the occurrence of “compression” as wrong answer was similar to
the one of “zero-force”.
Among the difficulties posed by the task, a particular effort was required to keep track of the
forces identified in a structure and to propagate them in order to determine the remaining
ones. Thus, it was not surprising that a source of mistake in determining the force of a beam
72
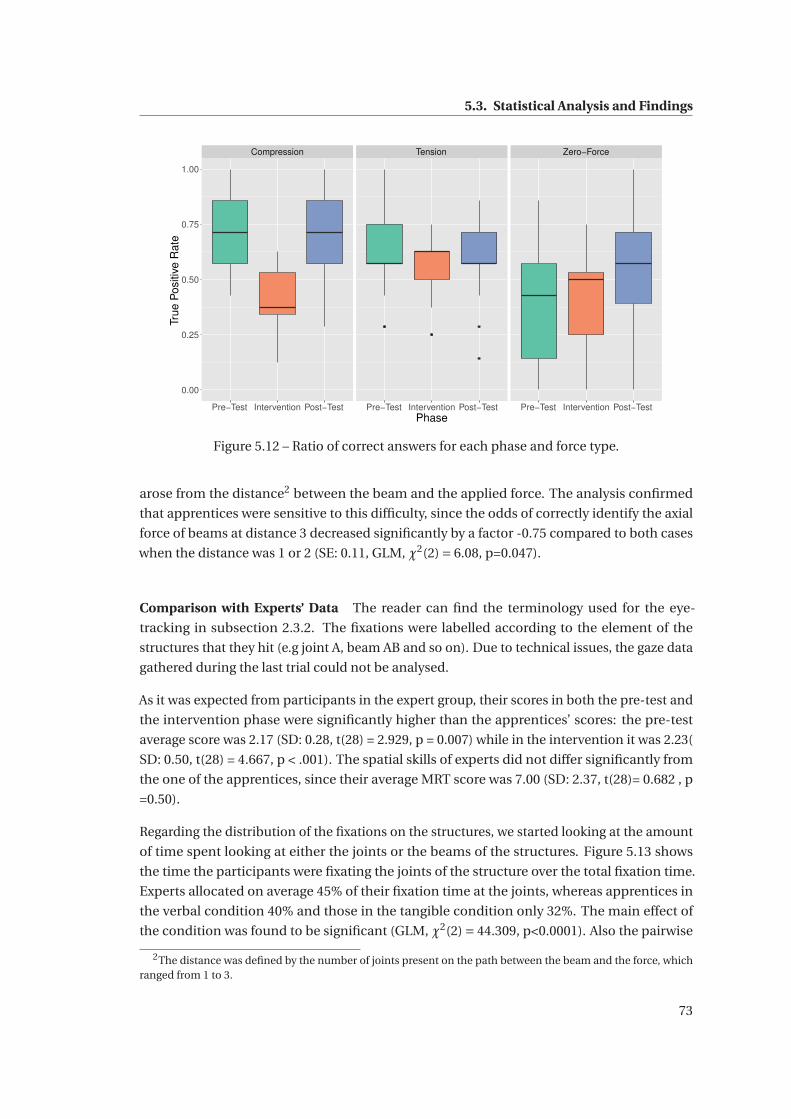
5.3. Statistical Analysis and Findings
Compression Tension Zero−Force
Pre−Test Intervention Post−Test Pre−Test Intervention Post−Test Pre−Test Intervention Post−Test
0.00
0.25
0.50
0.75
1.00
Phase
True
Pos
itive
Rat
e
Figure 5.12 – Ratio of correct answers for each phase and force type.
arose from the distance2 between the beam and the applied force. The analysis confirmed
that apprentices were sensitive to this difficulty, since the odds of correctly identify the axial
force of beams at distance 3 decreased significantly by a factor -0.75 compared to both cases
when the distance was 1 or 2 (SE: 0.11, GLM, χ2(2)= 6.08, p=0.047).
Comparison with Experts’ Data The reader can find the terminology used for the eye-
tracking in subsection 2.3.2. The fixations were labelled according to the element of the
structures that they hit (e.g joint A, beam AB and so on). Due to technical issues, the gaze data
gathered during the last trial could not be analysed.
As it was expected from participants in the expert group, their scores in both the pre-test and
the intervention phase were significantly higher than the apprentices’ scores: the pre-test
average score was 2.17 (SD: 0.28, t(28) = 2.929, p = 0.007) while in the intervention it was 2.23(
SD: 0.50, t(28) = 4.667, p < .001). The spatial skills of experts did not differ significantly from
the one of the apprentices, since their average MRT score was 7.00 (SD: 2.37, t(28)= 0.682 , p
=0.50).
Regarding the distribution of the fixations on the structures, we started looking at the amount
of time spent looking at either the joints or the beams of the structures. Figure 5.13 shows
the time the participants were fixating the joints of the structure over the total fixation time.
Experts allocated on average 45% of their fixation time at the joints, whereas apprentices in
the verbal condition 40% and those in the tangible condition only 32%. The main effect of
the condition was found to be significant (GLM, χ2(2)= 44.309, p<0.0001). Also the pairwise
2The distance was defined by the number of joints present on the path between the beam and the force, whichranged from 1 to 3.
73
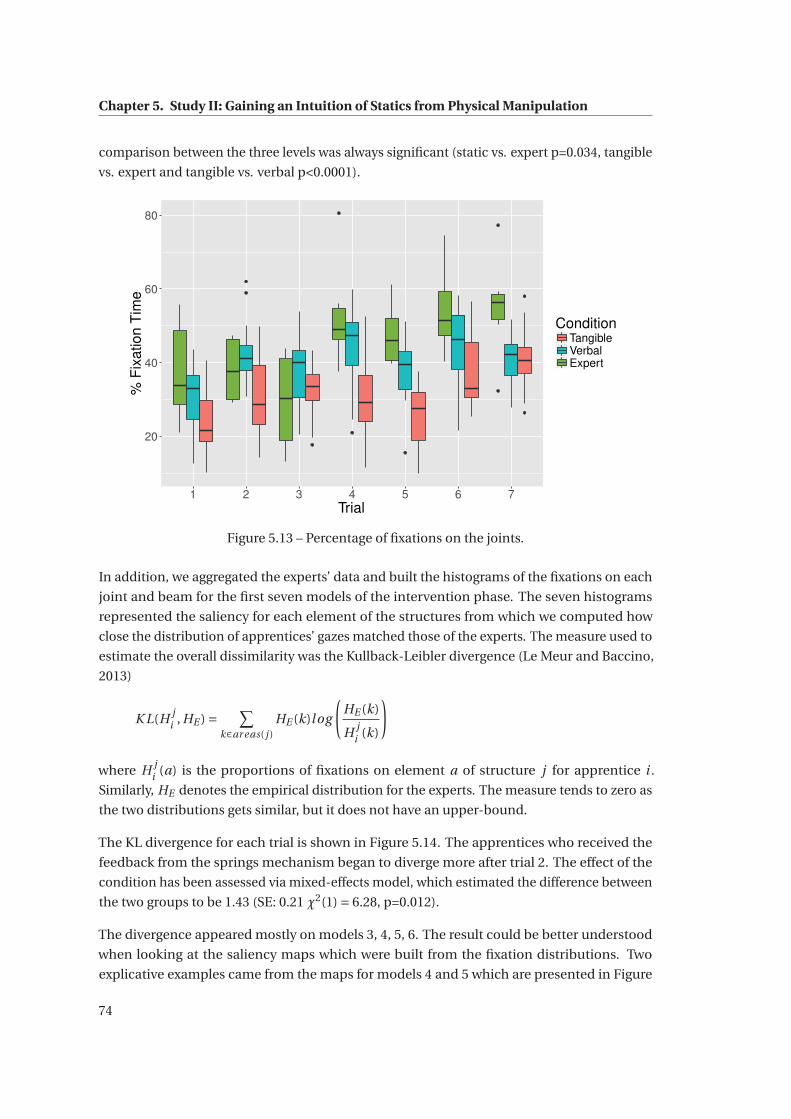
Chapter 5. Study II: Gaining an Intuition of Statics from Physical Manipulation
comparison between the three levels was always significant (static vs. expert p=0.034, tangible
vs. expert and tangible vs. verbal p<0.0001).
20
40
60
80
1 2 3 4 5 6 7Trial
% F
ixat
ion
Tim
e
ConditionTangibleVerbalExpert
Figure 5.13 – Percentage of fixations on the joints.
In addition, we aggregated the experts’ data and built the histograms of the fixations on each
joint and beam for the first seven models of the intervention phase. The seven histograms
represented the saliency for each element of the structures from which we computed how
close the distribution of apprentices’ gazes matched those of the experts. The measure used to
estimate the overall dissimilarity was the Kullback-Leibler divergence (Le Meur and Baccino,
2013)
K L(H ji , HE )= ∑
k∈ar eas( j )HE (k)log
(HE (k)
H ji (k)
)
where H ji (a) is the proportions of fixations on element a of structure j for apprentice i .
Similarly, HE denotes the empirical distribution for the experts. The measure tends to zero as
the two distributions gets similar, but it does not have an upper-bound.
The KL divergence for each trial is shown in Figure 5.14. The apprentices who received the
feedback from the springs mechanism began to diverge more after trial 2. The effect of the
condition has been assessed via mixed-effects model, which estimated the difference between
the two groups to be 1.43 (SE: 0.21 χ2(1)= 6.28, p=0.012).
The divergence appeared mostly on models 3, 4, 5, 6. The result could be better understood
when looking at the saliency maps which were built from the fixation distributions. Two
explicative examples came from the maps for models 4 and 5 which are presented in Figure
74
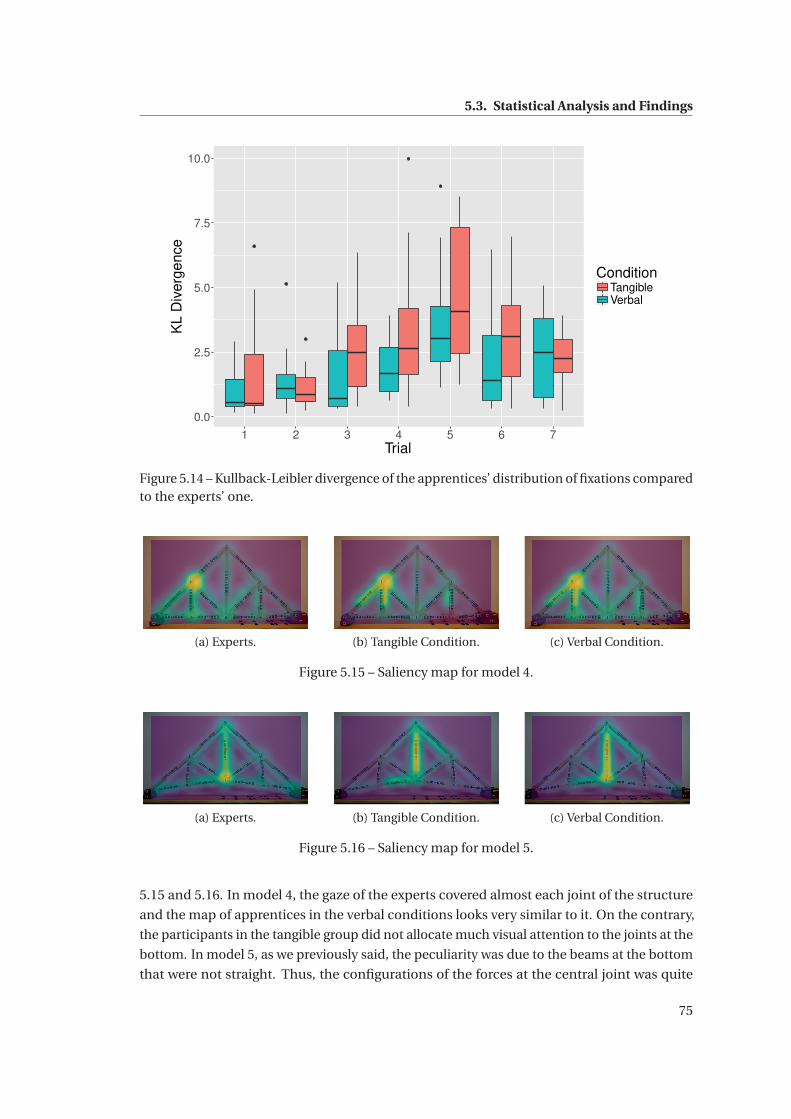
5.3. Statistical Analysis and Findings
0.0
2.5
5.0
7.5
10.0
1 2 3 4 5 6 7Trial
KL
Div
erge
nce
ConditionTangibleVerbal
Figure 5.14 – Kullback-Leibler divergence of the apprentices’ distribution of fixations comparedto the experts’ one.
(a) Experts. (b) Tangible Condition. (c) Verbal Condition.
Figure 5.15 – Saliency map for model 4.
(a) Experts. (b) Tangible Condition. (c) Verbal Condition.
Figure 5.16 – Saliency map for model 5.
5.15 and 5.16. In model 4, the gaze of the experts covered almost each joint of the structure
and the map of apprentices in the verbal conditions looks very similar to it. On the contrary,
the participants in the tangible group did not allocate much visual attention to the joints at the
bottom. In model 5, as we previously said, the peculiarity was due to the beams at the bottom
that were not straight. Thus, the configurations of the forces at the central joint was quite
75
Chapter 5. Study II: Gaining an Intuition of Statics from Physical Manipulation
different compared to the previous structures. This criticality emerges clearly from the two
maps 5.16a and 5.16c, but not from the apprentices’ one in tangible condition, that seemed to
not pay much attention to it.
However, in terms of scores achieved in the seven trials and the relative learning gain, we
could not find any significant correlation neither with the percentage of fixation on the joints
(r = −0.05, p=0.55) nor with the KL divergence from the experts’ saliency maps (r = −0.08,
p=0.27).
In contrary to the apprentices, the experts referred to the joints of the structures during their
verbal explanations. Typically their analysis began with considerations about the reactions
offered by the supports. Four of them explicitly stated the conditions for the equilibrium
and three experts used their fingers to build the polygons of the forces at the joints to check
their resultants. Their qualitative reasoning was largely influenced by the Cremona-Maxwell
method, which is a graphical method for analysing trusses taught during the first years of
university.
5.4 Discussion
The general picture offered by the analysis could be summarized in the absence of differences
between the two apprentices’ conditions in terms of learning outcomes, thus rejecting the
HOutcomes hypothesis. At first glance both the average post-test score and the RLG were higher
in the verbal condition compared to the tangible one, however the high variance resulted in a
lack of statistical significance.
A noteworthy result was the positive correlation between MRT score and both pre- and post-
test scores, and the absence of correlation with the intervention score. The positive relation
between spatial abilities and problem solving in structural behavior has emerged already from
the work of Alias, Gray and Black (Alias et al., 2003), as well as from works focused on other
STEM subjects (Uttal and Cohen, 2012). The absence of correlation with the intervention score
supported the claim that having a physical representation mitigates the difficulty of users with
low spatial abilities, which is one assumption for using physical materials (including TUIs) as
learning technology in STEM fields (Clifton et al., 2016).
In the intervention phase, the duration of the participants’ reasoning before the feedback
was given was 30s shorter in the tangible condition than in the verbal one. The difference
was present since the beginning of the intervention phase, thus the result might be due to
the fascination for the spring mechanisms and to the participants’ desire to manipulate the
tool. Similarly to the manipulation temptation concept reported by Do-Lenh et al. (Do-Lenh
et al., 2012), the backlash of having a high freedom of manipulation and a playful learning
experience was a decreasing attention towards the understanding of the problem. However,
in our experiment the fascination did not seem to last long. Although the participants were
encouraged by the experimenters to explore the behavior of the models, the number of springs
unlocked after the feedback was given was generally low. It was not possible to say whether
76
5.4. Discussion
the participants’ attitude to refrain from exploring was due to either the inhibition caused
by the experimental setup (e.g. “I already unlocked a couple of springs, I should not overdo
it.”) or to a perceived uselessness of the tangible feedback. In either way, we did not see any
relation between the number of springs unlocked and the learners’ performance.
The number of correct answers showed an increasing trend for the first four models, then a
drop and again an increment on the last structure. As mentioned in the analysis, although
the structures were sorted by increasing difficulty, the first four structures and the three-
dimensional one belonged to the same class of standard trusses having a triangular shape.
When isolating these four models, there was indeed an increment of participants’ scores,
which could be attributed to the recognition of the common pattern in the four layouts and
the transfer of this knowledge. The medium positive correlation between the dialogue code
analogy and the intervention score gave additional support to this interpretation. However,
when moving to structures having different layouts, finding analogies became more difficult,
which led to a higher number of mistakes. As suggested by the findings of Chi, Feltovitch,
and Glaser (Chi et al., 1981), apprentices might have tended to categorize the problem by
the explicit features (e.g. layouts, direction of the force) rather than by the underling physics
principles, which made difficult to reason by analogy when a new scenario was not highly
similar to the previously encountered ones.
The quality of the explanations given right before and after the feedback generally improved,
regardless of the experimental condition. The apprentices seemed to have developed a better
understanding of the physics concepts, but this did not result in a significant improvement of
the outcomes. Most likely, the experience gathered through the experiment did not provide
enough data to build an effective “theory” to solve the problems and it only superficially
scratched the body of participants’ misconceptions. This interpretation could be linked to
another result: the more participants used explanations during the intervention phase, the
lower was their score in such phase. According to recent works on the self-explanation effect
(Williams and Lombrozo, 2010; Legare et al., 2010), when learners strive to find regularities
and to abstract rules, the search for explanations lead people to connecting small samples of
unrepresentative observations, which results in inferring incorrect generalization and create
an illusion of discovery (Rozenblit and Keil, 2002). Probably the design of our setup could
not break these wrong beliefs. In the tangible condition, the participants were supposed to
have an advantage, thank to the fact they could have dissipated their doubts by means of the
feedback from the models. However, this was not the case. A better design could, for instance,
involve the collaboration between participants, who would benefit from a mutual explanation
and from providing sensible justifications to their answers(Jermann and Dillenbourg, 2003).
Regarding the mistakes, the apprentices found particularly difficult to grasp the concept of
zero-force. Recalling the results, the amount of correctly determined beams in the pre-test
was significantly lower for zero-force members compared to compression and tension ones.
However, in the post-test the difference is significant only with compression forces, which
could be read as an improvement. A common question during the experiment was “If it doesn’t
carry any load, can’t we just remove it?”. Zero-force members derive from the idealizations
77
Chapter 5. Study II: Gaining an Intuition of Statics from Physical Manipulation
introduced when describing a structure as a truss, e.g. the absence of shear forces or bending
effect or the connections not transmitting the momentum. Since the motivations of such
simplifications have never been presented to the apprentices and since their knowledge about
structures is mostly grounded on real-life examples, the existence of elements that do not
carry any load was considered to be odd. The analysis revealed also that the probability of
wrongly identifying the force in a beam was related to its distance from the joint(s) where the
external load were applied. Intuitively, the more a beam is far from the external force, the more
difficult it should be to propagate the assumptions made so far and coherently work out a
solution for the beam. Furthermore, in the interviews experts remarked that the task requires
a large memorization effort. The labels that were used to annotate the forces in the beams
were not helpful to mark the forces on the joints. The experimental task required extensive
demands of the participants’ working memory without providing an appropriate support.
Differences between the two experimental conditions arose from the analysis of the gaze
data and the comparison with the experts. Our HV i sual E xplor ati on hypothesis was that the
participants in the tangible group, compared to those in the verbal group, would have had a
distribution of visual attention over the structures more similar to the experts’ one. This would
suggest a deeper understanding of the statics concepts, which would drive the gazes on the
parts of the structures that are critical for the reasoning. What emerged for the analysis is the
opposite situation: participants that received the verbal feedback behaved more similarly to
the experts. They focused more on the joints and on those areas that experts looked at. The
absence of relationship between these results and the learning outcomes should not surprise
us, since the task was relatively short for consolidating the novel knowledge (Baylor, 2001).
However, the focus on the joints could reflect the consolidation of a sort of intuition about the
static equilibrium: in order to identify the forces inside the beams, it is necessary to analyse
their interaction at the connections and how they compensate each other. This hypothesis
might be supported by another result: the participants in the verbal condition had a higher
percentage of statements about the forces in the beams. They tended to verbally remark to
themself the forces while reasoning. Moreover, given the higher similarity with the experts’
gaze distribution, they might have learnt to identify the critical features of the structures
and to spot the differences between the scenarios of the exercises. Given the results of the
experiments, how could we explain the apparent detrimental effect of the spring mechanisms
and their manipulation? Even though the aim of the springs was to make visible the idea
of axial forces, it probably led apprentices to think that the key to solve the exercise was
to figure out how every single beam was reacting. Kriz and Hegarty, in their work on the
effects of animations on learning (Kriz and Hegarty, 2007), described how in the absence
of a consolidated prior knowledge of the domain, the learners’ visual attention is directed
toward distractive but not relevant stimuli. For low domain knowledge learners, bottom-up
processes tend to influence more learners’ attention than top-down processes, because the
former are triggered by visual representations (e.g. animations, arrows, etc.) whereas the latter
are regulated by the prior knowledge. In the tangible condition the manipulation of the spring
mechanism throughout the whole intervention stage might have monopolized participants’
78
5.5. Conclusion
focus at the expense of re-elaborating the pre-existing knowledge. On the contrary, in spite of
the statics knowledge being homogeneous between the experimental groups, participants’
reasoning in the verbal group could rely more on the physics principles they knew thanks to
the absence of any external cue. Although the models were the same both conditions, the
novelty effect induced by the presence of the spring mechanisms probably vanished because
they could not be unlocked.
Before moving to the conclusions, it is worth mentioning the limitations we observed in this
study. Several authors reported the issues related to the combination of think-aloud and eye-
tracking protocols. Besides the individual differences in the ability to verbalize the reasoning
process, it was observed in prior studies that participants perform slower when thinking aloud
(Holmqvist et al., 2011). Nielsen and colleagues (Nielsen et al., 2002) showed that think-aloud
also affects the rate of general exploration and learning processes since it takes resources
from all parts of the cognitive system. Furthermore, the order in which the participants
perform sub processes may change when thinking aloud (Davies, 1995). Nevertheless, we
decided to use think-aloud, being aware of its disadvantages, but also of its advantages. In
our case, the issues would be related mostly to the collection of data from the experts, since
they were asked to think aloud during the whole intervention. Another potential weakness
could be in the qualitative analysis of the think-aloud data, since, for practical reasons, the
coding was performed by only one person. Moreover, the coding scheme was applied in a very
dichotomous way and did not take into account qualitative differences.
The validity of the statics knowledge test as an assessment tool was questionable. Although the
test was co-designed with a carpentry teacher and it was used in a pilot study, its reliability was
not extensively checked. Nonetheless, given the absence of suitable alternatives, employing
our test seemed an acceptable compromise.
5.5 Conclusion
This study explored the possibility of promoting statics reasoning skills by using interactive
physical models. Their exploration and manipulation, along with the feedback offered by
the elongation and compression of the members of the models, should have brought the
participants to gain insights about the possible strategies to solve the given problems. However,
the result indicated the absence of any learning benefit compared to the non-exploratory
condition in which the physical models were rigid and the feedback was given verbally. This
was consistent with previous researches (Han et al., 2009; Alfieri et al., 2011). Furthermore,
the comparison with experts’ data suggested that the employment of the spring mechanisms
drove the participants’ visual attention away from task relevant areas. Our conclusions should
not imply a clear either/or choice between exploratory and non-exploratory or between hands-
on and hands-off. Interactive physical models could be helpful as teaching tools and could
also be helpful to learners that have a medium/high domain knowledge. However, this study
offered, within its limitations, little support to the idea that hands-on experiences involving
such materials could foster the deduction of statics principles in case of fragmented prior
79
Chapter 5. Study II: Gaining an Intuition of Statics from Physical Manipulation
knowledge and without tutoring.
Concerning the development of our augmented reality system, the conclusions that have been
drawn were:
• This study did not give any further support to the employment of spring mechanisms,
also in light of the resources required to create them and to integrate in wooden models
available in schools. The representation of axial forces by means of the spring metaphor
could be implemented virtually, but it should be complemented by a visualization that
could convey the idea of equilibrium at the joints.
• The augmentation should present a realistic and complete view of the effects of the
loads on the structures. The system should display also bending effects, shear forces and
displacements in addition to the axial forces. In this way, it would be easier to interpret,
for example, the simplification introduced by modelling a structure as a truss.
• The timing and availability of the feedback would be controlled by the AR system rather
than by the learners. In an authentic classroom scenario, a drawback of the spring
mechanisms would be that students would playfully unlock them. This would cause a
serious problem for teachers in terms of orchestration (Cuendet et al., 2013).
These considerations will be summarized in the next chapter together with the complete
description of the AR system and its features as they appeared in the latest version.
Acknowledgement
The data from this study featured also in (Schwär, 2015, unpublished), although the analysis
presented in this chapter has diverged on some aspects.
80
6 StaticAR: Qualitative Statics throughAugmented Reality
This chapter introduces StaticAR, the AR application that we developed in order to bring
qualitative statics in vocation classrooms. Although StaticAR is the result of several refinements
brought during my PhD work, the following sections present only its final version in order to
give to the reader an overview of the features offered by the system. The chapter is divided
into two parts: the first section presents the technical features of the application and the
augmentation of the learning resources in school context. The second section briefly presents
how workplace experiences can be captured and become resources for the school lessons.
6.1 Technical Setup and Features
StaticAR is a cross-platform application1 which includes features to analyse 2D and 3D trusses
and frames. The interaction style is based on the magic-lens metaphor (Bier et al., 1993): a
small-scale model of a structure is observed through the interface, which displays the results
of the statics analysis superposed on the structure.
StaticAR has been developed using the Qt framework. The interface is tailored for handheld
devices, like smartphones and tablets, and it does not require any other hardware features
than those available in regular devices, specifically a rear camera and modest computational
power2. Since the beginning, the design of StaticAR has been driven by the main constraint of
our project, namely scalability. We wanted our solution to be widely adoptable in vocational
classrooms. As pointed by Dunleavy and colleagues (Dunleavy et al., 2009), AR systems
have shown difficulties in spreading within schools. Besides the scepticism towards the
employment of new learning technologies and the inherent inertia in mutating the traditional
teaching practices, there is also the problem of “practical” constraints. For instance, the need
to purchase specific hardware that cannot be reused for general purposes, or the logistic issues
related to moving from classrooms to computer labs. We tackled these problems by building
StaticAR around the ideal scenario of a classroom in which teachers run their application on
1Running StaticAR on a platform requires compiling it for the target architecture.2To serve as baseline reference, the application runs smoothly on a Samsung S5.
81
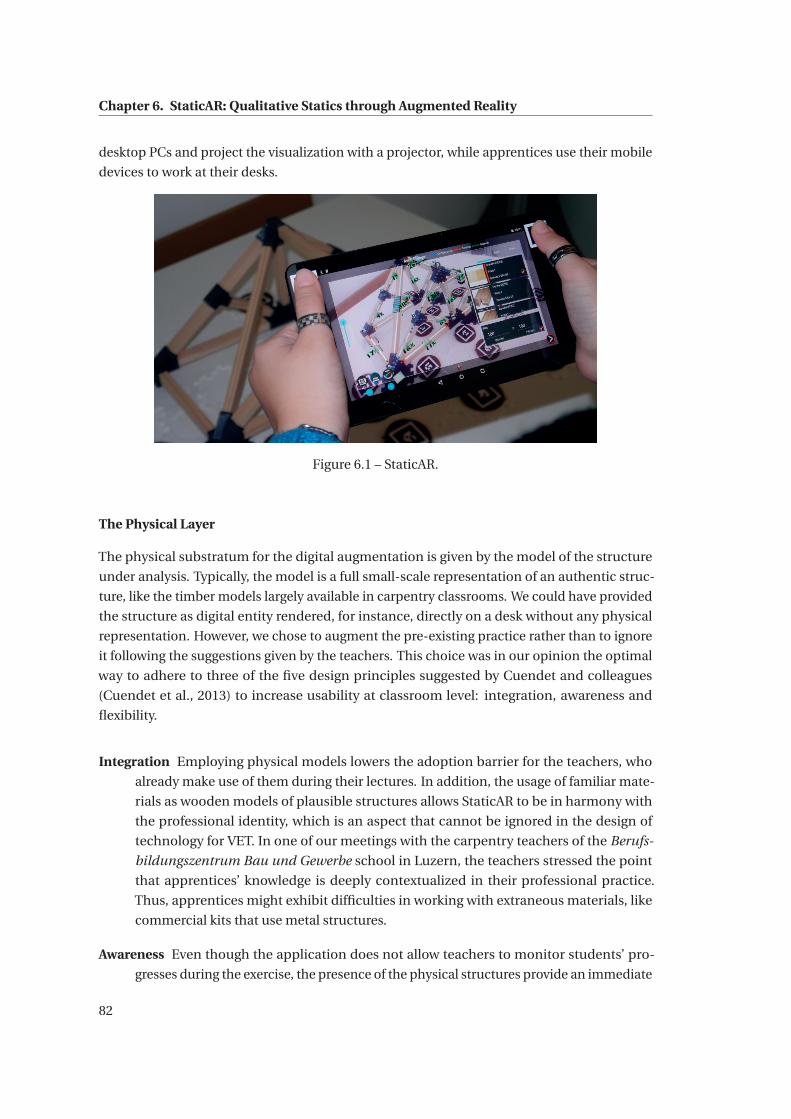
Chapter 6. StaticAR: Qualitative Statics through Augmented Reality
desktop PCs and project the visualization with a projector, while apprentices use their mobile
devices to work at their desks.
Figure 6.1 – StaticAR.
The Physical Layer
The physical substratum for the digital augmentation is given by the model of the structure
under analysis. Typically, the model is a full small-scale representation of an authentic struc-
ture, like the timber models largely available in carpentry classrooms. We could have provided
the structure as digital entity rendered, for instance, directly on a desk without any physical
representation. However, we chose to augment the pre-existing practice rather than to ignore
it following the suggestions given by the teachers. This choice was in our opinion the optimal
way to adhere to three of the five design principles suggested by Cuendet and colleagues
(Cuendet et al., 2013) to increase usability at classroom level: integration, awareness and
flexibility.
Integration Employing physical models lowers the adoption barrier for the teachers, who
already make use of them during their lectures. In addition, the usage of familiar mate-
rials as wooden models of plausible structures allows StaticAR to be in harmony with
the professional identity, which is an aspect that cannot be ignored in the design of
technology for VET. In one of our meetings with the carpentry teachers of the Berufs-
bildungszentrum Bau und Gewerbe school in Luzern, the teachers stressed the point
that apprentices’ knowledge is deeply contextualized in their professional practice.
Thus, apprentices might exhibit difficulties in working with extraneous materials, like
commercial kits that use metal structures.
Awareness Even though the application does not allow teachers to monitor students’ pro-
gresses during the exercise, the presence of the physical structures provide an immediate
82
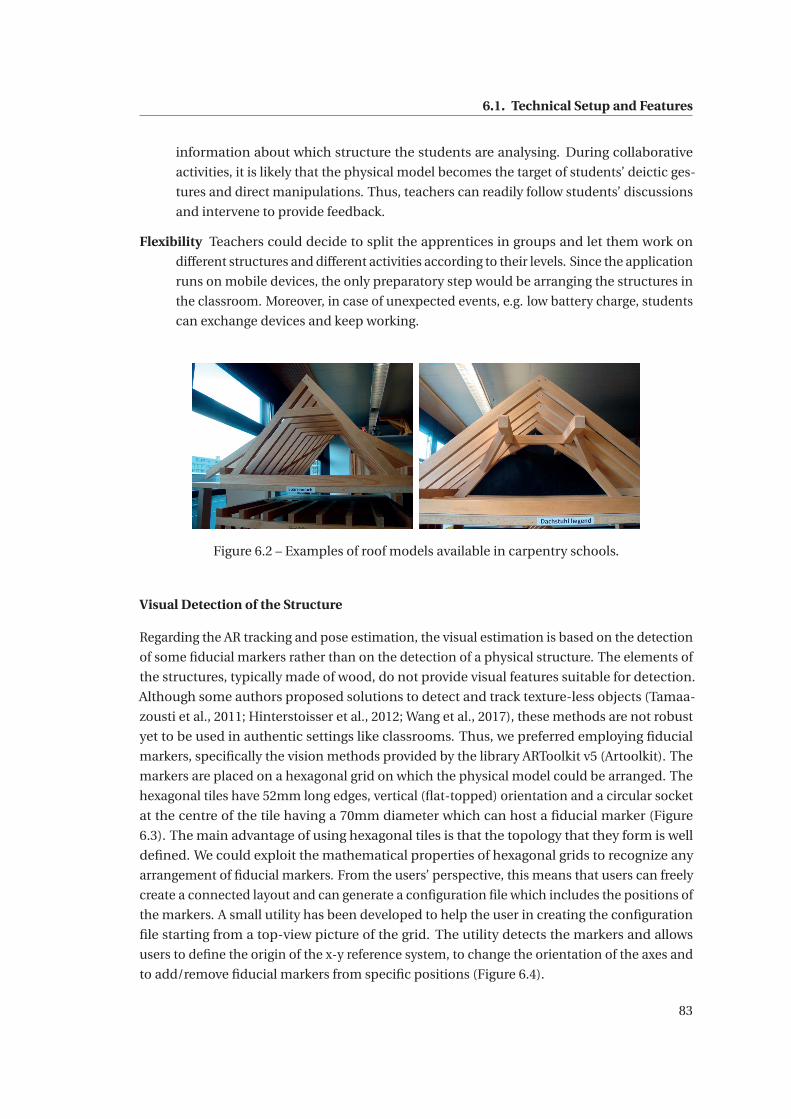
6.1. Technical Setup and Features
information about which structure the students are analysing. During collaborative
activities, it is likely that the physical model becomes the target of students’ deictic ges-
tures and direct manipulations. Thus, teachers can readily follow students’ discussions
and intervene to provide feedback.
Flexibility Teachers could decide to split the apprentices in groups and let them work on
different structures and different activities according to their levels. Since the application
runs on mobile devices, the only preparatory step would be arranging the structures in
the classroom. Moreover, in case of unexpected events, e.g. low battery charge, students
can exchange devices and keep working.
Figure 6.2 – Examples of roof models available in carpentry schools.
Visual Detection of the Structure
Regarding the AR tracking and pose estimation, the visual estimation is based on the detection
of some fiducial markers rather than on the detection of a physical structure. The elements of
the structures, typically made of wood, do not provide visual features suitable for detection.
Although some authors proposed solutions to detect and track texture-less objects (Tamaa-
zousti et al., 2011; Hinterstoisser et al., 2012; Wang et al., 2017), these methods are not robust
yet to be used in authentic settings like classrooms. Thus, we preferred employing fiducial
markers, specifically the vision methods provided by the library ARToolkit v5 (Artoolkit). The
markers are placed on a hexagonal grid on which the physical model could be arranged. The
hexagonal tiles have 52mm long edges, vertical (flat-topped) orientation and a circular socket
at the centre of the tile having a 70mm diameter which can host a fiducial marker (Figure
6.3). The main advantage of using hexagonal tiles is that the topology that they form is well
defined. We could exploit the mathematical properties of hexagonal grids to recognize any
arrangement of fiducial markers. From the users’ perspective, this means that users can freely
create a connected layout and can generate a configuration file which includes the positions of
the markers. A small utility has been developed to help the user in creating the configuration
file starting from a top-view picture of the grid. The utility detects the markers and allows
users to define the origin of the x-y reference system, to change the orientation of the axes and
to add/remove fiducial markers from specific positions (Figure 6.4).
83
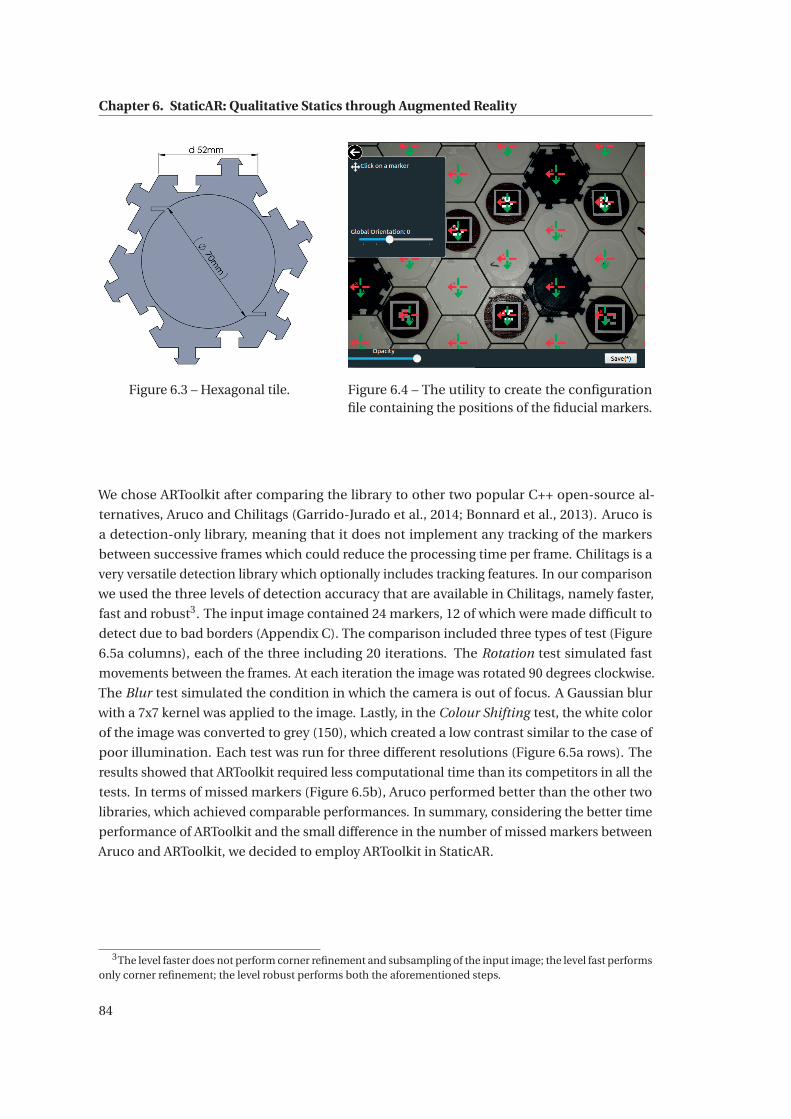
Chapter 6. StaticAR: Qualitative Statics through Augmented Reality
Figure 6.3 – Hexagonal tile. Figure 6.4 – The utility to create the configurationfile containing the positions of the fiducial markers.
We chose ARToolkit after comparing the library to other two popular C++ open-source al-
ternatives, Aruco and Chilitags (Garrido-Jurado et al., 2014; Bonnard et al., 2013). Aruco is
a detection-only library, meaning that it does not implement any tracking of the markers
between successive frames which could reduce the processing time per frame. Chilitags is a
very versatile detection library which optionally includes tracking features. In our comparison
we used the three levels of detection accuracy that are available in Chilitags, namely faster,
fast and robust3. The input image contained 24 markers, 12 of which were made difficult to
detect due to bad borders (Appendix C). The comparison included three types of test (Figure
6.5a columns), each of the three including 20 iterations. The Rotation test simulated fast
movements between the frames. At each iteration the image was rotated 90 degrees clockwise.
The Blur test simulated the condition in which the camera is out of focus. A Gaussian blur
with a 7x7 kernel was applied to the image. Lastly, in the Colour Shifting test, the white color
of the image was converted to grey (150), which created a low contrast similar to the case of
poor illumination. Each test was run for three different resolutions (Figure 6.5a rows). The
results showed that ARToolkit required less computational time than its competitors in all the
tests. In terms of missed markers (Figure 6.5b), Aruco performed better than the other two
libraries, which achieved comparable performances. In summary, considering the better time
performance of ARToolkit and the small difference in the number of missed markers between
Aruco and ARToolkit, we decided to employ ARToolkit in StaticAR.
3The level faster does not perform corner refinement and subsampling of the input image; the level fast performsonly corner refinement; the level robust performs both the aforementioned steps.
84
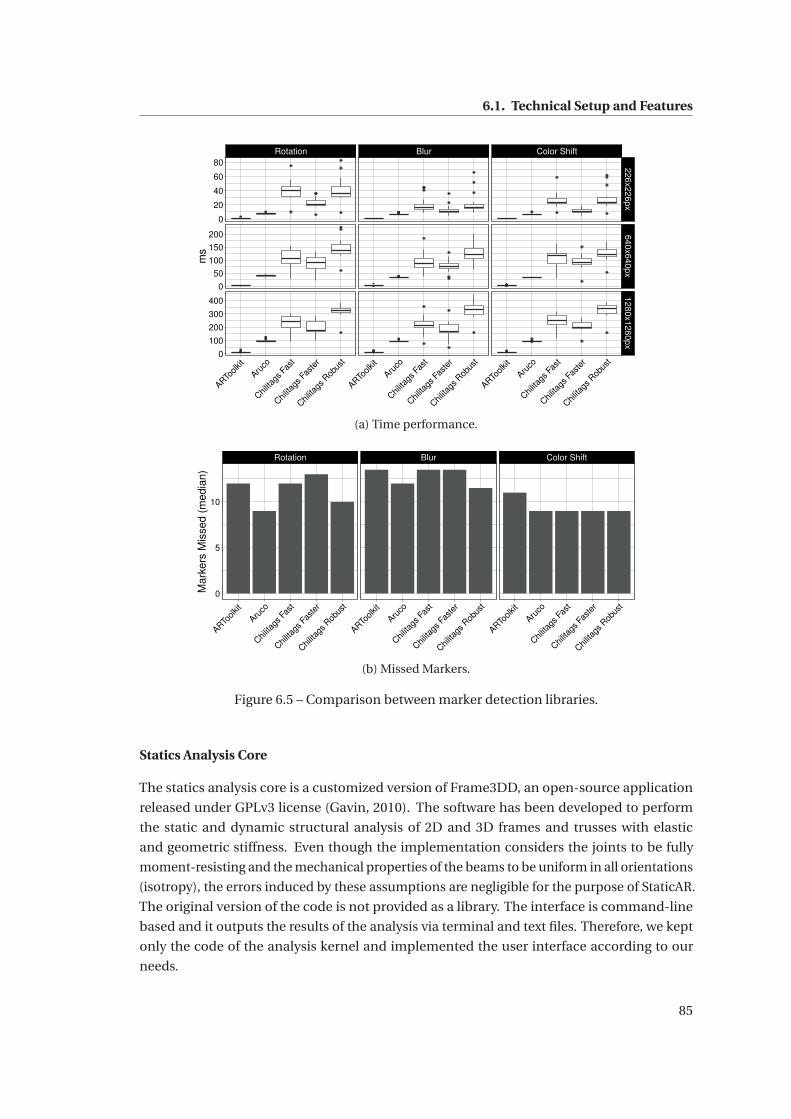
6.1. Technical Setup and Features
Rotation Blur Color Shift226x226px
640x640px1280x1280px
ARToolk
it
Aruco
Chilita
gs F
ast
Chilita
gs F
aste
r
Chilita
gs R
obus
t
ARToolk
it
Aruco
Chilita
gs F
ast
Chilita
gs F
aste
r
Chilita
gs R
obus
t
ARToolk
it
Aruco
Chilita
gs F
ast
Chilita
gs F
aste
r
Chilita
gs R
obus
t
0
20
40
60
80
0
50
100
150
200
0
100
200
300
400
ms
(a) Time performance.
Rotation Blur Color Shift
ARToolk
it
Aruco
Chilita
gs F
ast
Chilita
gs F
aste
r
Chilita
gs R
obus
t
ARToolk
it
Aruco
Chilita
gs F
ast
Chilita
gs F
aste
r
Chilita
gs R
obus
t
ARToolk
it
Aruco
Chilita
gs F
ast
Chilita
gs F
aste
r
Chilita
gs R
obus
t0
5
10
Mar
kers
Mis
sed
(med
ian)
(b) Missed Markers.
Figure 6.5 – Comparison between marker detection libraries.
Statics Analysis Core
The statics analysis core is a customized version of Frame3DD, an open-source application
released under GPLv3 license (Gavin, 2010). The software has been developed to perform
the static and dynamic structural analysis of 2D and 3D frames and trusses with elastic
and geometric stiffness. Even though the implementation considers the joints to be fully
moment-resisting and the mechanical properties of the beams to be uniform in all orientations
(isotropy), the errors induced by these assumptions are negligible for the purpose of StaticAR.
The original version of the code is not provided as a library. The interface is command-line
based and it outputs the results of the analysis via terminal and text files. Therefore, we kept
only the code of the analysis kernel and implemented the user interface according to our
needs.
85
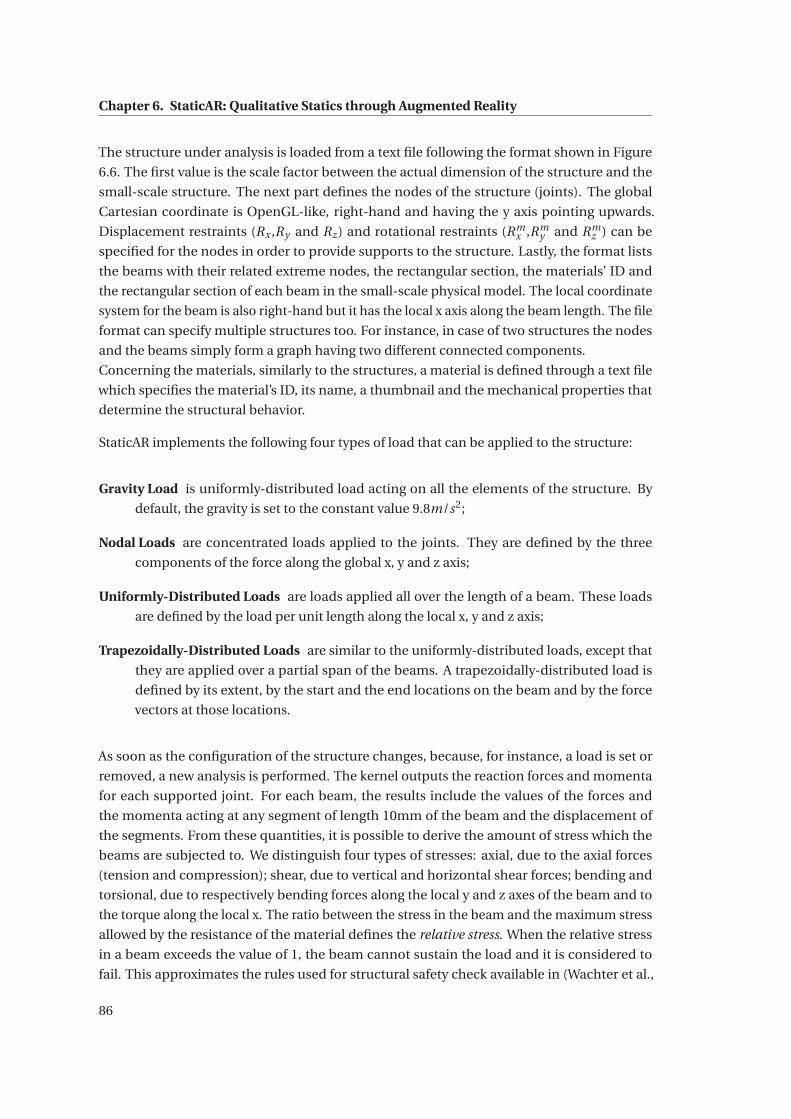
Chapter 6. StaticAR: Qualitative Statics through Augmented Reality
The structure under analysis is loaded from a text file following the format shown in Figure
6.6. The first value is the scale factor between the actual dimension of the structure and the
small-scale structure. The next part defines the nodes of the structure (joints). The global
Cartesian coordinate is OpenGL-like, right-hand and having the y axis pointing upwards.
Displacement restraints (Rx ,Ry and Rz) and rotational restraints (Rmx ,Rm
y and Rmz ) can be
specified for the nodes in order to provide supports to the structure. Lastly, the format lists
the beams with their related extreme nodes, the rectangular section, the materials’ ID and
the rectangular section of each beam in the small-scale physical model. The local coordinate
system for the beam is also right-hand but it has the local x axis along the beam length. The file
format can specify multiple structures too. For instance, in case of two structures the nodes
and the beams simply form a graph having two different connected components.
Concerning the materials, similarly to the structures, a material is defined through a text file
which specifies the material’s ID, its name, a thumbnail and the mechanical properties that
determine the structural behavior.
StaticAR implements the following four types of load that can be applied to the structure:
Gravity Load is uniformly-distributed load acting on all the elements of the structure. By
default, the gravity is set to the constant value 9.8m/s2;
Nodal Loads are concentrated loads applied to the joints. They are defined by the three
components of the force along the global x, y and z axis;
Uniformly-Distributed Loads are loads applied all over the length of a beam. These loads
are defined by the load per unit length along the local x, y and z axis;
Trapezoidally-Distributed Loads are similar to the uniformly-distributed loads, except that
they are applied over a partial span of the beams. A trapezoidally-distributed load is
defined by its extent, by the start and the end locations on the beam and by the force
vectors at those locations.
As soon as the configuration of the structure changes, because, for instance, a load is set or
removed, a new analysis is performed. The kernel outputs the reaction forces and momenta
for each supported joint. For each beam, the results include the values of the forces and
the momenta acting at any segment of length 10mm of the beam and the displacement of
the segments. From these quantities, it is possible to derive the amount of stress which the
beams are subjected to. We distinguish four types of stresses: axial, due to the axial forces
(tension and compression); shear, due to vertical and horizontal shear forces; bending and
torsional, due to respectively bending forces along the local y and z axes of the beam and to
the torque along the local x. The ratio between the stress in the beam and the maximum stress
allowed by the resistance of the material defines the relative stress. When the relative stress
in a beam exceeds the value of 1, the beam cannot sustain the load and it is considered to
fail. This approximates the rules used for structural safety check available in (Wachter et al.,
86
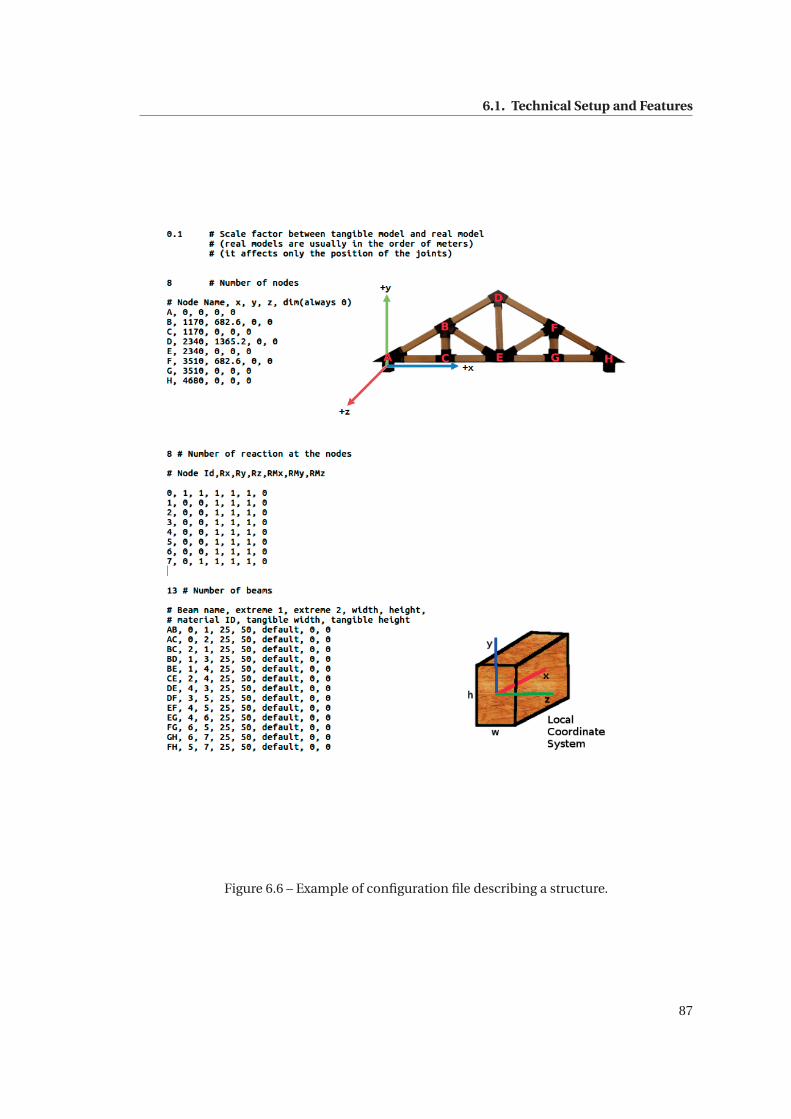
6.1. Technical Setup and Features
Figure 6.6 – Example of configuration file describing a structure.
87
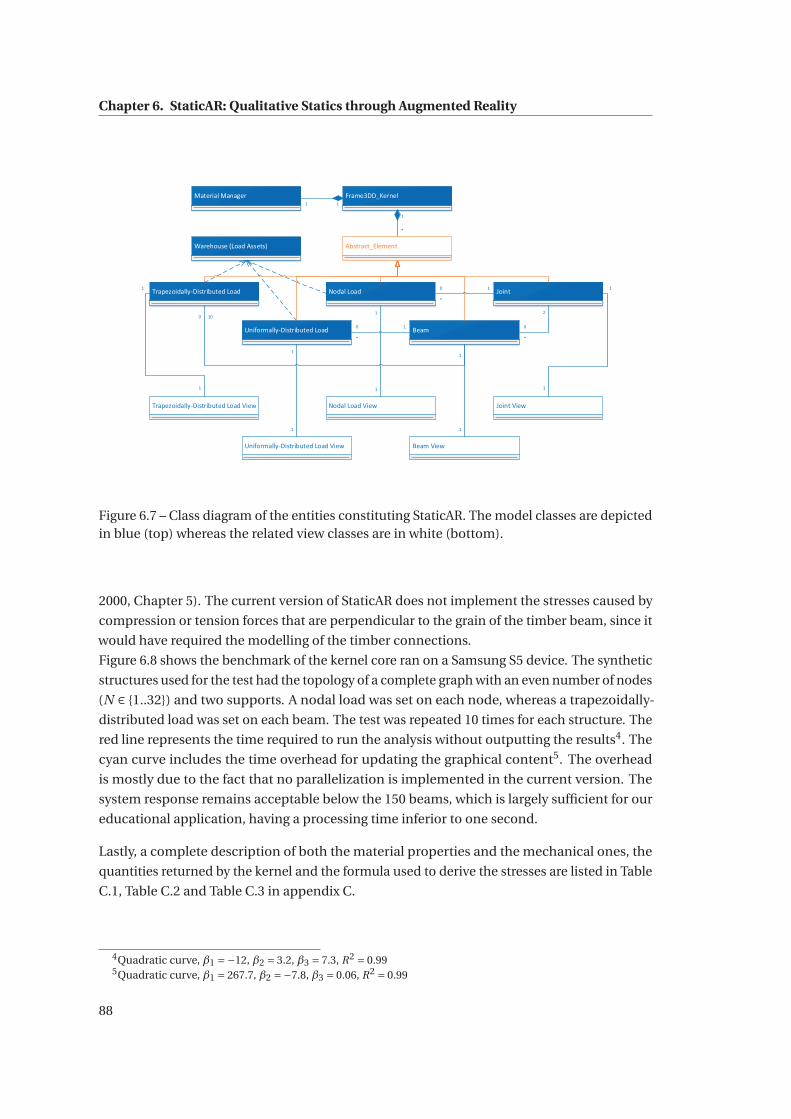
Chapter 6. StaticAR: Qualitative Statics through Augmented Reality
Frame3DD_KernelMaterial Manager
Beam
Trapezoidally-Distributed Load
Uniformally-Distributed Load
Nodal Load
11
Abstract_Element
1
*
Warehouse (Load Assets)
Joint0
*
1
0
*
1
100
1
0
*
2
Joint View
Beam View
Nodal Load View
Uniformally-Distributed Load View
Trapezoidally-Distributed Load View
1
1
1
1
1
1
1
1
1
Figure 6.7 – Class diagram of the entities constituting StaticAR. The model classes are depictedin blue (top) whereas the related view classes are in white (bottom).
2000, Chapter 5). The current version of StaticAR does not implement the stresses caused by
compression or tension forces that are perpendicular to the grain of the timber beam, since it
would have required the modelling of the timber connections.
Figure 6.8 shows the benchmark of the kernel core ran on a Samsung S5 device. The synthetic
structures used for the test had the topology of a complete graph with an even number of nodes
(N ∈ {1..32}) and two supports. A nodal load was set on each node, whereas a trapezoidally-
distributed load was set on each beam. The test was repeated 10 times for each structure. The
red line represents the time required to run the analysis without outputting the results4. The
cyan curve includes the time overhead for updating the graphical content5. The overhead
is mostly due to the fact that no parallelization is implemented in the current version. The
system response remains acceptable below the 150 beams, which is largely sufficient for our
educational application, having a processing time inferior to one second.
Lastly, a complete description of both the material properties and the mechanical ones, the
quantities returned by the kernel and the formula used to derive the stresses are listed in Table
C.1, Table C.2 and Table C.3 in appendix C.
4Quadratic curve, β1 =−12, β2 = 3.2, β3 = 7.3, R2 = 0.995Quadratic curve, β1 = 267.7, β2 =−7.8, β3 = 0.06, R2 = 0.99
88
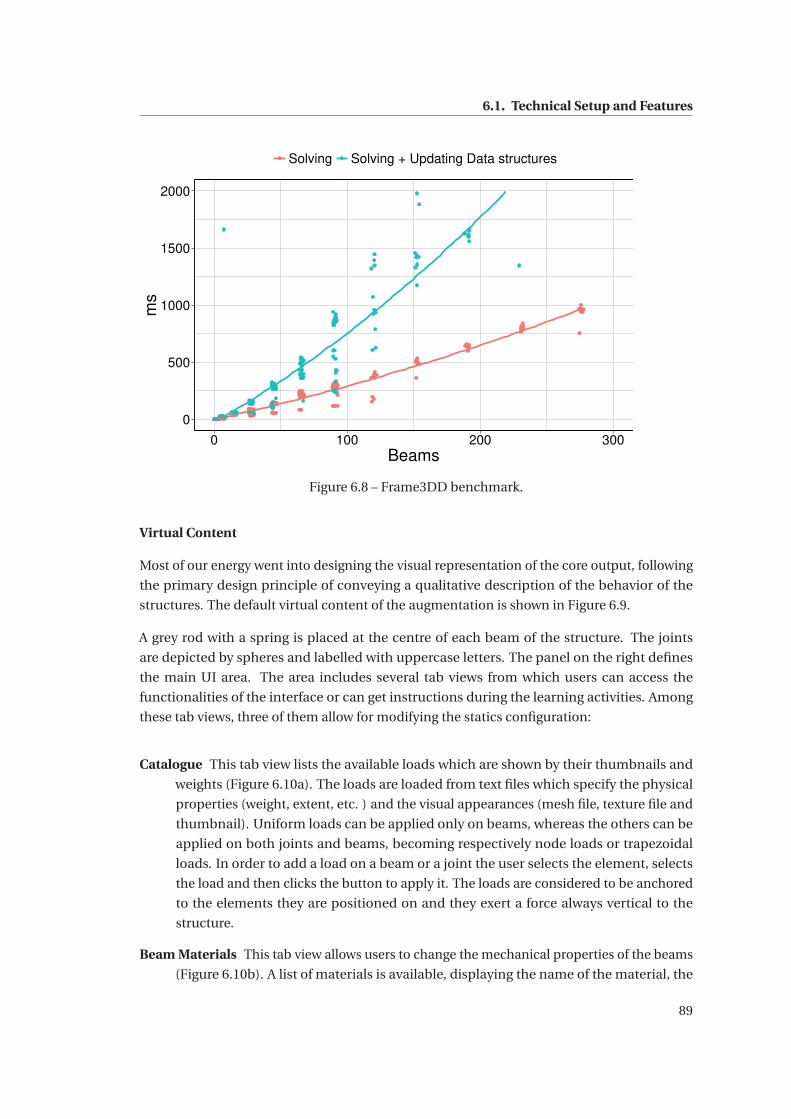
6.1. Technical Setup and Features
0
500
1000
1500
2000
0 100 200 300Beams
ms
Solving Solving + Updating Data structures
Figure 6.8 – Frame3DD benchmark.
Virtual Content
Most of our energy went into designing the visual representation of the core output, following
the primary design principle of conveying a qualitative description of the behavior of the
structures. The default virtual content of the augmentation is shown in Figure 6.9.
A grey rod with a spring is placed at the centre of each beam of the structure. The joints
are depicted by spheres and labelled with uppercase letters. The panel on the right defines
the main UI area. The area includes several tab views from which users can access the
functionalities of the interface or can get instructions during the learning activities. Among
these tab views, three of them allow for modifying the statics configuration:
Catalogue This tab view lists the available loads which are shown by their thumbnails and
weights (Figure 6.10a). The loads are loaded from text files which specify the physical
properties (weight, extent, etc. ) and the visual appearances (mesh file, texture file and
thumbnail). Uniform loads can be applied only on beams, whereas the others can be
applied on both joints and beams, becoming respectively node loads or trapezoidal
loads. In order to add a load on a beam or a joint the user selects the element, selects
the load and then clicks the button to apply it. The loads are considered to be anchored
to the elements they are positioned on and they exert a force always vertical to the
structure.
Beam Materials This tab view allows users to change the mechanical properties of the beams
(Figure 6.10b). A list of materials is available, displaying the name of the material, the
89
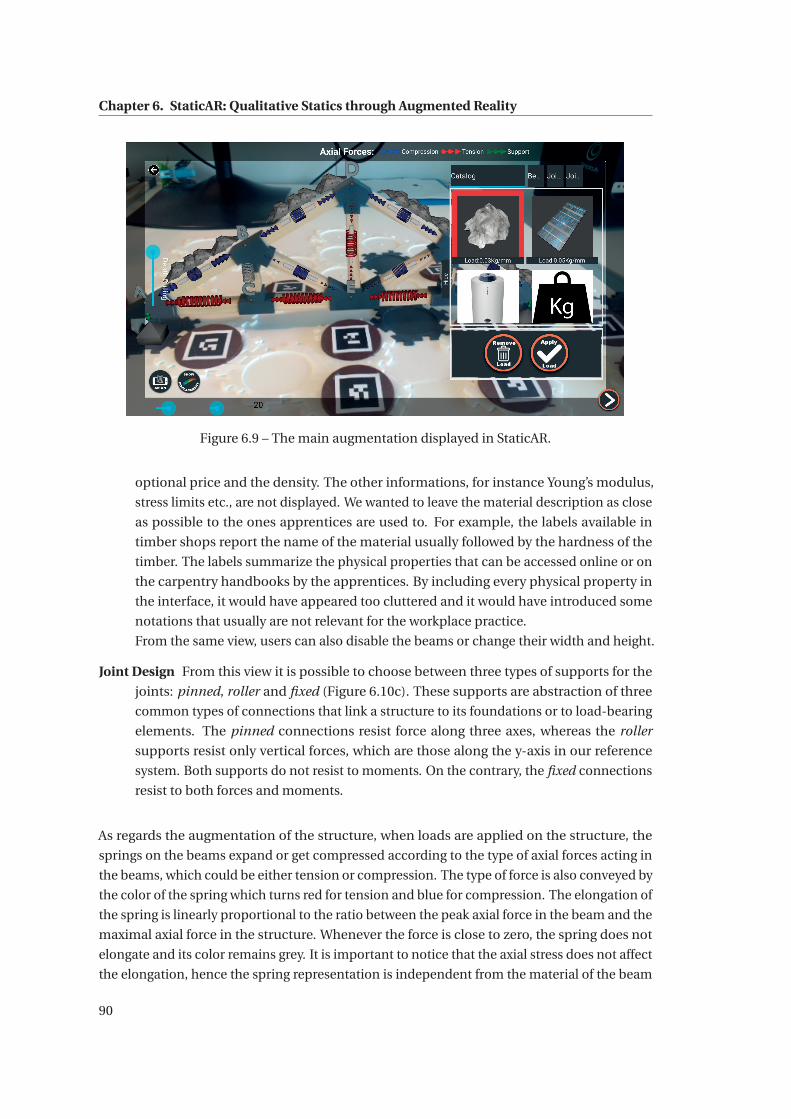
Chapter 6. StaticAR: Qualitative Statics through Augmented Reality
Figure 6.9 – The main augmentation displayed in StaticAR.
optional price and the density. The other informations, for instance Young’s modulus,
stress limits etc., are not displayed. We wanted to leave the material description as close
as possible to the ones apprentices are used to. For example, the labels available in
timber shops report the name of the material usually followed by the hardness of the
timber. The labels summarize the physical properties that can be accessed online or on
the carpentry handbooks by the apprentices. By including every physical property in
the interface, it would have appeared too cluttered and it would have introduced some
notations that usually are not relevant for the workplace practice.
From the same view, users can also disable the beams or change their width and height.
Joint Design From this view it is possible to choose between three types of supports for the
joints: pinned, roller and fixed (Figure 6.10c). These supports are abstraction of three
common types of connections that link a structure to its foundations or to load-bearing
elements. The pinned connections resist force along three axes, whereas the roller
supports resist only vertical forces, which are those along the y-axis in our reference
system. Both supports do not resist to moments. On the contrary, the fixed connections
resist to both forces and moments.
As regards the augmentation of the structure, when loads are applied on the structure, the
springs on the beams expand or get compressed according to the type of axial forces acting in
the beams, which could be either tension or compression. The type of force is also conveyed by
the color of the spring which turns red for tension and blue for compression. The elongation of
the spring is linearly proportional to the ratio between the peak axial force in the beam and the
maximal axial force in the structure. Whenever the force is close to zero, the spring does not
elongate and its color remains grey. It is important to notice that the axial stress does not affect
the elongation, hence the spring representation is independent from the material of the beam
90
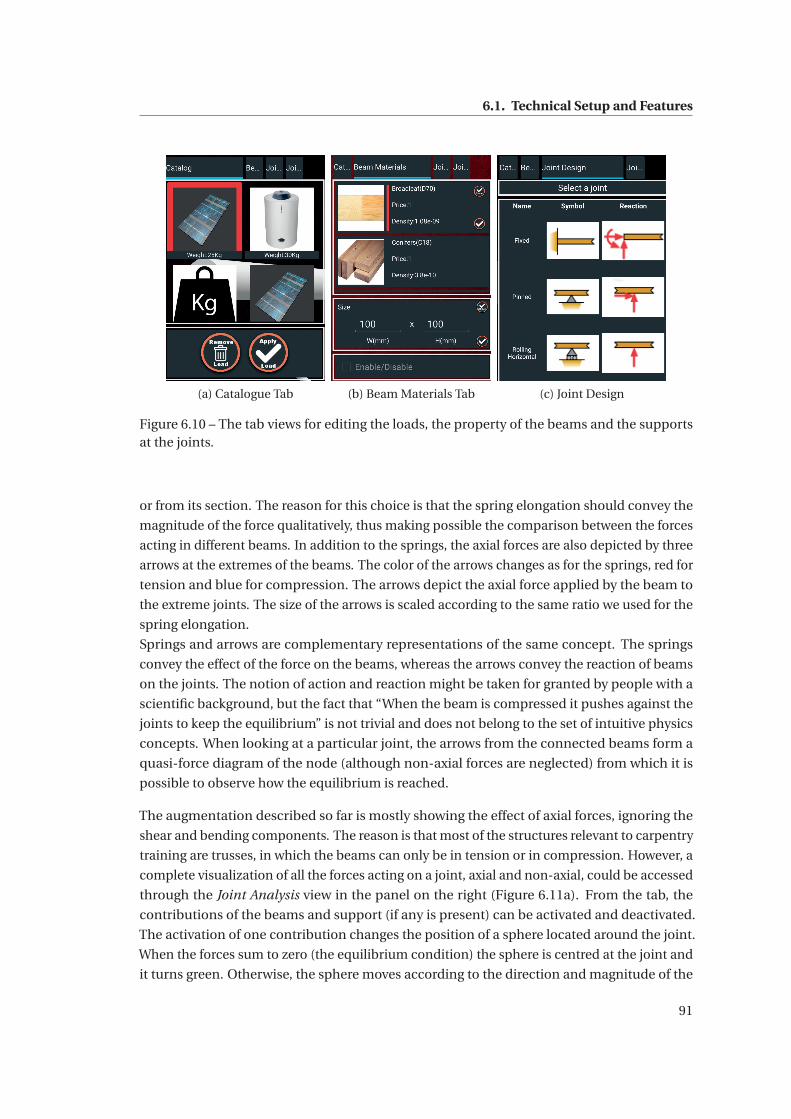
6.1. Technical Setup and Features
(a) Catalogue Tab (b) Beam Materials Tab (c) Joint Design
Figure 6.10 – The tab views for editing the loads, the property of the beams and the supportsat the joints.
or from its section. The reason for this choice is that the spring elongation should convey the
magnitude of the force qualitatively, thus making possible the comparison between the forces
acting in different beams. In addition to the springs, the axial forces are also depicted by three
arrows at the extremes of the beams. The color of the arrows changes as for the springs, red for
tension and blue for compression. The arrows depict the axial force applied by the beam to
the extreme joints. The size of the arrows is scaled according to the same ratio we used for the
spring elongation.
Springs and arrows are complementary representations of the same concept. The springs
convey the effect of the force on the beams, whereas the arrows convey the reaction of beams
on the joints. The notion of action and reaction might be taken for granted by people with a
scientific background, but the fact that “When the beam is compressed it pushes against the
joints to keep the equilibrium” is not trivial and does not belong to the set of intuitive physics
concepts. When looking at a particular joint, the arrows from the connected beams form a
quasi-force diagram of the node (although non-axial forces are neglected) from which it is
possible to observe how the equilibrium is reached.
The augmentation described so far is mostly showing the effect of axial forces, ignoring the
shear and bending components. The reason is that most of the structures relevant to carpentry
training are trusses, in which the beams can only be in tension or in compression. However, a
complete visualization of all the forces acting on a joint, axial and non-axial, could be accessed
through the Joint Analysis view in the panel on the right (Figure 6.11a). From the tab, the
contributions of the beams and support (if any is present) can be activated and deactivated.
The activation of one contribution changes the position of a sphere located around the joint.
When the forces sum to zero (the equilibrium condition) the sphere is centred at the joint and
it turns green. Otherwise, the sphere moves according to the direction and magnitude of the
91
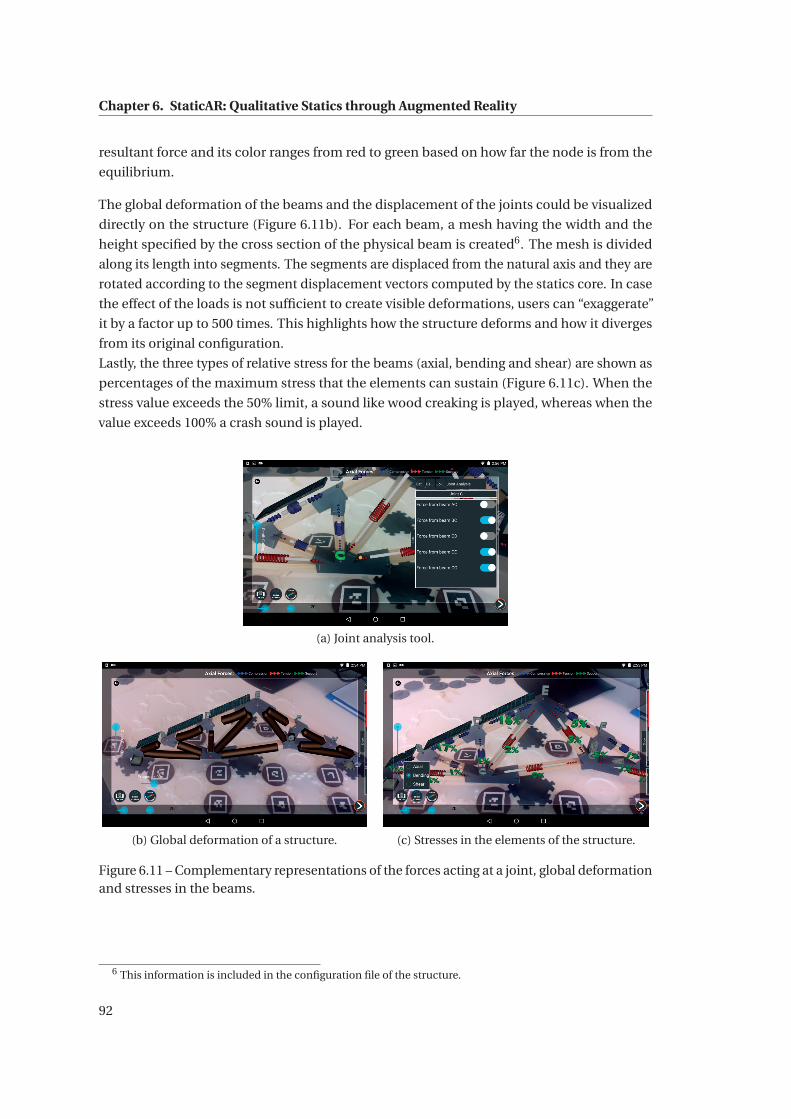
Chapter 6. StaticAR: Qualitative Statics through Augmented Reality
resultant force and its color ranges from red to green based on how far the node is from the
equilibrium.
The global deformation of the beams and the displacement of the joints could be visualized
directly on the structure (Figure 6.11b). For each beam, a mesh having the width and the
height specified by the cross section of the physical beam is created6. The mesh is divided
along its length into segments. The segments are displaced from the natural axis and they are
rotated according to the segment displacement vectors computed by the statics core. In case
the effect of the loads is not sufficient to create visible deformations, users can “exaggerate”
it by a factor up to 500 times. This highlights how the structure deforms and how it diverges
from its original configuration.
Lastly, the three types of relative stress for the beams (axial, bending and shear) are shown as
percentages of the maximum stress that the elements can sustain (Figure 6.11c). When the
stress value exceeds the 50% limit, a sound like wood creaking is played, whereas when the
value exceeds 100% a crash sound is played.
(a) Joint analysis tool.
(b) Global deformation of a structure. (c) Stresses in the elements of the structure.
Figure 6.11 – Complementary representations of the forces acting at a joint, global deformationand stresses in the beams.
6 This information is included in the configuration file of the structure.
92
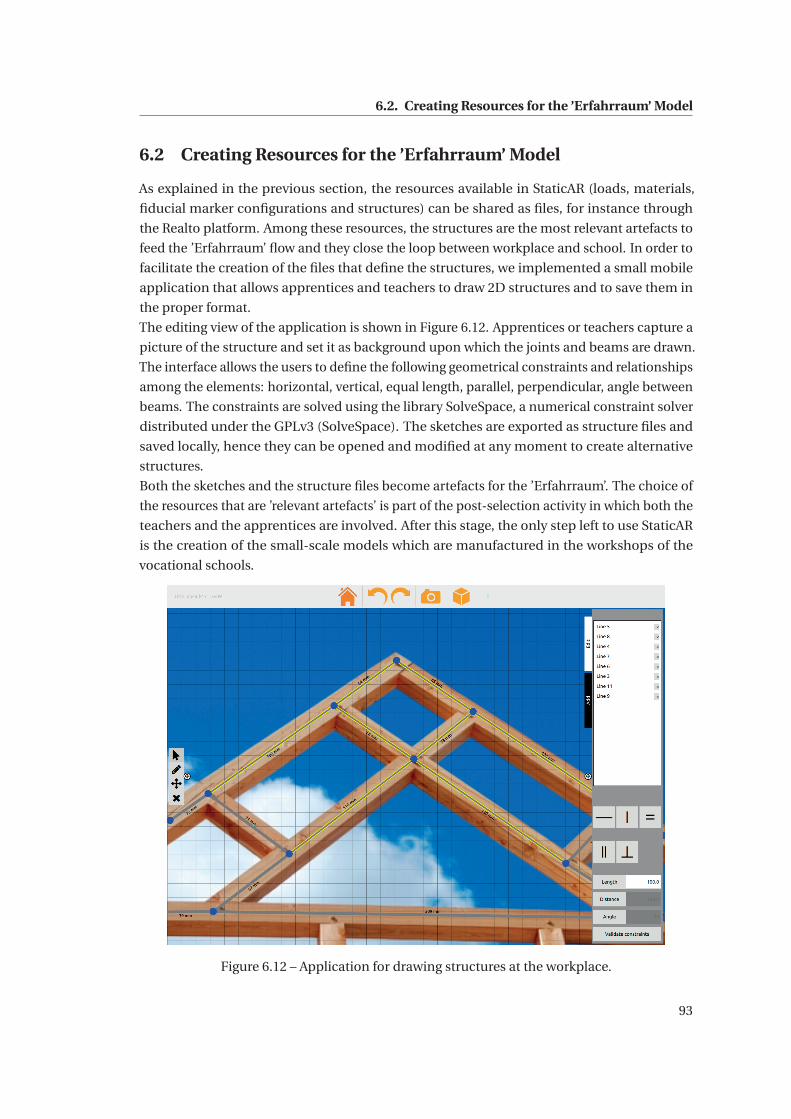
6.2. Creating Resources for the ’Erfahrraum’ Model
6.2 Creating Resources for the ’Erfahrraum’ Model
As explained in the previous section, the resources available in StaticAR (loads, materials,
fiducial marker configurations and structures) can be shared as files, for instance through
the Realto platform. Among these resources, the structures are the most relevant artefacts to
feed the ’Erfahrraum’ flow and they close the loop between workplace and school. In order to
facilitate the creation of the files that define the structures, we implemented a small mobile
application that allows apprentices and teachers to draw 2D structures and to save them in
the proper format.
The editing view of the application is shown in Figure 6.12. Apprentices or teachers capture a
picture of the structure and set it as background upon which the joints and beams are drawn.
The interface allows the users to define the following geometrical constraints and relationships
among the elements: horizontal, vertical, equal length, parallel, perpendicular, angle between
beams. The constraints are solved using the library SolveSpace, a numerical constraint solver
distributed under the GPLv3 (SolveSpace). The sketches are exported as structure files and
saved locally, hence they can be opened and modified at any moment to create alternative
structures.
Both the sketches and the structure files become artefacts for the ’Erfahrraum’. The choice of
the resources that are ’relevant artefacts’ is part of the post-selection activity in which both the
teachers and the apprentices are involved. After this stage, the only step left to use StaticAR
is the creation of the small-scale models which are manufactured in the workshops of the
vocational schools.
Figure 6.12 – Application for drawing structures at the workplace.
93
Chapter 6. StaticAR: Qualitative Statics through Augmented Reality
6.3 Conclusions
This chapter has described StaticAR and the way we implemented the ’Erfahrraum’ by using it.
The goal of the chapter was to describe the details of the implementation and the available
features as they are in the last version of the application. The application has been used in
the two experiments that are presented in the following chapters. The first study investigated
the role of shifting the visual attention between the physical realm (small-scale models) and
the digital one. The last study concerned the representations of the forces through springs
and arrows. It focused on how the two representations support the emergence of a qualitative
understanding of the principles of statics. In both studies, the interface of the application
presented some differences compared to the version presented so far. Each chapter will
describe these differences and how the experimental activities were implemented.
94
7 Study III: Shifting the Gaze Betweenthe Physical Object and Its DigitalRepresentation7.1 Introduction
In the previous chapter, the presence of a physical structure as substratum for the digital
augmentation was motivated as a way to integrate StaticAR almost seamlessly in the carpentry
classrooms. Nevertheless, the reader might have noticed that the physical structure is not
functional to the interaction with the AR system. None of the actions available in StaticAR were
triggered by gesture interaction or tangible controls and, furthermore, the pose estimation
was performed by tracking the hexagonal grid rather than the actual structure. The interaction
through the device is common in handheld magic-lens systems, in which real-world objects
are considered to be the background upon which the virtual content is overlaid and the user’s
attention is focused on the device rather than on the target object of the augmentation. If the
interaction does not involve the direct physical manipulation of that specific target object, it is
a fair assumption that such object could be replaced by a high-fidelity digital rendering. What
is the added value of having a real object fully matching its digital representation? A way to
investigate the role of the physical layer per-se, not just as background for the augmentation,
is to look at the moments when the users look directly at the physical layer and bypass the
screen instead of looking through it. This chapter presents an eye-tracking study centred on
the occurrence of the shifts of visual focus from the augmenting device to the physical reality.
The experimental task consisted in solving qualitative problems about the statics of structures
through visual inspection by using StaticAR. The nature of this study was exploratory, since
very few quantitative works explored the factors influencing the shift of attention between
the physical and digital realms. To some extent the point in question recalls the physical
correspondence dimension that was the focus of our first study. However, differently from the
TUI setup presented in that study, in the magic-lens interaction the physical layer does not act
as UI control. In order to give sense of the research hypotheses driving the following study, this
chapter begins with a review of the related works from which the hypotheses were derived.
95
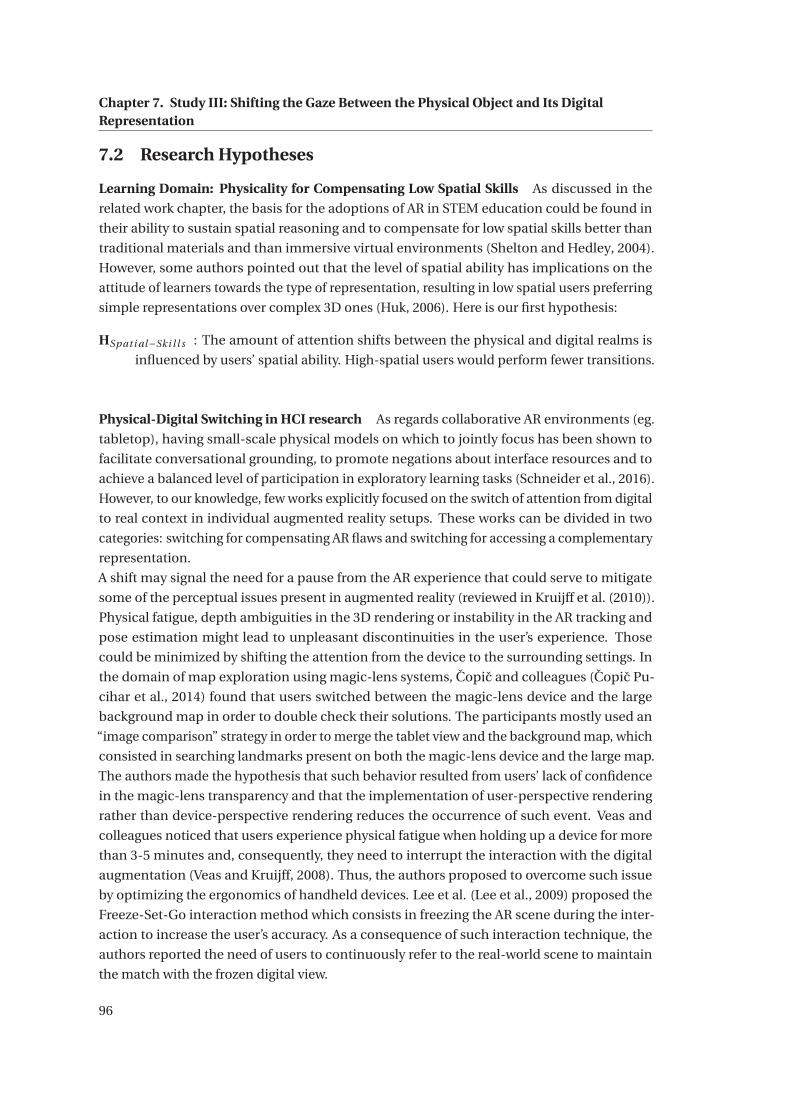
Chapter 7. Study III: Shifting the Gaze Between the Physical Object and Its DigitalRepresentation
7.2 Research Hypotheses
Learning Domain: Physicality for Compensating Low Spatial Skills As discussed in the
related work chapter, the basis for the adoptions of AR in STEM education could be found in
their ability to sustain spatial reasoning and to compensate for low spatial skills better than
traditional materials and than immersive virtual environments (Shelton and Hedley, 2004).
However, some authors pointed out that the level of spatial ability has implications on the
attitude of learners towards the type of representation, resulting in low spatial users preferring
simple representations over complex 3D ones (Huk, 2006). Here is our first hypothesis:
HSpati al−Ski l l s : The amount of attention shifts between the physical and digital realms is
influenced by users’ spatial ability. High-spatial users would perform fewer transitions.
Physical-Digital Switching in HCI research As regards collaborative AR environments (eg.
tabletop), having small-scale physical models on which to jointly focus has been shown to
facilitate conversational grounding, to promote negations about interface resources and to
achieve a balanced level of participation in exploratory learning tasks (Schneider et al., 2016).
However, to our knowledge, few works explicitly focused on the switch of attention from digital
to real context in individual augmented reality setups. These works can be divided in two
categories: switching for compensating AR flaws and switching for accessing a complementary
representation.
A shift may signal the need for a pause from the AR experience that could serve to mitigate
some of the perceptual issues present in augmented reality (reviewed in Kruijff et al. (2010)).
Physical fatigue, depth ambiguities in the 3D rendering or instability in the AR tracking and
pose estimation might lead to unpleasant discontinuities in the user’s experience. Those
could be minimized by shifting the attention from the device to the surrounding settings. In
the domain of map exploration using magic-lens systems, Copic and colleagues (Copic Pu-
cihar et al., 2014) found that users switched between the magic-lens device and the large
background map in order to double check their solutions. The participants mostly used an
“image comparison” strategy in order to merge the tablet view and the background map, which
consisted in searching landmarks present on both the magic-lens device and the large map.
The authors made the hypothesis that such behavior resulted from users’ lack of confidence
in the magic-lens transparency and that the implementation of user-perspective rendering
rather than device-perspective rendering reduces the occurrence of such event. Veas and
colleagues noticed that users experience physical fatigue when holding up a device for more
than 3-5 minutes and, consequently, they need to interrupt the interaction with the digital
augmentation (Veas and Kruijff, 2008). Thus, the authors proposed to overcome such issue
by optimizing the ergonomics of handheld devices. Lee et al. (Lee et al., 2009) proposed the
Freeze-Set-Go interaction method which consists in freezing the AR scene during the inter-
action to increase the user’s accuracy. As a consequence of such interaction technique, the
authors reported the need of users to continuously refer to the real-world scene to maintain
the match with the frozen digital view.
96
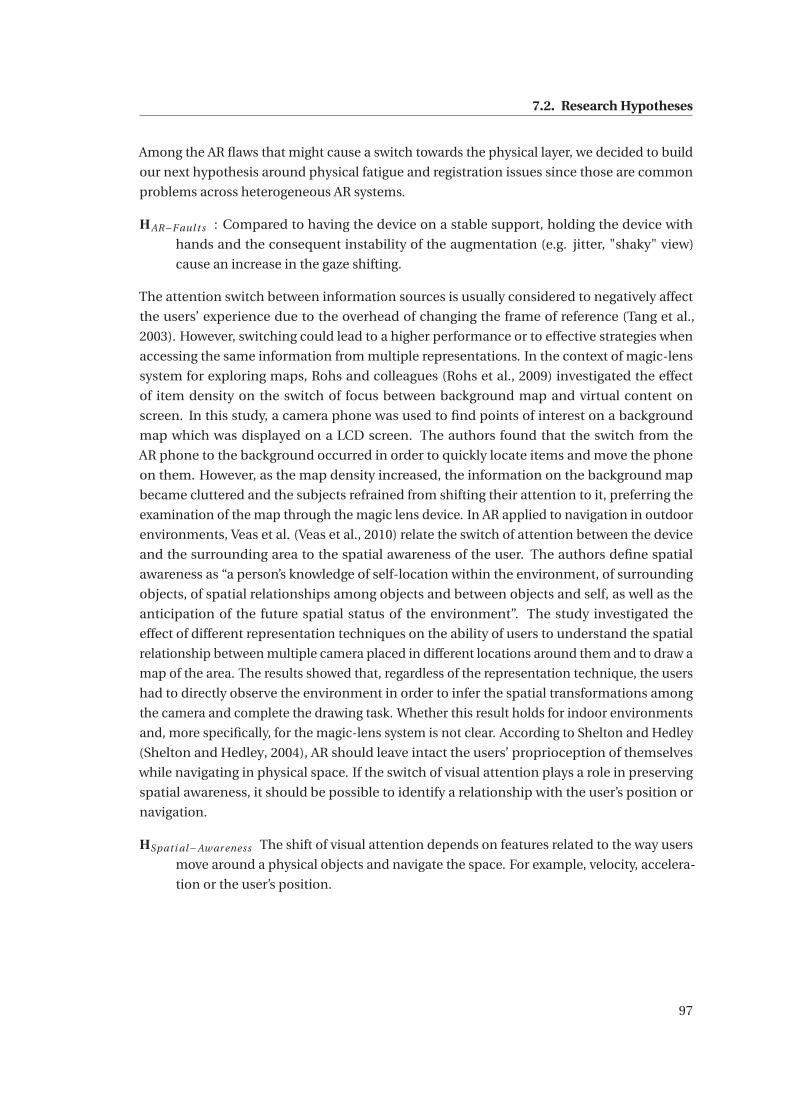
7.2. Research Hypotheses
Among the AR flaws that might cause a switch towards the physical layer, we decided to build
our next hypothesis around physical fatigue and registration issues since those are common
problems across heterogeneous AR systems.
HAR−F aul t s : Compared to having the device on a stable support, holding the device with
hands and the consequent instability of the augmentation (e.g. jitter, "shaky" view)
cause an increase in the gaze shifting.
The attention switch between information sources is usually considered to negatively affect
the users’ experience due to the overhead of changing the frame of reference (Tang et al.,
2003). However, switching could lead to a higher performance or to effective strategies when
accessing the same information from multiple representations. In the context of magic-lens
system for exploring maps, Rohs and colleagues (Rohs et al., 2009) investigated the effect
of item density on the switch of focus between background map and virtual content on
screen. In this study, a camera phone was used to find points of interest on a background
map which was displayed on a LCD screen. The authors found that the switch from the
AR phone to the background occurred in order to quickly locate items and move the phone
on them. However, as the map density increased, the information on the background map
became cluttered and the subjects refrained from shifting their attention to it, preferring the
examination of the map through the magic lens device. In AR applied to navigation in outdoor
environments, Veas et al. (Veas et al., 2010) relate the switch of attention between the device
and the surrounding area to the spatial awareness of the user. The authors define spatial
awareness as “a person’s knowledge of self-location within the environment, of surrounding
objects, of spatial relationships among objects and between objects and self, as well as the
anticipation of the future spatial status of the environment”. The study investigated the
effect of different representation techniques on the ability of users to understand the spatial
relationship between multiple camera placed in different locations around them and to draw a
map of the area. The results showed that, regardless of the representation technique, the users
had to directly observe the environment in order to infer the spatial transformations among
the camera and complete the drawing task. Whether this result holds for indoor environments
and, more specifically, for the magic-lens system is not clear. According to Shelton and Hedley
(Shelton and Hedley, 2004), AR should leave intact the users’ proprioception of themselves
while navigating in physical space. If the switch of visual attention plays a role in preserving
spatial awareness, it should be possible to identify a relationship with the user’s position or
navigation.
HSpati al−Aw ar eness The shift of visual attention depends on features related to the way users
move around a physical objects and navigate the space. For example, velocity, accelera-
tion or the user’s position.
97
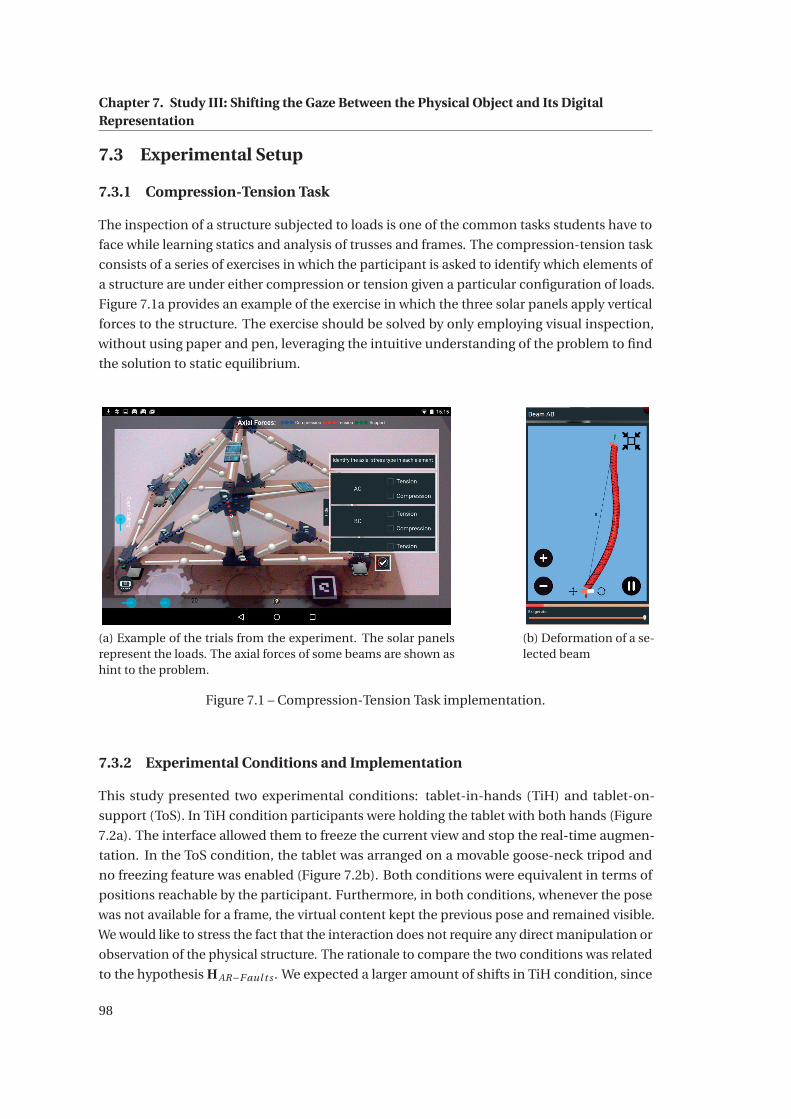
Chapter 7. Study III: Shifting the Gaze Between the Physical Object and Its DigitalRepresentation
7.3 Experimental Setup
7.3.1 Compression-Tension Task
The inspection of a structure subjected to loads is one of the common tasks students have to
face while learning statics and analysis of trusses and frames. The compression-tension task
consists of a series of exercises in which the participant is asked to identify which elements of
a structure are under either compression or tension given a particular configuration of loads.
Figure 7.1a provides an example of the exercise in which the three solar panels apply vertical
forces to the structure. The exercise should be solved by only employing visual inspection,
without using paper and pen, leveraging the intuitive understanding of the problem to find
the solution to static equilibrium.
(a) Example of the trials from the experiment. The solar panelsrepresent the loads. The axial forces of some beams are shown ashint to the problem.
(b) Deformation of a se-lected beam
Figure 7.1 – Compression-Tension Task implementation.
7.3.2 Experimental Conditions and Implementation
This study presented two experimental conditions: tablet-in-hands (TiH) and tablet-on-
support (ToS). In TiH condition participants were holding the tablet with both hands (Figure
7.2a). The interface allowed them to freeze the current view and stop the real-time augmen-
tation. In the ToS condition, the tablet was arranged on a movable goose-neck tripod and
no freezing feature was enabled (Figure 7.2b). Both conditions were equivalent in terms of
positions reachable by the participant. Furthermore, in both conditions, whenever the pose
was not available for a frame, the virtual content kept the previous pose and remained visible.
We would like to stress the fact that the interaction does not require any direct manipulation or
observation of the physical structure. The rationale to compare the two conditions was related
to the hypothesis HAR−F aul t s . We expected a larger amount of shifts in TiH condition, since
98
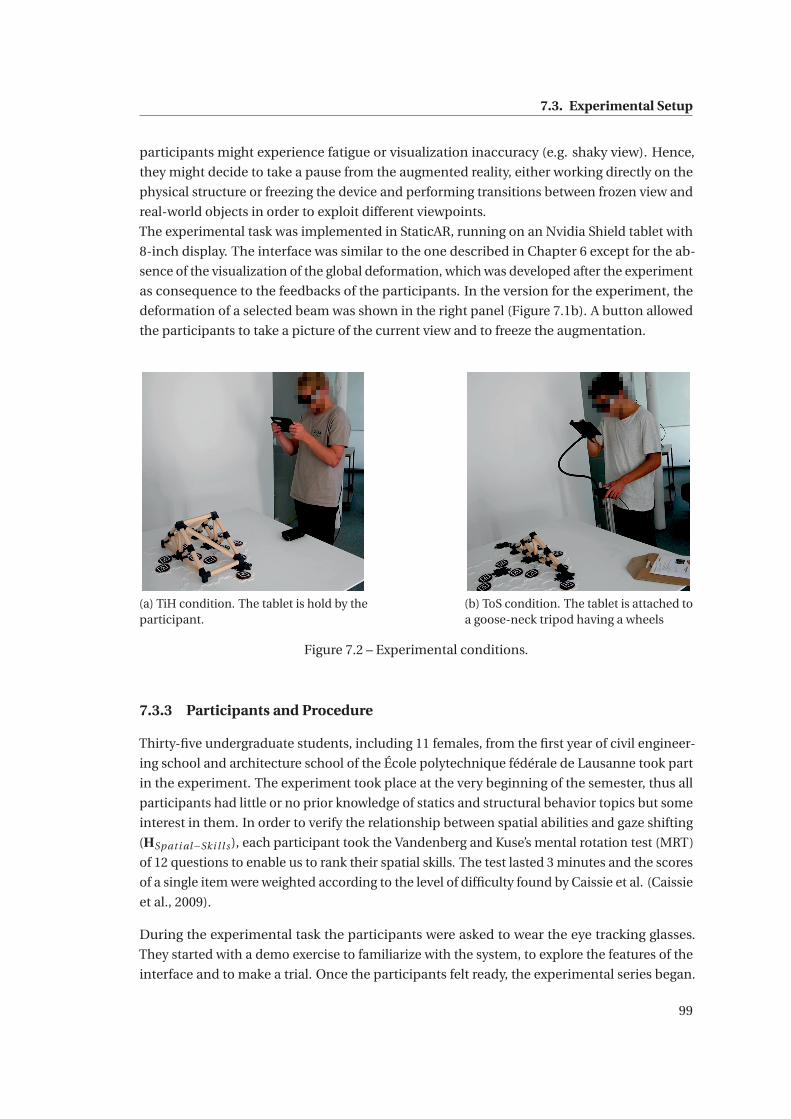
7.3. Experimental Setup
participants might experience fatigue or visualization inaccuracy (e.g. shaky view). Hence,
they might decide to take a pause from the augmented reality, either working directly on the
physical structure or freezing the device and performing transitions between frozen view and
real-world objects in order to exploit different viewpoints.
The experimental task was implemented in StaticAR, running on an Nvidia Shield tablet with
8-inch display. The interface was similar to the one described in Chapter 6 except for the ab-
sence of the visualization of the global deformation, which was developed after the experiment
as consequence to the feedbacks of the participants. In the version for the experiment, the
deformation of a selected beam was shown in the right panel (Figure 7.1b). A button allowed
the participants to take a picture of the current view and to freeze the augmentation.
(a) TiH condition. The tablet is hold by theparticipant.
(b) ToS condition. The tablet is attached toa goose-neck tripod having a wheels
Figure 7.2 – Experimental conditions.
7.3.3 Participants and Procedure
Thirty-five undergraduate students, including 11 females, from the first year of civil engineer-
ing school and architecture school of the École polytechnique fédérale de Lausanne took part
in the experiment. The experiment took place at the very beginning of the semester, thus all
participants had little or no prior knowledge of statics and structural behavior topics but some
interest in them. In order to verify the relationship between spatial abilities and gaze shifting
(HSpati al−Ski l l s), each participant took the Vandenberg and Kuse’s mental rotation test (MRT)
of 12 questions to enable us to rank their spatial skills. The test lasted 3 minutes and the scores
of a single item were weighted according to the level of difficulty found by Caissie et al. (Caissie
et al., 2009).
During the experimental task the participants were asked to wear the eye tracking glasses.
They started with a demo exercise to familiarize with the system, to explore the features of the
interface and to make a trial. Once the participants felt ready, the experimental series began.
99
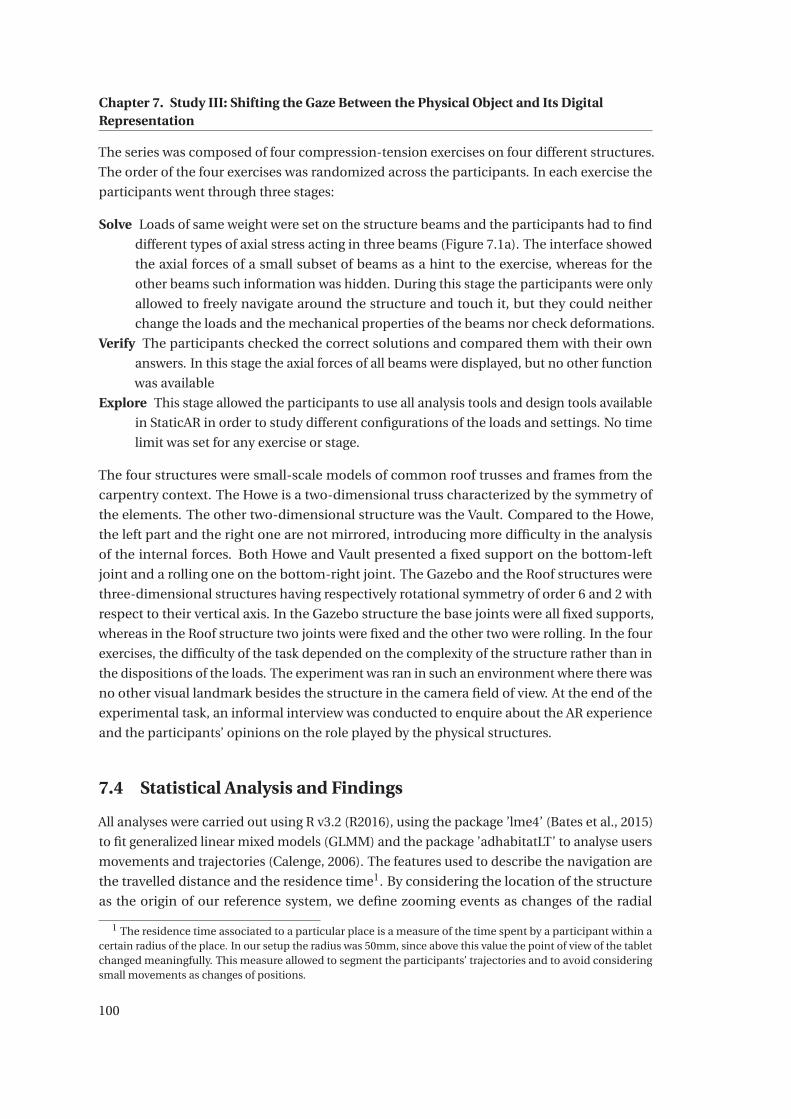
Chapter 7. Study III: Shifting the Gaze Between the Physical Object and Its DigitalRepresentation
The series was composed of four compression-tension exercises on four different structures.
The order of the four exercises was randomized across the participants. In each exercise the
participants went through three stages:
Solve Loads of same weight were set on the structure beams and the participants had to find
different types of axial stress acting in three beams (Figure 7.1a). The interface showed
the axial forces of a small subset of beams as a hint to the exercise, whereas for the
other beams such information was hidden. During this stage the participants were only
allowed to freely navigate around the structure and touch it, but they could neither
change the loads and the mechanical properties of the beams nor check deformations.
Verify The participants checked the correct solutions and compared them with their own
answers. In this stage the axial forces of all beams were displayed, but no other function
was available
Explore This stage allowed the participants to use all analysis tools and design tools available
in StaticAR in order to study different configurations of the loads and settings. No time
limit was set for any exercise or stage.
The four structures were small-scale models of common roof trusses and frames from the
carpentry context. The Howe is a two-dimensional truss characterized by the symmetry of
the elements. The other two-dimensional structure was the Vault. Compared to the Howe,
the left part and the right one are not mirrored, introducing more difficulty in the analysis
of the internal forces. Both Howe and Vault presented a fixed support on the bottom-left
joint and a rolling one on the bottom-right joint. The Gazebo and the Roof structures were
three-dimensional structures having respectively rotational symmetry of order 6 and 2 with
respect to their vertical axis. In the Gazebo structure the base joints were all fixed supports,
whereas in the Roof structure two joints were fixed and the other two were rolling. In the four
exercises, the difficulty of the task depended on the complexity of the structure rather than in
the dispositions of the loads. The experiment was ran in such an environment where there was
no other visual landmark besides the structure in the camera field of view. At the end of the
experimental task, an informal interview was conducted to enquire about the AR experience
and the participants’ opinions on the role played by the physical structures.
7.4 Statistical Analysis and Findings
All analyses were carried out using R v3.2 (R2016), using the package ’lme4’ (Bates et al., 2015)
to fit generalized linear mixed models (GLMM) and the package ’adhabitatLT’ to analyse users
movements and trajectories (Calenge, 2006). The features used to describe the navigation are
the travelled distance and the residence time1. By considering the location of the structure
as the origin of our reference system, we define zooming events as changes of the radial
1 The residence time associated to a particular place is a measure of the time spent by a participant within acertain radius of the place. In our setup the radius was 50mm, since above this value the point of view of the tabletchanged meaningfully. This measure allowed to segment the participants’ trajectories and to avoid consideringsmall movements as changes of positions.
100
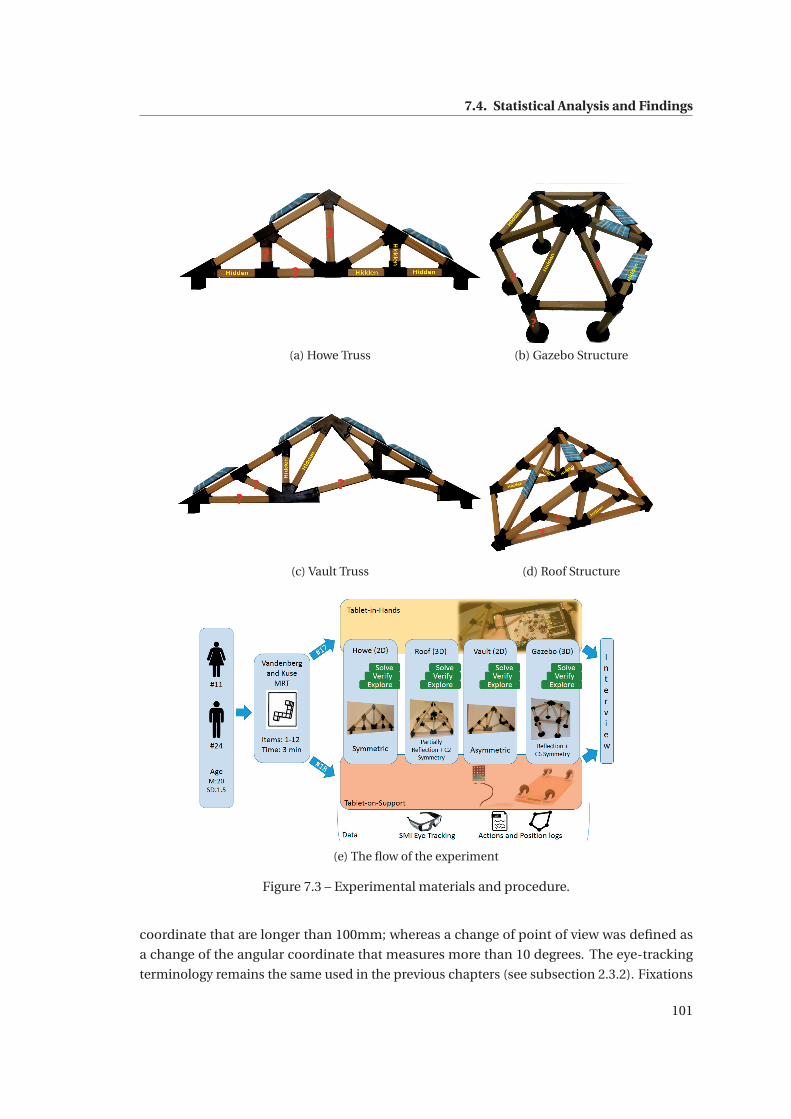
7.4. Statistical Analysis and Findings
(a) Howe Truss (b) Gazebo Structure
(c) Vault Truss (d) Roof Structure
(e) The flow of the experiment
Figure 7.3 – Experimental materials and procedure.
coordinate that are longer than 100mm; whereas a change of point of view was defined as
a change of the angular coordinate that measures more than 10 degrees. The eye-tracking
terminology remains the same used in the previous chapters (see subsection 2.3.2). Fixations
101
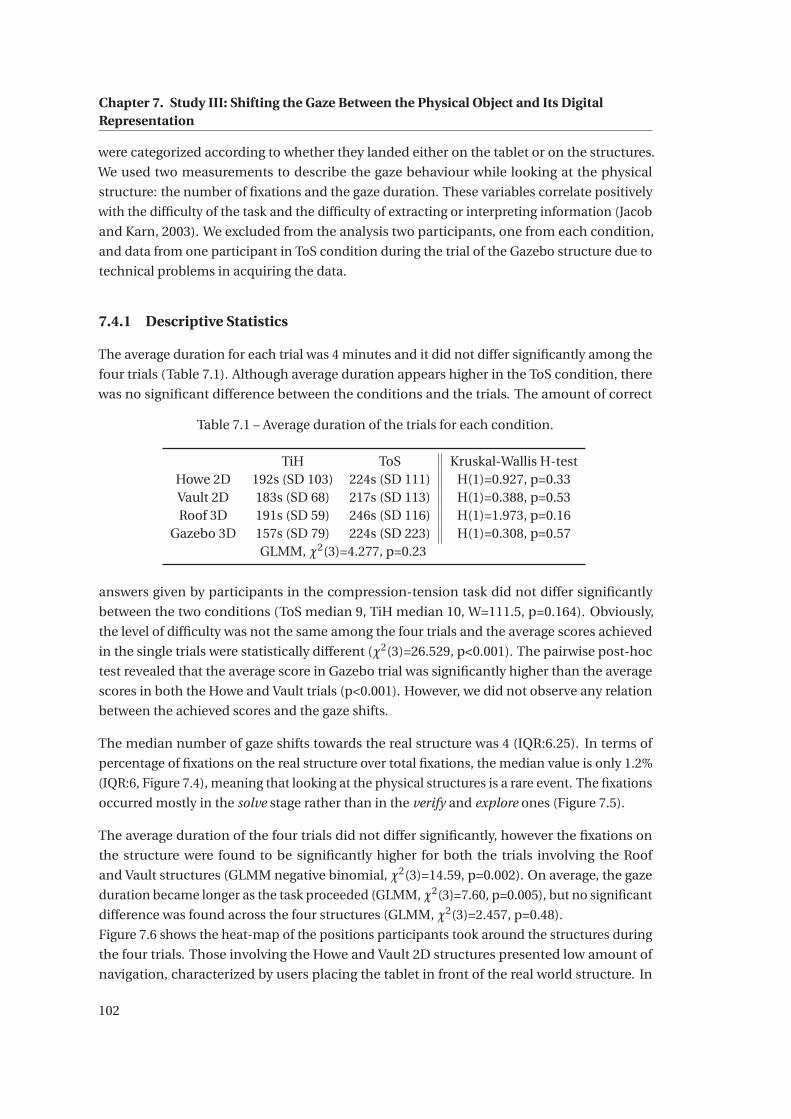
Chapter 7. Study III: Shifting the Gaze Between the Physical Object and Its DigitalRepresentation
were categorized according to whether they landed either on the tablet or on the structures.
We used two measurements to describe the gaze behaviour while looking at the physical
structure: the number of fixations and the gaze duration. These variables correlate positively
with the difficulty of the task and the difficulty of extracting or interpreting information (Jacob
and Karn, 2003). We excluded from the analysis two participants, one from each condition,
and data from one participant in ToS condition during the trial of the Gazebo structure due to
technical problems in acquiring the data.
7.4.1 Descriptive Statistics
The average duration for each trial was 4 minutes and it did not differ significantly among the
four trials (Table 7.1). Although average duration appears higher in the ToS condition, there
was no significant difference between the conditions and the trials. The amount of correct
Table 7.1 – Average duration of the trials for each condition.
TiH ToS Kruskal-Wallis H-testHowe 2D 192s (SD 103) 224s (SD 111) H(1)=0.927, p=0.33Vault 2D 183s (SD 68) 217s (SD 113) H(1)=0.388, p=0.53Roof 3D 191s (SD 59) 246s (SD 116) H(1)=1.973, p=0.16
Gazebo 3D 157s (SD 79) 224s (SD 223) H(1)=0.308, p=0.57GLMM, χ2(3)=4.277, p=0.23
answers given by participants in the compression-tension task did not differ significantly
between the two conditions (ToS median 9, TiH median 10, W=111.5, p=0.164). Obviously,
the level of difficulty was not the same among the four trials and the average scores achieved
in the single trials were statistically different (χ2(3)=26.529, p<0.001). The pairwise post-hoc
test revealed that the average score in Gazebo trial was significantly higher than the average
scores in both the Howe and Vault trials (p<0.001). However, we did not observe any relation
between the achieved scores and the gaze shifts.
The median number of gaze shifts towards the real structure was 4 (IQR:6.25). In terms of
percentage of fixations on the real structure over total fixations, the median value is only 1.2%
(IQR:6, Figure 7.4), meaning that looking at the physical structures is a rare event. The fixations
occurred mostly in the solve stage rather than in the verify and explore ones (Figure 7.5).
The average duration of the four trials did not differ significantly, however the fixations on
the structure were found to be significantly higher for both the trials involving the Roof
and Vault structures (GLMM negative binomial, χ2(3)=14.59, p=0.002). On average, the gaze
duration became longer as the task proceeded (GLMM, χ2(3)=7.60, p=0.005), but no significant
difference was found across the four structures (GLMM, χ2(3)=2.457, p=0.48).
Figure 7.6 shows the heat-map of the positions participants took around the structures during
the four trials. Those involving the Howe and Vault 2D structures presented low amount of
navigation, characterized by users placing the tablet in front of the real world structure. In
102
7.4. Statistical Analysis and Findings
z=3.388, p=0.00355
z=2.396, p=0.07775
z=2.980,p=0.01515
0
5
10
15
20
25
Gazebo3D
Symmetric
Howe2D
Symmetric
Roof3D
Partially Symmetric
Vault2D
AsymetricTrial
% F
ixat
ions
on
real
str
uctu
re
ExperimentalCondition
ToSTiH
Figure 7.4 – Percentage of fixations on the real-world structures.
0.00 0.25 0.50 0.75 1.00 0.00 0.25 0.50 0.75 1.00
0.00
0.05
0.10
0.15
0.20
Normalized trial time
De
nsity Experimental
ConditionToSTiH
Figure 7.5 – Normalized histogram of the fixation on the structure with respect to the normal-ized trial time.
3D trials, the navigation was more uniform around the structures, presenting a significantly
higher number of zooming and changing of point of view (GLMM, χ2(3)=49.09, p<0.001).
HSpati al−Ski l l s : Effect of Spatial Skills on the Gaze Shift The average MRT score was 11.89
± 5.94 (out of 23) and it was not found to be different in the two experimental conditions
(F[1,33]=0.38, p=0.54), indicating the absence of bias in the two experimental groups. The
MRT score affected significantly neither the duration of the trials (GLMM, χ2(1)=1.312, p=0.25)
nor the number of gaze shifts towards the structure (GLMM negative binomial, χ2(1)=1.422,
p=0.23). Regarding the episodes while participants were looking at the structure, the average
103
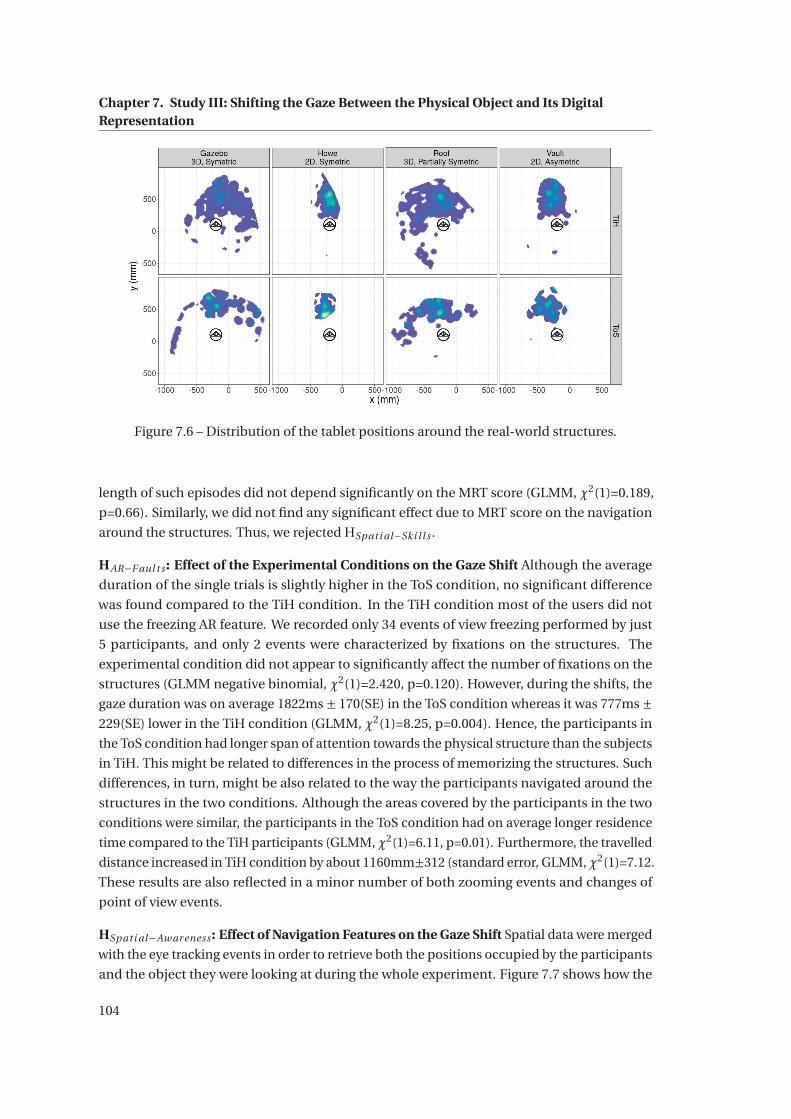
Chapter 7. Study III: Shifting the Gaze Between the Physical Object and Its DigitalRepresentation
Figure 7.6 – Distribution of the tablet positions around the real-world structures.
length of such episodes did not depend significantly on the MRT score (GLMM, χ2(1)=0.189,
p=0.66). Similarly, we did not find any significant effect due to MRT score on the navigation
around the structures. Thus, we rejected HSpati al−Ski l l s .
HAR−F aul t s : Effect of the Experimental Conditions on the Gaze Shift Although the average
duration of the single trials is slightly higher in the ToS condition, no significant difference
was found compared to the TiH condition. In the TiH condition most of the users did not
use the freezing AR feature. We recorded only 34 events of view freezing performed by just
5 participants, and only 2 events were characterized by fixations on the structures. The
experimental condition did not appear to significantly affect the number of fixations on the
structures (GLMM negative binomial, χ2(1)=2.420, p=0.120). However, during the shifts, the
gaze duration was on average 1822ms ± 170(SE) in the ToS condition whereas it was 777ms ±229(SE) lower in the TiH condition (GLMM, χ2(1)=8.25, p=0.004). Hence, the participants in
the ToS condition had longer span of attention towards the physical structure than the subjects
in TiH. This might be related to differences in the process of memorizing the structures. Such
differences, in turn, might be also related to the way the participants navigated around the
structures in the two conditions. Although the areas covered by the participants in the two
conditions were similar, the participants in the ToS condition had on average longer residence
time compared to the TiH participants (GLMM,χ2(1)=6.11, p=0.01). Furthermore, the travelled
distance increased in TiH condition by about 1160mm±312 (standard error, GLMM,χ2(1)=7.12.
These results are also reflected in a minor number of both zooming events and changes of
point of view events.
HSpati al−Aw ar eness : Effect of Navigation Features on the Gaze Shift Spatial data were merged
with the eye tracking events in order to retrieve both the positions occupied by the participants
and the object they were looking at during the whole experiment. Figure 7.7 shows how the
104
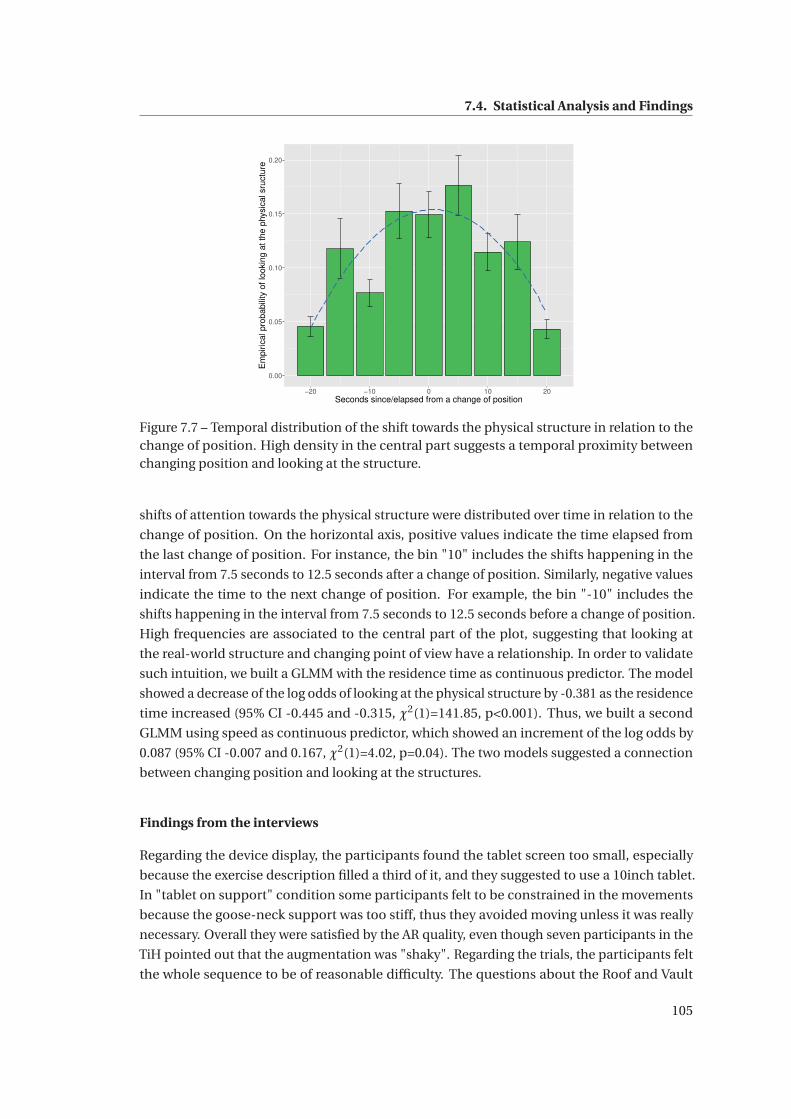
7.4. Statistical Analysis and Findings
0.00
0.05
0.10
0.15
0.20
−20 −10 0 10 20Seconds since/elapsed from a change of position
Em
piric
al p
roba
bilit
y of
look
ing
at th
e ph
ysic
al s
ruct
ure
Figure 7.7 – Temporal distribution of the shift towards the physical structure in relation to thechange of position. High density in the central part suggests a temporal proximity betweenchanging position and looking at the structure.
shifts of attention towards the physical structure were distributed over time in relation to the
change of position. On the horizontal axis, positive values indicate the time elapsed from
the last change of position. For instance, the bin "10" includes the shifts happening in the
interval from 7.5 seconds to 12.5 seconds after a change of position. Similarly, negative values
indicate the time to the next change of position. For example, the bin "-10" includes the
shifts happening in the interval from 7.5 seconds to 12.5 seconds before a change of position.
High frequencies are associated to the central part of the plot, suggesting that looking at
the real-world structure and changing point of view have a relationship. In order to validate
such intuition, we built a GLMM with the residence time as continuous predictor. The model
showed a decrease of the log odds of looking at the physical structure by -0.381 as the residence
time increased (95% CI -0.445 and -0.315, χ2(1)=141.85, p<0.001). Thus, we built a second
GLMM using speed as continuous predictor, which showed an increment of the log odds by
0.087 (95% CI -0.007 and 0.167, χ2(1)=4.02, p=0.04). The two models suggested a connection
between changing position and looking at the structures.
Findings from the interviews
Regarding the device display, the participants found the tablet screen too small, especially
because the exercise description filled a third of it, and they suggested to use a 10inch tablet.
In "tablet on support" condition some participants felt to be constrained in the movements
because the goose-neck support was too stiff, thus they avoided moving unless it was really
necessary. Overall they were satisfied by the AR quality, even though seven participants in the
TiH pointed out that the augmentation was "shaky". Regarding the trials, the participants felt
the whole sequence to be of reasonable difficulty. The questions about the Roof and Vault
105

Chapter 7. Study III: Shifting the Gaze Between the Physical Object and Its DigitalRepresentation
structures were perceived to be more difficult due to the unusual shapes, which require longer
time to get used to, and also due to the lower symmetry, which does not allow to transfer the
reasoning done on one part of the structure to another. The participants expressed a range of
considerations exhibiting coherence with the findings from the previous section2:
Useless or replaceable (N=12) The structure is an abstract mathematical entity and is ana-
lyzed as a system of equations. One or more pictures are sufficient since most of the
spatial processing is done mentally. "When I try to understand a structure, I don’t think
about it as a thing[...], it is just an exercise[...]. I don’t think about going real life and
simulating [the exercise scenario].". However, it was interesting to notice that typically
those participants were aware of their spatial skills and they affirmed that the structure
could be beneficial for people with lower skills.
AR Flaw Compensation (N=13) Shifting to physical model when the augmentation is noisy
allows not to interrupt the reasoning process. Looking at the physical model disam-
biguates 3D rendering issues in case of self-occlusions or provides depth cues. "[when
it’s shaking] I think it is more tiring to look at it on the screen than looking directly at the
structure".. It was a shared opinion that real world structures provided depth cues in
case of self-occlusion between the elements of the structure, especially in the Roof trial
when several beams overlapped.
Navigation (N=6) The participants appreciated the ease and speed of navigation provided
by the AR system compared to the traditional interaction styles based on mouse and
keyboard. The physical structure acts as a spatial anchor, supporting the spatial aware-
ness of the user. The participants who gave this explanation reported that they quickly
glanced at the structure in order to decide the successive points of view.
External representation and tangible interaction (N=13) The physical structure offers a
scaffold to the mental representation of the forces and the path of the loads. Eight
participants preferred to directly manipulate the physical structure instead of just
moving themselves around. Among those, 3 participants felt important to have the
physical structure in order to be able to push it with their hands and observe the
deformation at the joints to get "physical impression". "I think it is important to have
the structure, because it is easier to picture in my mind how and in which way the forces
go when I press here". "[when acting directly on the structure] you can feel what happens
in the wood. It is harder if one only has the display."
7.5 Discussion
Regarding the MRT score, the analysis did not show any effect between the user’s mental
rotation ability and the number of visual references towards the physical structures or the
2The number in brackets indicates the number of participants who shared that specific point of view.
106
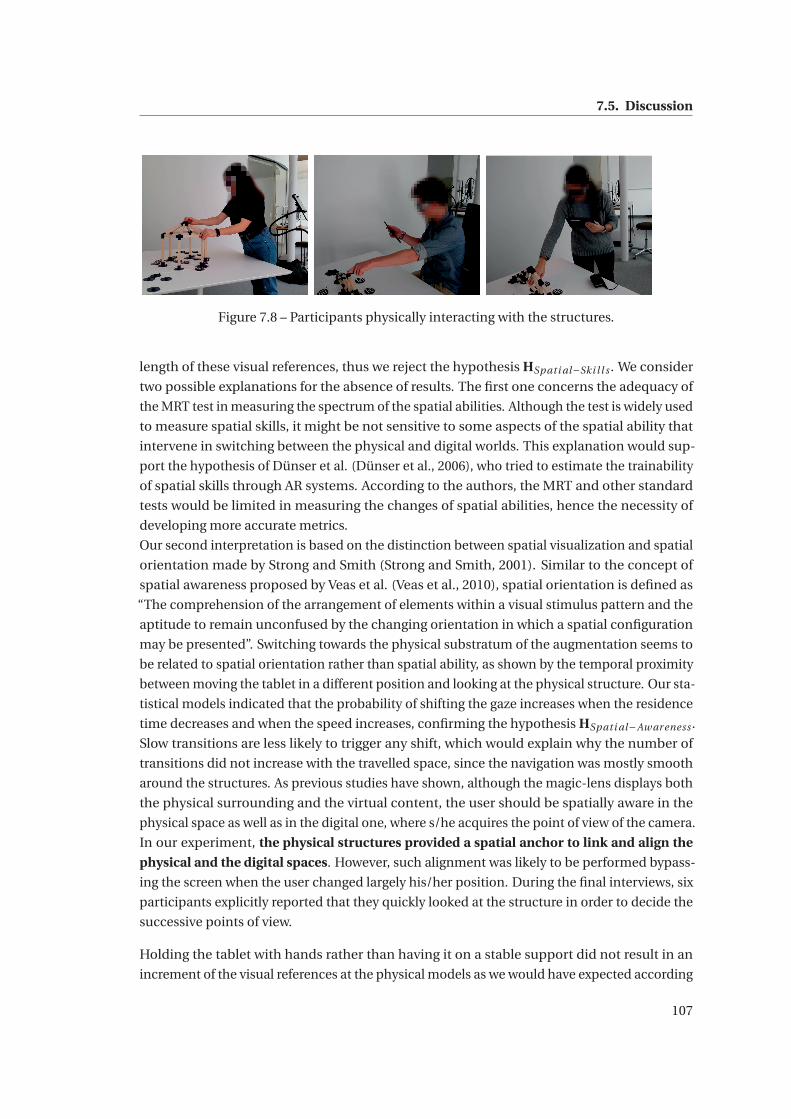
7.5. Discussion
Figure 7.8 – Participants physically interacting with the structures.
length of these visual references, thus we reject the hypothesis HSpati al−Ski l l s . We consider
two possible explanations for the absence of results. The first one concerns the adequacy of
the MRT test in measuring the spectrum of the spatial abilities. Although the test is widely used
to measure spatial skills, it might be not sensitive to some aspects of the spatial ability that
intervene in switching between the physical and digital worlds. This explanation would sup-
port the hypothesis of Dünser et al. (Dünser et al., 2006), who tried to estimate the trainability
of spatial skills through AR systems. According to the authors, the MRT and other standard
tests would be limited in measuring the changes of spatial abilities, hence the necessity of
developing more accurate metrics.
Our second interpretation is based on the distinction between spatial visualization and spatial
orientation made by Strong and Smith (Strong and Smith, 2001). Similar to the concept of
spatial awareness proposed by Veas et al. (Veas et al., 2010), spatial orientation is defined as
“The comprehension of the arrangement of elements within a visual stimulus pattern and the
aptitude to remain unconfused by the changing orientation in which a spatial configuration
may be presented”. Switching towards the physical substratum of the augmentation seems to
be related to spatial orientation rather than spatial ability, as shown by the temporal proximity
between moving the tablet in a different position and looking at the physical structure. Our sta-
tistical models indicated that the probability of shifting the gaze increases when the residence
time decreases and when the speed increases, confirming the hypothesis HSpati al−Aw ar eness .
Slow transitions are less likely to trigger any shift, which would explain why the number of
transitions did not increase with the travelled space, since the navigation was mostly smooth
around the structures. As previous studies have shown, although the magic-lens displays both
the physical surrounding and the virtual content, the user should be spatially aware in the
physical space as well as in the digital one, where s/he acquires the point of view of the camera.
In our experiment, the physical structures provided a spatial anchor to link and align the
physical and the digital spaces. However, such alignment was likely to be performed bypass-
ing the screen when the user changed largely his/her position. During the final interviews, six
participants explicitly reported that they quickly looked at the structure in order to decide the
successive points of view.
Holding the tablet with hands rather than having it on a stable support did not result in an
increment of the visual references at the physical models as we would have expected according
107
Chapter 7. Study III: Shifting the Gaze Between the Physical Object and Its DigitalRepresentation
to hypothesis HAR−F aul t s . The absence of significant difference might be due to the fact that
the participants rarely used the freezing functionality in TiH condition but expressed a general
positive feedback regarding the AR experience. Although we could have introduced more
perturbations to increase the difference between the two conditions, our implementation
was based on off-the-shelf AR technology. Hence, having more flaws than the ones present in
nowadays AR tools would have weakened the validity of our comparison. Probably, had the
experiment been longer, participants in TiH condition would have reached a higher level of
fatigue and would have performed more shifts towards the physical structures. We conclude
that common AR flaws do not affect significantly the shift of gaze.
Two differences emerged in the two experimental conditions: (1) although the areas navigated
by the participants in both conditions were not significantly different, ToS participants moved
less than those in TiH condition, preferring to keep the same position for longer periods; (2)
the average duration of the intervals spent to look at the physical structure was indeed longer
for ToS participants. In ToS condition, the stiffness of the support has limited, to some extent,
the navigation around the structures. Even though the tablet could reach the same locations
in both ToS and TiH conditions, ToS participants adopted positions from which the tablet
view included most of the structure rather than being at close-range. Hence, looking directly
at the structure became a way to memorize the model at different scales or from different
angles, in order to use this mental representation afterwards when working with the tablet.
Considering that mental processes involving the memorization of a scene require longer
fixation periods than other processes (Henderson, 2003), the ToS condition was leveraging
more on mental representation and the spatial visualization of the structure compared to
TiH condition. The fact that such difference did not result in the variation of visual switches
between the conditions gives support to our hypothesis that spatial skills do not affect the
number of shifts towards the physical layer. There might have been an interaction effect
between experimental condition and spatial abilities on the process variables characterizing
the shifts, but the statistical power of our study was probably not sufficient to show it.
The number of shifts toward the physical structure did not differ among the four trials, however
the Roof and Vault structures received more fixations than the Gazebo and Howe structures.
This result reflected the difficulty of the task, which appeared to depend on the asymmetry of
the structure rather than on whether the structure was two-dimensional or three-dimensional.
Symmetry allows to isolate a part of the structure, to find a solution for that small section and
finally to propagate the results to the whole structure. The participants converged on the fact
that both the Gazebo structure and the Howe structure could have been reduced respectively
to the analysis of a single slice and of the left-side. Since the Roof and Vault structures lack
symmetry they required a bigger effort to extract the layouts, to apply the forces and to solve
the compression-tension task for the different sub-parts of the models. What is the reason
why the number of shifts did not increase proportionally to the difficulty of the task? This
is probably due to the inherent attention switch cost. Gutpa (Gupta et al., 2004) found that
shifting between the physical and digital stimuli induces eye fatigue. The author investigated
the strain caused by switching between real-world context and digital context. In the study
108
7.6. Conclusions
setup, the participants were asked to match letters from a text displayed on a screen (physical
layer) and a text displayed through head-mounted display (digital layer). The task required
the participants to switch between the two sources while the text was displayed at different
distances (near 0.7mt, medium 2mt, far 6mt ). The results revealed that frequent gaze shifts
caused eye fatigue at any distance. Re-orienting visual attention between objects is a time-
consuming process (Iani et al., 2001; Brown and Denney, 2007). The average reaction time
necessary to shift the gaze between objects is typically longer than the one require to focus
on different parts of the same objects. This is due to the fact that a person has to disengage
his/her attention from a cued target. In our experiment, the perceived gains offered by shifting
back and forth between the structure and the augmentation did not offset its cost. The task
difficulty did not lower the cognitive load of shifting the gaze. Instead, the moments of visual
attention on the structures got characterized by an indicator of higher cognitive effort, as if
the user tried to process the most from these moments and, at the same time, to minimize the
need for new transitions.
7.6 Conclusions
This work represents a contribution to the AR field with regards to the role of the physical layer,
not only as a background for magic-lens systems. The main result is that looking directly at
the physical object seems to sustain the spatial orientation of the user in the physical space
when changing locations. Spatial abilities have neither significant effect on the number of
shift nor on the gaze behaviour while looking at the target of the augmentation. Similarly, we
did not observe any effect due to AR issues such as instability of the augmentation or depth
ambiguities. During the shifts, the increment of the task difficulty and the lower controllability
of the tablet position changed the gaze property in a way that clearly reflected the higher
mental effort of the users. Surprisingly, the two variations did not result in an increment of
shifts.
For what concerned StaticAR, this was the first experiment employing it. It provided us with
the participants’ feedback about the usability of the tool but also with a clearer of the role
of the physical structures. Removing the structure while keeping only the hexagonal grid
would result in higher difficulty of visualizing its geometry and in a lack of spatial references.
Nevertheless, the difference of visual shifts between the four structures revealed that the extent
to which the physical model is shaped after the digital one could be designed in function of
the structure complexity. Complex structures offers peculiar structural behaviours but require
elaborate physical models too. In case of simple and common structures, modelling only
the critical parts should be sufficient since the scaffolding provided by the physical model
becomes less necessary. Moreover, an advantage of the partial modelling is that one concrete
representation can serve to multiple case-studies, fostering the transfer of statics knowledge
among different scenarios. We believe that these observations could better inform teachers
and apprentices in the selection of the relevant artefacts from the Erfahrraum.
Given the exploratory nature of our study, our findings should be subject of further studies.
109
Chapter 7. Study III: Shifting the Gaze Between the Physical Object and Its DigitalRepresentation
Navigation and changes of position should be controlled, for example designing a study in
which these variable are the independent ones. Moreover, it should be clarified whether
only the target object of the augmentation provided support to the spatial awareness or any
other landmark in the physical surroundings. Other researches might consider to repeat the
experiment by employing a wider and more sensible range of tests for assessing spatial abilities
and might extend the duration of the task to verify if physical fatigue could lead to more and
longer shifts.
110
8 Study IV: Evaluating a Visual Repre-sentation of Forces in a CollaborativeTask8.1 Introduction
The purpose of our last study was to describe how apprentices’ reasoning is affected by the
pictorial representations of the forces used in StaticAR. As previously described in chapter 6,
the augmentation of the axial force acting in a beam is made of two components: the arrows
at the extreme joints and the spring in the middle of the beam. The spring conveys the effect
of the force on the beam, which could get either compressed or elongated. The arrows show
the way the beam reacts to the stress by respectively pushing or pulling the extreme joints.
Both the representations have strengths and weaknesses. Accepting a spring as a metaphor for
timber is straightforward and the usage of such analogy is recurrent in the carpentry teaching.
However, from our experience described in chapter 5, the sole representation through the
spring might lead learners to overlook how the elements of a structural system interact with
each other in order to be in equilibrium. Moreover, the concept of springiness (DiSessa, 1983),
which summarizes the link deformation =⇒ reaction force, could be not yet developed in
some students, who might lack a physical intuition of how springs work (Lattery, 2005). Hence,
we introduced the arrows that provide a cue about the composition of the forces at the joints.
The arrows create the free body diagrams of each joint which includes the magnitudes of the
forces too 1. The arrows representation is undoubtedly less immediate and less natural to
understand than the springs’ one, especially because it relies on the notion of vectors. Research
in physics education has shown that such notion could be challenging for novice students
(Nguyen and Meltzer, 2003; Nathan, 2012). Furthermore, prompting students to use the arrows
as representation to depict forces could prevent them from relying on intuitive methods for
solving physics problems, increasing the chances of giving wrong solutions to the exercises
(Meltzer, 2005; Heckler, 2010). In order to progressively introduce the formalism of vectors
to students and to help them mastering it to represent forces acting between bodies, several
authors have proposed alternative visual-representation tools that emphasize forces as a
property of the interaction between entities (de Dios Jiménez-Valladares and Perales-Palacios,
2001; Hinrichs, 2005; Savinainen et al., 2013). Following these works, we hypothesized that the
1The arrows are scaled according to the magnitude of the force.
111
Chapter 8. Study IV: Evaluating a Visual Representation of Forces in a Collaborative Task
combination of springs and arrows should make the action/reaction relationship between the
beams on the joints explicit.
For this study we used the compression-tension task again. However, differently from the
studies previously described, the participants solved the exercises by collaborating. Exploiting
social interaction to foster a deeper understanding of basic physics subjects (e.g. motion
and forces) has given positive outcomes, for example, in case of teacher-led peer discussion
(Savinainen et al., 2005), of peer instructions with structured inquiry (Suppapittayaporn et al.,
2010) or of computer-mediated collaborative problem-solving sessions (Soong and Mercer,
2011).
In our study, the participants formed pairs in which one apprentice received a tablet running
StaticAR with only the springs representation available; the other received another tablet
displaying only the arrows representation. After completing the task individually, they had
to collaborate to provide the final answers to the exercises. The rationale for this script of
the experiment flow could be found in the design principle “Split Where Interaction Should
Happen” (SWISH) (Dillenbourg and Hong, 2008). The idea of the SWISH is to let the partici-
pants’ understanding emerge by introducing some differences that force them to discuss, to
negotiate and to argue. In our case the difference was induced by the adoption of the two
different representations which do not appear equivalent at first sight. However, the apparent
discrepancy should dissolve as the participants collaborate, resulting in a synthesis of the two
representations. Furthermore, in terms of data collection, this type of approach would elicit
the participants’ verbalization of their reasoning in a natural way, overcoming the artificiality
of the think-aloud protocol noticed in Chapter 5.
The research objectives of this experiment were:
• to check if any learning gain resulted from the proposed activity (pre- and post-test
comparison);
• to look at the performance in the experimental task in order to get insights about the
impact of the two representations on the individual phase and about the effect on the
discussion phase.
• to identify what worked or did not work in the activity with StaticAR in order to extract
directions for future improvements.
8.2 Experimental Setup
8.2.1 Participants
This study was run at the Centre d’Enseignement Professionnel de Morges (CEPM) during the
spring semester 2017 and it involved 22 carpentry apprentices, all males, belonging to two
classes. The students were in their third year of training, hence the bases of statics had already
112
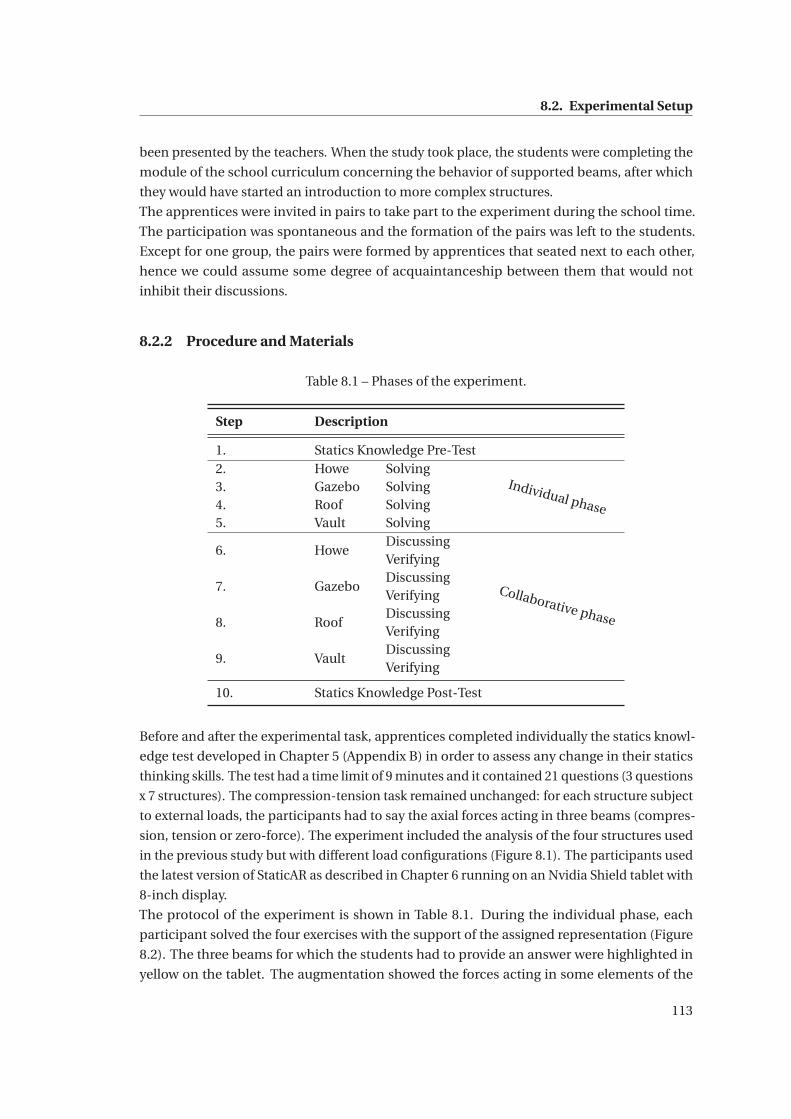
8.2. Experimental Setup
been presented by the teachers. When the study took place, the students were completing the
module of the school curriculum concerning the behavior of supported beams, after which
they would have started an introduction to more complex structures.
The apprentices were invited in pairs to take part to the experiment during the school time.
The participation was spontaneous and the formation of the pairs was left to the students.
Except for one group, the pairs were formed by apprentices that seated next to each other,
hence we could assume some degree of acquaintanceship between them that would not
inhibit their discussions.
8.2.2 Procedure and Materials
Table 8.1 – Phases of the experiment.
Step Description
1. Statics Knowledge Pre-Test2. Howe Solving
Individual phase
3. Gazebo Solving4. Roof Solving5. Vault Solving
6. HoweDiscussing
Collaborative phase
Verifying
7. GazeboDiscussingVerifying
8. RoofDiscussingVerifying
9. VaultDiscussingVerifying
10. Statics Knowledge Post-Test
Before and after the experimental task, apprentices completed individually the statics knowl-
edge test developed in Chapter 5 (Appendix B) in order to assess any change in their statics
thinking skills. The test had a time limit of 9 minutes and it contained 21 questions (3 questions
x 7 structures). The compression-tension task remained unchanged: for each structure subject
to external loads, the participants had to say the axial forces acting in three beams (compres-
sion, tension or zero-force). The experiment included the analysis of the four structures used
in the previous study but with different load configurations (Figure 8.1). The participants used
the latest version of StaticAR as described in Chapter 6 running on an Nvidia Shield tablet with
8-inch display.
The protocol of the experiment is shown in Table 8.1. During the individual phase, each
participant solved the four exercises with the support of the assigned representation (Figure
8.2). The three beams for which the students had to provide an answer were highlighted in
yellow on the tablet. The augmentation showed the forces acting in some elements of the
113
Chapter 8. Study IV: Evaluating a Visual Representation of Forces in a Collaborative Task
structures while hiding those acting in the question beams and in some beams that would
make the answers trivial. Besides this information, the interface did not provide any feedback
nor allowed accessing any function of StaticAR. The answers were marked on the sheets at-
tached to the tablets (Figure 8.3). Only when both participants had completed an exercise,
they could move to the next one.
During the collaborative phase, the two apprentices were asked to sit next to each other and,
for each structure, they had to compare their solutions and discuss their final shared answers.
Each participant kept the tablet with the representation used in the individual phase, but
they were invited to share the devices and to make use of both visualizations. Only when an
agreement was reached on the three answers of a structure, the participants could verify the
correctness of their solutions which were shown on both tablets. For the verification phase
the tablets provided the combination of the springs and the arrows. When needed, the partici-
pants could also use the additional functions offered by the application2 (e.g. deformations,
removing beams, changing supports, etc..). No time limit was set either for the individual
phase or for the collaborative phase.
Regarding the data collection, the whole sessions were video recorded in order to analyze
the dialogues between the apprentices. Although it would have been interesting to assess
the quality of the collaboration by employing eye-tracking measures (Jermann et al., 2012;
Sharma et al., 2013; Schneider et al., 2013a), the setup of a dual mobile eye-tracking system
was prohibitive due to technical difficulties (Clark and Gergle, 2011, review).
2The experimenters offered support to the apprentices to access such functions.
114
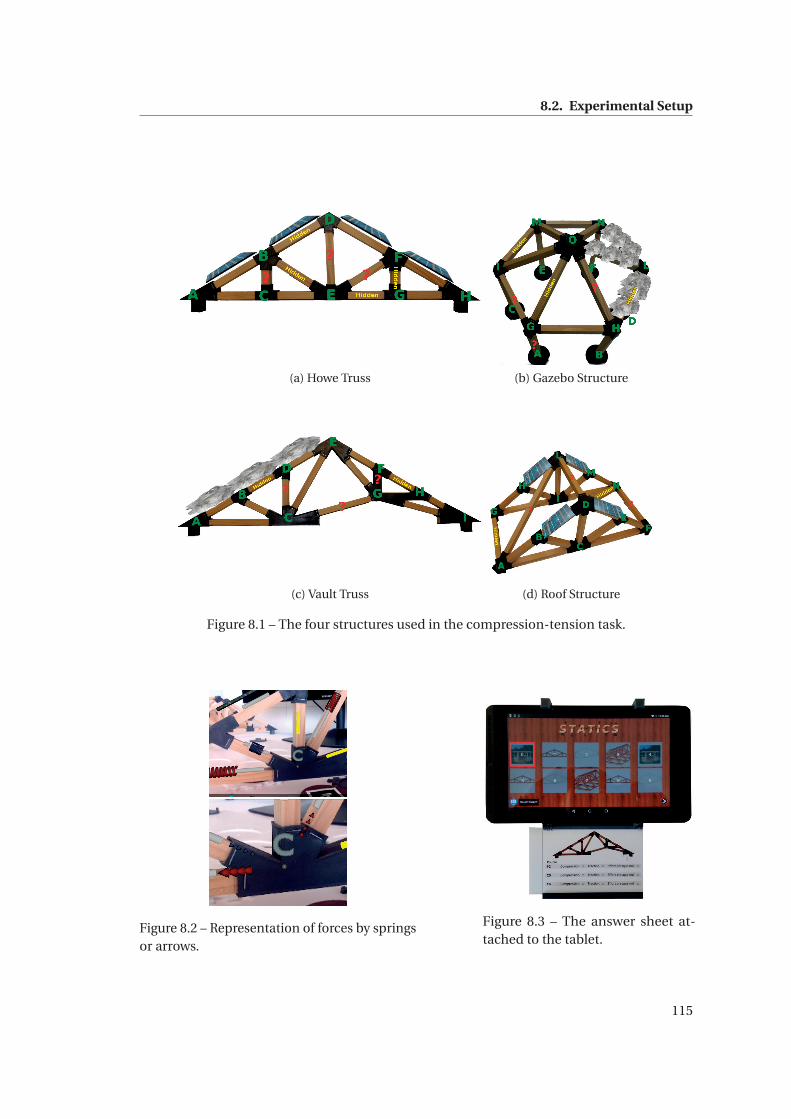
8.2. Experimental Setup
(a) Howe Truss (b) Gazebo Structure
(c) Vault Truss (d) Roof Structure
Figure 8.1 – The four structures used in the compression-tension task.
Figure 8.2 – Representation of forces by springsor arrows.
Figure 8.3 – The answer sheet at-tached to the tablet.
115
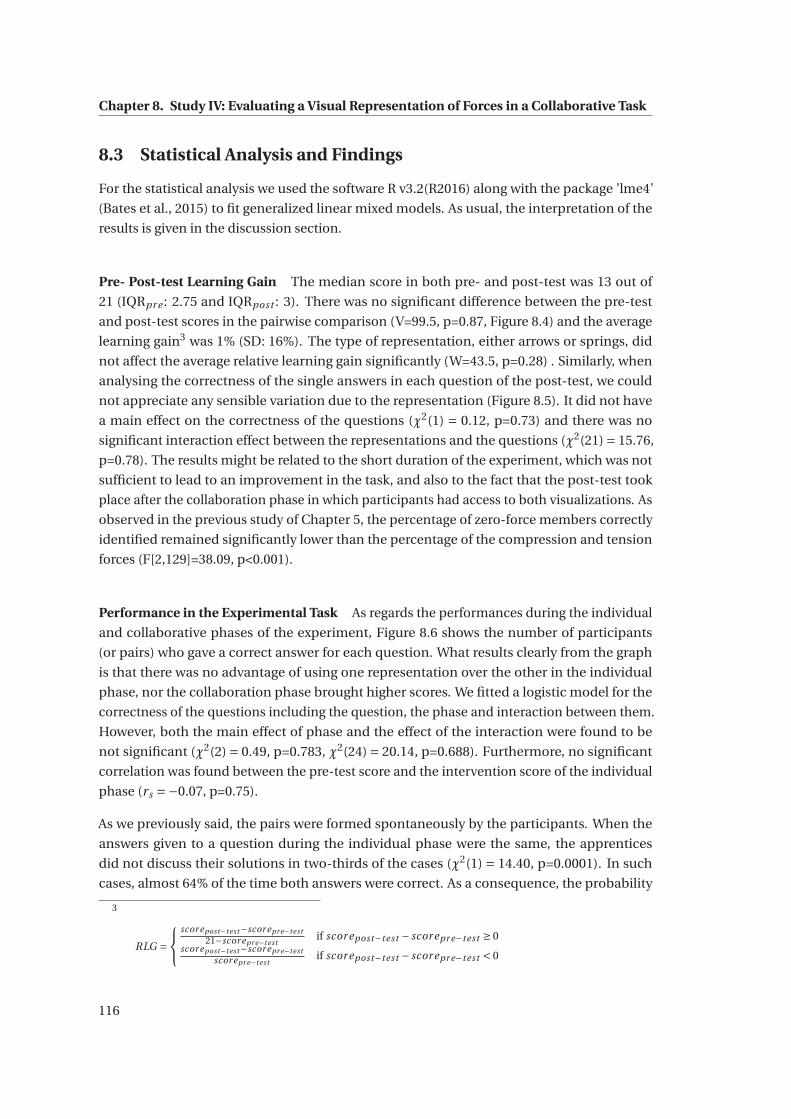
Chapter 8. Study IV: Evaluating a Visual Representation of Forces in a Collaborative Task
8.3 Statistical Analysis and Findings
For the statistical analysis we used the software R v3.2(R2016) along with the package ’lme4’
(Bates et al., 2015) to fit generalized linear mixed models. As usual, the interpretation of the
results is given in the discussion section.
Pre- Post-test Learning Gain The median score in both pre- and post-test was 13 out of
21 (IQRpr e : 2.75 and IQRpost : 3). There was no significant difference between the pre-test
and post-test scores in the pairwise comparison (V=99.5, p=0.87, Figure 8.4) and the average
learning gain3 was 1% (SD: 16%). The type of representation, either arrows or springs, did
not affect the average relative learning gain significantly (W=43.5, p=0.28) . Similarly, when
analysing the correctness of the single answers in each question of the post-test, we could
not appreciate any sensible variation due to the representation (Figure 8.5). It did not have
a main effect on the correctness of the questions (χ2(1) = 0.12, p=0.73) and there was no
significant interaction effect between the representations and the questions (χ2(21)= 15.76,
p=0.78). The results might be related to the short duration of the experiment, which was not
sufficient to lead to an improvement in the task, and also to the fact that the post-test took
place after the collaboration phase in which participants had access to both visualizations. As
observed in the previous study of Chapter 5, the percentage of zero-force members correctly
identified remained significantly lower than the percentage of the compression and tension
forces (F[2,129]=38.09, p<0.001).
Performance in the Experimental Task As regards the performances during the individual
and collaborative phases of the experiment, Figure 8.6 shows the number of participants
(or pairs) who gave a correct answer for each question. What results clearly from the graph
is that there was no advantage of using one representation over the other in the individual
phase, nor the collaboration phase brought higher scores. We fitted a logistic model for the
correctness of the questions including the question, the phase and interaction between them.
However, both the main effect of phase and the effect of the interaction were found to be
not significant (χ2(2) = 0.49, p=0.783, χ2(24) = 20.14, p=0.688). Furthermore, no significant
correlation was found between the pre-test score and the intervention score of the individual
phase (rs =−0.07, p=0.75).
As we previously said, the pairs were formed spontaneously by the participants. When the
answers given to a question during the individual phase were the same, the apprentices
did not discuss their solutions in two-thirds of the cases (χ2(1) = 14.40, p=0.0001). In such
cases, almost 64% of the time both answers were correct. As a consequence, the probability
3
RLG =⎧⎨⎩
scor epost−test−scor epr e−test21−scor epr e−test
if scor epost−test − scor epr e−test ≥ 0scor epost−test−scor epr e−test
scor epr e−testif scor epost−test − scor epr e−test < 0
116
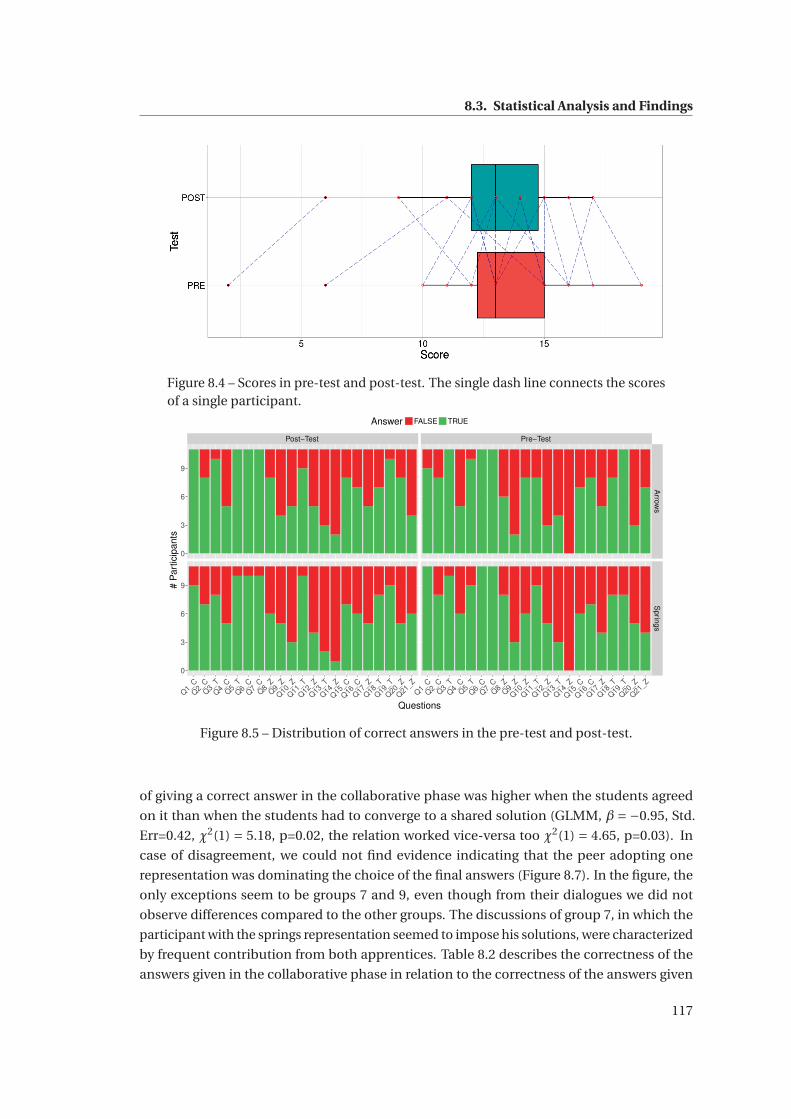
8.3. Statistical Analysis and Findings
Figure 8.4 – Scores in pre-test and post-test. The single dash line connects the scoresof a single participant.
Post−Test Pre−Test
Arrow
sS
prings
Q1_CQ2_
CQ3_
TQ4_
CQ5_
TQ6_
CQ7_
CQ8_
ZQ9_
Z
Q10_Z
Q11_T
Q12_Z
Q13_T
Q14_Z
Q15_C
Q16_C
Q17_Z
Q18_T
Q19_T
Q20_Z
Q21_Z
Q1_CQ2_
CQ3_
TQ4_
CQ5_
TQ6_
CQ7_
CQ8_
ZQ9_
Z
Q10_Z
Q11_T
Q12_Z
Q13_T
Q14_Z
Q15_C
Q16_C
Q17_Z
Q18_T
Q19_T
Q20_Z
Q21_Z
0
3
6
9
0
3
6
9
Questions
# P
artic
ipan
ts
Answer FALSE TRUE
Figure 8.5 – Distribution of correct answers in the pre-test and post-test.
of giving a correct answer in the collaborative phase was higher when the students agreed
on it than when the students had to converge to a shared solution (GLMM, β = −0.95, Std.
Err=0.42, χ2(1) = 5.18, p=0.02, the relation worked vice-versa too χ2(1) = 4.65, p=0.03). In
case of disagreement, we could not find evidence indicating that the peer adopting one
representation was dominating the choice of the final answers (Figure 8.7). In the figure, the
only exceptions seem to be groups 7 and 9, even though from their dialogues we did not
observe differences compared to the other groups. The discussions of group 7, in which the
participant with the springs representation seemed to impose his solutions, were characterized
by frequent contribution from both apprentices. Table 8.2 describes the correctness of the
answers given in the collaborative phase in relation to the correctness of the answers given
117
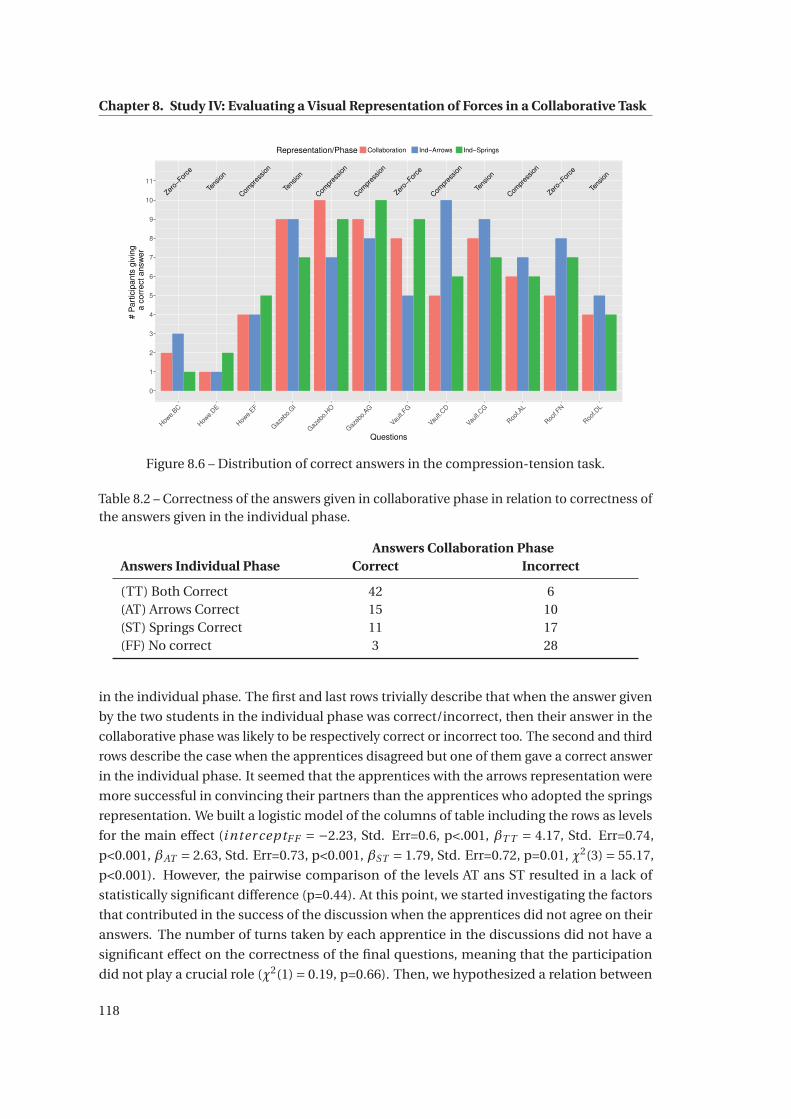
Chapter 8. Study IV: Evaluating a Visual Representation of Forces in a Collaborative Task
Zero−
Forc
e
Tens
ion
Compr
essio
n
Tens
ion
Compr
essio
n
Compr
essio
n
Zero−
Forc
e
Compr
essio
n
Tens
ion
Compr
essio
n
Zero−
Forc
e
Tens
ion
0
1
2
3
4
5
6
7
8
9
10
11
Howe.
BC
Howe.
DE
Howe.
EF
Gazeb
o.GI
Gazeb
o.HO
Gazeb
o.AG
Vault.F
G
Vault.C
D
Vault.C
G
Roof.A
L
Roof.F
N
Roof.D
L
Questions
# P
artic
ipan
ts g
ivin
g a
cor
rect
ans
wer
Representation/Phase Collaboration Ind−Arrows Ind−Springs
Figure 8.6 – Distribution of correct answers in the compression-tension task.
Table 8.2 – Correctness of the answers given in collaborative phase in relation to correctness ofthe answers given in the individual phase.
Answers Collaboration PhaseAnswers Individual Phase Correct Incorrect
(TT) Both Correct 42 6(AT) Arrows Correct 15 10(ST) Springs Correct 11 17(FF) No correct 3 28
in the individual phase. The first and last rows trivially describe that when the answer given
by the two students in the individual phase was correct/incorrect, then their answer in the
collaborative phase was likely to be respectively correct or incorrect too. The second and third
rows describe the case when the apprentices disagreed but one of them gave a correct answer
in the individual phase. It seemed that the apprentices with the arrows representation were
more successful in convincing their partners than the apprentices who adopted the springs
representation. We built a logistic model of the columns of table including the rows as levels
for the main effect (i nter ceptF F = −2.23, Std. Err=0.6, p<.001, βT T = 4.17, Std. Err=0.74,
p<0.001, βAT = 2.63, Std. Err=0.73, p<0.001, βST = 1.79, Std. Err=0.72, p=0.01, χ2(3) = 55.17,
p<0.001). However, the pairwise comparison of the levels AT ans ST resulted in a lack of
statistically significant difference (p=0.44). At this point, we started investigating the factors
that contributed in the success of the discussion when the apprentices did not agree on their
answers. The number of turns taken by each apprentice in the discussions did not have a
significant effect on the correctness of the final questions, meaning that the participation
did not play a crucial role (χ2(1)= 0.19, p=0.66). Then, we hypothesized a relation between
118
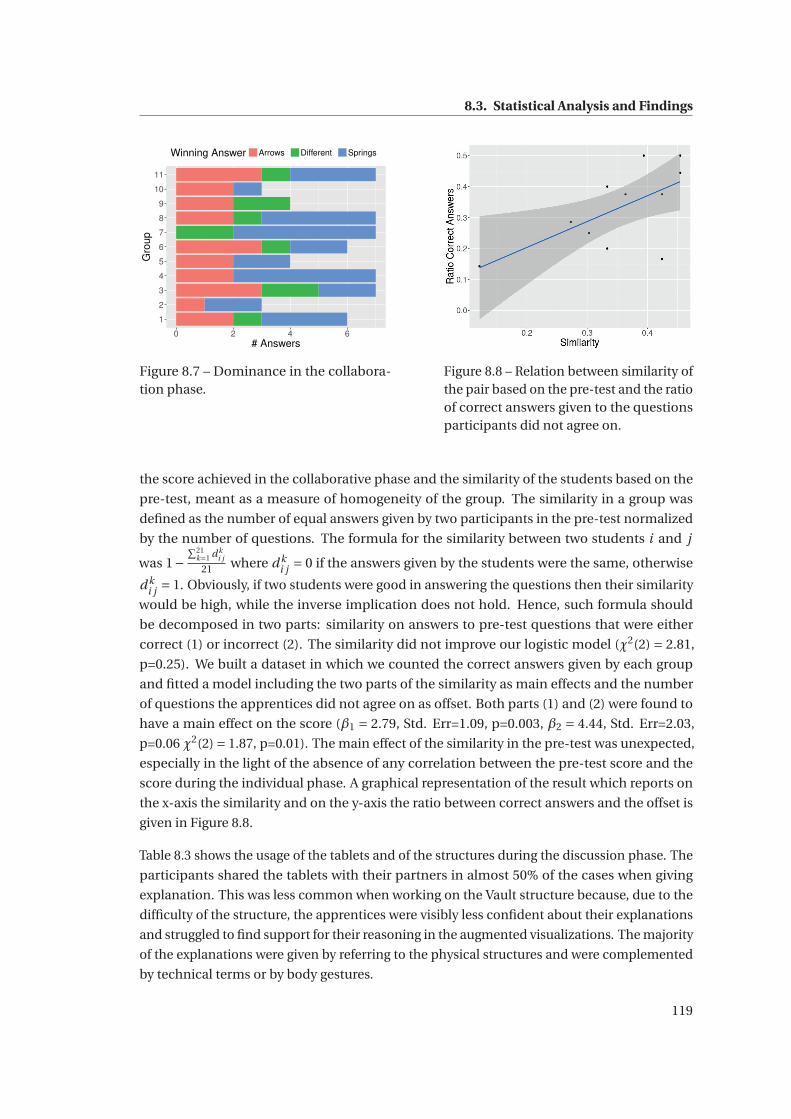
8.3. Statistical Analysis and Findings
1
2
3
4
5
6
7
8
9
10
11
0 2 4 6# Answers
Gro
upWinning Answer Arrows Different Springs
Figure 8.7 – Dominance in the collabora-tion phase.
Figure 8.8 – Relation between similarity ofthe pair based on the pre-test and the ratioof correct answers given to the questionsparticipants did not agree on.
the score achieved in the collaborative phase and the similarity of the students based on the
pre-test, meant as a measure of homogeneity of the group. The similarity in a group was
defined as the number of equal answers given by two participants in the pre-test normalized
by the number of questions. The formula for the similarity between two students i and j
was 1−∑21
k=1 d ki j
21 where d ki j = 0 if the answers given by the students were the same, otherwise
d ki j = 1. Obviously, if two students were good in answering the questions then their similarity
would be high, while the inverse implication does not hold. Hence, such formula should
be decomposed in two parts: similarity on answers to pre-test questions that were either
correct (1) or incorrect (2). The similarity did not improve our logistic model (χ2(2) = 2.81,
p=0.25). We built a dataset in which we counted the correct answers given by each group
and fitted a model including the two parts of the similarity as main effects and the number
of questions the apprentices did not agree on as offset. Both parts (1) and (2) were found to
have a main effect on the score (β1 = 2.79, Std. Err=1.09, p=0.003, β2 = 4.44, Std. Err=2.03,
p=0.06 χ2(2)= 1.87, p=0.01). The main effect of the similarity in the pre-test was unexpected,
especially in the light of the absence of any correlation between the pre-test score and the
score during the individual phase. A graphical representation of the result which reports on
the x-axis the similarity and on the y-axis the ratio between correct answers and the offset is
given in Figure 8.8.
Table 8.3 shows the usage of the tablets and of the structures during the discussion phase. The
participants shared the tablets with their partners in almost 50% of the cases when giving
explanation. This was less common when working on the Vault structure because, due to the
difficulty of the structure, the apprentices were visibly less confident about their explanations
and struggled to find support for their reasoning in the augmented visualizations. The majority
of the explanations were given by referring to the physical structures and were complemented
by technical terms or by body gestures.
119
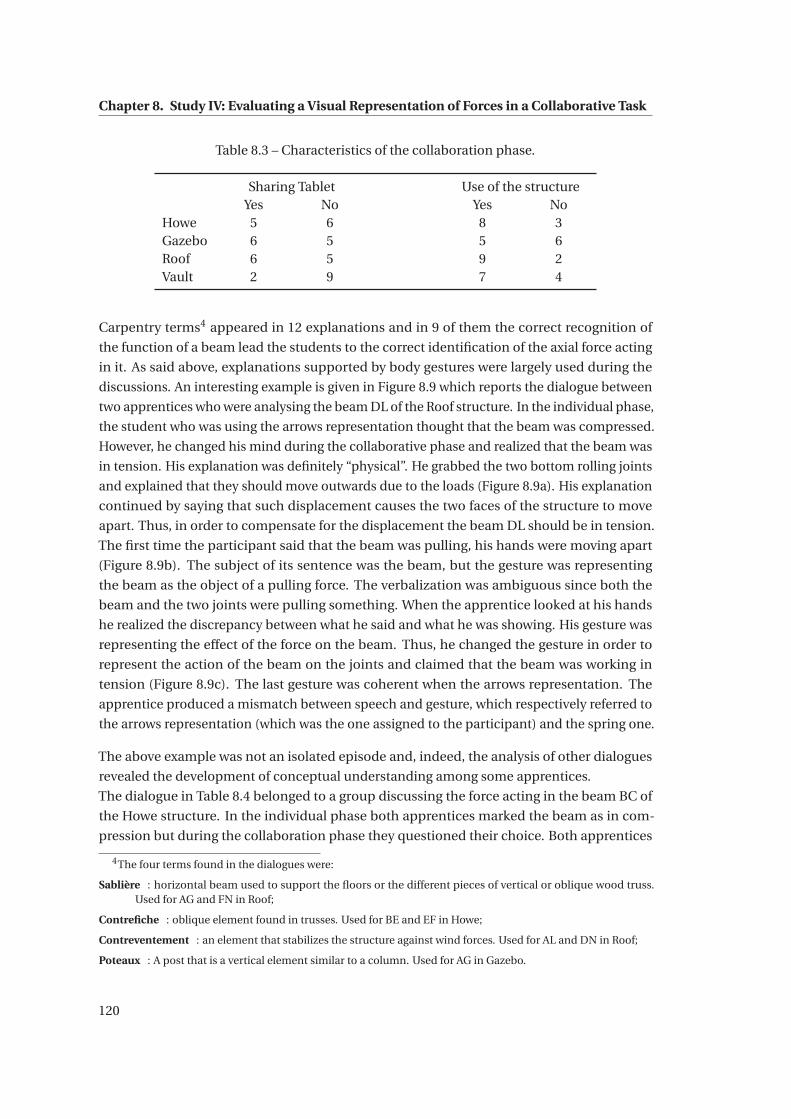
Chapter 8. Study IV: Evaluating a Visual Representation of Forces in a Collaborative Task
Table 8.3 – Characteristics of the collaboration phase.
Sharing Tablet Use of the structureYes No Yes No
Howe 5 6 8 3Gazebo 6 5 5 6Roof 6 5 9 2Vault 2 9 7 4
Carpentry terms4 appeared in 12 explanations and in 9 of them the correct recognition of
the function of a beam lead the students to the correct identification of the axial force acting
in it. As said above, explanations supported by body gestures were largely used during the
discussions. An interesting example is given in Figure 8.9 which reports the dialogue between
two apprentices who were analysing the beam DL of the Roof structure. In the individual phase,
the student who was using the arrows representation thought that the beam was compressed.
However, he changed his mind during the collaborative phase and realized that the beam was
in tension. His explanation was definitely “physical”. He grabbed the two bottom rolling joints
and explained that they should move outwards due to the loads (Figure 8.9a). His explanation
continued by saying that such displacement causes the two faces of the structure to move
apart. Thus, in order to compensate for the displacement the beam DL should be in tension.
The first time the participant said that the beam was pulling, his hands were moving apart
(Figure 8.9b). The subject of its sentence was the beam, but the gesture was representing
the beam as the object of a pulling force. The verbalization was ambiguous since both the
beam and the two joints were pulling something. When the apprentice looked at his hands
he realized the discrepancy between what he said and what he was showing. His gesture was
representing the effect of the force on the beam. Thus, he changed the gesture in order to
represent the action of the beam on the joints and claimed that the beam was working in
tension (Figure 8.9c). The last gesture was coherent when the arrows representation. The
apprentice produced a mismatch between speech and gesture, which respectively referred to
the arrows representation (which was the one assigned to the participant) and the spring one.
The above example was not an isolated episode and, indeed, the analysis of other dialogues
revealed the development of conceptual understanding among some apprentices.
The dialogue in Table 8.4 belonged to a group discussing the force acting in the beam BC of
the Howe structure. In the individual phase both apprentices marked the beam as in com-
pression but during the collaboration phase they questioned their choice. Both apprentices
4The four terms found in the dialogues were:
Sablière : horizontal beam used to support the floors or the different pieces of vertical or oblique wood truss.Used for AG and FN in Roof;
Contrefiche : oblique element found in trusses. Used for BE and EF in Howe;
Contreventement : an element that stabilizes the structure against wind forces. Used for AL and DN in Roof;
Poteaux : A post that is a vertical element similar to a column. Used for AG in Gazebo.
120
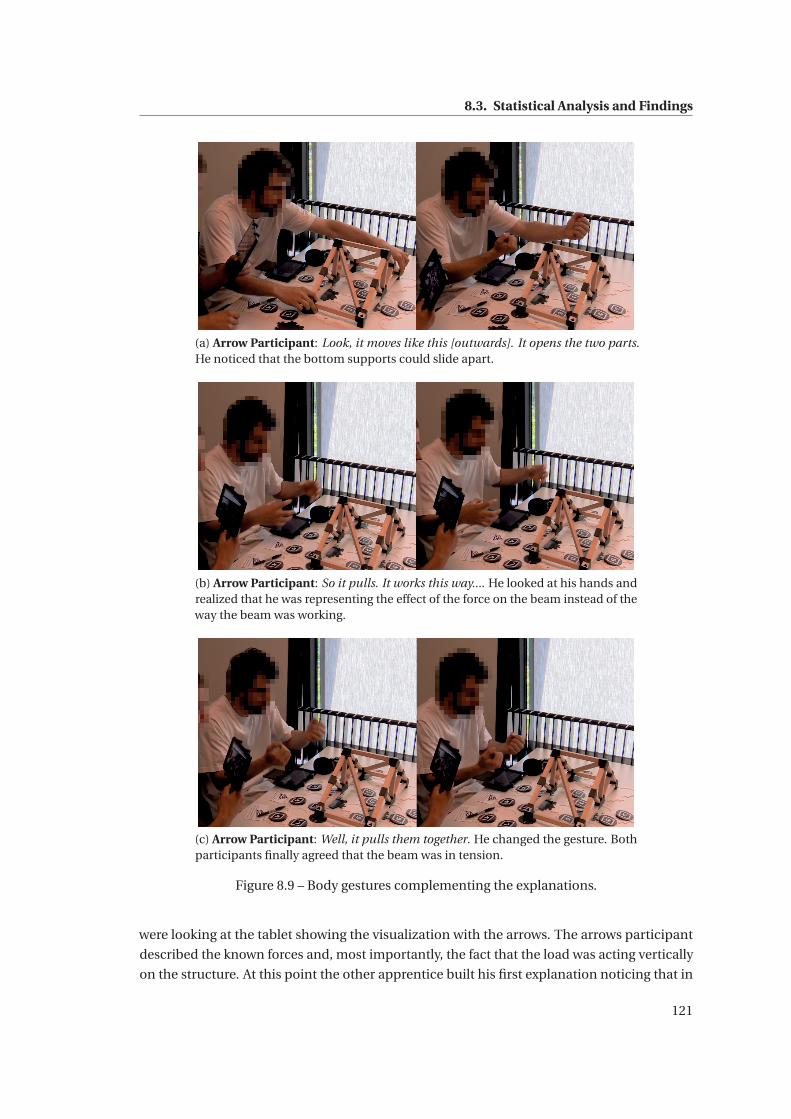
8.3. Statistical Analysis and Findings
(a) Arrow Participant: Look, it moves like this [outwards]. It opens the two parts.He noticed that the bottom supports could slide apart.
(b) Arrow Participant: So it pulls. It works this way.... He looked at his hands andrealized that he was representing the effect of the force on the beam instead of theway the beam was working.
(c) Arrow Participant: Well, it pulls them together. He changed the gesture. Bothparticipants finally agreed that the beam was in tension.
Figure 8.9 – Body gestures complementing the explanations.
were looking at the tablet showing the visualization with the arrows. The arrows participant
described the known forces and, most importantly, the fact that the load was acting vertically
on the structure. At this point the other apprentice built his first explanation noticing that in
121
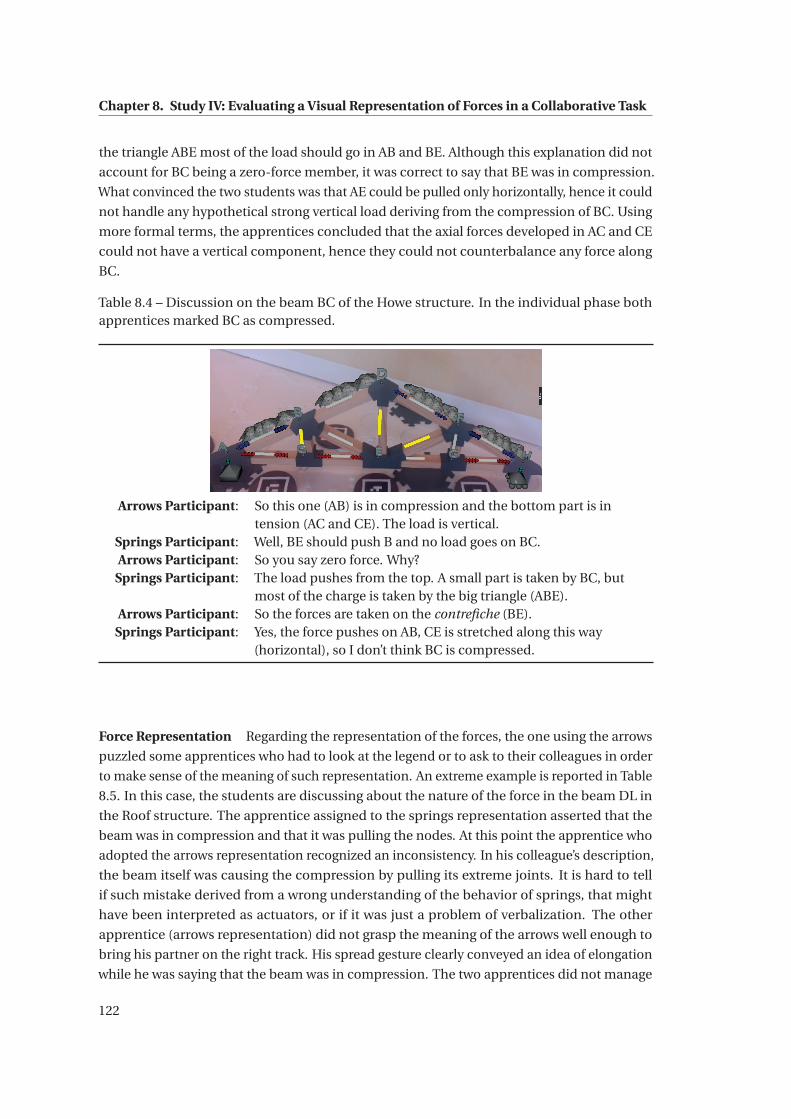
Chapter 8. Study IV: Evaluating a Visual Representation of Forces in a Collaborative Task
the triangle ABE most of the load should go in AB and BE. Although this explanation did not
account for BC being a zero-force member, it was correct to say that BE was in compression.
What convinced the two students was that AE could be pulled only horizontally, hence it could
not handle any hypothetical strong vertical load deriving from the compression of BC. Using
more formal terms, the apprentices concluded that the axial forces developed in AC and CE
could not have a vertical component, hence they could not counterbalance any force along
BC.
Table 8.4 – Discussion on the beam BC of the Howe structure. In the individual phase bothapprentices marked BC as compressed.
Arrows Participant: So this one (AB) is in compression and the bottom part is intension (AC and CE). The load is vertical.
Springs Participant: Well, BE should push B and no load goes on BC.Arrows Participant: So you say zero force. Why?
Springs Participant: The load pushes from the top. A small part is taken by BC, butmost of the charge is taken by the big triangle (ABE).
Arrows Participant: So the forces are taken on the contrefiche (BE).Springs Participant: Yes, the force pushes on AB, CE is stretched along this way
(horizontal), so I don’t think BC is compressed.
Force Representation Regarding the representation of the forces, the one using the arrows
puzzled some apprentices who had to look at the legend or to ask to their colleagues in order
to make sense of the meaning of such representation. An extreme example is reported in Table
8.5. In this case, the students are discussing about the nature of the force in the beam DL in
the Roof structure. The apprentice assigned to the springs representation asserted that the
beam was in compression and that it was pulling the nodes. At this point the apprentice who
adopted the arrows representation recognized an inconsistency. In his colleague’s description,
the beam itself was causing the compression by pulling its extreme joints. It is hard to tell
if such mistake derived from a wrong understanding of the behavior of springs, that might
have been interpreted as actuators, or if it was just a problem of verbalization. The other
apprentice (arrows representation) did not grasp the meaning of the arrows well enough to
bring his partner on the right track. His spread gesture clearly conveyed an idea of elongation
while he was saying that the beam was in compression. The two apprentices did not manage
122
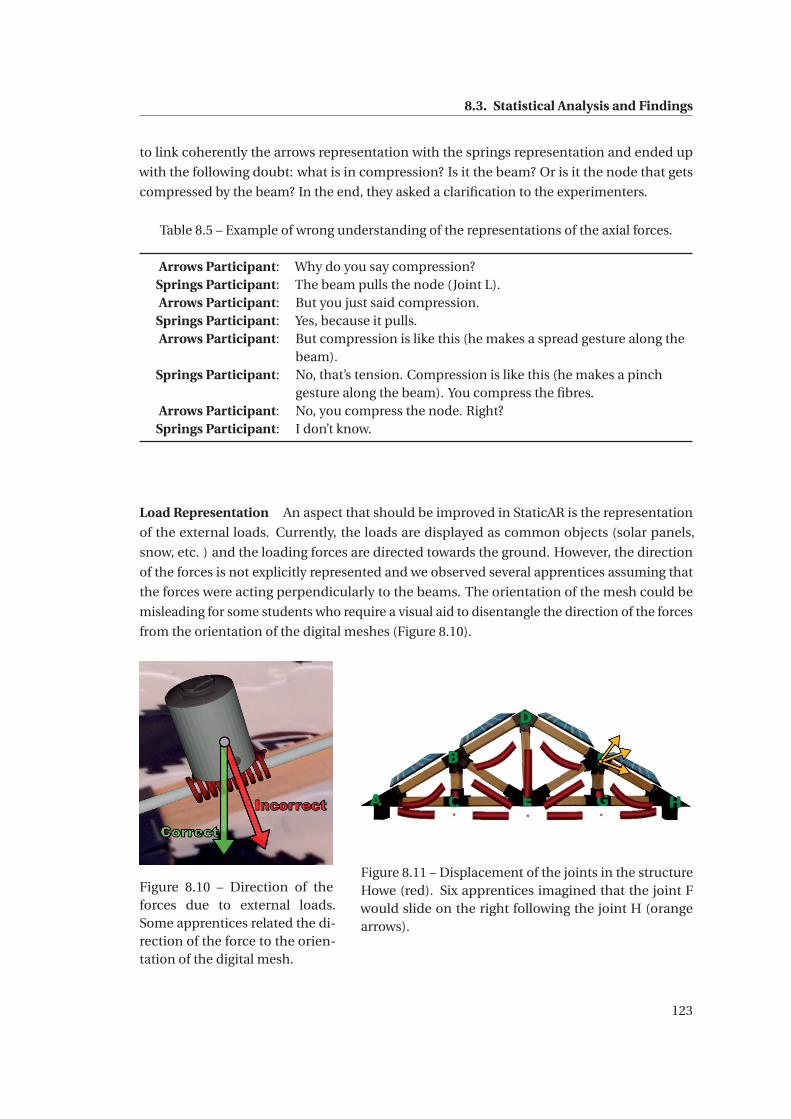
8.3. Statistical Analysis and Findings
to link coherently the arrows representation with the springs representation and ended up
with the following doubt: what is in compression? Is it the beam? Or is it the node that gets
compressed by the beam? In the end, they asked a clarification to the experimenters.
Table 8.5 – Example of wrong understanding of the representations of the axial forces.
Arrows Participant: Why do you say compression?Springs Participant: The beam pulls the node (Joint L).Arrows Participant: But you just said compression.
Springs Participant: Yes, because it pulls.Arrows Participant: But compression is like this (he makes a spread gesture along the
beam).Springs Participant: No, that’s tension. Compression is like this (he makes a pinch
gesture along the beam). You compress the fibres.Arrows Participant: No, you compress the node. Right?
Springs Participant: I don’t know.
Load Representation An aspect that should be improved in StaticAR is the representation
of the external loads. Currently, the loads are displayed as common objects (solar panels,
snow, etc. ) and the loading forces are directed towards the ground. However, the direction
of the forces is not explicitly represented and we observed several apprentices assuming that
the forces were acting perpendicularly to the beams. The orientation of the mesh could be
misleading for some students who require a visual aid to disentangle the direction of the forces
from the orientation of the digital meshes (Figure 8.10).
Figure 8.10 – Direction of theforces due to external loads.Some apprentices related the di-rection of the force to the orien-tation of the digital mesh.
Figure 8.11 – Displacement of the joints in the structureHowe (red). Six apprentices imagined that the joint Fwould slide on the right following the joint H (orangearrows).
123
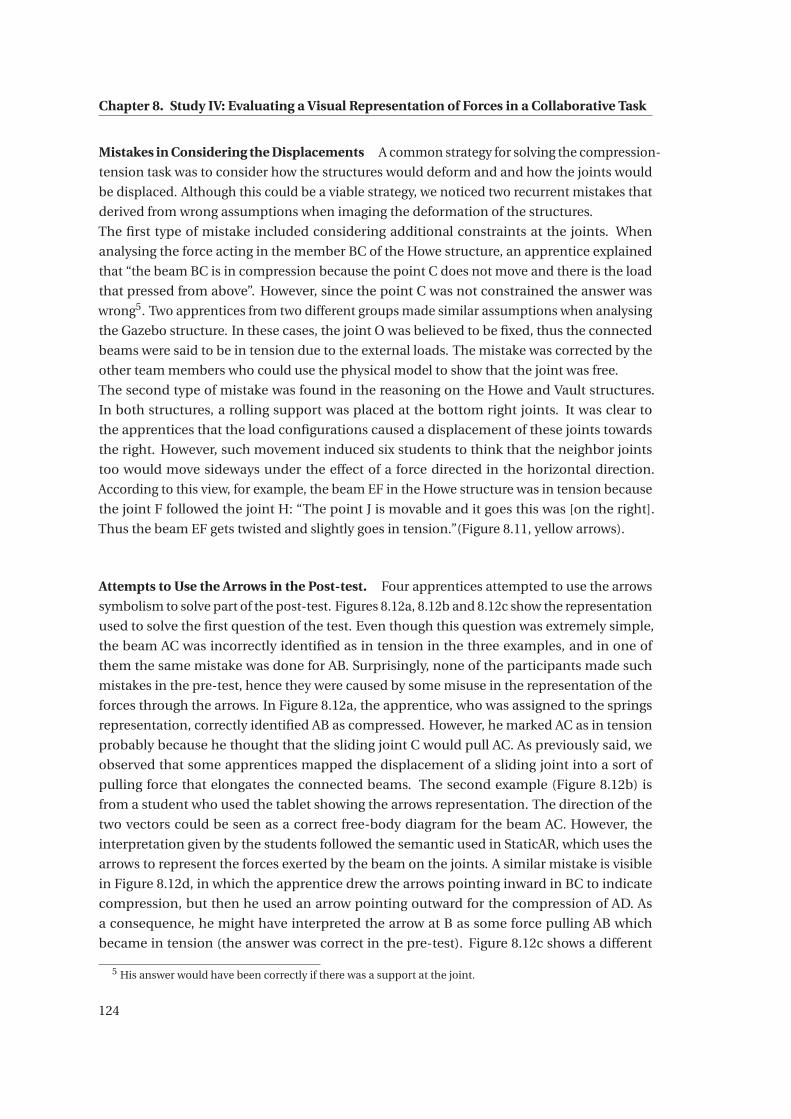
Chapter 8. Study IV: Evaluating a Visual Representation of Forces in a Collaborative Task
Mistakes in Considering the Displacements A common strategy for solving the compression-
tension task was to consider how the structures would deform and and how the joints would
be displaced. Although this could be a viable strategy, we noticed two recurrent mistakes that
derived from wrong assumptions when imaging the deformation of the structures.
The first type of mistake included considering additional constraints at the joints. When
analysing the force acting in the member BC of the Howe structure, an apprentice explained
that “the beam BC is in compression because the point C does not move and there is the load
that pressed from above”. However, since the point C was not constrained the answer was
wrong5. Two apprentices from two different groups made similar assumptions when analysing
the Gazebo structure. In these cases, the joint O was believed to be fixed, thus the connected
beams were said to be in tension due to the external loads. The mistake was corrected by the
other team members who could use the physical model to show that the joint was free.
The second type of mistake was found in the reasoning on the Howe and Vault structures.
In both structures, a rolling support was placed at the bottom right joints. It was clear to
the apprentices that the load configurations caused a displacement of these joints towards
the right. However, such movement induced six students to think that the neighbor joints
too would move sideways under the effect of a force directed in the horizontal direction.
According to this view, for example, the beam EF in the Howe structure was in tension because
the joint F followed the joint H: “The point J is movable and it goes this was [on the right].
Thus the beam EF gets twisted and slightly goes in tension.”(Figure 8.11, yellow arrows).
Attempts to Use the Arrows in the Post-test. Four apprentices attempted to use the arrows
symbolism to solve part of the post-test. Figures 8.12a, 8.12b and 8.12c show the representation
used to solve the first question of the test. Even though this question was extremely simple,
the beam AC was incorrectly identified as in tension in the three examples, and in one of
them the same mistake was done for AB. Surprisingly, none of the participants made such
mistakes in the pre-test, hence they were caused by some misuse in the representation of the
forces through the arrows. In Figure 8.12a, the apprentice, who was assigned to the springs
representation, correctly identified AB as compressed. However, he marked AC as in tension
probably because he thought that the sliding joint C would pull AC. As previously said, we
observed that some apprentices mapped the displacement of a sliding joint into a sort of
pulling force that elongates the connected beams. The second example (Figure 8.12b) is
from a student who used the tablet showing the arrows representation. The direction of the
two vectors could be seen as a correct free-body diagram for the beam AC. However, the
interpretation given by the students followed the semantic used in StaticAR, which uses the
arrows to represent the forces exerted by the beam on the joints. A similar mistake is visible
in Figure 8.12d, in which the apprentice drew the arrows pointing inward in BC to indicate
compression, but then he used an arrow pointing outward for the compression of AD. As
a consequence, he might have interpreted the arrow at B as some force pulling AB which
became in tension (the answer was correct in the pre-test). Figure 8.12c shows a different
5 His answer would have been correctly if there was a support at the joint.
124
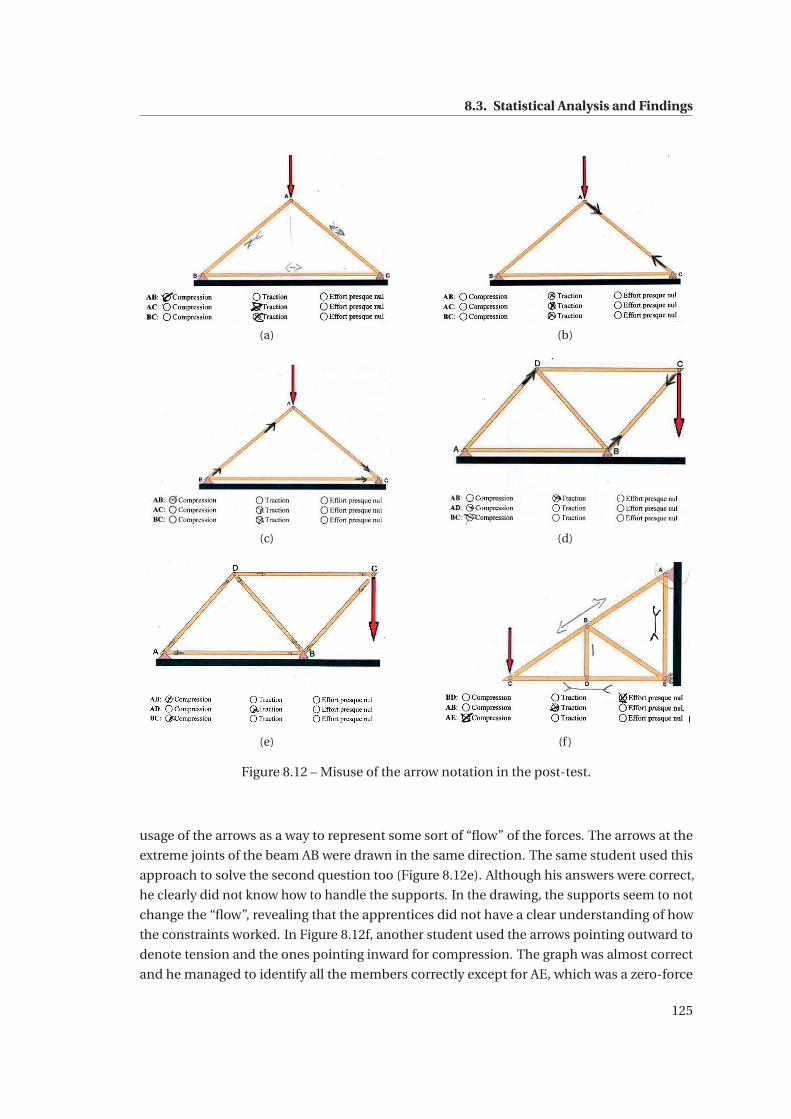
8.3. Statistical Analysis and Findings
(a) (b)
(c) (d)
(e) (f)
Figure 8.12 – Misuse of the arrow notation in the post-test.
usage of the arrows as a way to represent some sort of “flow” of the forces. The arrows at the
extreme joints of the beam AB were drawn in the same direction. The same student used this
approach to solve the second question too (Figure 8.12e). Although his answers were correct,
he clearly did not know how to handle the supports. In the drawing, the supports seem to not
change the “flow”, revealing that the apprentices did not have a clear understanding of how
the constraints worked. In Figure 8.12f, another student used the arrows pointing outward to
denote tension and the ones pointing inward for compression. The graph was almost correct
and he managed to identify all the members correctly except for AE, which was a zero-force
125
Chapter 8. Study IV: Evaluating a Visual Representation of Forces in a Collaborative Task
member. The mistake might be due to recognition of the triangular pattern ACE. Apprentices
learn that a triangle is a stable geometry and that usually there is one member in tension and
two others in compression (or vice-versa). However, often students do not pay attention to the
location of the supports and their nature, thus they make mistakes like the one just described.
Multiple Correspondence Analysis and Clustering Lastly, we performed a Multiple Corre-
spondence Analysis (MCA) on the pre-test, intervention and post-test answers, followed by a
hierarchical clustering analysis. The aim was to identify groups of apprentices whose answers
can describe recurrent difficulties. The purpose of MCA was to extract principle components
that could summarize the students’ answers. Since the answers were categorical variables
having three levels (compression, tension, zero-force), the MCA featured as a preliminary step
to transform such variables into continuous ones, which successively formed the input to
the hierarchical clustering (Ward’s method) (Husson et al., 2017, Chapter 4). The methods
employed in our analysis belonged to the R package FactoMineR (Lê et al., 2008). The number
of clusters was chosen on the basis of the heuristic rule implemented in the package. This
criterion suggests to keep the K clusters that minimize δ(K )δ(K−1) , where δ(K ) is the increment of
the between-clusters variance when passing from K-1 to K clusters (Husson et al., 2010).
The clustering of the answers given in the compression-tension task resulted in too many and
hardly interpretable clusters. Hence, we reported the results only for the pre-test and post-test
questions.
For the pre-test answers the method suggested eight clusters. The answers characterizing
the first four clusters are reported in Table 8.6. The other clusters are omitted because they
were formed by only one student each. In particular, clusters 7 and 8 were formed by two
apprentices who performed poorly during the pre-test and whose answers denoted a serious
lack of statics intuition. The first cluster was formed by the apprentices who showed to master
well the concept of zero-force member, even though with some mistakes (e.g. Q16 should be in
compression). Conversely, the answers characterizing the second cluster suggested that these
4 students did not have such concept clear since the correct answer to Q9, Q10 and Q20 was
zero-force but they never chose it. The interpretation of the third cluster should be done with
some caution since the only description was that apprentices marked the beams in questions
Q12 and Q13 as compressed. When looking at these questions, the impression was that the
mistakes rose from a poor understanding of the constraints provided by a rolling support
(in particular that such supports prevents vertical translations) that caused an erroneous
visualization of the deformations of the structures in question. A similar interpretation might
be given for the fourth cluster, especially on the account of the answer “tension” to question
Q12.
The eight clusters drastically reduced when analyzing the post-test from which we extracted
only four clusters. Four apprentices from cluster 1 moved to cluster 9, whereas 1 apprentice
came from cluster 2. The four apprentices from cluster 1 preserved their correct intuition on
the answers to Q9 and Q20 being zero-force. However, three of them and the student from the
126
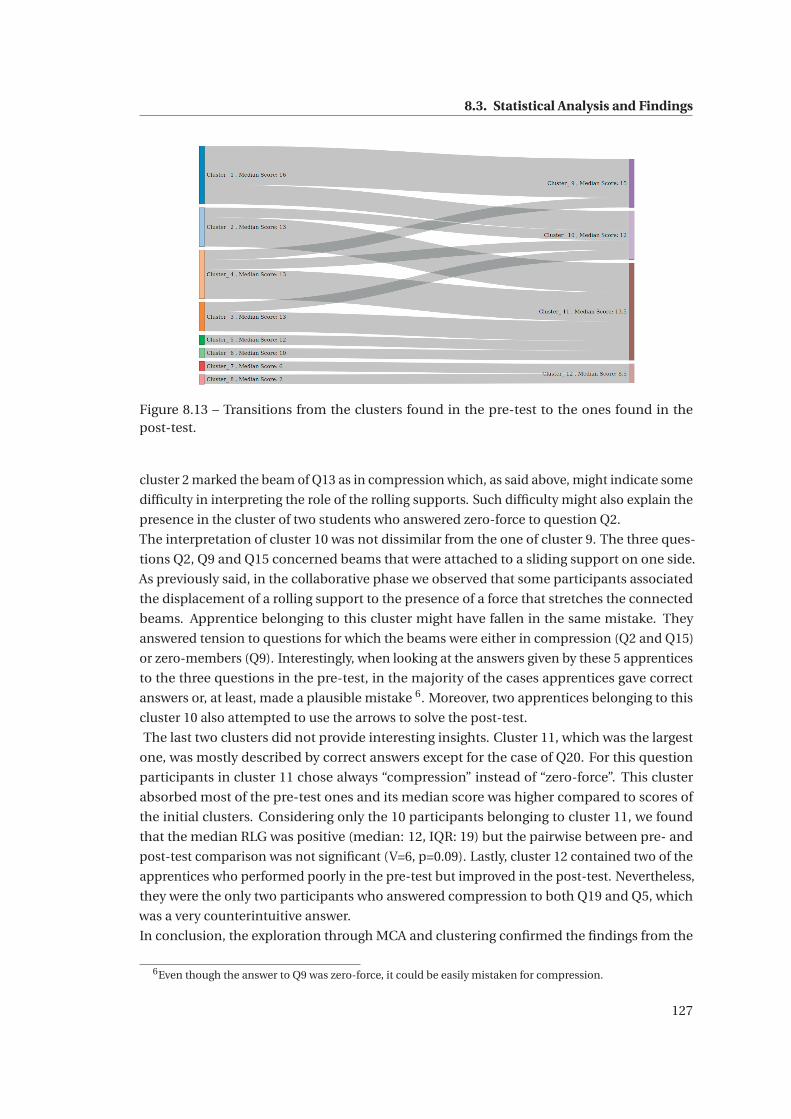
8.3. Statistical Analysis and Findings
Figure 8.13 – Transitions from the clusters found in the pre-test to the ones found in thepost-test.
cluster 2 marked the beam of Q13 as in compression which, as said above, might indicate some
difficulty in interpreting the role of the rolling supports. Such difficulty might also explain the
presence in the cluster of two students who answered zero-force to question Q2.
The interpretation of cluster 10 was not dissimilar from the one of cluster 9. The three ques-
tions Q2, Q9 and Q15 concerned beams that were attached to a sliding support on one side.
As previously said, in the collaborative phase we observed that some participants associated
the displacement of a rolling support to the presence of a force that stretches the connected
beams. Apprentice belonging to this cluster might have fallen in the same mistake. They
answered tension to questions for which the beams were either in compression (Q2 and Q15)
or zero-members (Q9). Interestingly, when looking at the answers given by these 5 apprentices
to the three questions in the pre-test, in the majority of the cases apprentices gave correct
answers or, at least, made a plausible mistake 6. Moreover, two apprentices belonging to this
cluster 10 also attempted to use the arrows to solve the post-test.
The last two clusters did not provide interesting insights. Cluster 11, which was the largest
one, was mostly described by correct answers except for the case of Q20. For this question
participants in cluster 11 chose always “compression” instead of “zero-force”. This cluster
absorbed most of the pre-test ones and its median score was higher compared to scores of
the initial clusters. Considering only the 10 participants belonging to cluster 11, we found
that the median RLG was positive (median: 12, IQR: 19) but the pairwise between pre- and
post-test comparison was not significant (V=6, p=0.09). Lastly, cluster 12 contained two of the
apprentices who performed poorly in the pre-test but improved in the post-test. Nevertheless,
they were the only two participants who answered compression to both Q19 and Q5, which
was a very counterintuitive answer.
In conclusion, the exploration through MCA and clustering confirmed the findings from the
6Even though the answer to Q9 was zero-force, it could be easily mistaken for compression.
127
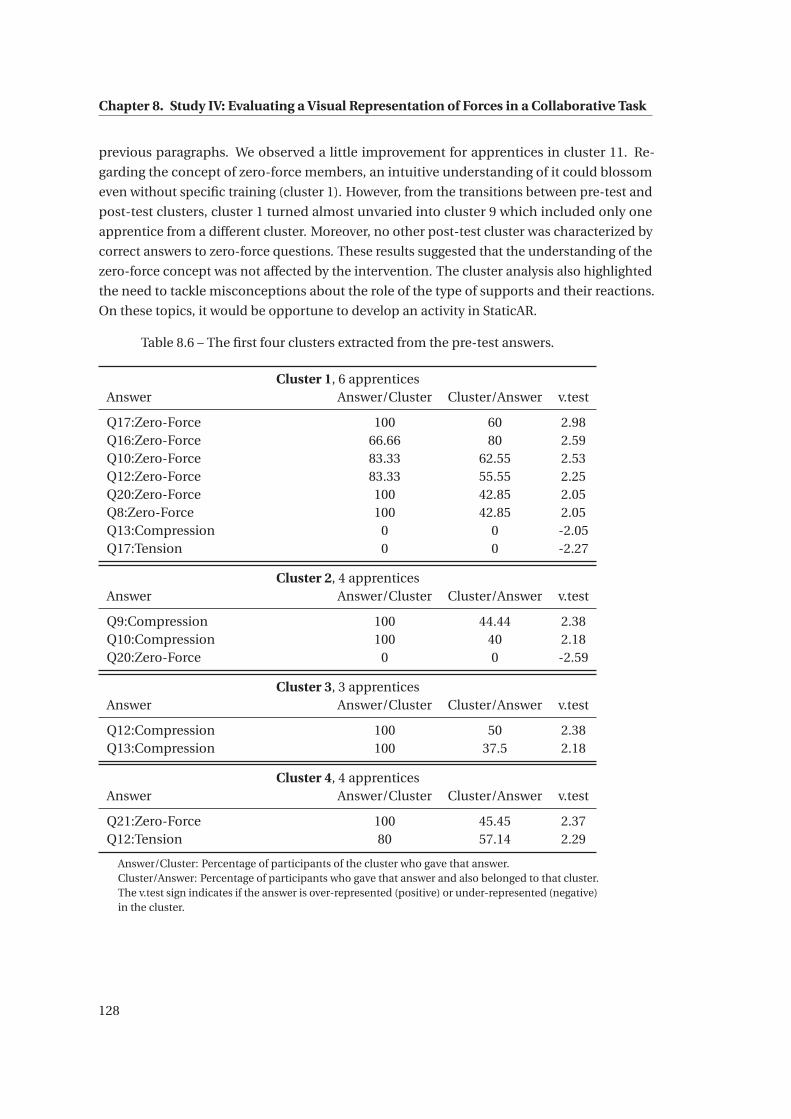
Chapter 8. Study IV: Evaluating a Visual Representation of Forces in a Collaborative Task
previous paragraphs. We observed a little improvement for apprentices in cluster 11. Re-
garding the concept of zero-force members, an intuitive understanding of it could blossom
even without specific training (cluster 1). However, from the transitions between pre-test and
post-test clusters, cluster 1 turned almost unvaried into cluster 9 which included only one
apprentice from a different cluster. Moreover, no other post-test cluster was characterized by
correct answers to zero-force questions. These results suggested that the understanding of the
zero-force concept was not affected by the intervention. The cluster analysis also highlighted
the need to tackle misconceptions about the role of the type of supports and their reactions.
On these topics, it would be opportune to develop an activity in StaticAR.
Table 8.6 – The first four clusters extracted from the pre-test answers.
Cluster 1, 6 apprenticesAnswer Answer/Cluster Cluster/Answer v.test
Q17:Zero-Force 100 60 2.98Q16:Zero-Force 66.66 80 2.59Q10:Zero-Force 83.33 62.55 2.53Q12:Zero-Force 83.33 55.55 2.25Q20:Zero-Force 100 42.85 2.05Q8:Zero-Force 100 42.85 2.05Q13:Compression 0 0 -2.05Q17:Tension 0 0 -2.27
Cluster 2, 4 apprenticesAnswer Answer/Cluster Cluster/Answer v.test
Q9:Compression 100 44.44 2.38Q10:Compression 100 40 2.18Q20:Zero-Force 0 0 -2.59
Cluster 3, 3 apprenticesAnswer Answer/Cluster Cluster/Answer v.test
Q12:Compression 100 50 2.38Q13:Compression 100 37.5 2.18
Cluster 4, 4 apprenticesAnswer Answer/Cluster Cluster/Answer v.test
Q21:Zero-Force 100 45.45 2.37Q12:Tension 80 57.14 2.29
Answer/Cluster: Percentage of participants of the cluster who gave that answer.Cluster/Answer: Percentage of participants who gave that answer and also belonged to that cluster.The v.test sign indicates if the answer is over-represented (positive) or under-represented (negative)in the cluster.
128
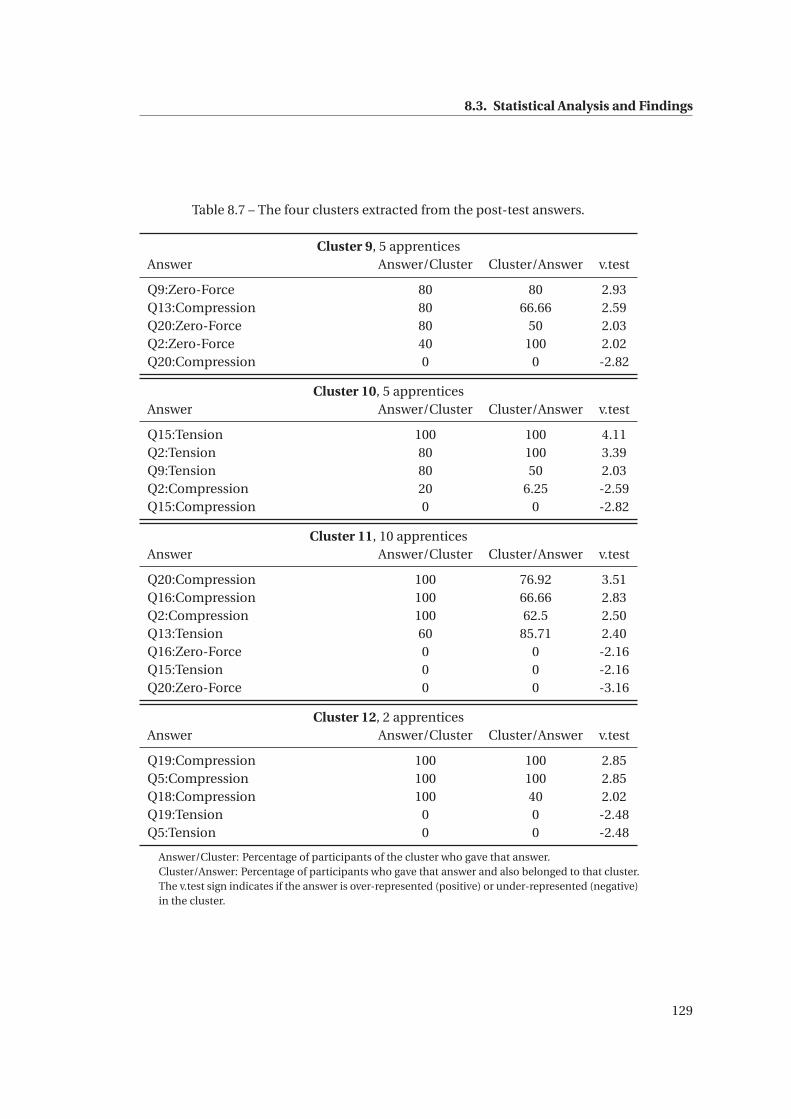
8.3. Statistical Analysis and Findings
Table 8.7 – The four clusters extracted from the post-test answers.
Cluster 9, 5 apprenticesAnswer Answer/Cluster Cluster/Answer v.test
Q9:Zero-Force 80 80 2.93Q13:Compression 80 66.66 2.59Q20:Zero-Force 80 50 2.03Q2:Zero-Force 40 100 2.02Q20:Compression 0 0 -2.82
Cluster 10, 5 apprenticesAnswer Answer/Cluster Cluster/Answer v.test
Q15:Tension 100 100 4.11Q2:Tension 80 100 3.39Q9:Tension 80 50 2.03Q2:Compression 20 6.25 -2.59Q15:Compression 0 0 -2.82
Cluster 11, 10 apprenticesAnswer Answer/Cluster Cluster/Answer v.test
Q20:Compression 100 76.92 3.51Q16:Compression 100 66.66 2.83Q2:Compression 100 62.5 2.50Q13:Tension 60 85.71 2.40Q16:Zero-Force 0 0 -2.16Q15:Tension 0 0 -2.16Q20:Zero-Force 0 0 -3.16
Cluster 12, 2 apprenticesAnswer Answer/Cluster Cluster/Answer v.test
Q19:Compression 100 100 2.85Q5:Compression 100 100 2.85Q18:Compression 100 40 2.02Q19:Tension 0 0 -2.48Q5:Tension 0 0 -2.48
Answer/Cluster: Percentage of participants of the cluster who gave that answer.Cluster/Answer: Percentage of participants who gave that answer and also belonged to that cluster.The v.test sign indicates if the answer is over-represented (positive) or under-represented (negative)in the cluster.
129
Chapter 8. Study IV: Evaluating a Visual Representation of Forces in a Collaborative Task
8.4 Discussion
The experiment ran smoothly and no major issue was reported by participants. From their
perspective the technology was obviously not novel: it appeared as a regular mobile app, and
one student even asked if it was available on the app markets. The apprentices got quickly used
to the interface and expressed a general positive appreciation for the tools that it provides.
The teachers’ feedback was positive too. They particularly appreciated the fact that the activity
was not built only around the tablets but it encompassed the collaboration between students
and the interaction with physical models too. Thus, they saw the potential for integrating
StaticAR in the current practice because it does not completely revolutionize it.
The first aim of this study was to show whether the activity could lead to any learning gain.
It was frustrating to see the lack of significant improvement in the average score between
pre- and post-test. The average learning gain was marginally positive, although the standard
deviation was quite large (16%). The adoption of either one representation or another did not
have an effect on the learning gain. As said above, a possible explanation for the result was
that in the collaborative phase the apprentices shared their tablets, hence they had access to
both representations.
Whether the apprentices worked with forces represented by arrows or by springs, the aver-
age scores in the individual phase of the experimental task were similar. The collaboration
phase did not lead to a general improvement of the intervention scores. However, our finding
suggested that the success of the collaboration phase could depend on the similarity of the
apprentices’ prior knowledge. It is well known from collaborative learning and computer-
supporter collaborative learning research that there is no golden rule to decide whether a
group should be composed by homogeneous learners (e.g. same level of abilities, same culture,
etc. ) or heterogeneous ones (Dillenbourg and Schneider, 1995). Some authors found that
heterogeneous groups explore more the problem space and create more alternative explana-
tions which results in a reacher learning experience (Jermann and Dillenbourg, 2003). Other
works have shown that when learners are involved in learning processes on complex topics,
such as maths or physics, homogeneous dyads performed better than heterogeneous ones
(Fuchs et al., 1998; Gijlers and De Jong, 2005). Our results leaned towards the second case. The
number of equal answers given in the pre-test by two participants, whether these answers
were correct or incorrect, had a positive significant effect on the score of the collaboration
phase, whereas the pre-test score did not have any correlation with the score of the individual
phase. It seemed that scoring high in the pre-test did not influence the score in the interven-
tion when working individually. However, working with someone who gave similar answers
created a fertile ground for achieving high score in the collaboration phase. Especially when
considering that the experiment duration was likely to be insufficient to consolidate new
intuitions, pairing students having a large gap between their abilities might not have resulted
in the reciprocal scaffolding, but it could have hindered the peer who was in a transitional
state. The results seem to suggest that the development of an intuitive understanding of statics
requires collaboration between learners who have a homogeneous prior-knowledge.
130
8.4. Discussion
If the quantitative analysis did not offer many insights about the effects of activity, the qual-
itative analysis of the dialogues revealed a germ of correct understanding in some of the
apprentices’ reasoning which were deeply influenced by the two representations.
An example was given by the episode about the mismatch of gestures and speech that we
interpreted in the light of the studies of Perry, Church and Goldin-Meadow (Perry et al., 1992).
According to the authors, the occurrence of gesture-speech mismatches can be considered a
signal of transitional knowledge in a person’s acquisition of a new concept. Since the concept
has not been consolidated yet, the learner produces alternative procedures that emerge ei-
ther in the verbal explanation or in gestures. This description could be well adapted to the
episode we have described, in which the two representations proposed by the tablet, arrows
and springs, were present in the apprentice’s hand gestures and speech and successively
integrated.
We also observed several episodes in which the two representations were not recognized as
equivalent. Moreover, their incorrect or partial integration led to their misuse in the post-test,
which introduced errors that were absent in the pre-test. The erroneous usage of the arrows
in the post-test resembled the findings of Heckler (Heckler, 2010). The author reported that
prompting students to draw free body diagrams increases the number of mistakes when
students do not master this representation. In our study, we did not prompt apprentices but
something similar happened. Some of them drew the arrows to make their own descriptions
of the problems but they mechanically interpreted them according to the semantic used in
StaticAR. What would have happened if these participants had drawn the springs together
with the arrows? It is likely that they would have used the arrows in a redundant way, for
example drawing inward arrows around a compressed spring. Of the two concepts included in
the spring metaphor, namely the deformation and the consequent reaction, the deformation
resulted to be too dominant and the arrows failed to activate the idea of reaction. As observed
in the example reported in the paragraph about the force representation, some participants
described the joints of a compressed beam as being pulled by the beam itself. Furthermore,
the pinch and the spread gestures, which were used to convey the compression and elongation
of the springs, made the misconception stronger because the reaction does not emerge from
them. In order to handle these issues, both the augmentation and the learning activity could
be improved. As regards the digital augmentation, probably the fact that the springs were
placed at the centre of the beams gave the impression that they were floating, nothing was
holding them and, therefore, there was no reaction. It might be better to place the springs
either all along the beams or at their extremes. In this way the springs of connected beams are
linked and this would highlight that there is interaction between them. From a different per-
spective, a more effective way to convey the idea of reaction of a single beam could be through
other perceptual modalities than the visual one. Complementing the visual augmentation
with haptic feedback could be one solution, as proposed in (Reiner, 1999; Wiebe et al., 2009;
Han and Black, 2011). Another alternative that does not require special hardware could be the
implementation of audio feedback (Roodaki et al., 2017). In this case, it would be interesting
to investigate what would be a good sonification for the behaviour of the beams.
In terms of learning activity, it might be helpful to integrate our activity into a more com-
131
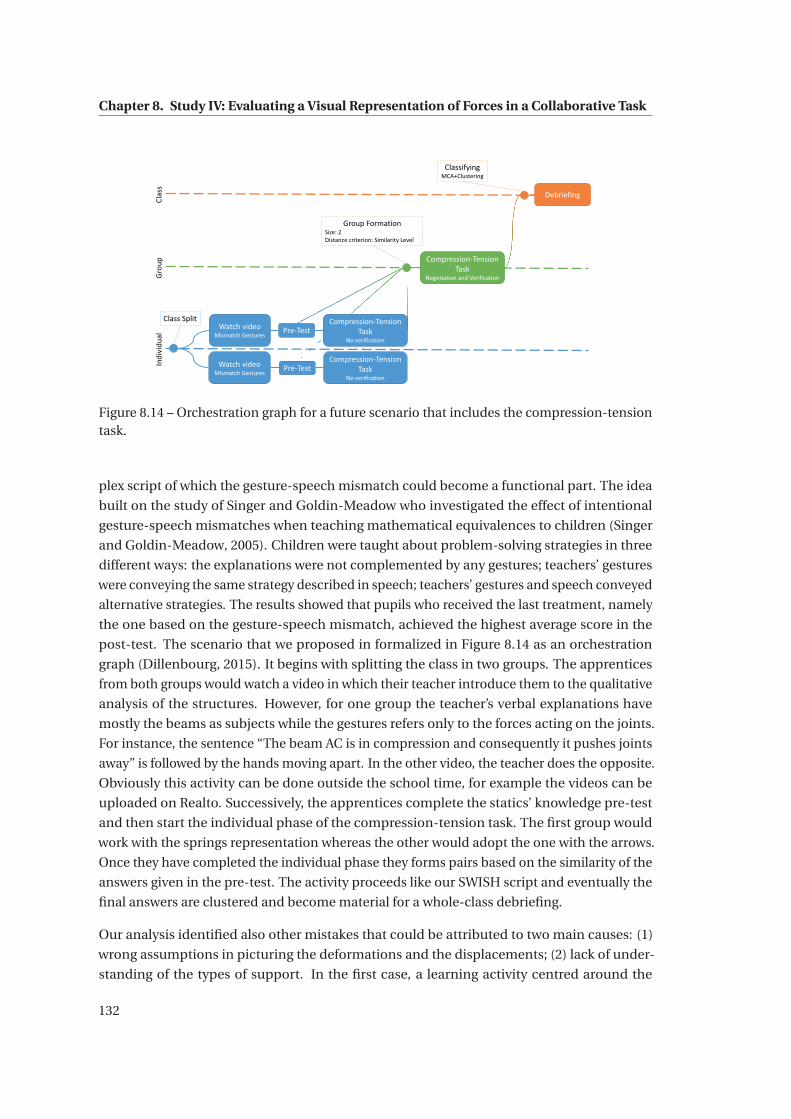
Chapter 8. Study IV: Evaluating a Visual Representation of Forces in a Collaborative Task
Clas
sG
roup
Watch videoMismatch Gestures
Compression-Tension Task
No verificationPre-Test
Pre-Test
Compression-Tension Task
Negotiation and Verification
Debriefing
Class Split
Group FormationSize: 2Distance criterion: Similarity Level
ClassifyingMCA+Clustering
Indi
vidu
al
Watch videoMismatch Gestures
Compression-Tension Task
No verification
Figure 8.14 – Orchestration graph for a future scenario that includes the compression-tensiontask.
plex script of which the gesture-speech mismatch could become a functional part. The idea
built on the study of Singer and Goldin-Meadow who investigated the effect of intentional
gesture-speech mismatches when teaching mathematical equivalences to children (Singer
and Goldin-Meadow, 2005). Children were taught about problem-solving strategies in three
different ways: the explanations were not complemented by any gestures; teachers’ gestures
were conveying the same strategy described in speech; teachers’ gestures and speech conveyed
alternative strategies. The results showed that pupils who received the last treatment, namely
the one based on the gesture-speech mismatch, achieved the highest average score in the
post-test. The scenario that we proposed in formalized in Figure 8.14 as an orchestration
graph (Dillenbourg, 2015). It begins with splitting the class in two groups. The apprentices
from both groups would watch a video in which their teacher introduce them to the qualitative
analysis of the structures. However, for one group the teacher’s verbal explanations have
mostly the beams as subjects while the gestures refers only to the forces acting on the joints.
For instance, the sentence “The beam AC is in compression and consequently it pushes joints
away” is followed by the hands moving apart. In the other video, the teacher does the opposite.
Obviously this activity can be done outside the school time, for example the videos can be
uploaded on Realto. Successively, the apprentices complete the statics’ knowledge pre-test
and then start the individual phase of the compression-tension task. The first group would
work with the springs representation whereas the other would adopt the one with the arrows.
Once they have completed the individual phase they forms pairs based on the similarity of the
answers given in the pre-test. The activity proceeds like our SWISH script and eventually the
final answers are clustered and become material for a whole-class debriefing.
Our analysis identified also other mistakes that could be attributed to two main causes: (1)
wrong assumptions in picturing the deformations and the displacements; (2) lack of under-
standing of the types of support. In the first case, a learning activity centred around the
132
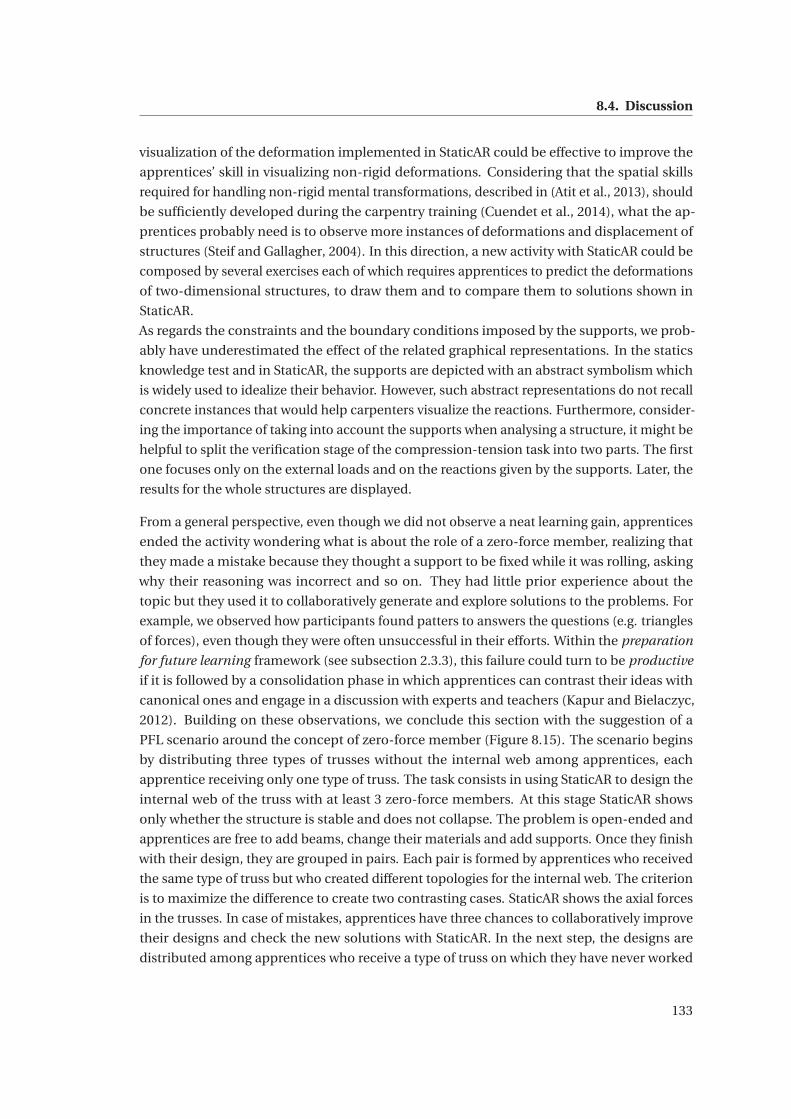
8.4. Discussion
visualization of the deformation implemented in StaticAR could be effective to improve the
apprentices’ skill in visualizing non-rigid deformations. Considering that the spatial skills
required for handling non-rigid mental transformations, described in (Atit et al., 2013), should
be sufficiently developed during the carpentry training (Cuendet et al., 2014), what the ap-
prentices probably need is to observe more instances of deformations and displacement of
structures (Steif and Gallagher, 2004). In this direction, a new activity with StaticAR could be
composed by several exercises each of which requires apprentices to predict the deformations
of two-dimensional structures, to draw them and to compare them to solutions shown in
StaticAR.
As regards the constraints and the boundary conditions imposed by the supports, we prob-
ably have underestimated the effect of the related graphical representations. In the statics
knowledge test and in StaticAR, the supports are depicted with an abstract symbolism which
is widely used to idealize their behavior. However, such abstract representations do not recall
concrete instances that would help carpenters visualize the reactions. Furthermore, consider-
ing the importance of taking into account the supports when analysing a structure, it might be
helpful to split the verification stage of the compression-tension task into two parts. The first
one focuses only on the external loads and on the reactions given by the supports. Later, the
results for the whole structures are displayed.
From a general perspective, even though we did not observe a neat learning gain, apprentices
ended the activity wondering what is about the role of a zero-force member, realizing that
they made a mistake because they thought a support to be fixed while it was rolling, asking
why their reasoning was incorrect and so on. They had little prior experience about the
topic but they used it to collaboratively generate and explore solutions to the problems. For
example, we observed how participants found patters to answers the questions (e.g. triangles
of forces), even though they were often unsuccessful in their efforts. Within the preparation
for future learning framework (see subsection 2.3.3), this failure could turn to be productive
if it is followed by a consolidation phase in which apprentices can contrast their ideas with
canonical ones and engage in a discussion with experts and teachers (Kapur and Bielaczyc,
2012). Building on these observations, we conclude this section with the suggestion of a
PFL scenario around the concept of zero-force member (Figure 8.15). The scenario begins
by distributing three types of trusses without the internal web among apprentices, each
apprentice receiving only one type of truss. The task consists in using StaticAR to design the
internal web of the truss with at least 3 zero-force members. At this stage StaticAR shows
only whether the structure is stable and does not collapse. The problem is open-ended and
apprentices are free to add beams, change their materials and add supports. Once they finish
with their design, they are grouped in pairs. Each pair is formed by apprentices who received
the same type of truss but who created different topologies for the internal web. The criterion
is to maximize the difference to create two contrasting cases. StaticAR shows the axial forces
in the trusses. In case of mistakes, apprentices have three chances to collaboratively improve
their designs and check the new solutions with StaticAR. In the next step, the designs are
distributed among apprentices who receive a type of truss on which they have never worked
133
Chapter 8. Study IV: Evaluating a Visual Representation of Forces in a Collaborative Task
Indi
vidu
alCl
ass
Gro
up
Class Split
Group FormationSize: 2Distance criterion: Topology Difference
Groupingby Type
Design of theinternal web
Comparison and Re-DesignComparison and Rean Design
Identification
Debriefing and Comparison with Commercial Trusseswith Commercial Trusses
SplittingCriterion: Working on a truss type which was never seen before
Figure 8.15 – Orchestration graph for PFL scenario about the concept of zero-force members.
in the previous phases (new contrasting case). In this individual step, the task consists in
identifying the zero-force members in the internal web. In case of mistakes apprentices can
give a new answer, up to three attempts. Lastly, the teacher receives the designs and initiate a
class discussion confronting apprentices’ designs with those of standard pre-build trusses.
8.5 Conclusions
We have presented a collaborative version of the tension-compression task in which pairs of
apprentices used StaticAR to solve it. Although the pre/post-test comparison did not reveal
any learning gain, the activity worked well: both apprentices and teachers saw the potentiality
of the tool in being integrated in the curriculum.
Both the activity and the tool could be improved. The students found difficulties in under-
standing the relation between the two representations of the axial forces, arrows and springs,
although we observed also cases of correct reasoning influenced by the two graphical nota-
tions. A result that deserves future investigation was that the outcome of the collaboration
might benefit from pairing students with a similar level of prior knowledge. For these findings
we suggested to integrate the script used for this experiment in a more complex one, in which
the introduction to the concepts of the task becomes part of the SWISH design. Lastly, we
summarized common mistakes from the apprentices by using unsupervised clustering meth-
ods and we proposed activities that could be implements directly within the current version
of StaticAR.
134
9 General Discussion
These last sections summarize the findings from the four studies presented in order to highlight
the contributions, the limitations and the opportunities that could inspire future research
directions.
9.1 Roadmap of the Results
• We found that the gaze measures we used confirmed some of the benefits associated
to tangible interaction. These are the facilitation of constructing the mental models of
3D shapes and of translating users’ execution plan into interface actions. Even though
we hypothesized that such benefits depended on the matching between the physical
appearance of the tangible interfaces and their digital representation, we found that
the advantages persisted even when the digital-physical coupling vanished over time
and that users modified their task-solving strategies in order to mitigate the effect of
this loss.
• From our comparative study, it did not emerge any clear advantage in exploring stat-
ics concepts through the manipulation of interactive physical models. Compared to
the adoption of non-interactive models, the task performance and the learning gain
did not significantly differ. In addition, some elements of the interactive models could
drive away the learners’ focus from the areas relevant to the solution of the given
problems.
• In handheld AR systems, real-world objects that form the background for the augmen-
tation also affect the users’ experience, even when they are not explicitly designed to
be functional to the systems. Moving the visual attention from the device to physi-
cal objects sustains the users’ spatial orientation within the digital and the physical
spaces. Furthermore, we found that the occurrence of shifts of visual attention was not
influenced by the task difficulty, by the setup of the device or by users’ spatial abilities,
although these factors might affect some other characteristics like their duration.
135
Chapter 9. General Discussion
• The combination of two types of representations, springs and arrows, that were de-
veloped to depict axial forces within a structure, could effectively induce a correct
intuition of statics principles when students worked collaboratively. Nevertheless,
difficulties in their interpretation were frequent and we identified common issues ex-
hibited by apprentices and proposed the implementation of new learning actives to
address them.
9.2 Contributions
9.2.1 Fostering an Intuitive Understanding of Statics
Can apprentices develop an intuitive understanding of statics without going into the math-
ematical formalisms? In other learning contexts, previous works have shown that this goal
could be reached (described in Chapter 2). Hence, we believe that the answer to this question
is still positive. The aim of this dissertation has been to explore how to fulfil our purposes
within the vocational education context.
In our last study, the improvements observed in some apprentices indicated that our aug-
mented reality environment can help in developing statics reasoning abilities, although it was
not possible to show a significant learning gain. One might wonder whether there was any
improvement compared to the performance achieved by apprentices in study presented in
chapter 5. When looking at Figure 9.1 it is possible to notice that the relative learning gains
were not statistically different in the four experimental conditions. Ironically, the highest
median was found when apprentices worked with non-interactive structures and received the
simple feedback “correct/incorrect” from the experimenters. Besides the concerns about the
validity of the pre-test and post-test (see below), the two studies were not meant to prove the
existence of one best solution. The first study has highlighted that activities meant to foster a
conceptual understanding of statics did not necessarily benefit from hands-on exploration.
The result was not novel and gave support to previous claims that the manipulation of physical
tools does not guarantee learning (McNeil and Jarvin, 2007; Han et al., 2009; Alfieri et al., 2011).
Our contribution has been to show the reason why this happened by comparing the gaze
behaviors of apprentices and experts. The spring mechanisms that we designed to make
the models interactive and to provide a visual feedback of the axial forces acting on them,
absorbed participants’ attention at the expense of other parts of the models that experts took
into account. These parts were relevant to understand how forces balanced each other and
reached the equilibrium. On the contrary, the gaze behavior of apprentices who worked in
the non-exploratory condition was closer to the experts’ one. Based on these results, we
proposed the augmentation through StaticAR as a way to overcome the observed limitations.
The presence of small-scale wooden models remained a crucial aspect of our AR environment,
but we chose not to pursue the idea of augmenting interactive structures after weighting
up the findings and other factors, like the time to manufacture them and its cost, following
the suggestion in (Klahr et al., 2007). Nevertheless, adopting StaticAR in combination with
136
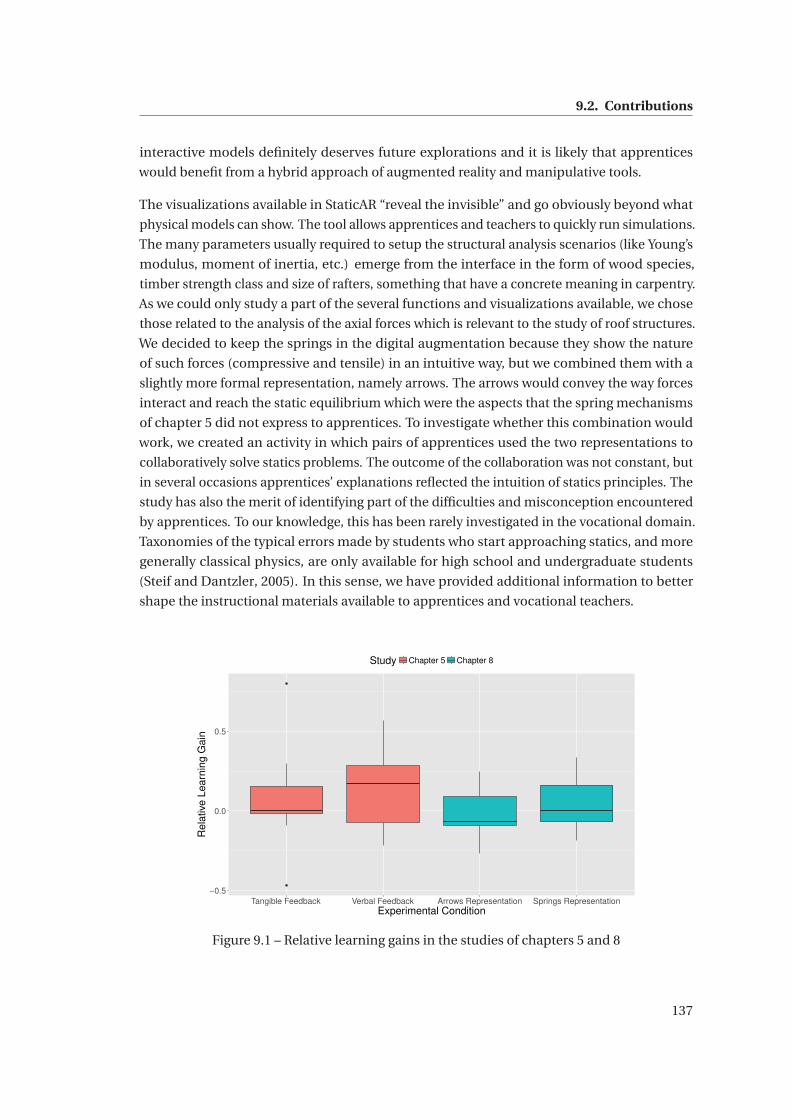
9.2. Contributions
interactive models definitely deserves future explorations and it is likely that apprentices
would benefit from a hybrid approach of augmented reality and manipulative tools.
The visualizations available in StaticAR “reveal the invisible” and go obviously beyond what
physical models can show. The tool allows apprentices and teachers to quickly run simulations.
The many parameters usually required to setup the structural analysis scenarios (like Young’s
modulus, moment of inertia, etc.) emerge from the interface in the form of wood species,
timber strength class and size of rafters, something that have a concrete meaning in carpentry.
As we could only study a part of the several functions and visualizations available, we chose
those related to the analysis of the axial forces which is relevant to the study of roof structures.
We decided to keep the springs in the digital augmentation because they show the nature
of such forces (compressive and tensile) in an intuitive way, but we combined them with a
slightly more formal representation, namely arrows. The arrows would convey the way forces
interact and reach the static equilibrium which were the aspects that the spring mechanisms
of chapter 5 did not express to apprentices. To investigate whether this combination would
work, we created an activity in which pairs of apprentices used the two representations to
collaboratively solve statics problems. The outcome of the collaboration was not constant, but
in several occasions apprentices’ explanations reflected the intuition of statics principles. The
study has also the merit of identifying part of the difficulties and misconception encountered
by apprentices. To our knowledge, this has been rarely investigated in the vocational domain.
Taxonomies of the typical errors made by students who start approaching statics, and more
generally classical physics, are only available for high school and undergraduate students
(Steif and Dantzler, 2005). In this sense, we have provided additional information to better
shape the instructional materials available to apprentices and vocational teachers.
−0.5
0.0
0.5
Tangible Feedback Verbal Feedback Arrows Representation Springs RepresentationExperimental Condition
Rel
ativ
e Le
arni
ng G
ain
Study Chapter 5 Chapter 8
Figure 9.1 – Relative learning gains in the studies of chapters 5 and 8
137
Chapter 9. General Discussion
9.2.2 The role of physical objects in AR systems
We have been able to provide empirical support for the positive impacts that tangible interac-
tion could have on users’ experience as described by other authors (Marshall, 2007; Antle and
Wise, 2013). The contribution came mainly from the application of the eye-tracking methods
that has recently become more common in research areas of tangible interaction and TUIs
(Schneider et al., 2015, 2016). In particular, the claims that attribute to tangibles the advantage
of promoting a more readily comprehension of 3D shapes compared to digital visualizations
found confirmation in our third study too (the one about the shifts of visual attention). Even
though in that setup the manipulation of the physical structures did not have any effect on the
AR experience, one of the findings was that the aid associated to the perception of complex
geometries was reflected in a higher number of fixations in the participants’ gaze when they
were looking at challenging structures.
In both the studies of chapters 4 and 7, the participants worked within mixed-reality environ-
ments where they needed to link the virtual and the real-world spaces. The study of chapter 7
confirmed that this connection could be facilitated by the physical entities since they exist in
both spaces and act as anchors and spatial cues. Gaze-shifts were due to participants’ change
of position and it is very likely that the same motivation brought participants in the study of
chapter 4 to look at the physical shape. In that case, the anchoring function was even more
precious because in the experimental setup the physical space (the workspace printed on
paper) and the digital space (the screen) were not overlapping. The issue of sustaining users’
spatial perception is well known in mixed-reality research, especially for what concerns the
design of immersive environments where the user cannot rely on natural multi-sensory during
locomotion (Darken and Peterson, 2001). In outdoor environment it has been shown that
looking at the real-world surroundings and introducing artificial spatial cues in the AR appli-
cations help users to keep the spatial orientation. (Veas et al., 2010; Tatzgern et al., 2015). Our
findings suggested the possibility to use physical objects as spatial cues in indoor mixed-reality
systems too.
Another result from the first study was that participants kept on referring to the physical
interface even when its shape began to diverge from the shape of its digital counterpart, which
made us reject our tokenization hypothesis. This finding should be discussed in the light of the
fact that tangibles usually cannot accommodate the changes of their digital representations
(few exceptions like (Follmer et al., 2013) ). As a consequence, in application where the digital
entities mutate (e.g. CAD) either the digital shape changes according to the physical one or
the tangibles are mere controllers (examples in (Marner and Thomas, 2010; Wendrich and
Kruiper, 2017) ). We showed that tangibles can keep their representational role in this kind of
applications too, in the sense that, even when the physical correspondence is partially lost,
they embed the properties of the digital representations that go beyond the properties of
tokens (presence, position, proximity). Furthermore, the loss of physical correspondence was,
to some extent, actively avoided by the participants. Our tangible interface could not accom-
modate the changes of its digital representation, so participants changed their task-solving
strategy in order to preserve that part of information they probably could not reconstruct from
138
9.3. Limitations
somewhere else. Therefore, the question is how to identify these properties and the users’
purposes that they serve. A guideline is to design the experimental tasks in such a way that
there is a straightforward and obvious strategy that nullifies the hypothesized advantage. Since
users are quite reluctant to lose the advantage, alternative strategies would emerge. From our
experience, we hypothesize that the aforementioned anchoring role does not dissolve when
relaxing the correspondence between physical and digital shapes. Similarly, we believe that a
complete physical representation is not required to build a mental model when working with
an object made of symmetrical pieces. As resulted form the interviews in chapter 7, the real
object could be reduced to just one of symmetrical pieces.
9.3 Limitations
The design of StaticAR would have profited from having the vocational teachers more involved
in it. However, the problem of introducing statics was novel and only recently teachers started
to have a better idea of its facets. As a consequence, with StaticAR we have tried to anticipate,
to some extent, what would be needed in the future. Several features, as well as their potential
employment in learning activities, have remained untested. In terms of usability, we could see
that StaticAR worked well when the apprentices worked in pairs and their teachers feedback
were positive. Nevertheless, the activity still resembled too much an experiment rather than a
class activity. Another aspect we could not study was whether StaticAR is a teaching tool or
a learning tool. We believe it could serve both purposes. The tension-compression task was
definitely meant to be part of a learning activity, but the default visualizations can be used by
teachers during a lesson. In conclusion, we see a clear need for studying in which conditions a
classroom activity would work well and which tools should be introduced to assist teachers in
this task.
Assessing the learning gain was difficult too. We have created the statics knowledge test and
the compression-tension task with the help of carpentry teachers, but we could not thoroughly
evaluate to what extent the performance in the test and in the task reflects apprentices’ level
of intuitive understanding and its development. The current version of the statics knowledge
test covers only the analysis of truss structures for which it provides a coarse assessment of
apprentices’ abilities. The single questions are not tuned to provide a measure of how well a
topic is mastered, for instance the knowledge of the types of supports and the understanding of
the load directions. Furthermore, it advantages those apprentices who work in contact to this
type of structures because the pictorial representations recall familiar scenarios. A carpenter
who manufactures spiral staircases would probably manifest an intuitive understanding of
statics that does not get triggered by a pictorial representation of a roof structure. It follows that
the test should be extended to encompass questions about other topics besides trusses, such
as bending of beams and displacements. Obviously, this would increase its duration and make
more difficult to run interventions in the short time that teachers can spare to explore novel
solutions. Lastly, in chapter 5 we also noticed that participants’ spatial skills were correlated
with their score of pre-test, done on paper, but not to their score in the intervention, done on
139
Chapter 9. General Discussion
physical structures. This also raises questions about the choice of appropriate media for the
test.
The development of StaticAR has been informed by data collected in the carpentry training
context. Teachers and apprentices who were involved in our design process came from the
same population and we tailored tasks and functions of StaticAR for the the carpentry world.
It seems reasonable to wonder whether our findings are generalizable to other vocational
professions.
Apprentices could be more motivated in exploring the physics of structures if they could
bring to the classroom the structure on which they are working. This would create the flow
of experiences described in the Erfahrraum (see chapter 6). The app presented in the same
chapter, which allows apprentices and teachers to draw structures and create the configuration
files for StaticAR, represents part of our effort that went into setting this flow of experiences
in motion. We have an ecosystem of tools (StaticAR, drawing app, Realto) that, in principle,
should create resources able to cross the boundary of the contexts in which apprentices learn.
Due to project constraints, the evaluation of the bottlenecks in the above process has been left
for future work.
9.4 Future Research Directions
It is not hard to imagine that part of the work that could be done in the future naturally
comes from the limitations we have just discussed. One future direction would be to create
a vocational statics concept inventory: a set of instruments to assess the level of intuitive
understanding of statics. We used Multiple Correspondence Analysis to extract clusters of
students who had the same difficulties, however some clusters could hardly be interpreted.
Having a more powerful instrument becomes crucial for any researcher who pursues objectives
similar to ours. An interesting opportunity is to implement such tools using an augmented
reality system like StaticAR, which would overcome the bias that affects paper-based tests
related to differences in participants’ spatial abilities. It would also bring the advantage of
keeping a digital trace of apprentices’ states that can be used, as proposed in the orchestration
graph in chapter 8, as criterion to form groups in classroom activities.
We imagined StaticAR as an environment in which apprentices enter, get instructions about
the topic and the task on which they will work, take an activity and hopefully develop some
correct qualitative understanding. This is an ambitious goal that could drive future extensions
of our work. However, the last study highlighted the potential of StaticAR as a preparation
for future learning tool (PFL, subsection 2.3.3). Our activity made apprentices’ curiosity
arise, pushed them to reflect on their answers and made them realize their mistakes without
necessarily achieving any learning gain in the traditional sense (pre/post-test comparison).
These observations brought us to design a possible PFL scenario in which StaticAR would
support apprentices’ elaborations and explorations so that they could be ready to attend class
lectures. Compared to the initial goal, this aim looks less ambitious. Nevertheless, if gaining a
140
9.4. Future Research Directions
conceptual understanding of statics benefits from a PFL approach, the role of StaticAR would
be more modest, but it would still remain a precious learning resource.
Considering the hype around mixed-reality systems and their application to the learning
domain, a question that might puzzle designers and developers is to what extent the real-
world should be made accessible. It is also a question of where to place a system in the
reality-virtuality continuum (chapter 2) and what type of roles physical representations or
the physical surroundings are expected to have. Design guidelines are largely available in
literature, but new opportunities are offered by commercial solutions. What would be the
impact of exploring statics in a more immersive environment instead of using a handheld
device?
In conclusion, we focused on how augmented reality could foster an intuitive understanding
of statics and, within this subject, much remains to uncover. We believe that other subjects
would benefits from the same approach: gaining an intuitive understanding of the acoustic
properties of the materials, of the thermal properties and so on. Vocational curricula include
STEM topics, but the peculiarities related to teaching and studying them as vocational teachers
and apprentices would do are under-represented in vocational research, and so are learning
technologies. According to our experience, this is the perfect time for studying the impact of
AR tools in vocational classrooms: the required hardware is affordable, students are already
familiar with it and high ecological validity is almost guaranteed. Augmented reality has
turned into a modest technology, which could be introduced in the current practices without
making a learning activity an exceptional activity anymore.
141

Appendices
143

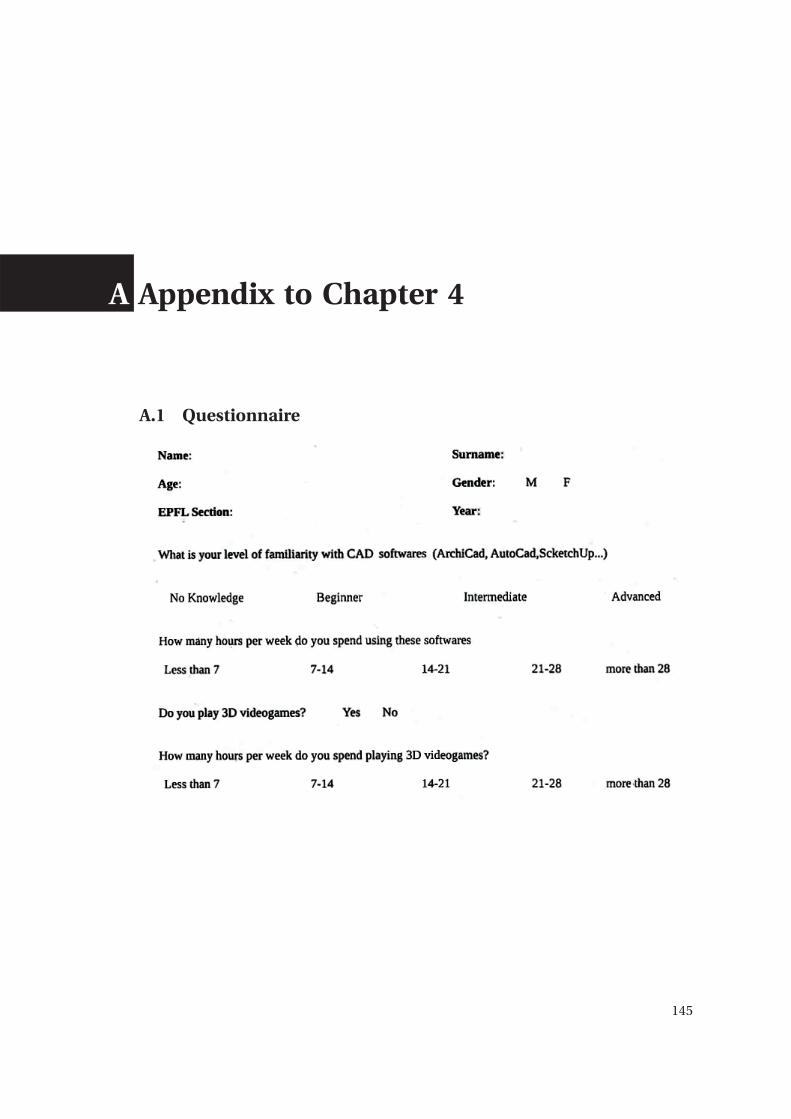
A Appendix to Chapter 4
A.1 Questionnaire
145
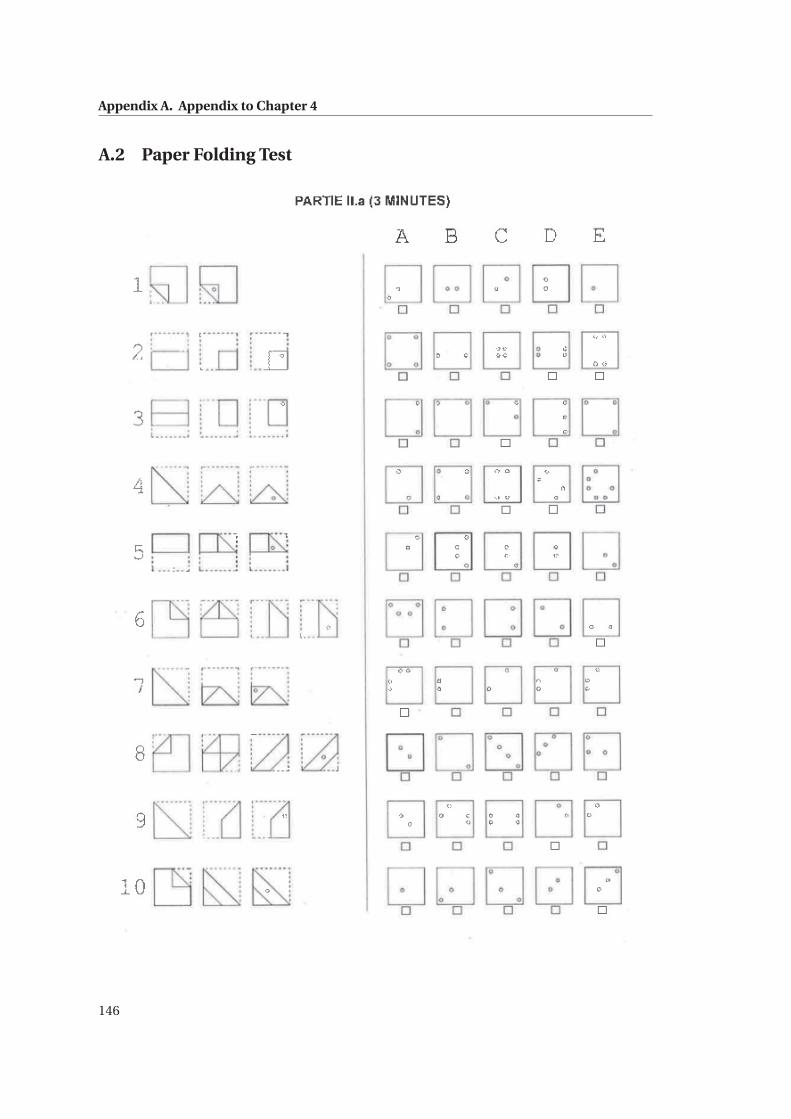
Appendix A. Appendix to Chapter 4
A.2 Paper Folding Test
146
B Appendix to Chapter 5
B.1 Presentation Page
147
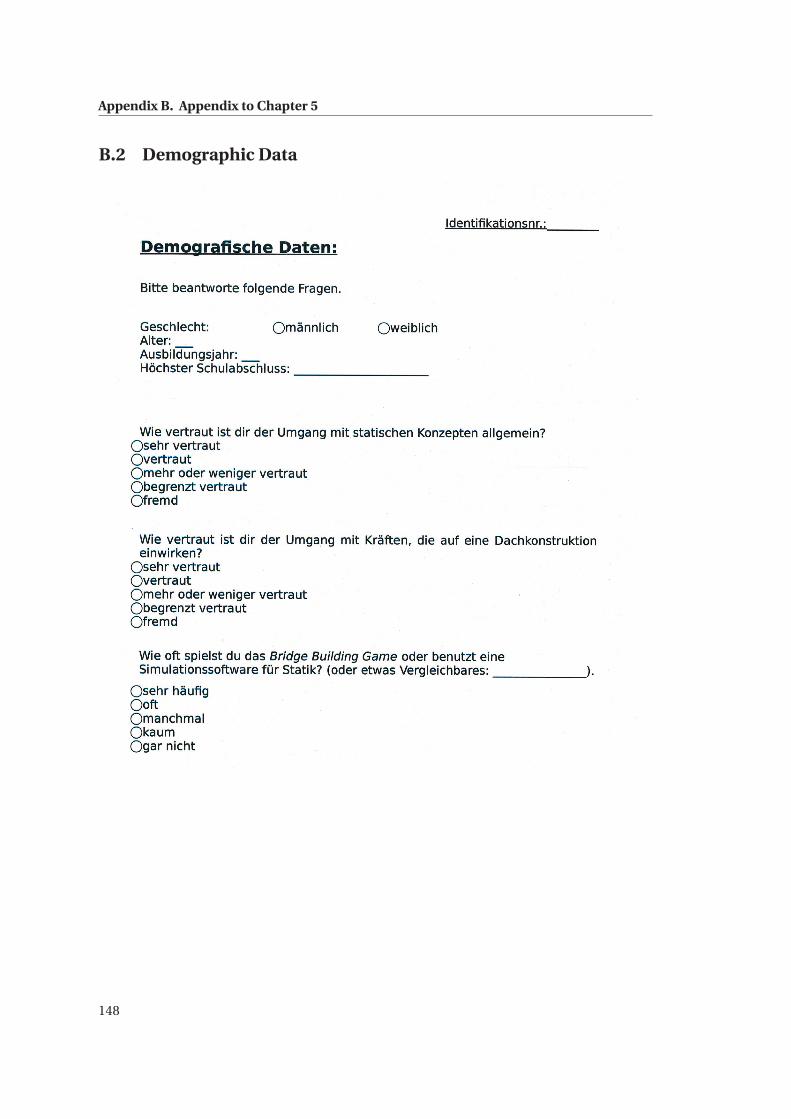
Appendix B. Appendix to Chapter 5
B.2 Demographic Data
148
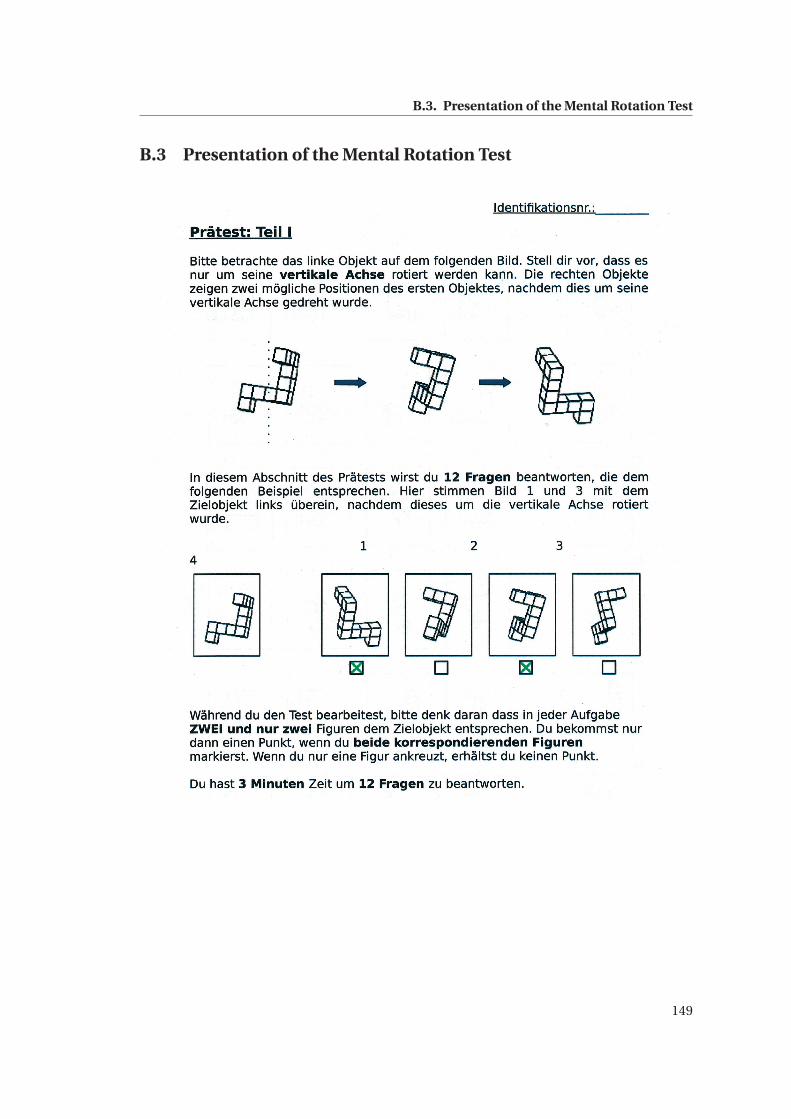
B.3. Presentation of the Mental Rotation Test
B.3 Presentation of the Mental Rotation Test
149
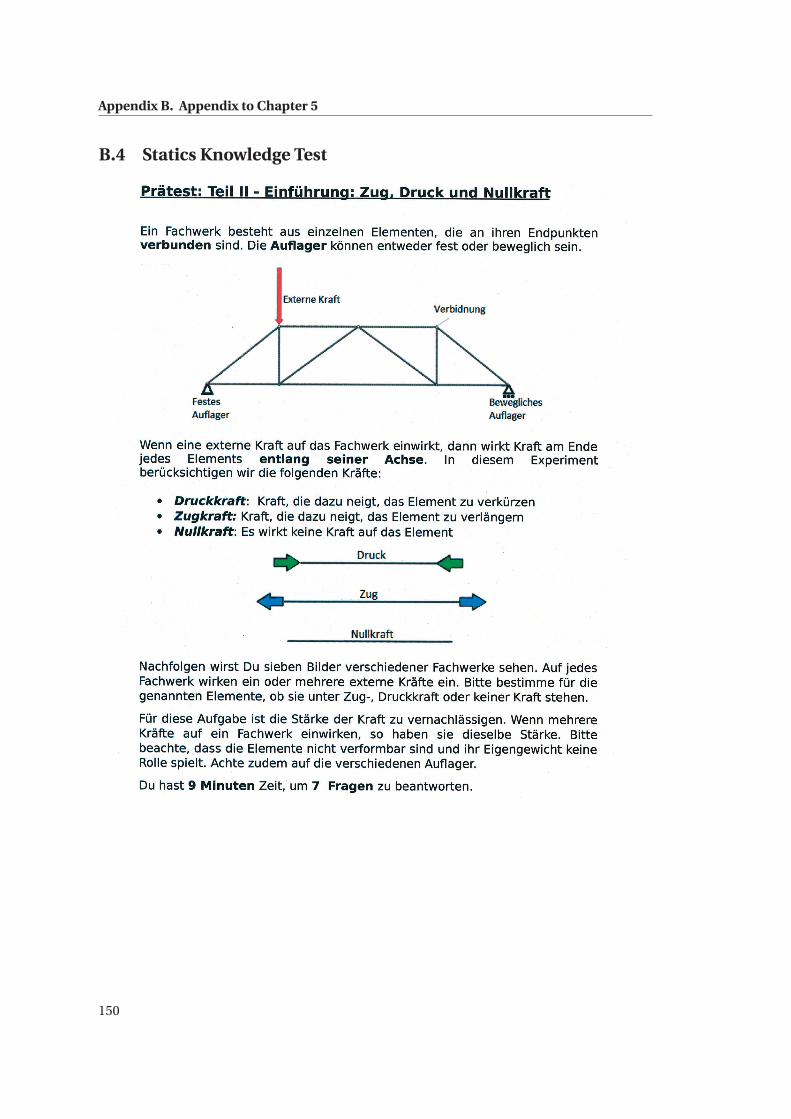
Appendix B. Appendix to Chapter 5
B.4 Statics Knowledge Test
150
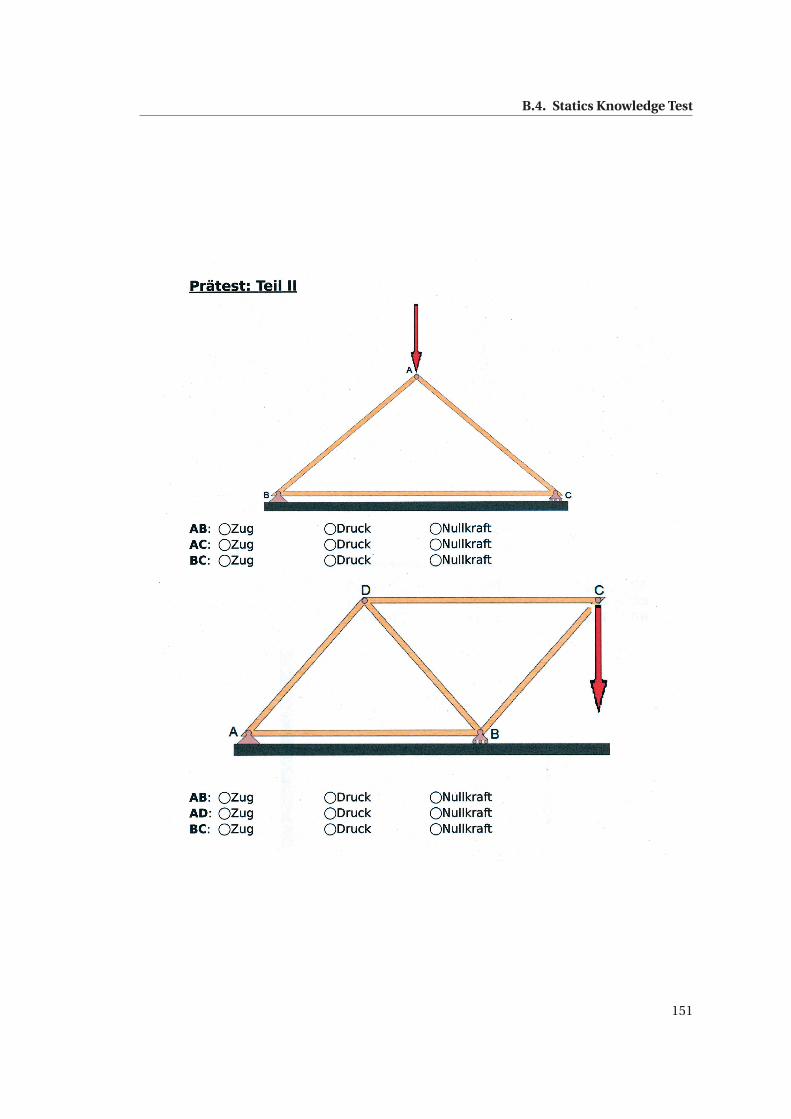
B.4. Statics Knowledge Test
151
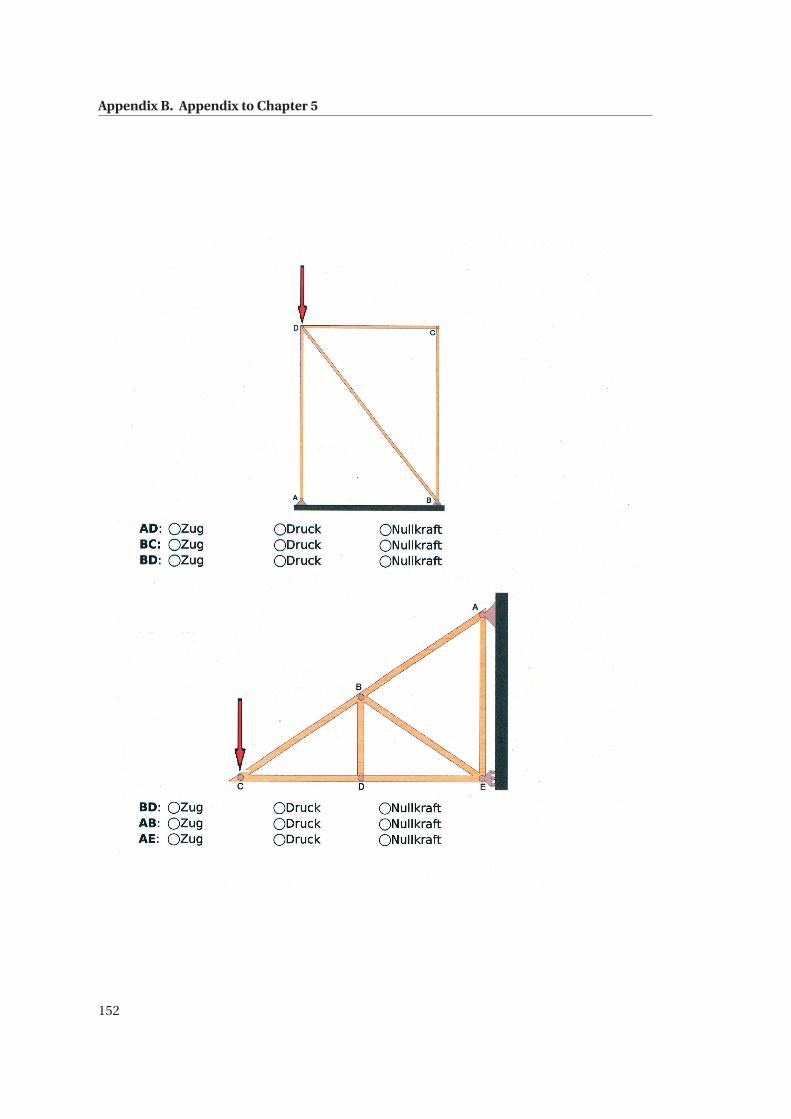
Appendix B. Appendix to Chapter 5
152
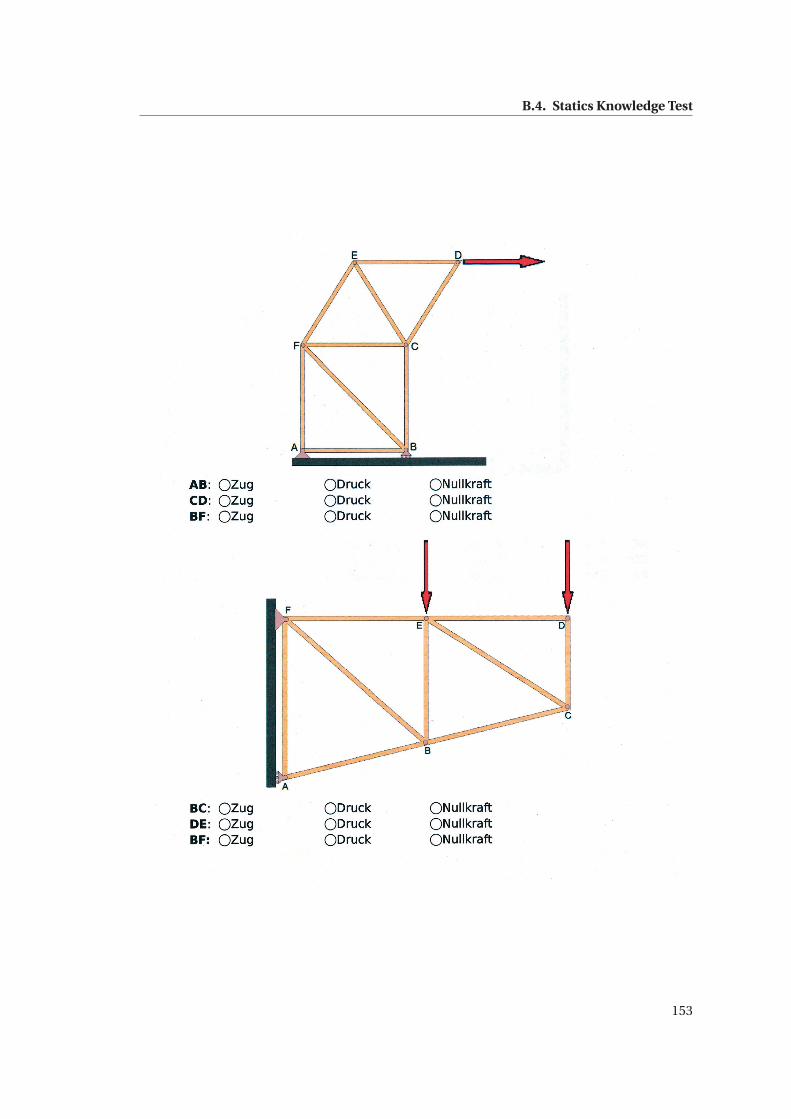
B.4. Statics Knowledge Test
153
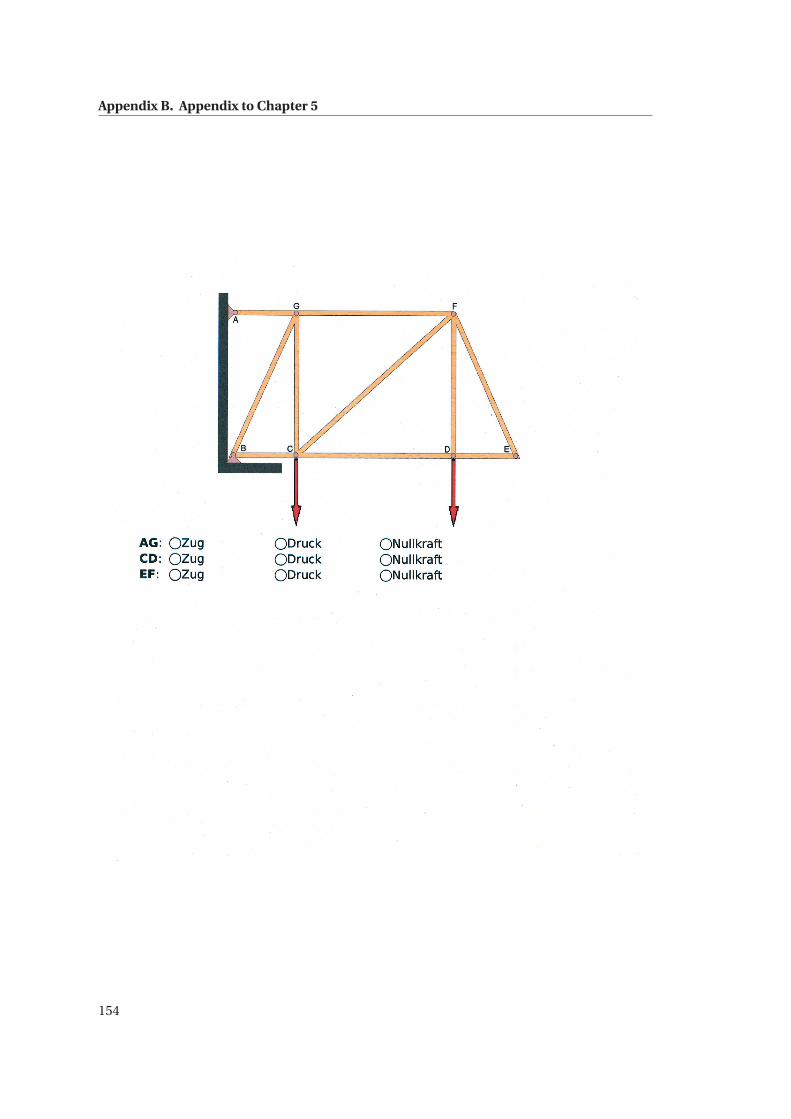
Appendix B. Appendix to Chapter 5
154
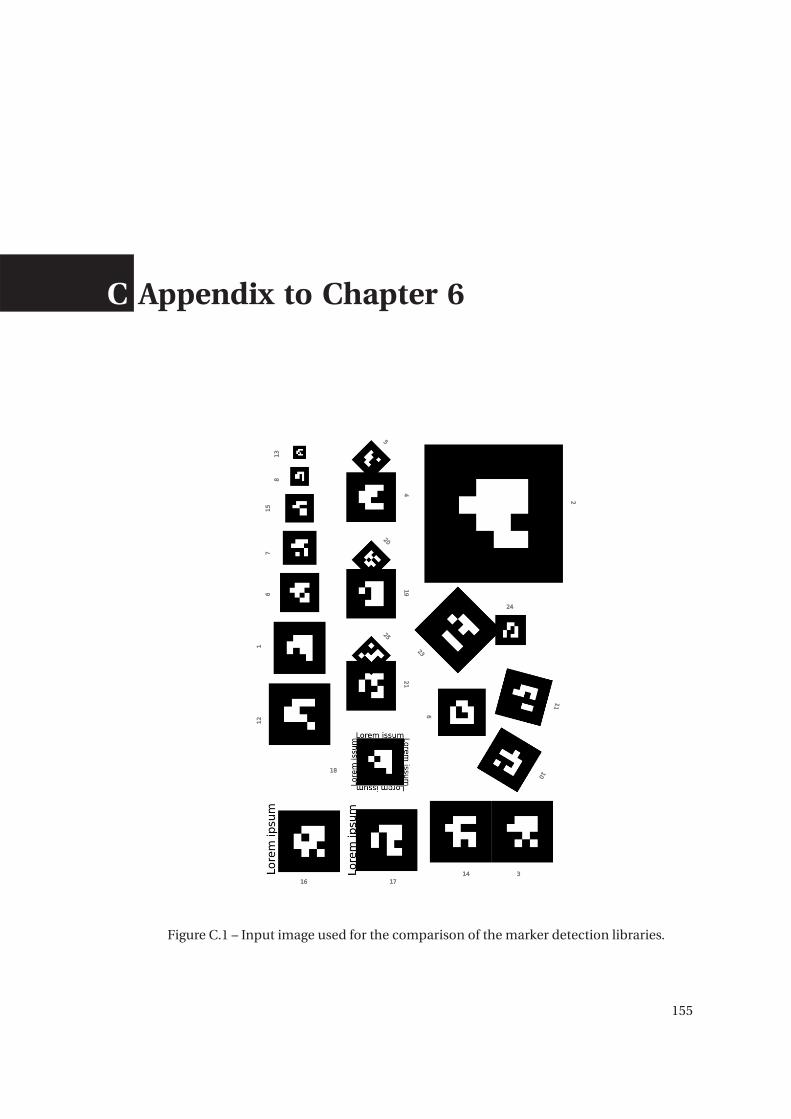
C Appendix to Chapter 6
Figure C.1 – Input image used for the comparison of the marker detection libraries.
155
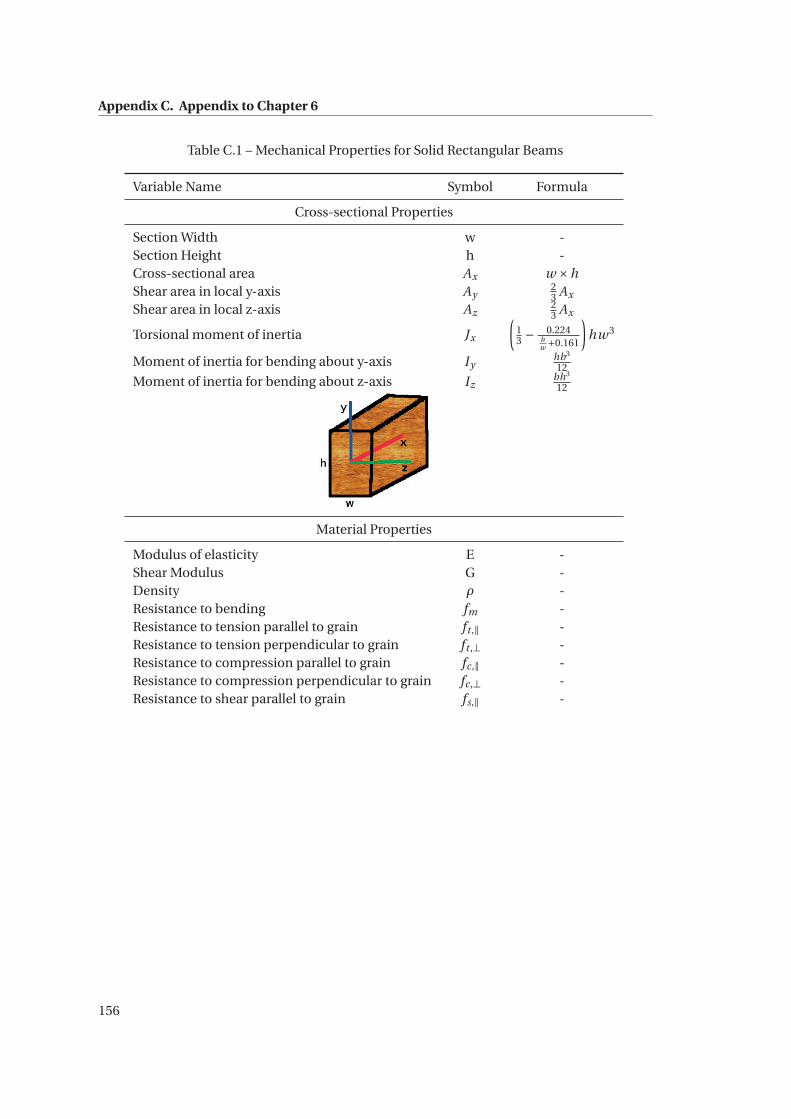
Appendix C. Appendix to Chapter 6
Table C.1 – Mechanical Properties for Solid Rectangular Beams
Variable Name Symbol Formula
Cross-sectional Properties
Section Width w -Section Height h -Cross-sectional area Ax w ×hShear area in local y-axis Ay
23 Ax
Shear area in local z-axis Az23 Ax
Torsional moment of inertia Jx
(13 − 0.224
hw +0.161
)hw3
Moment of inertia for bending about y-axis Iyhb3
12
Moment of inertia for bending about z-axis Izbh3
12
Material Properties
Modulus of elasticity E -Shear Modulus G -Density ρ -Resistance to bending fm -Resistance to tension parallel to grain ft ,∥ -Resistance to tension perpendicular to grain ft ,⊥ -Resistance to compression parallel to grain fc,∥ -Resistance to compression perpendicular to grain fc,⊥ -Resistance to shear parallel to grain fs,∥ -
156
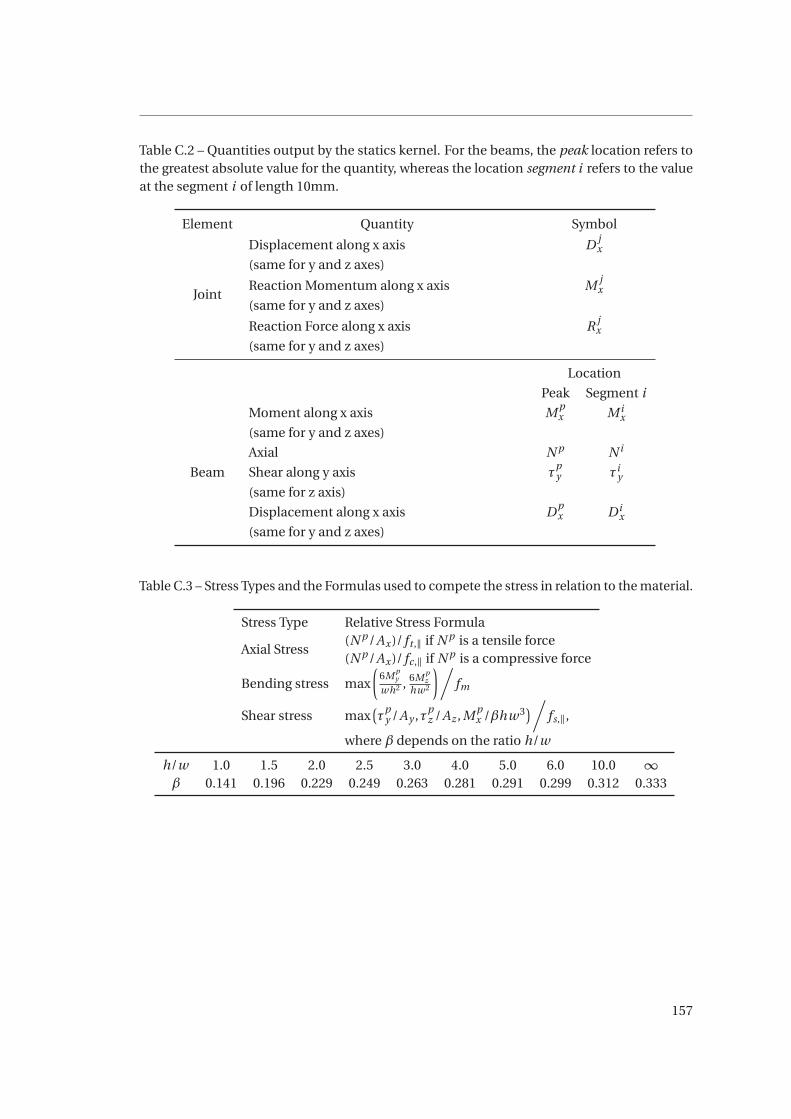
Table C.2 – Quantities output by the statics kernel. For the beams, the peak location refers tothe greatest absolute value for the quantity, whereas the location segment i refers to the valueat the segment i of length 10mm.
Element Quantity Symbol
Joint
Displacement along x axis D jx
(same for y and z axes)
Reaction Momentum along x axis M jx
(same for y and z axes)
Reaction Force along x axis R jx
(same for y and z axes)
Location
Peak Segment i
Beam
Moment along x axis M px M i
x
(same for y and z axes)
Axial N p N i
Shear along y axis τpy τi
y
(same for z axis)
Displacement along x axis Dpx Di
x
(same for y and z axes)
Table C.3 – Stress Types and the Formulas used to compete the stress in relation to the material.
Stress Type Relative Stress Formula
Axial Stress(N p/Ax)/ ft ,∥ if N p is a tensile force(N p/Ax)/ fc,∥ if N p is a compressive force
Bending stress max
(6M p
y
wh2 , 6M pz
hw2
)/fm
Shear stress max(τ
py /Ay ,τp
z /Az , M px /βhw3
)/fs,∥,
where β depends on the ratio h/w
h/w 1.0 1.5 2.0 2.5 3.0 4.0 5.0 6.0 10.0 ∞β 0.141 0.196 0.229 0.249 0.263 0.281 0.291 0.299 0.312 0.333
157

Bibliography
Dor Abrahamson and Arthur Bakker. “Making sense of movement in embodied design for
mathematics learning”. Cognitive Research: Principles and Implications, 1(1):33, 2016.
Shaaron Ainsworth. “DeFT: A conceptual framework for considering learning with multiple
representations”. Learning and instruction, 16(3):183–198, 2006.
Louis Alfieri, Patricia J Brooks, Naomi J Aldrich, and Harriet R Tenenbaum. “Does discovery-
based instruction enhance learning?”, 2011.
M Alias, DE Gray, and T Black. “The relationship between spatial visualisation ability and
problem solving in structural design”. World Transactions on Engineering and Technology
Education, 2(2):273–276, 2003.
Edoardo Anderheggen and Claudia Pedron. “E-Teaching and E-Learning Structural Design”.
In Computing in Civil Engineering (2005), pages 1–9. 2005.
Alissa N Antle and Alyssa F Wise. “Getting down to details: Using theories of cognition and
learning to inform tangible user interface design”. Interacting with Computers, 25(1):1–20,
2013.
Armfield. “Undestranding Structural Behaviour-ST10/ST11”. http://discoverarmfield.com/media/transfer/doc/st10st11_web.pdf, 2016.
Artoolkit. “Artoolkit.org, Open Source Augmented Reality SDK”. https://artoolkit.org/,
2017.
Kinnari Atit, Thomas F Shipley, and Basil Tikoff. “Twisting space: are rigid and non-rigid
mental transformations separate spatial skills?”. Cognitive processing, 14(2):163–173, 2013.
Ronald T Azuma. “A survey of augmented reality”. Presence: Teleoperators and virtual environ-
ments, 6(4):355–385, 1997.
Douglas Bates, Martin Mächler, Ben Bolker, and Steve Walker. “Fitting Linear Mixed-Effects
Models Using lme4”. Journal of Statistical Software, 67(1):1–48, 2015. doi: 10.18637/jss.v067.
i01.
159
Bibliography
Amy L Baylor. “A U-shaped model for the development of intuition by level of expertise”. New
Ideas in Psychology, 19(3):237 – 244, 2001. ISSN 0732-118X. doi: http://dx.doi.org/10.1016/
S0732-118X(01)00005-8.
URL:http://www.sciencedirect.com/science/article/pii/S0732118X01000058.
Eric A Bier, Maureen C Stone, Ken Pier, William Buxton, and Tony D DeRose. “Toolglass and
magic lenses: the see-through interface”. In Proceedings of the 20th annual conference on
Computer graphics and interactive techniques, pages 73–80. ACM, 1993.
Davide Bigoni, Francesco Dal Corso, Diego Misseroni, and Mirko Tommasini. “A teaching
model for truss structures”. European Journal of Physics, 33(5):1179, 2012.
Oliver Bimber and Ramesh Raskar. “Modern approaches to augmented reality”. In ACM
SIGGRAPH 2006 Courses, pages 1–13. ACM, 2006.
Frank Biocca, Arthur Tang, Charles Owen, and Fan Xiao. “Attention funnel: omnidirectional
3D cursor for mobile augmented reality platforms”. In Proceedings of the SIGCHI conference
on Human Factors in computing systems, pages 1115–1122. ACM, 2006.
Quentin Bonnard, Patrick Jermann, Amanda Legge, Frédéric Kaplan, and Pierre Dillenbourg.
“Tangible paper interfaces: interpreting pupils’ manipulations”. In Proceedings of the 2012
ACM international conference on Interactive tabletops and surfaces, pages 133–142. ACM,
2012a.
Quentin Bonnard, Himanshu Verma, Frédéric Kaplan, and Pierre Dillenbourg. “Paper inter-
faces for learning geometry”. 21st Century Learning for 21st Century Skills, pages 37–50,
2012b.
Quentin Bonnard, Séverin Lemaignan, Guillaume Zufferey, Andrea Mazzei, Sébastien Cuendet,
Nan Li, Ayberk Özgür, and Pierre Dillenbourg. “Chilitags 2: Robust Fiducial Markers for
Augmented Reality and Robotics.”, 2013.
URL:http://chili.epfl.ch/software.
John D Bransford and Daniel L Schwartz. “Chapter 3: Rethinking transfer: A simple proposal
with multiple implications”. Review of research in education, 24(1):61–100, 1999.
Bert Bredeweg and Peter Struss. “Current topics in qualitative reasoning”. AI Magazine, 24(4):
13, 2003.
James R Brinson. “Learning outcome achievement in non-traditional (virtual and remote)
versus traditional (hands-on) laboratories: A review of the empirical research”. Computers &
Education, 87:218–237, 2015.
David Brohn. Understanding structural analysis. New Paradigm Solutions, 2008. ISBN 978-0-
9556311-0-8. OCLC: 740257390.
D.M. Brohn and J. Cowan. “Teaching towards an improved understanding of structural
behaviour.”. Structural Engineer, 55(1):9–17, January 1977. ISSN 14665123.
160
Bibliography
James M Brown and Hope I Denney. “Shifting attention into and out of objects: Evaluating the
processes underlying the object advantage”. Attention, Perception, & Psychophysics, 69(4):
606–618, 2007.
Olivier Burdet and Jean-Luc Zanella. “i-structures, le projet”. Technical report, Flash Informa-
tique EPFL, spécial été, 2004.
Daniela Caballero, Yun Wen, Luis P. Prieto, and Pierre Dillenbourg. “Single Locus of Control in
a Tangible Paper-based Tabletop Application: An Exploratory Study”. In Proceedings of the
Ninth ACM International Conference on Interactive Tabletops and Surfaces, ITS ’14, pages
351–356, New York, NY, USA, 2014. ACM. ISBN 978-1-4503-2587-5. doi: 10.1145/2669485.
2669545.
URL:http://doi.acm.org/10.1145/2669485.2669545.
Su Cai, Xu Wang, and Feng-Kuang Chiang. “A case study of Augmented Reality simulation
system application in a chemistry course”. Computers in Human Behavior, 37:31 – 40, 2014.
ISSN 0747-5632. doi: http://dx.doi.org/10.1016/j.chb.2014.04.018.
URL:http://www.sciencedirect.com/science/article/pii/S0747563214002271.
André F Caissie, François Vigneau, and Douglas A Bors. “What does the Mental Rotation Test
measure? An analysis of item difficulty and item characteristics”. Open Psychology Journal,
2(1):94–102, 2009.
C. Calenge. “The package adehabitat for the R software: tool for the analysis of space and
habitat use by animals”. Ecological Modelling, 197:1035, 2006.
Benjamin James Call, Wade H Goodridge, and Christopher Green. “Strategy, Task Performance,
and Behavioral Themes from Students Solving 2-D and 3-D Force Equilibrium Problems”.
In 2015 ASEE Annual Conference & Exposition, pages 26–1405, 2015.
Kira J Carbonneau and Scott C Marley. “Activity-based learning strategies”. The international
guide to student achievement, pages 282–284, 2012.
Kira J Carbonneau, Scott C Marley, and James P Selig. “A meta-analysis of the efficacy of
teaching mathematics with concrete manipulatives.”. Journal of Educational Psychology,
105(2):380, 2013.
Gail Carmichael, Robert Biddle, and David Mould. “Understanding the power of augmented
reality for Learning”. In E-Learn: World Conference on E-Learning in Corporate, Government,
Healthcare, and Higher Education, pages 1761–1771. Association for the Advancement of
Computing in Education (AACE), 2012.
Kun-Hung Cheng and Chin-Chung Tsai. “Affordances of augmented reality in science learning:
Suggestions for future research”. Journal of Science Education and Technology, 22(4):449–462,
2013.
161
Bibliography
Michelene TH Chi, Paul J Feltovich, and Robert Glaser. “Categorization and representation of
physics problems by experts and novices”. Cognitive science, 5(2):121–152, 1981.
Chien Chou, Hsieh-Lung Hsu, Yu-Seng Yao, et al. “Construction of a virtual reality learn-
ing environment for teaching structural analysis”. Computer Applications in Engineering
Education, 5(4):223–230, 1997.
Alan T Clark and Darren Gergle. “Mobile dual eye-tracking methods: challenges and opportu-
nities”. In Proc. of International Workshop on Dual Eye Tracking, 2011.
Alexis Clay, Gaol Domenger, Julien Conan, Axel Domenger, and Nadine Couture. “Integrating
augmented reality to enhance expression, interaction & collaboration in live performances:
A ballet dance case study”. In Mixed and Augmented Reality-Media, Art, Social Science,
Humanities and Design (ISMAR-MASH’D), 2014 IEEE International Symposium on, pages
21–29. IEEE, 2014.
Paul G Clifton, Jack Shen-Kuen Chang, Georgina Yeboah, Alison Doucette, Sanjay Chan-
drasekharan, Michael Nitsche, Timothy Welsh, and Ali Mazalek. “Design of embodied
interfaces for engaging spatial cognition”. Cognitive Research: Principles and Implications, 1
(1):24, 2016.
Marcelo Coelho and Pattie Maes. “Sprout I/O: a texturally rich interface”. In Proceedings of the
2nd international conference on Tangible and embedded interaction, pages 221–222. ACM,
2008.
Klen Copic Pucihar, Paul Coulton, and Jason Alexander. “The use of surrounding visual
context in handheld AR: device vs. user perspective rendering”. In Proceedings of the SIGCHI
Conference on Human Factors in Computing Systems, pages 197–206. ACM, 2014.
Sébastien Cuendet. Tangible Interfaces for Learning: Training Spatial Skills in Vocational
Classrooms. PhD thesis, EPFL, 2013.
Sébastien Cuendet, Engin Bumbacher, and Pierre Dillenbourg. “Tangible vs. Virtual Represen-
tations: when Tangibles Benefit the Training of Spatial Skills”. In NordiCHI ’12 Proceedings of
the 7th Nordic Conference on Human-Computer Interaction: Making Sense Through Design,
2012a.
Sébastien Cuendet, Patrick Jermann, and Pierre Dillenbourg. “Tangible interfaces: when
physical-virtual coupling may be detrimental to learning”. In Proceedings of the 26th Annual
BCS Interaction Specialist Group Conference on People and Computers, pages 49–58. British
Computer Society, 2012b.
Sébastien Cuendet, Quentin Bonnard, Son Do-Lenh, and Pierre Dillenbourg. “Designing
augmented reality for the classroom”. Computers & Education, 68:557–569, 2013.
Sebastien Cuendet, Jessica Dehler-Zufferey, Christoph Arn, Engin Bumbacher, and Pierre Dil-
lenbourg. “A study of carpenter apprentices’ spatial skills”. Empirical Research in Vocational
Education and Training, 6(1):3, 2014.
162
Bibliography
Rudolph P Darken and Barry Peterson. “Spatial Orientation, Wayfinding, and Representation”.
In In KM Stanney (Ed.), Handbook of Virtual Environments: Design, Implementation, and
Applications. Citeseer, 2001.
Simon P Davies. “Effects of concurrent verbalization on design problem solving”. Design
Studies, 16(1):102–116, 1995.
Juan de Dios Jiménez-Valladares and F Javier Perales-Palacios. “Graphic representation of
force in secondary education: analysis and alternative educational proposals”. Physics
Education, 36(3):227, 2001.
Pierre Dillenbourg. “What do you mean by collaborative learning?”, 1999.
Pierre Dillenbourg. “Over-scripting CSCL: The risks of blending collaborative learning with
instructional design.”, 2002.
Pierre Dillenbourg. Orchestration graphs. Number EPFL-BOOK-226087. EPFL press, 2015.
Pierre Dillenbourg and Michael Evans. “Interactive tabletops in education”. International
Journal of Computer-Supported Collaborative Learning, 6(4):491–514, 2011.
Pierre Dillenbourg and Fabrice Hong. “The mechanics of CSCL macro scripts”. International
Journal of Computer-Supported Collaborative Learning, 3(1):5–23, 2008.
Pierre Dillenbourg and Daniel Schneider. “Mediating the mechanisms which make collabora-
tive learning sometimes effective”. International Journal of Educational Telecommunica-
tions, 1(2-3):131–146, 1995.
Andrea A DiSessa. “Phenomenology and the evolution of intuition.”. Mental models, pages
15–34, 1983.
Son Do-Lenh. Supporting reflection and classroom orchestration with tangible tabletops. PhD
thesis, École Polytechnique Federale De Laussane, 2012.
Son Do-Lenh, Frédéric Kaplan, and Pierre Dillenbourg. “Paper-based concept map: The
effects of tabletop on an expressive collaborative learning task”. In Proceedings of the 23rd
British HCI Group Annual Conference on People and Computers: Celebrating People and
Technology, pages 149–158. British Computer Society, 2009.
Son Do-Lenh, Patrick Jermann, Amanda Legge, Guillaume Zufferey, and Pierre Dillenbourg.
“TinkerLamp 2.0: designing and evaluating orchestration technologies for the classroom”.
21st Century Learning for 21st Century Skills, pages 65–78, 2012.
Reid E Dodge, Benjamin C Fisher, Jared J King, Paul G Kuehl, Shogo Matsuki, William E Mitchell,
Jeffrey F Dailey, and David M Boyajian. “Introducing the Structural Engineering Encounter
laboratory: a physical approach to teaching statics, mechanics of materials and structural
analysis”. World Transactions on Engng. and Technol. Educ, 9(2):86–91, 2011.
163
Bibliography
Dual-T. “Leading House: Technologies for Vocational Training Dual-T”. http://dualt.epfl.ch/, 2017.
Matt Dunleavy, Chris Dede, and Rebecca Mitchell. “Affordances and limitations of immersive
participatory augmented reality simulations for teaching and learning”. Journal of Science
Education and Technology, 18(1):7–22, 2009.
Andreas Dünser, Karin Steinbügl, Hannes Kaufmann, and Judith Glück. “Virtual and aug-
mented reality as spatial ability training tools”. In Proceedings of the 7th ACM SIGCHI New
Zealand chapter’s international conference on Computer-human interaction: design centered
HCI, pages 125–132. ACM, 2006.
Michael Eraut. “Non-formal learning and tacit knowledge in professional work”. British
Journal of Educational Psychology, 70(1):113–136, 2000. ISSN 2044-8279. doi: 10.1348/
000709900158001.
URL:http://dx.doi.org/10.1348/000709900158001.
Taciana Pontual Falcão and Sara Price. “What have you done! the role of’interference’in
tangible environments for supporting collaborative learning”. In Proceedings of the 9th
international conference on Computer supported collaborative learning-Volume 1, pages
325–334. International Society of the Learning Sciences, 2009.
George W Fitzmaurice and William Buxton. Graspable user interfaces. University of Toronto,
1997.
Sean Follmer, Daniel Leithinger, Alex Olwal, Akimitsu Hogge, and Hiroshi Ishii. “inFORM:
dynamic physical affordances and constraints through shape and object actuation.”. In Uist,
volume 13, pages 417–426, 2013.
Kenneth D. Forbus. “Readings in Qualitative Reasoning About Physical Systems”. chapter
Qualitative Physics: Past Present and Future, pages 11–39. Morgan Kaufmann Publishers
Inc., San Francisco, CA, USA, 1990. ISBN 1-55860-095-7.
URL:http://dl.acm.org/citation.cfm?id=93913.93932.
Eva Frühwald and Sven Thelandersson. “Design of safe timber structures-How can we learn
from structural failures in concrete, steel and timber?”. In World Conference on Timber
Engineering, 2008, 2008.
Lynn S Fuchs, Douglas Fuchs, Carol L Hamlett, and Kathy Karns. “High-achieving students’ in-
teractions and performance on complex mathematical tasks as a function of homogeneous
and heterogeneous pairings”. American Educational Research Journal, 35(2):227–267, 1998.
Sergio Garrido-Jurado, Rafael Muñoz-Salinas, Francisco José Madrid-Cuevas, and
Manuel Jesús Marín-Jiménez. “Automatic generation and detection of highly reliable fiducial
markers under occlusion”. Pattern Recognition, 47(6):2280–2292, 2014.
164
Bibliography
Henri P Gavin. “Frame3DD”, Nov 2010.
URL:https://nees.org/resources/1504.
Andreas Gegenfurtner, Erno Lehtinen, and Roger Säljö. “Expertise differences in the compre-
hension of visualizations: A meta-analysis of eye-tracking research in professional domains”.
Educational Psychology Review, 23(4):523–552, 2011.
Hannie Gijlers and Ton De Jong. “The relation between prior knowledge and students’ collab-
orative discovery learning processes”. Journal of research in science teaching, 42(3):264–282,
2005.
Alexandre Gillet, Michel Sanner, Daniel Stoffler, and Arthur Olson. “Tangible interfaces for
structural molecular biology”. Structure, 13(3):483–491, 2005.
Divya Gupta et al. “An empirical study of the effects of context-switch, object distance, and
focus depth on human performance in augmented reality”. In Masters dissertation in
Industrial and Systems Engineering. Citeseer, 2004.
Jean-Luc Gurtner, Alida Gulfi, Philippe A Genoud, Bernardo de Rocha Trindade, and Jérôme
Schumacher. “Learning in multiple contexts: are there intra-, cross-and transcontextual
effects on the learner’s motivation and help seeking?”. European journal of psychology of
education, 27(2):213–225, 2012.
Barbara J Guzzetti, Tonja E Snyder, Gene V Glass, and Warren S Gamas. “Promoting conceptual
change in science: A comparative meta-analysis of instructional interventions from reading
education and science education”. Reading Research Quarterly, pages 117–159, 1993.
Hilde Haider and Peter A Frensch. “Eye movement during skill acquisition: More evidence
for the information-reduction hypothesis.”. Journal of Experimental Psychology: Learning,
Memory, and Cognition, 25(1):172, 1999.
Insook Han and John B Black. “Incorporating haptic feedback in simulation for learning
physics”. Computers & Education, 57(4):2281–2290, 2011.
Insook Han, John Black, and Greg Hallman. “Are Simulation and Physical Manipulation
Different in Improving Conceptual Learning and Mechanical Reasoning?”. In Proceedings of
the annual meeting of the AERA, 01 2009.
Andrew F Heckler. “Some consequences of prompting novice physics students to construct
force diagrams”. International Journal of Science Education, 32(14):1829–1851, 2010.
John M Henderson. “Human gaze control during real-world scene perception”. Trends in
cognitive sciences, 7(11):498–504, 2003.
David Hestenes, Malcolm Wells, and Gregg Swackhamer. “Force concept inventory”. The
physics teacher, 30(3):141–158, 1992.
165
Bibliography
Brant E Hinrichs. “Using the system schema representational tool to promote student under-
standing of Newton’s third law”. In AIP Conference Proceedings, volume 790, pages 117–120.
AIP, 2005.
Stefan Hinterstoisser, Vincent Lepetit, Slobodan Ilic, Stefan Holzer, Kurt Konolige, Gary Bradski,
and Nassir Navab. “Technical demonstration on model based training, detection and pose
estimation of texture-less 3d objects in heavily cluttered scenes”. In Computer Vision–ECCV
2012. Workshops and Demonstrations, pages 593–596. Springer, 2012.
Kenneth Holmqvist, Marcus Nyström, Richard Andersson, Richard Dewhurst, Halszka Jaro-
dzka, and Joost Van de Weijer. Eye tracking: A comprehensive guide to methods and measures.
OUP Oxford, 2011.
Holzbau-Schweiz. “Formazione di base”. https://www.holzbau-schweiz.ch/it/offerte-dei-settori-specialistici/formazione/formazione-di-base/, 2017a.
Holzbau-Schweiz. “Informazioni sulla formazione di base di 4 anni come carpentiera/-
carpentiere AFC”. http://www.ascoleti.ch/files/Brochure_Formazione4anni_IT_2013-12_Web.pdf, 2017b.
Holzbau-Schweiz. “Programma per l’insegnamento professionale Carpentiera AFC / Carpen-
tiere AFC”. https://www.holzbau-schweiz.ch/fileadmin/user_upload/Dokumente_HBCH/DL_Bildung/Grundbildung_EFZ/2015/IT/Programma_per_d_insegnamento_professionale_AFC.pdf, 2017c.
Eva Hornecker. “Beyond affordance: tangibles’ hybrid nature”. In Proceedings of the Sixth
International Conference on Tangible, Embedded and Embodied Interaction, pages 175–182.
ACM, 2012.
Eva Hornecker and Jacob Buur. “Getting a grip on tangible interaction: a framework on
physical space and social interaction”. In Proceedings of the SIGCHI conference on Human
Factors in computing systems, pages 437–446. ACM, 2006.
JM Huang, Soh-Khim Ong, and Andrew YC Nee. “Real-time finite element structural analysis
in augmented reality”. Advances in Engineering Software, 87:43–56, 2015.
Olivier Hugues, Philippe Fuchs, and Olivier Nannipieri. “New augmented reality taxonomy:
Technologies and features of augmented environment”. In Handbook of augmented reality,
pages 47–63. Springer, 2011.
Thomas Huk. “Who benefits from learning with 3D models? The case of spatial ability”.
Journal of computer assisted learning, 22(6):392–404, 2006.
Francois Husson, Julie Josse, and Jerome Pages. “Principal component methods-hierarchical
clustering-partitional clustering: why would we need to choose for visualizing data”. Applied
Mathematics Department, 2010.
166
Bibliography
François Husson, Sébastien Lê, and Jérôme Pagès. Exploratory multivariate analysis by
example using R. CRC press, 2017.
Cristina Iani, Roberto Nicoletti, Sandro Rubichi, and Carlo Umiltà. “Shifting attention between
objects”. Cognitive Brain Research, 11(1):157–164, 2001.
Hiroshi Ishii. “Tangible bits: beyond pixels”. In Proceedings of the 2nd international conference
on Tangible and embedded interaction, pages xv–xxv. ACM, 2008.
Hiroshi Ishii and Brygg Ullmer. “Tangible bits: towards seamless interfaces between peo-
ple, bits and atoms”. In Proceedings of the ACM SIGCHI Conference on Human factors in
computing systems, pages 234–241. ACM, 1997.
Hiroshi Ishii, Dávid Lakatos, Leonardo Bonanni, and Jean-Baptiste Labrune. “Radical atoms:
beyond tangible bits, toward transformable materials”. interactions, 19(1):38–51, 2012.
RJ Jacob and Keith S Karn. “Eye tracking in human-computer interaction and usability research:
Ready to deliver the promises”. Mind, 2(3):4, 2003.
Robert JK Jacob, Audrey Girouard, Leanne M Hirshfield, Michael S Horn, Orit Shaer, Erin Treacy
Solovey, and Jamie Zigelbaum. “Reality-based interaction: a framework for post-WIMP
interfaces”. In Proceedings of the SIGCHI conference on Human factors in computing systems,
pages 201–210. ACM, 2008.
Patrick Jermann and Pierre Dillenbourg. “Elaborating new arguments through a CSCL script”.
In Arguing to learn, pages 205–226. Springer, 2003.
Patrick Jermann, Darren Gergle, Roman Bednarik, and Susan Brennan. “Duet 2012: dual eye
tracking in CSCW”. In Proceedings of the ACM 2012 conference on Computer Supported
Cooperative Work Companion, pages 23–24. ACM, 2012.
Amy M Kamarainen, Shari Metcalf, Tina Grotzer, Allison Browne, Diana Mazzuca, M Shane
Tutwiler, and Chris Dede. “EcoMOBILE: Integrating augmented reality and probeware with
environmental education field trips”. Computers & Education, 68:545–556, 2013.
Manu Kapur. “Productive failure”. Cognition and instruction, 26(3):379–424, 2008.
Manu Kapur and Katerine Bielaczyc. “Designing for productive failure”. Journal of the Learning
Sciences, 21(1):45–83, 2012.
Frank C Keil. “Folkscience: Coarse interpretations of a complex reality”. Trends in cognitive
sciences, 7(8):368–373, 2003.
SeungJun Kim and Anind K Dey. “Simulated augmented reality windshield display as a
cognitive mapping aid for elder driver navigation”. In Proceedings of the SIGCHI Conference
on Human Factors in Computing Systems, pages 133–142. ACM, 2009.
167
Bibliography
David Klahr, Lara M Triona, and Cameron Williams. “Hands on what? The relative effectiveness
of physical versus virtual materials in an engineering design project by middle school
children”. Journal of Research in Science teaching, 44(1):183–203, 2007.
Sarah Kriz and Mary Hegarty. “Top-down and bottom-up influences on learning from ani-
mations”. International Journal of Human-Computer Studies, 65(11):911 – 930, 2007. ISSN
1071-5819. doi: http://dx.doi.org/10.1016/j.ijhcs.2007.06.005.
URL:http://www.sciencedirect.com/science/article/pii/S1071581907000869.
Ernst Kruijff, J Edward Swan II, and Steven Feiner. “Perceptual issues in augmented reality
revisited.”. In ISMAR, volume 9, pages 3–12, 2010.
Meng-Lung Lai, Meng-Jung Tsai, Fang-Ying Yang, Chung-Yuan Hsu, Tzu-Chien Liu, Silvia Wen-
Yu Lee, Min-Hsien Lee, Guo-Li Chiou, Jyh-Chong Liang, and Chin-Chung Tsai. “A review
of using eye-tracking technology in exploring learning from 2000 to 2012”. Educational
Research Review, 10:90–115, 2013.
Jill Larkin, John McDermott, Dorothea P Simon, and Herbert A Simon. “Expert and novice
performance in solving physics problems”. Science, pages 1335–1342, 1980.
Mark J Lattery. “Student understanding of the primitive spring concept: Effects of prior
classroom instruction and gender”. Electronic Journal of Science Education, 9(3), 2005.
Jean Lave. “Situating learning in communities of practice”. Perspectives on socially shared
cognition, 2:63–82, 1991.
Sébastien Lê, Julie Josse, François Husson, et al. “FactoMineR: an R package for multivariate
analysis”. Journal of statistical software, 25(1):1–18, 2008.
Olivier Le Meur and Thierry Baccino. “Methods for comparing scanpaths and saliency maps:
strengths and weaknesses”. Behavior research methods, 45(1):251–266, 2013.
Gun A Lee, Ungyeon Yang, Yongwan Kim, Dongsik Jo, Ki-Hong Kim, Jae Ha Kim, and Jin Sung
Choi. “Freeze-Set-Go interaction method for handheld mobile augmented reality envi-
ronments”. In Proceedings of the 16th ACM Symposium on Virtual Reality Software and
Technology, pages 143–146. ACM, 2009.
Cristine H Legare, Susan A Gelman, and Henry M Wellman. “Inconsistency with prior knowl-
edge triggers children’s causal explanatory reasoning”. Child development, 81(3):929–944,
2010.
Zeina Atrash Leong and Michael S Horn. “Representing equality: A tangible balance beam for
early algebra education”. In Proceedings of the 10th International Conference on Interaction
Design and Children, pages 173–176. ACM, 2011.
Vincent Lepetit, Pascal Fua, et al. “Monocular model-based 3d tracking of rigid objects: A
survey”. Foundations and Trends® in Computer Graphics and Vision, 1(1):1–89, 2005.
168
Bibliography
Peiliang Li, Tong Qin, Botao Hu, Fengyuan Zhu, and Shaojie Shen. “Monocular visual-inertial
state estimation for mobile augmented reality”. In Mixed and Augmented Reality (ISMAR),
2017 IEEE International Symposium on. IEEE, 2017.
Tzu-Chien Liu, Yi-Chun Lin, Meng-Jung Tsai, and Fred Paas. “Split-attention and redundancy
effects on mobile learning in physical environments”. Computers & Education, 58(1):172–
180, 2012.
Weiquan Lu, Linh-Chi Nguyen, Teong Leong Chuah, and Ellen Yi-Luen Do. “Effects of mobile
AR-enabled interactions on retention and transfer for learning in art museum contexts”. In
Mixed and Augmented Reality-Media, Art, Social Science, Humanities and Design (ISMAR-
MASH’D), 2014 IEEE International Symposium on, pages 3–11. IEEE, 2014.
Wendy E Mackay. “Augmented reality: linking real and virtual worlds: a new paradigm for
interacting with computers”. In Proceedings of the working conference on Advanced visual
interfaces, pages 13–21. ACM, 1998.
Wendy E Mackay and Anne-Laure Fayard. “HCI, natural science and design: a framework
for triangulation across disciplines”. In Proceedings of the 2nd conference on Designing
interactive systems: processes, practices, methods, and techniques, pages 223–234. ACM,
1997.
David M Mark. “Human spatial cognition”. Human factors in geographical information systems,
pages 51–60, 1993.
Michael R Marner and Bruce H Thomas. “Augmented foam sculpting for capturing 3D models”.
In 3D User Interfaces (3DUI), 2010 IEEE Symposium on, pages 63–70. IEEE, 2010.
Paul Marshall. “Do tangible interfaces enhance learning?”. In Proceedings of the 1st interna-
tional conference on Tangible and embedded interaction, pages 163–170. ACM, 2007.
Paul Marshall, Peter C-H Cheng, and Rosemary Luckin. “Tangibles in the balance: a discovery
learning task with physical or graphical materials”. In Proceedings of the fourth international
conference on Tangible, embedded, and embodied interaction, pages 153–160. ACM, 2010.
Jorge Martín-Gutiérrez, José Luís Saorín, Manuel Contero, Mariano Alcañiz, David C Pérez-
López, and Mario Ortega. “Design and validation of an augmented book for spatial abilities
development in engineering students”. Computers & Graphics, 34(1):77–91, 2010.
Ian M May and David Johnson. “The teaching of structural analysis”. The Ove Arup Foundation,
2008.
Richard E Mayer. “Constructivism as a theory of learning versus constructivism as a prescrip-
tion for instruction.”. 2009.
Richard E Mayer. “Unique contributions of eye-tracking research to the study of learning with
graphics”. Learning and instruction, 20(2):167–171, 2010.
169
Bibliography
Steven W McCrary and Martin P Jones. “Build It and They Will Learn: Enhancing Experiential
Learning Opportunities in the Statics Classroom”. In Annual International Conference of
Associated Schools of Construction, 2008.
Mark G McGee. “Human spatial abilities: Psychometric studies and environmental, genetic,
hormonal, and neurological influences.”. Psychological bulletin, 86(5):889, 1979.
Nicole McNeil and Linda Jarvin. “When theories don’t add up: disentangling the manipulatives
debate”. Theory into Practice, 46(4):309–316, 2007.
David E Meltzer. “Relation between students’ problem-solving performance and representa-
tional format”. American Journal of Physics, 73(5):463–478, 2005.
Paul Milgram, Haruo Takemura, Akira Utsumi, Fumio Kishino, et al. “Augmented reality: A
class of displays on the reality-virtuality continuum”. In Telemanipulator and telepresence
technologies, volume 2351, pages 282–292, 1994.
Wendy L Millroy. “An ethnographic study of the mathematical ideas of a group of carpenters”.
Learning and individual differences, 3(1):1–25, 1991.
Mark R Mine, Frederick P Brooks Jr, and Carlo H Sequin. “Moving objects in space: ex-
ploiting proprioception in virtual-environment interaction”. In Proceedings of the 24th
annual conference on Computer graphics and interactive techniques, pages 19–26. ACM
Press/Addison-Wesley Publishing Co., 1997.
A. Muttoni. The Art of Structures: Introduction to the Functioning of Structures in Architecture.
EPFL Press Series. Routledge, 2011. ISBN 9782940222384.
URL:https://books.google.ch/books?id=Wux5BBYyhMUC.
Mitchell J. Nathan. “Rethinking Formalisms in Formal Education”. Educational Psychologist,
47(2):125–148, 2012. doi: 10.1080/00461520.2012.667063.
URL:http://dx.doi.org/10.1080/00461520.2012.667063.
Ngoc-Loan Nguyen and David E Meltzer. “Initial understanding of vector concepts among
students in introductory physics courses”. American journal of physics, 71(6):630–638, 2003.
Janni Nielsen, Torkil Clemmensen, and Carsten Yssing. “Getting access to what goes on in
people’s heads?: reflections on the think-aloud technique”. In Proceedings of the second
Nordic conference on Human-computer interaction, pages 101–110. ACM, 2002.
Jean-Marie Normand, Myriam Servières, and Guillaume Moreau. “A new typology of aug-
mented reality applications”. In proceedings of the 3rd augmented human international
conference, page 18. ACM, 2012.
Márcio Sequeira de Oliveira. “Modelo estrutural qualitativo para pré-avaliação do comporta-
mento de estruturas metálicas.”. PROPEC - Mestrado (Dissertações), 2008.
170
Bibliography
Ayberk Özgür, Séverin Lemaignan, Wafa Johal, Maria Beltran, Manon Briod, Léa Pereyre,
Francesco Mondada, and Pierre Dillenbourg. “Cellulo: Versatile Handheld Robots for
Education”. In Proceedings of the 2017 ACM/IEEE International Conference on Human-Robot
Interaction, pages 119–127. ACM, 2017.
Youngmin Park, Vincent Lepetit, and Woontack Woo. “Texture-less object tracking with online
training using an RGB-D camera”. In Mixed and Augmented Reality (ISMAR), 2011 10th IEEE
International Symposium on, pages 121–126. IEEE, 2011.
Claudia Pedron. An innovative tool for teaching structural analysis and design. Number 298.
vdf Hochschulverlag AG, 2006.
Michelle Perry, R Breckinridge Church, and Susan Goldin-Meadow. “Is gesture-speech mis-
match a general index of transitional knowledge?”. Cognitive Development, 7(1):109–122,
1992.
Rolf Ploetzner and Kurt VanLehn. “The acquisition of qualitative physics knowledge during
textbook-based physics training”. Cognition and Instruction, 15(2):169–205, 1997.
Wim TJL Pouw, Tamara Van Gog, and Fred Paas. “An embedded and embodied cognition
review of instructional manipulatives”. Educational Psychology Review, 26(1):51–72, 2014.
Sara Price and Taciana Pontual Falcão. “Designing for physical-digital correspondence in
tangible learning environments”. In Proceedings of the 8th International Conference on
Interaction Design and Children, pages 194–197. ACM, 2009.
Sara Price, Taciana Pontual Falcão, Jennifer G Sheridan, and George Roussos. “The effect of
representation location on interaction in a tangible learning environment”. In Proceedings
of the 3rd International Conference on Tangible and Embedded Interaction, pages 85–92.
ACM, 2009.
Luis P Prieto, Yun Wen, Daniela Caballero, and Pierre Dillenbourg. “Review of augmented pa-
per systems in education: an orchestration perspective”. Journal of Educational Technology
& Society, 17(4):169, 2014.
John Quarles, Samsun Lampotang, Ira Fischler, Paul Fishwick, and Benjamin Lok. “Tangible
user interfaces compensate for low spatial cognition”. In 3D User Interfaces, 2008. 3DUI
2008. IEEE Symposium on, pages 11–18. IEEE, 2008.
Iulian Radu. “Augmented reality in education: a meta-review and cross-media analysis”.
Personal and Ubiquitous Computing, 18(6):1533–1543, 2014.
Felix Rauner. “Practical Knowledge and Occupational Competence.”. European journal of
vocational training, 40(1):52–66, 2007.
Felix Rauner and Rupert Maclean. Handbook of technical and vocational education and
training research, volume 49. Springer, 2008.
171
Bibliography
Realto. “REALTO: The online learning platform for integrated vocational education”. http://dualt.epfl.ch/page-121584-en.html, 2017.
Miriam Reiner. “Conceptual construction of fields through tactile interface”. Interactive
Learning Environments, 7(1):31–55, 1999.
Bethany Rittle-Johnson. “Promoting Transfer: Effects of Self-Explanation and Direct Instruc-
tion”. Child Development, 77(1):1–15, 2006. ISSN 00093920, 14678624.
URL:http://www.jstor.org/stable/3696686.
Claudia Susie C Rodrigues, Paulo FN Rodrigues, and Claudia ML Werner. “An Application
of Augmented Reality in Architectural Education for Understanding Structural Behavior
through Models”. In Proceedings of the X Symposium of Virtual and Augmented Reality, João
Pessoa: Universidade Federal da Paraíba, pages 163–166, 2008.
Michael Rohs, Georg Essl, Johannes Schöning, Anja Naumann, Robert Schleicher, and Antonio
Krüger. “Impact of item density on magic lens interactions”. In Proceedings of the 11th
International Conference on Human-Computer Interaction with Mobile Devices and Services,
page 38. ACM, 2009.
Manuel L Romero and Pedro Museros. “Structural analysis education through model experi-
ments and computer simulation”. Journal of Professional issues in engineering education
and practice, 128(4):170–175, 2002a.
Manuel L Romero and Pedro Museros. “Structural analysis education through model experi-
ments and computer simulation”. Journal of Professional issues in engineering education
and practice, 128(4):170–175, 2002b.
Hessam Roodaki, Navid Navab, Abouzar Eslami, Christopher Stapleton, and Nassir Navab.
“SonifEye: Sonification of Visual Information Using Physical Modeling Sound Synthesis”.
IEEE Transactions on Visualization and Computer Graphics, 23(11):2366–2371, 2017.
Jeremy Roschelle and James G Greeno. “Mental Models in Expert Physics Reasoning”. Technical
report, CALIFORNIA UNIV BERKELEY, 1987.
Leonid Rozenblit and Frank Keil. “The misunderstood limits of folk science: An illusion of
explanatory depth”. Cognitive science, 26(5):521–562, 2002.
David Sands. “Concepts and conceptual understanding: What are we talking about?”. New
Directions in the Teaching of Physical Sciences, 10:7–11, 2014.
Antti Savinainen and Philip Scott. “The Force Concept Inventory: a tool for monitoring student
learning”. Physics Education, 37(1):45, 2002.
Antti Savinainen, Philip Scott, and Jouni Viiri. “Using a bridging representation and social in-
teractions to foster conceptual change: Designing and evaluating an instructional sequence
for Newton’s third law”. Science Education, 89(2):175–195, 2005.
172
Bibliography
Antti Savinainen, Asko Mäkynen, Pasi Nieminen, and Jouni Viiri. “Does using a visual-
representation tool foster students’ ability to identify forces and construct free-body dia-
grams?”. Physical Review Special Topics-Physics Education Research, 9(1):010104, 2013.
Bertrand Schneider. “Preparing Students for Future Learning with Mixed Reality Interfaces”.
In Virtual, Augmented, and Mixed Realities in Education, pages 219–236. Springer, 2017.
Bertrand Schneider, Patrick Jermann, Guillaume Zufferey, and Pierre Dillenbourg. “Benefits
of a tangible interface for collaborative learning and interaction”. IEEE Transactions on
Learning Technologies, 4(3):222–232, 2011.
Bertrand Schneider, Sami Abu-El-Haija, Jim Reesman, and Roy Pea. “Toward collaboration
sensing: applying network analysis techniques to collaborative eye-tracking data”. In
Proceedings of the Third International Conference on Learning Analytics and Knowledge,
pages 107–111. ACM, 2013a.
Bertrand Schneider, Jenelle Wallace, Paulo Blikstein, and Roy Pea. “Preparing for future
learning with a tangible user interface: the case of neuroscience”. IEEE Transactions on
Learning Technologies, 6(2):117–129, 2013b.
Bertrand Schneider, Kshitij Sharma, Sébastien Cuendet, Guillaume Zufferey, Pierre Dillen-
bourg, and Roy D Pea. “3D tangibles facilitate joint visual attention in dyads”. In Proceedings
of 11th International Conference of Computer Supported Collaborative Learning, volume 1,
pages 156–165, 2015.
Bertrand Schneider, Kshitij Sharma, Sébastien Cuendet, Guillaume Zufferey, Pierre Dillen-
bourg, and Roy Pea. “Using mobile eye-trackers to unpack the perceptual benefits of a
tangible user interface for collaborative learning”. ACM Transactions on Computer-Human
Interaction (TOCHI), 23(6):39, 2016.
Carolyn M Schroeder, Timothy P Scott, Homer Tolson, Tse-Yang Huang, and Yi-Hsuan Lee. “A
meta-analysis of national research: Effects of teaching strategies on student achievement
in science in the United States”. Journal of research in science teaching, 44(10):1436–1460,
2007.
Sophia Schwär. “A Study of Carpenter’s Static Reasoning Skills: External Load Distribution in
Roof Structures”. unpublished thesis, 2015.
Daniel L Schwartz and Taylor Martin. “Inventing to prepare for future learning: The hidden
efficiency of encouraging original student production in statistics instruction”. Cognition
and Instruction, 22(2):129–184, 2004.
Daniel L Schwartz, Catherine C Chase, Marily A Oppezzo, and Doris B Chin. “Practicing
versus inventing with contrasting cases: The effects of telling first on learning and transfer.”.
Journal of Educational Psychology, 103(4):759, 2011.
173
Bibliography
Beat A. Schwendimann, Alberto A.P. Cattaneo, Jessica Dehler Zufferey, Jean-Luc Gurtner,
Mireille Bétrancourt, and Pierre Dillenbourg. “The ‘Erfahrraum’: a pedagogical model
for designing educational technologies in dual vocational systems”. Journal of Vocational
Education & Training, 67(3):367–396, 2015. doi: 10.1080/13636820.2015.1061041.
URL:http://dx.doi.org/10.1080/13636820.2015.1061041.
Phil Scott, Hilary Asoko, and John Leach. “Student conceptions and conceptual learning in
science”. Handbook of research on science education, pages 31–56, 2007.
Gennaro Senatore and Daniel Piker. “Interactive real-time physics”. Computer-Aided Design,
61:32 – 41, 2015. ISSN 0010-4485. doi: http://dx.doi.org/10.1016/j.cad.2014.02.007. Steering
Architectural Form.
URL:http://www.sciencedirect.com/science/article/pii/S0010448514000311.
SERI. “Vocational and professional education and training in Switzerland - Facts and fig-
ures 2017”. https://www.sbfi.admin.ch/dam/sbfi/en/dokumente/2017/04/Fakten_Zahlen_BB2017.pdf.download.pdf/Fakten_Zahlen_BB2017_en.pdf, 2017.
Mehdi Setareh, Doug A Bowman, Alex Kalita, Matthew Gracey, and John Lucas. “Application
of a virtual environment system in building sciences education”. Journal of architectural
engineering, 11(4):165–172, 2005.
Orit Shaer and Eva Hornecker. “Tangible user interfaces: past, present, and future directions”.
Foundations and Trends in Human-Computer Interaction, 3(1–2):1–137, 2010.
Kshitij Sharma, Patrick Jermann, Marc-Antoine Nüssli, and Pierre Dillenbourg. “Understand-
ing collaborative program comprehension: Interlacing gaze and dialogues”. In Proceedings
of Computer Supported Collaborative Learning (CSCL 2013), volume 1, pages 430–437, 2013.
Brett E Shelton and Nicholas R Hedley. “Exploring a cognitive basis for learning spatial
relationships with augmented reality”. Technology, Instruction, Cognition and Learning, 1
(4):323, 2004.
Melissa A Singer and Susan Goldin-Meadow. “Children learn when their teacher’s gestures
and speech differ”. Psychological Science, 16(2):85–89, 2005.
Nedim Slijepcevic. The effect of augmented reality treatment on learning, cognitive load, and
spatial visualization abilities. PhD thesis, University of Kentucky, 2013.
URL:http://uknowledge.uky.edu/edc_etds/4.
M Solís, A Romero, and P Galvín. “Teaching structural analysis through design, building,
and testing”. Journal of Professional Issues in Engineering Education and Practice, 138(3):
246–253, 2012.
SolveSpace. “SOLVESPACE,parametric 2d/3d CAD”. http://solvespace.com, 2017.
174
Bibliography
Benson Soong and Neil Mercer. “Improving students’ revision of physics concepts through
ICT-based co-construction and prescriptive tutoring”. International Journal of Science
Education, 33(8):1055–1078, 2011.
Sofoklis Sotiriou and Franz X Bogner. “Visualizing the invisible: augmented reality as an
innovative science education scheme”. Advanced Science Letters, 1(1):114–122, 2008.
Paul S Steif and John A Dantzler. “A statics concept inventory: Development and psychometric
analysis”. Journal of Engineering Education, 94(4):363–371, 2005.
Paul S Steif and Edward Gallagher. “Transitioning students to finite element analysis and
improving learning in basic courses”. In Frontiers in Education, 2004. FIE 2004. 34th Annual,
pages S3B–1. IEEE, 2004.
Shawn Strong and Roger Smith. “Spatial visualization: Fundamentals and trends in engineer-
ing graphics”. Journal of industrial technology, 18(1):1–6, 2001.
Petra Sundström, Sebastian Osswald, and Manfred Tscheligi. “From Tangible Bits to Seamful
Designs: Learnings from HCI Research”. In AutoNUI: Automotive Natural User Interfaces
(Workshop at AUI’11), 2011.
Decha Suppapittayaporn, Narumon Emarat, and Kwan Arayathanitkul. “The effectiveness of
peer instruction and structured inquiry on conceptual understanding of force and motion:
a case study from Thailand”. Research in Science & Technological Education, 28(1):63–79,
2010.
John Sweller, Jeroen JG Van Merrienboer, and Fred GWC Paas. “Cognitive architecture and
instructional design”. Educational psychology review, 10(3):251–296, 1998.
Nawel Takouachet, Nadine Couture, Patrick Reuter, Pierre Joyot, Guillaume Rivière, and Nico-
las Verdon. “Tangible user interfaces for physically-based deformation: design principles
and first prototype”. The Visual Computer, 28(6-8):799–808, 2012.
Mohamed Tamaazousti, Vincent Gay-Bellile, Sylvie Naudet Collette, Steve Bourgeois, and
Michel Dhome. “Real-time accurate localization in a partially known environment: Applica-
tion to augmented reality on textureless 3d objects”. In ISMAR workshop, volume 1, page 3,
2011.
Arthur Tang, Charles Owen, Frank Biocca, and Weimin Mou. “Comparative effectiveness of
augmented reality in object assembly”. In Proceedings of the SIGCHI conference on Human
factors in computing systems, pages 73–80. ACM, 2003.
Markus Tatzgern, Denis Kalkofen, Raphael Grasset, and Dieter Schmalstieg. “Hedgehog
labeling: View management techniques for external labels in 3D space”. In Virtual Reality
(VR), 2014 iEEE, pages 27–32. IEEE, 2014.
175
Bibliography
Markus Tatzgern, Raphael Grasset, Eduardo Veas, Denis Kalkofen, Hartmut Seichter, and
Dieter Schmalstieg. “Exploring real world points of interest: Design and evaluation of object-
centric exploration techniques for augmented reality”. Pervasive and Mobile Computing, 18:
55–70, 2015.
Marcus Tönnis, David A Plecher, and Gudrun Klinker. “Representing information–Classifying
the Augmented Reality presentation space”. Computers & Graphics, 37(8):997–1011, 2013.
Brygg Ullmer, Hiroshi Ishii, and Robert JK Jacob. “Tangible query interfaces: Physically
constrained tokens for manipulating database queries”. In Proc. of INTERACT, volume 3,
pages 279–286, 2003.
David H Uttal and Cheryl A Cohen. “Spatial Thinking and STEM Education: When, Why, and
How?”. The Psychology of Learning and Motivation, 57:147, 2012.
Luca Vacchetti, Vincent Lepetit, and Pascal Fua. “Combining edge and texture information for
real-time accurate 3d camera tracking”. In Proceedings of the 3rd IEEE/ACM International
Symposium on Mixed and Augmented Reality, pages 48–57. IEEE Computer Society, 2004a.
Luca Vacchetti, Vincent Lepetit, and Pascal Fua. “Stable real-time 3d tracking using online
and offline information”. IEEE transactions on pattern analysis and machine intelligence, 26
(10):1385–1391, 2004b.
Eduardo Veas and Ernst Kruijff. “Vesp’R: design and evaluation of a handheld AR device”. In
Proceedings of the 7th IEEE/ACM International Symposium on Mixed and Augmented Reality,
pages 43–52. IEEE Computer Society, 2008.
Eduardo Veas, Alessandro Mulloni, Ernst Kruijff, Holger Regenbrecht, and Dieter Schmalstieg.
“Techniques for view transition in multi-camera outdoor environments”. In Proceedings of
Graphics Interface 2010, pages 193–200. Canadian Information Processing Society, 2010.
Stella Vosniadou. “On the nature of naive physics”. Reconsidering conceptual change: Issues in
theory and practice, pages 61–76, 2002.
S.M. Wachter, United States. Department of Housing, Urban Development. Office of Policy De-
velopment, Research, and National Association of Home Builders (U.S.). Residential Struc-
tural Design Guide: 2000 Edition. DIANE Publishing Company, 2000. ISBN 9780756703912.
URL:https://books.google.ch/books?id=NRGCAAAACAAJ.
Bin Wang, Fan Zhong, and Xueying Qin. “Pose optimization in edge distance field for texture-
less 3D object tracking”. In Proceedings of the Computer Graphics International Conference,
page 32. ACM, 2017.
Robert E Wendrich and Ruben Kruiper. “Robust Unconventional Interaction Design and Hy-
brid Tool Environments for Design and Engineering Processes”. In ASME 2017 International
Design Engineering Technical Conferences and Computers and Information in Engineering
Conference, pages V001T02A061–V001T02A061. American Society of Mechanical Engineers,
2017.
176
Bibliography
Sean White and Steven Feiner. “SiteLens: situated visualization techniques for urban site
visits”. In Proceedings of the SIGCHI conference on human factors in computing systems,
pages 1117–1120. ACM, 2009.
Eric N Wiebe, James Minogue, M Gail Jones, Jennifer Cowley, and Denise Krebs. “Haptic
feedback and students’ learning about levers: Unraveling the effect of simulated touch”.
Computers & Education, 53(3):667–676, 2009.
Joseph J Williams and Tania Lombrozo. “The role of explanation in discovery and generaliza-
tion: Evidence from category learning”. Cognitive Science, 34(5):776–806, 2010.
Hsin-Kai Wu, Silvia Wen-Yu Lee, Hsin-Yi Chang, and Jyh-Chong Liang. “Current status,
opportunities and challenges of augmented reality in education”. Computers & Education,
62:41–49, 2013.
Assist Prof Dr Gökhan Yazici and Edip Seçkin. “A Learning By Doing Approach in Teaching the
Fundamentals of the Structural Design of Trusses”. International Journal on New Trends in
Education & their Implications (IJONTE), 5(1), 2014.
Salih Yilmaz. “Misconceptions of civil engineering students on structural modeling”. Scientific
Research and Essays, 5(5):448–455, 2010.
Zacharias C Zacharia and Georgios Olympiou. “Physical versus virtual manipulative experi-
mentation in physics learning”. Learning and Instruction, 21(3):317–331, 2011.
Zacharias C. Zacharia, Eleni Loizou, and Marios Papaevripidou. “Is physicality an important
aspect of learning through science experimentation among kindergarten students?”. Early
Childhood Research Quarterly, 27(3):447 – 457, 2012. ISSN 0885-2006. doi: http://dx.doi.
org/10.1016/j.ecresq.2012.02.004.
URL:http://www.sciencedirect.com/science/article/pii/S0885200612000117.
Jiajie Zhang. “The nature of external representations in problem solving”. Cognitive science, 21
(2):179–217, 1997.
Feng Zhou, Henry Been-Lirn Duh, and Mark Billinghurst. “Trends in augmented reality
tracking, interaction and display: A review of ten years of ISMAR”. In Proceedings of the 7th
IEEE/ACM International Symposium on Mixed and Augmented Reality, pages 193–202. IEEE
Computer Society, 2008.
Guillaume Zufferey. The complementarity of tangible and paper interfaces in tabletop environ-
ments for collaborative learning. PhD thesis, EPFL, 2010.
Guillaume Zufferey, Patrick Jermann, Son Do-Lenh, and Pierre Dillenbourg. “Using augmen-
tations as bridges from concrete to abstract representations”. In Proceedings of the 23rd
British HCI Group Annual Conference on People and Computers: Celebrating People and
Technology, pages 130–139. British Computer Society, 2009.
177

Lorenzo Lucignano�08 September 1988, Naples, Italy
Avenue de Saugiaz 151020 Renens (VD)
Switzerland� +41 (0)786658816
InterestsHuman-Machine Interaction, Intelligent Agents, Post-WIMP interfaces, Mixed Reality, ComputerVision
Education2013–2018 PhD in Computer Science
École Polytechnique Fédérale de Lausanne, Lausanne, Switzerland� Thesis Title: Augmented Reality for Facilitating a Conceptual Understanding of Statics in Vocational
Education� Topics: Augmented Reality; Learning Technology; Human-Computer Interaction; User Studies
2010–2013 Master in Computer ScienceUniversitá degli studi di Napoli Federico II, Naples, Italy� Major Subject: Artificial Intelligence� Thesis Title: A Dialogue Manager For Multimodal Human-Robot Interaction� Topics: Human-Robot Interaction; Dialogue Management; Markov Processes� Final Grade: 110/110 cum laude
2006–2010 Bachelor in Computer ScienceUniversitá degli studi di Napoli Federico II, Naples, Italy� Thesis Title: Implementation and analysis of an optical mouse based on 3D planar tracking� Topics: Computer Vision� Final Grade: 110/110
ExperienceResearch Experience
2013–2018 Doctoral ResearcherComputer-Human Interaction in Learning and Instruction Laboratory, EPFL, Lausanne, Switzerland� Research
- Design and Development: Built an augmented reality system to support the learning of statics inan intuitive way (video).
- User Studies: Designed and conducted several studies centred around the design of the aforemen-tioned system employing also eye-tracking methods
- Qualitative and Quantitative Data Analysis: Performed a wide variety of analysis of the gathereddata, including coding of dialogues and think-aloud sessions, statistical inference, correspondenceanalysis and clustering
� Projects- Leading House DUAL-T, a research project focusing on learning technologies for the Swiss vocational
education system (link)� Other Activities
- Teaching assistant in four BSc and MSc courses.- Coordinator for the course "Introduction to visual computing" during the spring semester 2015, 2016
and 2017- Supervision of four semester students
1/3
179
August 2013 Research AssistantDepartment of Electrical Engineering and Information Technology (DIETI), Universitá degli studidi Napoli Federico II, Naples, ItalyObjective: Improvement of the dialogue manager described in the master thesis
MiscellaneousSummer 2016 Freelance Developer
Prof. Jean-Luc Gurtner, Département des Sciences de l’éducation, Université de Fribourg,Fribourg, SwitzerlandDevelopment of a Windows application (Qt/C++/Qml) for a research study.
Fall 2012 InstructorVoluntary organization “Un uovo mondo”, at XII CIRCOLO DIDATTICO NAPOLI OBERDAN,Naples, ItalyIn charge of an after-school program to introduce primary school students to the design and programmingof Lego Mindstorm robots.
Computer skillsLanguages C, C++, QML, Java
Frameworks Qt Windows, Linux and Android develop-ment
StatisticalTools
R
CAD SolidWorks, Blender (mostly to designfor 3D printing)
Others LATEX, ELAN, Git, OpenCV
LanguagesItalian Native speaker
English Upper-Intermediate ESOL B2 2012French Beginner
Projectsqml-ArtoolkitA wrapper to create augmenting reality applications in QT using ARToolkit. Github code
qtphysics-unofficialA wrapper to use the physics engine Bullet in Qt3D-based applications. Github code: https://github.com/chili-epfl/qtphysics-unofficial
Awards and FellowshipsSpring 2015 EPFL IC School Teaching Assistant Team Award for the course "Introduction to visual computing"2013–2014 EPFL IC School Fellowship
PublicationsLorenzo Lucignano and Pierre Dillenbourg. Double reality: Shifting the gaze between the physicalobject and its digital representation. In International Symposium on Mixed and AugmentedReality, ISMAR 2017 Adjunct, Nantes, France, October 9-13, 2017, publishing. IEEE, 2017.
Lorenzo Lucignano, Sébastien Cuendet, Beat Schwendimann, Mina Shirvani Boroujeni, and PierreDillenbourg. My hands or my mouse: Comparing a tangible and graphical user interface using eye-tracking data. In Proceedings of the FabLearn conference 2014, number EPFL-CONF-209011,
2/3
180
2014.
Lorenzo Lucignano, Francesco Cutugno, Silvia Rossi, and Alberto Finzi. A dialogue systemfor multimodal human-robot interaction. In Proceedings of the 15th ACM on Internationalconference on multimodal interaction, pages 197–204. ACM, 2013.
Mina Shirvani Boroujeni, Kshitij Sharma, Łukasz Kidziński, Lorenzo Lucignano, and PierreDillenbourg. How to quantify student’s regularity? In European Conference on TechnologyEnhanced Learning, pages 277–291. Springer International Publishing, 2016.
Mina Shirvani Boroujeni, Sébastien Cuendet, Lorenzo Lucignano, Beat Adrian Schwendimann,and Pierre Dillenbourg. Screen or tabletop: An eye-tracking study of the effect of representationlocation in a tangible user interface system. In Design for Teaching and Learning in a NetworkedWorld, pages 473–478. Springer International Publishing, 2015.
Riccardo Caccavale, Alberto Finzi, Lorenzo Lucignano, Silvia Rossi, and Mariacarla Staffa.Attentional top-down regulation and dialogue management in human-robot interaction. InProceedings of the 2014 ACM/IEEE international conference on Human-robot interaction, pages130–131. ACM, 2014.
Riccardo Caccavale, Enrico Leone, Lorenzo Lucignano, Silvia Rossi, Mariacarla Staffa, and AlbertoFinzi. Attentional regulations in a situated human-robot dialogue. In 2014 RO-MAN: The23rd IEEE International Symposium on Robot and Human Interactive Communication, pages844–849. IEEE, 2014.
Other InterestsMaker (3D Printing, Arduino, RasberryPi), Gardening, Manufacturing Nativity scenes from rawmaterials
3/3
181