Audi Investor and Analyst Day 2018
Alexander SeitzBoard Member for Finance, IT & Integrity, AUDI AG

robust KPIs 2017p
erfo
rm
an
ce
2016
60.1
2017
+1.4%
59.3
2017
SI 0.4
5.18.4%
4.88.2%
4.7
2016
3.1
SI 1.8
+4.4%
1,878
20172016
1,868
+0.6%
Deliveriesslightly above prior year
Revenueslightly above prior year
Operating profitbefore/after special items (SI) above prior year
Audi brand, ’000 vehicles EUR billion EUR billion
€$
£¥
passes 60bn EURre
ve
nu
e
59.3
+1.4%
2017
60.1
2016
EUR billion
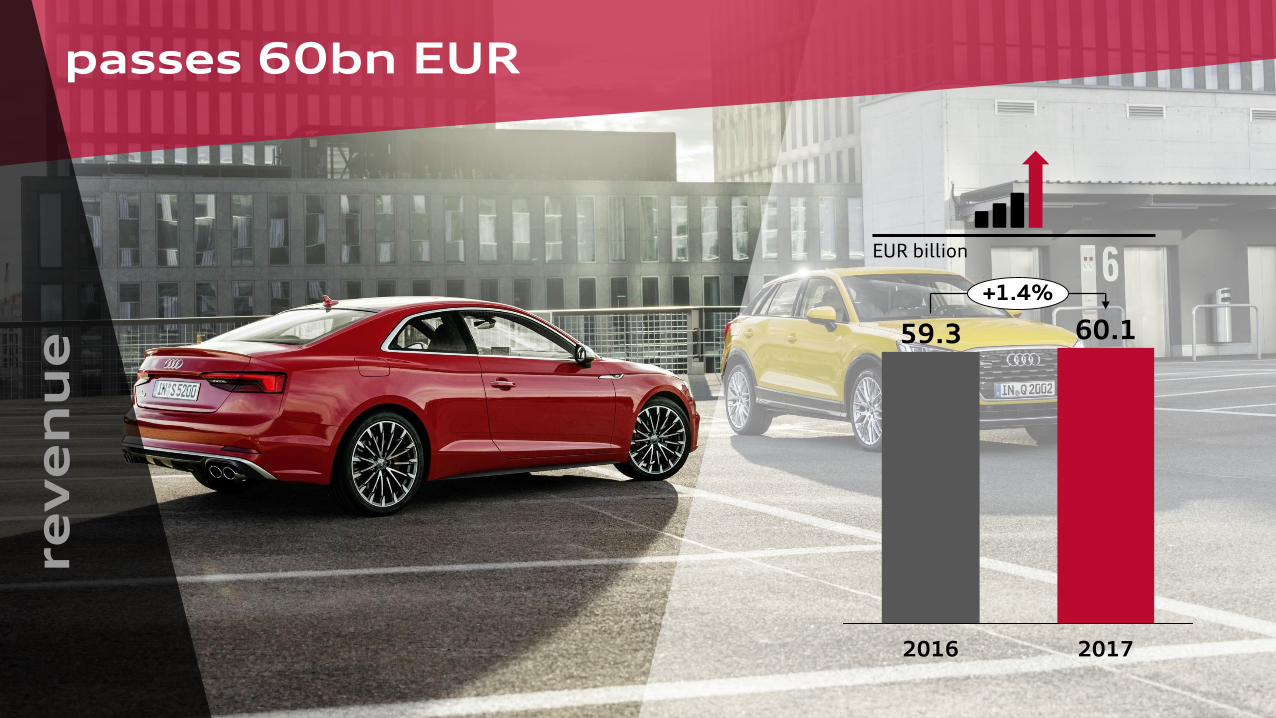
speeds-up revenueL
am
bo
rg
hin
i
1,009(906)EUR million
↗+11.4%
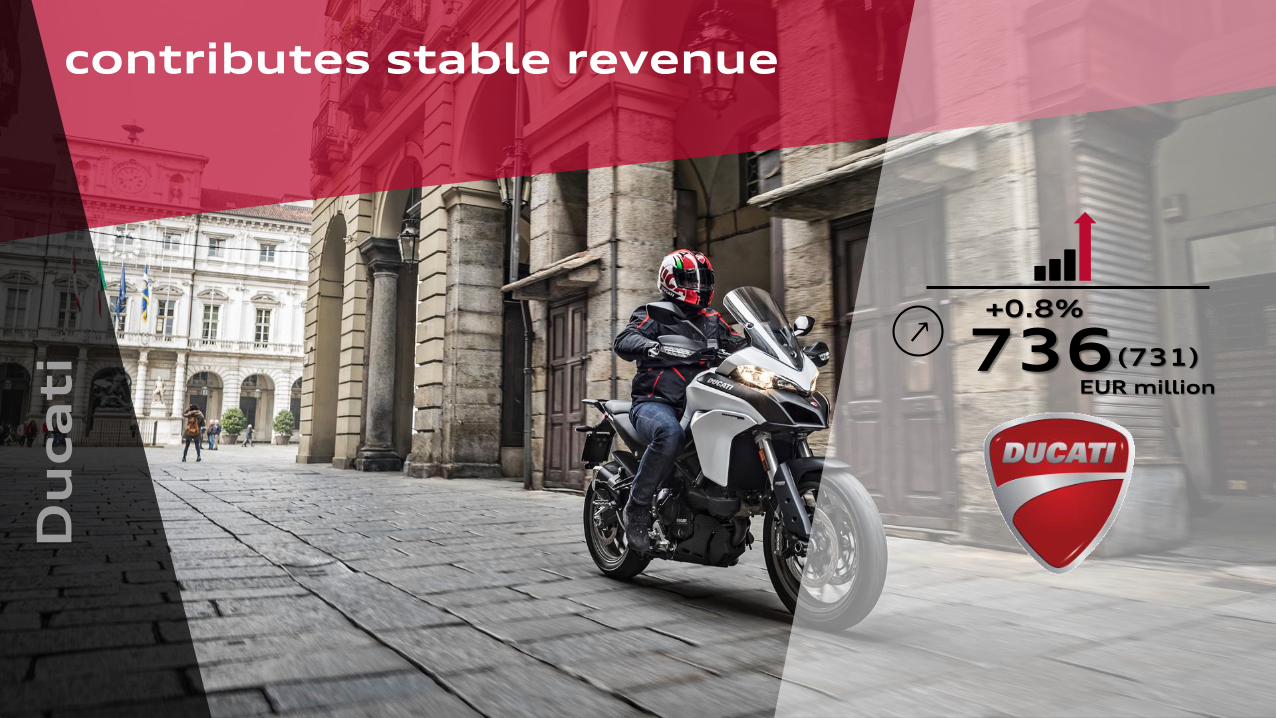
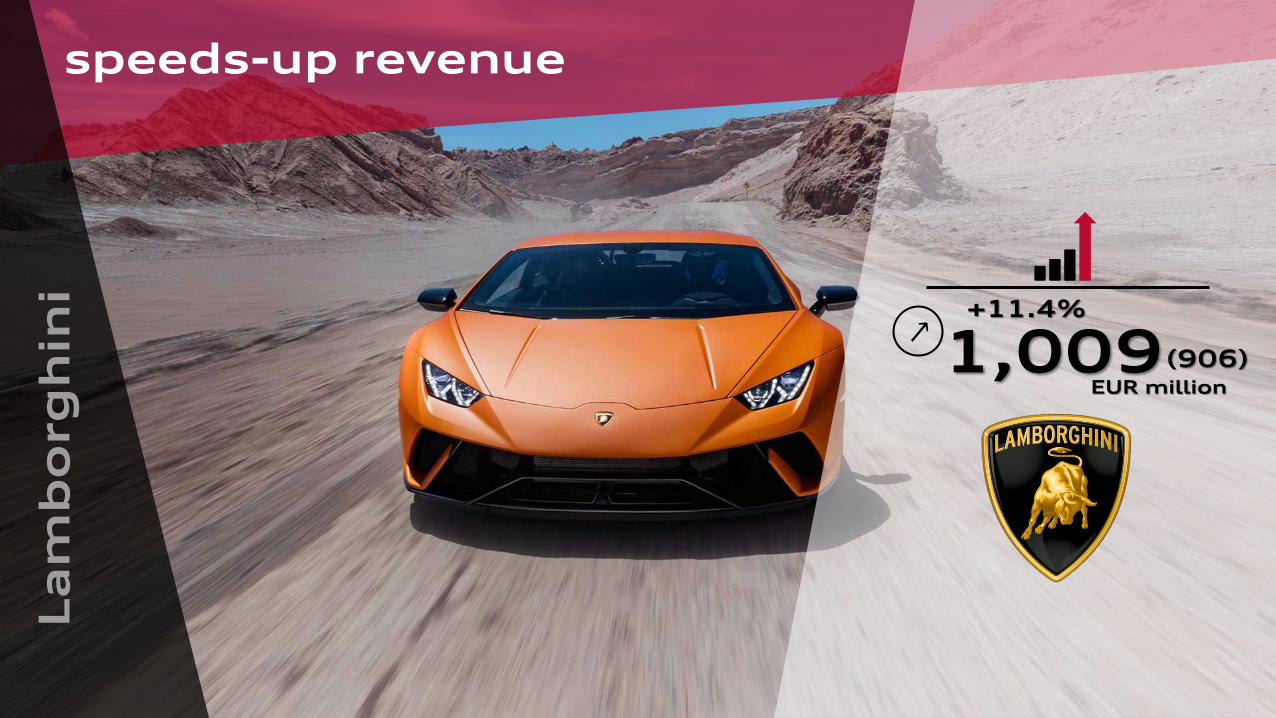
Du
ca
ti (731)736
contributes stable revenue
EUR million
↗+0.8%

pro
fit
& l
oss
↗Cost of goods sold
2017 2016
–50,545 –49,390
Distribution costs –5,297 –5,807
Administrative expenses
Revenue 60,128 59,317
Other operating result 1,069 –405
–685 –663
Operating Profit 4,671 3,052
robust performance
+2.3
–8.8
+1.4
X
+3.3
+53.1
∆ in %
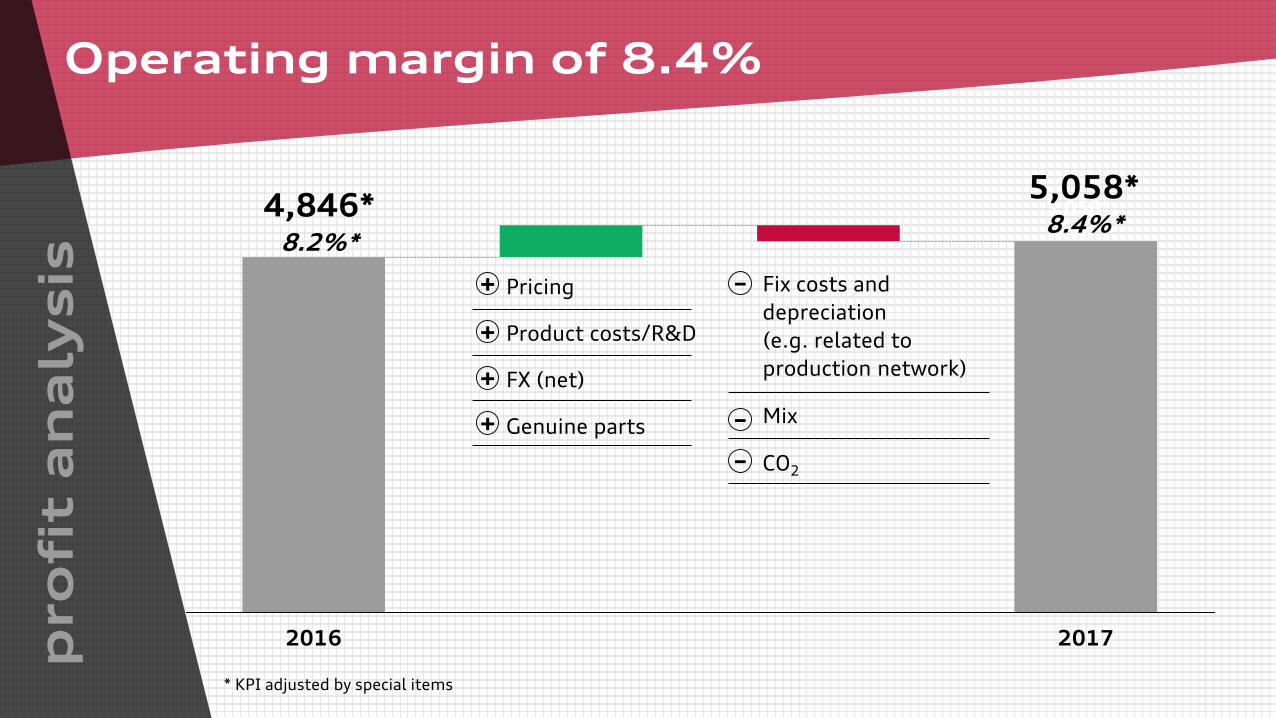
Operating Profit before special items
5,058 4,846 +4.4
EUR million
2016 2017
5,058*8.2%*
Fix costs and
depreciation
(e.g. related to
production network)
Mix
CO2
Pricing
Product costs/R&D
FX (net)
Genuine parts
4,846*8.2%*
5,058*8.4%*
pro
fit
an
aly
sis
Operating margin of 8.4%
+
+
+
+
–
–
–
* KPI adjusted by special items

20172016
5,058*8.2%*
4,846*8.2%*
5,058*8.4%*
-1,794
3,0525.1%
Special items
Takata and
Diesel issue 4,671
7.8%
-387
pro
fit
an
aly
sis
impacted by special items
* KPI adjusted by special items
Fix costs and
depreciation
(e.g. related to
production network)
Mix
CO2
Pricing
Product costs/R&D
FX (net)
Genuine parts
+
+
+
+
–
–
–
SpecialitemsDieselissue

financial strengthn
et c
ash
flo
w
4,312(2,094)↗
ne
t liq
uid
ity
20,788 (17,232)↗
sale of
participation
–
+
diesel issue
EUR million
EUR million

new models FX-headwinds
new regulationsnew technologies

deliveries revenue
net cash flowoperating margin
slight
2.7 and 3.2 billion EUR
between
8 – 10%
prior year level
between
increase
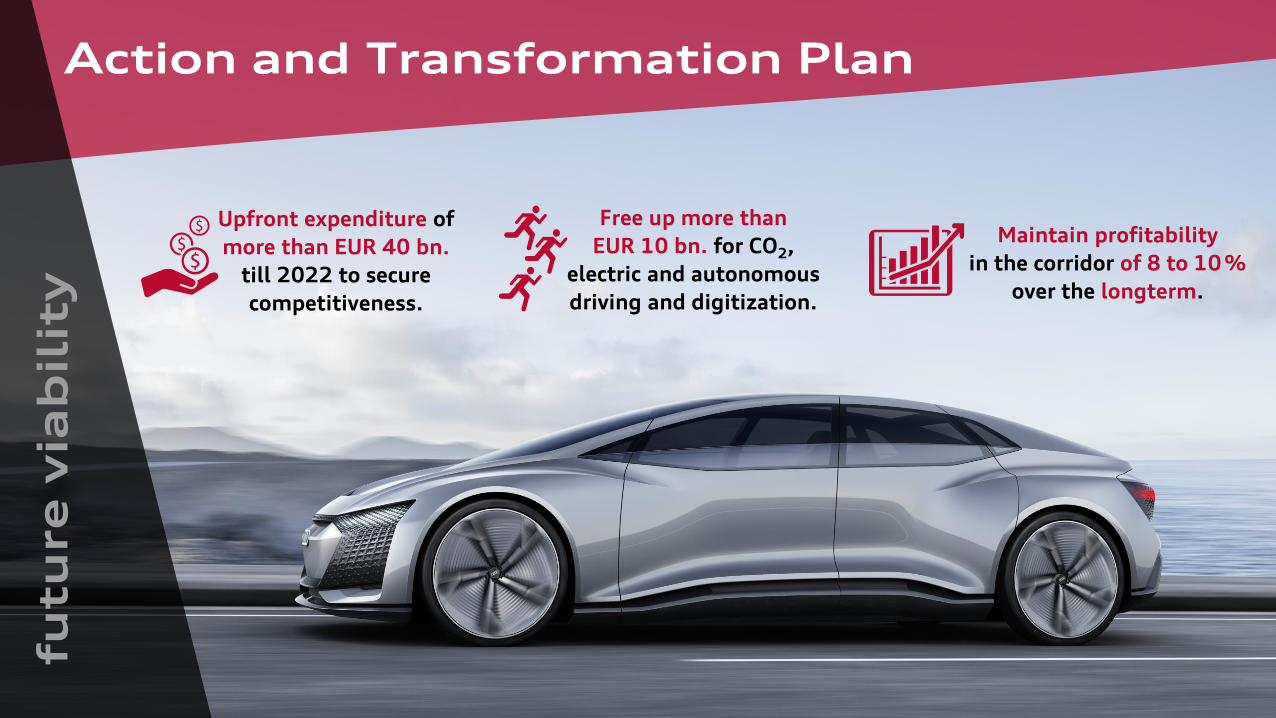
Action and Transformation Planfu
tu
re
via
bil
ity
Free up more than
EUR 10 bn. for CO2,
electric and autonomous
driving and digitization.
Upfront expenditure of
more than EUR 40 bn.
till 2022 to secure
competitiveness.
Maintain profitability
in the corridor of 8 to 10%
over the longterm.
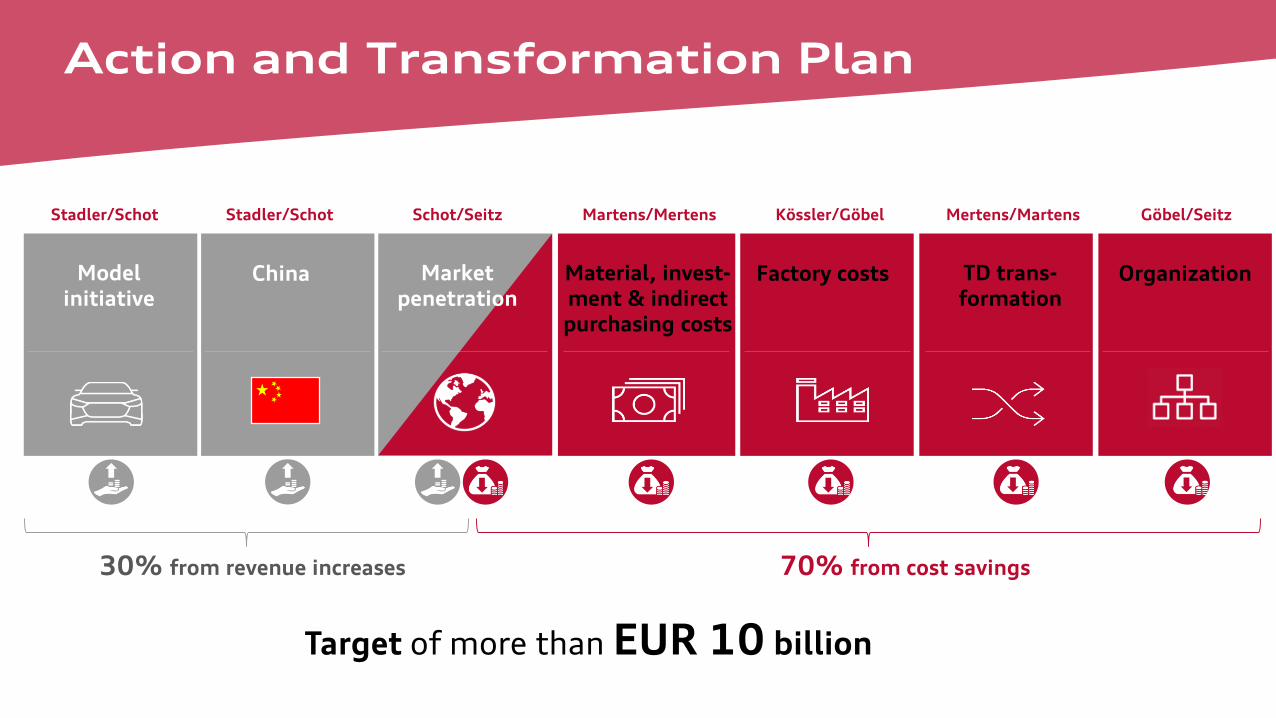
Action and Transformation Plan
40Milliarden EUR
&Model
initiativeMarket
penetrationMaterial, invest-ment & indirect purchasing costs
Factory costs TD trans-formation
OrganizationChina
Target of more than EUR 10 billion
30% from revenue increases 70% from cost savings
Stadler/Schot Schot/Seitz Martens/Mertens Kössler/Göbel Mertens/Martens Göbel/SeitzStadler/Schot

Audi Investor and Analyst Day 2018
Bram SchotBoard Member for Sales & Marketing, AUDI AG
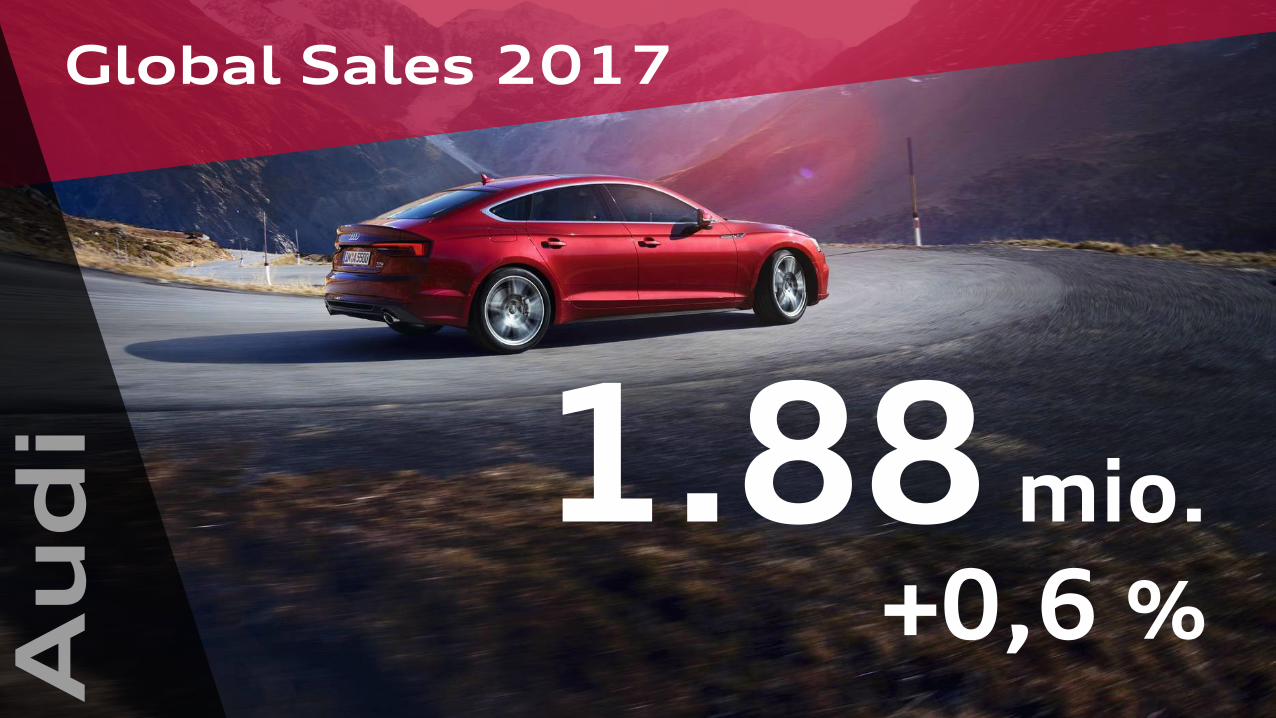
1.88 mio.
+0,6 %
Global Sales 2017A
ud
i

Core regionsA
ud
i
+7.8%
USA
226,511 cars
(210,213)
+0.5%
805,388 cars
(801,116)
Western
Europe

Top Ten markets 2017A
ud
i
1. CHINA
2. GERMANY
3. USA
4. GREAT BRITAIN
5. ITALY
6. FRANCE
7. SPAIN (incl. Canary Islands)
8. CANADA
9. BELGIUM
10. JAPAN
WORLD
2017 Delta vs. previous year
597,866
294,544
226,511
175,217
68,954
63,980
56,083
36,007
32,760
28,301
1,878,105
+6,312
+1,237
+16,298
-2,348
+6,524
+2,228
+4,204
+5,463
-510
-151
+10,367
+1.1%
+0.4%
+7.8%
-1.3%
+10.5%
+3.6%
+8.1%
+17.9%
-1.5%
-0.5%
+0.6%

Core regionsA
ud
i
+7.8%
USA
226,511 cars
(210,213)
+1.1%
China
597,866 cars
(591,554)
+0.5%
805,388 cars
(801,116)
Western
Europe
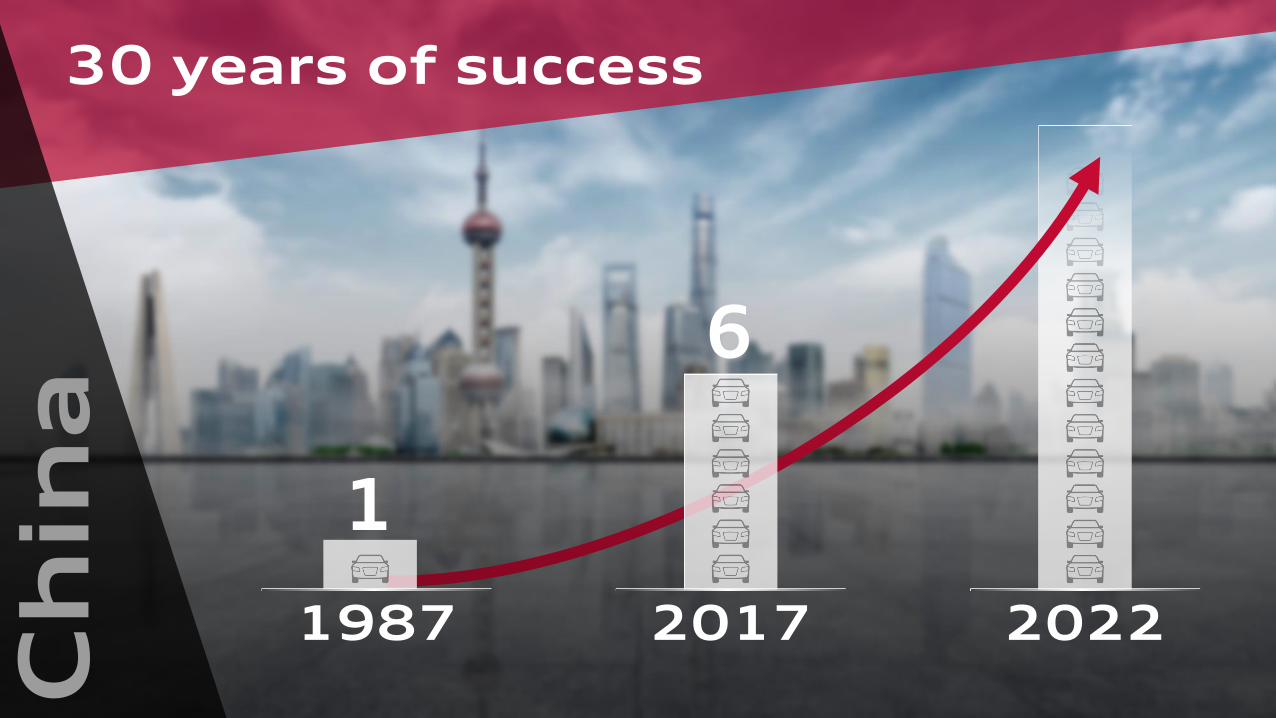
Ch
ina
30 years of success
1987 2022
6
2017
1

Au
di
Sp
ort
Constant Growth
24,000 RS-models
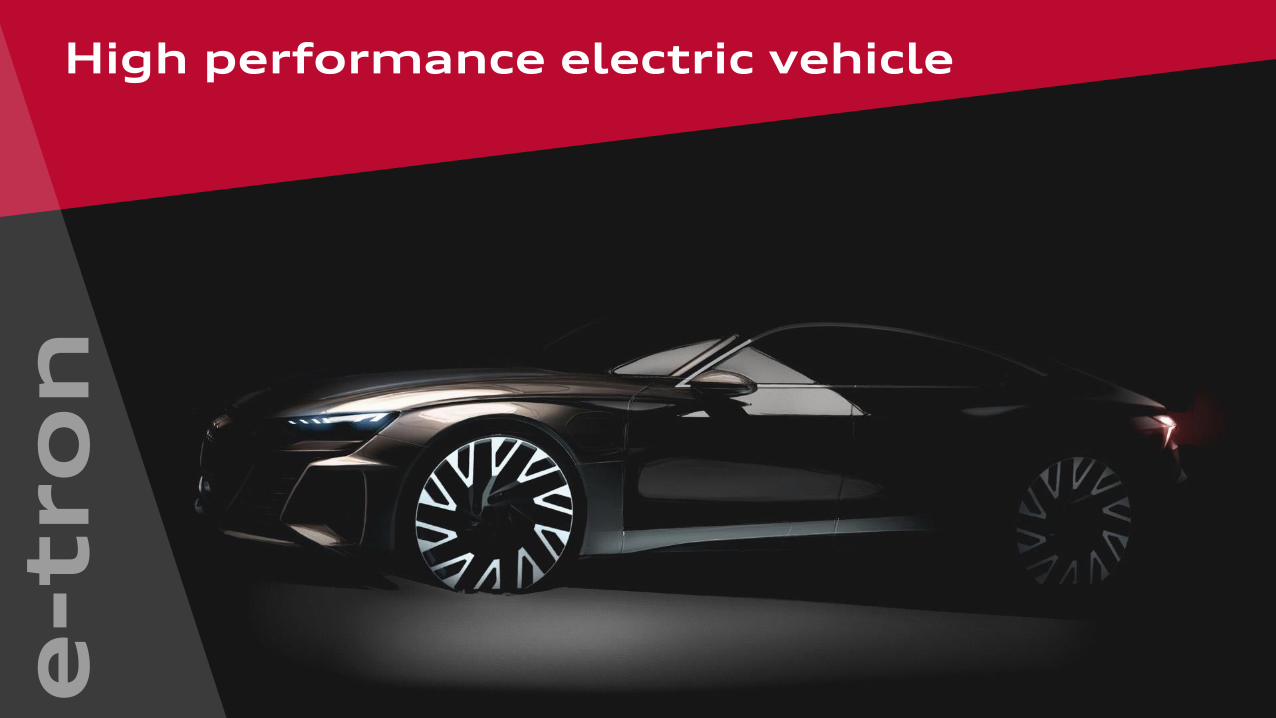
High performance electric vehiclee
-tro
n

Digital Retail ElementsC
on
ne
cte
dR
eta
il
+500 in 2017

my
Au
di
Audi on demand
USA
Canada
Spain
DenmarkGreat Britain
United Arab Emirates
Russia
South Korea JapanChina
Germany
France
Italy
Singapore
Australia
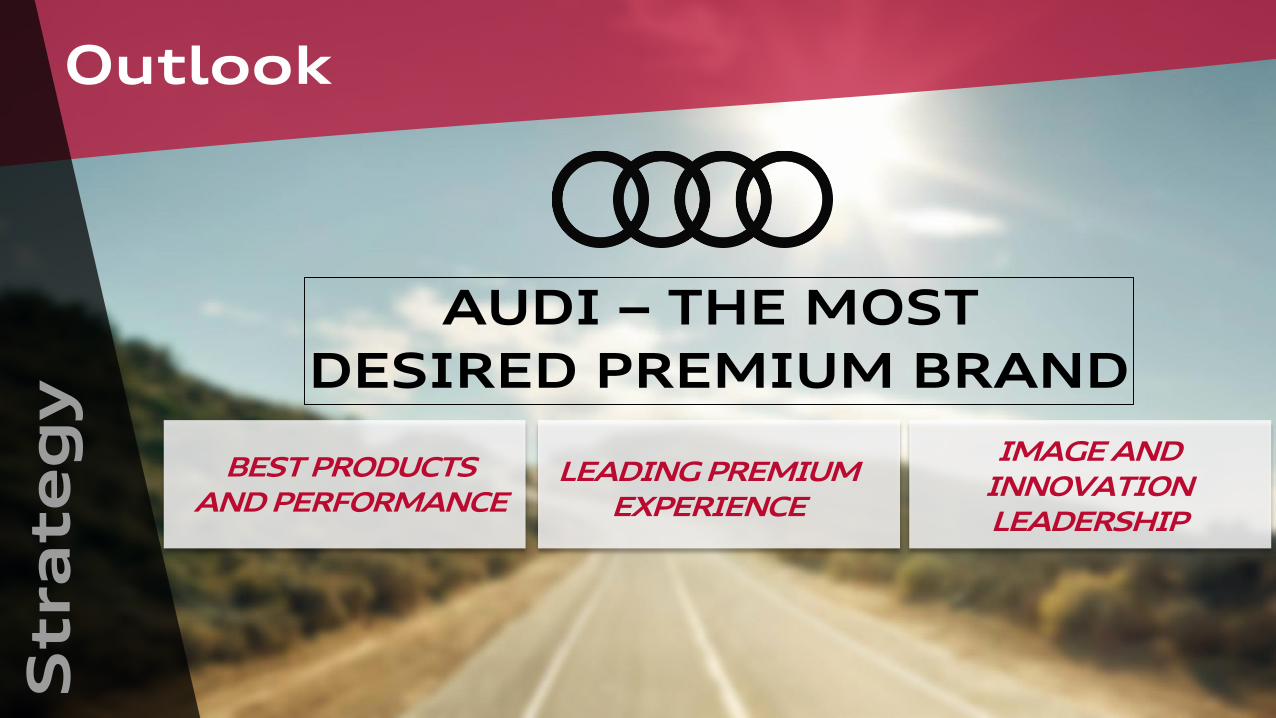
Stra
te
gy
Outlook
AUDI – THE MOST
DESIRED PREMIUM BRAND
BEST PRODUCTS AND PERFORMANCE
LEADING PREMIUM EXPERIENCE
IMAGE AND INNOVATION LEADERSHIP
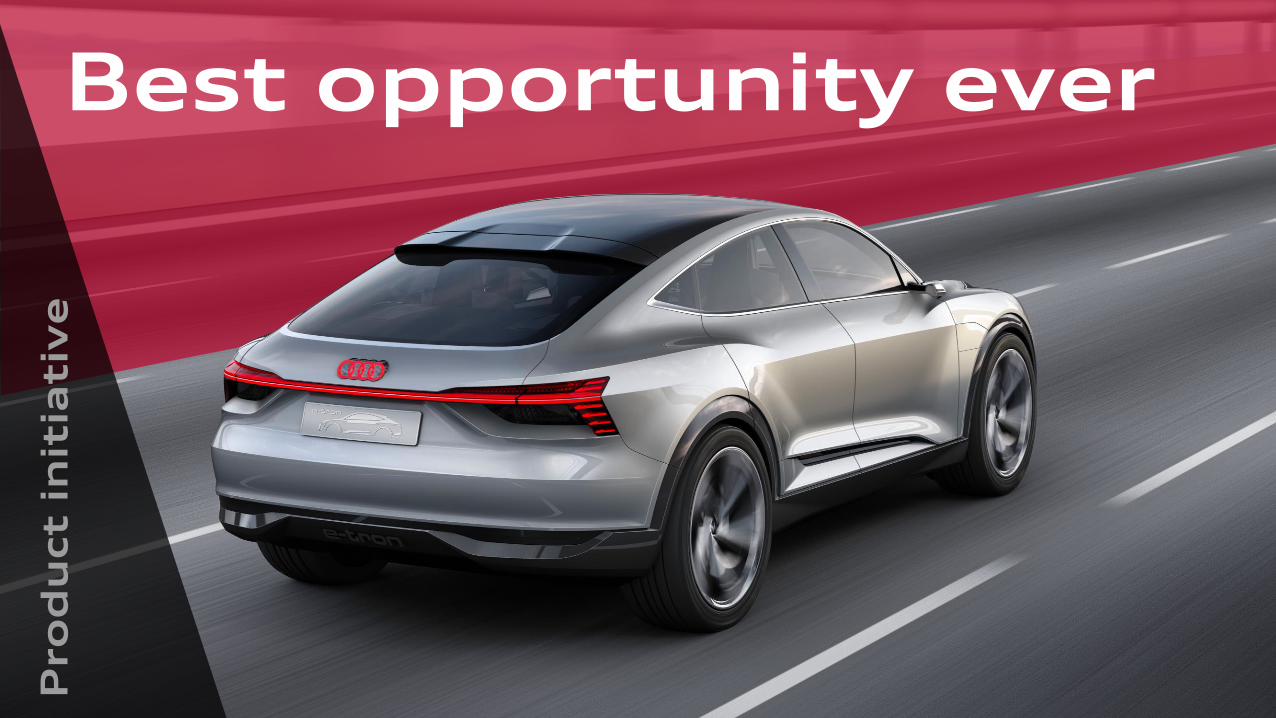
Pro
du
ct i
nit
iativ
eBest opportunity ever
Disclaimer
The following presentations contain forward-looking statements and information on the business development of the Volkswagen Group. These statements may be spoken orwritten and can be recognized by terms such as “expects”, “anticipates”, “intends”, “plans”, “believes”, “seeks”, “estimates”, “will” or words with similar meaning. These statementsare based on assumptions, which we have made on the basis of the information available to us and which we consider to be realistic at the time of going to press. Theseassumptions relate in particular to the development of the economies of individual countries and markets, the regulatory framework and the development of the automotiveindustry. Therefore the estimates given involve a degree of risk, and the actual developments may differ from those forecast. The Volkswagen Group currently faces additional risksand uncertainty related to pending claims and investigations of Volkswagen Group members in a number of jurisdictions in connection with findings of irregularities relating toexhaust emissions from diesel engines in certain Volkswagen Group vehicles. The degree to which the Volkswagen Group may be negatively affected by these ongoing claims andinvestigations remains uncertain.Consequently, a negative impact relating to ongoing claims or investigations, any unexpected fall in demand or economic stagnation in our key sales markets, such as in WesternEurope (and especially Germany) or in the USA, Brazil or China, will have a corresponding impact on the development of our business. The same applies in the event of asignificant shift in current exchange rates in particular relative to the US dollar, sterling, yen, Brazilian real, Chinese renminbi and Czech koruna.If any of these or other risks occur, or if the assumptions underlying any of these statements prove incorrect, the actual results may significantly differ from those expressed orimplied by such statements.We do not update forward-looking statements retrospectively. Such statements are valid on the date of publication and can be superseded.This information does not constitute an offer to exchange or sell or an offer to exchange or buy any securities.