ATTRIBUTING SOCIAL MEANING TO ANIMATED SHAPES 1
Attributing social meaning to animated shapes:
A new experimental study of apparent behavior
Adrianna Ratajska1, Matt I. Brown2, Christopher F. Chabris2
1Department of Clinical and Health Psychology, University of Florida, Gainesville, FL
2Geisinger Health System, Lewisburg, PA
Revised version in press at the American Journal of Psychology, 15 July 2020 Running Head: ATTRIBUTING SOCIAL MEANING TO ANIMATED SHAPES *Address correspondence to: Christopher F. Chabris Geisinger Health System 120 Hamm Drive, Suite 2A, MC 60-36 Lewisburg, PA 17837 [email protected] Acknowledgments: We thank Jaclyn Mandart for her research assistance and David Winn for his work in developing the shape animations. We also thank Shannon Hughes, Julie Fishman, and Elisa Huerta for their contributions to this project. Portions of this research were conducted while AR was a student and CFC was a professor at Union College in Schenectady, NY, and while AR was a research assistant at Brigham and Women’s Hospital in Boston, MA. This work was supported by funds from Union College, the National Science Foundation (grants 0963404 and 1322214) and the National Institutes of Health (grant U01MH119705). All data and materials for the work described in this article are available at OSF (https://osf.io/sqxy6). Keywords: social attribution, social cognition, social intelligence, social judgment, theory of mind
ATTRIBUTING SOCIAL MEANING TO ANIMATED SHAPES 2
Abstract
In 1944, Heider and Simmel reported that observers could perceive simple animated geometric
shapes as characters with emotions, intentions, and other social attributes. This work has been
cited over 3000 times and has had wide and ongoing influence on the study of social cognition
and social intelligence. However, many researchers in this area have continued to use the original
Heider and Simmel black-and-white video. We asked whether the original findings could be
reproduced 75 years later by creating 32 new colored animated shape videos designed to depict
various social plots and testing whether they can evoke similar spontaneous social attributions.
Participants (N = 66) viewed our videos and were asked to write narratives which we coded for
indicia of different types of social attributions. Consistent with Heider and Simmel, we found
that participants spontaneously attributed social meaning to the videos. We observed that
responses to our videos were also similar to responses to the original video reported by Klin
(2000), despite being only 13-23 s and portraying a broader range of social plots. Participants
varied in how many social attributions they made in response, and the videos varied in how
much they elicited such responses. Our set of animated shape videos is freely available online for
all researchers to use and forms the basis of a multiple-choice assessment of social intelligence
(Brown et al., 2019).
ATTRIBUTING SOCIAL MEANING TO ANIMATED SHAPES 3
Nearly every social interaction we engage in relies on the ability to understand and reason
about the thoughts, emotions, and intentions of other people. The ability to interpret others’
mental states allows us to navigate the complex world of social behavior by making sense of
others’ behaviors, interpreting subtle social cues, and making inferences about what other people
may be thinking. This set of skills has been referred to as social intelligence (Marlowe, 1986),
mentalizing (Frith & Frith, 2003), or Theory of Mind (ToM; Premack & Woodruff, 1978). Its
importance has been illustrated in many areas, including studies on social cooperativeness (Paal
& Bereczkei, 2007), size of one’s social network (Stiller & Dunbar, 2007), and leadership
(Zaccaro, Green, Dubrow, & Kolze, 2018), just to name a few. Despite these indications, much
of the research to date has focused on understanding impairments among individuals with
clinical diagnoses such as autism spectrum disorder (ASD) and schizophrenia (Chung, Barch, &
Strube, 2014; Sprong, Schothorst, Vos, Hox, & Van Engeland, 2007), with few studies focusing
on samples of typically functioning adults.
One challenge of research in social intelligence among neurotypical adults is invoking
mental state attributions in a suitable way for this population. Traditional methods include the
use of written narratives (e.g., Happé, 1994; Stone, Baron-Cohen, & Knight, 1998) and images
of facial expressions (e.g., Baron-Cohen, Wheelwright, Hill, Raste, & Plumb, 2001). Not only
were many of these tasks designed for use with specific populations (e.g., adults with ASD), but
they also may potentially confound social intelligence with verbal reasoning or general
intelligence (Greig, Bryson, & Bell, 2004; Olderbak, Semmler, & Doebler, 2019). These
methods may also include culturally biased stimuli which could lead to differences in task
performance (Dodell-Feder, Ressler, & Germine, 2020).

ATTRIBUTING SOCIAL MEANING TO ANIMATED SHAPES 4
One relatively underutilized method of modeling social interactions and mental state
attributions is the use of animated shape videos as stimuli. This paradigm, based on the classic
work of Heider and Simmel (1944), relies on individuals’ ability to make social inferences and
judgments from inanimate stimuli, and is a convenient way to elicit social attribution while
avoiding some of the limitations of other methods. Not only do these animated tasks typically
require less reading or verbal ability, but they have been reported to display little to no cross-
cultural differences (Lee et al., 2018). This paper presents a new class of animated shape videos,
inspired by the original methods used by Heider and Simmel. Rather than directly replicating the
original Heider and Simmel animation, we set out to design a new set of shorter, standardized
animations that involve a broader range of social situations and emotions. These new videos
were designed to be generally suitable for a variety of social intelligence studies in a variety of
research settings and participant populations.
Eliciting Social Attributions using Animated Shapes: Heider And Simmel (1944)
In their studies on social attribution, Heider and Simmel (1944) created a 2.5<H>-min
long silent animation which included simple geometric shapes (two triangles and one circle)
moving around on a screen. The shapes were not explicitly defined as human figures, nor did
they physically resemble humans in any way. Yet when college students viewed the animation
and were asked to summarize the events, all but one of the 34 participants in the study
(Experiment I) described the video in human-like terms. Many of the scenes were interpreted
similarly by participants, suggesting that certain movements by the shapes in the video signaled
social attribution in a predictable manner. In another condition of the study (Experiment III),
Heider and Simmel played the same animation in a reverse sequence. Again, nearly all
participants (42 of 44) described the actions in the video in human-like terms. However, the
ATTRIBUTING SOCIAL MEANING TO ANIMATED SHAPES 5
interpretations showed much more variation, likely because the reverse animation lacks definite
organization and participants struggled to construct a social plot consistent with the movements
of the shapes.
Heider and Simmel’s (1944) work had several important implications. It demonstrated
that even simple geometric shapes can be interpreted as human figures when the shapes seem to
be moving on their own accord (shapes not moving on their own are more likely to be interpreted
as inanimate objects, e.g. a door or house). Moreover, once a shape is perceived as human, there
is a tendency to attribute mental states to the shape and to use these mental states to predict its
behavior. According to Heider and Simmel, “as soon as we ascribe a certain movement to a
figural unit and consider this unit as an animated being, perception of motive or need is
involved” (p. 257). Additionally, their work determined that the cues for ascribing mental states
and predicting behavior in a figure are derived from the larger social plot and interactions with
other figures, rather than the shapes’ movement patterns in isolation. Heider and Simmel explain
that “we cannot read off the motivation from the movements themselves . . . movements of the
other actors, or of preceding or succeeding events, offer cues for the determination of motives”
(p. 258). Viewers make sense of the shapes’ mental states by analyzing the preceding events and
the shapes’ interactions with other figures. In this way, animated shape videos can be used to
depict social plots and human interactions, presenting a unique way of eliciting and studying
social attribution under challenging conditions, namely the absence of many typical cues like
facial expressions, body language, speech, and tone of voice.
Recent Applications Of Heider & Simmel’s Methods
ATTRIBUTING SOCIAL MEANING TO ANIMATED SHAPES 6
Many researchers have continued to use the original Heider and Simmel (H&S) video to
study social attributions in various fields. Klin (2000) used the H&S animation to evaluate social
attributions as an indicator of ToM capacities in a clinical population of individuals diagnosed
with high functioning autism and Asperger’s syndrome. Participants watched the video, which
had been broken into several short segments, and were asked to provide a series of narratives
describing the video’s plot. To quantify the level of social attribution in these narratives, Klin
developed a coding system which consisted of several index scores focusing on different aspects
of participants’ social and cognitive responses. Index scores measured, among other things,
participants’ overall capacity for attributing social meaning to the stimuli, frequency of use of
mental state terms, and ability to identify salient social features in the animation. Klin found that
participants with autism or Asperger’s were less likely than the typically functioning control
group to attribute social meaning to the animations. The clinical participants utilized fewer
mental state terms in their narratives and identified fewer social elements in the plot. Klin called
the measure he developed the Social Attribution Task (SAT), and it has since been used in
follow-up studies with individuals diagnosed with ASD (Klin & Jones, 2006) and schizophrenia
(Bell, Fiszdon, Greig, & Wexler, 2010). More recently, researchers have developed a multiple-
choice version of the SAT (SAT-MC) which provides scores that correlate positively with
measures of adaptive functioning (Burger-Caplan, Saulnier, Jones, & Klin, 2016) and other ToM
tasks (Altschuler et al., 2018).
In addition, other researchers have designed their own animated shape tasks to study
social attribution in clinical populations (Abell, Happé, & Frith, 2000) and in social neuroscience
research (Martin & Weisberg, 2003). In particular, Abell and colleagues (2000) developed a
novel set of animated shape videos representing three types of motion: random movement

ATTRIBUTING SOCIAL MEANING TO ANIMATED SHAPES 7
(purposeless movement and no interaction between the shapes), goal-directed action (a shape
responds to the physical action or behavior of one another), and ToM (a shape reacts to the
other’s mental state). Participants were shown the animations and asked to provide descriptions,
which were then rated based on accuracy and type of description. Typically functioning children
and adults were accurate in their explanations of the three types of videos. However, children
with autism had greater difficulty describing the ToM videos, using mentalizing descriptions less
often and referring to mental states that were inappropriate to the animation. Since then, this set
(the Frith-Happé animations) has been used to develop a short test of mentalizing ability (White,
Coniston, Rogers, & Frith, 2011) as well as to generally observe mentalizing ability among
different populations (Corden, Critchley, Skuse, & Dolan, 2006; Moriguchi et al., 2006;
Moriguchi, Ohsnishi, Mori, Matsuda, & Komaki, 2007; Russell, Reynaud, Herba, Morris, &
Corcoran, 2006). Moreover, the Frith-Happé animations have also been used to detect
differences in neural activity (Kirkovski, Enticott, Hughes, Rossell, & Fitzgerald, 2016) or eye
movement (Roux, Passerieux, & Ramus, 2013)
Beyond the original H&S and the Frith-Happé animations, most remaining studies have
relied on their own uniquely developed sets of animated shape videos. For example, Martin and
Weisberg (2003) designed videos to depict one of two different types of shape animation:
mechanical action and social interaction. The mechanical action videos used shapes to depict the
movement of inanimate objects (e.g., a pinball, a conveyor belt) while social interaction videos
used shapes to depict human activities (e.g., sharing, playing on a slide). The videos were
presented to typically functioning adults in a functional magnetic resonance imaging (fMRI)
experiment. When viewing social interaction videos, participants exhibited activation in different
brain regions than when viewing the mechanical action videos, suggesting that these are two
ATTRIBUTING SOCIAL MEANING TO ANIMATED SHAPES 8
distinct cognitive domains. Other studies further examined the effects of different animated
stimuli on brain activation and attention (e.g. Isik, Koldewyn, Beeler, & Kanwisher, 2017;
Tavares, Lawrence, & Barnard, 2008). Unlike most animated shape tasks, which are typically
shown in two dimensions, Visch and Tan (2009) created a three-dimensional shape task
involving two interacting shapes. Other researchers have created animated shape videos that
were designed by algorithms and not explicitly meant to represent any specific form of social
interaction (Wick, Soce, Garg, Grace, & Wolfe, 2019).
While these sets of animations have largely extended the work of Heider and Simmel
(1944), they face certain limitations. Although many researchers continue to use versions of the
original H&S animation, this animation is relatively long (2.5-min) and depicts a limited set of
social behaviors related to aggression and bullying. Many of the newer animations were designed
specifically for use in neuroimaging studies (e.g., Ludwig et al., 2020; Weisberg et al., 2014) or
to study impairments in clinical conditions (e.g., Abell et al., 2000). For example, the Frith-
Happé animations have been used frequently in past research but most of these studies focus
specifically on individuals who are diagnosed with ASD or other psychological impairments.
This potentially limits their generalizability and application to research in broader populations.
Moreover, these sets of videos and the individual participant descriptions of the videos are often
not publicly available or easily accessible. This makes it difficult for other researchers to use
these stimuli in subsequent research or to determine whether they are equally effective in
eliciting social attributions in other participant populations. Others have designed tools to create
new animations in the style of the original Heider and Simmel video (e.g. Gordon & Roemmele,
2014), but few studies tested whether they can also be used to evoke social attributions or mental
states.
ATTRIBUTING SOCIAL MEANING TO ANIMATED SHAPES 9
Present Study
We sought to develop a new set of animated shape videos that would provide a more
modern and convenient means for assessing social intelligence and which could also be used in
many populations and contexts. The custom-developed animations in the measure are a series of
short, two-dimensional shape videos designed to mimic human interactions. These videos, which
were also utilized in the present study, expand upon and update the work of Heider and Simmel
(1944) with modern videos featuring many new social plots and situations. Unlike Heider and
Simmel, the focus of our work was not to study the perceptual organization of the shapes’
movements and actions, but rather to develop an updated, publicly available set of videos. An
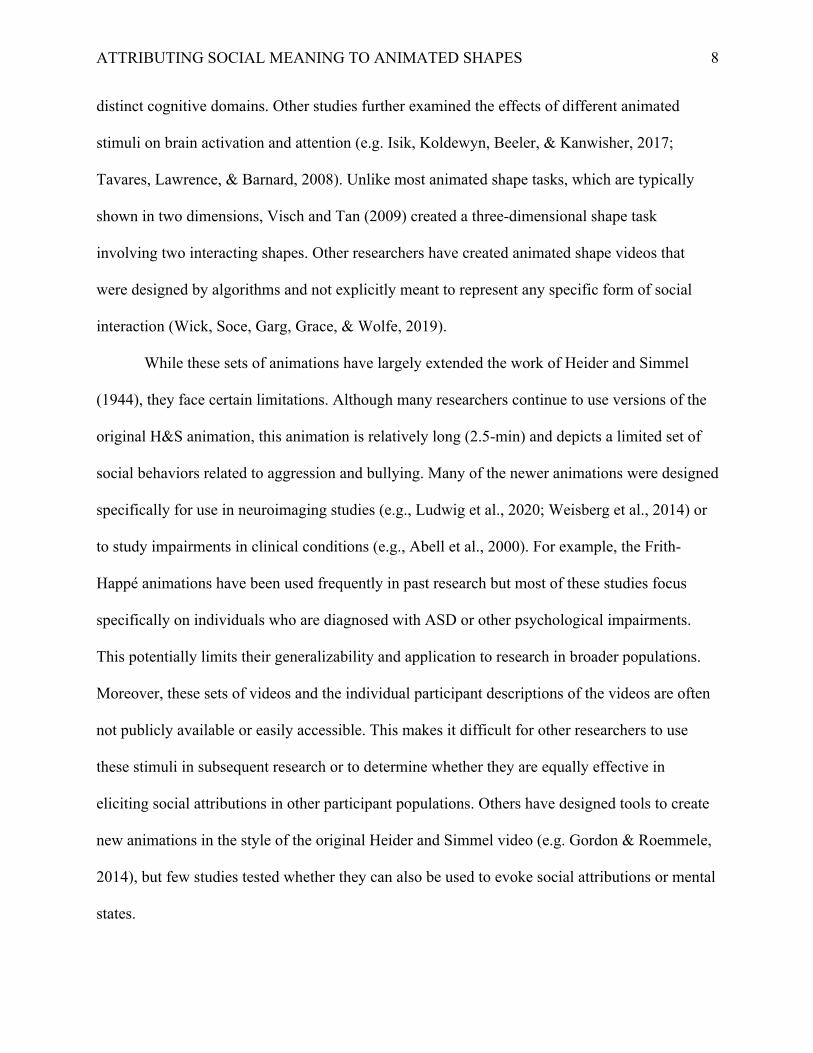
example screenshot of the H&S video and one of our newly developed videos is illustrated in
Figure 1. Although our videos were influenced by the original H&S animation, our intent was
not to reproduce or replace the original. Instead, our goal was to provide a set of modern, shorter
animations which involve a broader range of social and emotional expressions. These videos
were designed to be applied to many research settings including (but not limited to) social
cognition, social neuroscience, and developmental psychology. We expected that the videos
would vary not only in social/emotional content, but also in difficulty of making attributions and
in the consistency of such attributions made by different observers. These sources of variability
can be regarded as features of this set of videos that may make it useful as a research tool for
purposes to which a single video (e.g., the H&S original) is not optimally suited.
In prior research, several of these videos were used as stimuli in a multiple-choice test of social
intelligence: the Social Shapes Test (SST; Brown et al., 2019). Using these videos, Brown and
colleagues observed performance on the SST was positively correlated with performance on
emotional recognition and emotion understanding tasks. Compared to other social intelligence

ATTRIBUTING SOCIAL MEANING TO ANIMATED SHAPES 10
tasks, the SST was also less strongly related to measures of verbal ability. These results suggest
that the animated shape videos potentially provide a means of evoking social attributions without
relying heavily on verbal intelligence.
In the present study, participants watched our custom set of animated shape videos and
wrote free response narratives describing the action in the videos. Each participant’s response
was coded based on their level of social attribution, using scoring criteria adapted from Klin
(2000). Our primary objective was to replicate and extend the findings of Heider and Simmel
(1944) and observe the degree to which this new class of stimuli can evoke a broader range of
social attributions. We also compared our results to those reported by Klin (2000) for typically
developing participants. By omitting any cues to the social nature of our videos, we aimed to
investigate whether the videos can elicit spontaneous social attributions with the goal of
providing a more modern set of videos that can be utilized for research on social intelligence
among typical adults.
Method
Participants
Sixty-six undergraduate students (44 female, 22 male; aged 18–23 years, M = 19.8) at
Union College (Schenectady, New York) participated in this study to fulfill a course requirement
or for cash ($6). All participants provided written informed consent and the study was approved
by the Union College Committee on the Use of Human Subjects.
Materials
An initial set of 77 hand-drawn storyboards was designed to represent various plots or
social interactions (Brown et al., 2019). These storyboards were developed based on several
ATTRIBUTING SOCIAL MEANING TO ANIMATED SHAPES 11
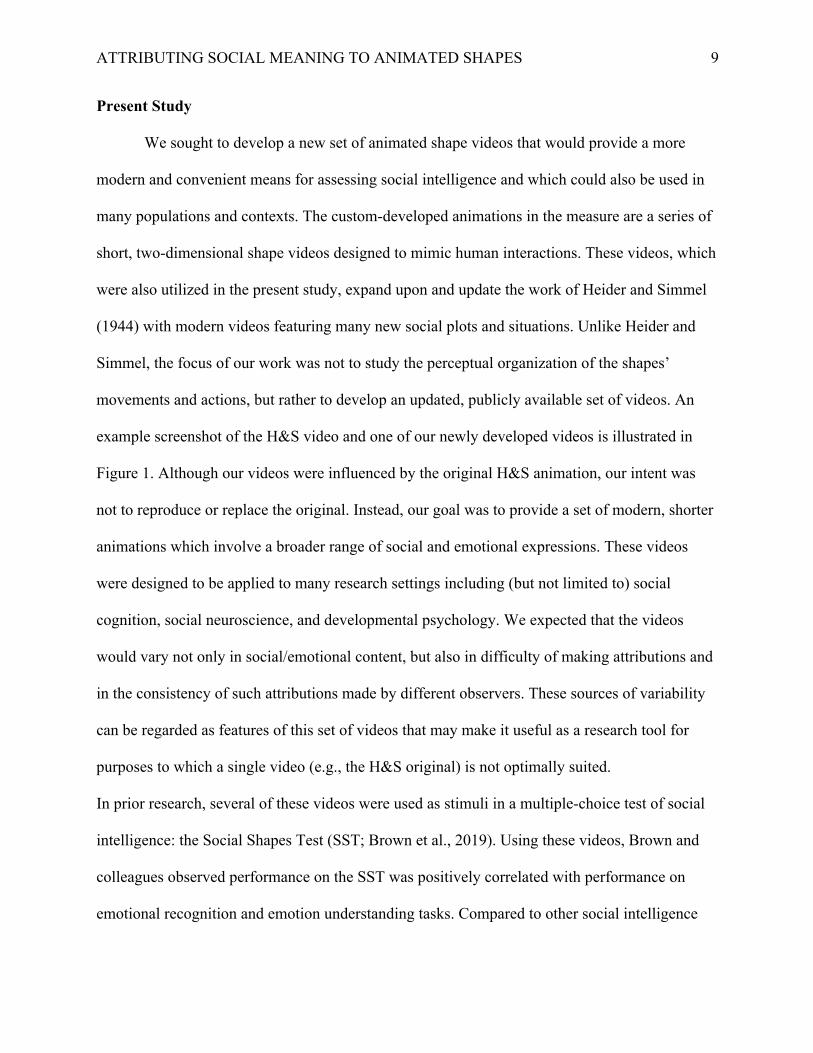
rounds of brainstorming sessions and feedback. We provide an example storyboard that was used
to create the animation titled “Exclusion” in Figure 2. Several of these storyboards were inspired
by social animations used in past research (e.g., Boraston, Blakemore, Chilvers, & Skuse, 2007;
Heider & Simmel, 1944; Martin & Weisberg, 2003; White et al., 2011). From this set of 77, we
selected 32 storyboards to be developed into digital animations by a professional graphic artist
using Adobe Flash. The digital animations underwent several revisions until the desired social
plot or interaction was sufficiently depicted (confirmed by agreement of a subset of the authors).
Each of the 32 animated videos was between 13–23 s in length (M = 17 s) and was
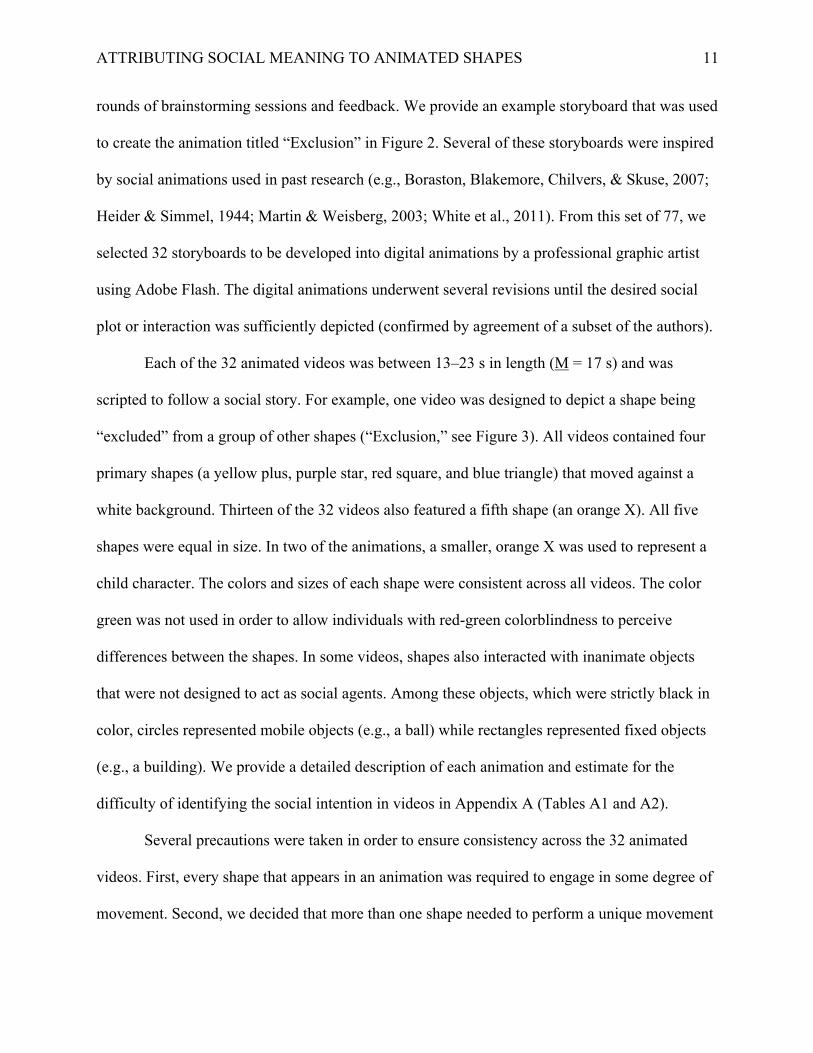
scripted to follow a social story. For example, one video was designed to depict a shape being
“excluded” from a group of other shapes (“Exclusion,” see Figure 3). All videos contained four
primary shapes (a yellow plus, purple star, red square, and blue triangle) that moved against a
white background. Thirteen of the 32 videos also featured a fifth shape (an orange X). All five
shapes were equal in size. In two of the animations, a smaller, orange X was used to represent a
child character. The colors and sizes of each shape were consistent across all videos. The color
green was not used in order to allow individuals with red-green colorblindness to perceive
differences between the shapes. In some videos, shapes also interacted with inanimate objects
that were not designed to act as social agents. Among these objects, which were strictly black in
color, circles represented mobile objects (e.g., a ball) while rectangles represented fixed objects
(e.g., a building). We provide a detailed description of each animation and estimate for the
difficulty of identifying the social intention in videos in Appendix A (Tables A1 and A2).
Several precautions were taken in order to ensure consistency across the 32 animated
videos. First, every shape that appears in an animation was required to engage in some degree of
movement. Second, we decided that more than one shape needed to perform a unique movement

ATTRIBUTING SOCIAL MEANING TO ANIMATED SHAPES 12
during each video. Both of these guidelines were determined in order to prevent drawing too
much attention to any individual shape.
Procedure
The 32 total videos were randomly divided into two randomly ordered sets of 16 (set A
and set B). Participants were assigned to watch the videos in one of four conditions: (1) set A in
order, (2) set A in reverse order, (3) set B in order, or (4) set B in reverse order. We did not show
each participant every video because we thought it would be difficult for participants to write
narratives consistent in quality over the length of time required to watch and describe 32 videos.
We counterbalanced the video orders in case there were any systematic effects of viewing earlier
videos on the descriptions of later videos. Thirty-two people viewed set A (16 in each order) and
34 people viewed set B (17 in each order). Participants completed the study alone in laboratory
testing rooms on computers where the videos were presented in an online survey.
The instructions at the beginning of the survey asked participants to pay close attention to
each video and watch each video twice. Each video was set to play automatically when the page
loaded. Participants watched each video twice by advancing to the next survey page, where the
same video appeared again. This was done to place less of a burden on memory, and Heider and
Simmel (1944) likewise showed their animation twice to participants. After the video was
shown, the following instructions were given: “Write a paragraph about what happened in this
video. Please include as much information as you can.” Participants typed a narrative of the
video into a text box which appeared on a separate page from the video. This was repeated until
participants completed the 16 videos they were assigned. Then participants answered
demographic questions and were dismissed. Average time to complete the study was 40 minutes
(SD = 13 minutes) and ranged from 16 minutes to 85 minutes.

ATTRIBUTING SOCIAL MEANING TO ANIMATED SHAPES 13
Scoring Guidelines
Scoring guidelines were developed to code the text provided in the narratives. A subset of
guidelines was adapted from the “SAT Coding System” by Klin (2000), which was created to
analyze social attributions contained in narratives describing Heider and Simmel’s (1944) social
animation. Not all of Klin’s scoring criteria were used because some were specific to the Heider
and Simmel video, which was much longer and followed a more specific and detailed social plot
than those in the videos we created. Additionally, several of Klin’s guidelines were developed to
test a clinical population of individuals with ASD, and therefore did not pertain to our study.
Thus, three social attribution indices in total were developed based on Klin’s scoring criteria. A
detailed description of each scoring index, along with a list of key words and phrases, is provided
in Appendix A. Although each index score was calculated separately and designed to focus on a
somewhat separate aspect of social attribution, the indices are likely interrelated as they were all
intended to measure facets of social understanding of the videos.
The Cognitive Term Index measured the degree to which participants described the
videos using cognitive mental state terms. This included terms denoting shapes’ knowledge,
intentions, and beliefs, among other things (e.g., know, think, avoid). The score was determined
by calculating the percentage of propositions in participants’ narratives that contained at least
one cognitive mental state term. For our purposes, a proposition was defined as a section of a
sentence which makes a "claim," typically when a verb appears. Each sentence in the narratives
consisted of one or more propositions.
The Affective Term Index measured the degree to which participants described the
videos using affective mental state terms. Affective terms included emotions and feelings (e.g.,
happy), behaviors which implicitly suggest a shared emotional state between two characters

ATTRIBUTING SOCIAL MEANING TO ANIMATED SHAPES 14
(e.g., celebrating), and emotional states which arise from social situations (e.g., jealous). The
score was determined by calculating the percentage of propositions in participants’ narratives
that contained at least one affective mental state term.
The Imagination Term Index measured the overall degree to which participants perceived
the shapes appearing in the videos as “human” figures. This index was partially based on Klin’s
“Animation Index” but amended as that index used a scale to assign level of social attribution
rather than counting individual terms. Scores on the Imagination Term Index corresponded to
how frequently participants described the shapes in ways that are social or human. Imagination
terms included behaviors which do not involve an explicit mental state but which are uniquely
human (e.g., talking), situations or environments which are uniquely human (e.g., home), sensory
experiences which are not uniquely human but which cannot be experienced by inanimate
objects (e.g., seeing), and allusions to a human as described by his or her relationship to another
(e.g., friend). The score was equal to the total percentage of propositions in participants’
narratives that contained these terms.
Data Analysis
In total, participants produced one narrative for each of the 16 videos that they
viewed. Each narrative was read and scored on the basis of the total number of cognitive,
affective, and imagination terms as well as the number of propositions that were included.
Additionally, participants’ data from those who viewed the first set of 16 videos in both orders
were combined. The same was repeated for the second set of 16 videos. Data were also
combined from all participants when calculating the index scores for each video, such that for
each video, the sum of relevant terms for that index was divided by the sum of propositions
given by all participants.
ATTRIBUTING SOCIAL MEANING TO ANIMATED SHAPES 15
Results
The written narratives were scored by a single rater (the first author). All narratives were scored
during an initial round of coding and then re-scored a second time (approximately ten weeks
later) to ensure accuracy of the data. The scoring system was relatively mechanical and mostly
consisted of counting words from different categories. The correlation between the first and
second ratings (across the 32 videos) were r = .97 for the Cognitive index, r = .97 for the
Affective index, and r = .98 for the Imagination index. Data from the second scoring is reported
here. We first determined the scores of the three social attribution indices (Cognitive Term
Index, Affective Term Index, and Imagination Term Index), the number of propositions, and the
word count of the narratives. All participants used at least one cognitive, affective, or
imagination term in their narratives in total across the 16 videos they viewed, thereby suggesting
that no one viewed the shapes in solely mechanical ways across all videos. Instead, most people
seemed to spontaneously attribute social meaning to the clips, replicating the findings of Heider
and Simmel (1944) in this new set of animated shape videos. These preliminary results also
suggest that participants varied in how “social” their narratives were, i.e., how many cognitive,
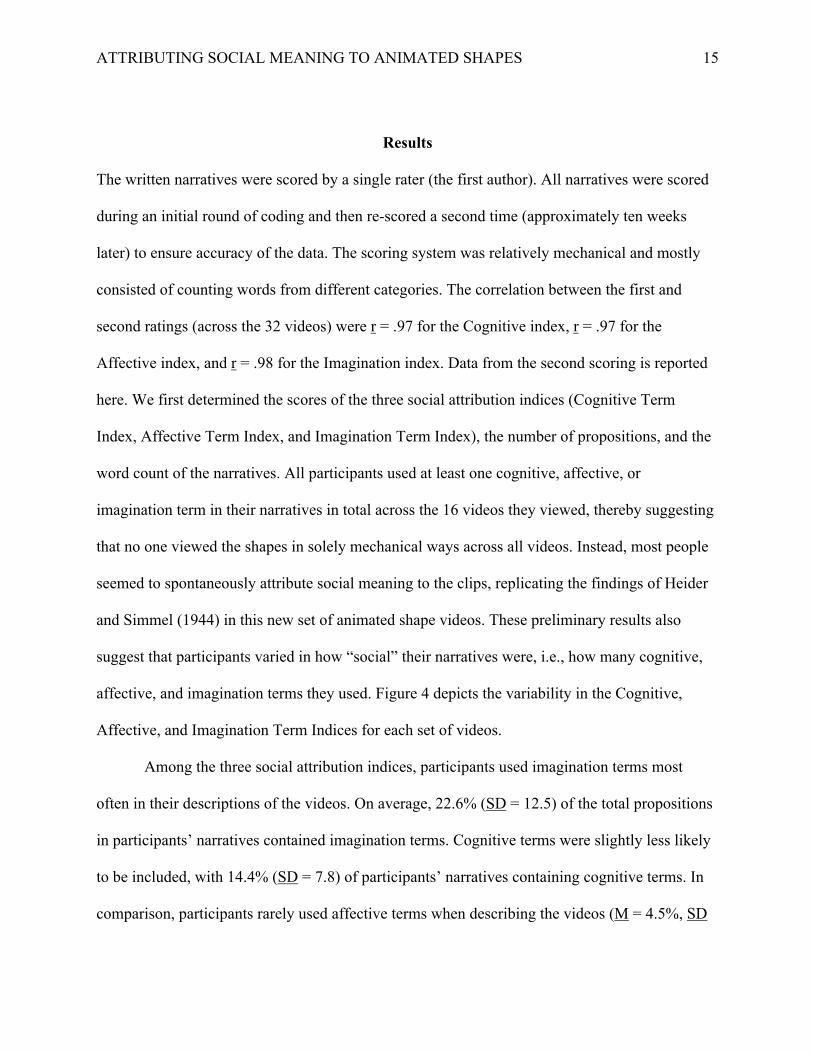
affective, and imagination terms they used. Figure 4 depicts the variability in the Cognitive,
Affective, and Imagination Term Indices for each set of videos.
Among the three social attribution indices, participants used imagination terms most
often in their descriptions of the videos. On average, 22.6% (SD = 12.5) of the total propositions
in participants’ narratives contained imagination terms. Cognitive terms were slightly less likely
to be included, with 14.4% (SD = 7.8) of participants’ narratives containing cognitive terms. In
comparison, participants rarely used affective terms when describing the videos (M = 4.5%, SD

ATTRIBUTING SOCIAL MEANING TO ANIMATED SHAPES 16
= 4.1). These results are summarized in Table 1. Given the relatively low number of affective
terms utilized, it is likely that several of our videos did not contain expressions of emotional
states that were easily identified by viewers.
We also used the social attribution indices to identify which videos were most likely to be
described using social terms (i.e., cognitive, affective, and imagination terms). These results are
summarized in Table 2. We found that certain videos were more likely to be described with
cognitive terms; for example, “Bullying 1” (for which 36.8% of propositions included cognitive
terms) and “Helping” (30.2%). Other videos provoked fewer cognitive terms in the narratives;
for example, “Baby” (4.4%) and “Friendship” (3.8%). Likewise, videos such as “SS1” (14.9%)
and “Bullying 1” (13.8%) were described with more affective terms while other videos were
described with fewer affective terms. In particular, the video “Hurdles” did not elicit any
affective terms from any of the participants (0%). Videos which contained the most imagination
terms were “Stealing” (51.5%) and “Peer Pressure” (46.9%), while “SS2” (5.8%) and “Line
Cutting” (3.1%) had the least number of imagination terms. We also calculated the number of
cognitive, affective, and imagination terms after adjusting for video length, but this had little
effect on the relative rankings.
Next, we compared the values on our Cognitive and Affective Term Indices to those of
the H&S video in Klin (2000). We found that our mean Cognitive Term Index score (14.4%) was
comparable to Klin’s Cognitive Index (13.6%) for the typically functioning sample in the study.
Most of our videos had Cognitive Index scores that were within a standard deviation of control
group scores in Klin (2000). Moreover, we observed that half of the videos (16/32) had greater
Cognitive Index scores compared to Klin’s results (“Strangers,” “Tricking,” “Stealing,” “Sad,”
ATTRIBUTING SOCIAL MEANING TO ANIMATED SHAPES 17
“Teacher,” “Sick,” “Duck Duck Goose,” “Dislike, “Mocking,” “Family,” “Couple,” “Scared,”
“Distraction,” “Exclusion,” “Helping,” and “Bullying 1”).
The Affective Term Index score, by comparison, was lower in the present study (4.5%)
than in Klin’s (11.5%). Only three of our videos had Affective Term Index scores which
exceeded Klin’s (“Peer Pressure,” “Bullying 1,” and “SS1”), with an average Affective Term
Index of 14% for these three. Interestingly, the only video which exceeded Klin’s score on both
the Cognitive and Affective Term Indices was “Bullying 1,” which is quite similar in content to
the Heider and Simmel video. Other videos with high Cognitive Term Index scores and
relatively high Affective Term Index scores include: “Exclusion,” “Couple,” “Mocking,”
“Teacher,” and “Sad.” These results are summarized in Table 2.
Discussion
We tested whether we could reproduce the observations made by Heider and Simmel
(1944), Klin (2000), and others by developing a new set of 32 colored animated shape videos.
Each video was designed to portray a different social plot. Using this new class of stimuli, we
found that participants often spontaneously attributed social meaning to the videos by using
terms that described the mental states of the shapes or described the shapes as “human”
characters. People varied in how many social terms they used, which suggests that it may be
possible to use our videos to measure differences in tendencies or abilities for social attribution
among people. Additionally, our videos varied in how many social terms they were described
with and the type of social term they were most likely to be described with. Finally, when
comparing our findings to those of Klin (2000), we see that our participants’ scores on the
ATTRIBUTING SOCIAL MEANING TO ANIMATED SHAPES 18
Cognitive Term Index are comparable to the scores of the normally functioning population in
that study but that most of our videos evoked fewer affective terms.
Our research suggests that participants spontaneously attributed social meaning to the
animations used in our study, with an average of 14.4% of propositions provided by participants
in their descriptions of the videos containing cognitive mental state terms, 4.5% containing
affective mental state terms, and 22.6% containing imagination terms. However, participants
varied widely, with some providing relatively few or no social terms in their narratives, while
others used a relatively high number of social terms. Below is a participant’s response that had
relatively high scores on the social attribution indices. The narrative is describing the video
“Helping,” in which two shapes help a third shape who has been left behind with the task of
getting inside a container.
“Here we have a black "u" in the center of the screen and our original four shapes. The
shapes all are on the bottom right hand side of the screen until they decide to move into
the u. Three of the shapes go into the u but the blue triangle doesn't follow and then acts
upset. Two of the shapes leave the u and the purple shape tries to help the blue triangle.
At first he doesn't seem to want the help. However, eventually he takes the help and all of
the shapes are in the u. When they are all in there they get excited and cheer.”
This participant provided a clear social story using the following cognitive terms in their
response: decide, follow, tries, help, and want. The following affective terms were used: upset,
excited, and cheer. The narrative also contained one imagination term: takes. This participant had
high Cognitive and Affective Indices (45.5% and 27.3%, respectively) with a slightly lower
score on the Imagination Index (9.1%). The participant spontaneously attributed mental states to
the shapes and used those perceived mental states to explain behaviors. In contrast, other

ATTRIBUTING SOCIAL MEANING TO ANIMATED SHAPES 19
participants were less likely to attribute social meaning to the shapes in the videos. Below is a
participant’s response which included fewer social terms, also in response to the video titled
“Helping.”
“There were four shapes and one “container.” Three shapes went inside the container and
one was outside. Then the triangle poked the star a couple of times, and all the shapes
went inside the container.”
This participant only used one social term in their response: the word “poked,” which is
counted as an imagination term. This participant did not attribute any thoughts, feelings, or
intentions to the shapes, and thus scored 0% on both the Cognitive and Affective Indices and a
score of 20% on the Imagination Index. Contrasting behaviors like these suggest that people may
vary in how well they can understand and attribute social meaning to these videos.
In addition, participants also varied in the way that they actually interpreted the videos
and how well their descriptions matched what we intended to depict in creating them. In some
videos we intended to depict certain social situations with the shapes’ movements, but
participants instead interpreted these movements in a completely different way. For example, in
our video titled “Scaring,” we intended to show that a group of shapes is startled by another
shape who was hiding behind a wall. Yet not a single participant correctly identified that the
group of shapes would be startled or scared by the other shape. Nonetheless, participants still
described the video using social terms, just without identifying the theme we believed we were
illustrating. Perhaps this video may be harder for people to understand without having any clues
or prior knowledge of what is happening.
We observed variability in responses between participants and between the different
videos. Some videos were more likely on average to be described with social terms than others.

ATTRIBUTING SOCIAL MEANING TO ANIMATED SHAPES 20
It is possible that our top 16 videos, based on Cognitive Term Index scores, contain social plots
that are more easily recognizable by participants. Along these lines, most of the videos with the
highest Cognitive Index scores were ones that were directly inspired by existing animated shape
tasks. For example, both of the Bullying videos (“Bullying 1” and “Bullying 2”) were inspired
by the original H&S animation and evoked a relatively high number of cognitive and
imagination terms. Moreover, many of these videos were also designed to represent some form
of conflict between the characters (e.g., one shape bullying, mocking, scaring, or excluding
others). Our results may suggest that simple forms of conflict can be easily recognized as
representing social interactions for most individuals. If most people can identify these social
themes, the degree and complexity of the social and mental state attributions people make when
viewing the videos can be measured, making them good stimuli for assessing social intelligence.
Further, among our three social attribution indices, participants had the lowest values on
the Affective Index. Fewer than 5% of propositions contained affective terms on average. Given
that the use of affective and emotional terms to describe the videos was relatively rare, it is
possible that our videos did not have expressions of affective states that were easily identifiable
by the viewer. A more three-dimensional depiction of shapes (or solids) could permit more
motion patterns that might indicate more emotional states. Alternatively, perhaps participants
were less likely to spontaneously comment upon the emotional states of the shapes in the videos
without instructions directing them to do so.
Even though our videos were substantially shorter than the original Heider and Simmel
video, participants made a similar number of social attributions compared to what has been
reported in past research. When comparing the scores on the social attribution indices to those
reported by Klin (2000), we found that our average scores on the Cognitive Term Index were
ATTRIBUTING SOCIAL MEANING TO ANIMATED SHAPES 21
comparable to the typically functioning group in Klin’s study. Klin found that on average this
group used cognitive terms in 13.6% of their propositions. In the present study, we found that
participants included cognitive terms in 14.4% of their propositions. Half of our videos (16/32)
had Cognitive Term Index scores equal to or greater than what Klin observed, with an average
score of 20.5% when just analyzing these videos. On the other hand, we found that the Affective
Term Index scores were lower for our videos (4.5%) compared to Klin (11.5%). Moreover, only
three of our videos scored equal to or higher than 11.5%. Thus, while the Affective Term Index
score across all videos in the present study was lower than that reported by Klin, a few of our
individual videos had similar or even higher Affective Term Index scores.
In particular, we observed the most frequent use of ToM terms (either cognitive or
affective) among videos that were influenced by previously developed shape tasks (e.g. Heider &
Simmel, 1944 or Martin & Weisberg, 2003). Many of these videos involve some form of conflict
between the shapes (e.g., one shape bullying, mocking, scaring, or excluding others). This
pattern suggests that it may be easier to evoke social attributions from stimuli that are designed
to represent conflict. On the other hand, more complex social interactions (e.g., waiting in line or
displaying friendship) may require a higher degree of ToM or social intelligence and result in a
broader range of attributions.
Limitations and Directions for Future Research
Our study had several limitations that open up potential for future research. One limitation is that
in the Klin (2000) study, propositions in participants’ narratives which were not pertinent to the
video were eliminated (e.g., vague references). This may have led to higher scores on the indices.
Additionally, Klin did not specify which words were counted as affective or cognitive terms.
Although the guidelines in Klin’s study were very similar to those in the present study, it is

ATTRIBUTING SOCIAL MEANING TO ANIMATED SHAPES 22
possible that certain terms were coded in different ways. We have made all of the coding data
from this study available on the Open Science Framework for future analysis and comparison
with other work.
Another limitation is that our instructions asked participants to describe what was
happening in the video without giving any clues that there were social connotations. While this
method allowed us to determine the spontaneous social attributions of our videos, it is possible
that some people did not report social attributions that they did make. Perhaps viewers may have
been less likely to contemplate and comment upon the mental states of the shapes and more
inclined to describe the actions of the shapes. Future research should examine the differences in
responses among instructions which prompt the viewer to view the shapes as social agents and
those which give no explicit social attribution instructions, as in this study.
Although the focus of our study was not on the perceptual organization of the shapes,
future work should examine how features of the shapes’ movements are related to the
interpretations that individuals provide. This would provide a greater understanding of what
specific characteristics in the animations, such as speed and perceptual organization, lead
individuals to make social judgments. Some past research has sought to identify how these
characteristics influence attributions (e.g., Gao, Baker, Tang, Xu, & Tenenbaum, 2019;
Rasmussen & Jiang, 2019), but further research using our animations could build on this work.
Finally, without the inclusion of other individual difference measures, it is difficult to
determine whether differences among participant responses were due to underlying differences
in social intelligence or differences in video content. Future research should examine whether
participant’s descriptions of these videos correlate with other standardized measures of social

ATTRIBUTING SOCIAL MEANING TO ANIMATED SHAPES 23
intelligence or ToM. This would help provide further evidence for the construct validity of our
animated shape videos as stimuli for social attribution.
Conclusion
In this study, we sought to create a new set of animated shape videos that could elicit
social attributions similar to existing tasks (e.g., the original H&S animation) while being shorter
in length (ranging between 13-23 s) and containing a broader range of social plots. As they did
75 years ago, college student participants spontaneously attributed social meaning to our videos,
as indicated by the use of cognitive and affective terms in their narratives. Our results therefore
confirm the findings of Heider and Simmel (1944) and Klin (2000) and demonstrate that those
findings were not idiosyncratic to the single particular video used in those studies. Rather, we
observed that many of our videos can be used to evoke a similar degree of social attributions
while also being much shorter in length. In particular, several videos that depicted conflict
between the shapes, like the original H&S video, often elicited the most attributions. However,
other forms of social interaction appear to be more difficult to perceive.
We hope these findings inspire future research to better understand how the physical or
relational properties of these animations influence the formation of social attributions. Moreover,
we developed these videos for use with typically functioning adults in order to enable future
researchers to more easily use this methodology for evoking social attributions in studies outside
of clinical psychology or neuroscience. Our animated shape videos are freely available for use
and can be administered as part of a multiple-choice assessment (Brown et al., 2019). Thus, our
animated shape videos may serve as a useful tool for simulating social interactions and invoking
social attribution in order to study the collection of cognitive capacities known as social
intelligence, mentalizing, and ToM.

ATTRIBUTING SOCIAL MEANING TO ANIMATED SHAPES 24
ATTRIBUTING SOCIAL MEANING TO ANIMATED SHAPES 25
References
Abell, F., Happé, F., & Frith, U. (2000). Do triangles play tricks? Attribution of mental states to
animated shapes in normal and abnormal development. Cognitive Development, 15, 1-16.
Altschuler, M., Sideridis, G., Kala, S., Warshawsky, M., Gilbert, R., Carroll, D., Burger-Caplan,
R., & Faja, S. (2018). Measuring individual differences in cognitive, affective, and
spontaneous theory of mind among school-aged children with autism spectrum disorder.
Journal of Autism and Developmental Disorders, 48, 3945-3957.
Baron-Cohen, S., Wheelwright, S., Hill, J., Raste, Y., & Plumb, I. (2001). The ‘‘reading the mind
in the eyes’’ test revised version: A study with normal adults, and adults with Asperger
syndrome or high-functioning autism. Journal of Child Psychology and Psychiatry, 42,
241–251.
Bell, M. D., Fiszdon, J. M., Greig, T. C, & Wexler, B. E. (2010). Social Attribution Test –
Multiple Choice (SAT-MC) in schizophrenia: Comparison with community sample and
relationship to neurocognitive, social cognitive and symptom measures. Schizophrenia
Research, 122, 164-171.
Boraston, Z., Blakemore, S. J., Chilvers, R., & Skuse, D. (2007). Impaired sadness recognition is
linked to social interaction deficit in autism. Neuropsychologicia, 45, 1501-1510.
Brown, M. I., Ratajska, A., Hughes, S., Fishman, J. B., Huerta, E., & Chabris, C. F. (2019). The
social shapes test: A new measure of social intelligence, mentalizing, and theory of mind.
Personality and Individual Differences, 143, 107-117.
Burger-Caplan, R., Saulnier, C., Jones, W., & Klin, A. (2016). Predicting social and
communicative ability in school-age children with autism spectrum disorder: A pilot
study of the social attribution task, multiple choice. Autism, 20, 952-962.

ATTRIBUTING SOCIAL MEANING TO ANIMATED SHAPES 26
Corden, B., Critchley, H.D., Skuse, D., & Dolan, R.J. (2006). Fear recognition ability predicts
differences in social cognitive and neural functioning in men. Journal of Cognitive
Neuroscience, 18, 889-897.
Chung, Y. S., Barch, D., & Strube, M. (2014). A meta-analysis of mentalizing impairments in
adults with schizophrenia and autism spectrum disorder. Schizophrenia Bulletin, 40, 602-
616.
Dodell-Feder, D., Ressler, K. J., & Germine, L. T. (2020). Social cognition or social class and
culture? On the interpretation of differences in social cognitive performance.
Psychological Medicine, 50, 133-145.
Frith, U., & Frith, C. D. (2003). Development and neurophysiology of mentalizing.
Philosophical Transactions of the Royal Society of London. Series B: Biological
Sciences, 358, 459-473.
Gao, T., Baker, C. L., Tang, N., Xu, H., & Tenenbaum, J. B. (2019). The cognitive architecture
of perceived animacy: Intention, attention, and memory. Cognitive Science, 43, e12775.
Gordon, A. S., & Roemmele, M. (2014). An authoring tool for movies in the style of Heider and
Simmel. In International Conference on Interactive Digital Storytelling (pp. 49-60).
Springer.
Greig, T. C., Bryson, G. J., & Bell, M. D. (2004). Theory of mind performance in schizophrenia:
Diagnostic symptom, and neuropsychological correlates. Journal of Nervous and Mental
Disease, 192, 12-18.
Happé, F. G. E. (1994). An advanced test of theory of mind: Understanding of story characters’
thoughts and feelings by able autistic, mentally handicapped, and normal children and
adults. Journal of Autism and Developmental Disorders, 24, 129–154.
ATTRIBUTING SOCIAL MEANING TO ANIMATED SHAPES 27
Heider, F., & Simmel, M. (1944). An experimental study of apparent behavior. The American
Journal of Psychology, 57, 243-259.
Isik, L., Koldewyn, K., Beeler, D., & Kanwisher, N. (2017). Perceiving social interactions in the
posterior superior temporal sulcus. Proceedings of the National Academy of Sciences,
114, E9145-E9152.
Kirkovski, M., Enticott, P. G., Hughes, M. E., Rossell, S. L., & Fitzgerald, P. B. (2016). Atypical
neural activity in males but not females with autism spectrum disorder. Journal of autism
and developmental disorders, 46, 954-963.
Klin, A. (2000). Attributing social meaning to ambiguous visual stimuli in higher- functioning
Autism and Asperger Syndrome: The social attribution task. Journal of Child Psychology
and Psychiatry, 41, 831-846.
Klin, A., & Jones, W. (2006). Attributing social and physical meaning to ambiguous visual
displays in individuals with higher-functioning autism spectrum disorders. Brain and
Cognition, 61, 40-53.
Lee, H. S., Corbera, S., Poltorak, A., Park, K., Assaf, M., Bell, M. D., Wexler, B. E., Cho, Y. I.,
Brocke, S., & Choi, K. H. (2018). Measuring theory of mind in schizophrenia research:
Cross-cultural validation. Schizophrenia Research, 201, 187-195.
Ludwig, N. N., Hecht, E. E., King, T. Z., Revill, K. P., Moore, M., Fink, S. E., & Robins, D. L.
(2020). A novel social attribution paradigm: The dynamic interacting shape clips (DISC).
Brain and Cognition, 138.
Martin, A., & Weisberg, J. (2003). Neural foundations for understanding social and mechanical
concepts. Cognitive Neuropsychology, 20, 575-587.
Marlowe, H. A. (1986). Social intelligence: Evidence for multidimensionality and construct
ATTRIBUTING SOCIAL MEANING TO ANIMATED SHAPES 28
independence. Journal of Educational Psychology, 78, 52-58.
Moriguchi, Y., Ohnishi, T., Lane, R. D., Maeda, M., Mori, T., Nemoto, K.,…Komaki, G. (2006).
Impaired self-awareness and theory of mind: An fMRI study of mentalizing in
alexithymia. NeuroImage, 32, 1472-1482.
Moriguchi, Y., Ohnishi, T., Mori, T., Matsuda, H., & Komaki, G. (2007). Changes of brain
activity in the neural substrates for theory of mind during childhood and adolescence.
Psychiatry and Clinical Neurosciences, 61, 355-363.
Olderbak, S., Semmler, M., & Doebler, P. (2019). Four-branch model of ability emotional
intelligence with fluid and crystalized intelligence: A meta-analysis of relations. Emotion
Review, 11, 166-183.
Paal, T., & Bereczkei, T. (2007). Adult theory of mind, cooperation, Machiavellianism: The
effect of mindreading on social relations. Personality and Individual Differences, 43,
541–551.
Premack, D., & Woodruff, G. (1978). Does the chimpanzee have a theory of mind? The
Behavioral Brain Sciences, 4, 515–526.
Rasmussen, C. E., & Jiang, Y. V. (2019). Judging social interaction in the Heider and Simmel
movie. Quarterly Journal of Experimental Psychology, 72, 2350-2361.
Russell, T. A., Reynaud, E., Herba, C., Morris, R., & Corcoran, R. (2006). Do you see what I
see? Interpretations of intentional movement in schizophrenia. Schizophrenia Research,
81, 101-111.
Roux, P., Passerieux, C., & Ramus, F. (2013). Kinematics matters: A new eye-tracking
investigation of animated triangles. Quarterly Journal of Experimental Psychology, 66,
229-244.
ATTRIBUTING SOCIAL MEANING TO ANIMATED SHAPES 29
Sprong, M., Schothorst, P., Vos, E., Hox, J., & Van Engeland, H. (2007). Theory of mind in
schizophrenia: Meta-analysis. The British Journal of Psychiatry, 191, 5-13.
Stiller, J., & Dunbar, R. I. (2007). Perspective-taking and memory capacity predict social
network size. Social Networks, 29, 93-104.
Stone, V. E., Baron-Cohen, S., & Knight, R. T. (1998). Frontal lobe contributions to theory of
mind. Journal of Cognitive Neuroscience, 10, 640-656.
Tavares, P., Lawrence, A. D., & Barnard, P. J. (2008). Paying attention to social meaning: An
fMRI study. Cerebral Cortex, 18, 1876-1885.
Visch, V. T., & Tan, E. S. (2009). Categorizing moving objects into film genres: The effect of
animacy attribution, emotional response, and the deviation from non-fiction. Cognition,
110, 265-272.
Weisberg, J., Milleville, S. C., Kenworthy, L., Wallace, G. L., Gotts, S. J., Beauchamp, M. S., &
Martin, A. (2014). Social perception in autism spectrum disorders: Impaired category
selectivity for dynamic but not static images in ventral temporal cortex. Cerebral Cortex,
24, 37-48.
White, S. J., Coniston, D., Rogers, R., & Frith, U. (2011). Developing the Frith-Happé
animations: A quick and objective test of theory of mind for adults with autism. Autism
Research, 4, 149-154.
Wick, F. A., Alaoui Soce, A., Garg, S., Grace, R. C., & Wolfe, J. M. (2018). Perception in
dynamic scenes: What is your Heider capacity? Journal of Experimental Psychology:
General, 148, 252-271.
Zaccaro, S. J., Green, J. P., Dubrow, S., & Kolze, M. (2018). Leader individual differences,
situational parameters, and leadership outcomes: A comprehensive review and

ATTRIBUTING SOCIAL MEANING TO ANIMATED SHAPES 30
integration. The Leadership Quarterly, 29, 2-43.

ATTRIBUTING SOCIAL MEANING TO ANIMATED SHAPES 31
Table 1. Average Number of Propositions, Word Count, and Results of Index Scores Obtained in Narratives Videos participants viewed
Word counta M(SD)
Number of propositionsb
M(SD)
Cognitive Term Indexc
M(SD)
Affective Term Indexd
M(SD)
Imagination Term Indexe
M(SD)
Videos 1–16 970 (438) 106 (38) 18.4% (8.0) 5.6% (3.5) 23.1% (12.6)
Videos 17–32 1036 (447) 116 (44) 10.3% (5.3) 3.3% (4.5) 22.1% (12.8)
Total average 1004 (441) 111 (41) 14.4% (7.8) 4.5% (4.1) 22.6% (12.5)
a Total words produced across all narratives b Total number of propositions across all narratives c Percentage of propositions containing cognitive terms across all narratives d Percentage of propositions containing affective terms across all narratives e Percentage of propositions containing imagination terms across all narratives

ATTRIBUTING SOCIAL MEANING TO ANIMATED SHAPES 32
Table 2. Cognitive, Affective, and Imagination Term Indices Compared to Klin (2000)
Video Cognitive
Term Index Affective Term
Index Imagination Term Index
Klin (2000) Video 13.6% 11.5% — Baby 4.4% 2.2% 36.0% Bullying 1 36.8% 13.8% 16.1% Bullying 2 12.2% 2.6% 10.6% Comfort 11.4% 5.9% 10.2% Couple 20.3% 7.4% 30.4% Cyberball 12.5% 3.7% 45.8% Dislike 19.3% 3.0% 7.2% Distraction 22.2% 2.8% 11.7% Duck Duck Goose 17.9% 3.3% 34.9% Exclusion 25.8% 8.2% 18.1% Family 20.0% 1.4% 18.6% FB 8.8% 1.5% 16.9% Friendship 3.8% 0.8% 15.0% Helping 30.2% 5.8% 26.7% Hurdles 8.9% 0.0% 39.3% Juggling 4.6% 0.4% 33.6% Leader 6.7% 2.4% 24.6% Line Cutting 9.7% 1.7% 3.1% Matchmaking 5.3% 0.4% 35.1% Mocking 19.3% 8.5% 14.2% Peer Pressure 5.1% 13.4% 46.9% Sad 17.2% 9.2% 23.6% Scared 20.6% 5.3% 10.1% Scaring 10.2% 0.4% 15.0% Sick 17.4% 3.2% 14.2% Slow Dancing 5.9% 4.6% 24.2% SS1 12.5% 14.9% 22.6% SS2 8.2% 0.5% 5.8% Stealing 15.9% 4.4% 51.5% Strangers 13.9% 0.8% 21.7% Teacher 17.3% 8.6% 14.9% Tricking 14.6% 2.5% 25.1%

ATTRIBUTING SOCIAL MEANING TO ANIMATED SHAPES 33
Figure 1. Example screenshots from the original Heider and Simmel animation (A; Figure 1 from Heider & Simmel, 1944) and one of the animated shape videos created in the present study, “Bullying 2” (B).
A B

ATTRIBUTING SOCIAL MEANING TO ANIMATED SHAPES 34
Figure 2. Example storyboard for the animated shape video “Exclusion.” Individual storyboards were created for 77 potential animations, of which 32 were created and used in this study.

ATTRIBUTING SOCIAL MEANING TO ANIMATED SHAPES 35
Figure 3. Six frames from the sample animated shape video “Exclusion” (17 seconds). In this video, a group of three shapes (Blue triangle, Red square, and Purple star) excludes Yellow plus from the rest of the group and moves away every time it comes near.
1 2 3
4 5 6

ATTRIBUTING SOCIAL MEANING TO ANIMATED SHAPES 36
Figure 4. Social Attribution Index Score distribution for Sets A and B. This figure illustrates the distribution of Cognitive, Affective, and Imagination Index Scores for Videos in Sets A and B compared to the results from Klin (2000). The whiskers represent the full range of index scores and the boxes represent ±1 SD. A = Set A, B = Set B.

ATTRIBUTING SOCIAL MEANING TO ANIMATED SHAPES 37
Appendix A
Scoring Guidelines (Partially adapted from Klin, 2000)
Propositions The part of a sentence which makes a "claim," typically when a verb appears. For example, the following response is scored as two propositions: "In this video, the blue triangle seemed to be excluding the cross the entire time and towards the end, the red square decided to exclude the cross as well." Cognitive Term Index This index corresponds to the percentage of propositions containing cognitive mental state terms (denoting desire, knowledge, thoughts, motivation, intentions) from the total number of propositions included in the participant’s narratives. Cognitive mental states are defined as:
1. Terms expressing one character’s desire of knowledge 2. Behaviors which not only implicitly indicate a shared cognition, thought, or plan between
two characters but which cannot exist without it (e.g., trapping, rescuing, sneaking, hiding, spying)
3. Terms expressing one character’s belief, thought, imagination, intention, plan, motivation 4. Behaviors which explicitly indicate a shared cognition, thought, or plan between two
characters in which one character intentionally impacts on the other’s cognitive state (e.g., intimidation, deception, trickery, bullying, joking, rebuffing)
Scoring: Number of cognitive mental state terms/Total number of propositions Included words and phrases:
Acknowledge, agree, allow, annoy***, ask, assure, attempt, attention, avoid, beckon, block (verb), bother, break out of/into, break up a fight, bully (verb), calm (e.g., one shape calms down another), capture, care, catch up (as in, to talk to someone after a long time), chase, choose, coax, confused, copy, convince, control, corner (verb), crush (as in, a romantic interest), cut (e.g., cut a shape in line), decide, deject, direct (verb), distract, ditch (verb), drive (e.g., drive another shape away), encourage, engage, escape, exclude** (e.g., to exclude other shapes), find, fit in, follow, force (verb), forget, gang up on, generous, get along, get (as in, convince), give in, handle a situation, harass , help, hide, hit (another shape), ignore, imitate, include, influence, insist, interact, intercept, interested , interfere, intervene, introduce , invade, kick out, know, lead, leave out** (verb), let, like, make (as in, to force), mimic, mirror (verb), motivate, neglect, notice, ostracize, outsider, plan (verb), please (e.g., the purple shape lets other shapes into the house whenever she pleases), practice, prank, prejudice, prepare, prevent, prompt (verb), protest, prove , rebel, refuse, reluctant, rescue, resolve, revolt, romantically interested, sacrifice, share, shield (verb), show off, shove, skip another’s place in line or turn, sneak, so (e.g., the blue shape passes his ball to the purple shape so they can all play), standoff, stand their ground, stop (as in, to prevent another shape), struggle, stuck, support, take a side in an argument, take turns, taunt, teach, team up against a shape, tease, threaten, trap, try, unable, uninvolved, unsure, unwanted, urge, voluntarily, wait, want, well-acquainted, withdraw, working together
ATTRIBUTING SOCIAL MEANING TO ANIMATED SHAPES 38
Included phrases without definite cognitive terms
“they kept together and were talking whether or not to bring the X into the group” “the plus sign butts in front of the triangle to get into the black box” “the X has the star leave the group” “the other two make it so they can all play” “the yellow plus sign and the purple star come out to see why he didn't jump” “the other shapes seem to be in on the plan” “the star stands up for itself and pushes the plus back” “then the star said screw this and left” “two members of the group turns their back on one” “the purple star jumped on each shape to get to the front of the lineup” “they looked like they had a lot more fun together”
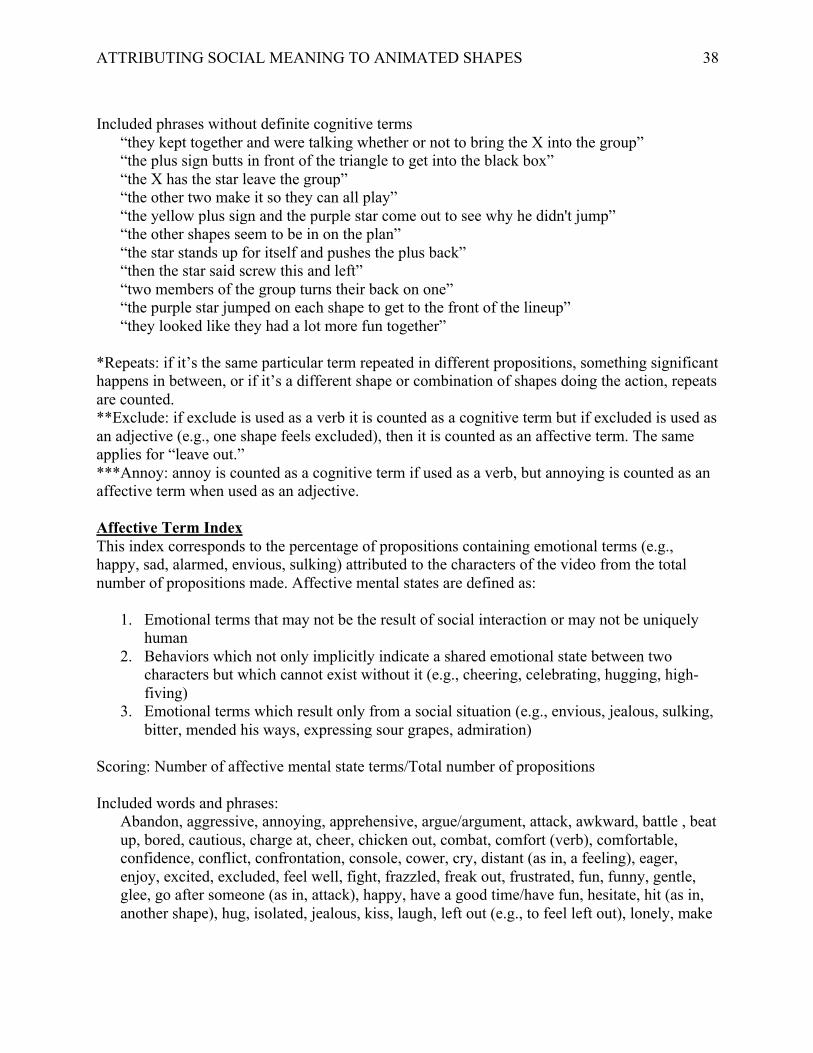
*Repeats: if it’s the same particular term repeated in different propositions, something significant happens in between, or if it’s a different shape or combination of shapes doing the action, repeats are counted. **Exclude: if exclude is used as a verb it is counted as a cognitive term but if excluded is used as an adjective (e.g., one shape feels excluded), then it is counted as an affective term. The same applies for “leave out.” ***Annoy: annoy is counted as a cognitive term if used as a verb, but annoying is counted as an affective term when used as an adjective. Affective Term Index This index corresponds to the percentage of propositions containing emotional terms (e.g., happy, sad, alarmed, envious, sulking) attributed to the characters of the video from the total number of propositions made. Affective mental states are defined as:
1. Emotional terms that may not be the result of social interaction or may not be uniquely human
2. Behaviors which not only implicitly indicate a shared emotional state between two characters but which cannot exist without it (e.g., cheering, celebrating, hugging, high-fiving)
3. Emotional terms which result only from a social situation (e.g., envious, jealous, sulking, bitter, mended his ways, expressing sour grapes, admiration)
Scoring: Number of affective mental state terms/Total number of propositions Included words and phrases:
Abandon, aggressive, annoying, apprehensive, argue/argument, attack, awkward, battle , beat up, bored, cautious, charge at, cheer, chicken out, combat, comfort (verb), comfortable, confidence, conflict, confrontation, console, cower, cry, distant (as in, a feeling), eager, enjoy, excited, excluded, feel well, fight, frazzled, freak out, frustrated, fun, funny, gentle, glee, go after someone (as in, attack), happy, have a good time/have fun, hesitate, hit (as in, another shape), hug, isolated, jealous, kiss, laugh, left out (e.g., to feel left out), lonely, make

ATTRIBUTING SOCIAL MEANING TO ANIMATED SHAPES 39
up (as in, to forgive), nervous, playful, provoke, ram into, retaliate, sad, scare, shocked, spar , stubborn, suffer, tantrum, tired, tentatively, tremble, upset, violent, vulnerable
Imagination Index This index corresponds to degree in which participants perceived the shapes appearing in the videos as “human” figures. It is calculated by determining the percentage of propositions containing imagination terms (e.g., child, yell, home) from the total number of propositions. This includes:
1. Verbs or behaviors which do not involve an explicit mental state (cognitive or affective) but which are uniquely human (e.g., talking)
2. Situations, environments, things, or roles which are uniquely human (e.g., home, bystander, clothes)
3. Sensory experiences which are not uniquely human, but which cannot be experienced by inanimate objects (e.g., see)
4. Allusions to a person as described by his or her relationship to another person (e.g., mom, friend)
Scoring: Total number of imagination words/Total number of propositions Included words and phrases:
Act, associate, baby, bathroom, blind date, bond, bounce a ball, bring, bystander, buddies, bully (noun), buy, carry, catch, check, chill (as in, hang out), child, civilized, claim, classroom, clique, clothes, communicate, concert, convene, conversation, couple (e.g., romantic couple), creepy, dad, dance, dance floor, date (as in, romantically), deal with, ding dong ditch, drag, drink, duck duck goose, embrace, encounter, exchange, fail, father, fidge, fix, flee, friend, game of catch, get, give, grab, greet, guard, hang out, hammer (verb), having a match, hide and seek, hold, hop, hopscotch, home, hurdle, invite, joke, juggling, jump (as an action humans would take, e.g., “jump over hurdles”), keep, kids, kick, knock (e.g., knock on the door), leader, leap, leapfrog, let go, lift, live, loner, lose, love triangle, match, matchmaker, mediator, meet, messing around, mingle, mind their business, mom, monitor, move (as a transitive verb), navigate, nightclub, nudge, obstacle course, oppressor, organize, pace (verb), parkour, participate, partner, party, pass a ball , patrol, people, photo booth, pick, pick up, picture day, place (verb), play, play ground, poke, powwow, pull, push, put, react, relax, remove, rest, restroom, retrieve, reunion, ringleader, roam, roommate, rub, run , rush, save the day, scurry, see, separate (as in, one shape separates two other shapes), sex, shake hands, shiver, silent, society, solve, spit out, stage, stare, steal, succeed, supervise, tag, tag along, take, talk, tango, tap, teacher, team, throw, toss, touch, town, tug, venture, victim, visitor, walk, wander, war, watch, water fountain, win, working out (as in, exercising), wrestler, yell

ATTRIBUTING SOCIAL MEANING TO ANIMATED SHAPES 40
Table A1. Descriptions for all 32 SST Animations
Title Description Length Friendship ☐ and + interact at center screen. △ and ☆ enter and
then ☐ leaves with ☆. + joins △, ☐ returns without ☆, and X appears for the first time.
0:17
Comfort One shape (☐) appears distressed and two other shapes (△ and X) attempt to provide comfort.
0:15
Exclusion Three shapes (☐, △, and ☆) act to avoid + 0:17
SS1 + initially attacks ☆, but X only observes ☆ retaliating against +
0:10
Juggling Three shapes (☐, △, and +) are each tossing their own ball. + leaves after ☆ joins, and △ shares give its' ball to ☆
0:17
Tricking △ knocks on +'s door and leaves when + answers. △ repeats this with the other two shapes (☐ and ☆)
0:17
Family Five shapes appear on screen (☐, △, ☆, +, and little x). Little x first approaches △ and the group of four move away. Next, little x approaches ☆. ☆ pushes little x away and the group leaves the scene with little x trailing behind.
0:19
Peer Pressure Four shapes (☐, △, ☆, and +) appear on a ledge. Three of the shapes take turns jumping off the ledge while △ decides not to jump and runs away.
0:18
Stealing ☐ and ☆ play catch with a ball. △ and + appear and join in. △ tries to run off with the ball and is chased by the others.
0:16
Leader Four shapes (☐, △, ☆, and +) enter on one side of the screen while X appears on the opposite side. The four huddle together and then ☆ leaves to approach X. ☆ goes back to get + and brings it to X.
0:16
Teacher Four shapes (☐, △, ☆, and +) enter and take a seat at individual desks. + picks a fight with ☐ before X enters. After X enters, ☐ strikes back at +.
0:15
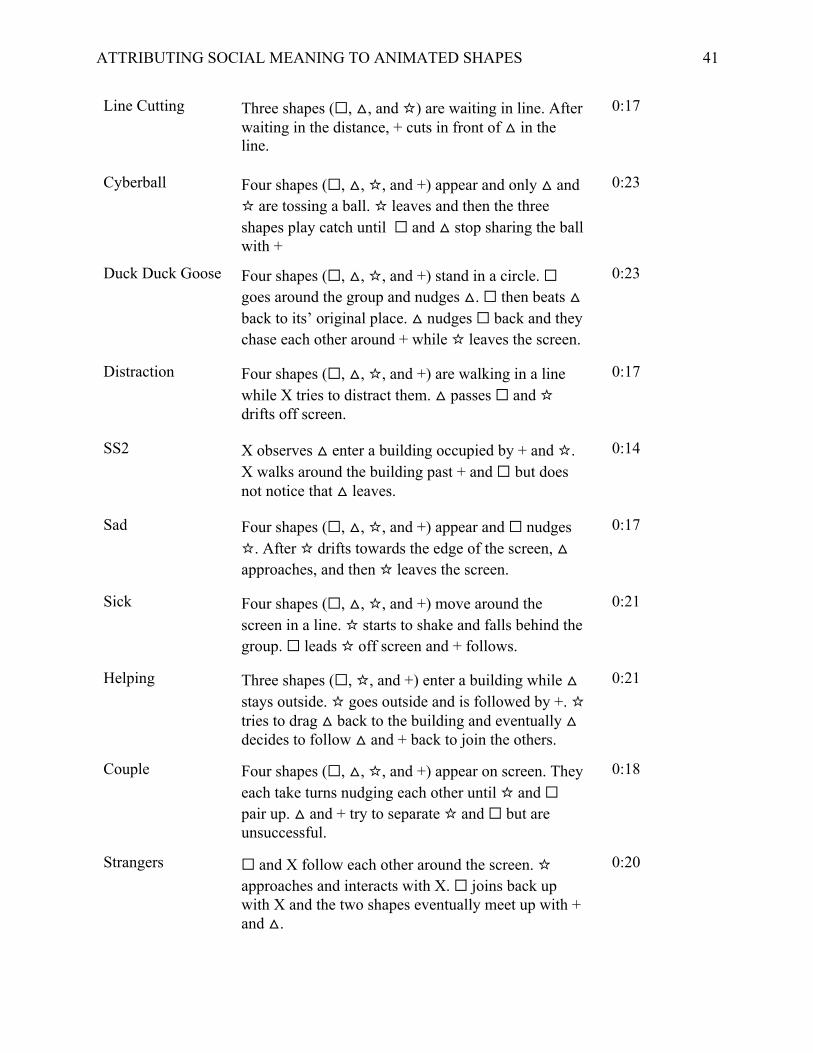
ATTRIBUTING SOCIAL MEANING TO ANIMATED SHAPES 41
Line Cutting Three shapes (☐, △, and ☆) are waiting in line. After waiting in the distance, + cuts in front of △ in the line.
0:17
Cyberball Four shapes (☐, △, ☆, and +) appear and only △ and ☆ are tossing a ball. ☆ leaves and then the three shapes play catch until ☐ and △ stop sharing the ball with +
0:23
Duck Duck Goose Four shapes (☐, △, ☆, and +) stand in a circle. ☐ goes around the group and nudges △. ☐ then beats △ back to its’ original place. △ nudges ☐ back and they chase each other around + while ☆ leaves the screen.
0:23
Distraction Four shapes (☐, △, ☆, and +) are walking in a line while X tries to distract them. △ passes ☐ and ☆ drifts off screen.
0:17
SS2 X observes △ enter a building occupied by + and ☆. X walks around the building past + and ☐ but does not notice that △ leaves.
0:14
Sad Four shapes (☐, △, ☆, and +) appear and ☐ nudges ☆. After ☆ drifts towards the edge of the screen, △ approaches, and then ☆ leaves the screen.
0:17
Sick Four shapes (☐, △, ☆, and +) move around the screen in a line. ☆ starts to shake and falls behind the group. ☐ leads ☆ off screen and + follows.
0:21
Helping Three shapes (☐, ☆, and +) enter a building while △ stays outside. ☆ goes outside and is followed by +. ☆ tries to drag △ back to the building and eventually △ decides to follow △ and + back to join the others.
0:21
Couple Four shapes (☐, △, ☆, and +) appear on screen. They each take turns nudging each other until ☆ and ☐ pair up. △ and + try to separate ☆ and ☐ but are unsuccessful.
0:18
Strangers ☐ and X follow each other around the screen. ☆ approaches and interacts with X. ☐ joins back up with X and the two shapes eventually meet up with + and △.
0:20
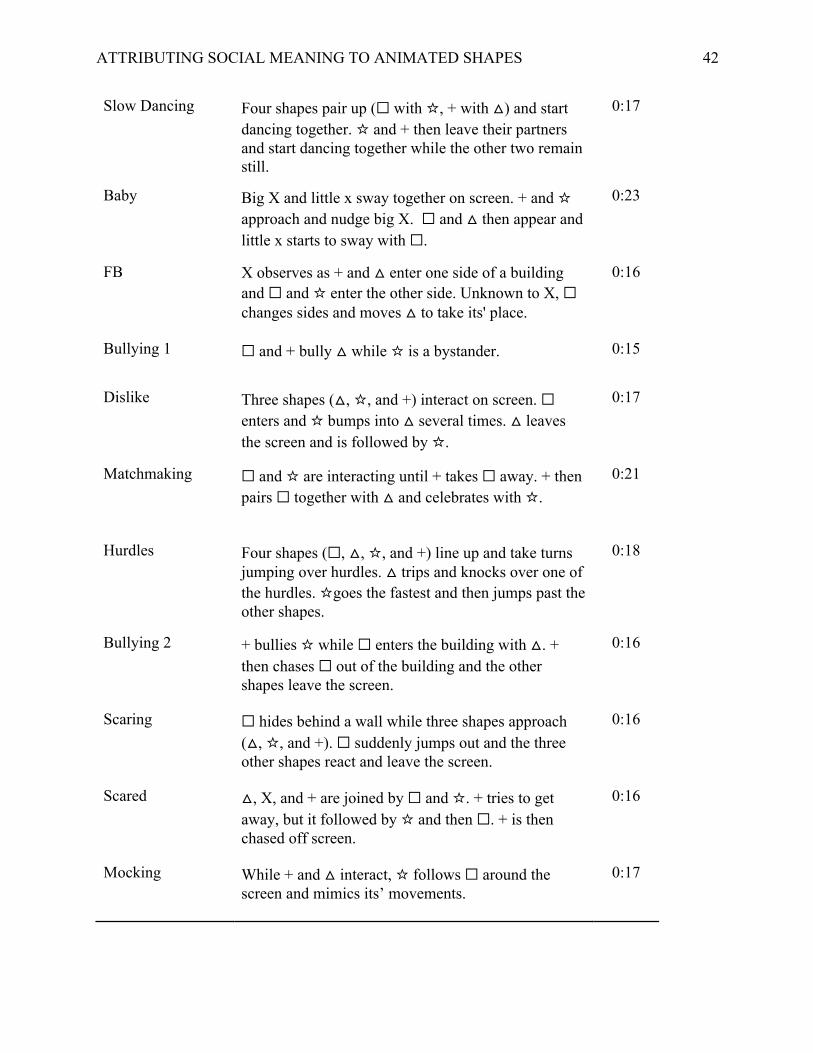
ATTRIBUTING SOCIAL MEANING TO ANIMATED SHAPES 42
Slow Dancing Four shapes pair up (☐ with ☆, + with △) and start dancing together. ☆ and + then leave their partners and start dancing together while the other two remain still.
0:17
Baby Big X and little x sway together on screen. + and ☆ approach and nudge big X. ☐ and △ then appear and little x starts to sway with ☐.
0:23
FB X observes as + and △ enter one side of a building and ☐ and ☆ enter the other side. Unknown to X, ☐ changes sides and moves △ to take its' place.
0:16
Bullying 1 ☐ and + bully △ while ☆ is a bystander. 0:15
Dislike Three shapes (△, ☆, and +) interact on screen. ☐ enters and ☆ bumps into △ several times. △ leaves the screen and is followed by ☆.
0:17
Matchmaking ☐ and ☆ are interacting until + takes ☐ away. + then pairs ☐ together with △ and celebrates with ☆.
0:21
Hurdles Four shapes (☐, △, ☆, and +) line up and take turns jumping over hurdles. △ trips and knocks over one of the hurdles. ☆goes the fastest and then jumps past the other shapes.
0:18
Bullying 2 + bullies ☆ while ☐ enters the building with △. + then chases ☐ out of the building and the other shapes leave the screen.
0:16
Scaring ☐ hides behind a wall while three shapes approach (△, ☆, and +). ☐ suddenly jumps out and the three other shapes react and leave the screen.
0:16
Scared △, X, and + are joined by ☐ and ☆. + tries to get away, but it followed by ☆ and then ☐. + is then chased off screen.
0:16
Mocking While + and △ interact, ☆ follows ☐ around the screen and mimics its’ movements.
0:17
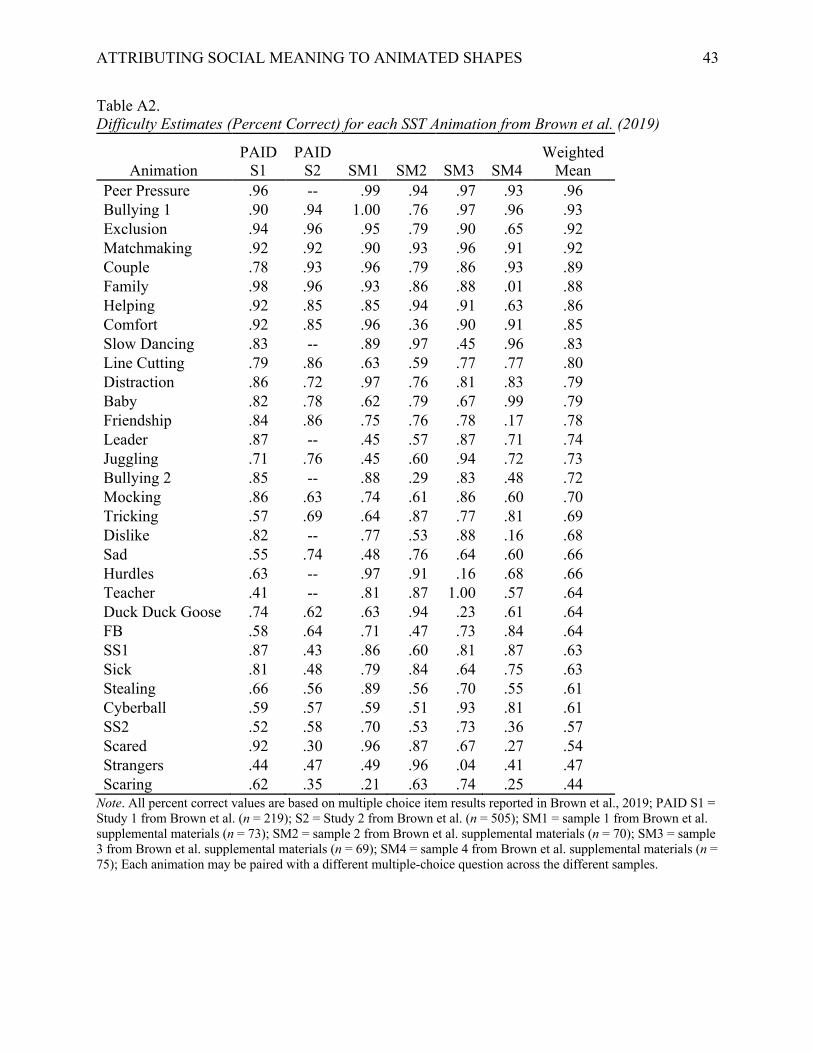
ATTRIBUTING SOCIAL MEANING TO ANIMATED SHAPES 43
Table A2. Difficulty Estimates (Percent Correct) for each SST Animation from Brown et al. (2019)
Animation PAID
S1 PAID
S2 SM1 SM2 SM3 SM4 Weighted
Mean Peer Pressure .96 -- .99 .94 .97 .93 .96 Bullying 1 .90 .94 1.00 .76 .97 .96 .93 Exclusion .94 .96 .95 .79 .90 .65 .92 Matchmaking .92 .92 .90 .93 .96 .91 .92 Couple .78 .93 .96 .79 .86 .93 .89 Family .98 .96 .93 .86 .88 .01 .88 Helping .92 .85 .85 .94 .91 .63 .86 Comfort .92 .85 .96 .36 .90 .91 .85 Slow Dancing .83 -- .89 .97 .45 .96 .83 Line Cutting .79 .86 .63 .59 .77 .77 .80 Distraction .86 .72 .97 .76 .81 .83 .79 Baby .82 .78 .62 .79 .67 .99 .79 Friendship .84 .86 .75 .76 .78 .17 .78 Leader .87 -- .45 .57 .87 .71 .74 Juggling .71 .76 .45 .60 .94 .72 .73 Bullying 2 .85 -- .88 .29 .83 .48 .72 Mocking .86 .63 .74 .61 .86 .60 .70 Tricking .57 .69 .64 .87 .77 .81 .69 Dislike .82 -- .77 .53 .88 .16 .68 Sad .55 .74 .48 .76 .64 .60 .66 Hurdles .63 -- .97 .91 .16 .68 .66 Teacher .41 -- .81 .87 1.00 .57 .64 Duck Duck Goose .74 .62 .63 .94 .23 .61 .64 FB .58 .64 .71 .47 .73 .84 .64 SS1 .87 .43 .86 .60 .81 .87 .63 Sick .81 .48 .79 .84 .64 .75 .63 Stealing .66 .56 .89 .56 .70 .55 .61 Cyberball .59 .57 .59 .51 .93 .81 .61 SS2 .52 .58 .70 .53 .73 .36 .57 Scared .92 .30 .96 .87 .67 .27 .54 Strangers .44 .47 .49 .96 .04 .41 .47 Scaring .62 .35 .21 .63 .74 .25 .44
Note. All percent correct values are based on multiple choice item results reported in Brown et al., 2019; PAID S1 = Study 1 from Brown et al. (n = 219); S2 = Study 2 from Brown et al. (n = 505); SM1 = sample 1 from Brown et al. supplemental materials (n = 73); SM2 = sample 2 from Brown et al. supplemental materials (n = 70); SM3 = sample 3 from Brown et al. supplemental materials (n = 69); SM4 = sample 4 from Brown et al. supplemental materials (n = 75); Each animation may be paired with a different multiple-choice question across the different samples.