ORIGINAL PAPER
Searching for novel sources of field resistance to Ug99and Ethiopian stem rust races in durum wheat via associationmapping
Tesfaye Letta • Marco Maccaferri •
Ayele Badebo • Karim Ammar • Andrea Ricci •
Jose Crossa • Roberto Tuberosa
Received: 24 May 2012 / Accepted: 19 January 2013 / Published online: 21 February 2013
� Springer-Verlag Berlin Heidelberg 2013
Abstract Puccinia graminis f. sp. tritici, the causative
agent of stem rust in wheat, is a devastating disease of
durum wheat. While more than 50 stem rust resistance (Sr)
loci have been identified in wheat, only a few of them have
remained effective against Ug99 (TTKSK race) and other
durum-specific Ethiopian races. An association mapping
(AM) approach based on 183 diverse durum wheat acces-
sions was utilized to identify resistance loci for stem rust
response in Ethiopia over four field-evaluation seasons and
artificial inoculation with Ug99 and a mixture of durum-
specific races. The panel was profiled with simple sequence
repeat, Diversity Arrays Technology and sequence-tagged
site markers (1,253 in total). The resistance turned out to be
oligogenic, with twelve QTL-tagging markers that were
significant (P \ 0.05) across three or four seasons. R2
values ranged from 1.1 to 11.3 %.Twenty-four additional
single-marker/QTL regions were found to be significant
over two seasons. The AM results confirmed the role of
Sr13, previously described in bi-parental mapping studies,
and the role of chromosome regions putatively harbouring
Sr9, Sr14, Sr17 and Sr28. Three minor QTLs were coin-
cident with those reported in hexaploid wheat and five
overlapped with those recently reported in the Seba-
tel 9 Kristal durum mapping population. Thirteen single-
marker/QTL regions were located in chromosome regions
where no Sr genes/QTLs have been previously reported.
The allelic variation identified in this study is readily
available and can be exploited for marker-assisted selec-
tion, thus providing additional opportunities for a more
durable stem rust resistance under field conditions.
Introduction
Durum wheat (Triticum durum Desf.) is an important crop
in the Mediterranean Basin, a region accounting for
approximately 75 % of global worldwide production
(Belaid 2000; Habash et al. 2009). In Sub-Saharan Africa,
Ethiopia is the largest wheat-growing country and is con-
sidered one of the centers of diversity of tetraploid wheat
(Vavilov 1929, 1951). Durum wheat is grown on approx-
imately 40 % of the total wheat area in Ethiopia, with a
tendency to increase due to the growing internal demand
for pasta products (Badebo et al. 2009). Among the factors
that negatively affect durum production and kernel quality,
rust diseases play an important role (Singh et al. 2005).
Historically, stem rust infections due to Puccinia graminis
Pers. f. sp. tritici have caused severe losses to wheat pro-
duction (Zwer et al. 1992; McIntosh and Brown1997;
Eversmeyer and Kramer 2000; Singh et al. 2011). Until the
appearance of Ug99, stem rust control through the use of
genetic resistance was considered a remarkable success
story worldwide. Although more than 50 stem rust
Communicated by D. Mather.
Electronic supplementary material The online version of thisarticle (doi:10.1007/s00122-013-2050-8) contains supplementarymaterial, which is available to authorized users.
T. Letta � M. Maccaferri � A. Ricci � R. Tuberosa (&)
Department of Agricultural Sciences, University of Bologna,
Viale Fanin 44, 40127, Bologna, Italy
e-mail: [email protected]
T. Letta
Sinana Agricultural Research Center, Bale-Robe, Ethiopia
A. Badebo
Debre Zeit Agricultural Research Center, Debre Zeit, Ethiopia
K. Ammar � J. Crossa
CIMMYT, Int. Apdo Postal 6-641, 06600 Mexico, DF, Mexico
123
Theor Appl Genet (2013) 126:1237–1256
DOI 10.1007/s00122-013-2050-8

resistance (Sr) loci have been identified in wheat (Singh
et al. 2006), including those introgressed from its wild
relatives, only a few remain effective against Ug99 or its
variants and even fewer are useful against the durum-spe-
cific Ethiopian races (Admassu et al. 2009). Susceptibility
in some CIMMYT-derived germplasm was first noted in
Uganda (Pretorius et al. 2000) and soon after was observed
in all germplasm groups. This new race, designated as
Ug99 or TTKS (Wanyera et al. 2006), spread to Kenya in
2001 and to Ethiopia in 2003 (Singh et al. 2006). By 2006,
TTKS was identified in Sudan and Yemen (http://
www.fao.org), and in 2008 its presence was confirmed in
Iran (Nazari et al. 2009). Ug99 is projected to spread far-
ther into the major wheat-growing regions of Asia (Singh
et al. 2009). In Ethiopia, Ug99 and its variants were added
to previously existing races, the latter specifically virulent
on durum wheat. Two such races have been characterized
as TRTTF and JRCQC with a combined virulence to Sr9e
and Sr13, two genes present in high frequency in the durum
wheat germplasm (Olivera et al. 2012). These races are
predominant in durum-growing areas of Ethiopia. Effective
resistance to them was found in only 5.2 % of a collection
of 996 tetraploid genotypes evaluated for field resistance at
the Debre Zeit Research Station in Ethiopia in 2009 (Oli-
vera et al. 2010). Therefore, the combination of Ug99 ?
Sr13-virulent Ethiopian races currently poses a major
threat to durum wheat production in Ethiopia and repre-
sents a potential danger elsewhere, should these virulent
races reach distant durum-growing areas such as central
India, where conditions are known to be conducive to the
epidemic development of this pathogen. Three different
races from the TTKS or Ug99 lineage were identified in
Kenya, which led to the re-designation of the original race
as TTKSK, and the other two races as TTKST (with
additional virulence on Sr24) (Jin et al. 2008) and TTTSK
(with additional virulence on Sr36) (Jin et al. 2009). The
effectiveness and durability of the genetic resistance
approach to control the disease require the availability of
many sources of resistance, preferably involving genes that
act on adult plant field resistance, to counter the continuing
evolution of new virulence in pathogen populations.
Selecting for the resistant phenotypes conferred by
major, race-specific loci is relatively straightforward, and
initially rewarding though eventually becomes ineffective
due to the fast evolution and selection of virulent strains of
the pathogen, as seen with Ug99. Although a number of
resistance genes have been introgressed into cultivated
wheat from wild relatives (Ceoloni et al. 2005; Feuillet
et al. 2008), the successful utilization of such materials has
often been hampered by the inherent difficulties of oper-
ating with alien genomes.
Marker-based approaches allow us to identify genes/
quantitative trait loci (QTL) governing plant response to
diseases. The effective deployment of stem rust resistance
alleles from different sources requires a thorough genetic
characterization of the available germplasm. The standard
approach is to use biparental mapping populations to relate
phenotypic information to genotypic data obtained from
molecular markers to determine the number and the chro-
mosomal location of resistance loci (Gupta et al. 1999;
Maccaferri et al. 2008; Simons et al. 2011). An alternative
to the use of bi-parental mapping is association mapping
(AM) or linkage disequilibrium (LD)-based mapping in
which genotype-phenotype relationships are explored in
germplasm collections or natural populations (Rafalski
2002, 2011; Flint-Garcia et al. 2003). The underlying
principle of this approach is that LD tends to be main-
tained over many generations between loci that are
genetically linked. With AM, statistical assessments are
made for associations between genotypes based on
molecular markers and phenotypes for various traits in
reference germplasm sets (Buntjer et al. 2005). Since its
first use in plants a decade ago (Thornsberry et al. 2001),
AM has been used in many important crops thanks to
advances in high-throughput genotyping technologies,
increased interest in identifying useful and/or novel alleles,
and improvements in statistical methods (Gupta et al. 2005;
Yu et al. 2006; Zhu et al. 2008). In both tetraploid and
hexaploid wheat, AM has already proven to be an effective
strategy to identify marker-trait associations for agronom-
ically valuable traits (Breseghello and Sorrells 2006;
Crossa et al. 2007; Maccaferri et al. 2010, 2011a),
including resistance to stem rust (Yu et al. 2011), Stago-
nospora nodorum blotch (Tommasini et al. 2007), Fusar-
ium head blight (Miedaner et al. 2011) in bread wheat and
leaf rust (Maccaferri et al. 2010) and SBMCV (Maccaferri
et al. 2011b) in durum wheat.
The objective of this study was to evaluate a panel of
durum wheat accessions well-suited for AM studies
(Maccaferri et al. 2006, 2010, 2011a, b) to identify geno-
mic regions associated with field-based resistance to the
combination of Ug99 with Ethiopian races of stem rust.
Materials and methods
Plant materials
A collection of 183 elite durum genotypes including cul-
tivars released or breeding lines developed in Italy, Mor-
occo, Spain, Syria, Tunisia, Southwestern USA and
Mexico was assembled to represent different spring durum
germplasm groups. The genotypes included in the AM
panel were chosen from a larger pool of 330 accessions
obtained from various sources and evaluated in a field trial
in 2003 in Cadriano, near Bologna, Italy (Maccaferri et al.
1238 Theor Appl Genet (2013) 126:1237–1256
123

2006). The accessions of this panel were chosen based on
their pedigrees and morpho-physiological traits critical to
adaptation, such as plant height and heading date. Highly
related accessions (e.g. sibs from the same cross, backcross
lines, etc.) and/or with excessively large differences in
heading date, a feature that could have biased the pheno-
typic evaluation of traits influenced by flowering time,
were excluded. Most of the accessions were semi-dwarf,
short- to medium-cycle elite cultivars and breeding lines
released from the early 1970s up to the late 1990s. The
collection comprises also ‘founder genotypes’ widely used
as parents in breeding programs throughout the Mediter-
ranean Basin and at International CGIAR Centers
(CIMMYT and ICARDA). The accessions were assembled
for conducting AM studies and are hitherto collectively
referred to as the ‘AM durum panel’. A detailed phenotypic
and molecular characterization of the panel was previously
reported in Maccaferri et al. (2006, 2010). Briefly, the
panel included accessions belonging to one of five main
population subgroups: accessions from ICARDA bred for
the dryland areas (subgroup 1), from ICARDA bred for
temperate areas (subgroup 2), from the Italian and early
1970s CIMMYT breeding programs (subgroup 3), from
CIMMYT in the late 1970s early 1980s (subgroup 4), from
CIMMYT in the late 1980s early 1990s (subgroup 5). As
compared to the panel of accessions described in Maccaf-
erri et al. (2010), 25 accessions were dropped due to their
relatively high relatedness while 19 additional accessions
from the CIMMYT breeding programs, mainly classified as
belonging to subgroup 5, were added to the panel. Based on
their molecular profiles, the accessions clustered into the
five subgroups with balanced frequencies.
Stem rust response evaluation under field conditions
Field experiments were conducted in Ethiopia at the Debre
Zeit Agricultural Research Center (DZARC), located at an
altitude of approximately 1,900 m above sea level, with
latitude of 8�440N and longitude of 38�850E. This Center is
a hot spot for wheat-stem rust during the main cropping
season (July to November) as well as during the off-season
(mid-January to May), if irrigation is provided to ensure
proper plant development. DZARC has been identified as
an international durum wheat screening site as part of the
Borlaug Global Rust Initiative.
The AM durum panel was evaluated during four con-
secutive growing seasons in 2009 and 2010. In both years,
the evaluation was carried out both in the off-season under
supplementary irrigation and in the main season under rain-
fed conditions. The off-season is warmer than the main
season and as a result stem rust disease pressure is often
higher than in the main season, depending on the moisture
availability for disease development. The accessions were
evaluated in non-replicated field trials, using an augmented
design, with plots consisting of 1-m long twin rows flanked
by spreader rows that were sown with a seed mixture of
PBW343, Morocco (bread wheat susceptible to Ug99) and
Local Red or Arendeto (susceptible durum) accessions in
2:1:1 proportion, respectively. Spreader rows were artifi-
cially inoculated with Ug99 (TTKSK race) and a mixture
of durum-specific races prevalent in Ethiopia. The Ug99
(TTKSK) stem rust race was isolated and maintained on
the variety PBW343 under greenhouse conditions. Race
purity was regularly checked on the North American stem
rust differential lines. In addition, bulk spores were col-
lected directly from the durum wheat nurseries in the field
and temporarily stored at 4 �C after drying. Field inocu-
lation was carried out following the methodology described
in Roelfs et al. (1992). Inoculation was carried out on
spreader rows starting at stem elongation growth stage and
was repeated two to three times at weekly intervals. The
cultural practices including fertilizer, weeds and insect
control were applied according to the local site
recommendations.
Stem rust disease severity was recorded two to three
times during the epidemics development using a modified
Cobb’s scale (Peterson et al. 1948). Disease severity score
(DSS) was calculated as the percentage of infected stem
area covered by pustules (visually estimated over the
whole canopy); at the same time, the major infection type
was also recorded (Roelfs et al. 1992). Infection types
were categorized into four discrete classes: resistant (R),
moderately resistant (MR), moderately susceptible (MS)
and susceptible (S). The DSS and the corresponding
infection types were used to compute the values of the
Coefficients of Infection (Stubbs et al. 1986). For each
evaluation season, the terminal disease severity at the
soft-dough stage (Zadoks scale, 85; Zadoks et al. 1974),
in coincidence with the peak of disease severity, was
considered as the most informative disease score and was,
therefore, used to carry out the molecular-phenotype
association tests.
Molecular profiling
A bulk of 25 seeds from the original pure stock of each
accession was germinated and grown in growth chamber at
20 �C. After 2 weeks, seedling leaves were collected,
freeze-dried, ground and used for genomic DNA extraction
as previously described in Maccaferri et al. (2010). The
accessions were profiled with 350 simple sequence repeat
loci (SSR), 900 Diversity Arrays Technology (DArT)
markers and three additional sequence-tagged site (STS)
markers, including those previously reported as markers
associated with major stem rust resistance genes (Yu et al.
2010).
Theor Appl Genet (2013) 126:1237–1256 1239
123

SSR and STS markers
Most of the SSR primers used were chosen among the
publicly available sets catalogued in the GrainGenes
database (http://wheat.pw.usda.gov) as BARC (barc mar-
ker loci), CFA, CFD and GPW from INRA (cfa, cfd and
gpw, respectively), KSUM (ksum), WMC (wmc) and WMS
(gwm). An additional subset of private genomic WMS
primers from TraitGenetics (supplied by M. Ganal, Trait-
Genetics, Gatersleben, Germany) were also considered.
The SSR loci used to genotype the accessions were pres-
elected for (i) clarity and repeatability of amplicon profiles,
(ii) polymorphism level and (iii) even distribution on all the
A- and B-genome chromosomes. The choice was carried
out based on the results of a survey of SSR primer pairs
conducted on a small subset of eight founder accessions
and lines used as parents of mapping populations.
As described in Maccaferri et al. (2008), a unique
thermo-cycling protocol was used for all primer sets and
SSR profiles of the accessions were obtained using the
automated LI-COR 4200 IR2 System (LiCor, Lincoln, NE,
USA). Genotyping was performed for most SSR markers
using the M13-labelled primers and amplification protocol
(Schuelke 2000). Alleles were scored using founder
genotypes as an allele reference set. Most markers pro-
duced only one band assigned to a unique wheat chromo-
some in previous mapping studies. For SSR primer pairs
amplifying two or more loci, each locus was independently
scored and assigned to the respective linkage group based
on either the score of the parental lines or the LD with
adjacent markers.
DArT markers
In addition to SSR and STS markers, the panel was profiled
with DArT markers. DArT markers were generated by
Triticarte Pty. Ltd. (Canberra, Australia; http://www.
triticarte.com.au), a whole-genome profiling service com-
pany, as described by Akbari et al. (2006). The durum
wheat PstI/TaqI array v 2.0, containing 7600 single DArT
clones obtained as described in Mantovani et al. (2008),
was used for genotyping the panel. The locus designation
used by Triticarte Pty. Ltd. was adopted (‘wPt’, ‘rPt’ and
‘tPt’ loci corresponding to wheat, rye and triticale clones,
respectively), and alleles at polymorphic loci were scored
as hybridization positive (1) or negative (0).
Construction of the consensus map
The majority of the SSR markers considered herein had
previously been mapped in five intra-specific durum
recombinant inbred line (RIL)-based linkage maps, whose
genotypic data were used to obtain a consensus durum
wheat-specific linkage map. Four mapping populations, i.e.
Kofa 9 Svevo (KS RIL population, Maccaferri et al.
2008), Colosseo 9 Lloyd (CL RIL, Mantovani et al. 2008),
Meridiano 9 Claudio (MC RIL, Maccaferri et al. 2011a, b)
and Simeto 9 Levante (SL RIL, Maccaferri et al. unpub-
lished) were developed by DiSTA in collaboration with
Produttori Sementi Bologna SpA (Argelato, BO, Italy). For
the fifth linkage map, obtained from the cross Kofa 9
UC1113 (KU RIL population, Zhang et al. 2008), the
genotypic data were downloaded from the GrainGenes web
database.
The consensus linkage map was obtained from the five
data-sets using the Carthagene v.4.0 software (de Givry
et al. 2005). Merging was performed with the dsmergen
command, after checking for marker order consistency
across maps, so that for each marker pair a single recom-
bination rate was estimated based on all available meioses.
A framework-mapping method was applied. Non-frame-
work markers were incorporated in the framework map by
building a complete map using the framework map as a
fixed order. The marker order and inter-marker genetic
distances from the consensus map were used to report the
LD and association results.
The consensus map included a total of 2,036 markers
(mostly SSR and DArT markers) and it is reported as
Supplemental Table 1.
Association mapping
To avoid LD inflation effects and to reduce the risk of
false-positive marker-trait associations (Myles et al. 2009),
data points for rare alleles (those with frequencies of 0.10
or less) were considered as missing data. Data points
showing residual allelic heterogeneity within accession
were also considered as missing data.
In total, the genotypic score of the AM durum panel
genotypes was available for 1,211 markers suitable for
association mapping (minor allele frequency [0.10),
including SSR, DArT and STS markers
Among those, the 320 SSR, 3 STS and 538 DArT
markers that could be projected onto the consensus linkage
map were retained for marker-phenotype association tests
(861 markers), while the others with undefined map posi-
tion were not considered for further analyses.
Genetic structure and linkage disequilibrium analysis
Prior knowledge suggested the presence of significant
population structure in the panel. To decrease the false-
positive rate, this structure was accounted for in the asso-
ciation test models. The genetic structure of the panel was
investigated with a combination of model- and distance-
based analyses. Model-based population structure using a
1240 Theor Appl Genet (2013) 126:1237–1256
123

selection of 96 highly informative and evenly spread SSRs
was assessed using the program STRUCTURE v. 2 (Prit-
chard et al. 2000). STRUCTURE parameter settings were:
linkage model, allele frequencies correlated, burn-in length
100,000 and 100,000 MCMC repetitions. An optimum
number of five hypothetical subgroups were chosen to
obtain the Q matrix of membership coefficients of each
accession to all subgroups (for details see Maccaferri et al.
2011a, b). In the distance-based analysis, pairwise genetic
similarity values (GSij) were calculated for all possible
pairs of accessions using the simple matching coefficient
for multi-state markers: a co-ancestry K (kinship) matrix
was thus obtained for SSRs (for details see Maccaferri et al.
2010). Similarly, the kinship matrix was also calculated for
DArT markers, separately.
Estimating LD between markers assess whether markers
segregate independently or not. The program TASSEL, v.
2.1 (www. maizegenetics.net, Yu et al. 2006) was used to
estimate the LD parameters D0 and r2 values as a function
of the corresponding inter-marker distances and the com-
parison-wise significance was computed with 10,000 per-
mutations. The r2 LD value was estimated for intra-
chromosomal loci and related to genetic distances between
loci (cM). If, within a chromosome region, all pairs of
adjacent loci were in LD, this region was referred to as an
LD block (Stich et al. 2005).
Marker-phenotype association analysis
Genome-wide scans for AM of loci governing stem rust
resistance were conducted using the coefficient of infection
(CI) as reference phenotypic data. Prior to the AM analysis,
homogeneity of experimental variance across experiments
was verified through the Bartlett’s test. AM analysis was
conducted using the TASSEL program, ver. 2.1. The 320
SSRs, 3 STSs and the 538 DArT markers were tested for
significance of marker-trait associations under: (1) the
fixed general linear model (GLM) including the Q popu-
lation structure results as covariates (Q GLM), (2) the
mixed linear model (MLM) including the Q population
structure results plus the K kinship matrix (Q ? K MLM).
For GLM analysis, besides the marker-wise association
probability values, the experiment-wise association signif-
icance probability was obtained based on a permutation test
implemented in TASSEL (10,000 permutations in total).
The experiment-wise test provides a much more severe
threshold for significance as compared to the marker-wise
test (Bradbury et al. 2007, 2011). In the MLM analysis,
experiment-wise significance was inspected using the false
discovery rate (FDR) approach according to Storey and
Tibshirani (2003) and implemented in Qvalue program.
Multiple adjacent co-segregating significant markers
were assigned to a unique QTL region upon satisfaction of
the following conditions: less than 20 cM of inter-marker
genetic distance, presence of significant and strong LD
among markers (possibly with r2 values C 0.6), consis-
tency of the marker allelic effects in sign (Massman et al.
2011).
Chromosome regions repeatedly associated with stem
rust response in two or more seasons and to the combined
response across seasons were considered as putative QTLs,
regardless of whether the experiment-wise significance
threshold was reached. For each putative QTL, the marker
with the strongest association to stem rust response was
considered as the main QTL-tagging marker. Results on the
allelic distribution and effects were examined for the QTL-
tagging markers only. Linear regression was used to
investigate the fit of the accessions’ haplotypes at the main
QTLs (significant over three to four seasons) to the cor-
responding phenotypic responses (CIs averaged across
seasons). Based on the results of the GLM and MLM tests,
the non-rare alleles at the QTL-tagging markers that were
significant over three or four seasons were classified as
beneficial, intermediate or deleterious and the cumulative
numbers of beneficial and deleterious alleles were counted
for each accession. The accessions’ disease response
averaged across the four seasons was regressed on the
cumulative numbers of both beneficial and deleterious
alleles. Significance of the regression was estimated with
an F test.
Results
Response to stem rust
Stem rust infection was high in all four testing seasons,
allowing for clear and unambiguous scoring of field reac-
tion. The mean CI values of the panel accessions ranged
from 33.6 for DZm-2010 to 49.3 for DZo-2010. In both
years, the off-season experiment showed a disease pressure
significantly (P B 0.01) higher than that recorded in the
main season (Table 1). In all seasons, a broad and contin-
uous variation within the panel was noted, from close-to-
immune, highly resistant reactions to highly susceptible
ones, as indicated by the disease response ranges reported in
Table 1 and by the CI frequency distribution in each season
and across seasons (reported as supplemental Figure 1).
The analysis of variance for stem rust reaction showed
highly significant differences (P B 0.0001) among acces-
sions and seasons (results not reported); the acces-
sion 9 season interaction was also significant (P B 0.01).
The heritability coefficient of stem rust response, cal-
culated across seasons using the data from the non-repli-
cated experiments, was equal to 0.80 while the coefficient
of variation reached 26.1 %. The Pearson correlation
Theor Appl Genet (2013) 126:1237–1256 1241
123

coefficients between the stem rust responses recorded in
the four seasons (data not reported) were always highly
significant (P B 0.001), with values ranging from 0.40
(DZo-2010 vs. DZm-2010) to 0.58 (DZm-2009 vs. DZo-
2010).
Based on the distribution of the stem rust responses
averaged over the four seasons (Table 2), about 5 % of the
accessions (nine in total) were highly resistant (mean
DSS \ 10 %) and 19 % (36 accessions) were categorized
as moderately resistant (mean DSS comprised between 10
and 30 %). In addition, 11 accessions (i.e. 6 %) were
classified as susceptible or highly susceptible (DSS equal to
or higher than 70 %); their number increased to 51 (i.e.
30 % of accessions) when considering the single DZo-2010
season that was characterized by an infection level signif-
icantly higher than that reached in the other three seasons.
Relationship between population structure and response
to stem rust
The genetic relationships among the accessions were
investigated using both a genetic similarity and a model-
based Bayesian clustering method and the results have
been reported elsewhere (Maccaferri et al. 2006, 2011a, b).
Both methods pointed out that the minimum and optimum
number of hypothetical well-distinct subgroups present in
the panel was equal to five. It was shown that the five
subgroups corresponded to clearly distinct breeding lin-
eages: (1) the ICARDA germplasm bred for the dryland
areas (subgroup S1); (2) the ICARDA germplasm bred for
the temperate areas (subgroup S2); 3) the Italian and early
1970s CIMMYT germplasm (subgroup S3); 4) the late
1970s CIMMYT germplasm, widely adapted to Mediter-
ranean conditions (subgroup S4); 5) the late 1980s to early
1990s CIMMYT germplasm, with increased yield potential
(subgroup S5). Based on the molecular assignment of each
accession to the subgroup with the highest Bayesian
probability, the five subgroups included 11, 55, 26, 56 and
35 accessions, respectively. The membership coefficient to
each of the five subgroups, averaged over all the acces-
sions, was equal to 0.09, 0.29, 0.14, 0.29 and 0.19 from S1
to S5, respectively (supplemental Table 2). The differences
for stem rust response among the five subgroups were
highly significant (P B 0.0001, results not reported), with
the differences among subgroups explaining 15.5 % of the
total variance. Although differences among subgroups
were significant, the within-group component of variance
prevailed, accounting for 53.2 % of the total variation. The
effect of population structure on the stem rust response was
also investigated by means of regression analysis. Using
data of each season separately, a modest population
structure effect was detected for the DZo-2009 and
DZm-2010 seasons, with R2 values of 8.9 and 7.7 %,
respectively, while a greater influence was detected for
DZm-2009 and DZo-2010, with R2 values of 14.7 and
20.8 %, respectively. The mean and range for stem rust
response values (CIs) of each of the five subgroups are
reported in Table 3. These values clearly show that all five
subgroups included accessions with a wide range of
responses, from highly resistant to highly susceptible, thus
indicating that all subgroups are equally informative and
Table 1 Descriptive statistics for field stem rust response (reported
as Coefficient of Infection) of the 183 elite durum wheat accessions
evaluated in four growing seasons in Ethiopia
Seasona CI
Mean Min Max
DZo-2009 42.2 0.2 80.0
DZm-2009 36.9 0.0 80.0
DZo-2010 49.3 0.0 90.0
DZm-2010 33.6 7.9 68.2
Mean 40.5 3.5 72.0
a Stem rust response evaluation carried out in Debre Zeit (DZ)
Agricultural Research Center; DZo-2009: off-season field trial eval-
uation carried out in 2009 (January to May); DZm-2009: main season
evaluation in 2009 (July to November); DZo-2010: off-season eval-
uation in 2010; DZm-2010: main season evaluation in 2010
Table 2 Frequency distribution of stem rust responses averaged over four growing seasons in Ethiopia for the 183 elite durum wheat accessions
included in the association mapping durum panel
Season Stem rust responsea
(DSS \ 10 %) (DSS 10-20 %) (DSS 30 %) (DSS 40 %) (DSS 50-60 %) (DSS 70-100 %)
DZo-2009 0.06 (10)b 0.06 (10) 0.12 (20) 0.26 (43) 0.45 (75) 0.05 (8)
DZm-2009 0.11 (16) 0.12 (17) 0.19 (27) 0.18 (26) 0.28 (40) 0.13 (19)
DZo-2010 0.05 (9) 0.06 (10) 0.10 (17) 0.16 (27) 0.34 (58) 0.30 (51)
DZm-2010 0.15 (22) 0.10 (14) 0.17 (25) 0.22 (31) 0.30 (43) 0.06 (8)
Mean 0.05 (9) 0.09 (17) 0.10 (19) 0.18 (33) 0.51 (94) 0.06 (11)
a Classification of response based on the Disease Severity Score (DSS) as reported in Singh et al. (2009)b Frequencies values; values within brackets report the actual accession numbers
1242 Theor Appl Genet (2013) 126:1237–1256
123

well-suited for AM purposes. Considering the mean sub-
group values across seasons and based on the least sig-
nificant difference among subgroups, S4 and S5, which
mainly included CIMMYT elite germplasm, showed sig-
nificantly higher stem rust susceptibility than S1, S2 and
S3. The complete dataset of phenotypic response and
population structure membership coefficients for each of
the 183 accessions included in the association panel is
reported as supplemental Table 2.
Association mapping for stem rust response
In view of the strong genotype by season interaction,
marker-phenotype association tests were conducted sepa-
rately for each season as well as for the responses averaged
over the four seasons.
The association mapping (AM) analysis was conducted
by performing single-marker F tests using both the General
Linear Model with Q covariate matrix (population structure
correction: Q GLM) and the mixed linear model with
Q ? K matrices (population structure and familial relat-
edness correction: Q ? K MLM). The genome-wide scan
revealed chromosome regions harbouring putative QTLs
for stem rust response on all chromosomes except for 3B.
Overall, 45 chromosome regions harboured markers that
were significant (P B 0.05) in at least two seasons under the
Q GLM model as well as across the averaged data of the
four seasons; 36 of these 45 chromosome regions showed
significant effects also using the Q ? K MLM model.
Introducing the experiment-wise correction, eight chro-
mosome regions showed significant (P B 0.05) effects in the
Q GLM model while in the Q ? K MLM model the signifi-
cance was limited to one region on chromosome 6A which
showed the strongest association with stem rust response.
Based on these findings, we decided to present detailed results
of the 36 chromosome regions which were detected in the
marker-wise analysis and considered as putative QTLs.
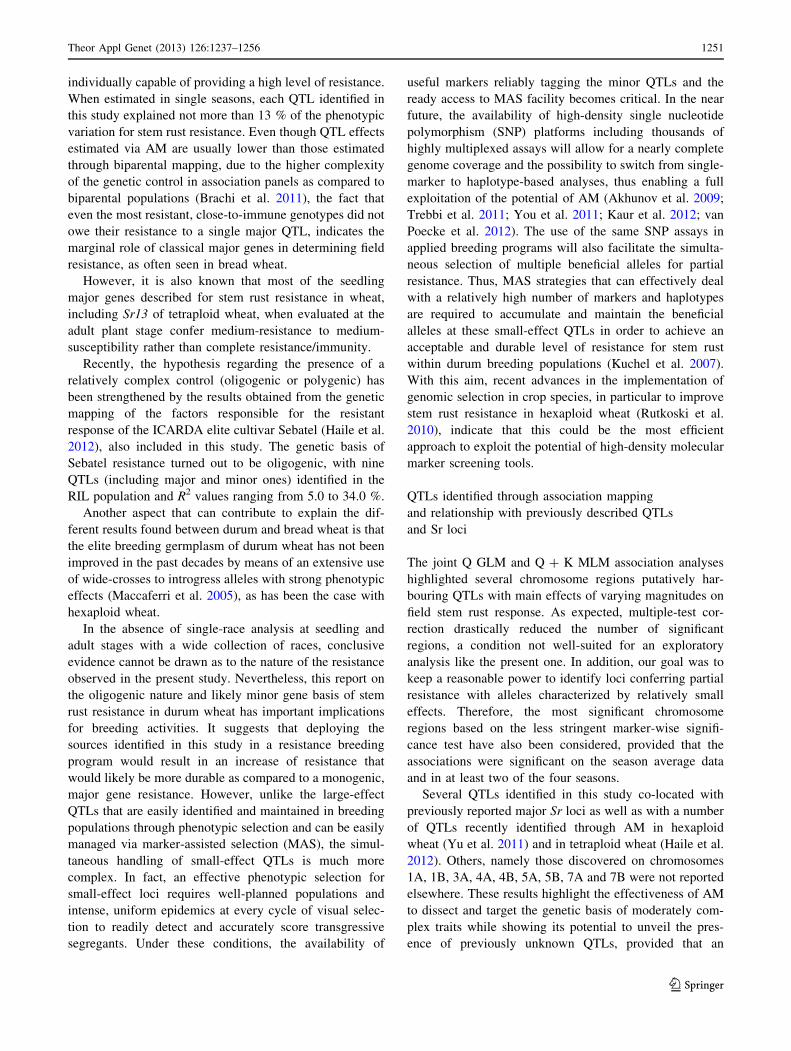
Figure 1 summarizes the results of the Q ? K MLM
genome scan for the disease response averaged across the
four seasons. In several cases, the presence of a QTL was
evidenced by multiple SSR and DArT markers significantly
associated with the phenotype, located within chromosome
regions of 10 cM or less (linked markers) and with the
same directional effect, as estimated from the durum con-
sensus map, and, in most cases, with LD r2 values higher
than 0.6. For each of the QTLs that were identified as
linkage blocks of adjacent markers, all the markers sig-
nificantly associated with the phenotype were checked for
consistency of their effects and the marker with the most
significant association to the trait was considered as the
QTL-tagging marker.
For 12 of the 36 chromosome regions considered as
putatively harbouring QTLs, the significance of the effects
on stem rust response was confirmed across three or four
seasons (QTL features reported in Table 4; see also Fig. 1),
while the other 24 regions showed significant, consistent
effects in two seasons (Table 5; Fig. 1). The QTLs with
consistent effects across three or four seasons (Table 4)
were also those with the highest overall R2 values based on
the combined analysis over seasons (in most cases com-
prised between 4.0 and 7.0 %) as well as for single seasons
(values ranging from 1.0 to 11.3 %). In particular the
regions on chromosomes 1BS (QTL-tagging marker
barc8), 2AS (gwm1045), 3AS (wPt-7972), 6AL (gwm427
and CD926040) and 7AS (wPt-2799) showed the highest
R2 values and all of these QTLs were tagged by a series of
adjacent markers that supported the primary QTL effect.
Regions on chromosomes 2BL, 3AL and 5AL had con-
sistently high R2 values, but were identified by single
markers.
The QTL tagged by barc8 on chromosome 1BS at
32.0 cM showed strong LD (r2 range of 0.60–0.67) along
with a 9.0 cM interval that included nine DArT markers
(following the mapping order of the consensus map: wPt-
Table 3 Mean and range of stem rust response (reported as Coefficient of Infection) in the five main germplasm subgroups of the association
mapping durum wheat panel
Environment Subgroup 1 (S1)
ICARDA drylands
(11)a
Subgroup 2 (S2)
ICARDA temperate
(55)
Subgroup 3 (S3) Italian
and early 1970s
CIMMYT (26)
Subgroup 4 (S4) late
1970s CIMMYT (56)
Subgroup 5 (S5) late
1980s CIMMYT (35)
Mean Min Max Mean Min Max Mean Min Max Mean Min Max Mean Min Max
DZo-2009 40.6 9.0 70.0 41.6 0.2 70.0 32.3 0.2 60.0 44.9 6.0 80.0 45.4 4.0 70.0
DZm-2009 27.4 6.0 54.0 34.5 2.0 80.0 22.7 0.0 63.0 42.7 3.0 80.0 44.0 3.0 80.0
DZo-2010 45.7 27.0 70.0 44.5 3.0 80.0 38.3 0.0 80.0 49.0 9.0 90.0 66.2 12.0 80.0
DZm-2010 43.5 9.4 60.5 32.2 7.9 60.5 27.4 7.9 60.5 33.7 11.0 52.7 36.2 7.9 68.2
Mean 39.6 14.6 58.0 38.6 3.5 67.5 29.4 3.8 58.7 42.7 7.5 66.2 47.5 9.5 72.0
Least significant difference (LSD) among subgroups = 4.99 (P = 0.05)a Number of accessions belonging to each subgroup
Theor Appl Genet (2013) 126:1237–1256 1243
123

2999, wPt-4605, wPt-3582, tPt-8831, wPt-9864, wPt-4133,
wPt-1876, wPt-5899 and wPt-4729) and one SSR marker
(gwm1100). In the distal region of chromosome 6AL,
highly significant effects were detected at three adjacent
chromosome regions/linkage that overall spanned 15.8 cM
on the durum consensus linkage map, but showed low LD
4
3
2
1
0
4
3
2
1
0
4
3
2
1
0
4
3
2
1
0
4
3
2
1
0
4
3
2
1
0
2B
3B
4B4A
3A
2A
4
3
2
1
0
1A4
3
2
1
0
1B
4
3
2
1
0
5A4
3
2
1
0
5B
5
4
3
2
1
0
6B5
4
3
2
1
0
6A
Sr26 Sr13
Sr35
Sr9-SrWeb
4
3
2
1
050 100 150
7A
200 250
Sr22
4
3
2
1
050 100 150 200
7B
Sr17
250
Sr2
Sr14
Sr28-Sr16
Fig. 1 Association mapping
probabilities, reported as -log
(p), of the mapped markers
tested for association to stem
rust response of 183 elite
accessions of durum wheat.
Results are shown for the stem
rust response averaged over four
evaluation seasons, reported on
a chromosome-by-chromosome
basis. The -log 0.05
significance threshold value is
equal to 1.35. Centromeres have
been indicated as solid filledtriangles. Vertical, dashed linesindicate the 12 markers with
significant effects (P \ 0.05) in
three or four seasons; vertical,
dotted lines indicate the 24
markers tagging QTL regions
with significant effects
(P \ 0.05) in two seasons only.
Chromosome intervals
corresponding to the locations
of stem rust (Sr) resistance loci
reported by previous studies in
hexaploid and tetraploid wheat
have been reported as blackbars above the graph of each
chromosome. Chromosome
linkage blocks associated with
stem rust response in hexaploid
wheat (Crossa et al. 2007; Yu
et al. 2011) and in tetraploid
wheat (Haile et al. 2012) have
been reported as grey and
crossed-bars, respectively
1244 Theor Appl Genet (2013) 126:1237–1256
123

with each other. Each of these three chromosome regions
were identified, respectively, by: (i) the marker pair
gwm427-wmc580 (at chromosome position 139.5 cM,
r2 LD value between the two markers = 0.98), (ii) the
EST-derived marker CD926040 (chromosome position
144.0 cM), associated with wPt-9474, wPt-4229, wPt-
5654, wPt-3247 and wPt-4663 (spanning a 9.3 cM interval
with moderate LD among markers and r2 values ranging
from 0.12 to 0.58) and (iii) barc104 (chromosome position
155.3 cM). The marker pair gwm427-wmc580 showed low
LD values with all the other markers in the region (r2
values from 0.01 to 0.20) while LD was detected between
the linkage block of markers associated with CD926040
and barc104 (r2 from 0.26 to 0.55).
As compared to the QTLs identified across three or four
seasons, those (24 in total) with significant effects in only
two seasons (Table 5) showed in general lower effects and
R2 values both on a mean-(values from 1.0 to 3.8 %) and
single-season basis. Nonetheless, some of these QTLs (e.g.
those on chrs. 1AS, 1BL, 2B, 3AL, 6A and 7B) showed
relatively high R2 values in specific seasons (from 3.6 to
8.0 %).
The least square phenotypic means (based on CIs) of
non-rare alleles at the QTL-tagging markers with signifi-
cant effects in three to four seasons are reported in Table 6.
The SSR marker gwm427 (chromosome 6AL) showed
two common alleles (212 and 188 bp), with the 188 bp
allele being associated with significantly (P B 0.05) lower
CI values. The EST-derived marker CD926040 (chromo-
some 6AL) carried three common alleles with phenotypic
effects that were estimated to be beneficial for one allele
(855 bp) over all seasons and detrimental (i.e. associated
with increased susceptibility) for the other two alleles (851
and 845 bp). At barc104 (chromosome 6AL) the 202 and
206 bp alleles were both considered as beneficial as com-
pared to the 172 bp allele (detrimental).
The genotypes of the 183 accessions of the AM durum
panel for all the QTL-tagging markers identified in this
Table 4 Quantitative trait loci (QTLs) for stem rust response identified through association mapping in a panel of 183 elite durum wheat
accessions evaluated in Ethiopia, with significant effects observed over three to four evaluation seasons
Chrom. Most
associated
marker
Position
(cM)aSeasons with significant
marker-trait
associations
R2 range
(%)bR2
(%)cAssociated markers in the QTL region Interval
width
(cM)a
1BS barc8 32.0 DZm-2009, DZo-2010,
DZm-2010
3.2–5.6 4.6 gwm1100, wPt-2999, wPt-4605, tPt-8831, wPt-
9864, wPt -3582, wPt-4133, wPt-1876, wPt-5899,
wPt-4729
9.0
2AS gwm1045 87.7 DZm-2009, DZo-2010,
DZm-2010
3.3–5.8 3.9 gwm425, cfa2263 12.5
2BL wmc356 220.0 DZo-2009, DZm-2009,
DZo-2010
3.2–6.6 4.1 – 0.0
3AS wPt-7992 8.0 DZo-2009, DZm-2009,
DZo-2010, DZm-2010
1.7–4.7 3.3 wPt-6854, barc12, wPt-1111 3.5
3AL wmc388 85.6 DZo-2009, DZo-2010,
DZm-2010
1.9 -4.1 4.0 – 0.0
5AL gwm126 93.3 DZo-2009, DZo-2010,
DZm-2010
1.8 -4.8 4.1 – 0.0
5AL gwm291 111.7 DZo-2009, DZm-2009,
DZo-2010,
2.7 -5.7 4.4 – 0.0
6AL gwm427 139.5 DZo-2009, DZm-2009,
DZm-2010
1.7 -6.8 3.5 wmc580 0.1
6AL CD926040 144.0 DZo-2009, DZm-2009,
DZo-2010, DZm-2010
3.5–11.3 7.1 wPt-9474, wPt-4229, wPt-5654, wPt-3247, wPt-
4663
9.3
6AL barc104 155.3 DZo-2009, DZm-2009,
DZm-2010
6.1–9.7 4.5 – 0.0
7AS wPt-2799 38.2 DZo-2009, DZm-2009,
DZo-2010, DZm-2010
1.7–4.9 5.2 barc70, gwm1187, wmc479 6.3
7AS wPt-7785 94.8 DZo-2009, DZo-2010,
DZm-2010
1.1–2.3 1.5 – 0.0
For each QTL, the chromosome position, the associated markers and the QTL features are reporteda Position of the QTL most associated marker as from the durum consensus map used as referenceb Range of R2 value across the three to four evaluation seasons with significant marker-trait associationc R2 value for the marker most associated with the QTL (averaged over the four evaluation seasons)
Theor Appl Genet (2013) 126:1237–1256 1245
123

study are reported in Supplemental Table 3 and 4, with the
durum accessions that were sorted based on their popula-
tion structure (supplemental Table 3) and mean stem rust
response (supplemental Table 4) over the four evaluation
seasons. For the same QTL-tagging markers, the least
square means of the corresponding alleles are reported in
supplemental Table 5.
Table 7 reports the frequencies in the five main germ-
plasm subgroups of the non-rare alleles at the QTL-tagging
markers that were significant in three to four seasons.
Inspection of allele frequencies as reported in Table 7
indicates that allele fixation within subgroups was rare and
further suggests that, in most cases, the frequency of the
resistant alleles and of the other common alleles can be
considered as balanced ([0.20), hence informative. In
general, common alleles were present with balanced fre-
quencies—the best condition to maximise the reliability of
the association assay—in two or three subgroups; while
barc104 (chromosome 6AL), wPt-2799 (chromosome
7AS) and wPt-7785 (chromosome 7AS) showed balanced
allele frequencies across four or five subgroups. For each
QTL-tagging marker, the frequency of the beneficial allele/
Table 5 Quantitative trait loci (QTLs) for stem rust response identified through association mapping in a panel of 183 elite durum wheat
accessions evaluated during four seasons in Ethiopia, with significant effects observed in two out of four evaluation seasons
Chrom. Most
associated
marker
Position
(cM)aSeasons with
significant marker-trait
associations
R2
range
(%)b
R2 (%)c Associated markers in the QTL
region
Interval
width (cM)a
1AS gpw2246 0.0 DZo-2009, DZm-2009 2.3–4.7 3.1 – 0.0
1AS wPt-5411 69.6 DZm-2009, DZo-2010 1.4–1.6 1.3 gwm164 1.0
1BL cfd65 40.8 DZm-2009, DZm-2010 3.5–3.8 2.4 wPt-8168, gwm947 11.0
1BL wPt-0202 85.7 DZo-2009, DZm-2009 1.4–2.0 1.0 wPt-0506, wPt-3227 0.6
2AS wPt-7049 26.9 DZo-2010, DZm-2010 1.7–3.2 1.6 barc212 4.0
2BS wPt-8404 75.7 DZm-2009, DZm-2010 2.2–6.1 1.6 wmc257, wmc243, wmc25 2.0
2BL wmc361 29.0 DZm-2009, DZo-2010 2.5–4.3 2.0 – 0.0
2BL gwm1300 169.1 DZo-2009, DZm-2010 1.6–8.0 1.7 wPt-5242 1.0
3AL wPt-1923 46.4 DZm-2009, DZm-2010 2.2–4.5 2.2 wPt-3348, wPt-1652 0.0
3AL wmc428 110.5 DZo-2009, DZm-2009 4.4–6.8 3.8 – 0.0
3AL wPt-8203 200.3 DZo-2009, DZm-2009 1.9–2.5 1.8 barc1177 5.9
4AL wPt-9196 102.4 DZo-2010, DZm-2010 1.0–1.5 1.0 wPt-2985, wPt-8886 wPt-8271
wPt-8167 wPt-3108 wPt-3796
wPt-6502 wPt-7821
6.9
4AL wPt-0798 111.0 DZo-2009, DZm-2010 2.8–2.9 1.9 wPt-5055 0.0
4BL wPt-8543 101.9 DZo-2009, DZo-2010 1.2–2.9 1.4 – 0.0
5BL wPt-9300 118.9 DZm-2009, DZo-2010 1.2–1.9 1.1 wPt-2453, wPt-1733 0.0
6AS wPt-7330 18.6 DZm-2009, DZo-2010 1.2–3.6 1.6 wPt-1742, wPt-5395, wPt-5633,
tPt-6710, wPt-1377, wPt-9075,
wPt-6520, wPt-7754, wPt-4016,
wPt-4017, wPt-3468
7.5
6AL tpt-4209 109.6 DZm-2009, DZo-2010 2.3–2.6 1.5 gwm1150 8.4
6AL gwm169 126.6 DZo-2009, DZm-2010 2.0–3.0 1.5 0.0
6BS wPt-1437 41.9 DZo-2009, DZo-2010 2.2–2.3 1.3 wPt-2095, wPt-7935 2.4
7AS wPt-5489 0.0 DZo-2009, DZo-2010 1.5–1.8 2.0 0.0
7AL wPt-0745 248.4 DZo-2009, DZm-2010 1.7–2.2 1.3 wPt-7763 0.0
7BS gwm573 66.6 DZo-2009, DZm-2009 2.9–5.7 3.4 gwm1184, wmc182 6.2
7BL wmc517 155.6 DZm-2009, DZm-2010 3.5–3.6 2.3 – 0.0
7BL wPt-8615 175.9 DZo-2010, DZm-2010 2.3–2.7 2.1 wPt-5343, wPt-1715, wPt-4298,
wPt-4869, wPt-7362, wPt-4010,
wPt-7191, wPt-7351, Pt-8417,
wPt-4045, gwm611
21.0
For each QTL, the chromosome position, the associated markers and QTL features are reporteda Position of the QTL most associated marker as from the durum consensus map used as referenceb Range of R2 value across the evaluation seasons with significant marker-trait associationc R2 value for the marker most associated with the QTL (average over the four evaluation seasons)
1246 Theor Appl Genet (2013) 126:1237–1256
123

s was highly variable across the five germplasm subgroups.
As an example, in five cases beneficial alleles were
observed at relatively high frequencies ([0.50) in more
than one subgroup, i.e. in all the five subgroups (wPt-7992
on chromosome 3AS), in four subgroups (barc8 and
gwm1045 on chromosomes 1BS and 2AS, respectively), in
three subgroups (barc104 on chromosome 6AL) and in two
subgroups (wmc388 on chromosome 3AL).
Overall, subgroup 1 (ICARDA accessions bred for
dryland conditions) had higher frequencies of the
resistance alleles at the QTLs on chromosome 5A than the
other subgroups. Subgroup 5 (CIMMYT accessions
released in the late 1980s–early 1990s), though character-
ized by relatively high mean phenotypic responses, had
higher frequencies of resistance allele at QTLs on chro-
mosome 6A than the other subgroups.
For each locus consistently associated with stem rust
resistance over seasons, in addition to reporting the allelic
effects estimated as phenotypic least squared means over
the whole association panel and the consistency of their
Table 6 Allele frequencies and phenotypic coefficients of infection (CI) least square means for the markers most associated with the QTLs
consistently observed over three to four evaluation seasons
Chromosome Marker Allelea,b Allele frequency CI least square means
DZo-2009 DZm-2009 DZo-2010 DZm-2010 Mean over four seasons
1BS barc8 257 0.23 52.7 70.0 87.2 48.3 63.6b
255* 0.77 46.9 46.4 67.9 36.3 49.4a
2AS gwm1045 Null 0.12 52.3 60.9 84.8 51.9 62.1b
180* 0.76 50.5 47.5 74.4 39.1 52.9a
172 0.12 56.5 64.1 95.2 48.1 65.9c
2BL wmc356 180* 0.12 22.4 20.0 61.1 23.3 32.4a
178 0.69 40.2 34.2 74.3 33.7 45.5b
176 0.19 47.6 37.9 89.9 27.5 49.9c
3AS wPt-7992 1 0.21 59.9 64.1 80.9 47.8 62.3b
0* 0.79 50.2 49.9 73.3 40.4 53.3a
3AL wmc388 250 0.29 61.4 53.3 75.7 43.4 57.4b
258 0.38 60.2 55.9 81.6 44.6 60.8c
275* 0.33 47.9 45.9 70.7 35.5 49.6a
5AL gwm126 Nu11 0.46 51.0 48.8 74.8 41.3 53.7b
214* 0.42 41.8 41.0 67.2 32.9 44.8a
208 0.12 49.8 44.9 77.2 42.3 52.5b
5AL gwm291 166 0.45 49.9 48.3 71.8 39.1 51.9b
160 0.40 54.6 59.2 81.9 43.2 59.6c
139* 0.15 42.9 44.9 60.7 39.7 47.3a
6AL gwm427 212 0.72 55.1 53.6 76.4 45.1 57.5b
188* 0.28 45.8 43.6 69.9 33.4 48.5a
6AL CD926040 855* 0.32 50.1 49.8 73.1 39.8 53.4a
851 0.40 68.9 61.3 83.8 55.7 66.9b
845 0.28 61.8 67.8 89.6 48.6 67.3b
6AL barc104 206* 0.21 50.6 68.6 76.6 32.9 56.2b
202* 0.30 50.0 48.9 73.7 37.9 52.4a
172 0.49 62.9 68.4 81.9 49.1 63.8c
7AS wPt-2799 1* 0.42 48.2 44.7 70.5 36.6 49.9a
0 0.58 55.6 59.3 78.2 45.3 59.6b
7AS wPt-7785 1 0.78 48.6 46.0 71.8 38.7 50.9b
0* 0.12 40.9 41.9 64.9 31.3 45.1a
Data are reported for the common allelic variants only (frequency C0.10). Least square means reported with bold font refer to the marker-
environment pairs showing significant associations. For each locus, the least significant difference between the allele means over four seasons
was calculated: means followed by different letters are significantly different (P B 0.05)a Molecular weight (bp) of the alleles at SSR markers; presence (1) or absence (0) of the band at DArT markers (wPt-)b ‘‘*’’ indicates the most resistant allele
Theor Appl Genet (2013) 126:1237–1256 1247
123

significant differences (Table 6) were further inspected
within subgroups. Markers associated with the main QTLs
for stem rust resistance on chromosomes 1B (barc8), 6A
(CD926040 and barc104) and 7A (wPt-2799) were con-
sidered for the comparison of the allelic phenotypic values
in the entire panel and its subpopulations as these markers
accounted for the largest proportion of phenotypic varia-
tion. Accessions carrying the 255-bp allele at barc8, the
855-bp allele at CD926040, the 202- or 206-bp allele at
barc104 as well as the presence of the band at wPt-2799
had significantly (P B 0.05) lower stem rust infection than
the other accessions across three or more of the five sub-
groups that composed the panel.
The relevance of the QTL-tagging markers significant
over three or four seasons in predicting the accessions’
stem rust response was further investigated by regressing
CI values on the cumulated number of beneficial alleles of
the accessions. The scatter plot thus obtained is reported in
Fig. 2. Although the significance of the linear regression
was high (P B 0.001), the R2 value of the regression was
Table 7 Allele frequency within each of the five germplasm subgroups (S1–S5) for the markers most associated with the QTLs consistently
observed over three to four evaluation seasons
Chromosome Marker Allelea,b Frequency within subgroups
Subgroup 1 (S1)
ICARDA
drylands (11)a
Subgroup 2 (S2)
ICARDA
temperate (55)
Subgroup 3 (S3) Italian
and early 1970
CIMMYT (26)
Subgroup 4 (S4)
late 1970
CIMMYT (56)
Subgroup 5 (S5)
late 1980
CIMMYT (35)
1BS barc8 257 0.00 0.20 0.73 0.12 0.15
255* 1.00 0.80 0.27 0.89 0.85
2AS gwm1045 null 0.20 0.18 0.13 0.10 0.07
180* 0.80 0.79 0.25 0.88 0.93
172 0.00 0.03 0.69 0.02 0.00
2BL wmc356 180* 0.00 0.30 0.00 0.05 0.00
178 1.00 0.62 0.17 0.84 1.00
176 0.00 0.08 0.83 0.11 0.00
3AS wPt-7992 1 0.09 0.33 0.29 0.17 0.06
0* 0.91 0.67 0.71 0.83 0.94
3AL wmc388 250 0.00 0.37 0.65 0.28 0.06
258 0.00 0.43 0.25 0.52 0.25
275* 1.00 0.20 0.10 0.20 0.69
5AL gwm126 Nu11 0.18 0.43 0.20 0.43 0.85
214* 0.82 0.41 0.48 0.48 0.15
208 0.10 0.16 0.32 0.09 0.00
5AL gwm291 166 0.10 0.47 0.13 0.42 0.77
160 0.00 0.39 0.63 0.54 0.20
139* 0.90 0.14 0.24 0.04 0.02
6AL gwm427 212 0.00 0.63 0.87 0.80 0.58
188* 1.00 0.37 0.13 0.20 0.42
6AL CD926040 855* 0.18 0.24 0.08 0.22 0.79
851 0.72 0.44 0.65 0.36 0.12
845 0.10 0.32 0.27 0.42 0.09
6AL barc104 206* 0.33 0.28 0.24 0.20 0.06
202* 0.33 0.24 0.05 0.12 0.84
172 0.33 0.48 0.71 0.67 0.10
7AS wPt-2799 1* 0.30 0.37 0.45 0.25 0.73
0 0.70 0.63 0.55 0.75 0.27
7AS wPt-7785 1 0.50 0.78 0.73 0.80 1.00
0* 0.50 0.22 0.27 0.20 0.00
Least square means reported with bold font refer to the marker-environment pairs showing significant associationsa Molecular weight (bp) of the alleles at SSR markers; presence (1) or absence (0) of the band at DArT markers (wPt-)b ‘‘*’’ indicates the most resistant allele
1248 Theor Appl Genet (2013) 126:1237–1256
123

very low (5.6 %). As expected, the regression coefficient
was negative (b = -1.75). The increase in resistance
associated with the cumulative effects of the beneficial
alleles is also revealed by the comparison between the
response values predicted for zero beneficial alleles
(CI = 48.3) and the maximum number (9) of cumulated
beneficial alleles (CI = 32.5). The significance of the
regression was also tested for the pool of QTL-tagging
markers when considering only the accessions with the
susceptible allele at CD926040, the marker most associated
with the Sr13 region; also in this case the regression on the
number of beneficial alleles was highly significant
(P B 0.001), with the b coefficient and the R2 value equal
to -3.52 and 16.1 %, respectively.
Discussion
A better understanding of the genetic basis underlying the
durum wheat response to Ug99 and durum-specific Ethio-
pian races of stem rust will help enhancing disease resis-
tance of this crop globally, while shedding light on the
evolution of durum wheat-stem rust relationships in East
Africa. To this end, association mapping (AM) is a useful
approach as indicated by the growing interest in its appli-
cation to identify disease-resistance genes/QTLs in a wide
range of crops (Ersoz et al. 2009; Hall et al. 2010; Mac-
caferri et al. 2010).
The AM durum panel evaluated in the present study
encompasses a large portion of the genetic variation pres-
ent in the elite germplasm pools commonly used by durum
breeders. Only very few landraces/pre-Green Revolution
genotypes were kept because of their ‘‘founders’’ role and
significant contribution to the development of some of the
modern germplasm groups. The predominance of elite
germplasm in this panel was justified for several reasons.
First, the presence in the elite germplasm of LD which
extends over rather long distances, as shown in Maccaferri
et al. (2005, 2006, 2011a, b) enabled us to conduct a
genome-wide scan with an average marker density
matching the genotyping capacity allowed by the marker
systems currently available for durum wheat, mainly SSR
and DArT markers (Maccaferri et al. 2003, 2008). Second,
very little information about useful loci for quantitative
stem rust field resistance is available in durum wheat and,
thus, the modern germplasm pool was considered as the
primary target for such investigation. Finally, the high
homogeneity in phenology of the elite materials herein
considered (Maccaferri et al. 2006) as compared to the
higher heterogeneity in phenology observed in other AM
collections, particularly those including landraces (Wang
et al. 2012), allowed for a more meaningful assessments of
the disease responses.
Response of the elite durum wheat germplasm to stem
rust under field conditions
Highly significant genotype 9 season interactions were
detected within the AM panel used in this study. These
interactions were not only due to magnitude effects, since
the stem rust response of some accessions varied from
resistant in one season to clearly susceptible in another
season. This finding was confirmed by the values of cor-
relation coefficients between accession responses in dif-
ferent seasons that even if highly significant were quite low
(r \ 0.58). These interactions could be explained in part by
the different growing conditions prevailing in different
seasons, which are known to affect disease incidence and
intensity. Such inter-season effect on disease intensity is
clearly seen in the increase in average intensity in the
Resistance allele number
Resistance allele number
Coe
ffici
ent o
f inf
ectio
n (C
I)C
oeffi
cien
t of i
nfec
tion
(CI)
Regression equation: CI=48.3 –1.75 x resistance allele number
Regression equation: CI=51.1 –3.52 x resistance allele number
(a) 183 accessions considering all the QTLs significantacross three or four environments
(b) 67 accessions with fixed susceptible allele at Sr13
Fig. 2 Scatterplot of the coefficient of infection values of the elite
accessions of durum wheat on the cumulated number of beneficial
alleles at the QTL-tagging markers significant (P \ 0.05) in three to
four seasons. Results are shown for the stem rust response averaged
over four evaluation seasons of the 183 accessions (a) and of the 67
accessions (b) with the susceptible allele at CD926040, the marker
most tightly associated with the Sr13 region
Theor Appl Genet (2013) 126:1237–1256 1249
123

warmer off-seasons compared to the more temperate con-
ditions during the main-seasons. Most importantly perhaps,
genotype 9 season interactions may have been due to the
use of a mixture of races with different virulence spectra
rather than a single-race. The different races, especially the
least characterized durum-specific ones, may have impac-
ted differently on final reaction in different seasons, due to
different starting relative quantities of inoculum, fitness or
interactions with season-specific environmental and/or
inoculation conditions. However, the use of such a mixture
rather than single race inoculum, while predictably com-
plicating the interpretation of the results, was essential for
this study to address comprehensively stem rust threats that
are relevant to durum wheat breeding under field condi-
tions. The use of Ug99 or its more recent variants alone, all
avirulent on Sr13, would have had limited relevance to
global durum wheat breeding as resistance to them is
present in most germplasm groups worldwide. On the other
hand, the exclusive use of the Ethiopian races, as single
isolates or mixtures, because of their unclear virulence
spectrum, would have likely provided incomplete infor-
mation as to the global usefulness of sources of resistance
or genomic regions involved in controlling such resistance.
Also, the presence of Ug99 in the mixture was important,
since this is the only race that so far has migrated out of
Africa into Asia and could, therefore, become the first
threat to the South Asian durum-growing areas. Whatever
the reason for the highly significant genotype 9 season
interaction, its effects were mitigated and robustness of our
conclusions was supported by the analysis of single-season
data in addition to the results averaged over seasons.
Genotypes were considered resistant or susceptible only
when they performed as such consistently across seasons,
and phenotype-marker associations, as discussed below,
were considered relevant only when they were significant
in at least three of the four seasons.
Nevertheless, clear trends in the distribution of genetic
resistance present in this AM panel were observed and
reliable conclusions could be drawn. First the very low
frequency (5 % of all accessions) of high-level resistance,
expressed as reactions that are consistently close-to-
immune or always below 10 % DSS, supported the con-
clusions from previous studies that elite durum wheat
germplasm is relatively poor in genes with major effects
providing complete field resistance to stem rust (Singh
et al. 1992; Bonman et al. 2007). This also agree with
results from evaluations conducted in Ethiopia at the onset
of the Borlaug Global Rust Initiative in 2007–2008 which
showed only 3 % of resistant lines within the CIMMYT
elite germplasm tested in that year (Ammar and Badebo,
unpublished). This trend seems to extend to wider germ-
plasm groups as shown by Olivera et al. (2010), who
reported 5.2 % of field resistance in a worldwide collection
of 996 durum wheat accessions and other tetraploid rela-
tives under conditions and with races similar to those used
in the present study.
Another interesting reaction group includes genotypes
showing DSS between 10 and 20 %, most with R-MR to
MS type pustules, with a reaction type very similar to that
of local Ethiopian cultivars such as Boohai or Ude, con-
sidered adequately resistant to be competitive in most areas
of Ethiopia. In the present study, 9 % of the genotypes
were consistently classified in this group and, therefore,
could be considered as valuable resistance sources for
breeding programs, possibly providing usable resistance
genes.
In contrast to the low frequency of accessions with high
levels of resistance, a sizeable portion (at least 28 %)
showed a DSS consistently between 30 and 40 %. Such
intermediate, albeit susceptible, values could indicate, if
accompanied by seedling susceptibility to the races inves-
tigated in this study, relatively high frequencies of minor
genes conferring quantitative and partial field resistance to
both Ug99 and the Ethiopian durum races of stem rust. The
accumulation of such genes in a single genotype might
result in durable race non-specific resistance at levels
comparable to that conferred by major gene-based resis-
tance (Skovmand et al. 1978; Lagudah 2011; Singh et al.
2011). Along with this hypothesis, genotypes useful as
sources of minor gene-based resistance to leaf rust have
already been identified in durum wheat (Herrera-Foessel
et al. 2007) and the improvement of resistance through the
cumulation of such genes has been demonstrated (Herrera-
Foessel et al. 2009).
Alternatively, the low rust response observed in some
accessions included in the present study may be due to the
presence and, possibly, cumulation of race-specific seed-
ling genes, which exhibit moderate resistance to moderate
susceptibility at adult plant growth stage.
Genetic basis of the resistance to stem rust in durum
wheat and relevance to breeding
Based on the observation that complete immunity to the
Ethiopian races was seldom observed in the field under
heavy infection conditions, it has been suggested that
resistance in durum wheat elite germplasm was likely to be
based on additivity, i.e. resulting from the cumulative
effect of additive beneficial alleles from multiple loci
(major and minor) of variable effect (Osman Abdallah,
personal communication; Ayele Badebo, personal com-
munication). This hypothesis is clearly supported in the
present study by the fact that improved resistance response
was always associated with several genomic regions (36 in
total), each contributing a small fraction of the variability
associated with field reaction while none of them was
1250 Theor Appl Genet (2013) 126:1237–1256
123
individually capable of providing a high level of resistance.
When estimated in single seasons, each QTL identified in
this study explained not more than 13 % of the phenotypic
variation for stem rust resistance. Even though QTL effects
estimated via AM are usually lower than those estimated
through biparental mapping, due to the higher complexity
of the genetic control in association panels as compared to
biparental populations (Brachi et al. 2011), the fact that
even the most resistant, close-to-immune genotypes did not
owe their resistance to a single major QTL, indicates the
marginal role of classical major genes in determining field
resistance, as often seen in bread wheat.
However, it is also known that most of the seedling
major genes described for stem rust resistance in wheat,
including Sr13 of tetraploid wheat, when evaluated at the
adult plant stage confer medium-resistance to medium-
susceptibility rather than complete resistance/immunity.
Recently, the hypothesis regarding the presence of a
relatively complex control (oligogenic or polygenic) has
been strengthened by the results obtained from the genetic
mapping of the factors responsible for the resistant
response of the ICARDA elite cultivar Sebatel (Haile et al.
2012), also included in this study. The genetic basis of
Sebatel resistance turned out to be oligogenic, with nine
QTLs (including major and minor ones) identified in the
RIL population and R2 values ranging from 5.0 to 34.0 %.
Another aspect that can contribute to explain the dif-
ferent results found between durum and bread wheat is that
the elite breeding germplasm of durum wheat has not been
improved in the past decades by means of an extensive use
of wide-crosses to introgress alleles with strong phenotypic
effects (Maccaferri et al. 2005), as has been the case with
hexaploid wheat.
In the absence of single-race analysis at seedling and
adult stages with a wide collection of races, conclusive
evidence cannot be drawn as to the nature of the resistance
observed in the present study. Nevertheless, this report on
the oligogenic nature and likely minor gene basis of stem
rust resistance in durum wheat has important implications
for breeding activities. It suggests that deploying the
sources identified in this study in a resistance breeding
program would result in an increase of resistance that
would likely be more durable as compared to a monogenic,
major gene resistance. However, unlike the large-effect
QTLs that are easily identified and maintained in breeding
populations through phenotypic selection and can be easily
managed via marker-assisted selection (MAS), the simul-
taneous handling of small-effect QTLs is much more
complex. In fact, an effective phenotypic selection for
small-effect loci requires well-planned populations and
intense, uniform epidemics at every cycle of visual selec-
tion to readily detect and accurately score transgressive
segregants. Under these conditions, the availability of
useful markers reliably tagging the minor QTLs and the
ready access to MAS facility becomes critical. In the near
future, the availability of high-density single nucleotide
polymorphism (SNP) platforms including thousands of
highly multiplexed assays will allow for a nearly complete
genome coverage and the possibility to switch from single-
marker to haplotype-based analyses, thus enabling a full
exploitation of the potential of AM (Akhunov et al. 2009;
Trebbi et al. 2011; You et al. 2011; Kaur et al. 2012; van
Poecke et al. 2012). The use of the same SNP assays in
applied breeding programs will also facilitate the simulta-
neous selection of multiple beneficial alleles for partial
resistance. Thus, MAS strategies that can effectively deal
with a relatively high number of markers and haplotypes
are required to accumulate and maintain the beneficial
alleles at these small-effect QTLs in order to achieve an
acceptable and durable level of resistance for stem rust
within durum breeding populations (Kuchel et al. 2007).
With this aim, recent advances in the implementation of
genomic selection in crop species, in particular to improve
stem rust resistance in hexaploid wheat (Rutkoski et al.
2010), indicate that this could be the most efficient
approach to exploit the potential of high-density molecular
marker screening tools.
QTLs identified through association mapping
and relationship with previously described QTLs
and Sr loci
The joint Q GLM and Q ? K MLM association analyses
highlighted several chromosome regions putatively har-
bouring QTLs with main effects of varying magnitudes on
field stem rust response. As expected, multiple-test cor-
rection drastically reduced the number of significant
regions, a condition not well-suited for an exploratory
analysis like the present one. In addition, our goal was to
keep a reasonable power to identify loci conferring partial
resistance with alleles characterized by relatively small
effects. Therefore, the most significant chromosome
regions based on the less stringent marker-wise signifi-
cance test have also been considered, provided that the
associations were significant on the season average data
and in at least two of the four seasons.
Several QTLs identified in this study co-located with
previously reported major Sr loci as well as with a number
of QTLs recently identified through AM in hexaploid
wheat (Yu et al. 2011) and in tetraploid wheat (Haile et al.
2012). Others, namely those discovered on chromosomes
1A, 1B, 3A, 4A, 4B, 5A, 5B, 7A and 7B were not reported
elsewhere. These results highlight the effectiveness of AM
to dissect and target the genetic basis of moderately com-
plex traits while showing its potential to unveil the pres-
ence of previously unknown QTLs, provided that an
Theor Appl Genet (2013) 126:1237–1256 1251
123

appropriately balanced and phenologically suitable set of
accessions are evaluated.
On chromosome 1A, significant effects were identified
in the distal end and in the short arm near the centromere.
In both cases, significant effects were also reported in
hexaploid and tetraploid wheat, respectively, within 10 cM
distance from the significant markers, with associated R2
values of ca. 5.0 %. Highly significant effects were
detected near to the centromere of chromosome 1B,
between 30 and 40 cM from the top of the chromosome. In
the cultivated hexaploid wheat germplasm, these markers
could either tag Sr14 or Sr31. In several hexaploid wheat
cultivars, chromosome 1BS is known to harbour the 1B�1R
translocated gene Sr31 (Zeller 1973), which is present in
the hexaploid wheat germplasm only, while the centro-
meric region of chromosome 1B is known to harbour Sr14
(McIntosh 1980), which originated from the tetraploid
wheat (Khapli emmer; Heermann and Stoa 1956) and has
been shown to be effective against Ug99 races (Singh et al.
2006). Sr14 should be located on chromosome 1BL very
close to the centromere (McIntosh 1980), a location com-
patible with the mapping position of the significant markers
represented by the QTL-tagging markers barc8 (in close
linkage with gwm1100 and nine DArT markers) and cfd65
(in close linkage with the significant wPt-8168 and
gwm947). Due to the absence of the 1B�1R translocation in
the present durum panel, the effect herein detected is likely
due to Sr14. A recent AM study in a panel of spring
hexaploid wheat (Yu et al. 2011) showed the presence of a
QTL associated with stem rust response precisely in the
same region of chromosome 1BS, near the centromere (wPt
1560 at 8.6 cM and wPt5678 at 33.7 cM). Notably, the
DArT markers identified by Yu et al. (2011) as associated
with stem rust resistance in spring hexaploid wheat were
reported to tag resistance gene loci located on chromosome
1BS instead of 1RS as it would be the case in presence of a
functional Sr31 allele. Moreover, three DArT markers
significantly associated with stem rust response were
reported in the same region by Crossa et al. (2007). The
presence of the Sr14 resistance allele in durum wheat
germplasm can be traced back to Triticum dicoccum Sch-
rank accessions such as Khapli emmer, which is known to
carry Sr14 and is also considered as one of the few foun-
ders of modern durum wheat germplasm (Autrique et al.
1996). Sr14 has been considered as one of the causes of
stem rust resistance in some synthetic wheat-derived lines
(Njau et al. 2010).
Additional overlap with a minor QTL for stem rust
resistance in durum wheat described by Haile et al. (2012)
occurred on chromosome arm 2AS.
On chromosome arm 2BL, gwm1300 and wmc356
(50.9 cM apart) were significantly associated with stem
rust resistance for two and three seasons, respectively.
These markers mapped in regions corresponding to the
putative locations of Sr9/SrWeb and Sr28/Sr16, respec-
tively. At the Sr9 region, two alleles are known: Sr9e
which was reported to be ineffective against Ug99 at the
seedling stage while showing MR to MS infection types in
the field nurseries (Jin et al. 2007) and Sr9g, which pro-
vides field resistance to Ug99 and to the Ethiopian races.
Sr9e is present in many durum wheat genotypes, including
the CIMMYT landmark Yavaros C79 and its sister line
Karim 80, which in the present study were classified as
moderately resistant to moderately susceptible. Sr9g is one
of the resistance alleles reported to be present in the durum
cultivar Iumillo (McIntosh et al. 1995).
Several regions with significant associations to field
reaction to stem rust were detected on chromosome 3A
where Sr27 and Sr35, both effective against Ug99, have
been reported (McIntosh et al. 1995; Singh et al. 2006).
However, as Sr27 originated from a wheat-rye transloca-
tion engineered exclusively in bread wheat and Sr35 from
Triticum monococcum, transferred to some tetraploids of
Canadian origin, none of which was present in this study or
in the pedigree of the accessions of the AM panel, the
chromosome 3A related associations detected herein are
likely to involve novel loci or alleles.
The distal region of chromosome 3BS is known to
harbour Sr2, a gene that confers effective partial resistance
to Ug99 at the adult plant stage (Mago et al. 2011b). In
hexaploid wheat, the beneficial Sr2 allele is actively
selected by MAS (Mago et al. 2011a). Although the
effective alleles originates from the tetraploid wheat
germplasm (Yaroslav emmer), Sr2 was not detected as a
locus relevant for stem rust response in the durum elite
germplasm considered in this study. Nevertheless, Sr2 has
been reported as the major component of resistance in the
durum RIL population developed from the Seba-
tel 9 Kristal (R2 = 34.0 %, Haile et al. 2012). The SSR
markers used to characterize the Sr2-associated haplotype
(gwm533 and barc133) showed that this haplotype was rare
in the sample of elite durum wheat accessions herein
considered and the corresponding marker alleles were,
therefore, not considered for the association test. This
observation can be considered as an instructive example
regarding one of the limitations of association mapping
versus the use of specifically developed mapping
populations.
On chromosome 6A, AM highlighted six QTLs with
significant effects on field stem rust reaction. One of these
regions (approximately 8 cM wide) tagged by wPt-7330, in
the distal portion of chromosome arm 6AS colocates with
the region known to harbour Sr8, a gene known to be
ineffective against Ug99 (Singh et al. 2006). Interestingly,
this region completely overlapped with a QTL for stem rust
resistance recently reported in an AM study in hexaploid
1252 Theor Appl Genet (2013) 126:1237–1256
123

wheat (Yu et al. 2011). A wide region on chromosome arm
6AL, about 40 cM wide, plays a major role in controlling
stem rust response in the durum wheat germplasm tested
herein. This region in our association mapping panel
includes two distinct sub-regions harbouring effective but
most probably distinct genes, including Sr13.
The first, proximal sub-region, tagged by tPt-4209,
gwm1150 and gwm169 and associated with stem rust
resistance in this study, colocates with Sr26, a gene
effective against Ug99 (Singh et al. 2006) and the Ethio-
pian races (Ayele and Ammar, unpublished results).
However, the presence of the known Sr26 allele in the AM
panel or in the durum wheat germplasm at large is unlikely,
since the Sr26-resistant allele has been introgressed from
the wild relative Thinopyrum ponticum exclusively into
bread wheat. A gene/allelic variant other than Sr26 should
be located in this sub-region. This QTL region has been
independently confirmed in the Sebatel 9 Kristal durum
population and reported as QSr.IPK-6A (Haile et al. 2012),
a QTL with R2 value equal to 9.3 % and tagged by the SSR
markers gwm494-gwm1150.
The second, distal sub-region of chromosome 6AL
includes three further sub-regions (tagged by gwm427,
CD926040 and barc104) strongly associated with stem rust
response. These sub-regions colocate with Sr13, which has
been mapped in tetraploid wheat to chromosome 6AL
within a 1.2–2.8 cM interval, flanked by the EST-derived
markers CD926040 and BE471213 (Simons et al. 2011). In
our study, CD926040 showed the maximum R2 value and
was consistently significant across all four seasons. Sr13 is
effective against the TTKS complex of Puccinia graminis
ssp. tritici, namely TTKSK (Ug99), TTKST and TTTSK.
However, virulence for Sr13 within Ethiopian stem rust
populations has been suspected for some time, and recently
confirmed by the characterization of the TRTTF and
JRCQC isolates collected from the Ethiopian site in Debre
Zeit (Olivera et al. 2010, 2012). Therefore, while very
effective against the TTKSK or Ug99 lineage—the only
ones so far to have migrated out of Africa, its presence alone
is not sufficient for adequate protection in Ethiopia. This is
clearly seen when comparing the field reaction and the long-
range haplotype in the extended Sr13 chromosome region
of two US desert-durum cultivars, namely Kronos and Kofa,
which were considered in the present study. While both
cultivars exhibited the haplotype of Khapli Emmer, known
to carry Sr13 (Knott 1962), Kronos had one of the most
consistently resistant reactions over seasons while Kofa was
regularly susceptible. Taking into account all of the above
information, the presence of the resistant allele(s) in the
Sr13 region is valuable for breeding activities and should be
pursued for pyramiding multiple useful alleles.
Specifically for the Sr13 locus, Simons et al. (2011)
found different linked marker alleles among the Sr13
donors, suggesting that breeding programs used different
sources of Sr13 or that independent recombination events
occurred between loci. In our study, the durum wheat
accessions Khapli, Kofa and Kronos were the donors of
resistant Sr13 alleles (Simons et al. 2011). The LD decay
among the three main linkage blocks (tagged by gwm427-
wmc580, CD926040 and barc104) near Sr13 and the var-
iation in band sizes of the marker alleles indicate that the
current markers are not fully diagnostic in a wide range of
backgrounds and, therefore, cannot be used to predict with
high confidence the presence of Sr13 in unknown sets of
germplasm. This notwithstanding, these markers can be
used to follow the Sr13 resistant alleles in segregating
populations involving parental lines (e.g. Khapli, Kofa and
Kronos) related to any of the known Sr13 sources. The
future availability of high-density, SNP platforms (Trebbi
et al. 2011; van Poecke et al. 2012) will likely provide
much better haplotype resolution.
The significant effects identified in chromosome arms
6BS, 7AS and 7BS are specific to the durum germplasm
considered here. They have not been reported as QTL loca-
tions in bread wheat nor in the Sebatel 9 Kristal population.
On the distal portion of chromosome 7AL, DArT
markers with significant effects on stem rust resistance in
our study overlapped with the locations of Sr22 and
QSr.ipk-7AL (Haile et al. 2012), providing independent
evidence for the relevance of this chromosome region for
stem rust response. Finally, AM detected QTLs at the distal
end of chromosome arm 7BL (QTL-tagging marker wPt-
8615), with several DArT markers associated with stem rust
resistance. This region colocates with that known to harbour
Sr17, a gene linked to Lr14a and Pm5 in bread wheat
(Crossa et al. 2007). It also is consistent with a region
reported to include a stem rust QTL in the Arina 9 Forno
RIL population (Bansal et al. 2008). Sr17-related resistance
to stem rust has been reported in tetraploid wheat or syn-
thetic bread wheat (Bansal et al. 2008). Consistent with this,
in the present study, there was no relationship, either in
coupling or repulsion, between stem rust resistance and the
presence of Lr14a (known from previous studies on the
same panel). This may indicate that the two genes are far
enough apart that no linkage was detected.
Based on the results herein presented, it is clear that
quantitative, additive variation is present in the elite
germplasm at chromosome regions known to carry well-
characterized resistance genes (Sr14, Sr28-Sr16, Sr8 and
particularly Sr13) whose alleles are tagged by known
molecular markers and are known to be frequently defeated
by specific races or non-effective at seedling stage.
Although further work would be required to confirm the
presence of known alleles of these genes, our results may
reflect appreciable residual quantitative and additive effects
of seedling resistance genes at the adult, open field stage.
Theor Appl Genet (2013) 126:1237–1256 1253
123

The low rust response phenotypes observed in the present
study seem to be due to the presence of combinations of
resistance genes including previously designated genes and
novel genes/QTLs.
Implications for marker-assisted breeding
Association mapping in elite germplasm has the potential to
accelerate the translation of basic genetic information
towards applications in crop improvement and cultivar
release. Our study shows that AM effectively complement
bi-parental mapping studies by providing independent vali-
dation of previously detected QTLs and discovering new
QTLs. In addition, our study highlighted the presence of
valuable genetic variation that could be exploited to sus-
tainably enhance stem rust resistance in durum wheat. This
study clearly documented the oligogenic or minor gene-
based nature of resistance to Ug99 and the Ethiopian races of
stem rust in durum wheat. Several chromosome regions
harbouring putative QTLs involved in the stem rust response
in the field under high infection rate were consistently
detected across seasons; the allelic variation at these QTLs
can be exploited for further validation studies and utilization
in MAS programs. The AM results reported herein confirm
the important role of the Sr13 region, but also its limitation in
individually addressing the presence of the Ethiopian races.
Our analysis also highlighted the role of chromosome regions
putatively harbouring Sr14, Sr9 and Sr17, to be further dis-
sected as providing alleles with beneficial effects on final
resistance, but again not sufficiently strong individually. In
addition, the AM analysis strengthens the role of five QTLs
recently described in the Sebatel 9 Kristal durum mapping
population and located in chromosome regions where no
designated resistance genes were mapped. Novel regions,
previously not reported to be associated with stem rust
resistance either in durum or bread wheat, have been detec-
ted. These regions contribute minor genes that can be
cumulated through either traditional cycles of recurrent
selection or MAS using markers in classical cross and
backcross schemes or by means of a more comprehensive
genomic selection approach towards the release of durum
wheat cultivars with a more durable resistance to stem rust.
Acknowledgments The financial contribution of the Beachell-
Borlaug International Scholar Initiative to support Tesfaye L. Dugo is
gratefully acknowledged.
References
Admassu B, Lind V, Friedt W, Ordon F (2009) Virulence analysis of
Puccinia graminis f. sp. tritici populations in Ethiopia with
special consideration of Ug99. Plant Pathol 58:362–369
Akbari M, Wenzl P, Caig V, Carling J, Xia L, Yang S, Uszynski G,
Mohler V, Lehmensiek A, Kuchel H, Hayden MJ, Howes N,
Sharp P, Vaughan P, Rathmell B, Huttner E, Kilian A (2006)
Diversity arrays technology (DArT) for high-throughput profil-
ing of the hexaploid wheat genome. Theor Appl Genet 113:
1409–1420
Akhunov E, Nicolet C, Dvorak J (2009) Single nucleotide polymor-
phism genotyping in polyploid wheat with the Illumina Gold-
enGate assay. Theor Appl Genet 119:507–517
Autrique E, Nachit MM, Monneveux P, Tanksley SD, Sorrells ME
(1996) Genetic diversity in durum wheat based on RFLPs,
morphophysiological traits, and coefficient of parentage. Crop
Sci 36:735–742
Badebo A, Gelalcha S, Ammar K, Nachit MM, Abdalla O (2009)
Durum wheat research in Ethiopia. In: Proceedings of the 2009
BGRI technical workshop, CIMMYT, Cd. Obregon, Sonora,
Mexico, March 17–20, 2009. P 28
Bansal UK, Bossolini E, Miah H, Keller B, Park RF, Bariana HS
(2008) Genetic mapping of seedling and adult plant stem rust
resistance in two European winter wheat cultivars. Euphytica
164:821–828
Belaid A (2000) Durum wheat in WANA (West Asia and North
Africa): production, trade, and gains from technological change.
In: Royo C, Nachit MM, Di Fonzo N, Araus JL (eds) Durum
wheat improvement in the Mediterranean region: new chal-
lenges, vol 40., Options MediterraneennesCIHEAM-IAMZ,
Zaragoza, pp 35–39
Bonman JM, Bockelman HE, Jin Y, Hijmans RJ, Gironella AIN
(2007) Geographic distribution of stem rust resistance in wheat
landraces. Crop Sci 47:1955–1963
Brachi B, Morris GP, Borevitz JO (2011) Genome-wide association
studies in plants: the missing heritability is in the field. Genome
Biol 12:232
Bradbury PJ, Zhang Z, Kroon DE, Casstevens TM, Ramdoss Y,
Buckler ES (2007) TASSEL: software for association mapping
of complex traits in diverse samples. Bioinformatics 23:
2633–2635
Bradbury P, Parker T, Hamblin MT, Jannink JL (2011) Assessment of
power and false discovery rate in genome-wide association
studies using the BarleyCAP germplasm. Crop Sci 51:52–59
Breseghello F, Sorrells ME (2006) Association mapping of kernel
size and milling quality in wheat (Triticum aestivum L.)
cultivars. Genetics 172:1165–1177
Buntjer JB, Sorensen AP, Peleman JD (2005) Haplotype diversity: the
link between statistical and biological association. Trends Plant
Sci 10:466–471
Ceoloni C, Forte P, Gennaro A, Micali S, Carozza R, Bitti A (2005)
Recent developments in durum wheat chromosome engineering.
Cytogenet Genome Res 109:328–334
Crossa J, Burgueno J, Dreisigacker S, Vargas M, Herrera-Foessel SA,
Lillemo M, Singh RP, Trethowan R, Warburton M, Franco J,
Reynolds M, Crouch JH, Ortiz R (2007) Association analysis of
historical bread wheat germplasm using additive genetic covari-
ance of relatives and population structure. Genetics 177:
1889–1913
de Givry S, Bouchez M, Chabrier P, Milan D, Schiex T (2005)
CAR(H)(T)AGene: multipopulation integrated genetic and radi-
ation hybrid mapping. Bioinformatics 21:1703–1704
Ersoz ES, Yu J, Buckler ES (2009) Application of linkage disequi-
librium and association mapping in maize. In: Kriz A, Larkins B
(eds) Molecular genetic approaches to maize improvement.
Springer, Berlin, pp 173–195
Eversmeyer MG, Kramer CL (2000) Epidemiology of wheat leaf and
stem rust in the central Great Plains of the USA. Annu Rev
Phytopathol 38:491–513
1254 Theor Appl Genet (2013) 126:1237–1256
123

Feuillet C, Langridge P, Waugh R (2008) Cereal breeding takes a
walk on the wild side. Trends Genet 24:24–32
Flint-Garcia SA, Thornsberry JM, Buckler ES (2003) Structure of
linkage disequilibrium in plants. Annu Rev Plant Biol 54:
357–374
Gupta PK, Varshney RK, Sharma PC, Ramesh B (1999) Molecular
markers and their applications in wheat breeding. Plant Breed
118:369–390
Gupta PK, Rustgi S, Kulwal PL (2005) Linkage disequilibrium and
association studies in higher plants: present status and future
prospects. Plant Mol Biol 57:461–485
Habash DZ, Kehel Z, Nachit M (2009) Genomic approaches for
designing durum wheat ready for climate change with a focus on
drought. J Exp Bot 60:2805–2815
Haile JK, Nachit MM, Hammer K, Badebo A, Roder MS (2012) QTL
mapping of resistance to race Ug99 of Puccinia graminis f. sp.
tritici in durum wheat (Triticum durum Desf.). Mol Breed
30:1479–1493
Hall D, Tegstrom C, Ingvarsson PK (2010) Using association
mapping to dissect the genetic basis of complex traits in plants.
Brief Funct Genomics 9:157–165
Heermann RM, Stoa TE (1956) New durum wheats resistant to 15B.
N Dakota Agric Exp Stn Farm Res 18:75–81
Herrera-Foessel SA, Singh RP, Huerta-Espino J, Crossa J, Djurle A,
Yue J (2007) Evaluation of slow rusting resistance components
to leaf rust in CIMMYT durum wheats. Euphytica 155:361–369
Herrera-Foessel SA, Singh RP, Huerta-Espino J, Ammar K (2009)
Pyramiding slow rusting genes for durable resistance to leaf rust
in durum wheat. In: Proceedings of the 2009 BGRI Technical
Workshop, CIMMYT, Cd. Obregon, Sonora, Mexico, March
17–20, 2009
Jin Y, Singh RP, Ward RW, Wanyera R, Kinyua M, Njau P, Pretorius
ZA (2007) Characterization of seedling infection types and adult
plant infection responses of monogenic Sr gene lines to race
TTKS of Puccinia graminis f. sp tritici. Plant Dis 91:1096–1099
Jin Y, Szabo LJ, Pretorius ZA, Singh RP, Ward R, Fetch T Jr (2008)
Detection of virulence to resistance gene Sr24 within race TTKS
of Puccinia graminis f. sp. tritici. Plant Dis 92:923–926
Jin Y, Szabo L, Rouse M, Fetch T Jr, Pretorius ZA, Wanyera R, Njau
P (2009) Detection of virulence to resistance gene Sr36 within
race TTKS lineage of Puccinia graminis f. sp. tritici. Plant Dis
93:367–370
Kaur S, Francki MG, Forster JW (2012) Identification, characteriza-
tion and interpretation of single-nucleotide sequence variation in
allopolyploid crop species. Plant Biotechnol J 10:125–138
Knott DR (1962) The inheritance of resistance to races 15B and 56 of
stem rust in the wheat variety Khapstein. Can J Agric Sci
42:415–419
Kuchel H, Langridge P, Eagles HA, Jefferies SP (2007) Genetic
dissection of grain yield in bread wheat I. QTL analysis. Theor
Appl Genet 115:1029–1041
Lagudah ES (2011) Molecular genetics of race non-specific rust
resistance in wheat. Euphytica 179:81–91
Maccaferri M, Sanguineti MC, Donini P, Tuberosa R (2003)
Microsatellite analysis reveals a progressive widening of the
genetic basis in the elite durum wheat germplasm. Theor Appl
Genet 107:783–797
Maccaferri M, Sanguineti MC, Noli E, Tuberosa R (2005) Population
structure and long-range linkage disequilibrium in a durum
wheat elite collection. Mol Breed 15:271–289
Maccaferri M, Sanguineti MC, Natoli V, Ortega JLA, Ben Salem M,
Bort J, Chenenaoui C, De Ambrogio E, del Moral LG, De Montis
A, El-Ahmed A, Maalouf F, Machlab H, Moragues M, Motawaj
J, Nachit M, Nserallah N, Ouabbou H, Royo C, Tuberosa R
(2006) A panel of elite accessions of durum wheat (Triticum
durum Desf.) suitable for association mapping studies. Plant Gen
Res 4:79–85
Maccaferri M, Sanguineti MC, Corneti S, Ortega JLA, Ben Salem M,
Bort J, DeAmbrogio E, del Moral LFG, Demontis A, El-Ahmed
A, Maalouf F, Machlab H, Martos V, Moragues M, Motawaj J,
Nachit M, Nserallah N, Ouabbou H, Royo C, Slama A, Tuberosa
R (2008) Quantitative trait loci for grain yield and adaptation of
durum wheat (Triticum durum Desf.) across a wide range of
water availability. Genetics 178:489–511
Maccaferri M, Sanguineti MC, Mantovani P, Demontis A, Massi A,
Ammar K, Kolmer J, Czembor J, Ezrati S, Tuberosa R (2010)
Association mapping of leaf rust response in durum wheat. Mol
Breed 26:189–228
Maccaferri M, Sanguineti MC, del Moral LFG, Demontis A,
El-Ahmed A, Maalouf F, Machlab H, Martos V, Moragues M,
Motawaj J, Nachit M, Nserallah N, Ouabbou H, Royo C, Slama
A, Tuberosa R (2011a) Association mapping in durum wheat
grown across a broad range of water regimes and yield potential.
J Exp Bot 62:409–438
Maccaferri M, Ratti C, Rubies-Autonell C, Vallega V, Demontis A,
Stefanelli S, Tuberosa R, Sanguineti MC (2011b) Resistance to
Soil-borne cereal mosaic virus in durum wheat is controlled by a
major QTL on chromosome arm 2BS and minor loci. Theor Appl
Genet 123:527–544
Mago R, Lawrence GJ, Ellis JG (2011a) The application of DNA
marker and doubled-haploid technology for stacking multiple
stem rust resistance genes in wheat. Mol Breed 27:329–335
Mago R, Tabe L, McIntosh RA, Pretorius Z, Kota R, Paux E, Wicker
T, Breen J, Lagudah ES, Ellis JG, Spielmeyer W (2011b) A
multiple resistance locus on chromosome arm 3BS in wheat
confers resistance to stem rust (Sr2), leaf rust (Lr27) and
powdery mildew. Theor Appl Genet 123:615–623
Mantovani P, Maccaferri M, Sanguineti MC, Tuberosa R, Catizone I,
Wenzl P, Thomson B, Carling J, Eric H, De-Ambrogio E, Kilian
A (2008) An integrated DArT-SSR linkage map of durum wheat.
Mol Breed 22:629–648
Massman J, Cooper B, Horsley R, Neate S, Dill-Macky R, Chao S,
Dong Y, Schwarz P, Muehlbauer GJ, Smith KP (2011) Genome
wide association mapping of fusarium head blight resistance in
contempary barely breeding germplasm. Mol Breed 27:439–454
McIntosh RA (1980) Chromosome location and linkage studies
involving the wheat stem rust resistance gene Sr14. Cereal Res
Comm 8:315–320
McIntosh RA, Brown GN (1997) Anticipatory breeding for resistance
to rust diseases in wheat. Annu Rev Phytol 35:311–326
McIntosh RA, Wellings CR, Park RF (1995) Wheat rusts: an atlas of
resistance genes. CSIRO, Canberra
Miedaner T, Wurschum T, Maurer HP, Korzun V, Ebmeyer E, Reif
JC (2011) Association mapping for Fusarium head blight
resistance in European soft winter wheat. Mol Breed 28:647–655
Myles S, Peiffer J, Brown PJ, Ersoz ES, Zhang ZW, Costich DE,
Buckler ES (2009) Association mapping: critical considerations
shift from genotyping to experimental design. Plant Cell
21:2194–2202
Nazari K, Mafi M, Yahyaoui A, Singh RP, Park RF (2009) Detection
of wheat stem rust (Puccinia graminis f. sp. tritici) race TTKSK
(Ug99) in Iran. Plant Dis 93:317
Njau PN, Jin Y, Huerta-Espino J, Keller B, Singh RP (2010)
Identification and evaluation of sources of resistance to stem rust
race Ug99 in wheat. Plant Dis 94:413–419
Olivera PD, Jin Y, Badebo A, Singh D (2010) Races of Pucciniagraminis f.sp. tritici with virulence on Sr13 and Sr9e in durum
screening nursery in Ethiopia. In: McIntosh R, Pretorious Z (eds)
Proceedings of BGRI 2010 technical workshop, St Petersburg,
Russia, May 30–31, pp 7-8
Theor Appl Genet (2013) 126:1237–1256 1255
123

Olivera PD, Jin Y, Rouse M, Badebo A, Fetch T, Singh RP, Yahyaoui
A (2012) Races of Puccinia graminis f. sp. tritici with combined
virulence to Sr13 and Sr9e in a field stem rust screening nursery
in Ethiopia. Plant Dis 96:623–628
Peterson RF, Campbell AB, Hannah AE (1948) A diagrammatic scale
for estimating rust intensity of leaves and stem of cereals. Can J
Res Sect C 26:496–500
Pretorius ZA, Singh RP, Wagoire WW, Payne TS (2000) Detection of
virulence to wheat stem rust resistance gene Sr31 in Pucciniagraminis f. sp. tritici in Uganda. Plant Dis 84:203
Pritchard JK, Stephens M, Donnelly P (2000) Inference of population
structure using multilocus genotype data. Genetics 155:945–959
Rafalski JA (2002) Novel genetic mapping tools in plants: SNPs and
LD-based approaches. Plant Sci 162:329–333
Rafalski JA (2011) Genomic tools for the analysis of genetic
diversity. Plant Genetic Resour Charact Util 9:159–162
Roelfs AP, Singh RP, Saari EE (1992) Rust diseases of wheat: concepts
and methods of disease management. CIMMYT, Mexico
Rutkoski JE, Heffner EL, Sorrells ME (2010) Genomic selection for
durable stem rust resistance in wheat. Euphytica 179:161–173
Schuelke M (2000) An economic method for the fluorescent labelling
of PCR fragments. Nat Biotechnol 18:233–234
Simons K, Abate Z, Chao S, Zhang W, Rouse M, Jin Y, Elias E,
Dubcovsky J (2011) Genetic mapping of stem rust resistance
gene Sr13 in tetraploid wheat (Triticum turgidum ssp. durum L.).
Theor Appl Genet 122:649–658
Singh RP, Bechere E, Abdalla O (1992) Genetic analysis of resistance
to stem rust in 10 durum wheats. Phytopathology 82:919–922
Singh RP, Huerta-Espino J, Fuentes G, Duveiller E, Gilchrist L,
Henry M, Nicol MJ (2005) Resistance to diseases. In: Royo C,
Nachit MM, Di Fonzo N, Araus JL, Pfeiffer WH, Slafer GA
(eds) Durum wheat breeding: current approaches and future
strategies. Food Product Press, Binghamton, pp 291–315
Singh RP, Hodson DP, Jin Y, Huerta-Espino J, Kinyua MG, Wanyera
R, Njau P, Ward RW (2006) Current status, likely migration and
strategies to mitigate the threat to wheat production from race
Ug99 (TTKS) of stem rust pathogen. In: CAB reviews:
perspectives in agriculture, veterinary science, nutrition and
natural resources. 1, No. 054
Singh D, Girma B, Njau P, Wanyera R, Badebo A, Bhavani S, Singh
RP, Huerta-Espino J, Woldeab G, Ward R (2009) Screening for
stem rust resistance in East Africa. In: Proceedings of the 2009
BGRI Technical Workshop, CIMMYT, Cd. Obregon, Sonora,
Mexico, March 17–20, 2009, pp 33–38
Singh RP, Hadson DP, Huerta-Espino J, Jin Y, Bhavani S, Njau P,
Herrera-Foessel S, Singh PK, Singh S, Govindan V (2011) The
emergence of Ug99 races of the stem rust fungus is a threat to
world wheat production. Annu Rev Phytopathol 49:465–481
Skovmand B, Wilcoxson RD, Shearer BL, Stucker RE (1978)
Inheritance of slow rusting to stem rust in wheat. Euphytica
27:95–107
Stich B, Melchinger AE, Frisch M, Maurer HP, Heckenberger M,
Reif JC (2005) Linkage disequilibrium in European elite maize
germplasm investigated with SSRs. Theor Appl Genet 111:
723–730
Storey JD, Tibshirani R (2003) Statistical significance for genome
wide studies. Proc Natl Acad Sci USA 100:9440–9445
Stubbs RW, Prescott JM, Saari EE, Dubin HJ (1986) Cereal disease
methodology manual. CIMMYT, Mexico, pp 45–46
Thornsberry JM, Goodman MM, Doebley J, Kresovich S, Nielsen D,
Buckler ES IV (2001) Dwarf8 polymorphisms associate with
variation in flowering time. Nat Genet 28:286–289
Tommasini L, Schnurbusch T, Fossati D, Mascher F, Keller B (2007)
Association mapping of Stagonospora nodorum blotch resistance
in modern European winter wheat varieties. Theor Appl Genet
115:697–708
Trebbi D, Maccaferri M, de Heer P, Sorensen A, Giuliani S, Salvi S,
Sanguineti MC, Massi A, van der Vossen EAG, Tuberosa R
(2011) High-throughput SNP discovery and genotyping in durum
wheat (Triticum durum Desf.). Theor Appl Genet 123:555–569
van Poecke RMP, Maccaferri M, Tang J, Truong HT, Janssen A, van
Orsouw NJ, Salvi S, Sanguineti MC, Tuberosa R, van der
Vossen EAG (2012) Sequence-based SNP genotyping in durum
wheat. Plant Biotechnol J (accepted)
Vavilov NI (1929) Wheat of Ethiopia. Bull Appl Bot Genetics Plant
Breed 20:224–356
Vavilov NI (1951) The origin, variation, immunity and breeding of
cultivated plants. Chron Bot 13:1–36
Wang M, Jiang N, Jia T, Leach L, Cockram J, Comadran J, Shaw P,
Waugh R, Luo Z (2012) Genome-wide association mapping of
agronomic and morphologic traits in highly structured popula-
tions of barley cultivars. Theor Appl Genet 124:233–246
Wanyera R, Kinyua MG, Jin Y, Singh R (2006) The spread of stem
rust caused by Puccinia graminis f. sp. tritici, with virulence on
Sr31 in wheat in Eastern Africa. Plant Dis 90:113
You FM, Huo NX, Deal KR, Gu YQ, Luo MC, McGuire PE, Dvorak
J, Anderson OD (2011) Annotation-based genome-wide SNP
discovery in the large and complex Aegilops tauschii genome
using next-generation sequencing without a reference genome
sequence. BMC Genomics. doi:10.1186/1471-2164-12-59
Yu JM, Pressoir G, Briggs WH, Bi IV, Yamasaki M, Doebley JF,
McMullen MD, Gaut BS, Nielsen DM, Holland JB, Kresovich S,
Buckler ES (2006) A unified mixed-model method for associ-
ation mapping that accounts for multiple levels of relatedness.
Nat Genet 38:203–208
Yu L-X, Liu S, Anderson JA, Singh RP, Jin Y, Dubcovsky J, Brown
Guidera G, Bhavani S, Morgounov A, He Z, Huerta-Espino J,
Sorrells ME (2010) Haplotype diversity of stem rust resistance
loci in uncharacterized wheat lines. Mol Breed 26:667–680
Yu L-X, Lorenz A, Rutkoski J, Singh RP, Bhavani S, Huerta-Espino
J, Sorrells ME (2011) Association mapping and gene–gene
interaction for stem rust resistance in CIMMYT spring whear
germplasm. Theor Appl Genet 123:1257–1268
Zadoks JC, Chang TT, Konzak CF (1974) A decimal code for the
growth stages of cereals. Weed Res 14:415–421
Zeller FJ (1973) 1B/1R wheat-rye chromosome substitutions and
translocations. In: Sears ER, Sears LMS (eds) Proc 4 Int Wheat
Genetics Symposium. Columbia, Missouri, pp 209–221
Zhang W, Chao S, Manthey F, Chicaiza O, Brevis JC, Echenique V,
Dubcovsky J (2008) QTL analysis of pasta quality using a
composite microsatellite and SNP map of durum wheat. Theor
Appl Genet 117:1361–1377
Zhu C, Gore M, Buckler ES, Yu J (2008) Status and prospects of
association mapping in plants. Plant Genome 1:5–20
Zwer PK, Park RF, McIntosh RA (1992) Wheat-Stem rust in
Australia-1969-1985. Aust J Agric Res 43:399–432
1256 Theor Appl Genet (2013) 126:1237–1256
123