Association Analysis Identifies Melampsora6columbianaPoplar Leaf Rust Resistance SNPsJonathan La Mantia1, Jaroslav Klapste1,5, Yousry A. El-Kassaby1, Shofiul Azam1, Robert D. Guy1,
Carl J. Douglas2, Shawn D. Mansfield3, Richard Hamelin1,4*
1 Department of Forest and Conservation Sciences, University of British Columbia, Vancouver, British Columbia, Canada, 2 Department of Botany, University of British
Columbia, Vancouver, British Columbia, Canada, 3 Department of Wood Science, University of British Columbia, Vancouver, British Columbia, Canada, 4 Natural Resources
Canada, Laurentian Forestry Center, Quebec, Canada, 5 Department of Dendrology and Forest Tree Breeding, Faculty of Forestry and Wood Sciences, Czech University of
Life Sciences Prague, Kamycka, Czech Republic
Abstract
Populus species are currently being domesticated through intensive time- and resource-dependent programs for utilizationin phytoremediation, wood and paper products, and conversion to biofuels. Poplar leaf rust disease can greatly reducewood volume. Genetic resistance is effective in reducing economic losses but major resistance loci have been race-specificand can be readily defeated by the pathogen. Developing durable disease resistance requires the identification of non-race-specific loci. In the presented study, area under the disease progress curve was calculated from natural infection ofMelampsora 6columbiana in three consecutive years. Association analysis was performed using 412 P. trichocarpa clonesgenotyped with 29,355 SNPs covering 3,543 genes. We found 40 SNPs within 26 unique genes significantly associated(permutated P,0.05) with poplar rust severity. Moreover, two SNPs were repeated in all three years suggesting non-race-specificity and three additional SNPs were differentially expressed in other poplar rust interactions. These five SNPs werefound in genes that have orthologs in Arabidopsis with functionality in pathogen induced transcriptome reprogramming,Ca2+/calmodulin and salicylic acid signaling, and tolerance to reactive oxygen species. The additive effect of non-R genefunctional variants may constitute high levels of durable poplar leaf rust resistance. Therefore, these findings are ofsignificance for speeding the genetic improvement of this long-lived, economically important organism.
Citation: La Mantia J, Klapste J, El-Kassaby YA, Azam S, Guy RD, et al. (2013) Association Analysis Identifies Melampsora 6columbiana Poplar Leaf Rust ResistanceSNPs. PLoS ONE 8(11): e78423. doi:10.1371/journal.pone.0078423
Editor: Ivan Baxter, United States Department of Agriculture, Agricultural Research Service, United States of America
Received May 9, 2013; Accepted September 19, 2013; Published November 13, 2013
Copyright: � 2013 La Mantia et al. This is an open-access article distributed under the terms of the Creative Commons Attribution License, which permitsunrestricted use, distribution, and reproduction in any medium, provided the original author and source are credited.
Funding: This work was supported by Genome British Columbia (103BIO) Applied Genomics Innovation Program and Genome Canada (168BIO) Large ScaleApplied Research Project funding. The funders had no role in study design, data collection and analysis, decision to publish, or preparation of the manuscript.
Competing Interests: The authors declare that no competing interests exist.
* E-mail: [email protected]
Introduction
Rust fungi cause some of the most important crop and tree
diseases worldwide. In Populus species (poplar trees), leaf rust
disease is caused by several species of Melampsora. Severe poplar
leaf rust infections decrease photosynthetic capacity, reduce
biomass, and increase susceptibility to additional pathogens [1].
Reductions in dry weight and fiber volume of P. deltoides x P.
balsamifera ‘Northwest’, have been estimated at 57% and 65%,
respectively [2]. In North America, hybridization of rust species,
M. occidentalis and M. medusae, has produced a new rust pathogen,
M. 6columbiana. This hybrid rust has demonstrated high patho-
genic diversity. In an initial collection 13 pathotypes (race with
unique virulence to specific hosts) were identified. Furthermore,
host resistance loci to pathotypes Mxc3 and Mxc4 map to unique
chromosomes in poplar and are race-specific [3,4].
Rust virulence and poplar resistance interact in a classical gene-
for-gene model, where host R gene recognition of a pathogen
avirulence gene is necessary for resistance [5].The pathogenic
diversity of Melampsora is facilitated by obligate sexual reproduction
on alternative hosts (Larix species) during winter and migration of
wind-dispersed spores. Previous studies of M. medusae populations
suggest that inoculum source and genetic composition vary from
year to year outside the range of alternative host sympatry [6].
This is also evident in M. 6columbiana populations in the coastal
Pacific Northwest, where Larix spp. are not native and rust
pathotypes varied across years at single locations [4].
Poplar leaf rust resistance has been extensively studied using the
European counterpart, M. larici-populina [7–11]. Bi-parental
linkage mapping has identified major resistance loci that map to
nucleotide binding site – leucine rich repeat (NBS-LRR) R genes
on chromosome 19 [7–9,11]. During the mid-1990s, P. trichocarpa
6 P. deltoides ‘Beaupre’ was bred for rust resistance and then
exclusively planted in European plantations. Yet, a rust epidemic
occurred after the R gene was defeated by the evolution of
virulence factor 7 [1,12]. In wheat, NBS-LRRs have also
conferred race-specific resistance to stem rust; however, associa-
tion mapping has recently been applied to validate non-R gene
non-race-specific resistance loci [13].
Association mapping in plants has the capability to precisely
identify a greater number of functional variants which explain
smaller proportions of the phenotypic variance than traditional
linkage analysis [14]. The development of genomic resources
necessary for association analysis in Populus species have been
facilitated by its value to wood and paper industries and its
potential as a biofuels feedstock. With large unstructured
PLOS ONE | www.plosone.org 1 November 2013 | Volume 8 | Issue 11 | e78423
populations and wide phenotypic diversity, wood traits in P.
trichocarpa have begun to be studied via association analysis [15].
Here, we report the first multi-year association analysis of poplar
leaf rust resistance SNPs in P. trichocarpa.
Methods
Plant Material and PhenotypingThe ramets of 456 genotypes of native black cottonwood were
collected from the common garden of British Columbia Ministry
of Forest, Lands and Natural Resource Operations (MOFLNRO)
at Surrey, BC in March of 2008. MOFLNRO collected these
native poplar genotypes from 136 provenances from 44.00 degrees
north latitude (Oregon USA) to 59.34 degrees north latitude of
(Alaska USA) under the authority of Dr. Alvin Yanchuk,
Technical Advisor for the Tree Improvement Branch (Victoria,
BC Canada). In June of 2008, four replicates of each genotype
were planted in a common garden situated at the University of
British Columbia in Vancouver, Canada (49.27 degree north
latitude). Replicates were planted in a completely randomized
design with 1.561.5 meter spacing. In 2008 and 2009, fields were
watered daily by rainfall or drip irrigation. No fertility or soil
amendments were applied at any time. In 2009, 2010, and 2011
natural infection from Melampsora 6columbiana was scored visually
on the basis of pustules present on the leaves. Ratings were taken
on a 0–4 scale where (0) = no pustules, (1) = less than five pustules
per leaf on less than five leaves, (2) = less than five pustules per leaf
on more than five leaves, (3) = more than five pustules per leaf on
more than five leaves, (4) = more than five pustules on all leaves.
Ratings were taken once a week for 11 consecutive weeks (Julian
Day 200–279). Ratings were used to calculated area under the
disease curve (AUDPC) using the following equation [16]:
Pni~1 ½(Yizn1zYi)=2�½Xiz1{Xi� ð1Þ
where, Yi is the disease rating at the ith observation, Xi is the time
at the ith observation, and n is the total number of observations.
Genotypes with missing scores from all four replicates were
removed from the study and reduced the population to 412
genotypes. Date of bud set was taken concurrently with disease
ratings and varied widely (data not shown). Host age can interact
with disease resistance [17] thus, AUDPC scores were adjusted for
bud set using ANCOVA in Minitab v16 (MinitabH Statistical
Software). Finally, all adjusted AUDPC scores were transformed
for normalization using the following equation:
Xi~ffiffiffiffiffiffiffiffiffiffiffiffiffiffiffiffiffiffiffiffiffiffiffiffiffiffiffiffiffiffi(AUDPCiz1)
pð2Þ
Data normality was tested using Lilliefors (Kolomorov-Smirnov)
test in R package ‘‘nortest’’.
SNP GenotypingWe genotyped a total of 456 clones of the P. trichocarpa
population using an Illumina InfiniumH genotyping array with a
set of 34,131 SNPs in 3,543 candidate genes. The 34K SNP
genotyping array we employed was designed to take linkage
disequilibrium (LD) into account. SNPs in any given candidate
gene represented on the array were chosen to ‘‘tag’’ as many other
Table 1. Analysis of variance (ANOVA) testing the effect ofclone, year, and clone 6 year interaction of AUDPC.
Sources ofVariance Estimate St. Error Z value Pr.Z
Clone 44.6077 3.0644 14.56 ,0.0001
Year 27.9939 28.0179 1 0.1589
Clone x Year 5.1717 0.5507 9.39 ,0.0001
Residual 27.2343 0.5616 48.5 ,0.0001
doi:10.1371/journal.pone.0078423.t001
Table 2. Correlation coefficients of the population structure, latitude, and AUDPC in each year.
Latitude Q1 Q2 Q3 PC1 AUDPC09 AUDPC10
Q1 20.37016
,0.0001a
Q2 20.08427 20.74541
0.0876 ,0.0001
Q3 0.65247 20.49093 20.2148
,0.0001 ,0.0001 ,0.0001
PC1 20.62464 0.65285 20.17031 20.73393
,0.0001 ,0.0001 0.0005 ,0.0001
AUDPC09 0.73339 20.42216 0.00914 0.60658 20.67059
,0.0001 ,0.0001 0.8533 ,0.0001 ,0.0001
AUDPC10 0.67009 20.53882 0.05547 0.71694 20.73558 0.77123
,0.0001 ,0.0001 0.2613 ,0.0001 ,0.0001 ,0.0001
AUDPC11 0.73398 20.50088 0.09273 0.61266 20.69105 0.79764 0.8213
,0.0001 ,0.0001 0.06 ,0.0001 ,0.0001 ,0.0001 ,0.0001
aP value of Pearson’s correlation coefficient (n = 412).Q1, Q2, Q3 represent the three sub-populations revealed by GENELAND analysis where pairwise FST were calculated. Q16Q2 = 0.0118, Q16Q3 = 0.0226, andQ26Q3 = 0.02. PC1 represents the first principal component used to correct for population stratification.doi:10.1371/journal.pone.0078423.t002
Poplar Leaf Rust Resistance SNPs
PLOS ONE | www.plosone.org 2 November 2013 | Volume 8 | Issue 11 | e78423
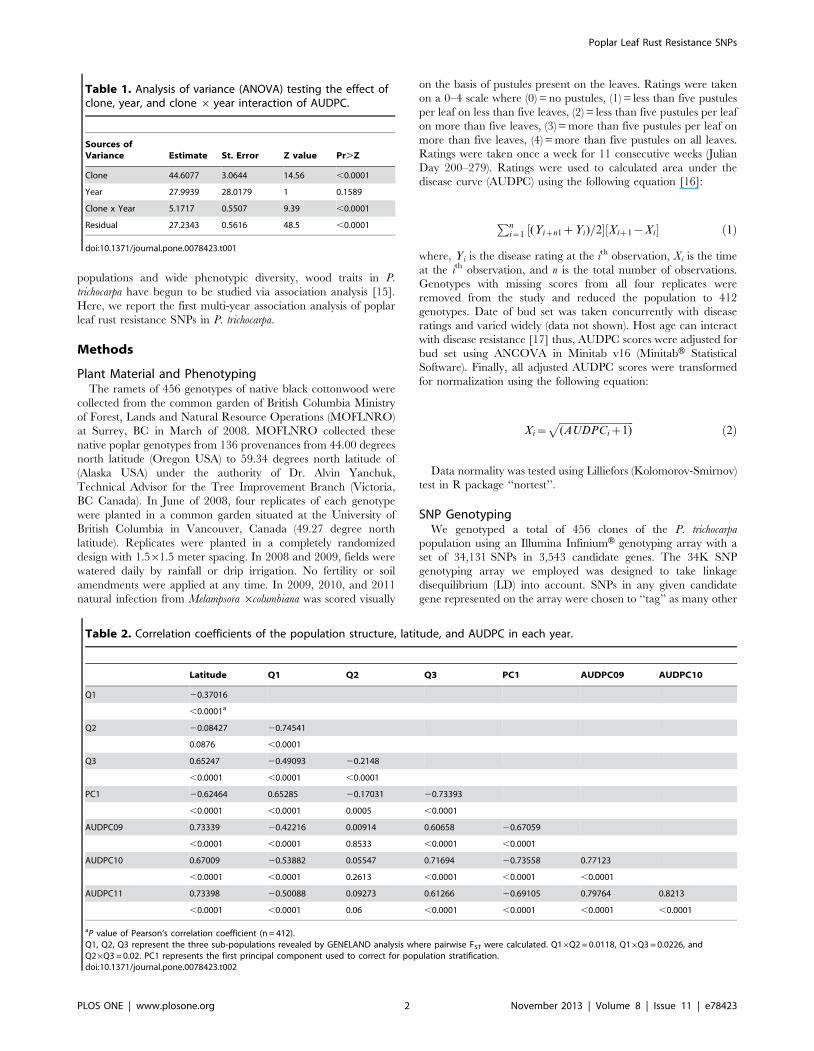
Figure 1. Quantile-quantile plots of expected and observed P values evaluating the type-1 error in a simple model (simple), the topten principal components (PCA-TOP10), BIC selected PCs (PCA-BIC), the K model (KINSHIP), and the Q model (Q MATRIX) withgoodness of fit test using Bayesian Information Criterion for 2009, 2010, and 2011 (top to bottom).doi:10.1371/journal.pone.0078423.g001
Poplar Leaf Rust Resistance SNPs
PLOS ONE | www.plosone.org 3 November 2013 | Volume 8 | Issue 11 | e78423
target SNPs as possible (based on LD calculations), with a SNP
density of approximately 1–2 SNPs per candidate gene kb [18].
We eliminated SNPs with: i) minor allele frequency below 0.05, ii)
more than 10% missing values, and iii) an Illumina GeneTrain
score below 0.5. These three selection criteria reduced the number
of SNPs to 29,355. These remaining SNPs were used in all
subsequent analyses.
Population StructureTo fit population structure effect, we used a subset of 899
randomly selected SNPs distributed across all 19 chromosomes
with complete information (i.e., no missing data) and meeting
HWE expectation (tested using ‘‘HWChisq’’ function implement-
ed in ‘‘HardyWeinberg’’ R package [19]. Population fit was done
by performing principal component analysis (PCA) in TASSEL
[20] and 263 principal components accounting for 90% of the
total variance in the SNP data were retained for further
determination of their impact. Principal components affecting
AUDPC in each year were selected through regression in a
stepwise manner using the function ‘‘stepwise’’ implemented in R
package ‘‘Rcmdr’’ with ‘‘backward’’ direction and Bayesian
information criterion ‘‘BIC’’ as the selection criterion.
Kinship matrix was calculated using the above mentioned
899 SNPs in SPAGeDi [21]. All negative values were set as zero
and diagonal elements were set to one [22]. Q matrix and FST
were calculated using GENELAND software with a subset of
200 SNPs randomly selected from the 899 used in PCA. Pearson’s
product moment correlations for latitude, AUDPC, Q matrix, and
PC1 were calculated in R package ‘‘Rcmdr’’.
Association AnalysisWe applied a two-step approach to analyze SNP-AUDPC
association [23]. First, a simple linear regression with AUDPC in
each year and every SNP was used to pre-select SNPs with the
following equation:
Y~Xbze ð3Þ
where, Y is the observations vector, b is the fixed effects of
population mean and SNP effect vector, X is the incidence matrix
assigning fixed effects to observations, and e is the residual effect.
SNP genotypes were coded as 0, 1, and 2 for common allele
homozygote, heterozygote, and rare allele homozygote, respec-
tively. SNPs with significant effect (P,0.001) were included in the
second analysis.
Finally, the selected principal components were included in a
regression model along the screened SNP individually as follows:
Y~mzSazXK
j~1
Pjbjze ð4Þ
where, Y is vector of measurements, is the population mean, is the
SNP effect, the term represents the effect of selected principal
components resulting from backward stepwise selection procedure
(above), and e is the residual effect. Association analysis was
performed in TASSEL [20] employing the GLM procedure.
Permutated P value was calculated in TASSEL with 1,000
permutations. The correction for multiple testing was applied at a,0.05. Cumulative effect of SNPs within each year was calculated
using method described by Ingvarsson et al. [24]. Pairwise LD
plots was calculated using the ‘‘LDheatmap’’ function implement-
ed in the LDheatmap R package [25].
Variance Components and Spatial AnalysisA REML-mixed linear model was used to estimate variance
components in SAS and test the effect of clone, year, and clone
6year interaction as follows:
Zijk~mzYizCjzYi|Cjzeijk ð5Þ
where, Z is vector of measurements (AUDPC) in the ith year, of
the jth clone, in the kth ramet, m is the population mean, Yi = effect
of the ith year, Cj = effect of the jth clone, Yi6Cj = effect of the ith
year6the jth clone interaction, e is the residual effect. Broad-sense
heritability in each year was calculated using methods described in
Lynch & Walsh [26].
In each year the mixed linear model implemented in ASReml
[27] was used to plot the residuals to their location in the field as
follows:
Y~XbzZmze ð6Þ
where Y is vector of measurements, b and m are vectors of fixed
(intercept and population) and random (genotypic values) effects
assuming U,N(0,) and Var(m) = I, e is vector of residual effects
assuming E,N(0,) and Var(e) = I where I is identity matrix
containing 19s on diagonal and 09s at diagonal-off elements, and
X and Z are index matrices assigning both fixed and random
effects to measurements. Q matrix from GENELAND analysis was
used to fit population structure effect.
Results
Disease AnalysisTo identify SNPs that confer non-race-specific resistance to
M. 6columbiana, we performed association analysis on 412
unrelated P. trichocarpa genotypes from a North American
provenance trial ranging from Alaska to Oregon. Poplar leaf rust
severity was scored (0–4 worst) on natural infection in a replicated
(ramets = 4) common garden experiment where ratings were taken
over 11 continuous weeks (Julian days 200 – 279) in each of three
consecutive years. Rust severity ranged from zero rust pustules
after 11 weeks (complete resistance) to 100% of the leaves covered
after four weeks (Julian day 229).
Area under the disease progress curve (AUDPC) was calculated
from the disease ratings over time. Previously, AUDPC had the
highest broad-sense heritability (H2 = 0.69) among four other
measures of Melampsora resistance in growth chamber assays with
artificial inoculations [28]. We estimated broad-sense heritability
for AUDPC at H2 = 0.72, 0.65, and 0.58 for each of the three
years, respectively. Analysis of variance indicated that clone and
clone 6 year interaction were significant, while year was not
significant (Table 1). Spatial analysis of the experimental plot also
demonstrated a change in the pattern of infection across years (Fig.
S1).
Population Structure and Association AnalysisAnalysis of population structure was tested using GENELAND
software [29]. An uncorrelated allele frequency model did not
detect any population structure while a correlated allele frequency
model revealed three sub-populations with weak systemic structure
Poplar Leaf Rust Resistance SNPs
PLOS ONE | www.plosone.org 4 November 2013 | Volume 8 | Issue 11 | e78423
Ta
ble
3.
SNP
sas
soci
ate
dw
ith
AU
DP
Cin
20
09
,2
01
0,
and
20
11
.
Ye
ar
Sca
ffo
ldS
NP
Ge
ne
Mo
de
lS
NP
loca
tio
nA
rab
ido
psi
sB
est
hit
An
no
tate
dG
en
eP
va
lue
Pe
rmu
tate
dP
va
lue
Ma
rke
rR
2
20
09
10
19
21
57
15
PO
PT
R_
00
10
s22
23
0e
xon
At5
g0
28
10
.1P
RR
7(P
SEU
DO
-RES
PO
NSE
REG
ULA
TO
R7
)7
.33
41
4E-
07
0.0
03
0.0
28
9
14
32
45
28
2P
OP
TR
_0
01
4s0
40
70
intr
on
At1
g1
93
30
.1u
nkn
ow
np
rote
in1
.45
40
7E-
06
0.0
03
0.0
27
1
14
32
45
41
4P
OP
TR
_0
01
4s0
40
70
intr
on
At1
g1
93
30
.1u
nkn
ow
np
rote
in1
.45
40
7E-
06
0.0
03
0.0
27
1
12
18
14
21
8P
OP
TR
_0
01
2s0
21
70
intr
on
At3
g4
92
20
.1p
ect
ine
ste
rase
fam
ilyp
rote
in4
.44
88
5E-
06
0.0
12
0.0
25
0
12
18
14
16
4P
OP
TR
_0
01
2s0
21
70
intr
on
At3
g4
92
20
.1p
ect
ine
ste
rase
fam
ilyp
rote
in5
.76
60
2E-
06
0.0
18
0.0
24
4
52
39
49
32
7P
OP
TR
_0
00
5s2
57
50
inte
rge
nic
At1
g1
98
70
.1IQ
D3
2(I
Q-d
om
ain
32
)7
.86
98
8E-
06
0.0
25
0.0
23
8
21
39
04
00
4P
OP
TR
_0
00
2s1
80
10
inte
rge
nic
no
arab
ido
psi
sb
last
hit
un
kno
wn
pro
tein
9.0
27
06
E-0
60
.03
00
.02
36
10
18
44
26
6P
OP
TR
_0
01
0s0
16
50
inte
rge
nic
At4
g1
59
00
.1P
RL1
(PLE
IOT
RO
PIC
REG
ULA
TO
RY
LOC
US
1)
1.0
68
75
E-0
50
.03
30
.02
53
13
11
18
78
4P
OP
TR
_0
00
1s3
28
10
intr
on
At4
g1
39
80
.1A
tHSF
A5
;D
NA
bin
din
g/t
ran
scri
pti
on
fact
or
1.4
09
77
E-0
50
.03
70
.02
26
20
10
10
19
21
57
15
PO
PT
R_
00
10
s22
23
0e
xon
At5
g0
28
10
.1P
RR
7(P
SEU
DO
-RES
PO
NSE
REG
ULA
TO
R7
)4
.49
27
4E-
11
0.0
01
0.0
47
6
52
39
49
32
7P
OP
TR
_0
00
5s2
57
50
inte
rge
nic
At1
g1
98
70
.1IQ
D3
2(I
Q-d
om
ain
32
)2
.71
30
7E-
07
0.0
03
0.0
30
2
51
07
82
55
5P
OP
TR
_0
00
5s1
37
80
inte
rge
nic
At2
g2
37
60
.1B
LH4
(BEL
1-L
IKE
HO
MEO
DO
MA
IN4
)4
.67
80
4E-
07
0.0
04
0.0
29
2
52
39
52
53
8P
OP
TR
_0
00
5s2
57
50
exo
nA
t1g
19
87
0.1
IQD
32
(IQ
-do
mai
n3
2)
7.9
94
77
E-0
70
.00
40
.02
81
61
40
27
70
PO
PT
R_
00
06
s02
14
0in
terg
en
icA
t4g
15
09
0.1
FAR
1(F
AR
-RED
IMP
AIR
EDR
ESP
ON
SE1
)3
.64
89
E-0
60
.01
60
.02
53
61
39
78
89
PO
PT
R_
00
06
s02
14
03
9-U
TR
At4
g1
50
90
.1FA
R1
(FA
R-R
EDIM
PA
IRED
RES
PO
NSE
1)
4.0
78
83
E-0
60
.01
70
.02
50
13
47
21
61
6P
OP
TR
_0
00
1s3
62
10
exo
nA
t3g
27
33
0.1
zin
cfi
ng
er
(C3
HC
4-t
ype
RIN
Gfi
ng
er)
fam
ilyp
rote
in6
.18
98
E-0
60
.02
40
.02
44
61
39
92
89
PO
PT
R_
00
06
s02
14
0e
xon
At4
g1
50
90
.1FA
R1
(FA
R-R
EDIM
PA
IRED
RES
PO
NSE
1)
7.2
84
74
E-0
60
.02
90
.02
38
91
09
70
41
4P
OP
TR
_0
00
9s1
38
80
inte
rge
nic
At4
g0
23
90
.1A
PP
(AR
AB
IDO
PSI
SP
OLY
(AD
P-R
IBO
SE)
PO
LYM
ERA
SE)
7.5
94
21
E-0
60
.02
90
.02
39
61
40
24
69
PO
PT
R_
00
06
s02
14
0in
terg
en
icA
t4g
15
09
0.1
FAR
1(F
AR
-RED
IMP
AIR
EDR
ESP
ON
SE1
)8
.05
64
8E-
06
0.0
31
0.0
24
2
14
10
71
67
74
PO
PT
R_
00
14
s14
65
0in
tro
nA
t5g
48
56
0.1
bas
ich
elix
-lo
op
-he
lix(b
HLH
)fa
mily
pro
tein
1.1
10
7E-
05
0.0
41
0.0
23
0
20
11
91
67
62
27
PO
PT
R_
00
09
s01
42
0in
terg
en
icA
t1g
08
09
0.1
PtN
RT
2.1
(NIT
RA
TE
TR
AN
SPO
RT
ER2
.1)
3.5
22
42
E-0
70
.00
30
.03
42
52
39
49
32
7P
OP
TR
_0
00
5s2
57
50
inte
rge
nic
At1
g1
98
70
.1IQ
D3
2(I
Q-d
om
ain
32
)7
.88
90
1E-
07
0.0
03
0.0
30
8
10
19
21
57
15
PO
PT
R_
00
10
s22
23
0e
xon
At5
g0
28
10
.1P
RR
7(P
SEU
DO
-RES
PO
NSE
REG
ULA
TO
R7
)8
.34
72
9E-
07
0.0
03
0.0
31
3
91
67
88
26
PO
PT
R_
00
09
s01
42
0in
terg
en
icA
t1g
08
09
0.1
PtN
RT
2.1
(NIT
RA
TE
TR
AN
SPO
RT
ER2
.1)
1.9
23
6E-
06
0.0
07
0.0
30
8
91
60
62
13
PO
PT
R_
00
09
s01
33
0e
xon
At3
g4
50
40
.1p
ho
sph
atid
ate
cyti
dyl
yltr
ansf
era
sefa
mily
pro
tein
2.9
63
57
E-0
60
.00
80
.02
79
91
85
71
42
PO
PT
R_
00
09
s01
49
0in
terg
en
icA
t5g
60
72
0.1
un
kno
wn
pro
tein
4.8
30
27
E-0
60
.01
40
.02
70
84
16
58
33
PO
PT
R_
00
08
s06
92
0in
terg
en
icA
t5g
05
61
0.1
AL1
(ALF
IN-L
IKE
1)
5.7
17
05
E-0
60
.01
70
.02
66
91
67
65
90
PO
PT
R_
00
09
s01
42
03
9-U
TR
At1
g0
80
90
.1P
tNR
T2
.1(N
ITR
AT
ET
RA
NSP
OR
TER
2.1
)5
.74
40
7E-
06
0.0
17
0.0
26
6
14
32
95
5P
OP
TR
_0
14
3s0
02
00
exo
nA
t5g
60
77
0.1
PtN
RT
2.4
(NIT
RA
TE
TR
AN
SPO
RT
ER2
.1)
5.7
44
07
E-0
60
.01
70
.02
66
21
31
31
62
2P
OP
TR
_0
00
2s1
73
60
inte
rge
nic
no
arab
ido
psi
sb
last
hit
un
kno
wn
pro
tein
7.7
35
44
E-0
60
.02
20
.02
59
24
62
72
86
PO
PT
R_
00
02
s06
88
0in
tro
nA
t1g
76
90
0.1
AtT
LP1
(TU
BB
YLI
KE
PR
OT
EIN
1)
8.1
30
72
E-0
60
.02
50
.02
59
10
21
45
19
68
PO
PT
R_
00
10
s26
10
05
9-U
TR
At3
g5
45
40
.1A
tGC
N4
;tr
ansp
ort
er
8.2
35
63
E-0
60
.02
50
.02
61
17
12
39
29
05
PO
PT
R_
00
17
s12
21
03
9-U
TR
At5
g6
14
30
.1A
NA
C1
00
(AR
AB
IDO
PSI
SN
AC
DO
MA
INC
ON
TA
ININ
GP
RO
TEI
N1
00
)1
.02
65
5E-
05
0.0
35
0.0
25
4
91
67
92
12
PO
PT
R_
00
09
s01
42
0in
terg
en
icA
t1g
08
09
0.1
PtN
RT
2.1
(NIT
RA
TE
TR
AN
SPO
RT
ER2
.1)
1.0
95
75
E-0
50
.03
90
.02
52
12
18
11
25
0P
OP
TR
_0
01
2s0
21
70
inte
rge
nic
At3
g4
92
20
.1p
ect
ine
ste
rase
fam
ilyp
rote
in1
.10
23
6E-
05
0.0
39
0.0
25
3
Poplar Leaf Rust Resistance SNPs
PLOS ONE | www.plosone.org 5 November 2013 | Volume 8 | Issue 11 | e78423
(FST ,0.0227) consistent with our previous results [18,30].
Components of the population structure also displayed strong
correlation to AUDPC and latitude (Table 2; Fig. S2). Due to this
correlation of phenotype and population structure, the trait-SNP
simple model (simple linear regression) produced 941, 1220, and
1093 significant associations at P,1.7261026 in each of the three
years, respectively (data not shown) and a prodigious inflation of
type-1 error (Fig. 1).
During association analysis, we tested the effects of Q matrix,
PCA-based model that uses the first 10 PC’s (PCA-TOP10) [31]
PCA-based model with PCs that affect AUDPC selected through a
backwards step-wise regression (PCA-BIC), and kinship matrix
[32]. In a goodness of fit test, kinship matrix had the lowest
Bayesian Information Criterion (BIC) value; however in the 2010
and 2011 quantile-quantile plots (q-q plots), kinship matrix
eliminated all of the expected associations. The PCA-BIC
displayed the next best model fit without overcorrecting for
structure (Fig. 1).
Association analysis was performed with 29,355 SNPs covering
3,543 genes in a linear regression with AUDPC using the PCA-
BIC model in each year. In 2009, 2010, and 2011 a total of three,
four, and three SNPs were significantly associated at
P,1.4661026. Bonferroni correction for multiple testing was
applied at a= 0.05/29,355 where P = 1.7061026. Single SNPs
located in PSEUDO RESPONSE REGULATOR7 (PRR7) and IQ-
DOMAIN32 (IQD32) were repeated in three and two years
respectively. In addition, two SNPs in high linkage disequilibrium
(LD) (R2.0.8) located in the intergenic region between NITRATE
TRANSPORTER2.1 (NRT2.1) and NITRATE TRANSPORTER2.4
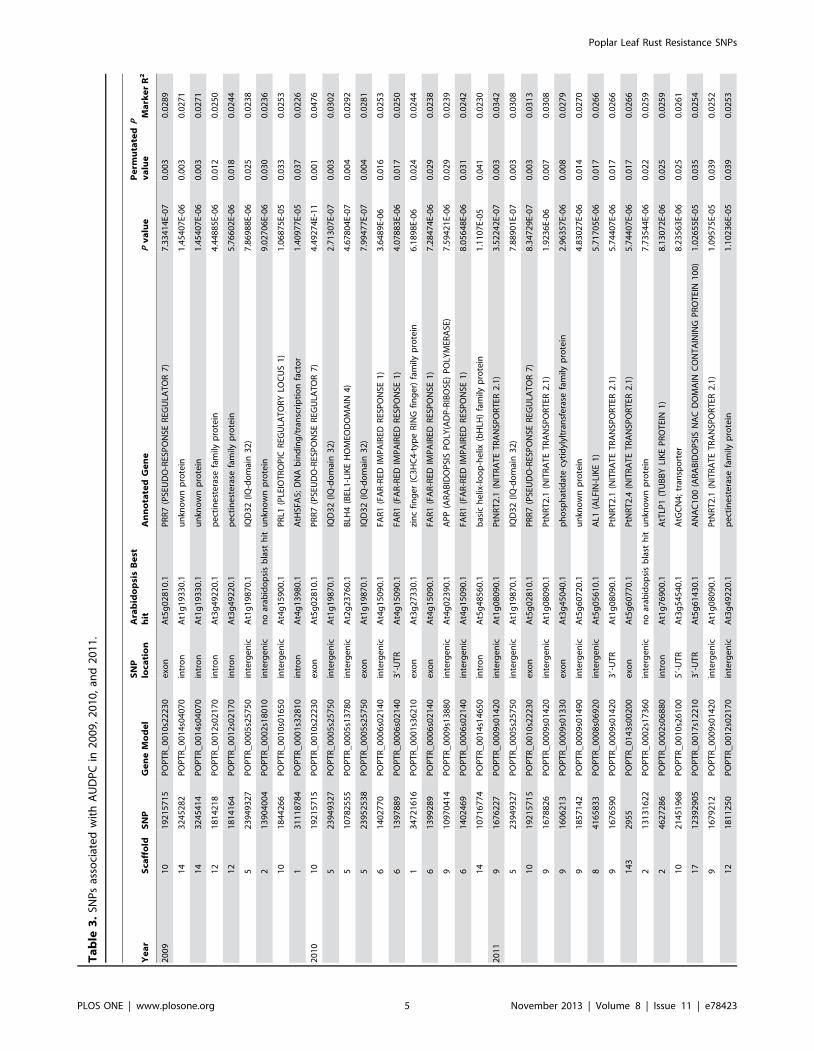
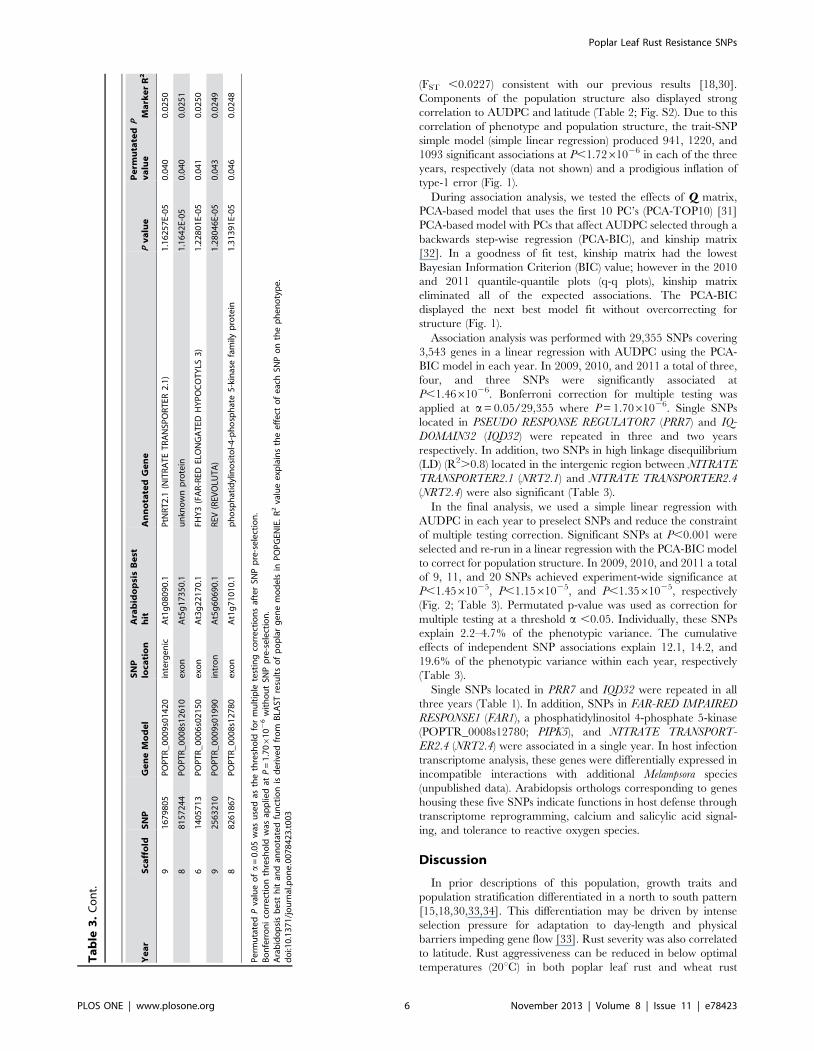
(NRT2.4) were also significant (Table 3).
In the final analysis, we used a simple linear regression with
AUDPC in each year to preselect SNPs and reduce the constraint
of multiple testing correction. Significant SNPs at P,0.001 were
selected and re-run in a linear regression with the PCA-BIC model
to correct for population structure. In 2009, 2010, and 2011 a total
of 9, 11, and 20 SNPs achieved experiment-wide significance at
P,1.4561025, P,1.1561025, and P,1.3561025, respectively
(Fig. 2; Table 3). Permutated p-value was used as correction for
multiple testing at a threshold a ,0.05. Individually, these SNPs
explain 2.2–4.7% of the phenotypic variance. The cumulative
effects of independent SNP associations explain 12.1, 14.2, and
19.6% of the phenotypic variance within each year, respectively
(Table 3).
Single SNPs located in PRR7 and IQD32 were repeated in all
three years (Table 1). In addition, SNPs in FAR-RED IMPAIRED
RESPONSE1 (FAR1), a phosphatidylinositol 4-phosphate 5-kinase
(POPTR_0008s12780; PIPK5), and NITRATE TRANSPORT-
ER2.4 (NRT2.4) were associated in a single year. In host infection
transcriptome analysis, these genes were differentially expressed in
incompatible interactions with additional Melampsora species
(unpublished data). Arabidopsis orthologs corresponding to genes
housing these five SNPs indicate functions in host defense through
transcriptome reprogramming, calcium and salicylic acid signal-
ing, and tolerance to reactive oxygen species.
Discussion
In prior descriptions of this population, growth traits and
population stratification differentiated in a north to south pattern
[15,18,30,33,34]. This differentiation may be driven by intense
selection pressure for adaptation to day-length and physical
barriers impeding gene flow [33]. Rust severity was also correlated
to latitude. Rust aggressiveness can be reduced in below optimal
temperatures (20uC) in both poplar leaf rust and wheat rust
Ta
ble
3.
Co
nt.
Ye
ar
Sca
ffo
ldS
NP
Ge
ne
Mo
de
lS
NP
loca
tio
nA
rab
ido
psi
sB
est
hit
An
no
tate
dG
en
eP
va
lue
Pe
rmu
tate
dP
va
lue
Ma
rke
rR
2
91
67
98
05
PO
PT
R_
00
09
s01
42
0in
terg
en
icA
t1g
08
09
0.1
PtN
RT
2.1
(NIT
RA
TE
TR
AN
SPO
RT
ER2
.1)
1.1
62
57
E-0
50
.04
00
.02
50
88
15
72
44
PO
PT
R_
00
08
s12
61
0e
xon
At5
g1
73
50
.1u
nkn
ow
np
rote
in1
.16
42
E-0
50
.04
00
.02
51
61
40
57
13
PO
PT
R_
00
06
s02
15
0e
xon
At3
g2
21
70
.1FH
Y3
(FA
R-R
EDEL
ON
GA
TED
HY
PO
CO
TY
LS3
)1
.22
80
1E-
05
0.0
41
0.0
25
0
92
56
32
10
PO
PT
R_
00
09
s01
99
0in
tro
nA
t5g
60
69
0.1
REV
(REV
OLU
TA
)1
.28
04
6E-
05
0.0
43
0.0
24
9
88
26
18
67
PO
PT
R_
00
08
s12
78
0e
xon
At1
g7
10
10
.1p
ho
sph
atid
ylin
osi
tol-
4-p
ho
sph
ate
5-k
inas
efa
mily
pro
tein
1.3
13
91
E-0
50
.04
60
.02
48
Pe
rmu
tate
dP
valu
eo
fa
=0
.05
was
use
das
the
thre
sho
ldfo
rm
ult
iple
test
ing
corr
ect
ion
saf
ter
SNP
pre
-se
lect
ion
.B
on
ferr
on
ico
rre
ctio
nth
resh
old
was
app
lied
atP
=1
.706
10
26
wit
ho
ut
SNP
pre
-se
lect
ion
.A
rab
ido
psi
sb
est
hit
and
ann
ota
ted
fun
ctio
nis
de
rive
dfr
om
BLA
STre
sult
so
fp
op
lar
ge
ne
mo
de
lsin
PO
PG
ENIE
.R
2va
lue
exp
lain
sth
ee
ffe
cto
fe
ach
SNP
on
the
ph
en
oty
pe
.d
oi:1
0.1
37
1/j
ou
rnal
.po
ne
.00
78
42
3.t
00
3
Poplar Leaf Rust Resistance SNPs
PLOS ONE | www.plosone.org 6 November 2013 | Volume 8 | Issue 11 | e78423
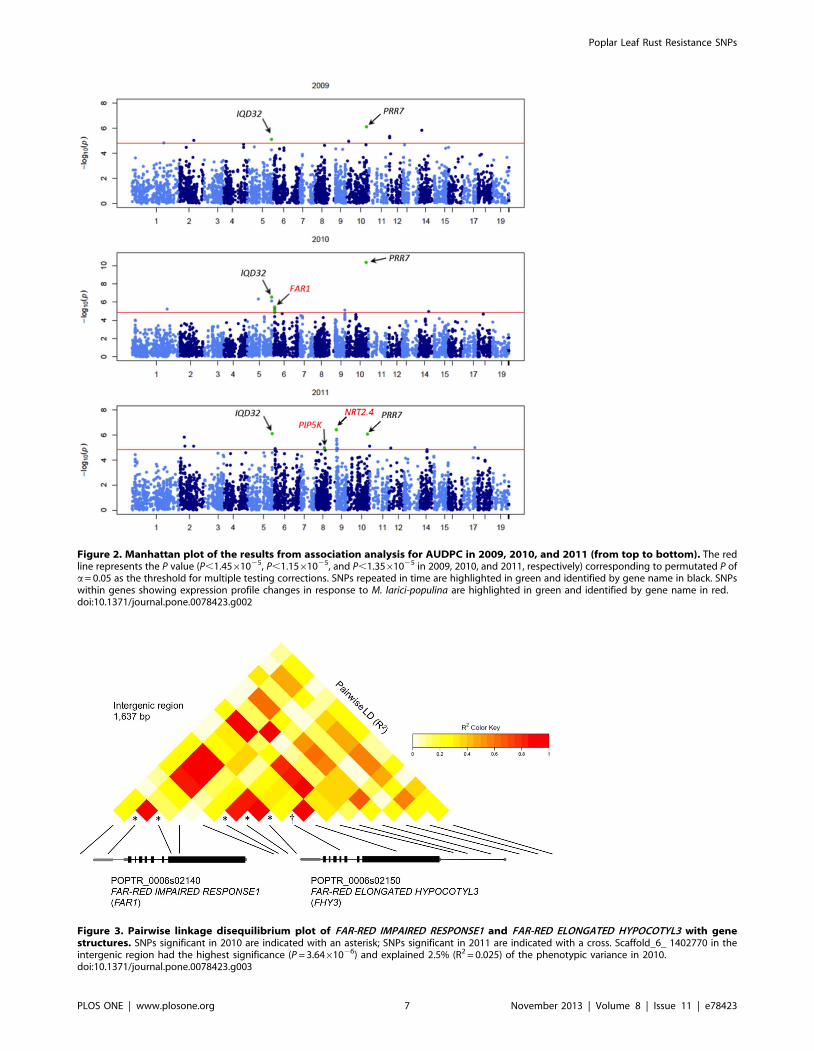
Figure 2. Manhattan plot of the results from association analysis for AUDPC in 2009, 2010, and 2011 (from top to bottom). The redline represents the P value (P,1.4561025, P,1.1561025, and P,1.3561025 in 2009, 2010, and 2011, respectively) corresponding to permutated P ofa= 0.05 as the threshold for multiple testing corrections. SNPs repeated in time are highlighted in green and identified by gene name in black. SNPswithin genes showing expression profile changes in response to M. larici-populina are highlighted in green and identified by gene name in red.doi:10.1371/journal.pone.0078423.g002
Figure 3. Pairwise linkage disequilibrium plot of FAR-RED IMPAIRED RESPONSE1 and FAR-RED ELONGATED HYPOCOTYL3 with genestructures. SNPs significant in 2010 are indicated with an asterisk; SNPs significant in 2011 are indicated with a cross. Scaffold_6_ 1402770 in theintergenic region had the highest significance (P = 3.6461026) and explained 2.5% (R2 = 0.025) of the phenotypic variance in 2010.doi:10.1371/journal.pone.0078423.g003
Poplar Leaf Rust Resistance SNPs
PLOS ONE | www.plosone.org 7 November 2013 | Volume 8 | Issue 11 | e78423
interactions [35,36]. Cooler temperatures at northern latitudes
may produce a weaker selection pressure for resistance than in the
south, thus creating co-linearity of causal variants with population
structure. Co-linearity of allele frequencies via correlation of
phenotype and population structure inflates type-1 error in
association studies; therefore, it is necessary to correct for the
confounding effects of population structure.
Several approaches have been proposed to correct for structure.
Yu et al. [22] proposed a unified mixed model which fits both
population (Q matrix) and familiar structure (kinship matrix) to
precisely eliminate confounding factors. Consideration of a
residual polygenic term fitting LD pattern across chromosomes
in the model, which is usually fit solely by kinship matrix, has also
improved the estimate of the genetic relatedness [37–39] especially
in complex polygenic traits. Moreover, the kinship matrix itself is
considered to fit both confounding factors efficiently [31,40,41]. In
our study, GENELAND analysis indicated very weak stratification
among three sub-populations (FST ,0.0227). The use of Q matrix
in the association model resulted in decreased fit and inflated type-
1 error. Kinship matrix had the lowest BIC value in a goodness of
fit test, suggesting that it is the best model to correct for the
confounding structure; however the q-q plots indicated that
kinship matrix eliminated the expected associations and overcor-
rected the model (Fig. 1).
Alternatively, Price et al. [42,43] employed principal component
analysis to improve the correction for population stratification and
the confounding effects of phenotype – population structure
correlation. They proposed using a fixed number of principal
components (first 10) or ones selected on the basis of Tracy-
Widom statistics [44] when admixture occurred in population
regardless of their relationship to phenotype. Methods using a
stepwise regression to select a set of SNPs [37,45] or principal
components [23,46] have been suggested to fit the confounding
structure and used as regressors in the final association analysis
model. Novembre & Stephens [47] also indicated that inclusion of
principal components not correlated with the trait may reduce
power. In our study, the inflation of significant associations and the
goodness of fit in the PCA-TOP10 model in comparison to the
PCA-BIC model further supports this hypothesis (Fig. 1).
We also used SNP pre-selection to reduce the constraint of
multiple testing corrections on inflation of false negative associa-
tions [23,48]. We reason that elevating the pre-selection threshold
from P,0.05 to P,0.001 would remove erroneous SNPs that
would have been selected via the correlation of AUDPC and
population stratification and thus increase type-2 error. In 2009,
pre-selection at P,0.05 would have selected 10,828 SNPs for
AUDPC, where P,0.001 reduced the SNP selection to 3,905
(data not shown). Moreover, SNP associations in FAR1 and PIPK5
were only achieved via SNP pre-selection but correlated to rust
resistance through transcriptome analysis during incompatible
poplar leaf rust interactions.
Associated SNPs within PRR7, IQD32, and PIPK5 were in low
LD with the adjacent SNPs. Thus, these SNPs may be causative
variants or in high LD with the unrepresented causative SNP.
Conversely, several SNPs within the neighboring gene pairs; FAR1
and FHY3, and NRT2.4 and NRT2.1, respectively, were in high
LD which convolutes the elucidation of the true causative SNP.
Scaffold_10_ 19,215,715 is a non-synonymous polymorphism in
the fifth exon of a sequence orthologous to PRR7 (Fig. S3). In
Arabidopsis, PRR7 is a gene within a small family of circadian
clock gene transcription factors [49]; however, it was not
associated with phenological traits in this population (personal
communications, Athena McKown). The prr7 loss of function
mutants has an ambiguous phenotype, but double and triple
mutants accentuate the prr5 and prr9 single mutant phenotypes:
arrhythmia with increased hypocotyl elongation, leaf number, and
days to flowering [49]. More recently, PRR7 was down-regulated
in response to chitooctaose (chitin oligomer; chitin is a component
of fungal cell walls). These results would suggest a role of PRR7
transcriptional regulation during host infection [50].
Scaffold_5_23949327 is located 1,826 bp downstream from the
39UTR of IQD32 (Fig. S4). This gene is orthologous to a
calmodulin binding protein that serves as an integral component
of Ca2+/calmodulin signaling. In Arabidopsis and rice, IQD gene
family members share as many as three calmodulin binding motifs
IQ, 1-5-10, and 1-8-14. While IQD gene function has not been
well characterized, IQD1 has been shown to function in defense
response to herbivory [51].
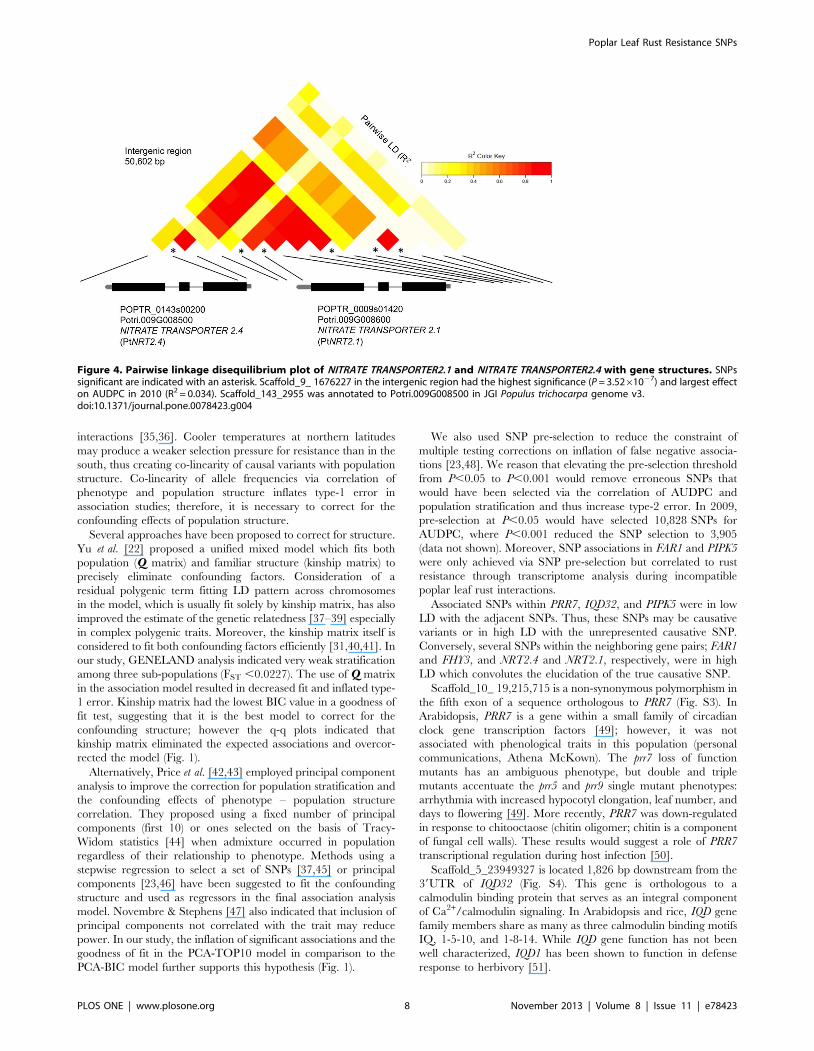
Figure 4. Pairwise linkage disequilibrium plot of NITRATE TRANSPORTER2.1 and NITRATE TRANSPORTER2.4 with gene structures. SNPssignificant are indicated with an asterisk. Scaffold_9_ 1676227 in the intergenic region had the highest significance (P = 3.5261027) and largest effecton AUDPC in 2010 (R2 = 0.034). Scaffold_143_2955 was annotated to Potri.009G008500 in JGI Populus trichocarpa genome v3.doi:10.1371/journal.pone.0078423.g004
Poplar Leaf Rust Resistance SNPs
PLOS ONE | www.plosone.org 8 November 2013 | Volume 8 | Issue 11 | e78423
These single SNPs within PRR7 and IQD32 were associated in
all three years. Bi-parental linkage mapping has identified major
resistance loci that confer race-specific resistance to M.6columbiana
[4]. In our study, ANOVA and spatial analysis suggest the
pathogenicity of the rust population varied across the three years.
This is consistent with the reproductive biology of the rust where
the non-overlap of poplar-alternative host ranges would affect the
genetic composition of the rust population in time. Therefore, we
propose that SNP-associations replicated in time and in the
diversity of M. 6columbiana across the three years confer non-race-
specific resistance.
Numerous signals within FAR1 were also significant in 2010, but
not repeated in time (Fig. 3). A homolog of FAR1, FAR-RED
ELONGATED HYPOCOTYL3 (FHY3), is a clock gene that
indirectly mediates the phytochrome A response, but has
additional functions. In Arabidopsis, fhy3 mutants regulate plant
architecture and abiotic stress tolerance through suppression of
axillary bud outgrowth and repressed leaf growth with decreased
tolerance to oxidative stress. Loss of function mutants in far1 and
revoluta (REV), a leucine-zipper transcription factor, enhance the
fhy3 phenotype [52]. In 2011, scaffold_6_1405713 within FHY3
and scaffold_9_2,563,210 within REV were also significant
(Table 3). These signals were not repeated in time; however,
FAR1 expression was increased 2-fold 96 hours after inoculation
with M. larici-populina (unpublished data).
Likewise, scaffold_8_8261867 in the 12 exon of
POPTR_0008s12780; encoding a phosphatidylinositol 4-phos-
phate 5-kinase (PIP5K), was significant in 2011 (Fig. S5) and has
been previously implicated in resistance to Melampsora. In
Arabidopsis, lower expression of PIP5Ks leads to accumulation
of the raffinose family oligosaccharides that act as osmoprotectants
and antioxidants and protect mitochondria and chloroplasts from
stress-induced production of reactive oxygen species [53]. In
resistant P. trichocarpa 6 deltoides, this PIP5K gene was shown to
have more than a 2-fold decrease in its expression 48 hours after
inoculation with M. larici-populina [54].
The SNP at scaffold_143_2955 encodes a non-synonymous
mutation in the third exon of NRT2.4 and is in high LD (R2.0.8)
with three other associated SNPs in the neighboring NRT2.1
(Fig. 4). These genes are orthologous to the nitrate transporter
AtNRT2.1. Nitrate transporters are transmembrane proteins that
primarily function in nitrate transport; however, they also function
as environmental signal receptors and regulators of biotic and
abiotic stress pathways. Recently, it was reported that the mutant
nrt2 that lacks the function of both AtNRT2.1 and the adjacent
AtNRT2.2 shows decreased susceptibility to Pseudomonas syringae.
The decrease in susceptibility is coordinated through an earlier
and more robust induction of salicylic acid and up-regulation of
defense genes PR1 and PR5 [55]. In poplar, NTR2.4 was down-
regulated in incompatible interactions of P. deltoides with M.
occidentalis and M. larici-populina (unpublished data). The change in
expression levels of genes housing associated SNPs during
incompatible poplar leaf rust interactions further implicates a
functional role in host defense.
In summary, we identified two independent loci that were
strongly associated with host defense to M. 6columbiana and
through repetition in time confer non-race-specific resistance.
Furthermore, three other associated loci have been correlated to
poplar leaf rust resistance through transcriptome analysis and may
form a functional network with additional genes involved in
tolerance to reactive oxygen species. In this long-lived ecologically
and economically important tree species, these associations lay the
foundation to more efficient breeding of durable disease resistance.
Supporting Information
Figure S1 Spatial distribution of residuals for AUDPCin each year. The scale of residuals ranges from 220(low disease) to 20 (high disease).
(TIFF)
Figure S2 Population structure estimates and geo-graphical distribution of each sampled tree (n = 412).Colors designate the three sub-populations detected using GENE-
LAND analysis (Q matrix).
(TIFF)
Figure S3 Pairwise linkage disequilibrium plot ofPSEUDO-RESPONSE REGULATOR7 and gene structure.Scaffold_10_19215715 is indicated with an asterisk. In 2009,
2010, and 2011 (from left to right) each box plot shows the lower
quartile, the median, and the upper quartile values, and the
whiskers show the range of the phenotypic variation in the
population.
(TIF)
Figure S4 Pairwise linkage disequilibrium plot of IQ-DOMAIN32 and gene structure. Scaffold_5_23949327 is
indicated with an asterisk. In 2009, 2010, and 2011 (from left to
right) each box plot shows the lower quartile, the median, and the
upper quartile values, and the whiskers show the range of the
phenotypic variation in the population.
(TIF)
Figure S5 Pairwise linkage disequilibrium plot ofPHOSPHATIDYLINOSITOL-4-PHOSPHATE 5-KINASEand gene structure. Scaffold_8_ 8261867 is indicated with an
asterisk. In 2011, the box plot shows the lower quartile, the
median, and the upper quartile values, and the whiskers show the
range of the phenotypic variation in the population.
(TIF)
Acknowledgments
The authors acknowledge Nicolas Feau’s work on RNA-Seq transcriptome
analysis of Populus x Melampsora interactions and his review of the
manuscript.
Author Contributions
Conceived and designed the experiments: YEK RG CD SM RH.
Performed the experiments: JL SA. Analyzed the data: JL JK. Wrote the
paper: JL JK.
References
1. Steenackers J, Steenackers M, Steenackers V, Stevens M (1996) Poplar diseases,
consequences on growth and wood quality. Biomass Bioenerg 10: 267–274.
2. Widin KD, Schipper AL (1981) Effect of Melampsora medusae leaf rust infection on
yield of hybrid poplars. Eur J Forest Pathol 11: 438–448.
3. Newcombe G, Stirling B, Mcdonald S, Bradshaw HD (2000) Melampsora
6columbiana, a natural hybrid of M. medusa and M. occidentalis. Mycol Res 104:
261–274.
4. Newcombe G, Stirling B, Bradshaw HD (2001) Abundant pathogenic variation
in the new hybrid rust Melampsora 6columbiana on hybrid poplar. Phytopathology
91: 981–985.
5. Flor HH (1955) Host-parasite interaction in flax rust - its genetics and other
implications. Phytopathology 45: 680–685.
Poplar Leaf Rust Resistance SNPs
PLOS ONE | www.plosone.org 9 November 2013 | Volume 8 | Issue 11 | e78423
6. Bourassa M, Bernier L, Hamelin RC (2007) Genetic diversity in poplar leaf rust
(Melampsora medusae f. sp. deltoidae) in the zones of host sympatry and allopatry.Phytopathology 97: 603–610.
7. Zhang J, Steenackers M, Storme V, Neyrinck S, Van Montagu M, et al. (2001)
Fine mapping and identification of nucleotide binding site/leucine-rich repeatsequences at the MER locus in Populus deltoides ‘S9–2’. Phytopathology 91:
1069–1073.8. Lescot M, Rombauts S, Zhang J, Aubourg S, Mathe C, et al. (2004) Annotation
of a 95-kb Populus deltoides genomic sequence reveals a disease resistance gene
cluster and novel class I and class II transposable elements. Theor Appl Genet109: 10–22.
9. Yin TM, DiFazio SP, Gunter LE, Jawdy SS, Boerjan W, et al. (2004) Geneticand physical mapping of Melampsora rust resistance genes in Populus and
characterization of linkage disequilibrium and flanking genomic sequence. NewPhytol 164: 95–105.
10. Gerard PR, Husson C, Pinon J, Frey P (2006) Comparison of genetic and
virulence diversity of Melampsora larici-populina populations on wild and cultivatedpoplar and influence of the alternate host. Phytopathology 96: 1027–1036.
11. Bresson A, Jorge V, Dowkiw A, Guerin V, Bourgait I, et al. (2011) Qualitativeand quantitative resistances to leaf rust finely mapped within two nucleotide-
binding site leucine-rich repeat (NBS-LRR)-rich genomic regions of chromo-
some 19 in poplar. New Phytol 192: 151–163.12. Dowkiw A, Voisin E, Bastien C (2010) Potential of Eurasian poplar rust to
overcome a major quantitative resistance factor. Plant Pathol 59: 523–534.13. Crossa J, Burgueno J, Dreisigacker S, Vargas M, Herrera-Foessel SA, et al.
(2007) Association analysis of historical bread wheat germplasm using additivegenetic covariance of relatives and population structure. Genetics 177: 1889–
1913.
14. Zhu C, Gore M, Buckler E, Yu J (2008) Status and prospects of associationmapping in plants. The Plant Genome 1: 5–20.
15. Wegrzyn JL, Eckert AJ, Choi M, Lee JM, Stanton BJ, et al. (2010) Associationgenetics of traits controlling lignin and cellulose biosynthesis in black cottonwood
(Populus trichocarpa, Salicaceae) secondary xylem. New Phytol 188: 515–532.
16. Shaner G, Finney RE (1977) The effect of nitrogen fertilization on theexpression of slow mildewing resistance in Knox wheat. Phytopathology 67:
1051–1056.17. Rupe JC, Siegel MR, Hartman JR (1982) Influence of environment and plant
maturity on gray leaf spot of corn caused by Cercospora zeae-maydis.Phytopathology 72: 1587–1591.
18. Geraldes A, Difazio SP, Slavov GT, Ranjan P, Muchero W, et al. (2013) A 34K
SNP genotyping array for Populus trichocarpa: Design, application to the study ofnatural populations and transferability to other Populus species. Mol Ecol
Resour, in press.19. Graffelman J, Morales-Camarena J (2008) Graphical tests for Hardy-Weinberg
equilibrium based on the ternary plot. Human Heredity 65: 77–84.
20. Bradbury PJ, Zhang Z, Kroon DE, Casstevens TM, Ramdoss Y, et al. (2007)TASSEL: software for association mapping of complex traits in diverse samples.
Bioinformatics 23: 2633–2635.21. Hardy OJ, Vekemans X (2002) SPAGeDi: a versatile computer program to
analyse spatial genetic structure at the individual or population levels. MolecularEcology Notes 2: 618–620.
22. Yu J, Pressoir G, Briggs W, Vroh I, Yamasaki M, et al. (2006) A unified mixed-
model method for association mapping that accounts for multiple levels ofrelatedness. Nat Genet 38: 203–208.
23. Pant SD, Schenkel FS, Verschoor CP, You Q, Kelton DF, et al. (2010) Aprincipal component regression based genome wide analysis approach reveals
the presence of a novel QTL on BTA7 for MAP resistance in holstein cattle.
Genomics 95: 176–182.24. Ingvarsson P, Garcia M, Luquez V, Hall D, Jansson S (2008) Nucleotide
Polymorphism and Phenotypic Associations Within and Around the phyto-chrome B2 Locus in European Aspen (Populus tremula, Salicaceae). Genetics 178:
2217–2226.
25. Shin J-H, Blay S, McNeney B, Graham J (2006) LDheatmap: An R Function forGraphical Display of Pairwise Linkage Disequilibria Between Single Nucleotide
Polymorphisms. Journal of Statistical Software 16: Code Snippet 3.26. Lynch M, Walsh B (1998) Genetics and Analysis of Quantitative Traits.
Sunderland, MA: Sinauer Associates, Inc.27. Gilmour AR, Gogel BJ, Cullis BR, Welham SJ, Thompson R (2002) ASReml
User Guide Release 1.0: Hemel Hempstead, UK: VSN International Ltd.
28. Dowkiw A, Husson C, Frey P, Pinon J, Bastien C (2003) Partial resistance toMelampsora larici-populina leaf rust in hybrid poplars: genetic variability in
inoculated excised leaf disk bioassay and relationship with complete resistance.Phytopathology 93: 421–427.
29. Guillot G, Mortier F, Estoup A (2005) Geneland: A program for landscape
genetics. Mol Ecol Notes 5: 712–715.
30. Slavov GT, DiFazio SP, Martin J, Schackwitz W, Muchero W, et al. (2012)
Genome resequencing reveals multiscale geographic structure and extensivelinkage disequilibrium in the forest tree Populus trichocarpa. New Phytol 196: 713–
725.
31. Zhao K, Aranzana MJ, Kim S, Lister C, Shindo C, et al. (2007) An arabidopsisexample of association mapping in structured samples. PloS Genet 3: e4.
32. Loiselle BA, Sork VL, Nason J, Graham C (1995) Spatial genetic structure of atropical understory shrub, Psychotria officinalis (Rubiaceae). Am J Bot 82: 1420–
1425.
33. Xie C-Y, Ying CC, Yanchuk AD, Holowachuk DL (2009) Ecotypic mode ofregional differentiation caused by restricted gene migration: a case in black
cottonwood (Populus trichocarpa) along the Pacific Northwest coast. Can J ForestRes 39: 519–526.
34. Xie C-Y, Carlson MR, Ying CC (2012) Ecotypic mode of regionaldifferentiation of black cottonwood (Populus trichocarpa) due to restricted gene
migration: further evidence from a field test on the northern coast of British
Columbia. Can J Forest Res 42: 400–405.35. Levine MN (1928) Biometric studies of the variation of physiologic forms of
Puccinia graminis tritici and the effects of ecological factors on the susceptibility ofwheat varieties. Phytopathology 18: 7–123.
36. Chandrashekar M, Heather WA (1980) Temperature sensitivity of reactions of
Populus spp. to races of Melampsora larici-populina. Phytopathology 71: 421–424.37. Habier D, Fernando RL, Dekkers J (2007) The impact of genetic relationship
information on genome-assisted breeding values. Genetics 177: 2389–2397.38. Karkkainen H, Sillanpaa M (2012) Robustness of Bayesian multilocus
association models to cryptic relatedness. Annals of Human Genetics 76: 510–523.
39. Wang M, Jiang N, Jia T, Leach L, Cockram J, et al. (2012) Genome-wide
association mapping of agronomic traits in highly structured populations ofbarley cultivars. Theor Appl Genet 124: 233–246.
40. Astle W, Balding DJ (2009) Population structure and cryptic relatedness ingenetic association studies. Stat Sci 24: 451–471.
41. Stich B, Mohring J, Piepho HP, Heckenberger M, Buckler ES, et al. (2008)
Comparison of mixed-model approaches for association mapping. Genetics 174:1745–1754.
42. Price AL, Patterson NJ, Plenge RM, Weinblatt ME, Shadick NA, et al. (2006)Principal components analysis corrects for stratification in genome-wide
association studies. Nat Genet 38: 904–909.43. Price AL, Zaitlen NA, Reich D, Patterson N (2010) New approaches to
population stratification in genome-wide association studies. Nature Reviews
Genetics 11: 459–463.44. Patterson N, Price A, Reich D (2006) Population Structure and Eigenanalysis.
PLoS Genet 2: e190.45. Setakis E, Stirnadel H, Balding D (2006) Logistic regression protects against
population structure in genetic association studies. Genome Res 16: 290–296.
46. Li Q, Wacholder S, Hunter D, Hoover R, Chanock S, et al. (2009) Geneticbackground comparison using distance-based regression, with applications in
population stratification evaluation and adjustment. Genet Epidemiol 33: 432–441.
47. Novembre J, Stephens M (2008) Interpreting principal component analyses ofspatial population genetic variation. Nat Genet 40: 646–649.
48. Quesada T, Gopal V, Cumbie WP, Eckert AJ, Wegrzyn JL, et al. (2010)
Association mapping of quantitative disease resistance in a natural population ofloblolly pine (Pinus taeda L.). Genetics 186: 677–686.
49. Nakamichi N, Kita M, Ito S, Yamashino T, Mizuno T (2005) PSEUDO-RESPONSE REGULATORS, PRR9, PRR7 and PRR5, together play essential
roles close to the circadian clock of Arabidopsis thaliana. Plant Cell Physiol 46:
686–698.50. Libault M, Wan J, Czechowski T, Udvardi M, Stacey G (2007) Identification of
118 Arabidopsis transcription factor and 30 ubiquitin-ligase genes responding tochitin, a plant-defense elicitor. Mol Plant-Microbe In 20: 900–911.
51. Levy M, Wang Q, Kaspi R, Parrella MP, Abel S (2005) Arabidopsis IQD1, a
novel calmodulin-binding nuclear protein, stimulates glucosinolate accumulationand plant defense. Plant J 43: 79–96.
52. Stirnberg P, Zhao S, Williamson L, Ward S, Leyser O (2012). FHY3 promotesshoot branching and stress tolerance in Arabidopsis in an AXR1-dependent
manner. Plant J 71: 907–920.53. Vallurua R, Van den Endeb W (2011) Myo-inositol and beyond – Emerging
networks under stress. Plant Sci 181: 387–400.
54. Rinaldi C, Kohler A, Frey P, Duchaussoy F, Ningre N, et al. (2007) Transcriptprofiling of poplar leaves upon infection with compatible and incompatible
strains of the foliar rust Melampsora larici-populina. Plant Physiol 144: 347–366.55. Camanes G, Pastor V, Cerezo M, Garcıa-Andrade J, Vicedo B, et al. (2012) A
deletion in NRT2.1 attenuates Pseudomonas syringae induced hormonal perturba-
tion, resulting in primed plant defenses. Plant Physiol 158: 1054–1066.
Poplar Leaf Rust Resistance SNPs
PLOS ONE | www.plosone.org 10 November 2013 | Volume 8 | Issue 1 | e784231


![Bennett v. Columbiana Cty. Coroner - Supreme Court of Ohio · 30/09/2016 · [Cite as Bennett v. Columbiana Cty. Coroner, 2016-Ohio-7182.] STATE OF OHIO, COLUMBIANA COUNTY IN THE](https://static.cupdf.com/doc/110x72/5f5ffda9f4db67574d78fafa/bennett-v-columbiana-cty-coroner-supreme-court-of-30092016-cite-as-bennett.jpg)


![김동환 2009암학회워크샵.ppt [호환 모드]•Basic concepts of SNPs •Applications of SNPs into cancer research ... 21 SNPs a/w antileukemic drug disposition-> 63 SNPs a/w](https://static.cupdf.com/doc/110x72/601ede878cebc154024e5352/ee-2009oeoefppt-eeoe-abasic-concepts-of-snps-aapplications.jpg)