1Otley et al.: Fiordland crested penguin population trend
New Zealand Journal of Ecology (2018) 42(2): 0-0 © New Zealand Ecological Society.
DOI: 10.20417/nzjecol.42.15
Assessing the population trend and threats to New Zealand’s Fiordland crested penguin using counting and demographic modelling approaches
Helen Otley1*, Hannah Edmonds2, Jo Hiscock3, Glen Newton4, Jane Tansell5, Paul van Klink6, Rebecca Wilson7,8 and Ian Westbrooke9
1Department of Conservation, Private Bag 701, Hokitika 7842, New Zealand2Department of Conservation, PO Box 29, Te Anau 9640, New Zealand3Department of Conservation, PO Box 743, Invercargill 9840, New Zealand4Department of Conservation, PO Box 370, Greymouth 7840, New Zealand5Southern Contractors, 330 Sinclair Rd, Te Anau 9679, New Zealand6179B Stone St, Wanaka 9305, New Zealand7Department of Conservation, Haast8Present address: WWF-New Zealand, PO Box 6237, Wellington 6141, New Zealand9Department of Conservation, Private Bag 4715, Christchurch Mail Centre, Christchurch 8140, New Zealand*Author for correspondence (Email: [email protected])
Published online: 12 March 2018
Abstract: The Fiordland crested penguin Eudyptes pachyrhynchus is one of the least studied crested penguin species, with indications the species has a declining population, which would be in line with the historic and contemporary trends for most crested penguins. To determine the current population trend of the Fiordland crested penguin, a number of monitoring programmes using both abundance counts and demographic modelling approaches were carried out between 1990 and 2010 in the northern half of the species’ range. A 2.6% ± 0.8% annual decline rate of active nests was detected at 14 monitoring plots, and the number of nests along two coastlines declined annually by 1.2% and 2.6%. Population matrix models using site-specific demographic rates for the species at two South Westland sites indicated contrasting population trends, with one site increasing by 1.6% annually and a second site decreasing at 0.3% annually. Due to concerns about the reproductive parameters used in the model, the trajectory indicated by the nest-chick data was deemed more robust and should be used to inform management. Six potential threats to Fiordland crested penguin were reviewed against the detected population trend and specifically adult survival, but it was determined that there is insufficient understanding about the species, particularly its foraging ecology and effects of fishing and terrestrial predation, to confidently identify the key threats. Therefore, the recommended management action is to address these knowledge gaps.
Key words: demography; Eudyptes; matrix model; nest counts
Introduction
Seabirds form an important part of both terrestrial and marine ecosystems, with their populations influenced by processes and conditions that occur in both environments. Many seabird species, including most penguins, have declining population trajectories and are at a high risk of extinction (Trathan et al. 2015). Monitoring population size and demographic rates has an important role in identifying if a species is declining, which life history stages contribute the most to the population trajectory, what management activities may be most effective, and whether management actions are slowing or reversing declines. Detecting the trajectory of a penguin population can be challenging but, where monitoring programmes exist, it is usually a numerical count of birds and/or active nests or burrows in a colony or defined area (e.g. Pütz et al. 2003; Trathan et al. 2012; Hiscock & Chilvers 2014). However, more recently, demographic models have been used to determine the population trajectory (e.g. Sutherland & Dann 2013) and/or to understand how detected numerical changes are biologically possible (e.g. Baylis et al. 2013b).
The genus Eudyptes has seven species, with at least one species in each Southern Hemisphere ocean (Borboroglu & Boersma 2013). The extent of biological and ecological
knowledge of the seven species varies widely. Numerical counts over the last 30 to 100 years appear to show a decline in most crested penguin species. Dramatic declines have been noted for the macaroni penguin (E. chrysolophus) at South Georgia (Trathan et al. 2012), for the southern rockhopper penguin (E. chrysocome) at Campbell Island (Cunningham & Moors 1994) and at the Falkland Islands (Pütz et al. 2003), and for the northern rockhopper penguin (E. moseleyi) at Gough Island (Cuthbert et al. 2009). However, population monitoring over the last 15–20 years has shown that the rate of decline for some species has slowed (e.g. the macaroni penguin at South Georgia, Trathan et al. 2012; and the erected-crested penguin E. sclateri on Antipodes Islands, Hiscock & Chilvers 2014), stabilised or even increased (for the southern rockhopper penguin at the Falkland Islands and at Campbell Island; Baylis et al. 2013b; Morrison et al. 2015, respectively). For some Eudyptes species, the population is currently increasing at one location but declining at another, for example the northern rockhopper penguin (Cuthbert et al. 2009; Robson et al. 2011) and the southern rockhopper penguin (Baylis et al. 2013b; Hiscock & Chilvers 2014).
Despite the fact that New Zealand’s Fiordland crested penguin has a breeding range that includes permanently inhabited temperate islands (including the South Island) and
2 New Zealand Journal of Ecology, Vol. 42, No. 2, 2018
has the smallest population size of any Eudyptes species, the species current population trend is unknown (Mattern 2013). Yet it is assessed internationally (BirdLife International 2016) and nationally (Robertson et al. 2016) as being at high risk of extinction due to its sparse distribution and a small population that is considered to be declining. It is important to determine whether this assessment is correct and if the species is at risk of extinction, and to identify appropriate conservation management actions to halt and reverse any negative trend.
In this paper, we determine the population trend based on a monitoring programme, using both counting and demographic approaches, conducted over a 20-year period (1990–2010) in the northern part of the species’ range. Population modelling was used to identify the demographic features that contribute the most to the rate of population change. Several examinations of
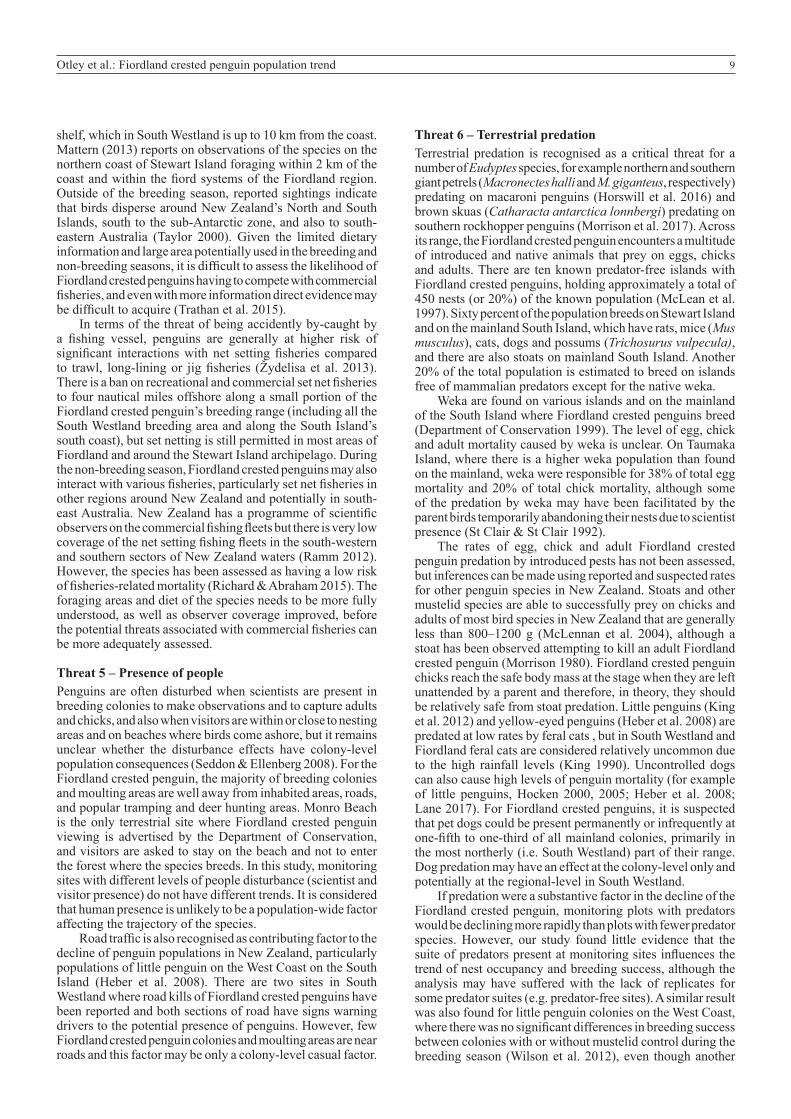
Figure 1. Location of the seven monitoring sites (14 monitoring plots, dots), one research site (Taumaka Island, triangle), two coastline re-survey sites (Heretaniwha to Bruce Bay and Jackson Head West, stars) and two colony re-surveys (Gorge River, cross) for Fiordland crested penguins in South Westland and Fiordland, South Island, New Zealand. The towns of Haast and Te Anau (squares) and the regions of
potential and actual threats to penguins have been undertaken (e.g. Trathan et al. 2015), including specifically for crested penguins (BirdLife International 2010). We reviewed these threats for Fiordland crested penguin against the detected population trends and the life stage(s) that were identified to contribute most to the population trajectory in order to identify management actions.
Materials and methods
The monitoring programme included both counting and demographic approaches. The demographic data included adult and juvenile survival, age of first breeding and breeding success (Otley et al. 2017) and these data were used to develop
3Otley et al.: Fiordland crested penguin population trend
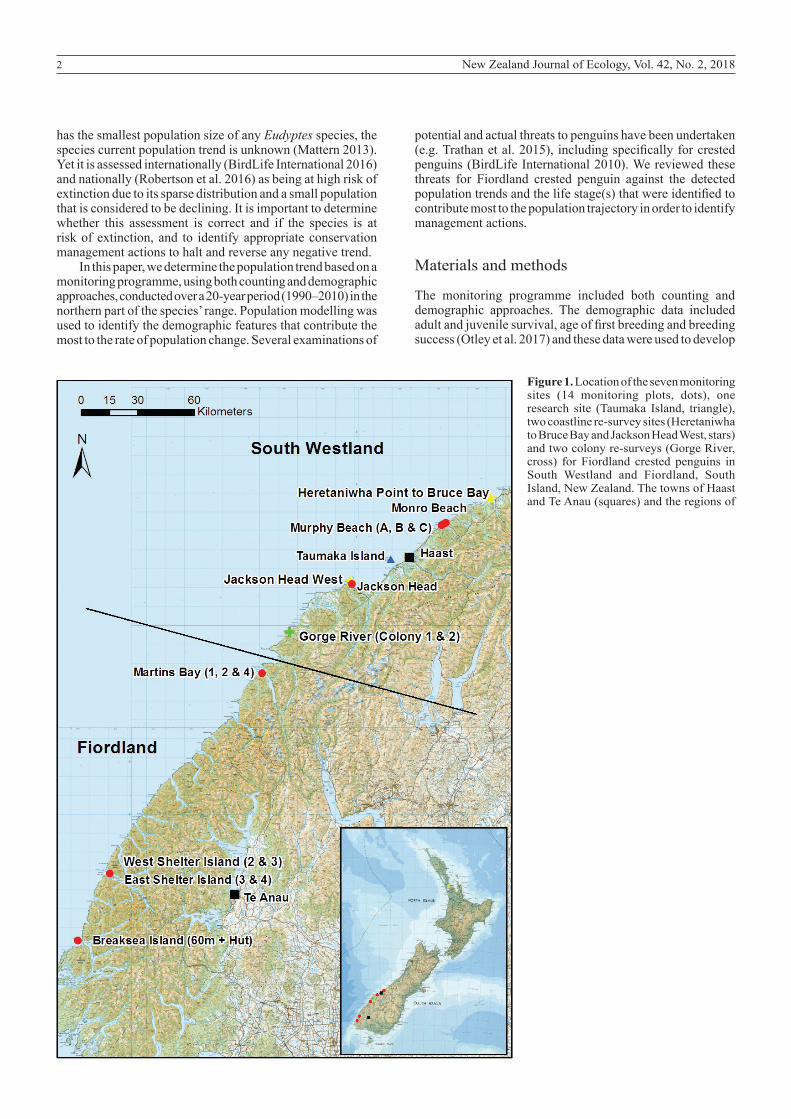
Table 1. Trend in Fiordland crested penguin nest counts at 14 nest-chick monitoring plots (in geographic order from north to south), one research site, two coastal re-surveys and two colony re-surveys, and three location level variables for the monitoring plots and research site (level of human disturbance, island/mainland and predator suite present). The annual rate of change for the 14 monitoring plots and one research site was calculated using a mixed-effects model. For the two coastal re-surveys and two colony re-surveys, the annual rate of change between the two data points is presented. __________________________________________________________________________________________________________________________________________________________________
Location Region Monitoring dates Monitoring Disturbance Location Predators Annual rate plot size of change (ha) in nests (%)__________________________________________________________________________________________________________________________________________________________________
Nest-chick monitoring plots Monro Beach South Westland 1990–1998, 2000–2004, 2007–2009 0.4 Moderate Mainland All except weka -3.6Murphy Beach A South Westland 1990–1998, 2000–2004, 2007–2009 0.1 Low Mainland All except weka -4.5Murphy Beach B South Westland 1990–1998, 2000–2004, 2007–2009 0.1 Low Mainland All except weka -5.5Murphy Beach C South Westland 1990–1998, 2000–2004, 2007–2009 0.4 Low Mainland All except weka 0.5Jacksons Head South Westland 1990–1998, 2000–2004, 2007–2009 0.4 Moderate Mainland All except weka -3.5Martins Bay 1 Fiordland 1994–1998, 2006–2009 1.6 Low Mainland All except weka -0.5Martins Bay 2 Fiordland 1994–1998, 2006–2009 1.3 Low Mainland All except weka 0.6Martins Bay 4 Fiordland 1994–1998, 2006–2009 2.6 Low Mainland All except weka -5.5East Shelter Island 3 Fiordland 1994–1998, 2006–2009 0.2 Low Island Weka only -2.8East Shelter Island 4 Fiordland 1994–1998, 2006–2009 0.2 Low Island Weka only 0.0West Shelter Island 2 Fiordland 1994–1998, 2006–2009 0.5 Low Island Weka only -5.6West Shelter Island 3 Fiordland 1994–1998, 2006–2009 0.4 Low Island Weka only -2.9Breaksea Island 50m Fiordland 1996–2000, 2006–2009 0.5 Low Island None -0.2Breaksea Island Hut Fiordland 1996–2000, 2006–2009 0.5 Low Island None -3.4__________________________________________________________________________________________________________________________________________________________________
Research site Taumaka Island South Westland 1988–1995 Not recorded High Island Weka only -3.5 (St Clair et al. 1999)__________________________________________________________________________________________________________________________________________________________________
Coastline re-surveys Heretaniwha Point South Westland 1992 and 2003 -1.2 to Bruce Bay (c. 50 nests) Jackson Head West South Westland 1993 and 2005 -2.6 (c. 200 nests)__________________________________________________________________________________________________________________________________________________________________
Colony re-surveys (Long et al. 2009) Gorge River colony 1 South Westland 1995 and 2009 6.7 (c. 20 nests) Gorge River colony 2 South Westland 1995 and 2009 0.0 (25 nests)_________________________________________________________________________________________________________________________________
a transition matrix model of population growth. In addition, to give the broadest understanding of the trend of the species, we included two other available count datasets in this paper: 7 years of nest count data from Taumaka Island presented, but not fully analysed, by St Clair et al. (1999), and unpublished counts conducted in the 2000s of two colonies first counted by McLean et al. (1997) in the 1990s (Long et al. 2009).
Counting approachNest-chick monitoringThree nest-chick monitoring sites were established at South Westland (Monro Beach, Murphy Beach and Jackson Head) and four were established in Fiordland (Martins Bay, West Shelter Island, East Shelter Island and Breaksea Island), which are in the northern part of the species’ range (Fig. 1). The three South Westland and Martins Bay monitoring sites are all on the mainland with the full suite of introduced mammalian predators (e.g. stoats Mustela erminea, rats Rattus spp., dogs Canis lupus familiaris and cats Felis catus; Taylor 2000), while the Shelter Islands are predator-free, except for the native rail weka (Gallirallus australis), and Breaksea Island is predator-free (Table 1).
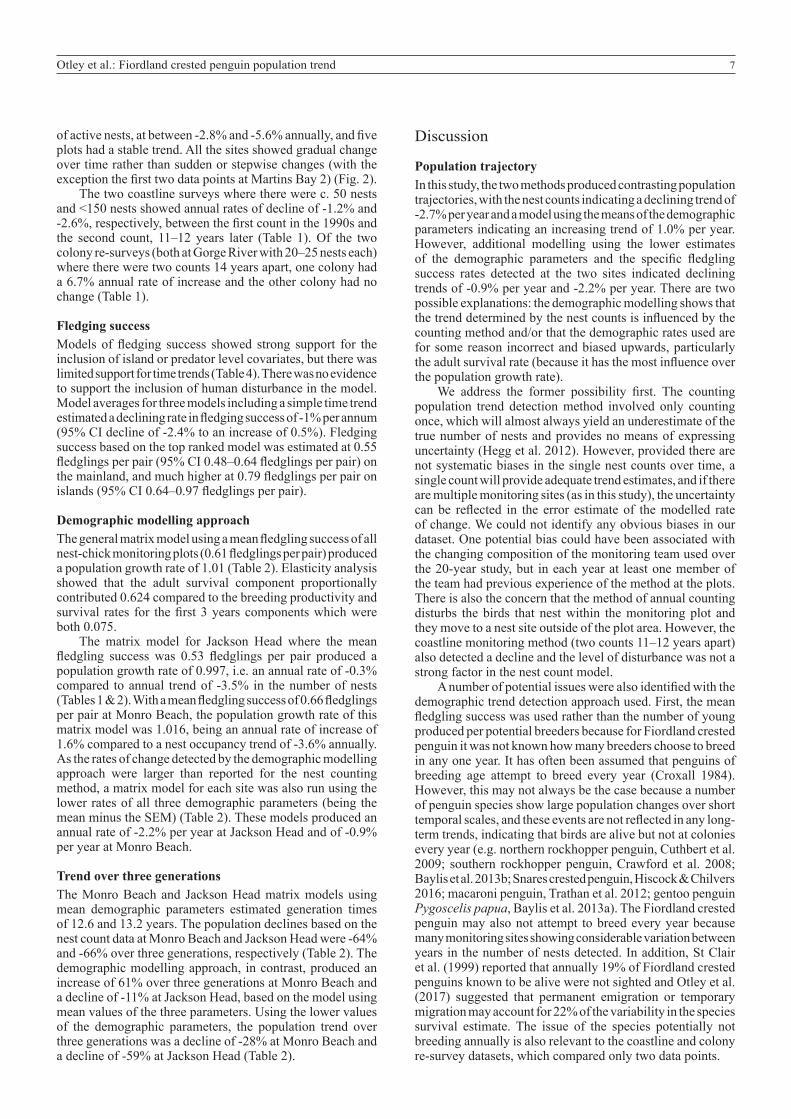
In an attempt to produce a dataset with high precision, we decided that each monitoring site should have at least 20–30 nests. To achieve this goal, some monitoring sites were made up of up to three separate monitoring plots within the site. Two monitoring sites had one monitoring plot, three monitoring sites had two monitoring plots and three monitoring sites had three monitoring plots, and the plots varied in size from 0.1 ha to 2.6 ha (Table 1). The Murphy Beach A, Murphy Beach C and Jacksons Head monitoring plots were located in a colony that extended beyond the boundary of the monitoring plot, and the other monitoring plots encompassed an entire colony. When the monitoring commenced, three monitoring plots contained 20–30 nests, four monitoring plots had 10–20 nests and two monitoring plots had fewer than 10 nests (Fig. 2).
During mid-August (typically 1 to 2 weeks after most eggs had been laid at the monitoring sites), the number of nests in each monitoring plot was counted. Fiordland crested penguins readily move off nests if disturbed, so to avoid abandonment of eggs and brooded chicks, we counted any bird sitting tight in the incubation position as an active nest. Around the second week of November (around 1 week before chicks began departing the colony), the number of fledglings within each monitoring plot was also counted.
4 New Zealand Journal of Ecology, Vol. 42, No. 2, 2018
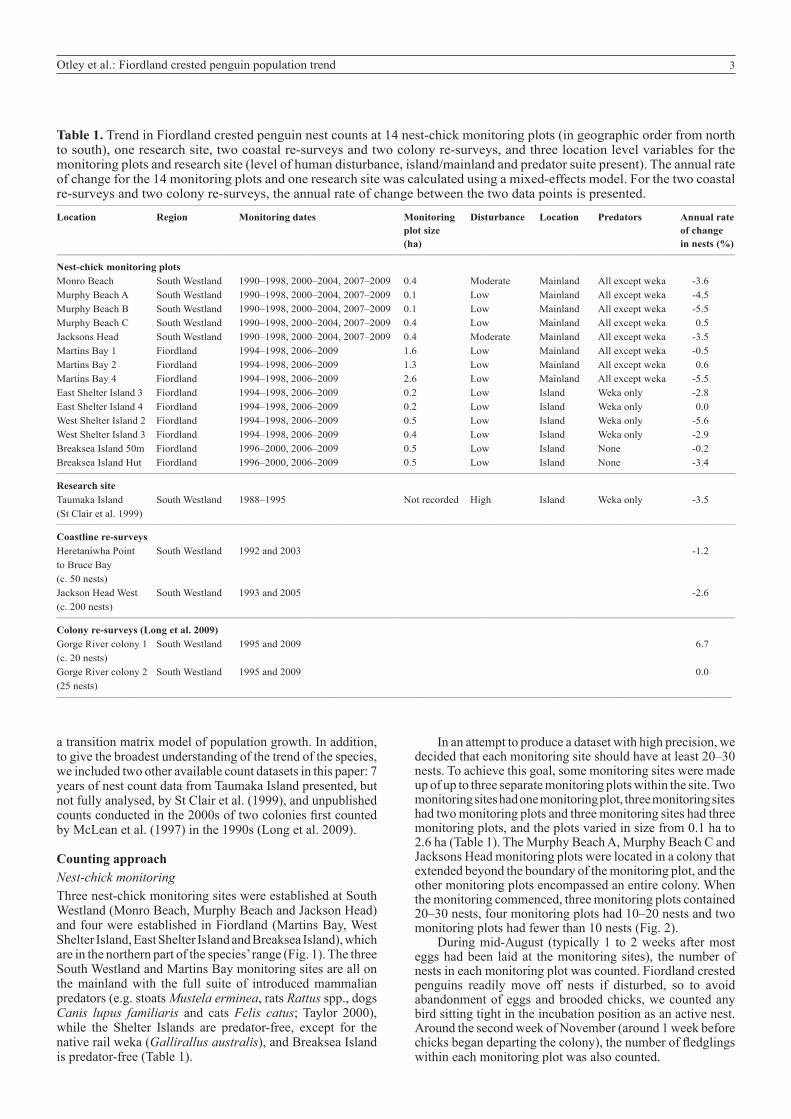
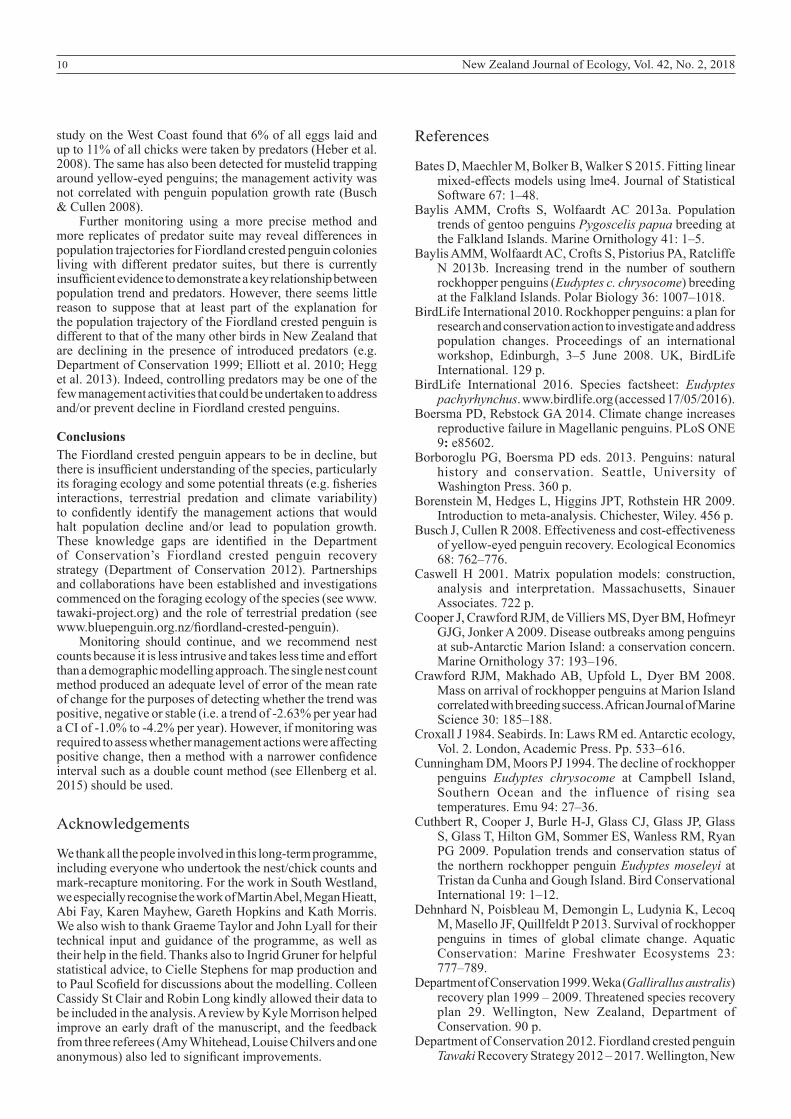
Figure 2. Trend in the number of Fiordland crested penguin nests at 14 monitoring plots and one research site between 1988 to 2009.
Counts of active nests and fledglings were carried out over a 20-year period between 1990 and 2009, being almost every year at the South Westland monitoring sites and consecutively for two 5-year intervals during the 1990s and 2000s at the Fiordland monitoring sites (Table 1). Counts were completed by a team of two or three people. For the South Westland monitoring, the monitoring team consisted of at least one experienced person who had completed the counts on 2 prior years except during the final 3 years, and there was at least one experienced person in the Fiordland monitoring team annually after the first year of monitoring in each study period, but no surveyors completed monitoring in both study periods.
At all monitoring plots, the field team searched the entire plot area, with team members spaced across the width of the plot but within sight to ensure that no birds were double counted or missed, and no areas in the plot were missed. A single count was undertaken. As Fiordland crested penguins
are prone to moving away from their nests if approached too closely, surveyors moved slowly and quietly. Some nests were in relatively open locations, but most nesting birds were obscured from view in some way because they were under thick vegetation, tree roots or in rock crevices or in caves. Caves and other dark cavities were searched using a torch.
The nest count data on Taumaka Island (part of the Open Bay Islands) presented by St Clair et al. (1999) (the ‘active nests’ data presented by St Clair et al. 1999 in Fig. 1) was also included in the nest monitoring dataset analysed. Cassidy et al. (1999) had 46 marked nests and the activity status of each nest (i.e. whether active or unused) was determined during the egg laying period annually between 1988 and 1995. The site is referred to as a ‘research site’, as these nests and birds attempting to breed on them were closely studied for 8 years by St Clair et al. (1999).
5Otley et al.: Fiordland crested penguin population trend
Coastline re-surveysTwo areas in South Westland that are much larger than the monitoring plots (i.e. stretches of coastline with multiple colonies, having a total of 50–200 nests; Fig. 1) were surveyed in the 1990s by McLean et al. (1997). These were re-counted using the same method in 2003 or 2005. One coastline monitoring site was between Heretaniwha Point and Bruce Bay at the very northern extent of the species’ range, and the other site was the west side of Jackson Head (whereas the nest-chick monitoring site was located on the east side of Jackson Head). The coastline re-surveys were conducted by a team of two to four surveyors walking along the coastline searching for penguins and/or sign, with likely wet areas and areas of kiekie (Freycinetia banksii) checked inland to a distance of 20–50 m, and, when penguins were located, a count of birds and nests made (McLean et al. 1997).
Colony re-surveys Two other colonies at Gorge River at the southern end of South Westland (Fig. 1), which have 20–25 nests, counted in 1995 by McLean et al. (1997) and in 2009 by Long et al. (2009) are also presented. Long et al. (2009) used the method of McLean et al. (1997) as described above.
Data analysis methodsThe nest-chick monitoring data were modelled, while for the other monitoring data only the annual rate of change between the two data points was calculated. As the nest-chick monitoring data has a hierarchical structure (monitoring plots within monitoring sites, with counts through time at each), these data were analysed using hierarchical models with the mixed-effects model package lme4 (version 1.1-14) in R (version 2.15) (R Development Core Team 2014; Bates et al. 2015). These models provide estimates of parameters such as time trends for a population if the sample units are a random selection of such units within the population. The monitoring sites and plots in the nest-chick dataset were not selected on a random basis, but chosen purposively on the basis of where substantial numbers of Fiordland crested penguin were accessible. Therefore, the estimates provide a summary of trends based on the particular areas chosen (or for a larger population that they might be a random selection from). The estimates can be regarded as outputs from a meta-analysis, with the monitoring sites and plots treated as separate studies (Borenstein et al. 2009).
The nest model used a random intercept, a fixed effect for time trend and Poisson regression (reflecting that the response variable is a count). Fledging success was modelled in a similar way, but with an offset for the number of nests counted in the
monitoring plot to allow for the use of a Poisson model. This effectively models the number of fledglings in proportion to the number of nests in the plot. Three location level variables associated with the nest-chick monitoring sites were included in the models as fixed effects: island/mainland, predator suite present, and level of disturbance from people (researchers and visitors). The predator suites at the monitoring plots were no predators, the native weka only, and all mammalian predators and no weka (all mainland). Thus, the island and predator variables were closely associated, with the distinction that the predator variable split islands between those with no predators or those with weka only. Taumaka Island was assigned a high level of disturbance because of the daily presence of researchers during the breeding season at the monitoring site and the fact that adult birds were captured as part of the research programme. Monro Beach and Jackson Head monitoring sites were assigned a moderate level of disturbance because of the demographic study carried out at both sites (Otley et al. 2017) and the presence of visitors on the coastlines below the colonies. The other monitoring sites were all assigned a low level of disturbance.
The effects of the three location level variables were assessed using Akaike’s information criterion (AIC) values. We evaluated models for levels and time trend in the nest counts and fledgling rate, with or without each of the location-level variables, including possibly interactions for each with the trend ranking the models by their corrected Akaike’s Information Criterion (AICc) score. Model-averaging for parameters of interest was applied to models within three units of the delta AICc of the top-ranked model.
Demographic modelling approachAs adult male and female Fiordland crested penguin survival rates are not significantly different (Otley et al. 2017), a single-sex deterministic Leslie matrix was employed to model the population growth rate, using the PopTools add-in (Hood 2010) for Microsoft Excel (Microsoft Corporation). The Leslie matrix requires survival rates of the species in the different age classes, reproductive rates (i.e. total young/total potential breeders) and age at first breeding (Caswell 2001). The age at which most Fiordland crested penguins first breed is considered to be 5 years (Otley et al. 2017).
A mark-recapture study at Monro Beach and Jackson Head conducted between 1994 and 2010 estimated both true and apparent annual adult survival of Fiordland crested penguin at 0.89 ± 0.1 and annual survival of young birds until their first return at 0.77 ± 0.02, which was at a mean age of 3 years, and with no discernible annual differences or differences between the two sites (Otley et al. 2017; Table 2). The annual rate of
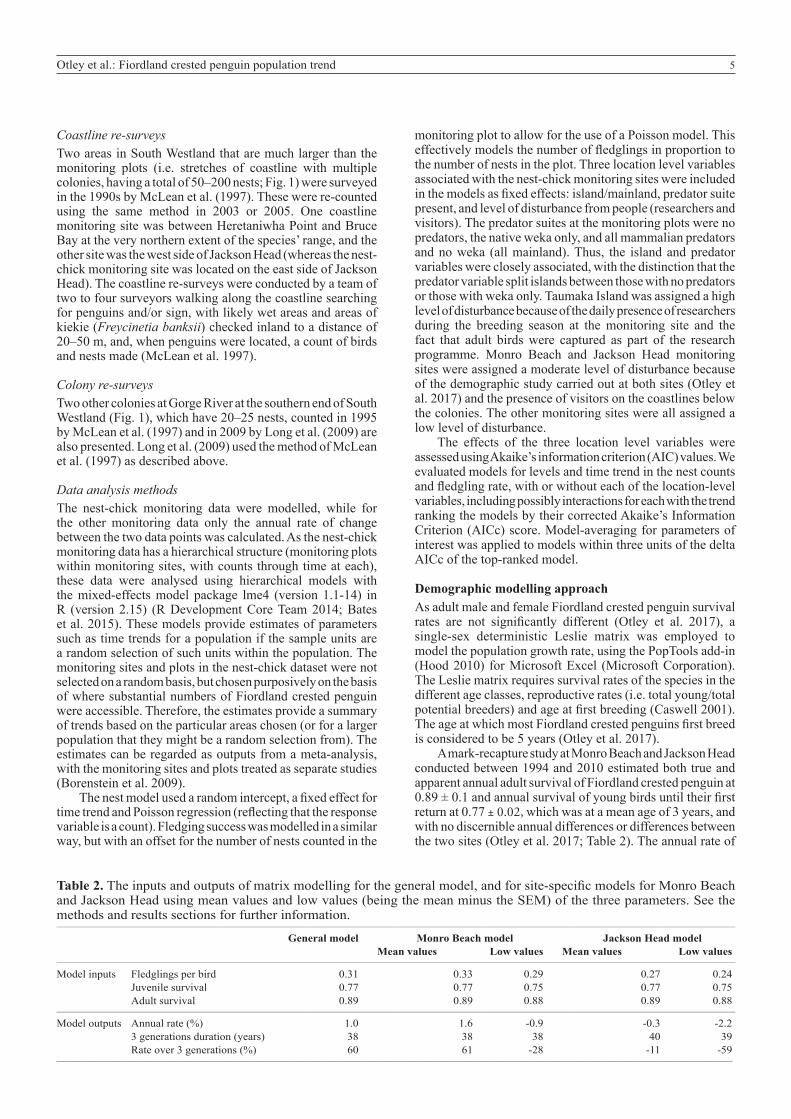
Table 2. The inputs and outputs of matrix modelling for the general model, and for site-specific models for Monro Beach and Jackson Head using mean values and low values (being the mean minus the SEM) of the three parameters. See the methods and results sections for further information.__________________________________________________________________________________________________________________________________________________________________
General model Monro Beach model Jackson Head model Mean values Low values Mean values Low values__________________________________________________________________________________________________________________________________________________________________
Model inputs Fledglings per bird 0.31 0.33 0.29 0.27 0.24 Juvenile survival 0.77 0.77 0.75 0.77 0.75 Adult survival 0.89 0.89 0.88 0.89 0.88__________________________________________________________________________________________________________________________________________________________________
Model outputs Annual rate (%) 1.0 1.6 -0.9 -0.3 -2.2 3 generations duration (years) 38 38 38 40 39 Rate over 3 generations (%) 60 61 -28 -11 -59_________________________________________________________________________________________________________________________
6 New Zealand Journal of Ecology, Vol. 42, No. 2, 2018
juvenile survival is likely to be lower than 0.77 during the first year and higher in subsequent years, but as we could not estimate these rates, we have used 0.77 for ages one to three. The breeding frequency of the Fiordland crested penguin is not known, and so the mean breeding success rate (fledglings per pair) was used in the model.
Separate matrix models were run for the two mark-recapture sites because they had different mean fledgling success, which was 0.66 ± 0.08 fledglings per pair at Monro Beach and 0.53 ± 0.04 fledglings per pair at Jackson Head (Otley et al. 2017; Table 2). A third model (general model) was also run using the mean fledgling success of all the 14 nest-chick monitoring sites (0.61 fledglings per pair; Otley et al. 2017). Elasticity analysis in PopTools was used to identify the relative contribution of the demographic parameters to the population growth rate (Caswell 2001).
Trend over three generationsThe population trend was calculated over a period of three generations, as this is the standard assessment for identifying threat ranking (three generations or 10 years, whatever is longer
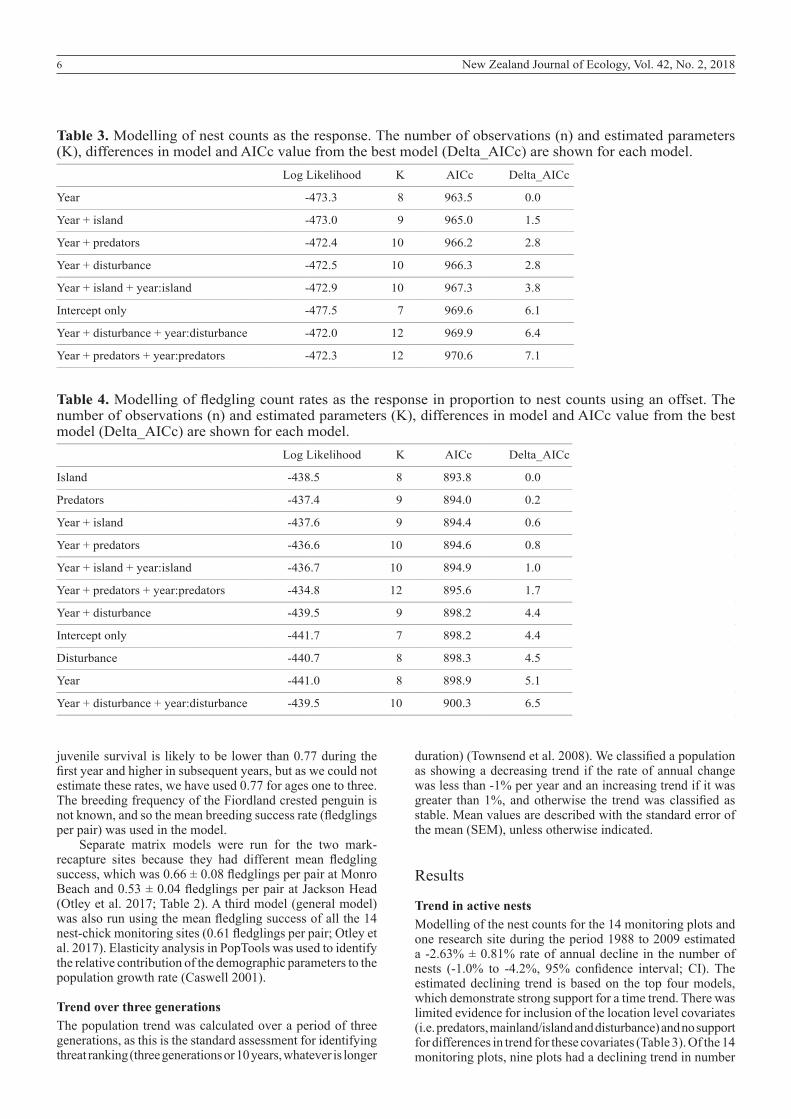
Table 3. Modelling of nest counts as the response. The number of observations (n) and estimated parameters (K), differences in model and AICc value from the best model (Delta_AICc) are shown for each model.__________________________________________________________________________________________________________________________________________________________________
Log Likelihood K AICc Delta_AICc__________________________________________________________________________________________________________________________________________________________________
Year -473.3 8 963.5 0.0__________________________________________________________________________________________________________________________________________________________________
Year + island -473.0 9 965.0 1.5__________________________________________________________________________________________________________________________________________________________________
Year + predators -472.4 10 966.2 2.8__________________________________________________________________________________________________________________________________________________________________
Year + disturbance -472.5 10 966.3 2.8__________________________________________________________________________________________________________________________________________________________________
Year + island + year:island -472.9 10 967.3 3.8__________________________________________________________________________________________________________________________________________________________________
Intercept only -477.5 7 969.6 6.1__________________________________________________________________________________________________________________________________________________________________
Year + disturbance + year:disturbance -472.0 12 969.9 6.4__________________________________________________________________________________________________________________________________________________________________
Year + predators + year:predators -472.3 12 970.6 7.1__________________________________________________________________________________________________________________________________________________________________
Table 4. Modelling of fledgling count rates as the response in proportion to nest counts using an offset. The number of observations (n) and estimated parameters (K), differences in model and AICc value from the best model (Delta_AICc) are shown for each model.__________________________________________________________________________________________________________________________________________________________________
Log Likelihood K AICc Delta_AICc__________________________________________________________________________________________________________________________________________________________________
Island -438.5 8 893.8 0.0__________________________________________________________________________________________________________________________________________________________________
Predators -437.4 9 894.0 0.2__________________________________________________________________________________________________________________________________________________________________
Year + island -437.6 9 894.4 0.6__________________________________________________________________________________________________________________________________________________________________
Year + predators -436.6 10 894.6 0.8__________________________________________________________________________________________________________________________________________________________________
Year + island + year:island -436.7 10 894.9 1.0__________________________________________________________________________________________________________________________________________________________________
Year + predators + year:predators -434.8 12 895.6 1.7__________________________________________________________________________________________________________________________________________________________________
Year + disturbance -439.5 9 898.2 4.4__________________________________________________________________________________________________________________________________________________________________
Intercept only -441.7 7 898.2 4.4__________________________________________________________________________________________________________________________________________________________________
Disturbance -440.7 8 898.3 4.5__________________________________________________________________________________________________________________________________________________________________
Year -441.0 8 898.9 5.1__________________________________________________________________________________________________________________________________________________________________
Year + disturbance + year:disturbance -439.5 10 900.3 6.5__________________________________________________________________________________________________________________________________________________________________
duration) (Townsend et al. 2008). We classified a population as showing a decreasing trend if the rate of annual change was less than -1% per year and an increasing trend if it was greater than 1%, and otherwise the trend was classified as stable. Mean values are described with the standard error of the mean (SEM), unless otherwise indicated.
Results
Trend in active nestsModelling of the nest counts for the 14 monitoring plots and one research site during the period 1988 to 2009 estimated a -2.63% ± 0.81% rate of annual decline in the number of nests (-1.0% to -4.2%, 95% confidence interval; CI). The estimated declining trend is based on the top four models, which demonstrate strong support for a time trend. There was limited evidence for inclusion of the location level covariates (i.e. predators, mainland/island and disturbance) and no support for differences in trend for these covariates (Table 3). Of the 14 monitoring plots, nine plots had a declining trend in number
7Otley et al.: Fiordland crested penguin population trend
of active nests, at between -2.8% and -5.6% annually, and five plots had a stable trend. All the sites showed gradual change over time rather than sudden or stepwise changes (with the exception the first two data points at Martins Bay 2) (Fig. 2).
The two coastline surveys where there were c. 50 nests and <150 nests showed annual rates of decline of -1.2% and -2.6%, respectively, between the first count in the 1990s and the second count, 11–12 years later (Table 1). Of the two colony re-surveys (both at Gorge River with 20–25 nests each) where there were two counts 14 years apart, one colony had a 6.7% annual rate of increase and the other colony had no change (Table 1).
Fledging successModels of fledging success showed strong support for the inclusion of island or predator level covariates, but there was limited support for time trends (Table 4). There was no evidence to support the inclusion of human disturbance in the model. Model averages for three models including a simple time trend estimated a declining rate in fledging success of -1% per annum (95% CI decline of -2.4% to an increase of 0.5%). Fledging success based on the top ranked model was estimated at 0.55 fledglings per pair (95% CI 0.48–0.64 fledglings per pair) on the mainland, and much higher at 0.79 fledglings per pair on islands (95% CI 0.64–0.97 fledglings per pair).
Demographic modelling approachThe general matrix model using a mean fledgling success of all nest-chick monitoring plots (0.61 fledglings per pair) produced a population growth rate of 1.01 (Table 2). Elasticity analysis showed that the adult survival component proportionally contributed 0.624 compared to the breeding productivity and survival rates for the first 3 years components which were both 0.075.
The matrix model for Jackson Head where the mean fledgling success was 0.53 fledglings per pair produced a population growth rate of 0.997, i.e. an annual rate of -0.3% compared to annual trend of -3.5% in the number of nests (Tables 1 & 2). With a mean fledgling success of 0.66 fledglings per pair at Monro Beach, the population growth rate of this matrix model was 1.016, being an annual rate of increase of 1.6% compared to a nest occupancy trend of -3.6% annually. As the rates of change detected by the demographic modelling approach were larger than reported for the nest counting method, a matrix model for each site was also run using the lower rates of all three demographic parameters (being the mean minus the SEM) (Table 2). These models produced an annual rate of -2.2% per year at Jackson Head and of -0.9% per year at Monro Beach.
Trend over three generationsThe Monro Beach and Jackson Head matrix models using mean demographic parameters estimated generation times of 12.6 and 13.2 years. The population declines based on the nest count data at Monro Beach and Jackson Head were -64% and -66% over three generations, respectively (Table 2). The demographic modelling approach, in contrast, produced an increase of 61% over three generations at Monro Beach and a decline of -11% at Jackson Head, based on the model using mean values of the three parameters. Using the lower values of the demographic parameters, the population trend over three generations was a decline of -28% at Monro Beach and a decline of -59% at Jackson Head (Table 2).
Discussion
Population trajectoryIn this study, the two methods produced contrasting population trajectories, with the nest counts indicating a declining trend of -2.7% per year and a model using the means of the demographic parameters indicating an increasing trend of 1.0% per year. However, additional modelling using the lower estimates of the demographic parameters and the specific fledgling success rates detected at the two sites indicated declining trends of -0.9% per year and -2.2% per year. There are two possible explanations: the demographic modelling shows that the trend determined by the nest counts is influenced by the counting method and/or that the demographic rates used are for some reason incorrect and biased upwards, particularly the adult survival rate (because it has the most influence over the population growth rate).
We address the former possibility first. The counting population trend detection method involved only counting once, which will almost always yield an underestimate of the true number of nests and provides no means of expressing uncertainty (Hegg et al. 2012). However, provided there are not systematic biases in the single nest counts over time, a single count will provide adequate trend estimates, and if there are multiple monitoring sites (as in this study), the uncertainty can be reflected in the error estimate of the modelled rate of change. We could not identify any obvious biases in our dataset. One potential bias could have been associated with the changing composition of the monitoring team used over the 20-year study, but in each year at least one member of the team had previous experience of the method at the plots. There is also the concern that the method of annual counting disturbs the birds that nest within the monitoring plot and they move to a nest site outside of the plot area. However, the coastline monitoring method (two counts 11–12 years apart) also detected a decline and the level of disturbance was not a strong factor in the nest count model.
A number of potential issues were also identified with the demographic trend detection approach used. First, the mean fledgling success was used rather than the number of young produced per potential breeders because for Fiordland crested penguin it was not known how many breeders choose to breed in any one year. It has often been assumed that penguins of breeding age attempt to breed every year (Croxall 1984). However, this may not always be the case because a number of penguin species show large population changes over short temporal scales, and these events are not reflected in any long-term trends, indicating that birds are alive but not at colonies every year (e.g. northern rockhopper penguin, Cuthbert et al. 2009; southern rockhopper penguin, Crawford et al. 2008; Baylis et al. 2013b; Snares crested penguin, Hiscock & Chilvers 2016; macaroni penguin, Trathan et al. 2012; gentoo penguin Pygoscelis papua, Baylis et al. 2013a). The Fiordland crested penguin may also not attempt to breed every year because many monitoring sites showing considerable variation between years in the number of nests detected. In addition, St Clair et al. (1999) reported that annually 19% of Fiordland crested penguins known to be alive were not sighted and Otley et al. (2017) suggested that permanent emigration or temporary migration may account for 22% of the variability in the species survival estimate. The issue of the species potentially not breeding annually is also relevant to the coastline and colony re-survey datasets, which compared only two data points.
8 New Zealand Journal of Ecology, Vol. 42, No. 2, 2018
The rates of adult and juvenile survival used in the demographic model were similar to those estimated for other crested penguin species (Dehnhard et al. 2013; Horswill et al. 2014; Morrison et al. 2015) and therefore we assume that they are not inherently biologically high. Although the transition matrix model was most sensitive to adult survival, a 13% difference in mean fledgling success between Monro Beach and Jackson Head resulted in one site having a positive trajectory and one having a negative trajectory. Therefore, the use of fledglings produced per breeding pair rather than the number of fledglings divided by the potential breeders (which would likely be a lower rate, as explained above) may actually be crucial to interpreting the model result.
Due to our concerns about the reproductive parameters used in the model, we conclude that the trajectory indicated by the nest-chick data is more robust and should be used to inform management. Our view supports the most recent assessment of New Zealand threat status for Fiordland crested penguins of Nationally Vulnerable, due to the estimated of population of 5000+ individuals and a population declining at between -31% and -70% (Robertson et al. 2016; H. Robertson pers. comm.). That the species could have a declining population is not surprising given that most species of crested penguin are declining due to being at high risk from a number of anthropogenic threat factors, particularly habitat degradation and fisheries bycatch (Trathan et al. 2015). Six putative causes of decline have been identified for northern and southern rockhopper penguins (BirdLife International 2010) and these could equally apply to Fiordland crested penguin.
Threat 1 – Isolated mortality incidents caused by pandemic disease and toxic algal poisoningAs the trend of the Fiordland crested penguin is not a clear gradual decline, it is possible that pandemic disease or poisoning from an event such as harmful algal bloom may have played a role in the decline, as it has for the southern rockhopper penguin in the Falkland Islands (Baylis et al. 2013b). There is no documented instance of toxic algal poisoning of penguins in New Zealand (Trathan et al. 2015). The literature on infectious diseases and poisoning of New Zealand’s penguins is patchy, for both endemic and exotic diseases (Duignan 2001). For example, there have been periodic outbreaks of diseases in yellow-eyed penguins (Megadyptes antipodes), both in adults and chicks, and these have likely caused significant effects at the regional level (Seddon et al. 2013). However, it is often unclear whether the detected disease was the key factor, or whether the prevalence of disease was due to poor adult foraging success or paucity of nutritious prey items (King et al. 2012). For Fiordland crested penguins, high levels of adult or chick mortality have not been observed when penguin researchers have been working in colonies nor have they been reported by members of the public. However, few visits have been made to colonies during the moult period, when some disease and/or starvation events that cause death in high numbers of penguins occur (e.g. Keymer et al. 2001; Cooper et al. 2009). While pandemic disease and poisoning appears unlikely to have a major effect on the population trend of the Fiordland crested penguin, it remains as a potential threat and more information should be gathered where possible.
Threat 2 – Inter-specific competition and predation by marine mammalsTop-down changes in food web structure, leading to increased inter-specific competition between penguins and other higher
vertebrates (especially pinnipeds) have been suggested as a possible agent of decline of penguin populations (Trathan et al. 2012), but were identified not to be case for macroni penguins at South Georgia, despite the rapidly increasing population of Antarctic fur seals (Arctocephalus gazella) (Horswill et al. 2016). In New Zealand, the Fiordland crested penguin co-exists with the New Zealand fur seal (A. forsteri). However, at least in South Westland, the New Zealand fur seal also has a declining population trend (Roberts & Neale 2016) and therefore it is suggested that prey competition between the two species is unlikely to be a cause of the declining trend detected for Fiordland crested penguin.
Increasing secondary predation on penguins by increasing pinniped populations contributes to the decline of some penguin populations (Ryan & Kerr 2012; Schwarz et al. 2013; Horswill et al. 2016; Morrison et al. 2017). However, this is unlikely to be the case for Fiordland crested penguin in this study because New Zealand fur seals have never been observed purposively hunting Fiordland crested penguin in the waters adjacent to breeding colonies or in breeding areas (Warham 1974; DOC staff pers. obs.).
Threat 3 – Environmental variability and climate changeChanges in ocean conditions that cause decreased primary productivity or bottom-up driven food web shifts that reduce availability of favoured prey have been implicated in the decline in a number of seabird species (Lewison et al. 2012). Crested penguin populations in New Zealand’s sub-Antarctic region have declined significantly in the past century and rising ocean temperatures and subsequent changes in marine productivity are suspected to be the key factor (Cunningham & Moors 1994; Hilton et al. 2006; Hiscock & Chilvers 2014; Morrison et al. 2015). For the Fiordland crested penguin, there is no historical population information and the trend detected in this study covers only a 20-year period, therefore it is not possible to investigate how the species has been affected by rising ocean temperatures. However, Mattern et al. (2009) postulates that Snares penguin and Fiordland crested penguin may be less susceptible to this long-term change because they forage in the warm subtropical waters that have much higher primary production than the waters in the sub-Antarctic zone where the other crested penguin species forage.
Penguin species are also affected by the periodic and short-term marine and terrestrial climatic changes associated with the El Niño southern oscillation (Dehnhard et al. 2013; Boersma & Rebstock 2014; Morrison et al. 2015). This study recorded rates of Fiordland crested penguin occupancy and fledging success at monitoring sites to vary inter-annually over the 20-year period, indicating a likelihood that they were affected by the El Niño and La Nina events that occurred during this period. The effect of such fluctuations requires further investigation.
Threat 4 – Fisheries interactions: competition for marine prey and bycatchThere is limited knowledge of the foraging ecology of the Fiordland crested penguin. The diet during the breeding season at one site in both Fiordland and South Westland was made up predominantly of cephalopods (85%), compared to 85% fish on Codfish Island (van Heezik 1989, 1990). However, Mattern et al. (2009) pointed out that the importance of cephalopods may have been over-estimated due to the methodological analysis used by van Heezik (1989). A preference for arrow squid (Nototodarus sloanii) indicates foraging over the continental
9Otley et al.: Fiordland crested penguin population trend
shelf, which in South Westland is up to 10 km from the coast. Mattern (2013) reports on observations of the species on the northern coast of Stewart Island foraging within 2 km of the coast and within the fiord systems of the Fiordland region. Outside of the breeding season, reported sightings indicate that birds disperse around New Zealand’s North and South Islands, south to the sub-Antarctic zone, and also to south-eastern Australia (Taylor 2000). Given the limited dietary information and large area potentially used in the breeding and non-breeding seasons, it is difficult to assess the likelihood of Fiordland crested penguins having to compete with commercial fisheries, and even with more information direct evidence may be difficult to acquire (Trathan et al. 2015).
In terms of the threat of being accidently by-caught by a fishing vessel, penguins are generally at higher risk of significant interactions with net setting fisheries compared to trawl, long-lining or jig fisheries (Žydelisa et al. 2013). There is a ban on recreational and commercial set net fisheries to four nautical miles offshore along a small portion of the Fiordland crested penguin’s breeding range (including all the South Westland breeding area and along the South Island’s south coast), but set netting is still permitted in most areas of Fiordland and around the Stewart Island archipelago. During the non-breeding season, Fiordland crested penguins may also interact with various fisheries, particularly set net fisheries in other regions around New Zealand and potentially in south-east Australia. New Zealand has a programme of scientific observers on the commercial fishing fleets but there is very low coverage of the net setting fishing fleets in the south-western and southern sectors of New Zealand waters (Ramm 2012). However, the species has been assessed as having a low risk of fisheries-related mortality (Richard & Abraham 2015). The foraging areas and diet of the species needs to be more fully understood, as well as observer coverage improved, before the potential threats associated with commercial fisheries can be more adequately assessed.
Threat 5 – Presence of peoplePenguins are often disturbed when scientists are present in breeding colonies to make observations and to capture adults and chicks, and also when visitors are within or close to nesting areas and on beaches where birds come ashore, but it remains unclear whether the disturbance effects have colony-level population consequences (Seddon & Ellenberg 2008). For the Fiordland crested penguin, the majority of breeding colonies and moulting areas are well away from inhabited areas, roads, and popular tramping and deer hunting areas. Monro Beach is the only terrestrial site where Fiordland crested penguin viewing is advertised by the Department of Conservation, and visitors are asked to stay on the beach and not to enter the forest where the species breeds. In this study, monitoring sites with different levels of people disturbance (scientist and visitor presence) do not have different trends. It is considered that human presence is unlikely to be a population-wide factor affecting the trajectory of the species.
Road traffic is also recognised as contributing factor to the decline of penguin populations in New Zealand, particularly populations of little penguin on the West Coast on the South Island (Heber et al. 2008). There are two sites in South Westland where road kills of Fiordland crested penguins have been reported and both sections of road have signs warning drivers to the potential presence of penguins. However, few Fiordland crested penguin colonies and moulting areas are near roads and this factor may be only a colony-level casual factor.
Threat 6 – Terrestrial predationTerrestrial predation is recognised as a critical threat for a number of Eudyptes species, for example northern and southern giant petrels (Macronectes halli and M. giganteus, respectively) predating on macaroni penguins (Horswill et al. 2016) and brown skuas (Catharacta antarctica lonnbergi) predating on southern rockhopper penguins (Morrison et al. 2017). Across its range, the Fiordland crested penguin encounters a multitude of introduced and native animals that prey on eggs, chicks and adults. There are ten known predator-free islands with Fiordland crested penguins, holding approximately a total of 450 nests (or 20%) of the known population (McLean et al. 1997). Sixty percent of the population breeds on Stewart Island and on the mainland South Island, which have rats, mice (Mus musculus), cats, dogs and possums (Trichosurus vulpecula), and there are also stoats on mainland South Island. Another 20% of the total population is estimated to breed on islands free of mammalian predators except for the native weka.
Weka are found on various islands and on the mainland of the South Island where Fiordland crested penguins breed (Department of Conservation 1999). The level of egg, chick and adult mortality caused by weka is unclear. On Taumaka Island, where there is a higher weka population than found on the mainland, weka were responsible for 38% of total egg mortality and 20% of total chick mortality, although some of the predation by weka may have been facilitated by the parent birds temporarily abandoning their nests due to scientist presence (St Clair & St Clair 1992).
The rates of egg, chick and adult Fiordland crested penguin predation by introduced pests has not been assessed, but inferences can be made using reported and suspected rates for other penguin species in New Zealand. Stoats and other mustelid species are able to successfully prey on chicks and adults of most bird species in New Zealand that are generally less than 800–1200 g (McLennan et al. 2004), although a stoat has been observed attempting to kill an adult Fiordland crested penguin (Morrison 1980). Fiordland crested penguin chicks reach the safe body mass at the stage when they are left unattended by a parent and therefore, in theory, they should be relatively safe from stoat predation. Little penguins (King et al. 2012) and yellow-eyed penguins (Heber et al. 2008) are predated at low rates by feral cats , but in South Westland and Fiordland feral cats are considered relatively uncommon due to the high rainfall levels (King 1990). Uncontrolled dogs can also cause high levels of penguin mortality (for example of little penguins, Hocken 2000, 2005; Heber et al. 2008; Lane 2017). For Fiordland crested penguins, it is suspected that pet dogs could be present permanently or infrequently at one-fifth to one-third of all mainland colonies, primarily in the most northerly (i.e. South Westland) part of their range. Dog predation may have an effect at the colony-level only and potentially at the regional-level in South Westland.
If predation were a substantive factor in the decline of the Fiordland crested penguin, monitoring plots with predators would be declining more rapidly than plots with fewer predator species. However, our study found little evidence that the suite of predators present at monitoring sites influences the trend of nest occupancy and breeding success, although the analysis may have suffered with the lack of replicates for some predator suites (e.g. predator-free sites). A similar result was also found for little penguin colonies on the West Coast, where there was no significant differences in breeding success between colonies with or without mustelid control during the breeding season (Wilson et al. 2012), even though another
10 New Zealand Journal of Ecology, Vol. 42, No. 2, 2018
study on the West Coast found that 6% of all eggs laid and up to 11% of all chicks were taken by predators (Heber et al. 2008). The same has also been detected for mustelid trapping around yellow-eyed penguins; the management activity was not correlated with penguin population growth rate (Busch & Cullen 2008).
Further monitoring using a more precise method and more replicates of predator suite may reveal differences in population trajectories for Fiordland crested penguin colonies living with different predator suites, but there is currently insufficient evidence to demonstrate a key relationship between population trend and predators. However, there seems little reason to suppose that at least part of the explanation for the population trajectory of the Fiordland crested penguin is different to that of the many other birds in New Zealand that are declining in the presence of introduced predators (e.g. Department of Conservation 1999; Elliott et al. 2010; Hegg et al. 2013). Indeed, controlling predators may be one of the few management activities that could be undertaken to address and/or prevent decline in Fiordland crested penguins.
ConclusionsThe Fiordland crested penguin appears to be in decline, but there is insufficient understanding of the species, particularly its foraging ecology and some potential threats (e.g. fisheries interactions, terrestrial predation and climate variability) to confidently identify the management actions that would halt population decline and/or lead to population growth. These knowledge gaps are identified in the Department of Conservation’s Fiordland crested penguin recovery strategy (Department of Conservation 2012). Partnerships and collaborations have been established and investigations commenced on the foraging ecology of the species (see www.tawaki-project.org) and the role of terrestrial predation (see www.bluepenguin.org.nz/fiordland-crested-penguin).
Monitoring should continue, and we recommend nest counts because it is less intrusive and takes less time and effort than a demographic modelling approach. The single nest count method produced an adequate level of error of the mean rate of change for the purposes of detecting whether the trend was positive, negative or stable (i.e. a trend of -2.63% per year had a CI of -1.0% to -4.2% per year). However, if monitoring was required to assess whether management actions were affecting positive change, then a method with a narrower confidence interval such as a double count method (see Ellenberg et al. 2015) should be used.
Acknowledgements
We thank all the people involved in this long-term programme, including everyone who undertook the nest/chick counts and mark-recapture monitoring. For the work in South Westland, we especially recognise the work of Martin Abel, Megan Hieatt, Abi Fay, Karen Mayhew, Gareth Hopkins and Kath Morris. We also wish to thank Graeme Taylor and John Lyall for their technical input and guidance of the programme, as well as their help in the field. Thanks also to Ingrid Gruner for helpful statistical advice, to Cielle Stephens for map production and to Paul Scofield for discussions about the modelling. Colleen Cassidy St Clair and Robin Long kindly allowed their data to be included in the analysis. A review by Kyle Morrison helped improve an early draft of the manuscript, and the feedback from three referees (Amy Whitehead, Louise Chilvers and one anonymous) also led to significant improvements.
References
Bates D, Maechler M, Bolker B, Walker S 2015. Fitting linear mixed-effects models using lme4. Journal of Statistical Software 67: 1–48.
Baylis AMM, Crofts S, Wolfaardt AC 2013a. Population trends of gentoo penguins Pygoscelis papua breeding at the Falkland Islands. Marine Ornithology 41: 1–5.
Baylis AMM, Wolfaardt AC, Crofts S, Pistorius PA, Ratcliffe N 2013b. Increasing trend in the number of southern rockhopper penguins (Eudyptes c. chrysocome) breeding at the Falkland Islands. Polar Biology 36: 1007–1018.
BirdLife International 2010. Rockhopper penguins: a plan for research and conservation action to investigate and address population changes. Proceedings of an international workshop, Edinburgh, 3–5 June 2008. UK, BirdLife International. 129 p.
BirdLife International 2016. Species factsheet: Eudyptes pachyrhynchus. www.birdlife.org (accessed 17/05/2016).
Boersma PD, Rebstock GA 2014. Climate change increases reproductive failure in Magellanic penguins. PLoS ONE 9: e85602.
Borboroglu PG, Boersma PD eds. 2013. Penguins: natural history and conservation. Seattle, University of Washington Press. 360 p.
Borenstein M, Hedges L, Higgins JPT, Rothstein HR 2009. Introduction to meta-analysis. Chichester, Wiley. 456 p.
Busch J, Cullen R 2008. Effectiveness and cost-effectiveness of yellow-eyed penguin recovery. Ecological Economics 68: 762–776.
Caswell H 2001. Matrix population models: construction, analysis and interpretation. Massachusetts, Sinauer Associates. 722 p.
Cooper J, Crawford RJM, de Villiers MS, Dyer BM, Hofmeyr GJG, Jonker A 2009. Disease outbreaks among penguins at sub-Antarctic Marion Island: a conservation concern. Marine Ornithology 37: 193–196.
Crawford RJM, Makhado AB, Upfold L, Dyer BM 2008. Mass on arrival of rockhopper penguins at Marion Island correlated with breeding success. African Journal of Marine Science 30: 185–188.
Croxall J 1984. Seabirds. In: Laws RM ed. Antarctic ecology, Vol. 2. London, Academic Press. Pp. 533–616.
Cunningham DM, Moors PJ 1994. The decline of rockhopper penguins Eudyptes chrysocome at Campbell Island, Southern Ocean and the influence of rising sea temperatures. Emu 94: 27–36.
Cuthbert R, Cooper J, Burle H-J, Glass CJ, Glass JP, Glass S, Glass T, Hilton GM, Sommer ES, Wanless RM, Ryan PG 2009. Population trends and conservation status of the northern rockhopper penguin Eudyptes moseleyi at Tristan da Cunha and Gough Island. Bird Conservational International 19: 1–12.
Dehnhard N, Poisbleau M, Demongin L, Ludynia K, Lecoq M, Masello JF, Quillfeldt P 2013. Survival of rockhopper penguins in times of global climate change. Aquatic Conservation: Marine Freshwater Ecosystems 23: 777–789.
Department of Conservation 1999. Weka (Gallirallus australis) recovery plan 1999 – 2009. Threatened species recovery plan 29. Wellington, New Zealand, Department of Conservation. 90 p.
Department of Conservation 2012. Fiordland crested penguin Tawaki Recovery Strategy 2012 – 2017. Wellington, New
11Otley et al.: Fiordland crested penguin population trend
Zealand, Department of Conservation. 25 p.Duignan PJ 2001. Diseases of penguins. Surveillance 28: 5–11.Ellenberg U, Edwards E, Mattern T, Hiscock JA, Wilson R,
Edmonds H 2015. Assessing the impact of nest searches on breeding birds – a case study on Fiordland crested penguins (Eudyptes pachyrhynchus). New Zealand Journal of Ecology 39: 231–244.
Elliott GP, Wilson PR, Taylor RH, Beggs JR 2010. Declines in common, widespread native birds in a mature temperate forest. Biological Conservation 143: 2119–2126.
Heber S, Wilson K-J, Molles L 2008. Breeding biology and breeding success of the blue penguin (Eudyptula minor) on the West Coast of New Zealand’s South Island. New Zealand Journal of Zoology 35: 63–71.
Hegg D, Giroir T, Ellenberg U, Seddon PJ 2012. Yellow-eyed penguin (Megadyptes antipodes) as a case study to assess the reliability of nest counts. Journal of Ornithology 153: 457–466.
Hegg D, MacKenzie DI, Jamieson IG 2013. Use of Bayesian population viability analysis to assess multiple management decisions in the recovery programme for the endangered takahe Porphyrio hochstetteri. Oryx 47: 144–152.
Hilton GM, Thompson DR, Sagar PM, Cuthbert RJ, Cherel Y, Bury SJ 2006. A stable isotopic investigation into the causes of decline in a sub-Antarctic predator, the rockhopper penguin Eudyptes chrysocome. Global Change Biology 12: 611–625.
Hiscock JA, Chilvers BL 2014. Declining eastern rockhopper (Eudyptes filholi) and erect-crested (E. sclateri) penguins on the Antipodes Islands, New Zealand. New Zealand Journal of Ecology 38: 124–131.
Hiscock JA, Chilvers BL 2016. Snares crested penguins Eudyptes robustus population estimates 2000–2013. New Zealand Journal of Ecology 40: 108–113.
Hocken AG 2000. Cause of death in blue penguins (Eudyptula m. minor) in North Otago, New Zealand. New Zealand Journal of Zoology 27: 305–309.
Hocken AG 2005. Necropsy findings in yellow-eyed penguins (Megadyptes antipodes) from Otago, New Zealand. New Zealand Journal of Zoology 32: 1–8.
Hood GM 2010. PopTools version 3.2.5. www.poptools.org.Horswill C, Matthiopoulos J, Green JA, Meredith MP, Forcada
J, Peat H, Preston M, Trathan PN, Ratcliffe N 2014. Survival in macaroni penguins and the relative importance of different drivers: individual traits, predation pressure and environmental variability. Journal of Animal Ecology 83: 1057–1067.
Horswill C, Ratcliffe N, Green JA, Phillips RA, Trathan PN, Matthiopoulos J 2016. Unravelling the relative roles of top- down and bottom-up forces driving population change in an oceanic predator. Ecology 97: 1919–1928.
Keymer IF, Malcolm HM, Hunt A, Horsley DT 2001. Health evaluation of penguins (Sphenisciformes) following mortality in the Falklands (South Atlantic). Diseases of Aquatic Organisms 45: 159–169.
King CM ed. 1990. The handbook of New Zealand mammals. Melbourne, Oxford University Press. 600 p.
King SD, Harper GA, Wright JB, McInnes JC, van der Lubbe JE, Dobbins ML, Murray SJ 2012. Site-specific reproductive failure and decline of a population of the endangered yellow-eyed penguin: a case for foraging habitat quality. Marine Ecology Progress Series 467: 233–244.
Lane R 2017. Practical solutions to penguin conservation on the West Coast. In: Agnew P ed. Proceedings of the 10th
Oamaru Penguin Symposium 2016. New Zealand Journal of Zoology 44: 163–175.
Lewison R, Oro D, Godley B, Underhill L, Bearhop S, Wilson RP, Ainley D, Arcos JM, Boersma PD, Borboroglu PG, Boulinier T, Frederiksen M, Genovart M, González-Solís J, Green JA, Grémillet D, Hamer KC, Hilton GM, Hyrenbach KD, Martínez-Abraín A, Montevecchi WA, Phillips RA, Ryan PG, Sagar P, Sydeman WJ, Wanless S, Watanuki Y, Weimerskirch H, Yorio P 2012. Research priorities for seabirds: improving conservation and management in the 21st century. Endangered Species Research 17: 93–121.
Long R, Stewart C, Long R, Otley H 2009. Surveys for Fiordland crested penguin from Sandrock Bluff to Longridge Point, South Westland, August and September 2009. An unpublished report of the West Coast Blue Penguin Trust and the Department of Conservation. Hokitika, New Zealand.
Mattern T 2013. Fiordland penguin. In: Borboroglu PG, Boersma PD eds. Penguins: natural history and conservation. Seattle, University of Washington Press. Pp. 153–167.
Mattern T, Houston D, Lalas C, Setiawan AN, Davis LS 2009. Diet composition, continuity in prey availability and marine habitat – keystones to population stability in the Snares Penguin (Eudyptes robustus). Emu 109: 204–213.
McLennan JA, Dew L, Joyce L, Miles J, Gillingham N, Waiwai R 2004. Size matters: predation risk and juvenile growth in North Island brown kiwi, Apteryx mantelli. New Zealand Journal of Ecology 20: 27–35.
McLean IG, Abel M, Challies CN, Heppelthwaite S, Lyall J, Russ RB 1997. The Fiordland crested penguin (Eudyptes pachyrhynchus) survey, stage V: mainland coastline, Bruce Bay to Yates Point. Notornis 44: 37–47.
Morrison K 1980. Bird and stoat encounters in Fiordland. Notornis 27: 324.
Morrison KW, Battley PF, Sagar PM, Thompson DR 2015. Population dynamics of eastern rockhopper penguins on Campbell Island in relation to sea surface temperature 1942–2012: current warming hiatus pauses a long-term decline. Polar Biology 38: 163–177.
Morrison KW, Armstrong DP, Battley FP, Jamieson SE, Thompson DR 2017. Predation by New Zealand sea lions and brown skuas is causing the continued decline of an eastern rockhopper penguin colony on Campbell Island. Polar Biology 40: 735–751.
Otley H, Tansell J, Scofield P 2017. A comprehensive demographic assessment of the endangered Fiordland crested penguin Eudyptes pachyrhynchus. New Zealand Journal of Zoology 44: 144–162.
Pütz K, Clausen AP, Huin N, Croxall JP 2003. Re-evaluation of historical rockhopper penguin population data in the Falkland Islands. Waterbirds 26: 169–175.
Ramm K 2012. Conservation services programme observer report, 1 July 2009 to 30 June 2010. Wellington, Department of Conservation. 121 p.
Richard Y, Abraham ER 2015. Assessment of the risk of commercial fisheries to New Zealand seabirds, 2006-07 to 2012-13. New Zealand Aquatic Environment and Biodiversity Report 162. Wellington, Ministry of Primary Industries. 89 p.
R Development Core Team 2014. R: a language and environment for statistical computing. Version 2.15. R Foundation for Statistical Computing, Vienna, Austria. www.R-project.org.
12 New Zealand Journal of Ecology, Vol. 42, No. 2, 2018
Roberts J, Neale D 2016. Census and individual size of New Zealand fur seal/keneko pups on the West Coast South Island from 1991 to 2016. Prepared for the Department of Conservation. NIWA Client Report 2016005WN. 28 p.
Robertson HA, Baird K, Dowding JE, Elliott GP, Hitchmough RA, Miskelly CM, McArthur N, O’Donnell CJ, Sagar PM, Scofield RP, Taylor GA 2016. Conservation status of New Zealand birds, 2016. New Zealand Threat Classification Series 11. Wellington, Department of Conservation. 27 p.
Robson B, Glass T, Glass N, Glass J, Green J, Repetto C, Rodgers G, Ronconi RA, Ryan PG, Swain G, Cuthbert RJ 2011. Revised population estimate and trends for the endangered northern rockhopper penguin Eudyptes moseleyi at Tristan da Cunha. Bird Conservation International 21: 454–459.
Ryan PG, Kerr J 2012. Is fur seal predation driving the decrease in northern rockhopper penguins Eudyptes moseleyi at Gough Island? Marine Ornithology 40: 69–71.
Schwarz LK, Goebel ME, Costa DP, Kilpatrick AM 2013. Top-down and bottom-up influences on demographic rates of Antarctic fur seals Arctocephalus gazelle. Journal of Animal Ecology 82: 903–911.
Seddon PJ, Ellenberg U 2008. Effects of human disturbance on penguins: the need for site- and species-specific visitor management guidelines. In: Higham J, Lück M eds. Marine wildlife and tourism management: insights from the natural and social sciences. CABI, Wallingford. Pp. 163–181.
Seddon PJ, Ellenberg U, van Heezik Y 2013. Yellow-eyed penguin. In: Borboroglu PG, Boersma PD eds. Penguins: natural history and conservation, University of Washington Press. Pp. 91–110.
St Clair CC, St Clair RC 1992. Weka predation on eggs and chicks of Fiordland crested penguin. Notornis 39: 60–63.
St Clair CC, McLean IG, Murie JO, Phillipson SM, Studholme BJS 1999. Fidelity to nest site and mate in Fiordland crested penguins. Marine Ornithology 27: 37–41.
Sutherland DR, Dann P 2013. Population trends in a substantial colony of little penguins: three independent measures over three decades. Biodiversity and Conservation 23: 241–250.
Taylor GA 2000. Action plan for seabird conservation in New Zealand. Part A: threatened seabirds. Threatened Species Occasional Publication No. 16. Wellington, New Zealand, Department of Conservation. 236 p.
Townsend AJ, de Lange PJ, Duffy CAJ, Miskelly CM, Molloy J, Norton DA 2008. New Zealand threat classification system manual. Wellington, Department of Conservation. 35 p.
Trathan PN, Ratcliffe N, Masden EA 2012. Ecological drivers of change at South Georgia: the krill surplus, or climate variability. Ecography 35: 983–993.
Trathan PN, Borboroglu PG, Boersma D, Bost C-A, Crawford RJM, Crossin GT, Cuthbert RJ, Dann P, Davis LS, de la Puente S, Ellenberg U, Lynch HJ, Mattern T, Pütz K, Seddon PJ, Trivelpiece W, Wienecke B 2015. Pollution, habitat loss, fishing, and climate change as critical threats to penguins. Conservation and Biology 29: 31–41.
van Heezik Y 1989. Diet of Fiordland crested penguin during the post-guard phase of chick growth. Notornis 36: 151–156.
van Heezik Y 1990. Diets of yellow-eyed, Fiordland crested, and little blue penguins breeding sympatrically on Codfish Island, New Zealand. New Zealand Journal of Zoology 17: 543–548.
Warham J 1974. The Fiordland crested penguin Eudyptes pachyrhynchus. Ibis 116: 1–23.
Wilson KJ, Lane R, Braidwood J, Columbus A, Davies I 2012. Cars, dogs and mustelids: mortality of little penguins on the West Coast, South Island, New Zealand. In: Agnew P. Proceedings of the 8th Oamaru Penguin Symposium 2012. New Zealand Journal of Zoology 40: 236–248.
Žydelisa R, Small C, French G 2013. The incidental catch of seabirds in gillnet fisheries: a global review. Biological Conservation 162: 76–88.
Editorial board member: Des SmithReceived 20 July 2016; accepted 14 December 2017