


April 7, 2009Presented by:
Tom WelchState Transportation Safety Engineer
Prepared with the Assistance of:
Dr. Tom Maze & Joshua Hochstein – Iowa State University
Iowa State University’s Center for Transportation Research and Education (CTRE) administers the following programs: Bridge Engineering Center • Center for Portland Cement Concrete Pavement Technology • Construction Management & Technology • Iowa Local Technical Assistance Program • Iowa Statewide Urban Design and Specifications• Iowa Traffic Safety Data Service • Midwest Transportation Consortium • Partnership for Geotechnical Advancement • Roadway Infrastructure Management Systems
IA-330/US-65/IA-117 & IA-330/F-17 Jasper County Intersections
Discussion of Design Alternatives

DEFINING THE PROBLEMWith Traditional Expressway Intersection Design
• Typical Problem: Far-Side Right-Angle Collisions
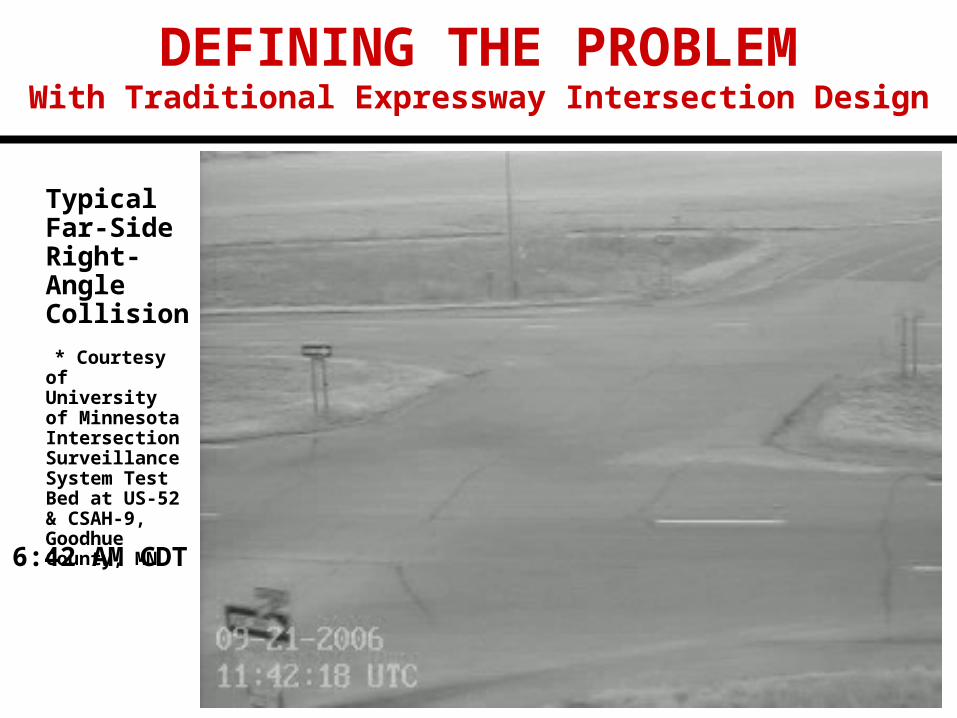
Typical Far-Side Right-Angle Collision
* Courtesy of University of Minnesota Intersection Surveillance System Test Bed at US-52 & CSAH-9, Goodhue County, MN
DEFINING THE PROBLEMWith Traditional Expressway Intersection Design
6:42 AM CDT

Locations:
IA-330 at County Road F-17 &
IA-330/US-65/IA-117
Jasper County
F-17
US
-65
IA-3
30
US-
65
IA-3
30
IA-1
17


Fatalities:
Major Injuries:
Indianola, Iowa47Brian Cole
Nevada, Iowa79Opal Kassel*
Collins, Iowa16Craig Hudson
Kamrar, Iowa73Dorothy Donahue
Kamrar, Iowa78Walter Donahue
IA-330 and Co Rd F-17
* Driver was former DOT Director
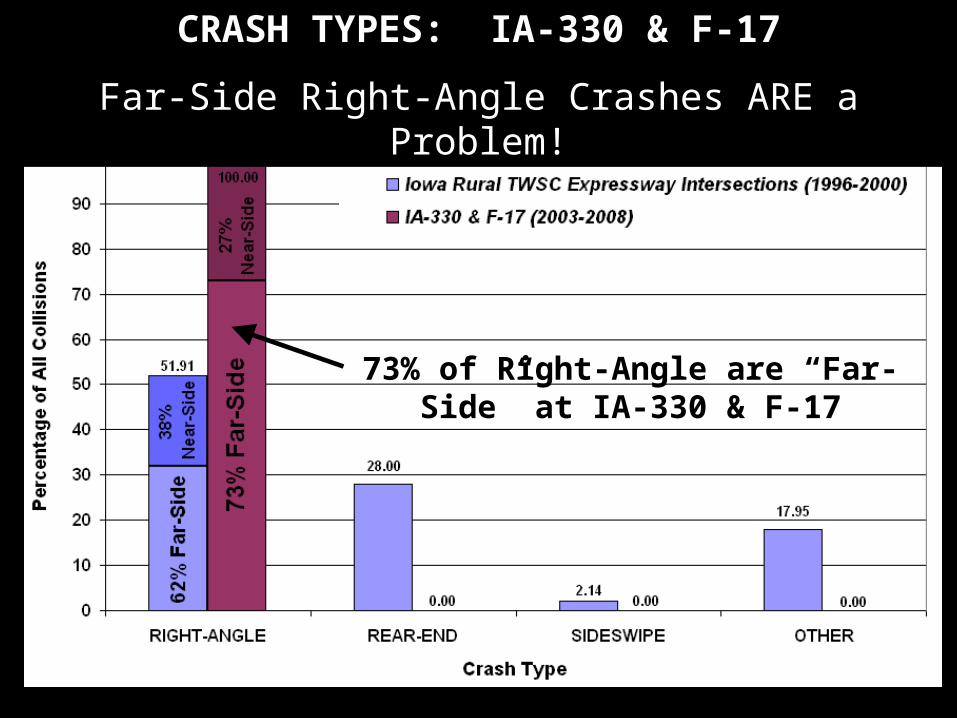
CRASH TYPES: IA-330 & F-17
Far-Side Right-Angle Crashes ARE a Problem!
73% of Right-Angle are “Far-Side” at IA-330 & F-17
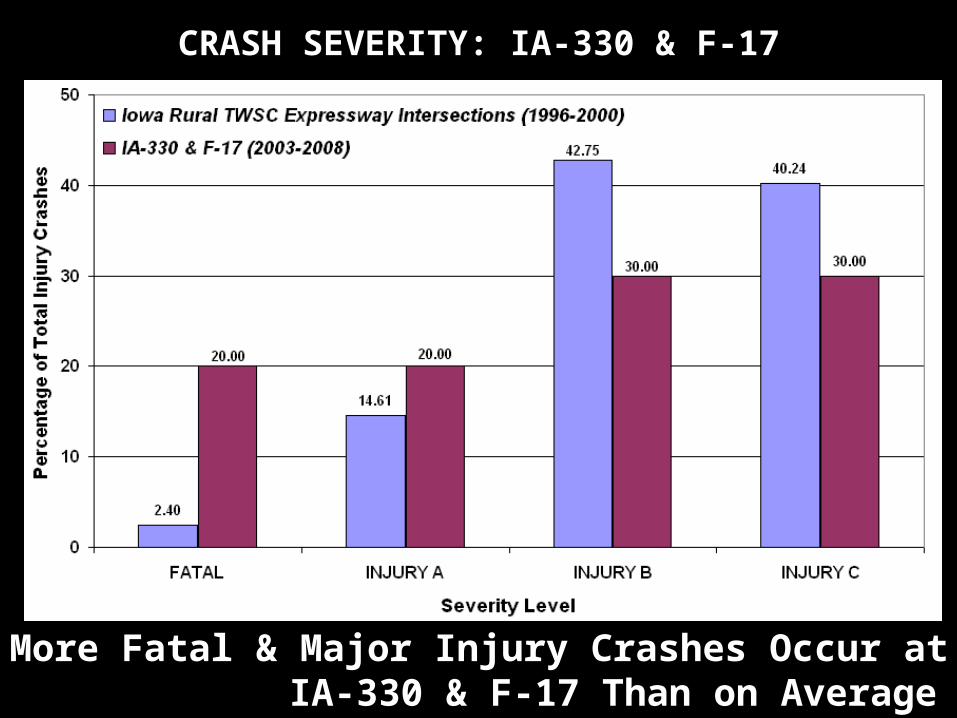
CRASH SEVERITY: IA-330 & F-17
Maze et al., 2004
[page 79]
More Fatal & Major Injury Crashes Occur at IA-330 & F-17 Than on Average

MINOR ROAD DRIVER AGE IN RIGHT-ANGLE CRASHES AT IA-330 & F-17
Elderly Drivers More Involved in these Collisions

Highway Crashes are Complex
Driver conditions and behavior A contributing factor in 95 percent of crashes Primary factor in 67 percent of crashes
Roadway design and environment A contributing factor in 28 percent of crashes Primary factor in 4 percent of crashes
Vehicle A contributing factor in 8 percent of crashes Primary factor in 4 percent of crashes

YOUNG & ELDERLY DRIVERS Vision and Cognition
Challenges
Peripheral Vision is important to making judgements about placement, speed, and gaps in moving traffic– Young drivers are still developing peripheral
vision– Along with other vision changes, older drivers
also begin to lose peripheral vision

The Teen Brain Is Still Under Construction
• Recent Scientific studies reveal that the teen brain is still under construction until about age 25.
• The Prefrontal Cortex is the last part to develop. It also controls: – risk-taking– judgment– impulse control– speed assessment– distance assessment– ability to handle distractions

Medical Factors - Aging Drivers
Eye Lens
• The lens of the eye becomes cloudy and yellow with age, giving faulty information for driving decisions.
Depth Perception • With age, people lose depth perception and peripheral
vision making it harder to judge distance and speed
Needed Light
• A 50-year-old needs 5 times more light to read than a 20-year old.
• At 60 he’ll need 10 times more light

ALTERNATIVES:

SIGNALIZATION
1) Creates Expressway Traffic Delay
2) Not Expected by Expressway Drivers
3) Don’t Necessarily Improve Safety (Change Crash Types, Not Severity)
4) Signals at the bottom of a hill are not desirable
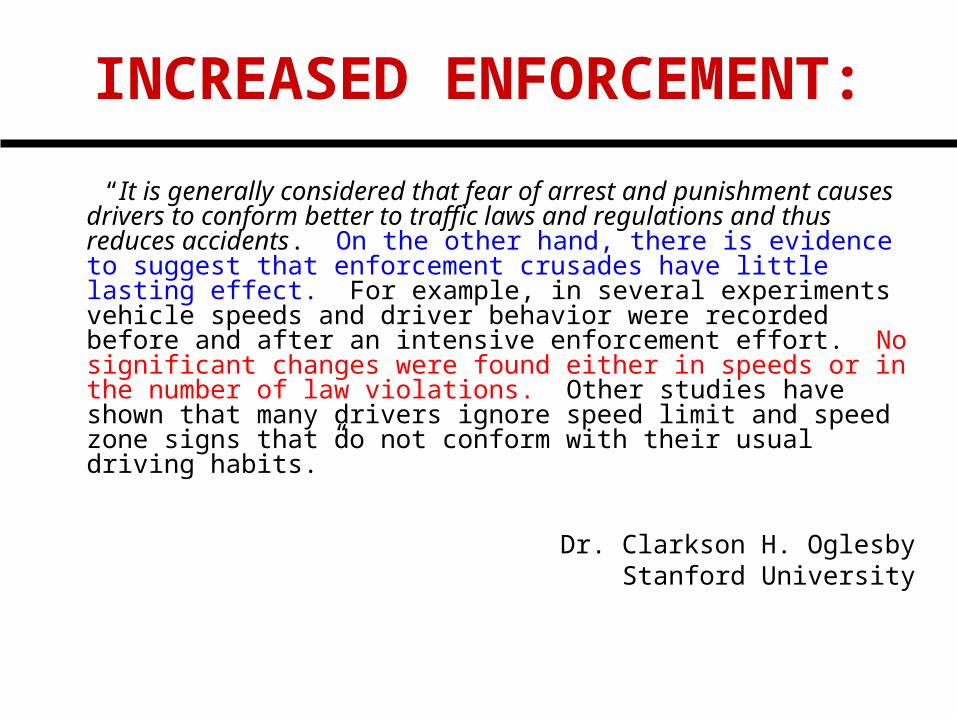
INCREASED ENFORCEMENT:
“It is generally considered that fear of arrest and punishment causes drivers to conform better to traffic laws and regulations and thus reduces accidents. On the other hand, there is evidence to suggest that enforcement crusades have little lasting effect. For example, in several experiments vehicle speeds and driver behavior were recorded before and after an intensive enforcement effort. No significant changes were found either in speeds or in the number of law violations. Other studies have shown that many drivers ignore speed limit and speed zone signs that do not conform with their usual driving habits.”
Dr. Clarkson H. OglesbyStanford University

Jasper Co. Sherriff Department Comments

Failure To Yield Right-of-Way Crashes2004 -2008
5-year average per/year
Vehicle Type that got pulled in front of Average annual crashes reported
This depicts crashes involving a causal driver who failed to yield the right-of-way to another vehicle at an
intersection
8 ft
16ft
16 ft
17 ft
18 ft
66 ft
149 Motorcycle
738 Van or mini-van
1224 Pickup, van, small bus
4742 Passenger car
815 Sport utility vehicle
269 Large Trucks

Cost Estimate: ≈ $7-10 Million
Safety Effectiveness Estimate:
≈ 60 – 80%
Diamond Interchang
e

Out-of-the-way travel distance depends on spacing of U-turns, but 1500 to 5000 feet extra travel can be expected for a J-Turn Intersection.
However, because the movements involved are less complex, the total delay time for indirect left-turn & crossing maneuvers may be equivalent to that of direct maneuvers at a traditional at-grade intersection.
THE J-TURN INTERSECTION

The J-Turn Intersection reduces the total number of intersection conflict points from 42 to 24, reduces the crossing conflicts from 24 to 4, and spreads out the conflict points over a larger area.
THE J-TURN INTERSECTION
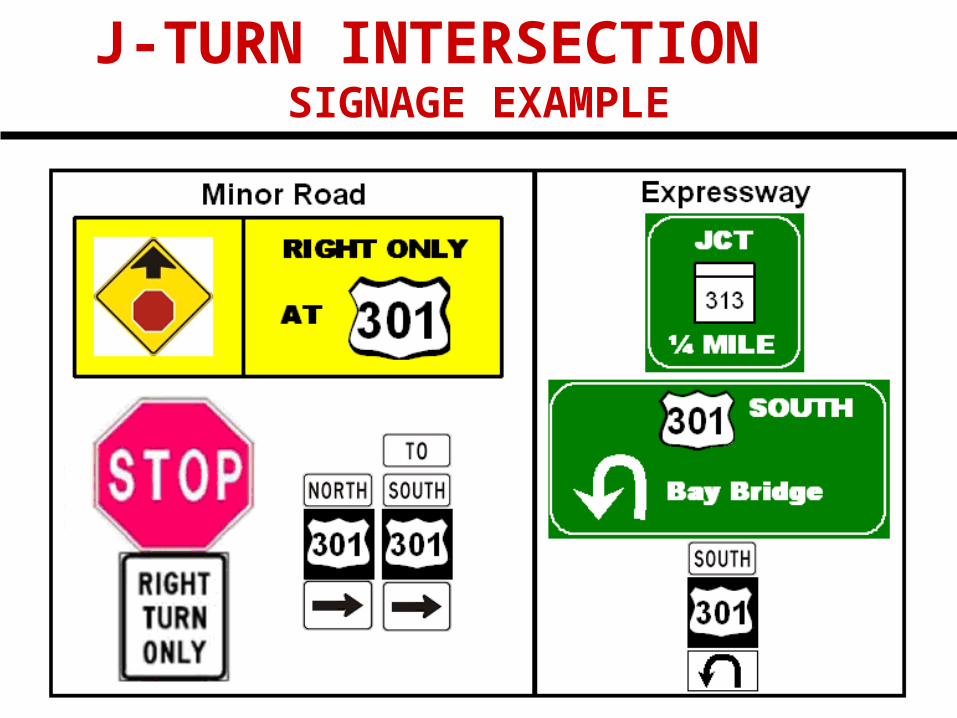
J-TURN INTERSECTION SIGNAGE EXAMPLE
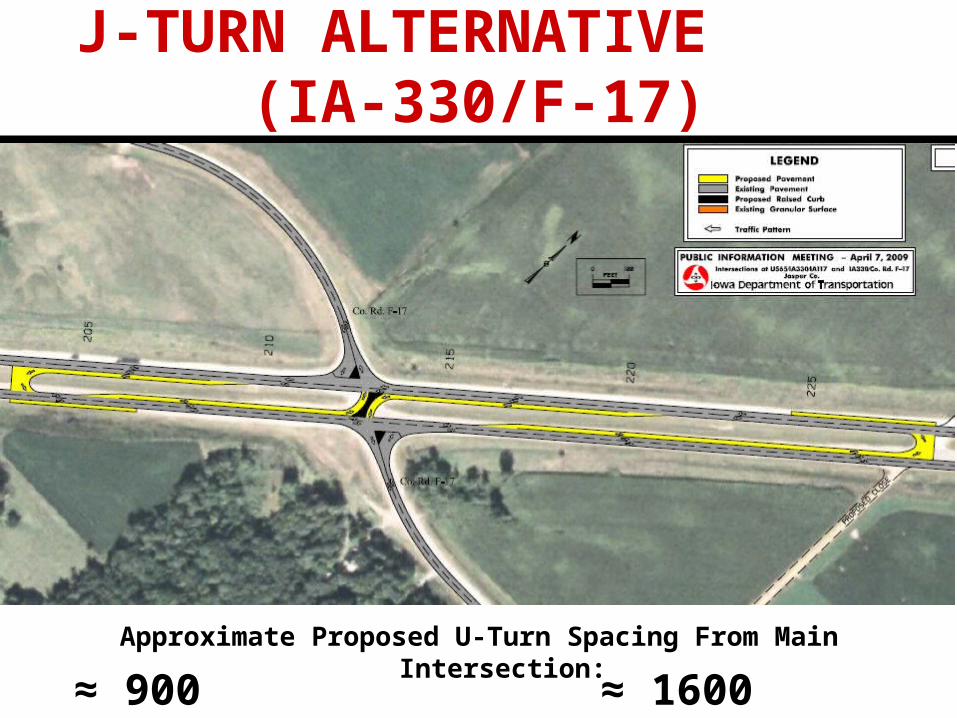
J-TURN ALTERNATIVE (IA-330/F-17)
Approximate Proposed U-Turn Spacing From Main Intersection:
≈ 900 feet ≈ 1600 feet

J-Turn Intersection at IA-330 & F-17 could…
Prevent 100% of the collisions which occurred there over the last 6 years.
THE J-TURN INTERSECTION


![Mayer, Tom - Analytical Marxism [Cap.6, The State]](https://static.cupdf.com/doc/110x72/544d95b4af7959f7178b4c4e/mayer-tom-analytical-marxism-cap6-the-state.jpg)