Appendix A
A Glossary of R Jargon
Below is a selection of common R terms defined using SAS/SPSS jargon (orplain English when possible) and R jargon. Some definitions in SAS/SPSSjargon are quite loose given the fact that they have no direct analog of someR terms. Items in italics are included in the glossary. Definitions in R terms areoften quoted (with permission) or paraphrased from S Poetry, by PatrickBurns [40].
Table A.1 Glossary of R Jargon
Defined in SAS/SPSS Terms Defined in R Terms
Apply The process of having a procedurework on variables orobservations/cases. Determineswhether a procedure will act as atypical procedure or as afunction instead. Also a functionthat does that.
The process of targeting a functionon rows or columns. Also afunction that does that.
Argument Parameter, option or setting thatcontrols what a procedure does.Includes variables to analyze.
Input to a function.
Array Multiple datasets that are linked inlayers. All variables must be onlyone type, e.g., all numeric or allcharacter.
A vector with a dim attribute. Thedim controls the number andsize of dimensions.
Assignmentfunction
The two-key sequence, ‘‘<–’’, thatplaces data or results ofprocedures or transformationsinto a variable or dataset.
The two-key sequence, ‘‘<–’’, thatgives names to objects.
Atomic object A variable whose values are all ofone type such as all numeric orall character.
An objectwhose components are allof one mode. Modes allowed arenumeric, character, logical, orcomplex.
Attach The process of adding a dataset oradd-on module to your path.Attaching a dataset appears tocopy the variables into an area
The process of adding a database toyour search list. Also a functionthat does this.
443
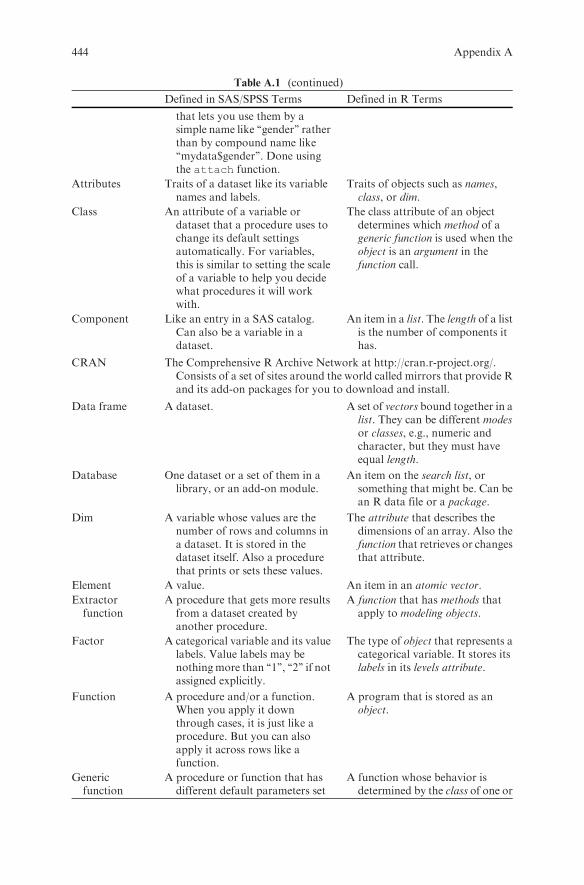
Table A.1 (continued)
Defined in SAS/SPSS Terms Defined in R Terms
that lets you use them by asimple name like ‘‘gender’’ ratherthan by compound name like‘‘mydata$gender’’. Done usingthe attach function.
Attributes Traits of a dataset like its variablenames and labels.
Traits of objects such as names,class, or dim.
Class An attribute of a variable ordataset that a procedure uses tochange its default settingsautomatically. For variables,this is similar to setting the scaleof a variable to help you decidewhat procedures it will workwith.
The class attribute of an objectdetermines which method of ageneric function is used when theobject is an argument in thefunction call.
Component Like an entry in a SAS catalog.Can also be a variable in adataset.
An item in a list. The length of a listis the number of components ithas.
CRAN The Comprehensive R Archive Network at http://cran.r-project.org/.Consists of a set of sites around the world called mirrors that provide Rand its add-on packages for you to download and install.
Data frame A dataset. A set of vectors bound together in alist. They can be different modesor classes, e.g., numeric andcharacter, but they must haveequal length.
Database One dataset or a set of them in alibrary, or an add-on module.
An item on the search list, orsomething that might be. Can bean R data file or a package.
Dim A variable whose values are thenumber of rows and columns ina dataset. It is stored in thedataset itself. Also a procedurethat prints or sets these values.
The attribute that describes thedimensions of an array. Also thefunction that retrieves or changesthat attribute.
Element A value. An item in an atomic vector.
Extractorfunction
A procedure that gets more resultsfrom a dataset created byanother procedure.
A function that has methods thatapply to modeling objects.
Factor A categorical variable and its valuelabels. Value labels may benothingmore than ‘‘1’’, ‘‘2’’ if notassigned explicitly.
The type of object that represents acategorical variable. It stores itslabels in its levels attribute.
Function A procedure and/or a function.When you apply it downthrough cases, it is just like aprocedure. But you can alsoapply it across rows like afunction.
A program that is stored as anobject.
Genericfunction
A procedure or function that hasdifferent default parameters set
A function whose behavior isdetermined by the class of one or
444 Appendix A
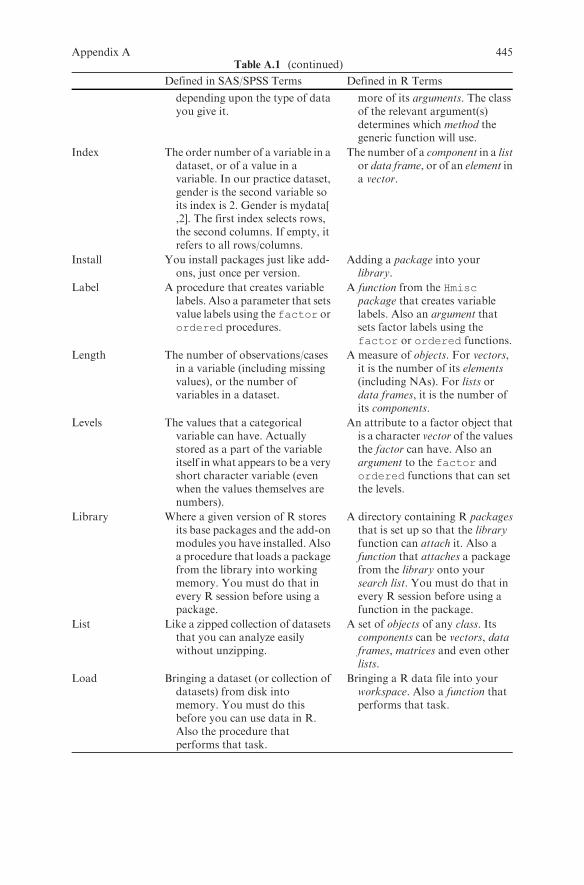
Table A.1 (continued)
Defined in SAS/SPSS Terms Defined in R Terms
depending upon the type of datayou give it.
more of its arguments. The classof the relevant argument(s)determines which method thegeneric function will use.
Index The order number of a variable in adataset, or of a value in avariable. In our practice dataset,gender is the second variable soits index is 2. Gender is mydata[,2]. The first index selects rows,the second columns. If empty, itrefers to all rows/columns.
The number of a component in a listor data frame, or of an element ina vector.
Install You install packages just like add-ons, just once per version.
Adding a package into yourlibrary.
Label A procedure that creates variablelabels. Also a parameter that setsvalue labels using the factor orordered procedures.
A function from the Hmiscpackage that creates variablelabels. Also an argument thatsets factor labels using thefactor or ordered functions.
Length The number of observations/casesin a variable (including missingvalues), or the number ofvariables in a dataset.
A measure of objects. For vectors,it is the number of its elements(including NAs). For lists ordata frames, it is the number ofits components.
Levels The values that a categoricalvariable can have. Actuallystored as a part of the variableitself in what appears to be a veryshort character variable (evenwhen the values themselves arenumbers).
An attribute to a factor object thatis a character vector of the valuesthe factor can have. Also anargument to the factor andordered functions that can setthe levels.
Library Where a given version of R storesits base packages and the add-onmodules you have installed. Alsoa procedure that loads a packagefrom the library into workingmemory. You must do that inevery R session before using apackage.
A directory containing R packagesthat is set up so that the libraryfunction can attach it. Also afunction that attaches a packagefrom the library onto yoursearch list. You must do that inevery R session before using afunction in the package.
List Like a zipped collection of datasetsthat you can analyze easilywithout unzipping.
A set of objects of any class. Itscomponents can be vectors, dataframes, matrices and even otherlists.
Load Bringing a dataset (or collection ofdatasets) from disk intomemory. You must do thisbefore you can use data in R.Also the procedure thatperforms that task.
Bringing a R data file into yourworkspace. Also a function thatperforms that task.
Appendix A 445
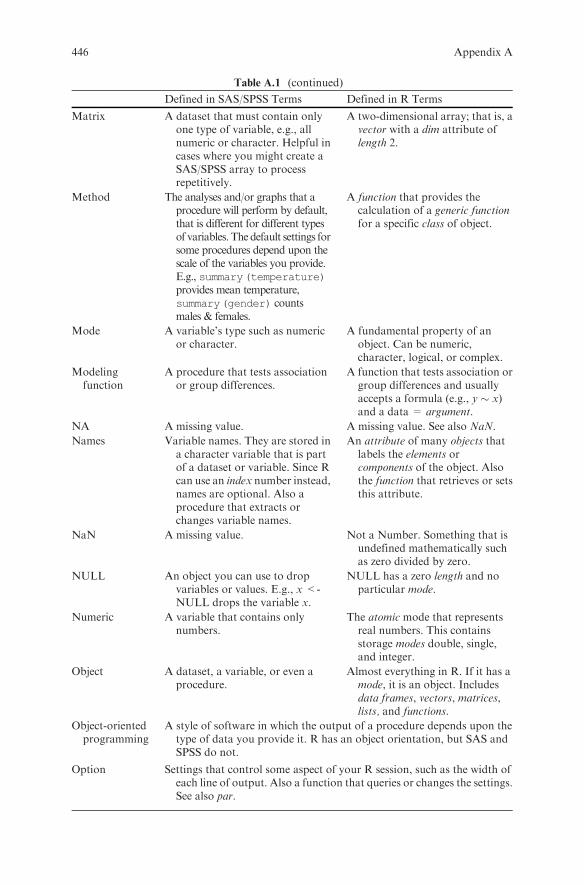
Table A.1 (continued)
Defined in SAS/SPSS Terms Defined in R Terms
Matrix A dataset that must contain onlyone type of variable, e.g., allnumeric or character. Helpful incases where you might create aSAS/SPSS array to processrepetitively.
A two-dimensional array; that is, avector with a dim attribute oflength 2.
Method The analyses and/or graphs that aprocedure will perform by default,that is different for different typesof variables. The default settings forsome procedures depend upon thescale of the variables you provide.E.g., summary(temperature)provides mean temperature,summary(gender) countsmales & females.
A function that provides thecalculation of a generic functionfor a specific class of object.
Mode A variable’s type such as numericor character.
A fundamental property of anobject. Can be numeric,character, logical, or complex.
Modelingfunction
A procedure that tests associationor group differences.
A function that tests association orgroup differences and usuallyaccepts a formula (e.g., y � x)and a data = argument.
NA A missing value. A missing value. See also NaN.
Names Variable names. They are stored ina character variable that is partof a dataset or variable. Since Rcan use an index number instead,names are optional. Also aprocedure that extracts orchanges variable names.
An attribute of many objects thatlabels the elements orcomponents of the object. Alsothe function that retrieves or setsthis attribute.
NaN A missing value. Not a Number. Something that isundefined mathematically suchas zero divided by zero.
NULL An object you can use to dropvariables or values. E.g., x <-NULL drops the variable x.
NULL has a zero length and noparticular mode.
Numeric A variable that contains onlynumbers.
The atomic mode that representsreal numbers. This containsstorage modes double, single,and integer.
Object A dataset, a variable, or even aprocedure.
Almost everything in R. If it has amode, it is an object. Includesdata frames, vectors, matrices,lists, and functions.
Object-orientedprogramming
A style of software in which the output of a procedure depends upon thetype of data you provide it. R has an object orientation, but SAS andSPSS do not.
Option Settings that control some aspect of your R session, such as the width ofeach line of output. Also a function that queries or changes the settings.See also par.
446 Appendix A
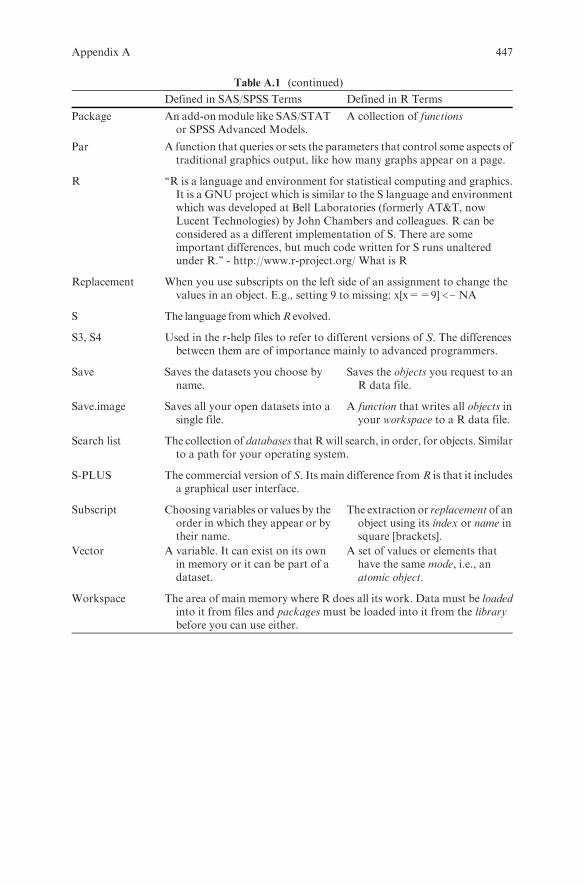
Table A.1 (continued)
Defined in SAS/SPSS Terms Defined in R Terms
Package An add-onmodule like SAS/STATor SPSS Advanced Models.
A collection of functions
Par A function that queries or sets the parameters that control some aspects oftraditional graphics output, like how many graphs appear on a page.
R ‘‘R is a language and environment for statistical computing and graphics.It is a GNU project which is similar to the S language and environmentwhich was developed at Bell Laboratories (formerly AT&T, nowLucent Technologies) by John Chambers and colleagues. R can beconsidered as a different implementation of S. There are someimportant differences, but much code written for S runs unalteredunder R.’’ - http://www.r-project.org/ What is R
Replacement When you use subscripts on the left side of an assignment to change thevalues in an object. E.g., setting 9 to missing: x[x==9] <– NA
S The language fromwhichR evolved.
S3, S4 Used in the r-help files to refer to different versions of S. The differencesbetween them are of importance mainly to advanced programmers.
Save Saves the datasets you choose byname.
Saves the objects you request to anR data file.
Save.image Saves all your open datasets into asingle file.
A function that writes all objects inyour workspace to a R data file.
Search list The collection of databases that Rwill search, in order, for objects. Similarto a path for your operating system.
S-PLUS The commercial version of S. Its main difference from R is that it includesa graphical user interface.
Subscript Choosing variables or values by theorder in which they appear or bytheir name.
The extraction or replacement of anobject using its index or name insquare [brackets].
Vector A variable. It can exist on its ownin memory or it can be part of adataset.
A set of values or elements thathave the same mode, i.e., anatomic object.
Workspace The area of main memory where R does all its work. Data must be loadedinto it from files and packages must be loaded into it from the librarybefore you can use either.
Appendix A 447

Appendix B
A Comparison of SAS and SPSS Products
with R Packages and Functions
With over 1200 add-on packages, many containing multiple procedures, R cando almost everything that SAS and SPSS can do and quite a bit more. Peopleare releasing new packages at a rapid pace and R can give you the latest countwith the following two commands. The first one uses the available.packages function to check Internet repositories for the packages that arecurrently available and store them in myPackageNames. The second commanddetermines the number of unique names.
> myPackageNames <- available.packages()
> length (unique( rownames(myPackageNames) ))
[1]1449
So at the time of publication, there were 1449 add-on packages! If you use thesetRepositories () function (or Packages> Select repositories . . . onWindows) to add the bioinformatic packages, the number is even higherat 2242.
Table B.1 below focuses only on SAS and SPSS products and which of themhave counterparts in R. As a result, some categories are extremely broad (e.g.,regression) while others are quite narrow (e.g., conjoint). This list does notcontain the hundreds of R packages that have no counterparts in the form ofSAS or SPSS products. There are many important topics (e.g., mixed models,offered by all three) that are not listed because neither SAS nor SPSS sell aproduct focused just on that.
Much more detailed information about R packages is available organized inTask Views at http://cran.r-project.org/web/views/index.html. Another site tosearch by task is at http://biostat.mc.vanderbilt.edu/s/finder/finder.html.Detailed information about most R packages is available at http://www.r-project.org/, choose CRAN, then choose a mirror, then choose Packages./
449
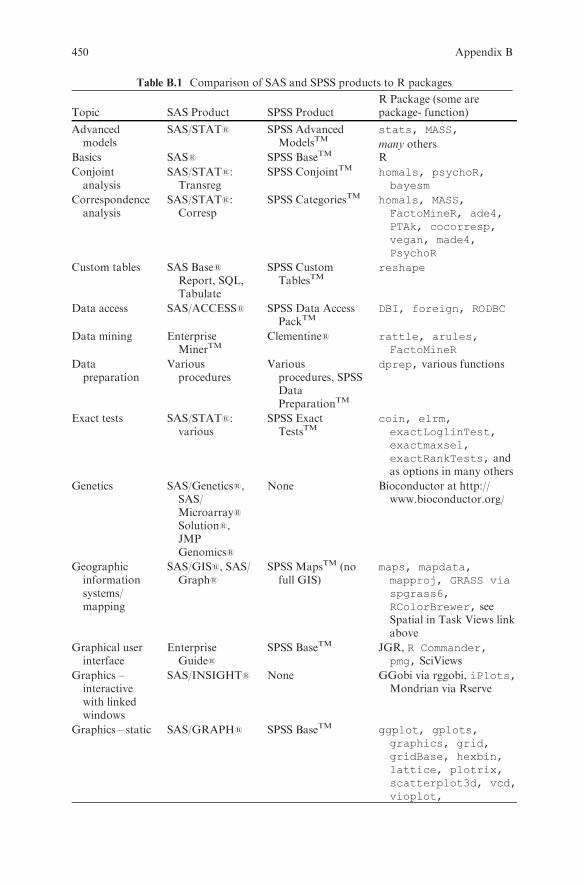
Table B.1 Comparison of SAS and SPSS products to R packages
Topic SAS Product SPSS ProductR Package (some arepackage- function)
Advancedmodels
SAS/STAT1 SPSS AdvancedModelsTM
stats, MASS,many others
Basics SAS1 SPSS BaseTM R
Conjointanalysis
SAS/STAT1:Transreg
SPSS ConjointTM homals, psychoR,bayesm
Correspondenceanalysis
SAS/STAT1:Corresp
SPSS CategoriesTM homals, MASS,FactoMineR, ade4,PTAk, cocorresp,vegan, made4,PsychoR
Custom tables SAS Base1
Report, SQL,Tabulate
SPSS CustomTablesTM
reshape
Data access SAS/ACCESS1 SPSS Data AccessPackTM
DBI, foreign, RODBC
Data mining EnterpriseMinerTM
Clementine1 rattle, arules,FactoMineR
Datapreparation
Variousprocedures
Variousprocedures, SPSSDataPreparationTM
dprep, various functions
Exact tests SAS/STAT1:various
SPSS ExactTestsTM
coin, elrm,exactLoglinTest,exactmaxsel,exactRankTests, andas options in many others
Genetics SAS/Genetics1,SAS/Microarray1
Solution1,JMPGenomics1
None Bioconductor at http://www.bioconductor.org/
Geographicinformationsystems/mapping
SAS/GIS1, SAS/Graph1
SPSS MapsTM (nofull GIS)
maps, mapdata,mapproj, GRASS viaspgrass6,RColorBrewer, seeSpatial in Task Views linkabove
Graphical userinterface
EnterpriseGuide1
SPSS BaseTM JGR, R Commander,pmg, SciViews
Graphics –interactivewith linkedwindows
SAS/INSIGHT1 None GGobi via rggobi, iPlots,Mondrian via Rserve
Graphics – static SAS/GRAPH1 SPSS BaseTM ggplot, gplots,graphics, grid,gridBase, hexbin,lattice, plotrix,scatterplot3d, vcd,vioplot,
450 Appendix B

Table B.1 (continued)
Topic SAS Product SPSS ProductR Package (some arepackage- function)
geneplotter,Rgraphics,
Guided analysis SAS/LAB1 None None
Matrix/linearalgebra
SAS/IML1,SAS/STATStudio1
SPSS MatrixTM R, matlab, Matrix,sparseM
Missing valuesimputation
SAS/STAT1: MI SPSS MissingValuesAnalysisTM
Hmisc - aregImpute,EMV,Design -fit.mult.impute,mice, mitools,mvnmle
Operationsresearch
SAS/OR1 None glpk, linprog,LowRankQP, TSP
Power analysis SAS1 Power andSample SizeApplication,SAS/STAT:Power, GLMPower
SamplePowerTM asypow, powerpkg,pwr, MBESS
Quality control SAS/QC1 SPSS BaseTM qcc, spc
Regressionmodels
SAS/BASE1 SPSS RegressionModelsTM
R, Hmisc, Design,lasso, VGAM, pda
Sampling,complex orsurvey
SAS/STAT1:surveymeans,etc.
SPSS ComplexSamplesTM
pps, sampling,sampling, spsurvey,survey
Structuralequations
SAS/STAT1:Calis
AmosTM Sem
Text analysis Text Miner SPSS Text Analysisfor SurveysTM,Text Miner forClementine1
Rstem, lsa, tm
Time series SAS/ETS1 SPSS TrendsTM
Expert ModelerOver 40 packages that dotime series are described atTask View link aboveunder Econometrics.
Time series,automated
SAS ForecastStudio1
SPSS Trends,DecisionTime/WhatIfTM
None
Trees, decisionor regression
EnterpriseMinerTM
SPSS ClassificationTreesTM,AnswerTreeTM
ada, adabag,BayesTree, boost,caret, GAMboost,gbev, gbm, maptree,mboost, mvpart,party, pinktoe,quantregForest,rpart, rpart.permutation,randomForest,randomForests, tree
Appendix B 451
Appendix C
Automating Your Settings
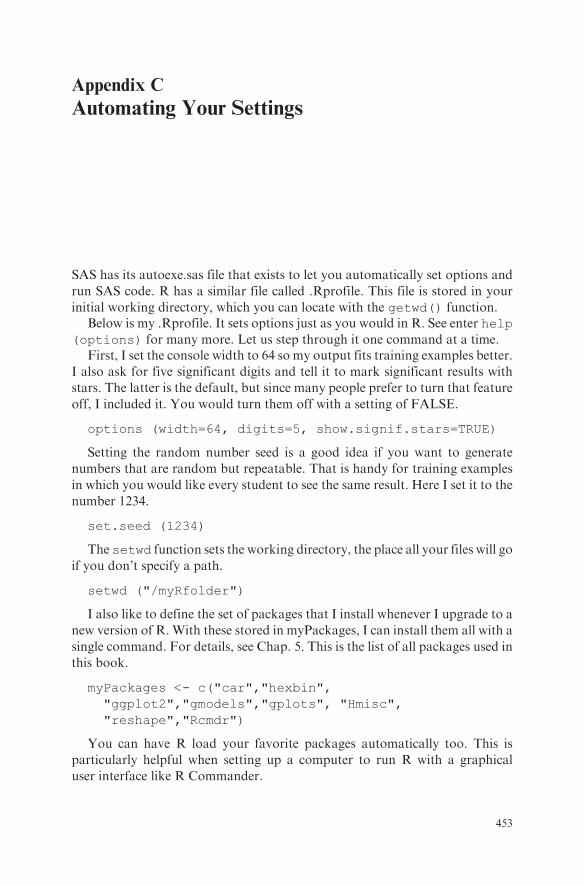
SAS has its autoexe.sas file that exists to let you automatically set options and
run SAS code. R has a similar file called .Rprofile. This file is stored in your
initial working directory, which you can locate with the getwd() function.Below is my .Rprofile. It sets options just as you would in R. See enter help
(options) for many more. Let us step through it one command at a time.First, I set the console width to 64 so my output fits training examples better.
I also ask for five significant digits and tell it to mark significant results with
stars. The latter is the default, but since many people prefer to turn that feature
off, I included it. You would turn them off with a setting of FALSE.
options (width=64, digits=5, show.signif.stars=TRUE)
Setting the random number seed is a good idea if you want to generate
numbers that are random but repeatable. That is handy for training examples
in which you would like every student to see the same result. Here I set it to the
number 1234.
set.seed (1234)
The setwd function sets the working directory, the place all your files will go
if you don’t specify a path.
setwd ("/myRfolder")
I also like to define the set of packages that I install whenever I upgrade to a
new version of R. With these stored in myPackages, I can install them all with a
single command. For details, see Chap. 5. This is the list of all packages used in
this book.
myPackages <- c("car","hexbin","ggplot2","gmodels","gplots", "Hmisc","reshape","Rcmdr")
You can have R load your favorite packages automatically too. This is
particularly helpful when setting up a computer to run R with a graphical
user interface like R Commander.
453

Loading packages at startup does have some disadvantages though. It slows
down your startup time, takes up memory in your workspace, and can create
conflicts when different packages have functions with the same name. There-
fore, you do not want to load too many. Loading packages at startup requires
the use of the local function. The getOption function gets the names of the
original packages to load and stores them in a character vector I named
myOriginal. I then created a second character vector, myAutoLoads, contain-
ing the names of the packages I want to add to the list. I then merged them into
one character vector, myBoth. Finally, I used the options function to change
the default packages to the combined list of both the original list andmy chosen
packages:
local({myOriginal <- getOption("defaultPackages")# edit next line to be your list of favorites.myAutoLoads <- c("Hmisc","ggplot2")myBoth <- c(myOriginal,myAutoLoads)options(defaultPackages = myBoth)
})
If you want R to run any functions automatically, you create your own
single functions that do the required steps. To have R run a function
before all others, name it ‘‘.First’’. To have it run the function after
all others, name it .Last. Notice that utility functions require a prefix of
"utils:: " or R will not find them while it is starting up. The time-stamp function is one of those. It simply returns the time and date. The
cat function simply prints messages.
.First <- function(){
cat("\n Welcome to R!\n")utils::timestamp()cat("\n")
}
You can also have R run any functions before exiting the package. As a
Windows user, I would like to save my command history. Below I print a
farewell message and then save the history to a file named myLatest.Rhistory.
.Last <- function(){
graphics.off()cat("\n\n myCumulative.Rhistory has been saved." )cat("\n\n Goodbye!\n\n")
utils::savehistory(file="myCumulative.Rhistory")}
454 Appendix C
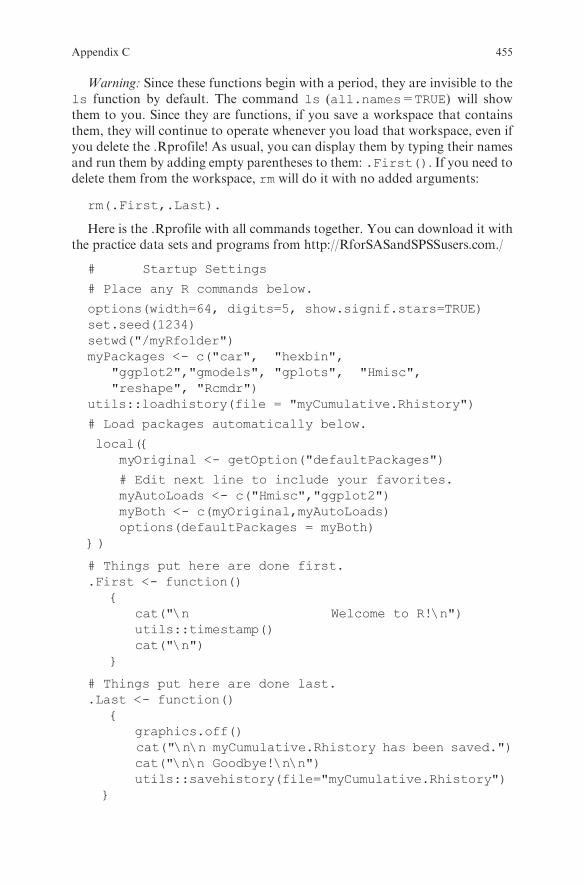
Warning: Since these functions begin with a period, they are invisible to thels function by default. The command ls (all.names=TRUE) will showthem to you. Since they are functions, if you save a workspace that containsthem, they will continue to operate whenever you load that workspace, even ifyou delete the .Rprofile! As usual, you can display them by typing their namesand run them by adding empty parentheses to them: .First(). If you need todelete them from the workspace, rm will do it with no added arguments:
rm(.First,.Last).
Here is the .Rprofile with all commands together. You can download it withthe practice data sets and programs from http://RforSASandSPSSusers.com./
# Startup Settings
# Place any R commands below.
options(width=64, digits=5, show.signif.stars=TRUE)set.seed(1234)setwd("/myRfolder")myPackages <- c("car", "hexbin",
"ggplot2","gmodels", "gplots", "Hmisc","reshape", "Rcmdr")
utils::loadhistory(file = "myCumulative.Rhistory")
# Load packages automatically below.
local({myOriginal <- getOption("defaultPackages")
# Edit next line to include your favorites.myAutoLoads <- c("Hmisc","ggplot2")myBoth <- c(myOriginal,myAutoLoads)options(defaultPackages = myBoth)
})
# Things put here are done first..First <- function()
{cat("\n Welcome to R!\n")utils::timestamp()cat("\n")
}
# Things put here are done last..Last <- function()
{graphics.off()cat("\n\n myCumulative.Rhistory has been saved.")cat("\n\n Goodbye!\n\n")utils::savehistory(file="myCumulative.Rhistory")
}
Appendix C 455
Appendix D
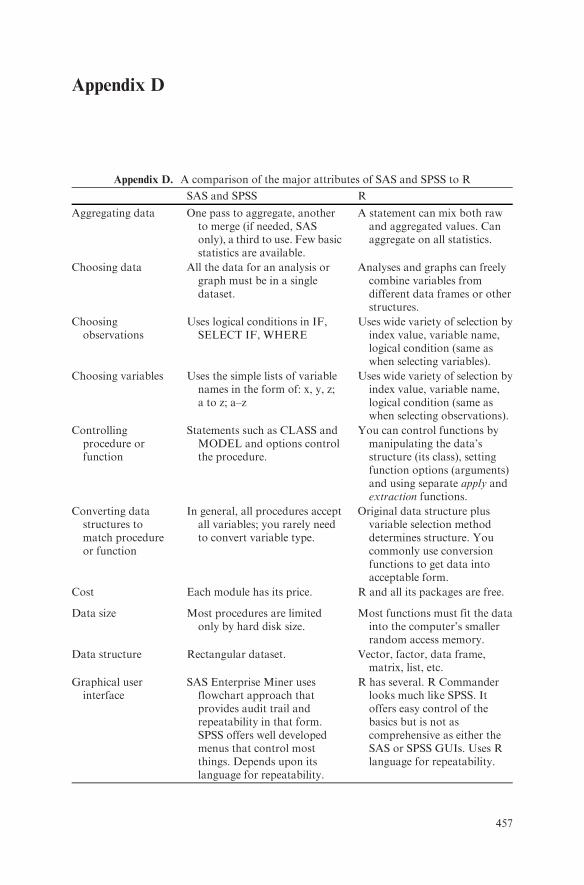
Appendix D. A comparison of the major attributes of SAS and SPSS to R
SAS and SPSS R
Aggregating data One pass to aggregate, anotherto merge (if needed, SASonly), a third to use. Few basicstatistics are available.
A statement can mix both rawand aggregated values. Canaggregate on all statistics.
Choosing data All the data for an analysis orgraph must be in a singledataset.
Analyses and graphs can freelycombine variables fromdifferent data frames or otherstructures.
Choosingobservations
Uses logical conditions in IF,SELECT IF, WHERE
Uses wide variety of selection byindex value, variable name,logical condition (same aswhen selecting variables).
Choosing variables Uses the simple lists of variablenames in the form of: x, y, z;a to z; a–z
Uses wide variety of selection byindex value, variable name,logical condition (same aswhen selecting observations).
Controllingprocedure orfunction
Statements such as CLASS andMODEL and options controlthe procedure.
You can control functions bymanipulating the data’sstructure (its class), settingfunction options (arguments)and using separate apply andextraction functions.
Converting datastructures tomatch procedureor function
In general, all procedures acceptall variables; you rarely needto convert variable type.
Original data structure plusvariable selection methoddetermines structure. Youcommonly use conversionfunctions to get data intoacceptable form.
Cost Each module has its price. R and all its packages are free.
Data size Most procedures are limitedonly by hard disk size.
Most functions must fit the datainto the computer’s smallerrandom access memory.
Data structure Rectangular dataset. Vector, factor, data frame,matrix, list, etc.
Graphical userinterface
SAS Enterprise Miner usesflowchart approach thatprovides audit trail andrepeatability in that form.SPSS offers well developedmenus that control mostthings. Depends upon itslanguage for repeatability.
R has several. R Commanderlooks much like SPSS. Itoffers easy control of thebasics but is not ascomprehensive as either theSAS or SPSS GUIs. Uses Rlanguage for repeatability.
457
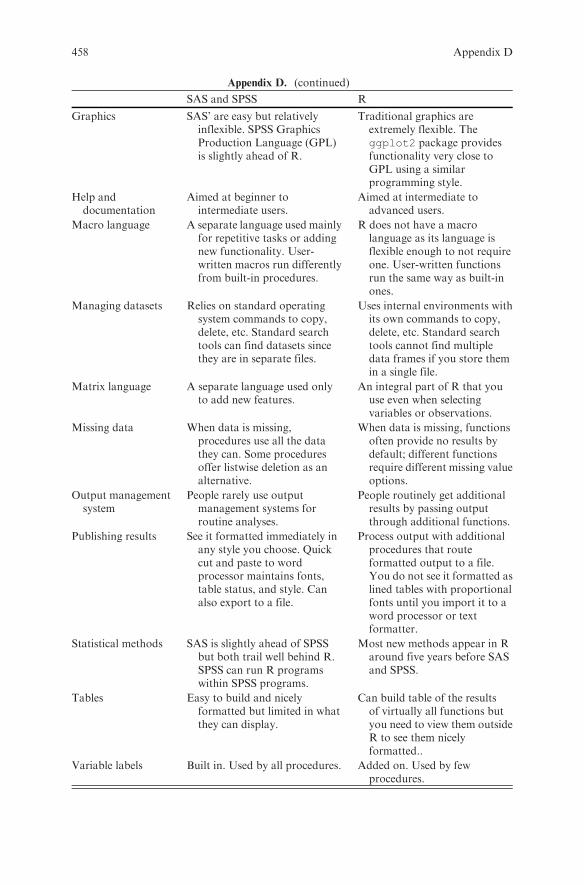
Appendix D. (continued)
SAS and SPSS R
Graphics SAS’ are easy but relativelyinflexible. SPSS GraphicsProduction Language (GPL)is slightly ahead of R.
Traditional graphics areextremely flexible. Theggplot2 package providesfunctionality very close toGPL using a similarprogramming style.
Help anddocumentation
Aimed at beginner tointermediate users.
Aimed at intermediate toadvanced users.
Macro language A separate language used mainlyfor repetitive tasks or addingnew functionality. User-written macros run differentlyfrom built-in procedures.
R does not have a macrolanguage as its language isflexible enough to not requireone. User-written functionsrun the same way as built-inones.
Managing datasets Relies on standard operatingsystem commands to copy,delete, etc. Standard searchtools can find datasets sincethey are in separate files.
Uses internal environments withits own commands to copy,delete, etc. Standard searchtools cannot find multipledata frames if you store themin a single file.
Matrix language A separate language used onlyto add new features.
An integral part of R that youuse even when selectingvariables or observations.
Missing data When data is missing,procedures use all the datathey can. Some proceduresoffer listwise deletion as analternative.
When data is missing, functionsoften provide no results bydefault; different functionsrequire different missing valueoptions.
Output managementsystem
People rarely use outputmanagement systems forroutine analyses.
People routinely get additionalresults by passing outputthrough additional functions.
Publishing results See it formatted immediately inany style you choose. Quickcut and paste to wordprocessor maintains fonts,table status, and style. Canalso export to a file.
Process output with additionalprocedures that routeformatted output to a file.You do not see it formatted aslined tables with proportionalfonts until you import it to aword processor or textformatter.
Statistical methods SAS is slightly ahead of SPSSbut both trail well behind R.SPSS can run R programswithin SPSS programs.
Most new methods appear in Raround five years before SASand SPSS.
Tables Easy to build and nicelyformatted but limited in whatthey can display.
Can build table of the resultsof virtually all functions butyou need to view them outsideR to see them nicelyformatted..
Variable labels Built in. Used by all procedures. Added on. Used by fewprocedures.
458 Appendix D

Bibliography
1. Chambers, John M. Software for Data Analysis: Programming with R. s.l.: SpringerScienceþBusiness Media, LLC, 2008. ISBN 978-0-387-75935-7.
2. Team, R Development Core. R: A Language and Environment for Statistical Computing.Vienna, Austria: http://www.R-project.org, 2007. 3-900051-07-0.
3. Roebuck, P. The MATLAB Package. 2006: http://lib.stat.cmu.edu/R/CRAN/doc/packages/matlab.pdf.
4. Keeling, Kellie B. and Pavur, Robert J. A comparative study of the reliability of ninestatistical software packages. 8, May 1, 2007, Computational Statistics & Data Analysis,Vol. 51, pp. 3811–3831.
5. Bolker, Ben. [R] software comparison. R Help Archive. [Online] 4 16, 2007. [Cited: 3 12,2008.]: http://finzi.psych.upenn.edu/R/Rhelp02a/archive/97802.html.
6. Frank E. Harrell, Jr. with contributions frommany others.Hmisc: HarrellMiscellaneous.R package version 3.4-3. s.l.: http://biostat.mc.vanderbilt.edu/s/Hmisc, 2007.
7. Lemon, Jim and Grosjean, Phillipe. prettyR: Pretty descriptive stats. 2007. R packageversion 1.1-3.
8. Bioconductor, open source software for bioinformatics. [Online]: http://www.bioconduc-tor.org/whatisit.
9. Omegahat Project for Statistical Computing. [Online]: http://www.omegahat.org/.10. Fox, John. car: Companion to Applied Regression. 2007. R package version 1.2-7: http://
www.r-project.org;http://socserv.socsci.mcmaster.ca/jfox/.11. Venables, W.N., Smith, D.M., and the R Development Core Team. An Introduction to R.
2007. ISBN 3-900051-12-7.12. SPSS, Inc. SPSS Statistics-R Integration Package. Chicago: SPSS, Inc., 2008.13. Fox, John, Michael Ash, Theophilius Boye, Stefano Calza, Andy Chang, Philippe Gros-
jean, Richard Heiberger, G. Jay Kerns, Renaud Lancelot, Matthieu Lesnoff, SamirMessad, Martin Maechler, Duncan Murdoch, Erich Neuwirth, Dan Putler, MiroslavRistic. Rcmdr: R Commander. 2008: http://www.r-project.org;http://socserv.socsci/mcmaster.ca/jvox/Misc/Rcmdr/.
14. Rattle: Gnome R Data Mining. Togaware. [Online]: http://rattle.togaware.com/.15. Helbig, Markus and Urbanek, Simon. JGR: Java GUI for R. 2007. Version 1.5-8: http://
cran.r-project.org/doc/packages/JGR.pdf.16. JGR: Java GUI for R. Dept. of Computer Oriented Statistics and Data Analysis. [Online]
2008: http://rosuda.org/JGR/.17. R-core members and Saikat DebRoy, Roger Bivand and others. Foreign: Red Data
Stored by Minitab, S, SAS, SPSS, Stata, Systat, dBase. 2007. R package version 0.8-23.18. Venables, W.N. and Ripley, B.D. Modern Applied Statistics with S. Fourth. New York:
Springer ScienceþBusiness Media, LLC, 2002. 0-387-95457-0.19. Spector, Phil. Data Manipulation with R. s.l.: Springer BusinessþScience, 2008. ISBN
978-0-387-74730-9.
459
20. Baron, Jonathan. R Site Search. Help for R: A Language and Environment for StatisticalComputing and Graphics. [Online] [Cited: February 12, 2008.]: http://finzi.psych.upenn.edu/search.html.
21. Romain, Francois. A firefox extension for R Site Search. [Online] [Cited: 2 12, 2008.]:http://addictedtor.free.fr/rsitesearch/.
22. Wickham, Hadley. reshape: Flexibly reshape data. 2007. R package version 0.8.0.23. Therneau, Terry M., Atkinson, Beth and Ripley, Brian (ported). rpart: Recursive Parti-
tioning. 2007. R package version 3.1-38.24. Lumley, Thomas. The biglm Package. 2006: http://cran.r-project.org/doc/packages/
biglm.pdf.25. iPlots. Department of Computer Oriented Statistics and Data Analysis. [Online] 2008.
[Cited: 2 11, 2008.]: http://www.rosuda.org/iplots/.26. Swayne, D., et al. GGobi: XGobi redesigned and extended. Vols. In Proc. of the 33th
Symposium on the Interface: Computing Science and Statistics, 2001.27. Sarkar, Deepayan. lattice: Lattice Graphics. 2008. R package version 0.17-4.28. Wickham, Hadley. ggplot. s.l.: http://had.co.nz/ggplot2/book.pdf, 2007.29. Murrell, Paul. R Graphics. Boca Raton, FL: Chapman & Hall/CRC, 2006. ISBN 978-1-
58488-486-6.30. Cleveland, William S. Visualizing Data. s.l.: Hobart Press, 1993. ISBN 978-0963488404.31. Sarkar, Deepayan. Lattice: Multivariate Data Visualization with R. s.l.: Springer
ScienceþBusiness Media, LLC, 2008. ISBN 978-0-387-75968-5.32. Wilkinson, Leland. The Grammar of Graphics, Second Edition. New York: Springer
ScienceþBusiness Media, Inc, 2005. ISBN 978-0387-24544-8.33. Friendly, Michael. Visualizing Categorical Data. s.l.: SAS Publishing, 2000. ISBN 978-
1580256605.34. Dan Carr, porte by Nicholas Lewin-Koh and Martin Maechler. hexbin: Hexoganal
Binning Routines. 2006. R package version 2.3.2.35. Warnes, Gregory R., et al. gplots: Various R programming tools for plotting data.
R package version 2.3.2.36. Dalgaard, Peter. Introductory Statistics with R. s.l.: Springer ScienceþBusiness Media,
Inc., 2002. ISBN 978-0387-95475-2.37. Warnes, Gregory R., et al. gmodels: Various R Programming Tools for Model Fitting.
2007. R package version 2.14.1: http://cran.r-project.org/src/contrib/PACKAGES.htm;http://www.sf.net/projects/r-gregmisc.
38. Pinheiro, Jose C. and Bates, Douglas M. Mixed Effects Models in S and S-Plus.New York: Springer ScienceþBusiness Media, Inc., 2000. ISBN 978-0387989570.
39. Venables, W.N. Exegeses on Linear Models. 1998: http://www.stats.ox.ac.uk/pub/MASS3/Exegeses.pdf.
40. Burns, Patrick J. S Poetry. 1998: http://www.burns-stat.com/pages/Spoetry/Spoetry.pdf.
41. Mitchell, Michael N. Strategically using General Purpose Statistics Packages: A Look atStata, SAS and SPSS. Statistical Consulting Group, UCLA Academic TechnologyServices. 2007. Technical Report Series: http://www.ats.ucla.edu/stat/technical-reports/.
42. Burns, Patrick. R Relative to Statistical Packages: Comment 1 on Technical ReportNumber 1 (Version 1.0) Strategically using General Purpose Statistics Packages: ALook at Stata, SAS and SPSS. Los Angeles: UCLA Academic Technology Services,2006. Technical Report Series: http://www.ats.ucla.edu/stat/technicalreports/.
43. Muenchen, Robert A. R for SAS & SPSS Users. 2006: http://RforSASandSPSSusers.com.
44. Alzola, Carlos and Harrell, Frank. An Introduction to S and The Hmisc and DesignLibraries. September 24, 2006. http://cran.r-project.org/doc/contrib/AlzolatHarrel-Hmisc-Design-Intro.pdf/.
460 Bibliography

45. Roebuck, P. MATLAB emulation package, version 0.8-1.MATLAB emulation package,version 0.8-1. 2006: http://cran.r-project.org/doc/packages/matlab.pdf.
46. Lumley, Gregory R. Warnes. Includes R source code and/or documentation contributedby Ben Bolker and Thomas. gplots: Various R programming tools for plotting data. Rpackage version 2.3.2.
47. HadleyWickham,Micheal Lawrence, Duncan Temple Lang, andDeborah F Swayne. Anintroduction to rggobi. R-news, Under revision. http://ggobi.org/rggobi.
Bibliography 461

Index
- SAS operator, 103-- SAS operator, 103� operator, 65!IN SPSS keyword, 111, 133%in% operator, 110, 111, 131,
133, 146%INCLUDE SAS statement, 27.First, 455.GlobalEnv, 266.Last, 455.RData file extension, 270.Rhistory file extension, 23, 25,
26, 272.Rprofile
file, 23, 16, 453/ operator, 148| operator, 109: SAS operator, 101^ R operator, 148_LAST_ SAS parameter, 113+ R operator, 169<-, 42, 50
Abline function, 369Accuracy of R, 3ADD FILES SPSS command, 189Add1 function, 421Addmargins function, 412Aes function, 372Aggregate function, 433AGGREGATE SPSS procedure,
214, 221Aggregating, 203AITR
An Introduction to R, 25ALL SPSS keyword, 104Anova function, 6, 432Array, 66as.data.frame function, 231, 242, 411
as.logical function, 129as.matrix function, 152as.table function, 226as.vector function, 171Assignment operator, 42, 50Attach, 131Attach function, 120, 149, 264, 266Attaching data frames, 264Attaching files, 266Attribute, 78Attributes function, 262, 271, 354Axis function, 321
Bar function, 355Barplot function, 289Bartlett.test function, 424Batch processing, 27Biglm package, 259Bioconductor, 17Boxplot function, 323By function, 206, 208, 214, 324BY processing example programs, 208BY processing, SAS, 208BY SAS statement, 243
c function, 57, 173Car package, 19, 180, 433Cases, 58Cat function, 454cbind function, 57CD SPSS command, 269, 330chisq.test function, 411Class, 73, 82Class function, 66, 69, 226, 262CLASS SAS statement, 225Cleanup.import function, 268Coercion, 51, 56colClasses argument, 83Comments, in programs, 62
463
Complete.cases function, 167Components, of a list, 60Contents function, 44, 263CONTENTS SAS procedure, 263Conversion
class removal, 144data frame to matrix, 144from logical vector to index
when seleting variables, 143index to logical, 146list to separate vectors, 144list to vector, 144lists or dataframes into list, 144matrix to data frame, 144matrix to vector, 144variable names to indexes, 115vector to matrix, 144vectors into one long one, 144vectors to columns of a matrix, 144vectors to data frame, 144vectors to rows of a matrix, 144
coord_polar function, 390Coplot function, 310Cor function, 37, 38, 58, 416, 439coord_flip function, 346Correlation
Kendall, 413Pearson, 434Spearman, 439
CRAN, 17, 29CROSSTABS SPSS procedure, 200Crosstabulation
column proportions, 411row proportions, 411
CTABLES SPSS procedure, 200cut2 function, 180
Datagenerating a data frame, 251generating continuous measures, 249generating factors, 246generating integer measures, 248generating numeric sequences, 245generating repititious patterns, 247generation, 251storage and memory considerations, 263
Data argument, 65Data editor, 86Data frame, 67, 81Data function, 18Datasets
reshaping, example programs, 219adding, 186
concatenating, 186joining, 190listing in all packages, 19merging, 190stacking, 186
data.frame function, 56, 116DATASET NAME SPSS command, 103DELETE VARIABLES SPSS command,
185Deleting objects. See removing objects,Demo function, 276Describe function, 14, 407DESIGN SPSS keyword, 65Detach function, 14, 114Dim function, 57Directory, setting. See working directorydo.call function, 207, 215DROP SAS statement, 185drop1 function, 421Duplicate observations, 210
Edit function, 79Editor
JGR data editor, 37, 40R Editor, 22, 24, 37, 173SAS Program Editor, 22, 24SPSS Syntax Editor, 22, 24
Elements, of a vector, 51Exiting R. See quitting RExp function, 148EXPLORE SPSS procedure, 406Exporting data
example programs, 95Exporting data, 97Expression function, 325Extracting parts of objects
getting help on, 42Extractor functions, 67–69, 418, 444
Factor, 82, 56, 66, 266character, 226converting many variables to, 232converting to variables, 228dropping unused levels, 233numeric, 247ordered, 229
file.show function, 101FILTER SPSS command, 124First observation per group, 214FIRST SPSS keyword, 214First.variable SAS variable, 214Fix function, 79Foreign package, 98
464 Index
FORMAT SAS procedure, 225FORMAT SAS statement, 225Formats, 225Formulas, 64FREQ SAS procedure, 200Function, 63
arguments, 63controlling with arguments, 62controlling with class, 65controlling with formulas, 64generic, 41, 44, 66, 67, 143, 285, 319,
444, 445, 446n, SAS or SPSS, 156visible vs. non-visible, 67writing your own, 73–75
Function (drop ‘‘s’’), 14
Generating data. See data generationGeneric function. See function, genericGeom_bar function, 355Geom_jitter function, 378Geom_segment function, 363GET FILE SPSS command, 113getOption function, 454getwd function, 61, 268, 453getwd function, 453ggplot function, 374ggplot2 package, 341, 386ggsave function, 278, 385gl function, 246, 253, 254, 255gmodels package, 409, 437GOPTIONS SAS statement, 277, 290GPL. See graphics:Graphics Production
LanguageGraphics
comparing R’s packages, 278density countours, 366devices, 277File> Export SPSS menu, 277GGobi, 274ggplot2 package, 274, 278ggplot2, example programs, 387Grammar of Graphics, 275–276, 341,
342, 347, 387, 389example programs, 387
grid graphics system, 307history recording, 278lattice, 310lattice package, 275, 310overview, 273procedures vs. systems, 277SAS/GRAPH, 273SAS/INSIGHT, 274
SPSS, 274traditional, 274, 281–339traditional graphics system, 277traditional, example programs, 331
Graphics Production Language, 274, 341,374, 458
Graphics, ggplot2aesthetics, defined, 342aspect ratio, 382axes, logarithmic, 381bar charts, 344bar charts with subgroups, 348box plots, 376box plots with jittered points, 378coordinate system, defined, 342density curve, 355dot charts, 352elements and parameters, summary, 386error bar plots, 337facets, defined, 342geoms, defined, 342histograms, 354labels, 353linear fit by groups, 373multiple plots on a page, 382normal QQ plots, 299overview of qplot and ggplot, 342pie charts, 347plot symbols, setting by groups, 372plots by group or level, 309point display variations, 361presummarized data, 351scales, defined, 342scatterplot matrix, 374scatterplot with density contours, 366scatterplots, 361scatterplots faceted by group, 374scatterplots with fit lines, 367scatterplots with jitter, 363scatterplots with large datasets, 364scatterplots with reference lines, 368statistics, defined, 342strip plots, 360titles, 353
Graphics, traditionalabline function, 307, 308, 309, 369adding titles, labels, colors, legends, 288adj parameter, 327arrows function, 327ask parameter, 291axis function, 321bar plots, 337barplot, 281
Index 465

Graphics, traditional (cont.)barplots of counts with subgroups,
281barplots of means, 286box function, 327box plots, 322cex parameter, 327col parameter, 327coplots, 309demonstration plot, 147density, 366dot charts, 352dual-axes plots, 320error bar plots, 380family parameter, 326font parameter, 327formula and symbol display, 324graphics parameters, 325grid function, 350histograms, 293histograms overlaid, 297identifying points, 311interaction plots, 324jitter, 304las parameter, 327linear fit, 308linear fit by group, 308lines function, 294lty parameter, 327lwd argument, 327main sub title argument, 324main title argument, 326mar parameter, 326mfcol parameter, 326mfrow parameter, 326mosaic plot, 275, 286mtext function, 328multiple plots on a page, 290new parameter, 326normal QQ plots, 299options and elements table, 325par function, 297pch parameter, 327pie charts, 347ps parameter, 326scatterplot matrices, 318scatterplots, 303scatterplots with confidence and
prediction intervals, 312scatterplots with confidence ellipse, 311scatterplots with jitter, 304scatterplots with large datasets, 305scatterplots with lines, 307
spine plot, 348srt parameter, 327strip charts, 301text function, 321types of point displays, 304usr parameter, 289, 326xlab argument, 326xlog parameter, 326ylab argument, 326ylog parameter, 326
Grep function, 110, 111, 132
Hat function, 325, 328, 338Head function, 18, 214, 264, 290Help
examples, 42extracting and replacing elements, 42for datasets, 45for generic functions, 44for packages, 44help files, 41running help examples, 32searching, 46via mailing lists, 45via web searches, 46vignettes, 47
help.search function, 42help.start function, 41Hexbin package, 307Hist function, 297Hmisc package, 13, 43, 45, 95, 180, 219, 239,
263, 326
ID variable. See row namesIdentify function, 301, 303, 304IML SAS product, 6Importing data
from SAS, 95from SAS, example programs, 95from SPSS, 96from SPSS, example programs, 96
IN SAS operator, 111, 133INCLUDE SPSS command, 27Inputting text files. See reading text filesinstall.packages function, 13, 16, 33Installation
of packages, 15of R, 12
interaction.plot function, 324is.na function, 166
JGR user interface, 36
KEEP SAS statement, 185
466 Index

Keywords, SPSS, 51kruskal.test function, 432, 433
Label function, 239LABEL SAS statement, 239Lapply function, 154, 169, 207
compared to do.call, 207, 215Last observation per group, 214LAST SPSS keyword, 214last.variable SAS variable, 214Lattice package, 275, 277, 290, 307, 341Layout function, 290Length function, 155, 157LENGTH SAS statement, 95levene.test function, 424LIBNAME SAS statement, 269Library function, 13, 14Library, for SAS formats, 225Lines function, 294, 308, 316, 319List, 41, 45, 59
created by lm, 68created in your function, 66
List function, 59, 75, 92, 145, 287lm functionlm function, 5, 64, 68, 262, 308, 314,
417, 418Load function, 23, 25, 26, 61, 261, 270Loadhistory function, 26, 272Loading a package, 14, 33Local function, 454Log function, 147log10 function, 381Logical comparisons
to missing values, 89, 129, 159,165, 166,
Logical operators, 159Long dataset format, 190Lowess function, 308, 367ls function, 60, 61, 261, 262, 263,
264, 455ls.str function, 263, 271
Macro. See functionMacro language, 5, 90, 458Macro substitution, 90–91, 92Mailing lists, 45, 103Mapply function, 157Masking functions, 432MASS
Modern Applied Statistics in S, 45, 403MATCH FILES SPSS procedure, 214MATLAB, 2, 451Matlines function, 313, 316
Matrix, 67, 68character, 68numeric, 68
Matrix language, 5, 6, 441, 458Matrix, SPSS product, 5Mean function, 42, 58, 63, 67, 68, 147, 152,
195, 197, 204, 286MEANS SAS procedure, 153Median function, 408, 427, 433Merge function, 191, 192, 193, 199Methods function, 66, 319, 441Missing values. See NA
example programs to assign, 169MISSOVER SAS option, 89Mode, 21, 27, 51, 57, 66, 68, 86, 144, 196, 200,
205, 300, 326, 418, 446Model object, 68, 70MODEL SAS statement, 65Mosaic function, 286mtext function, 321, 328
N function, SAS and SPSS, 155, 156, 158NA, missing value, 30, 52, 53, 54, 56, 63, 79,
80, 82, 146, 153, 167na.omit function, 167, 421na.rm argument, 63, 153Names function, 56, 70, 106, 115, 127,
128, 132, 134, 172, 174, 262, 298,317, 415
Naming objects, 60ncol function, 107NODUPKEY SAS option, 210Noint SAS option, 65Not run, 43nrow function, 127NULL object, 185NVALID SPSS function, 155
Object, 61Objects function, 68, 261Observations, 56
converting to variables, 232selecting, 42, 103, 123–140, 295selecting all, 124selecting by index number, 124selecting by row name, 127selecting by string search, 132selecting in SAS and SPSS, 123selecting using logic, 108–110selecting with subset function, 114
ODS. See Output Delivery SystemOMS. See Output Management SystemOperators, mathematical, 148
Index 467

Options, 486scipen, 404, 415
Optionsdigits, 403, 415number of siginificant digits, 403, 453SAS, linesize, 403, 437SAS, probsig, 403setting automatically, 444SPSS, small, 5, 222, 403SPSS, width, 50width, 50
Options function, 50Order function, 221, 222Ordered factor, 225, 229Ordinal data, 225, 229Output Delivery System, SAS, 5, 68, 417Output management, 5, 6, 68, 417, 441Output Management System, SPSS, 5, 68,
417, 458Packages, 18Pairs function, 67, 319, 320Pairwise.t.test function, 429, 433Pairwise.wilcoxon.test function, 433par function, 290, 302, 307, 322, 326, 341Paste function, 108, 176Plot function, 5, 67, 281plotmeans function, 324Points function, 294Predict function, 315, 316prettyR package, 14, 156Print function, 27, 31, 51, 69, 70, 74, 116, 135,
145, 262, 383as related to SPSS, 31, 52
PROC SORT NODUPKEY, 212Procedures, SAS or SPSS, 73Production Facility, SPSS, 28Programmability Extension, SPSS, 23Programming syntax, 24prop.table function, 407, 411, 412PRX SAS function, 110, 132
qplot function, 341, 342, 343qq.plot function, 300qqnorm function, 301quit function, 23, 26, 32
in SPSS-R programs, 28Quitting R, 26
R Commander user interface, 33R, running
from JGR interface, 36from R Commander, 33, 34, 35from Rattle interface, 34
from within SPSS, 27in batch mode, 27in standard R interface, 31, 343programs that include programs, 31
Rattle package, 34Rattle user interface, 34rbind function, 187
used with do.call, 207rcorr function, 413, 414read.fwf function, 89, 93read.table function, 79, 81, 82, 89, 165,
166, 226Reading data from keyboard, 86Reading data within a program
example programs, 85Reading text files
2 records per caseexample programs, 94
comma separated values, 80delimited, 79example programs, 80one record per case, 87skipping columns, 82two or more records per case, 92within a program, 84
Recode function, 180, 432Records, 55Regression, linear, 31, 64, 68Regular expressions, 110, 112, 132,
133, 262Removing objects, 185, 216Rename function, 171, 199Renaming
columns, 37, 175rows, 177variables, 37, 174variables, example programs, 177
rep function, 247, 254Replacing parts of objects
getting help on, 43Repositories, 17Reshape package, 201, 217rm function, 61, 267, 268, 313
regarding First. and Last., 455Round function, 407, 412row names, 56rownames function, 449row.names argument, 89, 177, 190row.names function, 56, 127, 128, 132,
134, 317rpart function, 180rpart package, 180Running R, See R, running
468 Index

Sample function, 248Sapply function, 155, 182, 231, 408sasxport.get function, 95SAS/IML SAS Product, 6Save function, 270, 278, 385save.image function, 22, 26, 150, 270savehistory function, 272Saving
data and functions, 22, 24, 26history (journal), 271output, 271program and output, 22, 24, 26programs, 271workspace, 269
Scale function, 198Scan function, 87Scientific notation, 403sd function, 155Search, 14Search function, 14, 264Search path, 264SELECT IF SPSS Command, 124Selecting observations
example programs, 135seq function, 246SET SAS statement, 186SET SPSS command, 404setRepositories() function, 449setwd function, 61, 269, 453sink UNIX command, 2, 25slashes, in filenames, 61Sorting
data, 221example programs, 223
Source function, 25, 27, 31as related to SPSS, 31
SPLIT FILE processing exampleprograms, 208
SPLIT FILE SPSS command, 204Split function, 186split.screen function, 290spss.get function, 96spsspivottable.Display function, 31SPSS-R Integration Package, 28, 29sqrt function, 148Statements, SAS, 51Statistics
nested, 65analysis of covariance, 65Analysis of variance, 427
post hoc tests, 436specifying interactions, 430sums of squares, 431
Chi-squared test, 408Correlations, 413Crosstabulation, 438Descriptive, 404Example programs, 433, 434Kruskal-Wallis test, 432Mann-Whitney U test, 425Models, comparing, 421Overview, 481percentages, 407, 412Predictions on new data, 422Proportions, 406, 411Regression, linear, 417
interaction, 65partial tests, 419QQ plot, 421residual plot, 421residuals-leverage plot, 420, 421scale-location plot, 421t-tests on parameters, 419without intercept, 65diagnostics, 420sequential tests, 420
t-testsfor independent groups, 422paired, 424
Variance, equality testing, 424Wilcoxon rank sum test, 425Wilcoxon signed rank test for paired
groups, 426Step function, 421stepAIC function, 421str function, 262, 263stringsAsFactors argument, 56stripchart function, 301, 303subset function, 114Summarizing, 157Summary function, 406, 407
from within SPSS, 31regarding variable labels, 239
SUMMARY SAS procedure, 201, 221
t.test function, 424, 426Table function, 58, 81, 282, 286Table object, 65TABULATE SAS procedure, 200Tail function, 18, 262Tapply function, 196TEMPORARY SPSS command, 124Text files, viewing, 87Text files, reading. See reading text filesText function, 317, 325textConnection function, 84, 85
Index 469

Timestamp function, 454TO SPSS keyword, 100Transcript of code and results, 26Transform function, 148Tree function, 180TukeyHSD function, 430type. See mode
Unclass function, 70, 144Uninstalling
packages, 16R, 16
UNIVARIATE SAS procedure, 406Unique function, 449Unlist function, 144Unload packages. See detach functionupdate.packages function, 15Updating packages, 15USE ALL SPSS command, 124
VALUE LABEL SPSS command, 150Value labels, 225
example programs, 234var function, 408, 428var.test function, 424VARIABLE LABELS SPSS command, 239VARIABLE LEVEL SPSS command, 225Variables, 65
converting to observations, 217dropping, 185keeping, 185labels, 239recoding, 180renaming, 56, 171selecting, 103
selecting all variables, 104selecting by column name, 125107selecting by index number, 104selecting by list index, 115selecting by simple name, 113selecting by string search, 110selecting in SAS and SPSS, 103selecting to save in new dataset, 116selecting using $ notation, 112selecting using logic, 108selecting with subset function, 114selection example programs, 116
Vector, 51character, 68character or string, 51numeric, 63, 73
Where function, 130WHERE SAS statement, 103, 123Which function, 162Wide dataset format, 217wilcox.test function, 426, 427with function, 51, 84, 114, 120, 147, 196, 208,
404within function, 147Working directory, 61, 272Workspace
managing, 261minimizing, 268saving, 269
write.foreign function, 98write.table function, 97writing text files, 99
Z score, 198
470 Index