For a Unique CompanyFocusing on Asia
Annual Report 2013

Mandom Annual Report 2013
This annual report contains forward-looking statements concerning Mandom’s current plans, strategies, beliefs and performance. These forward-looking statements include statements other than those based on historical fact and represent the assumptions and beliefs of management based on information currently available. Mandom therefore wishes to caution readers that actual results may differ materially from expectations, and that forward-looking statements are subject to a number of foreseen and unforeseen risks and uncertainties.
All amounts have been rounded to the nearest whole unit.
Cautionary Statement with Respect to Forward-Looking Statements
Contents
Profile
Reflecting its philosophy of “Aiming to Provide a Comfortable Lifestyle Supported by Health and Beauty,” Mandom
engages in the manufacture and sale of cosmetics. Since its foundation in 1927, we have expanded our businesses
centered on men’s cosmetics. Mandom presently offers various brand products to as many consumers worldwide
as possible, “creating lifestyle value with consumers, for consumers”. In particular, we are focusing on Gatsby,
which has grown into the top men’s cosmetics brand in Asia, along with Lúcido, Lúcido-L, Bifesta and Pixy,
shipping over 1 billion products annually in the hair styling, face & body care, skincare and make-up categories.
Mandom’s overseas expansion began in 1958, making an early mark in the cosmetics industry in 10 countries
and regions across Asia, particularly Indonesia, via 11 overseas Group companies. Beyond Asia, our products have
become consumer favorites in numerous countries worldwide, including Africa, Europe and North America.
The entire Mandom Group is currently working together as one to be an “Only One” company whose strength
lies in its global management with a focus on Asia.
1 mandom Annual Report 2013
Core Competence
Contributing to Comfortable Life of as Many Consumers as Possible
Business Expansion Rooted in Asia
Products Tailored to Consumer Needs and Wants
Top Message
To Our Stakeholders
Special Feature
Mandom’s Production and Supply System
Business Review
Summary of Consolidated Business Results
At a Glance
Overview by Segment
Management Information
The Philosophy of the Mandom Group
Mandom’s Social Contribution Concept
Corporate Governance
Executives, Audit & Supervisory Board Member
Financial Data
Consolidated Financial Indicators
Management’s Discussion and Analysis
Consolidated Financial Statements
Notes to Consolidated Financial Statements
Independent Auditor’s Report
Company Outline/Stock and Shareholder Information
3
5
7
9
15
19
20
21
29
30
32
34
35
37
42
47
57
58
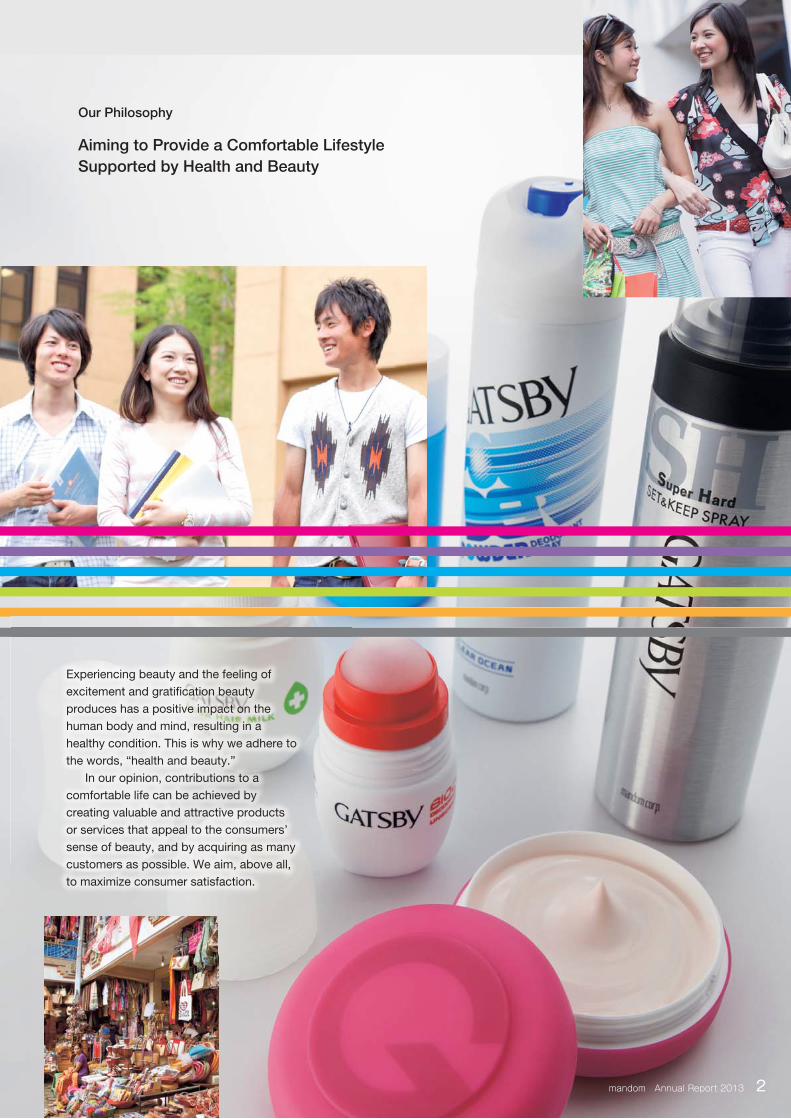
Our Philosophy
mandom Annual Report 2013 2
Aiming to Provide a Comfortable Lifestyle
Supported by Health and Beauty
Experiencing beauty and the feeling of
excitement and gratification beauty
produces has a positive impact on the
human body and mind, resulting in a
healthy condition. This is why we adhere to
the words, “health and beauty.”
In our opinion, contributions to a
comfortable life can be achieved by
creating valuable and attractive products
or services that appeal to the consumers’
sense of beauty, and by acquiring as many
customers as possible. We aim, above all,
to maximize consumer satisfaction.
3 mandom Annual Report 2013
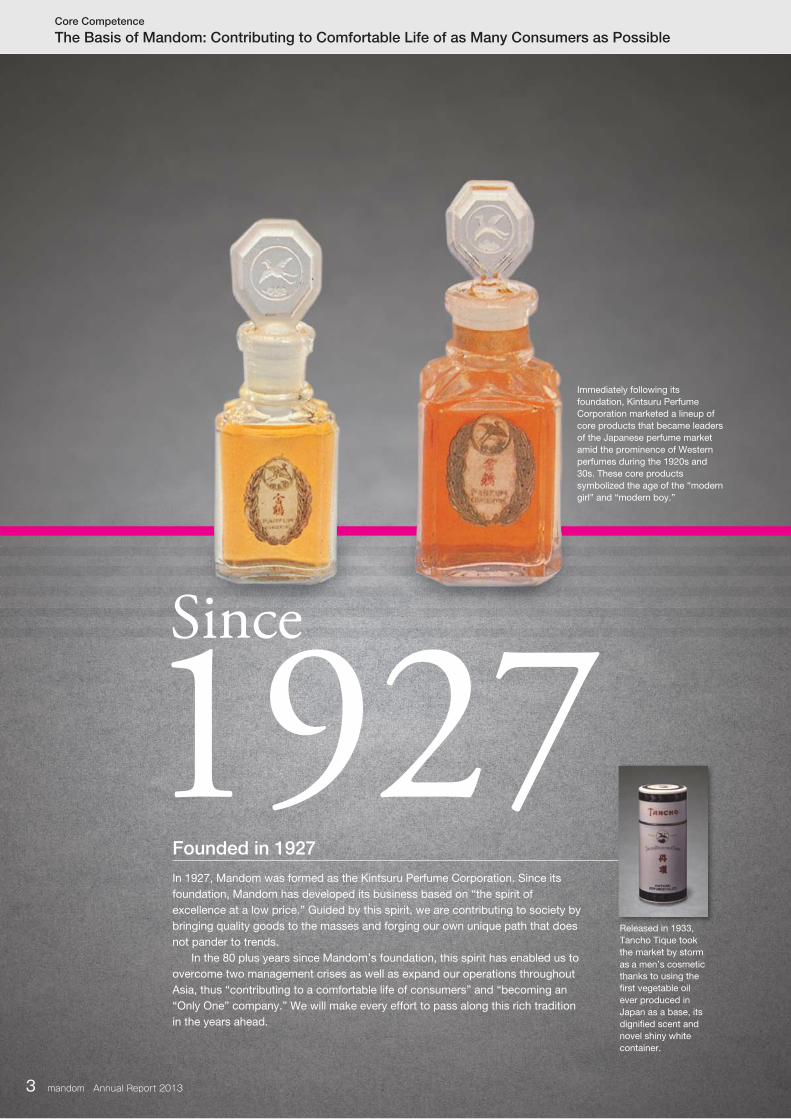
Founded in 1927
Released in 1933,
Tancho Tique took
the market by storm
as a men’s cosmetic thanks to using the
first vegetable oil
ever produced in
Japan as a base, its
dignified scent and
novel shiny white
container.
Core Competence
Immediately following its
foundation, Kintsuru Perfume
Corporation marketed a lineup of
core products that became leaders
of the Japanese perfume market
amid the prominence of Western
perfumes during the 1920s and
30s. These core products
symbolized the age of the “modern
girl” and “modern boy.”
The Basis of Mandom: Contributing to Comfortable Life of as Many Consumers as Possible
In 1927, Mandom was formed as the Kintsuru Perfume Corporation. Since its
foundation, Mandom has developed its business based on “the spirit of
excellence at a low price.” Guided by this spirit, we are contributing to society by
bringing quality goods to the masses and forging our own unique path that does
not pander to trends.
In the 80 plus years since Mandom’s foundation, this spirit has enabled us to
overcome two management crises as well as expand our operations throughout
Asia, thus “contributing to a comfortable life of consumers” and “becoming an
“Only One” company.” We will make every effort to pass along this rich tradition
in the years ahead.
1927Since

mandom Annual Report 2013 4
■Contributing to a Comfortable Life of Consumers
■Becoming an “Only One” Unique Company
Mandom’s mission is to “satisfy the average sense of style, bring style to the average
consumer.” Reflecting this, we believe that the source of our continual existence is the
generation of value through products that leverage employee creativity and the acceptance of
this value by a significant number of consumers.
This belief is simply stated in the concept, “contributing to a comfortable life of
consumers.” Mandom engages in business activities that take this concept to heart.
Mandom strives to maintain sustainable businesses with the aim of “contributing to a
comfortable life of consumers.” Consequently, it is essential that we possess the dynamism
required to prevail over the competition in any era. Coupled with this, Mandom will continue to
be a company that plays a useful social role by effectively balancing its humanity and social
responsibilities as a good corporate citizen and by gaining recognition for its existing social
value as an “Only One” company.
Mandom will realize its aim of becoming an “Only One” company by promoting unique
businesses and encouraging the participation of all employees.
Core Competence

Shipments1,058 ■Creating a Distribution Network and
Undertaking Marketing Tailored to Each Area
Mandom is creating a distribution network and undertaking marketing tailored to each area in order to
reach as many consumers as possible. To be a useful presence for the average consumer in each
country target area, we are creating a distribution network to enable consumers to purchase Mandom
products at nearby stores. We are also expanding contact points between consumers and products by
using various media tailored to the lifestyles of target consumers, and by creating buying spaces in
stores that stimulate consumers’ desire to buy our products and make it easier to choose the products
they need.
5 mandom Annual Report 2013
were shipped by the Mandom Group in the fiscal year ended March 31, 2013.
Overseas expansion began for Mandom in 1958, with the establishment of a technical tie-up in the
Philippines. Since then, we have expanded businesses that are fully rooted in the Asian market. In each
Asian country where we do business, we have focused our efforts on integrating ourselves into local
lifestyles in a real sense to thoroughly get to grips with local cultural norms and customs. At the same
time, we have developed products through trial and error that Asian consumers feel are useful.
In light of the dramatic economic growth and ongoing globalization of Asia, we aim to be a useful
and unique company by precisely meeting the needs and wants of consumers in all countries and areas
while maintaining an unwavering focus on global markets.
Strength in Asia: Business Expansion Rooted in AsiaCore Competence
Core Competence
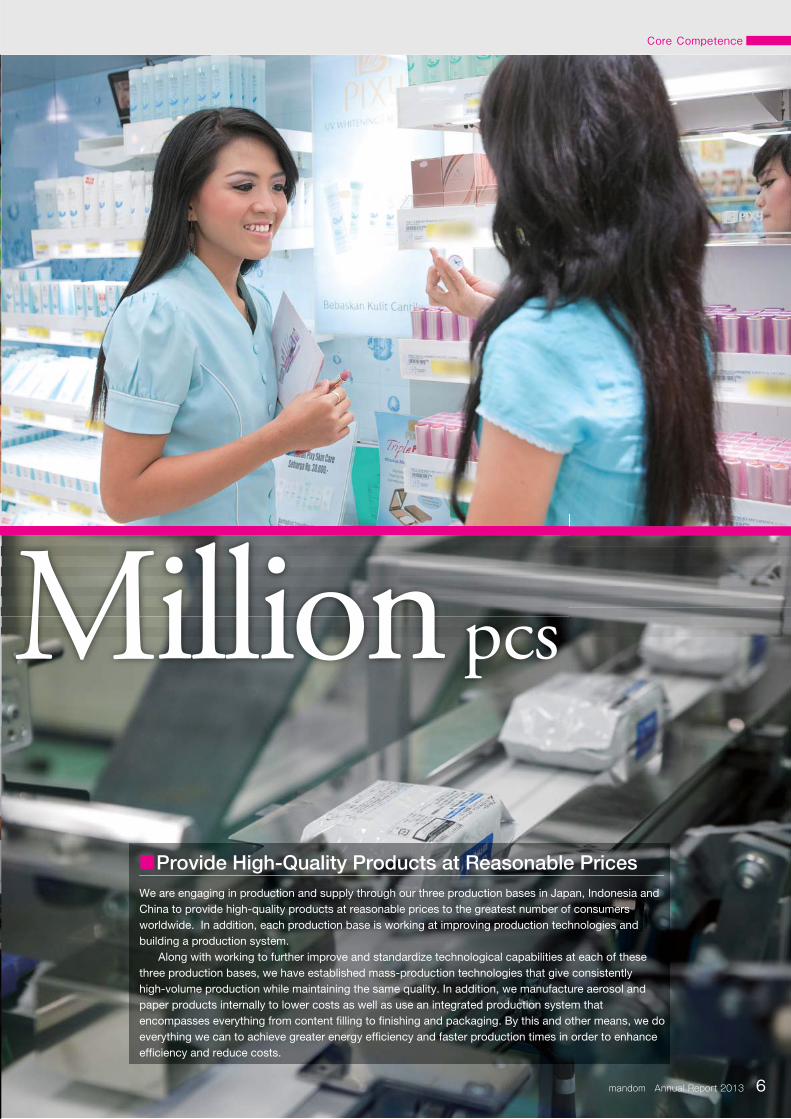
Million pcs
■Provide High-Quality Products at Reasonable Prices
We are engaging in production and supply through our three production bases in Japan, Indonesia and
China to provide high-quality products at reasonable prices to the greatest number of consumers
worldwide. In addition, each production base is working at improving production technologies and
building a production system.
Along with working to further improve and standardize technological capabilities at each of these
three production bases, we have established mass-production technologies that give consistently
high-volume production while maintaining the same quality. In addition, we manufacture aerosol and
paper products internally to lower costs as well as use an integrated production system that
encompasses everything from content filling to finishing and packaging. By this and other means, we do
everything we can to achieve greater energy efficiency and faster production times in order to enhance
efficiency and reduce costs.
mandom Annual Report 2013 6

JP¥34,876 Sales
7 mandom Annual Report 2013
We will do our best to listen to our consumers’ needs and wants and turn them into attractive products and services, and to bring those “values” to as many consumers as possible.
The No.1 men’s cosmetic brand, Gatsby consolidated net sales in the fiscal year ended March 31, 2013
■Provide Products That Express the Needs and Wants of Consumers
The needs and wants of consumers differ depending on country or area and are constantly changing in
line with various trends and lifestyles. To embody these needs and wants in our products, we undertake
product development from the perspective of consumers.
Regarding product development, in addition to tracking consumer lifestyles, consciousness, and
preferences, we extensively research market and store product trends to identify consumer needs and
wants. Based on the results of this research, we design high-quality, appealing, and distinctive products
that satisfy consumers in every way possible. However, we do not stop there. Once a product is sold, we
analyze consumer feedback and verify product trends to improve product quality and identify new needs
and wants. The results of verification are then reflected in the next cycle of product development.
Useful for Life: Products Tailored to Consumer Needs and WantsCore Competence
Core Competence
Million
mandom Annual Report 2013 8
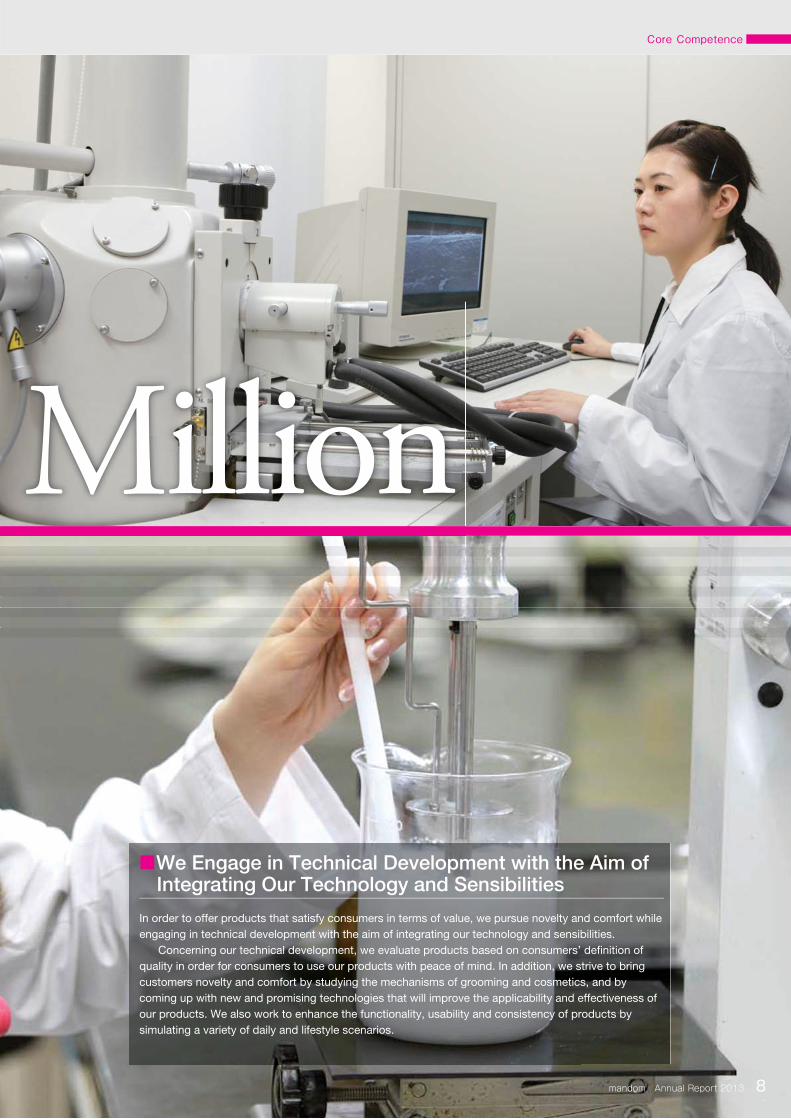
■We Engage in Technical Development with the Aim of Integrating Our Technology and Sensibilities
In order to offer products that satisfy consumers in terms of value, we pursue novelty and comfort while
engaging in technical development with the aim of integrating our technology and sensibilities.
Concerning our technical development, we evaluate products based on consumers’ definition of
quality in order for consumers to use our products with peace of mind. In addition, we strive to bring
customers novelty and comfort by studying the mechanisms of grooming and cosmetics, and by
coming up with new and promising technologies that will improve the applicability and effectiveness of
our products. We also work to enhance the functionality, usability and consistency of products by
simulating a variety of daily and lifestyle scenarios.
In the fiscal year ended March 31, 2013, the second fiscal year of our 10th three-year
Middle-Range Plan (fiscal year ended March 31, 2012–fiscal year ending March 31,
2014, “MP-10”), we recorded record-breaking net sales and net income. Nevertheless,
results fell short of initial targets due to weather-related factors and the impact of
intensifying competition on summer season products in Japan.
In the fiscal year ending March 31, 2014, the final year of MP-10, we will work to
achieve the initial numerical targets of the MP-10 by aggressively expanding sales
promotion activities centered on strong-performing overseas businesses. At the same
time, we will undertake measures to achieve further growth during MP-11.
9 mandom Annual Report 2013
Top Message To Our Stakeholders
We will accelerate the growth of Mandom Group
businesses to achieve the initial targets of
our 10th Three-Year Middle-Range Plan.
y , , y y
Middl R Pl (fi l d d M h 31 2012 fi l di M h 31
2014 “MP 10”) e eco ded eco d b eaking net sales and net income Ne e theless
mandom Annual Report 2013 10
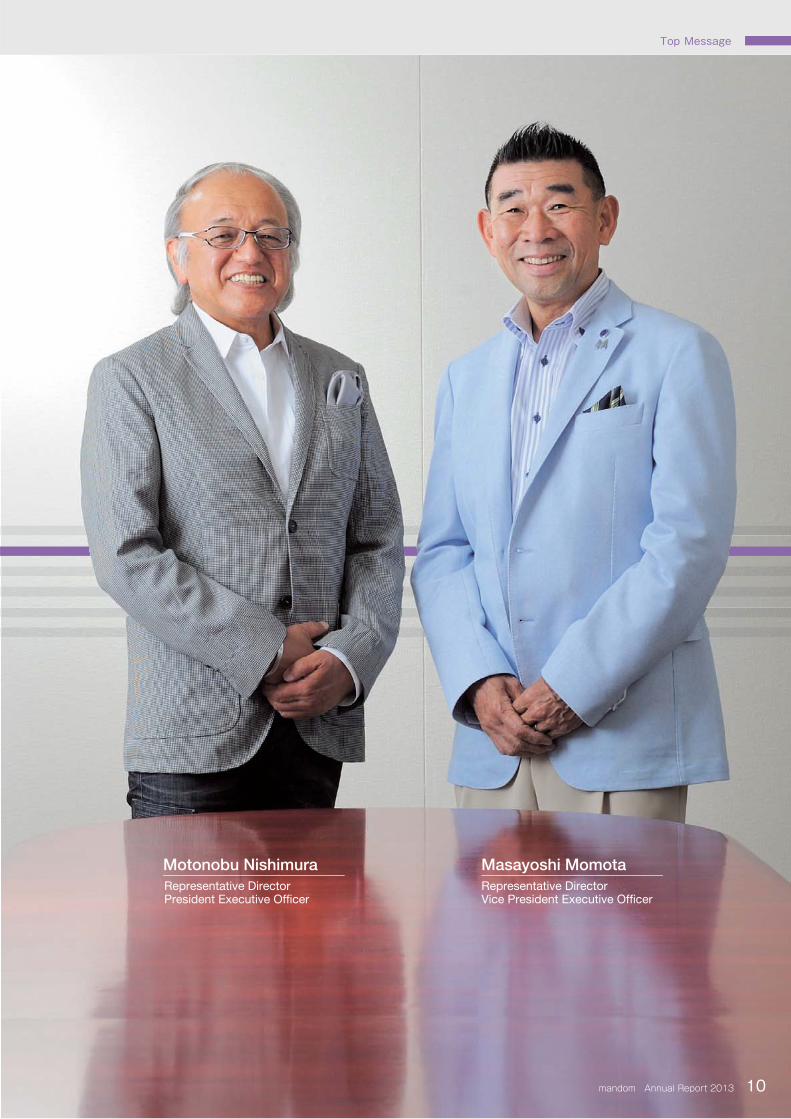
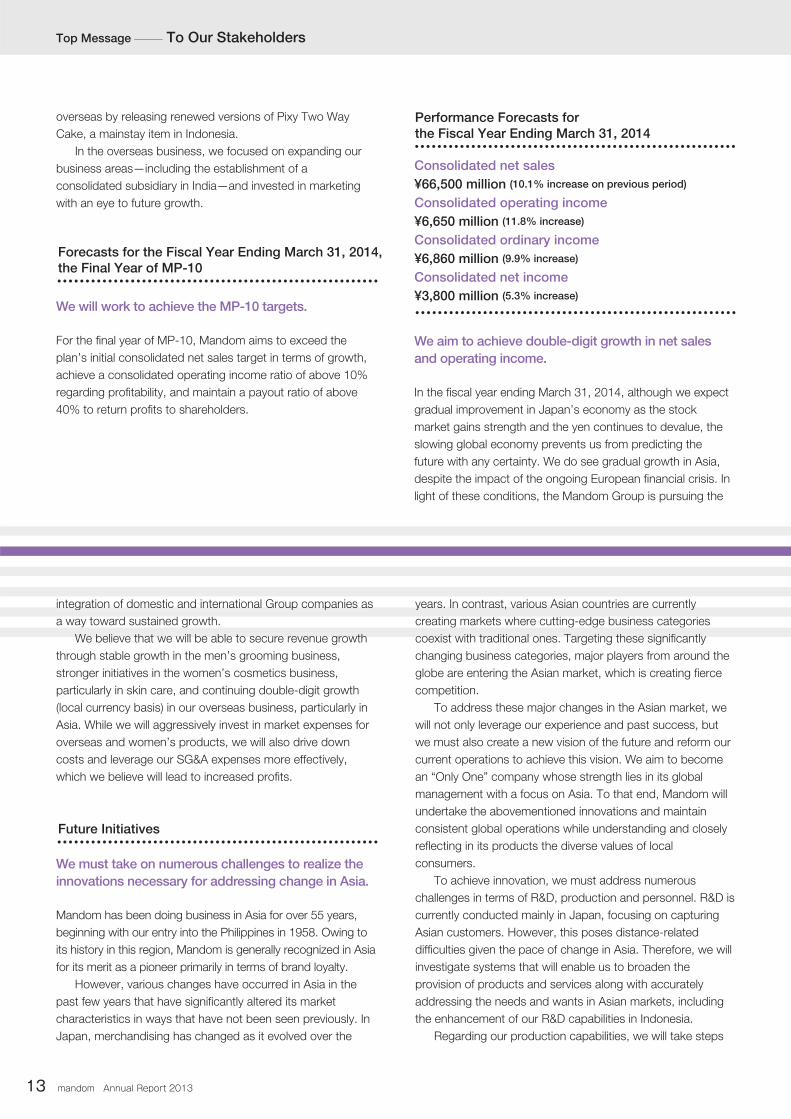
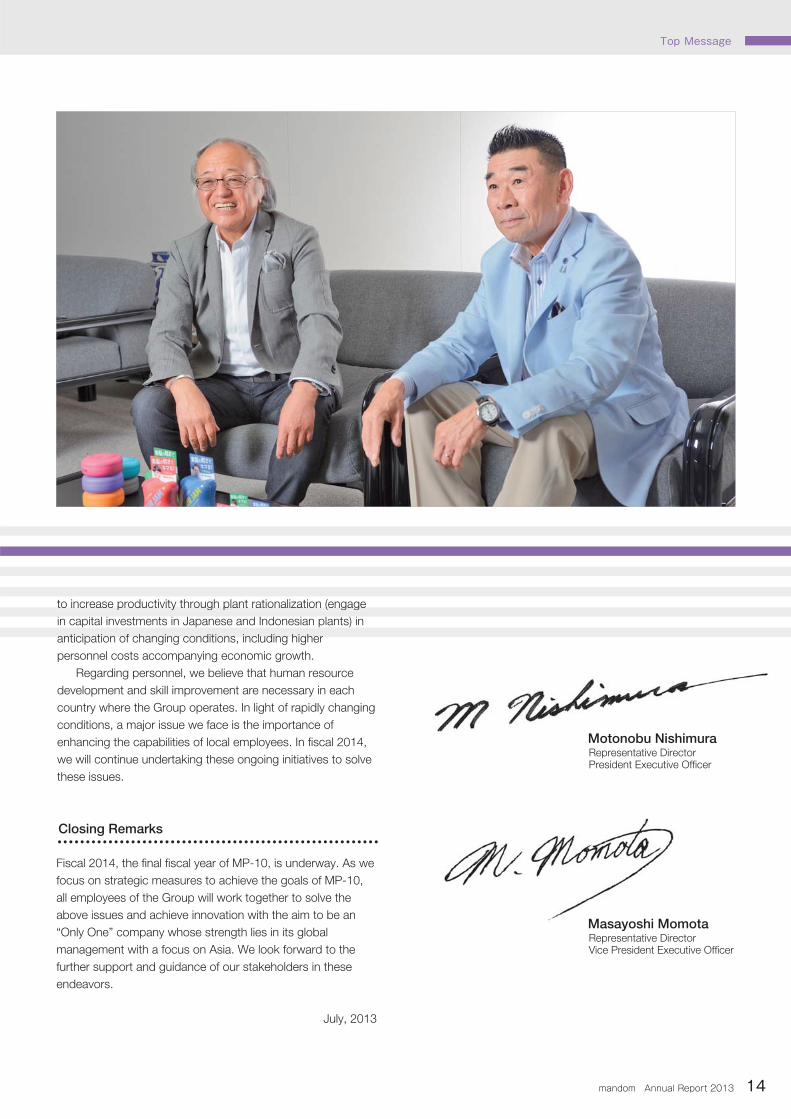
Masayoshi MomotaRepresentative DirectorVice President Executive Officer
Motonobu NishimuraRepresentative DirectorPresident Executive Officer
Top Message

We achieved record-breaking net sales despite a
marginal rise in revenues amid slumping sales of
summer season products in Japan. Operating income
and ordinary income decreased due to aggressive
marketing investments primarily overseas.
In fiscal 2013, the Group worked toward sustained growth
through the strategic measures of achieving stable growth in
the core men’s grooming business, stepping up efforts in
women’s cosmetics and continuing to expand overseas
operations with Asia as the engine of growth. Based on these
measures, in Japan we redoubled our efforts maintain
ongoing expansion primarily in the Gatsby face & body
category of summer season products and further developed
the Bifesta women’s cosmetic brand. Overseas, we stepped
our efforts to expand Gatsby reflecting the conditions of
individual countries while growing the women’s cosmetics
business in Asia. We also worked to curb the rising cost to
sales ratio amid high currency exchange rates and raw
materials prices by cutting costs focusing on paper products
in Japan. In addition, we aggressively invested in marketing,
particularly in overseas markets.
As a result of these efforts, overseas sales were strong,
including double-digit growth on a local currency basis,
excluding certain regions. In Japan, sales of summer season
products were weak because of weather-related factors and
intensifying competition. Consequently, net sales increased
only 1.0% over the previous fiscal year to ¥60,427 million.
Regarding earnings, operating income decreased 1.7% to
¥5,947 million, and ordinary income declined 1.1% to ¥6,241
million. Despite a decrease in the cost to sales ratio, mainly
reflecting cost-cutting measures and foreign currency
translations into yen, these decreases were attributable to
aggressive marketing investments overseas, beginning with
Indonesia. Net income increased 9.3% year on year owing
primarily to decreases in extraordinary loss and domestic
corporate taxes.
During the second fiscal year of MP-10, there was a
slight discrepancy between initial targets and results.
We have positioned MP-10 as a three-year business plan for
accelerating Mandom Group growth. To this end, we have
commenced the strategic measures of MP-10, which are to
accelerate growth through stable growth of the men’s
grooming business, bolstering expansion for the women’s
cosmetic business and continued strengthening of overseas
business, while remaining mindful of improving profitability and
maintaining high and consistent shareholder dividend
payouts. In the first fiscal year of MP-10, both growth and
profitability surpassed our initial projections. This was due to
outperforming our goals for MP-10 in its first fiscal year,
recording higher-than-expected growth that led to higher
profits. In addition, we improved profitability beyond our
expectations due to increased efficiency and a review of sales,
general and administrative expenses.
In the second year of MP-10, we did not reach initial
targets. Despite higher-than-projected net sales in the overseas
Overview of Fiscal 2013
5,550
6,600
5,747
6,050
5,947
58,500
66,000
57,262
59,801
60,427
66,500Consolidated Net Sales
¥60,427 million (1.0% increase on previous period)
Consolidated Operating Income
¥5,947 million (1.7% decrease)
Consolidated Ordinary Income
¥6,241 million (1.1% decrease)
Consolidated Net Income
¥3,607 million (9.3% increase)
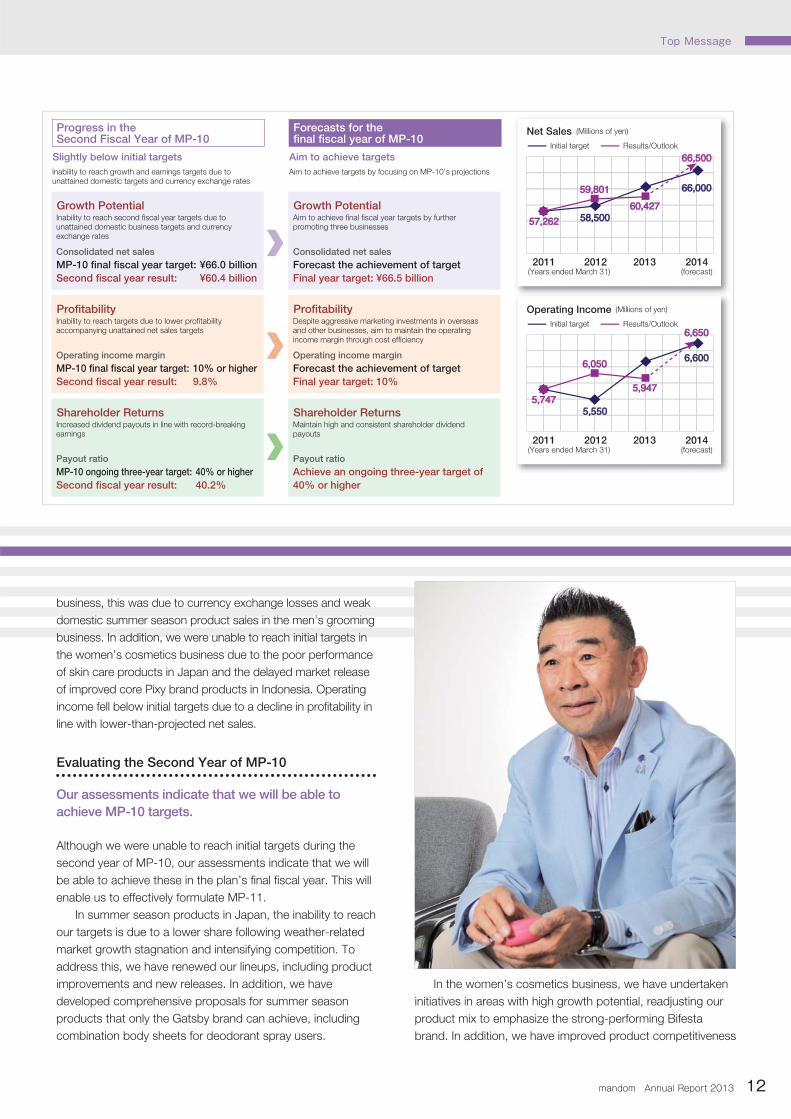
Progress in the Second Fiscal Year of MP-10
11 mandom Annual Report 2013
Despite achieving record-high net sales and net income,
operating income, ordinary income and other results fell short
of initial targets.
Top Message To Our Stakeholders
6,650
measures, in Japan we redoubled our efforts maintain
i i i il i h G b f & b d
Despite achieving record high net sales and net income,
category of summer season products and further developed
g
of initial targets
Our assessments indicate that we will be able to
achieve MP-10 targets.
Although we were unable to reach initial targets during the
second year of MP-10, our assessments indicate that we will
be able to achieve these in the plan’s final fiscal year. This will
enable us to effectively formulate MP-11.
In summer season products in Japan, the inability to reach
our targets is due to a lower share following weather-related
market growth stagnation and intensifying competition. To
address this, we have renewed our lineups, including product
improvements and new releases. In addition, we have
developed comprehensive proposals for summer season
products that only the Gatsby brand can achieve, including
combination body sheets for deodorant spray users.
Progress in the Second Fiscal Year of MP-10
Slightly below initial targets
Evaluating the Second Year of MP-10
5,5505,550
6,6006,600
5,7475,747
6,0506,050
5,9475,947
Net Sales
2011 2012 2013 2014(forecast)(Years ended March 31)
(Years ended March 31)
58,50058,500
66,00066,000
57,26257,262
59,80159,801
60,42760,427
66,50066,500Initial target Results/Outlook
Inability to reach growth and earnings targets due to unattained domestic targets and currency exchange rates
Growth PotentialInability to reach second fiscal year targets due to unattained domestic business targets and currency exchange rates
business, this was due to currency exchange losses and weak
domestic summer season product sales in the men’s grooming
business. In addition, we were unable to reach initial targets in
the women’s cosmetics business due to the poor performance
of skin care products in Japan and the delayed market release
of improved core Pixy brand products in Indonesia. Operating
income fell below initial targets due to a decline in profitability in
line with lower-than-projected net sales.
In the women’s cosmetics business, we have undertaken
initiatives in areas with high growth potential, readjusting our
product mix to emphasize the strong-performing Bifesta
brand. In addition, we have improved product competitiveness
MP-10 final fiscal year target: ¥66.0 billion
Second fiscal year result: ¥60.4 billion
Consolidated net sales
ProfitabilityInability to reach targets due to lower profitability accompanying unattained net sales targets
MP-10 final fiscal year target: 10% or higher
Second fiscal year result: 9.8%
Operating income margin
Shareholder ReturnsIncreased dividend payouts in line with record-breaking earnings
MP-10 ongoing three-year target: 40% or higher
Second fiscal year result: 40.2%
Payout ratio
Growth PotentialAim to achieve final fiscal year targets by further promoting three businesses
Forecast the achievement of target
Final year target: ¥66.5 billion
Consolidated net sales
ProfitabilityDespite aggressive marketing investments in overseas and other businesses, aim to maintain the operating income margin through cost efficiency
Forecast the achievement of target
Final year target: 10%
Operating income margin
Shareholder ReturnsMaintain high and consistent shareholder dividend payouts
Achieve an ongoing three-year target of
40% or higher
Payout ratio
Aim to achieve targets
Aim to achieve targets by focusing on MP-10’s projections
Forecasts for the final fiscal year of MP-10
(Millions of yen)
Operating Income
2011 2012 2013 2014(forecast)
Initial target Results/Outlook
(Millions of yen)
mandom Annual Report 2013 12
6,6506,650
Top Message
, y g
d ti d t l i th ’ i
business In addition we were unable to reach initial targets in
We will work to achieve the MP-10 targets.
For the final year of MP-10, Mandom aims to exceed the
plan’s initial consolidated net sales target in terms of growth,
achieve a consolidated operating income ratio of above 10%
regarding profitability, and maintain a payout ratio of above
40% to return profits to shareholders.
We aim to achieve double-digit growth in net sales
and operating income.
In the fiscal year ending March 31, 2014, although we expect
gradual improvement in Japan’s economy as the stock
market gains strength and the yen continues to devalue, the
slowing global economy prevents us from predicting the
future with any certainty. We do see gradual growth in Asia,
despite the impact of the ongoing European financial crisis. In
light of these conditions, the Mandom Group is pursuing the
Forecasts for the Fiscal Year Ending March 31, 2014, the Final Year of MP-10
We must take on numerous challenges to realize the
innovations necessary for addressing change in Asia.
Mandom has been doing business in Asia for over 55 years,
beginning with our entry into the Philippines in 1958. Owing to
its history in this region, Mandom is generally recognized in Asia
for its merit as a pioneer primarily in terms of brand loyalty.
However, various changes have occurred in Asia in the
past few years that have significantly altered its market
characteristics in ways that have not been seen previously. In
Japan, merchandising has changed as it evolved over the
Future Initiatives
13 mandom Annual Report 2013
Consolidated net sales
¥66,500 million (10.1% increase on previous period)
Consolidated operating income
¥6,650 million (11.8% increase)
Consolidated ordinary income
¥6,860 million (9.9% increase)
Consolidated net income
¥3,800 million (5.3% increase)
Performance Forecasts for the Fiscal Year Ending March 31, 2014
years. In contrast, various Asian countries are currently
creating markets where cutting-edge business categories
coexist with traditional ones. Targeting these significantly
changing business categories, major players from around the
globe are entering the Asian market, which is creating fierce
competition.
To address these major changes in the Asian market, we
will not only leverage our experience and past success, but
we must also create a new vision of the future and reform our
current operations to achieve this vision. We aim to become
an “Only One” company whose strength lies in its global
management with a focus on Asia. To that end, Mandom will
undertake the abovementioned innovations and maintain
consistent global operations while understanding and closely
reflecting in its products the diverse values of local
consumers.
To achieve innovation, we must address numerous
challenges in terms of R&D, production and personnel. R&D is
currently conducted mainly in Japan, focusing on capturing
Asian customers. However, this poses distance-related
difficulties given the pace of change in Asia. Therefore, we will
investigate systems that will enable us to broaden the
provision of products and services along with accurately
addressing the needs and wants in Asian markets, including
the enhancement of our R&D capabilities in Indonesia.
Regarding our production capabilities, we will take steps
overseas by releasing renewed versions of Pixy Two Way
Cake, a mainstay item in Indonesia.
In the overseas business, we focused on expanding our
business areas—including the establishment of a
consolidated subsidiary in India—and invested in marketing
with an eye to future growth.
integration of domestic and international Group companies as
a way toward sustained growth.
We believe that we will be able to secure revenue growth
through stable growth in the men’s grooming business,
stronger initiatives in the women’s cosmetics business,
particularly in skin care, and continuing double-digit growth
(local currency basis) in our overseas business, particularly in
Asia. While we will aggressively invest in market expenses for
overseas and women’s products, we will also drive down
costs and leverage our SG&A expenses more effectively,
which we believe will lead to increased profits.
Top Message To Our Stakeholders
years. In contrast, various Asian countries are currently
i k h i d b i i
integration of domestic and international Group companies as
d i d h g g g g
coexist with traditional ones Targeting these significantly
g
We believe that we will be able to secure revenue growth
Fiscal 2014, the final fiscal year of MP-10, is underway. As we
focus on strategic measures to achieve the goals of MP-10,
all employees of the Group will work together to solve the
above issues and achieve innovation with the aim to be an
“Only One” company whose strength lies in its global
management with a focus on Asia. We look forward to the
further support and guidance of our stakeholders in these
endeavors.
July, 2013
Closing Remarks
mandom Annual Report 2013 14
Motonobu NishimuraRepresentative DirectorPresident Executive Officer
Masayoshi MomotaRepresentative DirectorVice President Executive Officer
to increase productivity through plant rationalization (engage
in capital investments in Japanese and Indonesian plants) in
anticipation of changing conditions, including higher
personnel costs accompanying economic growth.
Regarding personnel, we believe that human resource
development and skill improvement are necessary in each
country where the Group operates. In light of rapidly changing
conditions, a major issue we face is the importance of
enhancing the capabilities of local employees. In fiscal 2014,
we will continue undertaking these ongoing initiatives to solve
these issues.
Top Message
to increase productivity through plant rationalization (engage
i i l i i J d I d i l ) i
anticipation of changing conditions including higher

Special Feature
15 mandom Annual Report 2013
Mandom’s overseas expansion began with the establishment of Tancho
Corporation in Manila, Philippines in 1958. Since then, we have focused
our overseas business growth on Asia. Our business operations in Asia
have involved understanding the values of each country and area while
working to satisfy local consumers by providing a variety of product
lineups that suit their economic clout and tastes.
Mandom currently operates four factories at three production bases,
Japan, Indonesia and China, which are able to produce and supply
cosmetics that match consumer characteristics in each area of Asia.
This feature introduces Mandom’s production and supply system,
which can address shifts in consumer trends as the Asian market
continues to develop.
Mandom’s Production and Supply System
Special Feature Mandom’s Production and Supply System

Special Feature
DUBAI etc
JAPANCHINA
NIESINDIA
ASEAN
INDONESIA
Production base
Product supply
1. Production and Supply System and Area Characteristics
Mandom currently produces and ships approximately 1 billion cosmetics and
other products from four factories at its three production bases, Japan,
Indonesia and China. Mandom produces and supplies its product lineups based
on six strategic area classifications that reflect market economic conditions,
consumer preferences, lifestyles and purchasing power.
This is an area where awareness of individual
style and cosmetics is increasing, and it lags
only slightly behind Japan in terms of trends.
As receptivity to new products and purchasing
power are relatively high, Mandom provides
highly functional, high-quality products that
reflect the latest trends.
This is an area where consumers have a high
awareness of personal style and cosmetics.
Accordingly, we anticipate a high rate of growth in this
market in the years ahead. Mandom supplies products
with functions, sizes and prices that suit the purchasing
power and lifestyles of Indian consumers.
This is an area where awareness of personal style and
cosmetics is increasing. Because there are disparities in
consumers’ purchasing power as well as a wide range
of lifestyles and preferences, Mandom supplies
products with functions, sizes and prices that suit the
lifestyles of consumers. Mandom also provides trendy
highly functional, superior-quality products that reflect
the characteristics of the country where it is expanding.
Awareness of personal style and cosmetics is
on the rise in Indonesia. Due to disparities in
consumers’ purchasing power as well as a
wide range of lifestyles and preferences, in this
area Mandom focuses on supplying products
with functions, sizes and prices adapted to
different consumer lifestyles.
CHINA
INDIA
CHINA
JAPAN
ASEANThailand, the Philippines, Malaysia INDONESIA
mandom Annual Report 2013 16
JAPAN
NIESSingapore, Taiwan, Hong Kong, South Korea
CHI
CHINA
Japan is Asia’s trendsetter and primary source
of information. Japanese consumers are very
aware of cosmetics and have strong
preferences, with a myriad of different
requirements, and Mandom supplies highly
functional, high-quality products that reflect the
latest trends.The time lag in trends compared to Japan is short.
Receptivity to new products and purchasing power are
relatively high in some areas, but as the market for
men’s cosmetics and hair styling products has not yet
matured, offering ample potential for growth going
forward. Against this backdrop, we are developing
products that suit the lifestyles and tastes of Chinese
consumers.
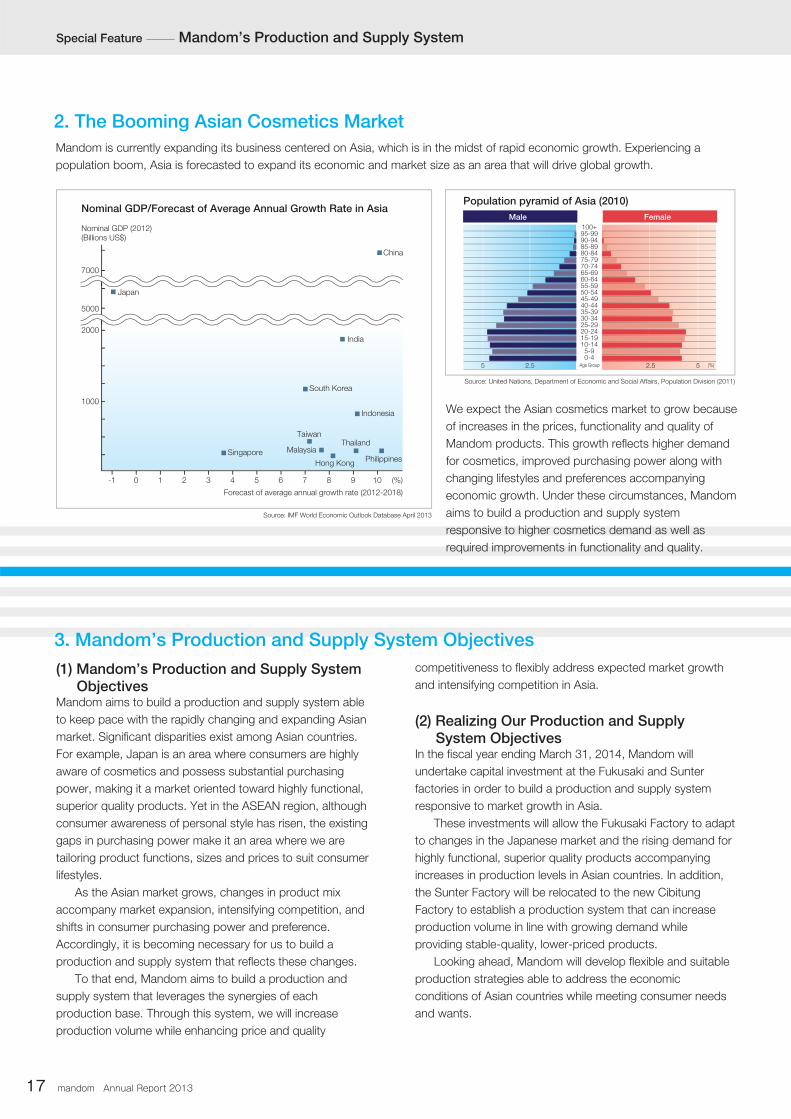
2. The Booming Asian Cosmetics Market
Mandom is currently expanding its business centered on Asia, which is in the midst of rapid economic growth. Experiencing a
population boom, Asia is forecasted to expand its economic and market size as an area that will drive global growth.
We expect the Asian cosmetics market to grow because
of increases in the prices, functionality and quality of
Mandom products. This growth reflects higher demand
for cosmetics, improved purchasing power along with
changing lifestyles and preferences accompanying
economic growth. Under these circumstances, Mandom
aims to build a production and supply system
responsive to higher cosmetics demand as well as
required improvements in functionality and quality.
3. Mandom’s Production and Supply System Objectives
17 mandom Annual Report 2013
(1) Mandom’s Production and Supply System Objectives
Mandom aims to build a production and supply system able
to keep pace with the rapidly changing and expanding Asian
market. Significant disparities exist among Asian countries.
For example, Japan is an area where consumers are highly
aware of cosmetics and possess substantial purchasing
power, making it a market oriented toward highly functional,
superior quality products. Yet in the ASEAN region, although
consumer awareness of personal style has risen, the existing
gaps in purchasing power make it an area where we are
tailoring product functions, sizes and prices to suit consumer
lifestyles.
As the Asian market grows, changes in product mix
accompany market expansion, intensifying competition, and
shifts in consumer purchasing power and preference.
Accordingly, it is becoming necessary for us to build a
production and supply system that reflects these changes.
To that end, Mandom aims to build a production and
supply system that leverages the synergies of each
production base. Through this system, we will increase
production volume while enhancing price and quality
competitiveness to flexibly address expected market growth
and intensifying competition in Asia.
(2) Realizing Our Production and Supply System Objectives
In the fiscal year ending March 31, 2014, Mandom will
undertake capital investment at the Fukusaki and Sunter
factories in order to build a production and supply system
responsive to market growth in Asia.
These investments will allow the Fukusaki Factory to adapt
to changes in the Japanese market and the rising demand for
highly functional, superior quality products accompanying
increases in production levels in Asian countries. In addition,
the Sunter Factory will be relocated to the new Cibitung
Factory to establish a production system that can increase
production volume in line with growing demand while
providing stable-quality, lower-priced products.
Looking ahead, Mandom will develop flexible and suitable
production strategies able to address the economic
conditions of Asian countries while meeting consumer needs
and wants.
Special Feature Mandom’s Production and Supply System
Population pyramid of Asia (2010)
Forecast of average annual growth rate (2012-2018)
1-1 0
2000
5000
7000
1000
Japan
2 3 4 5 6 7 8 9 10
Source: IMF World Economic Outlook Database April 2013
Source: United Nations, Department of Economic and Social Affairs, Population Division (2011)
Nominal GDP/Forecast of Average Annual Growth Rate in Asia
Singapore
Taiwan
Hong Kong
South Korea
Indonesia
MalaysiaPhilippines
Thailand
China
India
Age Group
Male Female
0-45-9
10-1415-1920-2425-2930-3435-3940-4445-4950-5455-5960-6465-6970-7475-7980-8485-8990-9495-99100+Nominal GDP (2012)
(Billions US$)
(%)
(%)52.55 2.5
Special Feature
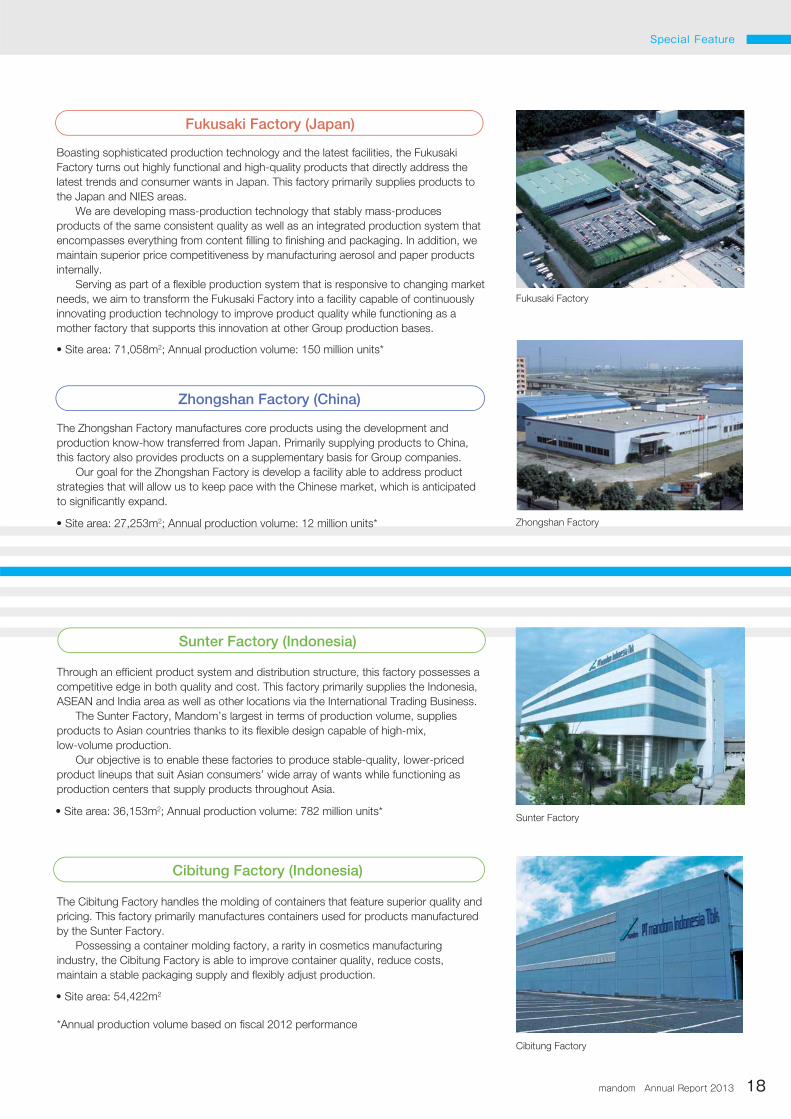
Boasting sophisticated production technology and the latest facilities, the Fukusaki
Factory turns out highly functional and high-quality products that directly address the
latest trends and consumer wants in Japan. This factory primarily supplies products to
the Japan and NIES areas.
We are developing mass-production technology that stably mass-produces
products of the same consistent quality as well as an integrated production system that
encompasses everything from content filling to finishing and packaging. In addition, we
maintain superior price competitiveness by manufacturing aerosol and paper products
internally.
Serving as part of a flexible production system that is responsive to changing market
needs, we aim to transform the Fukusaki Factory into a facility capable of continuously
innovating production technology to improve product quality while functioning as a
mother factory that supports this innovation at other Group production bases.
Fukusaki Factory (Japan)
The Cibitung Factory handles the molding of containers that feature superior quality and
pricing. This factory primarily manufactures containers used for products manufactured
by the Sunter Factory.
Possessing a container molding factory, a rarity in cosmetics manufacturing
industry, the Cibitung Factory is able to improve container quality, reduce costs,
maintain a stable packaging supply and flexibly adjust production.
Cibitung Factory (Indonesia)
• Site area: 71,058m2; Annual production volume: 150 million units*
Through an efficient product system and distribution structure, this factory possesses a
competitive edge in both quality and cost. This factory primarily supplies the Indonesia,
ASEAN and India area as well as other locations via the International Trading Business.
The Sunter Factory, Mandom’s largest in terms of production volume, supplies
products to Asian countries thanks to its flexible design capable of high-mix,
low-volume production.
Our objective is to enable these factories to produce stable-quality, lower-priced
product lineups that suit Asian consumers’ wide array of wants while functioning as
production centers that supply products throughout Asia.
Sunter Factory (Indonesia)
• Site area: 36,153m2; Annual production volume: 782 million units*
The Zhongshan Factory manufactures core products using the development and
production know-how transferred from Japan. Primarily supplying products to China,
this factory also provides products on a supplementary basis for Group companies.
Our goal for the Zhongshan Factory is develop a facility able to address product
strategies that will allow us to keep pace with the Chinese market, which is anticipated
to significantly expand.
Zhongshan Factory (China)
• Site area: 27,253m2; Annual production volume: 12 million units*
• Site area: 54,422m2
*Annual production volume based on fiscal 2012 performance
mandom Annual Report 2013 18
Fukusaki Factory
Zhongshan Factory
Sunter Factory
Cibitung Factory
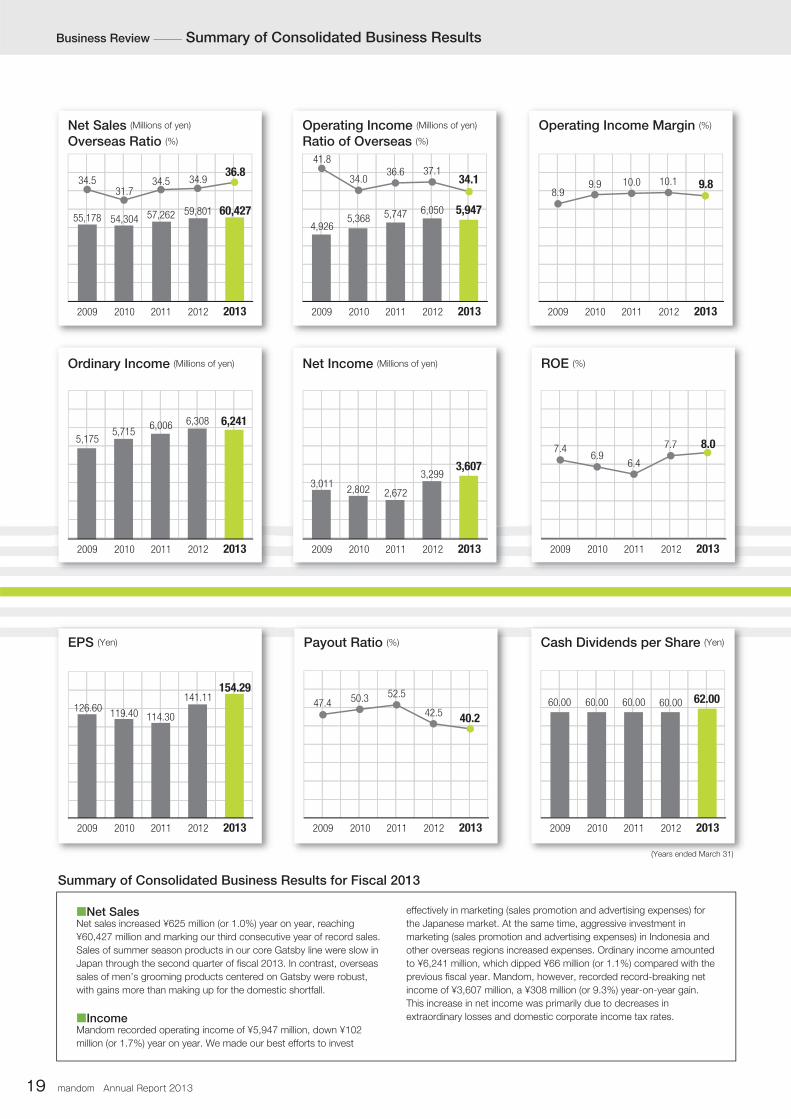
■Net SalesNet sales increased ¥625 million (or 1.0%) year on year, reaching
¥60,427 million and marking our third consecutive year of record sales.
Sales of summer season products in our core Gatsby line were slow in
Japan through the second quarter of fiscal 2013. In contrast, overseas
sales of men’s grooming products centered on Gatsby were robust,
with gains more than making up for the domestic shortfall.
■IncomeMandom recorded operating income of ¥5,947 million, down ¥102
million (or 1.7%) year on year. We made our best efforts to invest
19 mandom Annual Report 2013
effectively in marketing (sales promotion and advertising expenses) for
the Japanese market. At the same time, aggressive investment in
marketing (sales promotion and advertising expenses) in Indonesia and
other overseas regions increased expenses. Ordinary income amounted
to ¥6,241 million, which dipped ¥66 million (or 1.1%) compared with the
previous fiscal year. Mandom, however, recorded record-breaking net
income of ¥3,607 million, a ¥308 million (or 9.3%) year-on-year gain.
This increase in net income was primarily due to decreases in
extraordinary losses and domestic corporate income tax rates.
Summary of Consolidated Business Results for Fiscal 2013
Business Review Summary of Consolidated Business Results
Net Sales (Millions of yen)
Overseas Ratio (%)
36.8
60,42755,178
34.5
54,304
31.7
57,262
34.5
59,801
34.9
20132009 2010 2011 2012
Operating Income (Millions of yen)
Ratio of Overseas (%)
4,926
41.8
5,368
34.0
5,747
36.6
6,050
37.134.1
5,947
20132009 2010 2011 2012
Net Income (Millions of yen)
2,8023,011
3,299
2,672
3,607
20132009 2010 2011 2012
Ordinary Income (Millions of yen)
5,7155,175
6,3086,006 6,241
20132009 2010 2011 2012
ROE (%)
7.46.9
6.4
7.7 8.0
20132009 2010 2011 2012
EPS (Yen)
119.40126.60
141.11
114.30
154.29
20132009 2010 2011 2012
Payout Ratio (%)
47.4 50.3 52.5
42.5 40.2
20132009 2010 2011 2012
Cash Dividends per Share (Yen)
60.00 60.00 60.00 60.00 62.00
20132009 2010 2011 2012
Operating Income Margin (%)
8.99.9 10.0 10.1 9.8
20132009 2010 2011 2012
(Years ended March 31)

Business Review
Other Business
Men’s Grooming Business
This business handles a product range that
includes men’s daily grooming and hair styling
products, centering on the Gatsby and Lúcido
brands. In line with MP-10, Mandom has
positioned the men’s grooming business as its
core business and will leverage its stable
growth to construct a sturdy management
foundation.
Women’s Cosmetics Business
This business handles a range of make-up and
skin care products that lend variety to
women’s beauty routines centered on the Pixy
and Bifesta brands. Through MP-10, Mandom
will extend and intensify the women’s
cosmetics business with a view to enlarging
the scope of sales.
Women’s Cosmetries Business
Centered on the Lúcido-L and Pucelle brands,
this business comprises a range of products
including hair styling, facial and body care
items that enhance the beauty of women. In
the women’s cosmetries business, Mandom
aims to strengthen its base by reconstructing
each of these brands in accordance with
MP-10.
The Mandom Group has six strategic business units, including the men’s
grooming business, the women’s cosmetics business and the women’s
cosmetries business. Development of these businesses hinges directly on
the precise wants of consumers in each domain.
Product Expansion
This category is made up of the Professional Use Business, Other Business, and the International Trading Business.
● Business Ratio
%68.7● Net Sales
million yen41,504
compared with previous fiscal year
0.2% decrease ● ● ●
● Business Ratio
%11.1● Net Sales
million yen6,706
compared with previous fiscal year
6.2% increase
● Net Sales
million yen5,781
● Business Ratio
9.6%
compared with previous fiscal year
7.5% increase
Consolidated Net Sales– Ratio of Each Business
68.7%
11.1%
9.6%
10.6%
Men’s GroomingBusiness
Women’s CosmeticsBusiness
Women’s CosmetriesBusiness
Other Business
In Japan, the Group’s core operating area, growth
in the domestic market remains restrained due to
factors including an increasingly low birthrate and
aging society coupled with price reductions. With
companies in other industries entering the field,
these factors all point towards intensifying
competition. Despite this, new growth sectors are
emerging in the domestic market thanks mainly to
lifestyle changes. In men’s cosmetics, Mandom is
implementing its middle-range, three-year plan,
MP-10, to retain and expand its high market share,
drive the market as its leader and maintain steady
growth. For women’s cosmetics, Mandom will
leverage a reasonable and high-quality line of
products that meet consumer wants.
Asia is the business area that will drive growth
in the future. Increasing populations and higher
lifestyle standards stemming from economic
growth in each country point toward a market
that will continue to grow. In men’s hair-care
products, Mandom will implement MP-10 to
build and drive the market, while in other
product areas the company will increase sales
through leveraging a product lineup that
reflects the characteristics of each area.
In Indonesia, an area of paramount importance
for Mandom’s overseas business, there is
significant economic growth with further
market growth expected in line with increasing
income levels. Through MP-10, Mandom will,
in addition to its existing product range,
leverage a lineup that reflects the changes in
preferences, lifestyles and buying behavior
brought about by the higher purchasing power
of consumers, with a view to expanding sales
in this growing market.
● Area Ratio
%63.2● Net Sales
million yen38,208
compared with previous fiscal year
1.9% decrease ● ● ●
● Area Ratio
%22.4● Net Sales
million yen13,510
compared with previous fiscal year
0.4% increase
● Net Sales
million yen8,708
Japan Indonesia Other Overseas
● Area Ratio
14.4%
compared with previous fiscal year
17.6% increase
The Mandom Group does business in six strategic areas: Japan, Indonesia,
ASEAN, NIES, China and India. We strive to align our philosophy and the
policies common to our Group with local social and market characteristics.
Area Development
Domestic/Overseas Ratio of Consolidated Net Sales
36.8%Overseas
63.2%Japan
mandom Annual Report 2013 20
Business Review At a Glance
Domestic Operations
Japan
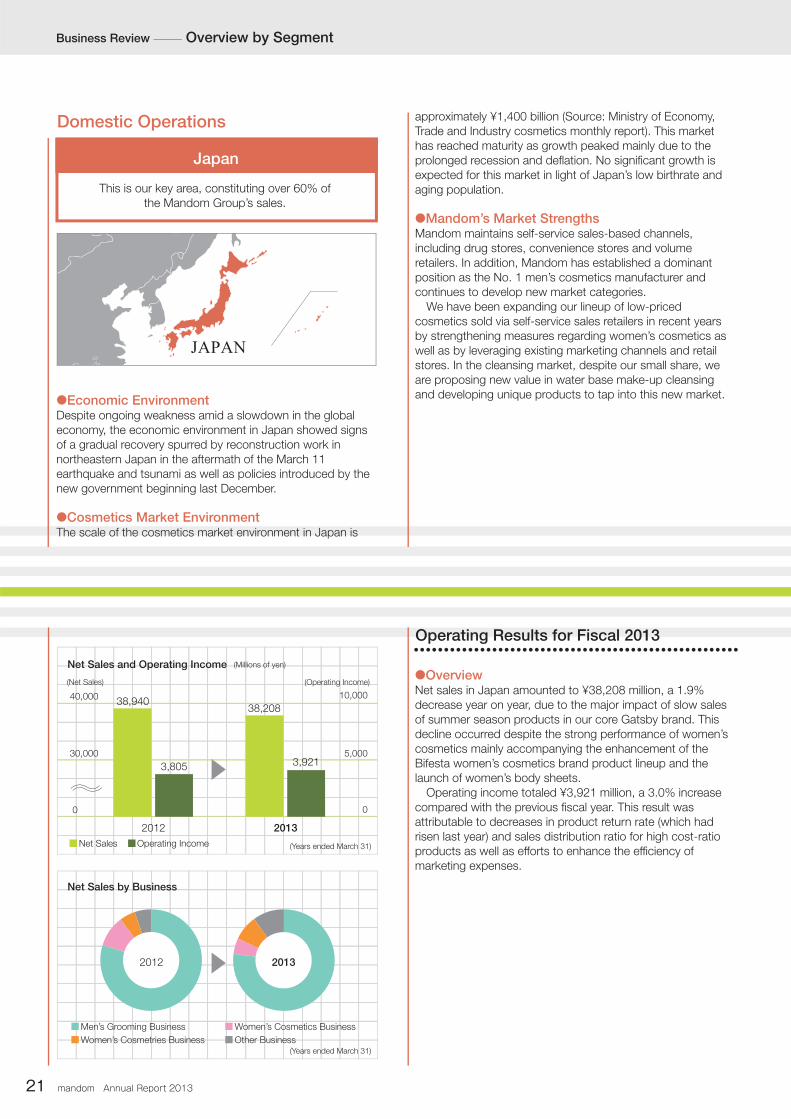
This is our key area, constituting over 60% ofthe Mandom Group’s sales.
●Economic Environment Despite ongoing weakness amid a slowdown in the global economy, the economic environment in Japan showed signs of a gradual recovery spurred by reconstruction work in northeastern Japan in the aftermath of the March 11 earthquake and tsunami as well as policies introduced by the new government beginning last December.
●Cosmetics Market EnvironmentThe scale of the cosmetics market environment in Japan is
approximately ¥1,400 billion (Source: Ministry of Economy, Trade and Industry cosmetics monthly report). This market has reached maturity as growth peaked mainly due to the prolonged recession and deflation. No significant growth is expected for this market in light of Japan’s low birthrate and aging population.
●Mandom’s Market StrengthsMandom maintains self-service sales-based channels, including drug stores, convenience stores and volume retailers. In addition, Mandom has established a dominant position as the No. 1 men’s cosmetics manufacturer and continues to develop new market categories. We have been expanding our lineup of low-priced cosmetics sold via self-service sales retailers in recent years by strengthening measures regarding women’s cosmetics as well as by leveraging existing marketing channels and retail stores. In the cleansing market, despite our small share, we are proposing new value in water base make-up cleansing and developing unique products to tap into this new market.
Operating Results for Fiscal 2013
●OverviewNet sales in Japan amounted to ¥38,208 million, a 1.9% decrease year on year, due to the major impact of slow sales of summer season products in our core Gatsby brand. This decline occurred despite the strong performance of women’s cosmetics mainly accompanying the enhancement of the Bifesta women’s cosmetics brand product lineup and the launch of women’s body sheets. Operating income totaled ¥3,921 million, a 3.0% increase compared with the previous fiscal year. This result was attributable to decreases in product return rate (which had risen last year) and sales distribution ratio for high cost-ratio products as well as efforts to enhance the efficiency of marketing expenses.
21 mandom Annual Report 2013
Business Review Overview by Segment
JAPAN
30,000
40,000
20132012
5,000
00
10,000
20132012
38,940
3,805
38,208
3,921
Net Sales by Business
Men’s Grooming Business Women’s Cosmetics Business
Women’s Cosmetries Business Other Business
Net Sales and Operating Income (Millions of yen)
Net Sales Operating Income
(Net Sales) (Operating Income)
(Years ended March 31)
(Years ended March 31)
Business Review
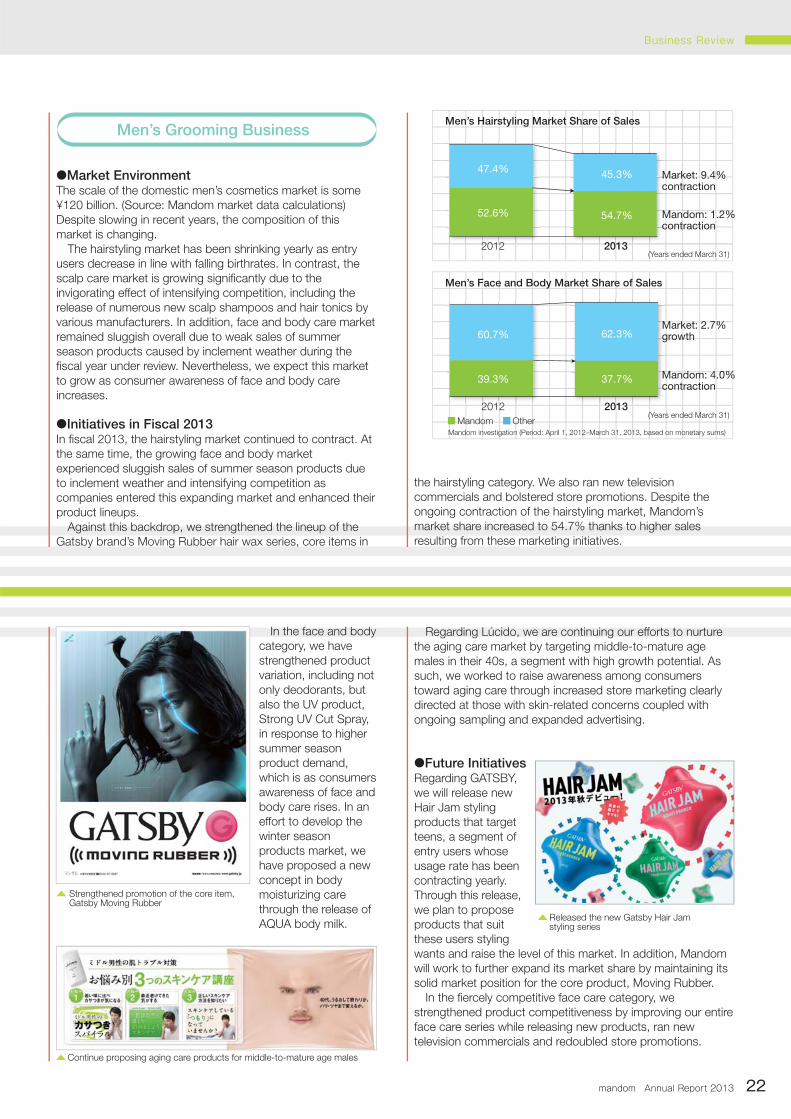
●Market EnvironmentThe scale of the domestic men’s cosmetics market is some ¥120 billion. (Source: Mandom market data calculations) Despite slowing in recent years, the composition of this market is changing. The hairstyling market has been shrinking yearly as entry users decrease in line with falling birthrates. In contrast, the scalp care market is growing significantly due to the invigorating effect of intensifying competition, including the release of numerous new scalp shampoos and hair tonics by various manufacturers. In addition, face and body care market remained sluggish overall due to weak sales of summer season products caused by inclement weather during the fiscal year under review. Nevertheless, we expect this market to grow as consumer awareness of face and body care increases.
●Initiatives in Fiscal 2013In fiscal 2013, the hairstyling market continued to contract. At the same time, the growing face and body market experienced sluggish sales of summer season products due to inclement weather and intensifying competition as companies entered this expanding market and enhanced their product lineups. Against this backdrop, we strengthened the lineup of the Gatsby brand’s Moving Rubber hair wax series, core items in
the hairstyling category. We also ran new television commercials and bolstered store promotions. Despite the ongoing contraction of the hairstyling market, Mandom’s market share increased to 54.7% thanks to higher sales resulting from these marketing initiatives.
Men’s Grooming Business
In the face and body category, we have strengthened product variation, including not only deodorants, but also the UV product, Strong UV Cut Spray, in response to higher summer season product demand, which is as consumers awareness of face and body care rises. In an effort to develop the winter season products market, we have proposed a new concept in body moisturizing care through the release of AQUA body milk.
Regarding Lúcido, we are continuing our efforts to nurture the aging care market by targeting middle-to-mature age males in their 40s, a segment with high growth potential. As such, we worked to raise awareness among consumers toward aging care through increased store marketing clearly directed at those with skin-related concerns coupled with ongoing sampling and expanded advertising.
●Future InitiativesRegarding GATSBY, we will release new Hair Jam styling products that target teens, a segment of entry users whose usage rate has been contracting yearly. Through this release, we plan to propose products that suit these users styling wants and raise the level of this market. In addition, Mandom will work to further expand its market share by maintaining its solid market position for the core product, Moving Rubber. In the fiercely competitive face care category, we strengthened product competitiveness by improving our entire face care series while releasing new products, ran new television commercials and redoubled store promotions.
Strengthened promotion of the core item, Gatsby Moving Rubber
Continue proposing aging care products for middle-to-mature age males
Released the new Gatsby Hair Jam styling series
mandom Annual Report 2013 22
MandomMandom investigation (Period: April 1, 2012–March 31, 2013, based on monetary sums)
Market: 2.7% growth
Mandom: 4.0% contraction
Other
Market: 9.4% contraction
Mandom: 1.2%contraction
20132012
47.4%45.3%
52.6% 54.7%
20132012
Men’s Face and Body Market Share of Sales
Men’s Hairstyling Market Share of Sales
60.7% 62.3%
39.3% 37.7%
(Years ended March 31)
(Years ended March 31)

Since its release at the end of February 2013, Perfect Scrub Wash reached No.1 in the face wash category (*monthly sales figures for April 2013) in spite of severe competition. Combined with a brand share of No. 2, Mandom products sales remain favorable.
In the body care category, we will work to increase usage rates for body paper, for which Gatsby has an approximately 80% market share and , in turn , further grow this market by stimulating consumer demand. This includes running new television commercials while further expanding various store and other promotions. In addition, we are renewing the highly effective Biocore deodorant series to enhance its wide array of variation to suit a multitude of applications. We are also addressing body odor care awareness, which is increasing yearly, by bolstering BIOCORE’s deodorant power. Regarding anti-aging proposals for middle-aged consumers through Lucido, we will work to raise body care awareness and cultivate this market by continuously expanding advertising and sampling.
●Market EnvironmentAmid sluggish sales in recent years, the women’s skincare market in Japan has seen changes in consumer purchasing behavior, leading to an increase in buying cosmetics at drugstores and the release of numerous low-cost, highly-fuctional cosmetics by all market players. At the same time, competition is becoming increasingly fierce, with growing numbers of pharmaceutical manufacturers and other types of businesses entering the cosmetics market. The cleansing market, which is the main business domain of our women’s cosmetics business, has peaked despite remaining large in scale. We expect our share of this market to increase through the proposition of new concepts and value.
●Initiatives in Fiscal 2013Despite signs of a slight rebound in the market, in fiscal 2013 competition became increasingly severe amid continually harsh market conditions and redoubled marketing activities by various companies. Under these circumstances, we worked to expand recognition of our core Bifesta brand and Water Cleansing series. In addition, we worked to raise awareness of water cleansing-type cleansers’ new value and promote their use. With Japanese actress and model Anna Tsuchiya serving as the new spokesperson for the Bifesta brand, we redoubled store promotion while airing new television commercials and
conducting sampling. Thanks to these initiatives, sales have increased while the size of the cleansing lotion category grew over 20%. In addition, we recently released the Bifesta Mirai Bihada skincare series, a simple yet sophisticated product that targets women in their 30s based on the same time-saving cosmetics concept used by the Water Cleansing series. We have worked to make Bifesta Mirai Bihada a market fixture through comprehensive marketing in stores. Amid fierce competition, however, rival products have driven down sales of Bifesta Mirai Bihada.
Women’ s Cosmetics Business
Improved Gatsby face care series
The renewed Gatsby’s Biocore deodorant series featuring an enhanced lineup
Expanded recognition of the Water Cleansing series by running new television advertisements
23 mandom Annual Report 2013
Business Review Overview by Segment

Business Review
●Future InitiativesWe will focus on strengthening the in-store appeal of Lúcido-L’s strong-selling hair wax series with the aim of maintaining the No. 1 market share of the hair wax category. We will enhance the variety of Mandom body sheets,
●Market EnvironmentThe women's hair styling market has contracted in recent years along with almost all product categories. However, hair cream and hair milk, hair oil non-bath treatments are enjoying strong sales as products that treat dry, brittle hair amid rising usage rates for hair irons and hot rollers. Despite steadily contracting each year, the body care market is experiencing changing product trends following the growth of body sheets and lotions in response to hot weather and growing energy conservation in recent years.
●Initiatives in Fiscal 2013In fiscal 2013, the women’s styling market remained largely unchanged as it continued to shrink. Under these circumstances, we updated the image of Lúcido-L brand, renewing the core items in that brand’s hair wax series to address consumer shifts toward natural styling products. As a result, our market share increased over 20% on the back of higher sales in the contracting hair wax market. However, the Lúcido-L brand as a whole experienced negative growth mainly due to a reduction in the hair color series. On the other hand, Mandom body sheets featuring Disney characters captured the fourth largest share of the body care market during the first fiscal year of its release. Thanks to this
and other factors, we enjoyed very strong performance that contributed to double-digit growth in the continually sluggish domestic women’s cosmetries business.
Women’ s Cosmetries Business●Future InitiativesIn addition the initiatives undertaken to date, we will redouble our efforts centered on Bifesta and the Water Cleansing series while working to further increase the recognition level of these brands. In addition, we will undertake market development in the cleansing lotion category. We will also cultivate these brands by enhancing product lineups, which includes releasing new highly popular 2-in-1-type oil-free cleansers that combine cleansing and facial washes in one package, to address consumers’ various cleansing-related wants.
Released 2-in-1-type cleansers
Expanded summer season series lineups by launching Mandom Splash Deo Water
Renewed Lúcido-L brand hair wax series
Strong-selling Mandom body sheets
mandom Annual Report 2013 24
which have been highly successful, by adding new fragrances. We will also expand the product lineups of women’s summer season series, which are expected to grow. To this end, we launched Splash Deo Water, a new product featuring various Disney characters.
●Economic EnvironmentAmid rapid economic growth in recent years, Indonesia’s consumer market has expanded on the back of higher income levels and accelerated changes in living conditions. In particular, ongoing growth of consumer markets is being buoyed by an increasing middle-class as wages rise along with an upswing in internal demand, reflecting a declining poverty rate. This promising consumer market, which boasts the world’s fourth largest population at 240 million, is experiencing a rising influx of overseas companies. Accordingly, the Indonesia consumer market is booming and is forecasted to enjoy high economic growth rates in the years ahead.
●Cosmetics Market EnvironmentThe cosmetics market is expected to grow at a high rate due to increasing consumer demand, quickly changing consumption behavior as well as indications of rising interest in highly-functional products and purchase prices. Previously, traditional markets comprised mainly of privately owned stores dominated retail sales in Indonesia. In recent years, however, numerous major overseas retail chains have entered the market and are expanding their operations, leading to a rapid modernization of this market. In this modern market, international cosmetics manufacturers are expanding the sales of men’s and women’s items. As this market grows, competition is expected to intensify even further.
●Mandom’s Strengths in the Indonesian MarketMandom began operating in Indonesia in 1969. At that time, the concept of men’s cosmetics had not yet taken hold. Proposing products that matched the wants of local consumers, we took it upon ourselves to develop and nurture a men’s cosmetics market that in turn boosted our business. Currently, we are building a distribution network able to supply products to almost all of Indonesia’s approximately 18,000 islands. Boasting a 70% plus share of the local hair styling market, we are Indonesia’s top men’s cosmetics manufacturer and have enjoyed strong growth in women’s cosmetics in recent years. With the percentage of domestic sales almost evenly divided between men and women, Mandom is a general cosmetics manufacturer that enjoys the highest brand recognition among local consumers.
Men’s Grooming Business
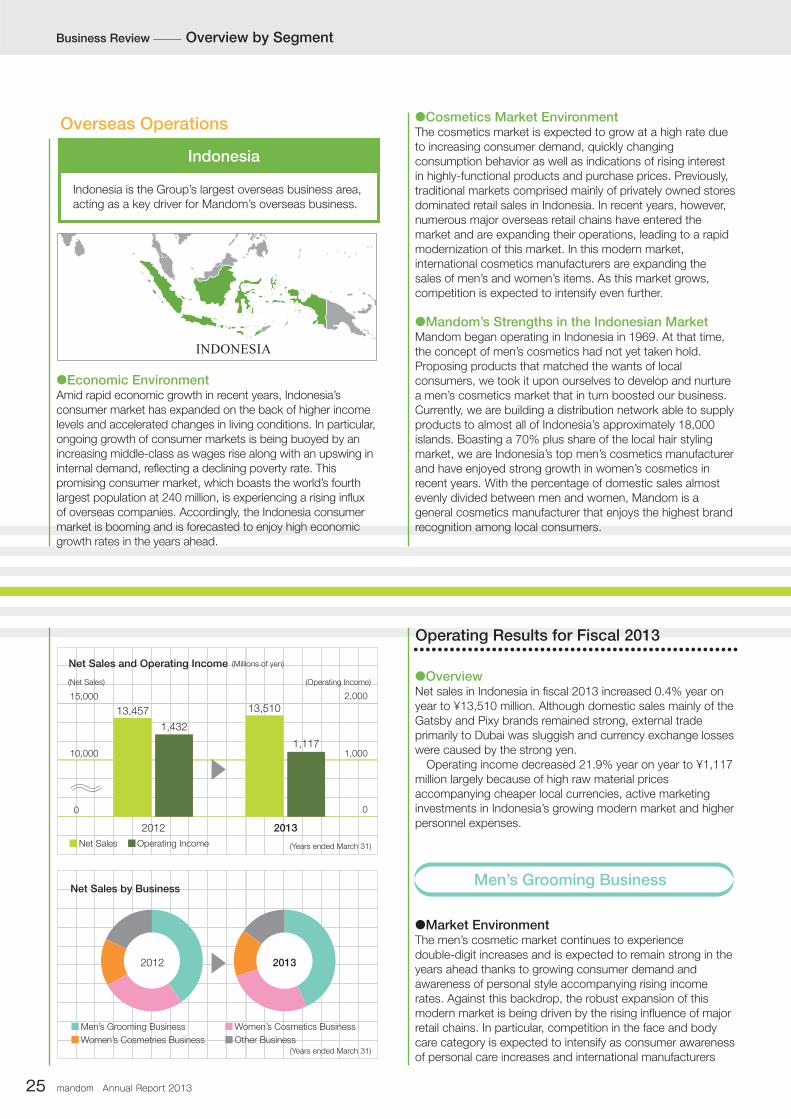
●OverviewNet sales in Indonesia in fiscal 2013 increased 0.4% year on year to ¥13,510 million. Although domestic sales mainly of the Gatsby and Pixy brands remained strong, external trade primarily to Dubai was sluggish and currency exchange losses were caused by the strong yen. Operating income decreased 21.9% year on year to ¥1,117 million largely because of high raw material prices accompanying cheaper local currencies, active marketing investments in Indonesia’s growing modern market and higher personnel expenses.
●Market EnvironmentThe men’s cosmetic market continues to experience double-digit increases and is expected to remain strong in the years ahead thanks to growing consumer demand and awareness of personal style accompanying rising income rates. Against this backdrop, the robust expansion of this modern market is being driven by the rising influence of major retail chains. In particular, competition in the face and body care category is expected to intensify as consumer awareness of personal care increases and international manufacturers
25 mandom Annual Report 2013
Operating Results for Fiscal 2013
Business Review Overview by Segment
INDONESIA
20132012
10,000
15,000
20132012
1,000
00
2,000
13,457
1,432
13,510
1,117
Indonesia
Overseas Operations
Indonesia is the Group’s largest overseas business area, acting as a key driver for Mandom’s overseas business.
Net Sales by Business
Net Sales and Operating Income
(Net Sales) (Operating Income)
(Millions of yen)
Men’s Grooming Business Women’s Cosmetics Business
Women’s Cosmetries Business Other Business
Net Sales Operating Income (Years ended March 31)
(Years ended March 31)
Business Review
Renewed the entire Gatsby Water Gloss series
Launched the Gatsby Urban Cologne series to strengthen product lineup
boost operations in their specialty areas.
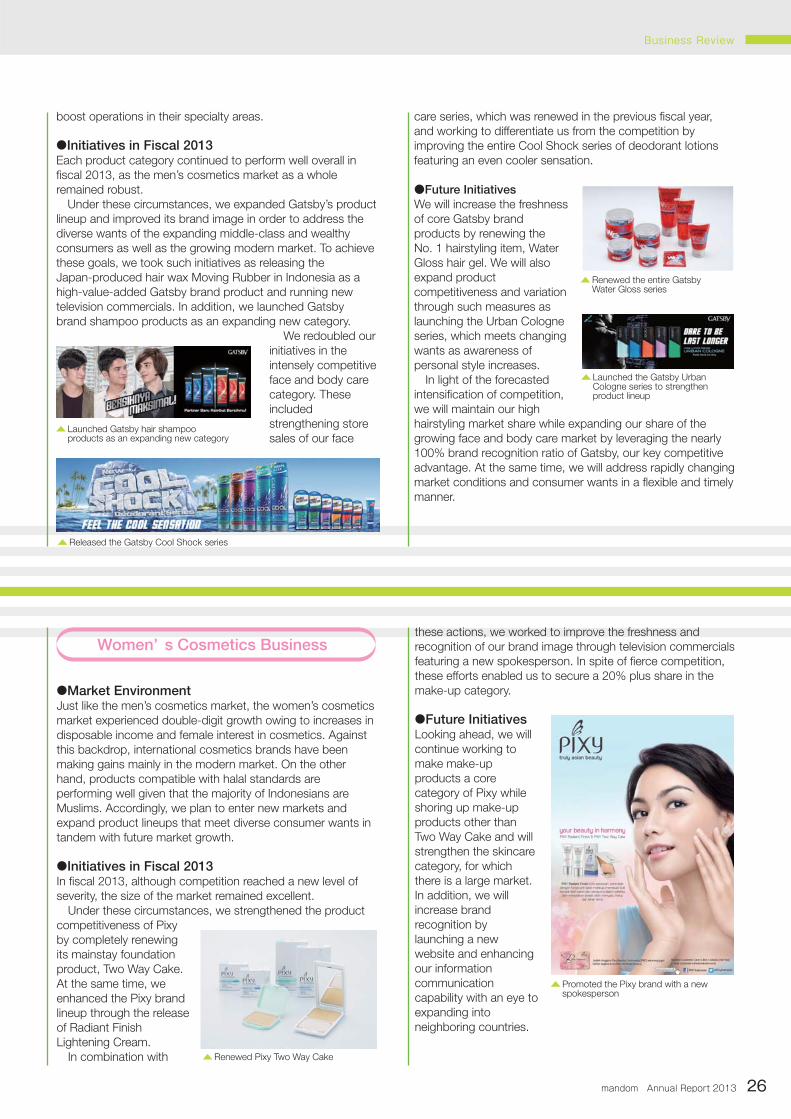
●Initiatives in Fiscal 2013Each product category continued to perform well overall in fiscal 2013, as the men’s cosmetics market as a whole remained robust. Under these circumstances, we expanded Gatsby’s product lineup and improved its brand image in order to address the diverse wants of the expanding middle-class and wealthy consumers as well as the growing modern market. To achieve these goals, we took such initiatives as releasing the Japan-produced hair wax Moving Rubber in Indonesia as a high-value-added Gatsby brand product and running new television commercials. In addition, we launched Gatsby brand shampoo products as an expanding new category.
We redoubled our initiatives in the intensely competitive face and body care category. These included strengthening store sales of our face
care series, which was renewed in the previous fiscal year, and working to differentiate us from the competition by improving the entire Cool Shock series of deodorant lotions featuring an even cooler sensation.
●Future InitiativesWe will increase the freshness of core Gatsby brand products by renewing the No. 1 hairstyling item, Water Gloss hair gel. We will also expand product competitiveness and variation through such measures as launching the Urban Cologne series, which meets changing wants as awareness of personal style increases. In light of the forecasted intensification of competition, we will maintain our high hairstyling market share while expanding our share of the growing face and body care market by leveraging the nearly 100% brand recognition ratio of Gatsby, our key competitive advantage. At the same time, we will address rapidly changing market conditions and consumer wants in a flexible and timely manner.
●Market EnvironmentJust like the men’s cosmetics market, the women’s cosmetics market experienced double-digit growth owing to increases in disposable income and female interest in cosmetics. Against this backdrop, international cosmetics brands have been making gains mainly in the modern market. On the other hand, products compatible with halal standards are performing well given that the majority of Indonesians are Muslims. Accordingly, we plan to enter new markets and expand product lineups that meet diverse consumer wants in tandem with future market growth.
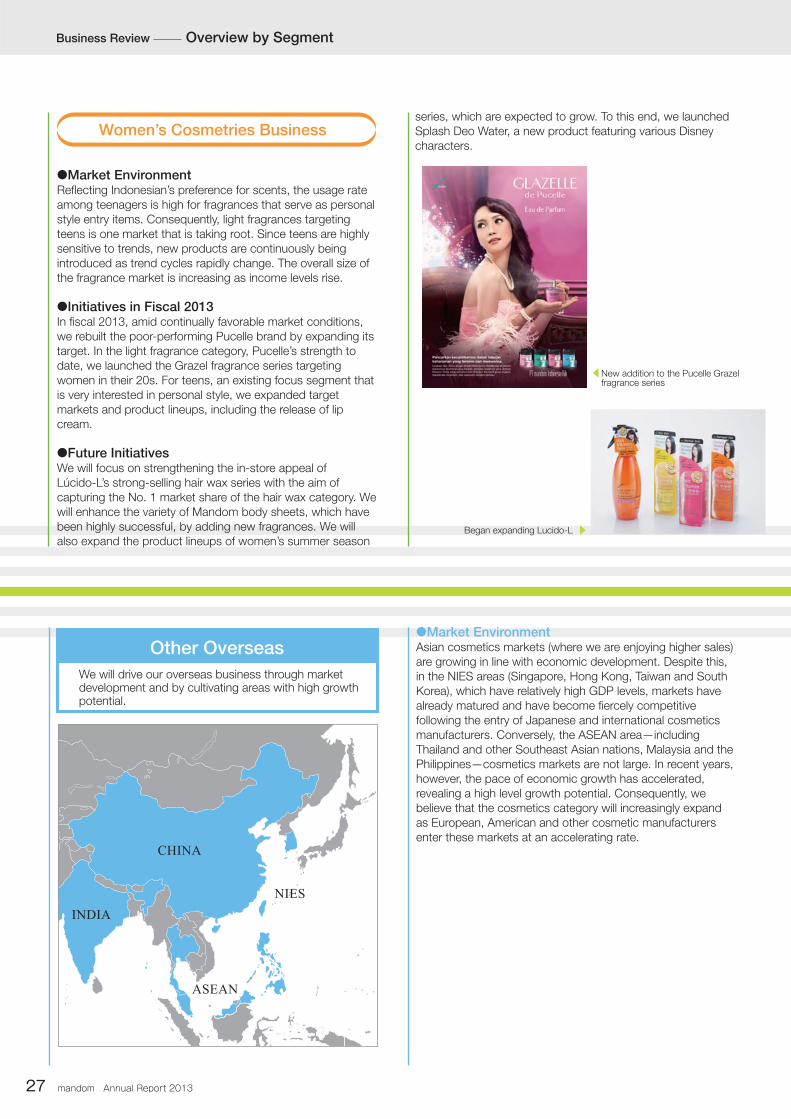
●Initiatives in Fiscal 2013In fiscal 2013, although competition reached a new level of severity, the size of the market remained excellent. Under these circumstances, we strengthened the product competitiveness of Pixy by completely renewing its mainstay foundation product, Two Way Cake. At the same time, we enhanced the Pixy brand lineup through the release of Radiant Finish Lightening Cream. In combination with
these actions, we worked to improve the freshness and recognition of our brand image through television commercials featuring a new spokesperson. In spite of fierce competition, these efforts enabled us to secure a 20% plus share in the make-up category.
●Future InitiativesLooking ahead, we will continue working to make make-up products a core category of Pixy while shoring up make-up products other than Two Way Cake and will strengthen the skincare category, for which there is a large market. In addition, we will increase brand recognition by launching a new website and enhancing our information communication capability with an eye to expanding into neighboring countries.
Women’ s Cosmetics Business
Renewed Pixy Two Way Cake
Promoted the Pixy brand with a new spokesperson
Launched Gatsby hair shampoo products as an expanding new category
Released the Gatsby Cool Shock series
mandom Annual Report 2013 26
●Market EnvironmentReflecting Indonesian’s preference for scents, the usage rate among teenagers is high for fragrances that serve as personal style entry items. Consequently, light fragrances targeting teens is one market that is taking root. Since teens are highly sensitive to trends, new products are continuously being introduced as trend cycles rapidly change. The overall size of the fragrance market is increasing as income levels rise.
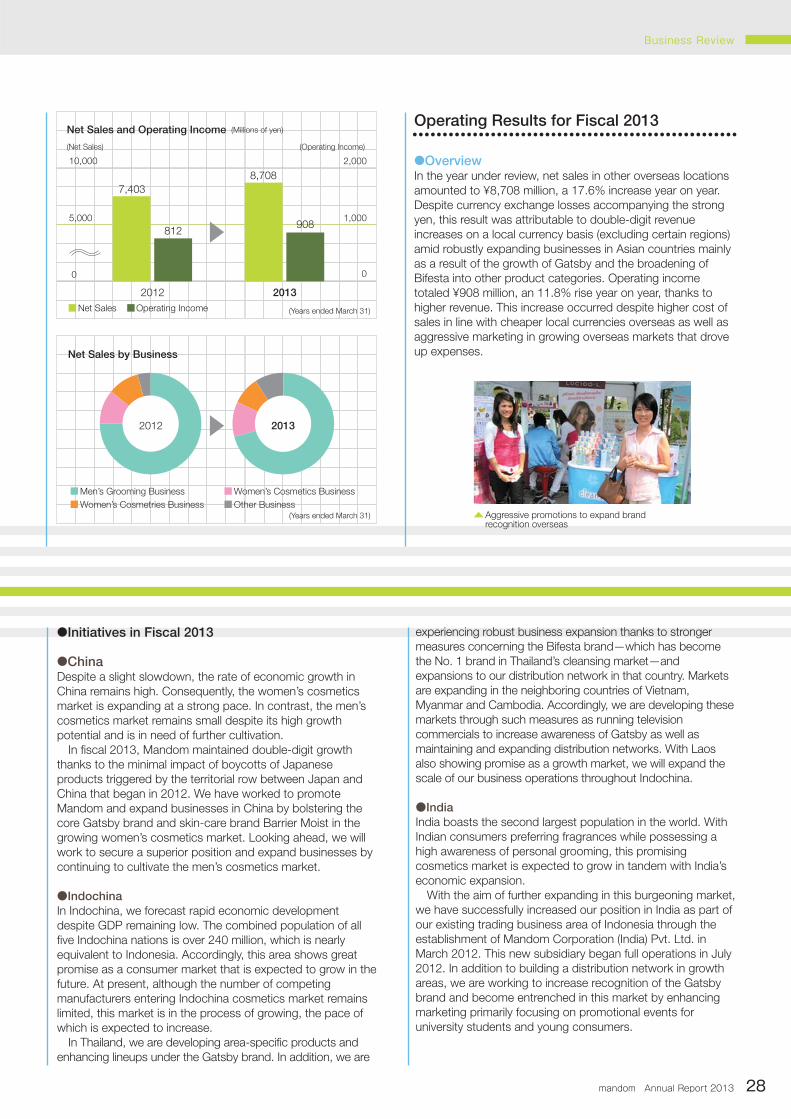
●Initiatives in Fiscal 2013In fiscal 2013, amid continually favorable market conditions, we rebuilt the poor-performing Pucelle brand by expanding its target. In the light fragrance category, Pucelle’s strength to date, we launched the Grazel fragrance series targeting women in their 20s. For teens, an existing focus segment that is very interested in personal style, we expanded target markets and product lineups, including the release of lip cream.
●Future InitiativesWe will focus on strengthening the in-store appeal of Lúcido-L’s strong-selling hair wax series with the aim of capturing the No. 1 market share of the hair wax category. We will enhance the variety of Mandom body sheets, which have been highly successful, by adding new fragrances. We will also expand the product lineups of women’s summer season
series, which are expected to grow. To this end, we launched Splash Deo Water, a new product featuring various Disney characters.
Women’s Cosmetries Business
Other Overseas
Began expanding Lucido-L
New addition to the Pucelle Grazel fragrance series
We will drive our overseas business through market development and by cultivating areas with high growth potential.
●Market EnvironmentAsian cosmetics markets (where we are enjoying higher sales) are growing in line with economic development. Despite this, in the NIES areas (Singapore, Hong Kong, Taiwan and South Korea), which have relatively high GDP levels, markets have already matured and have become fiercely competitive following the entry of Japanese and international cosmetics manufacturers. Conversely, the ASEAN area—including Thailand and other Southeast Asian nations, Malaysia and the Philippines—cosmetics markets are not large. In recent years, however, the pace of economic growth has accelerated, revealing a high level growth potential. Consequently, we believe that the cosmetics category will increasingly expand as European, American and other cosmetic manufacturers enter these markets at an accelerating rate.
27 mandom Annual Report 2013
Business Review Overview by Segment
CHINA
INDIA
ASEAN
NIES
Business Review
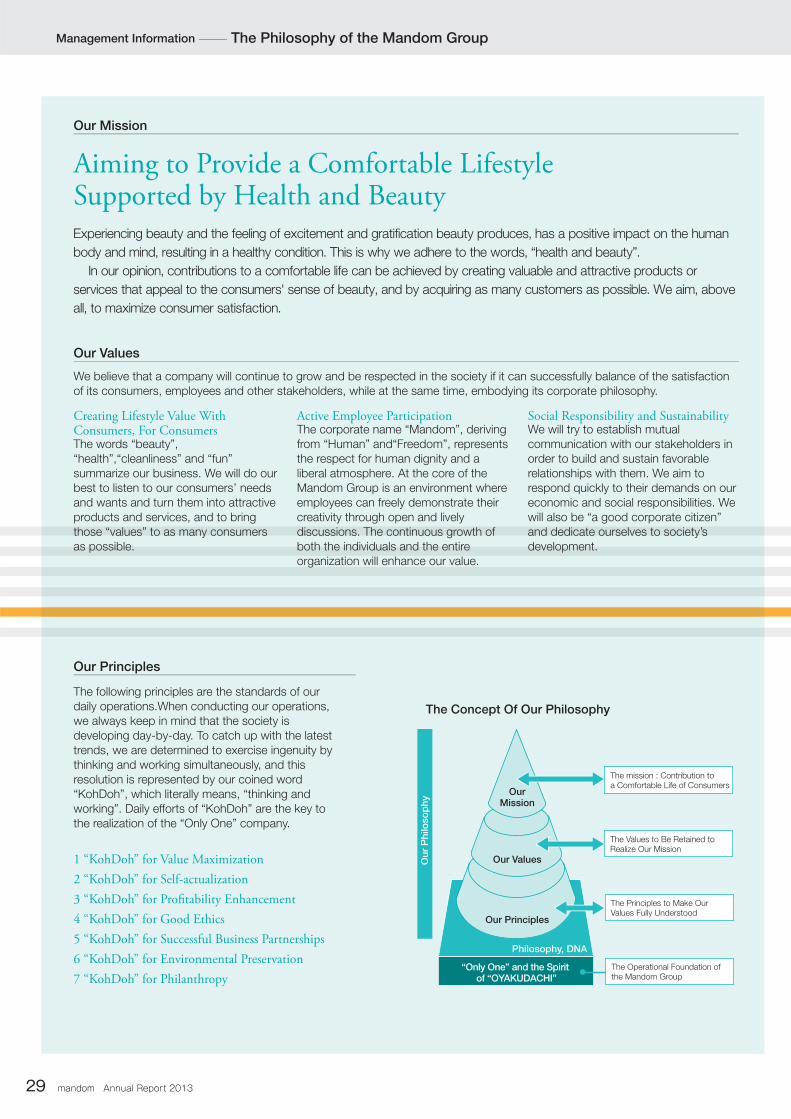
●OverviewIn the year under review, net sales in other overseas locations amounted to ¥8,708 million, a 17.6% increase year on year. Despite currency exchange losses accompanying the strong yen, this result was attributable to double-digit revenue increases on a local currency basis (excluding certain regions) amid robustly expanding businesses in Asian countries mainly as a result of the growth of Gatsby and the broadening of Bifesta into other product categories. Operating income totaled ¥908 million, an 11.8% rise year on year, thanks to higher revenue. This increase occurred despite higher cost of sales in line with cheaper local currencies overseas as well as aggressive marketing in growing overseas markets that drove up expenses.
●Initiatives in Fiscal 2013
●ChinaDespite a slight slowdown, the rate of economic growth in China remains high. Consequently, the women’s cosmetics market is expanding at a strong pace. In contrast, the men’s cosmetics market remains small despite its high growth potential and is in need of further cultivation. In fiscal 2013, Mandom maintained double-digit growth thanks to the minimal impact of boycotts of Japanese products triggered by the territorial row between Japan and China that began in 2012. We have worked to promote Mandom and expand businesses in China by bolstering the core Gatsby brand and skin-care brand Barrier Moist in the growing women’s cosmetics market. Looking ahead, we will work to secure a superior position and expand businesses by continuing to cultivate the men’s cosmetics market.
●IndochinaIn Indochina, we forecast rapid economic development despite GDP remaining low. The combined population of all five Indochina nations is over 240 million, which is nearly equivalent to Indonesia. Accordingly, this area shows great promise as a consumer market that is expected to grow in the future. At present, although the number of competing manufacturers entering Indochina cosmetics market remains limited, this market is in the process of growing, the pace of which is expected to increase. In Thailand, we are developing area-specific products and enhancing lineups under the Gatsby brand. In addition, we are
experiencing robust business expansion thanks to stronger measures concerning the Bifesta brand—which has become the No. 1 brand in Thailand’s cleansing market—and expansions to our distribution network in that country. Markets are expanding in the neighboring countries of Vietnam, Myanmar and Cambodia. Accordingly, we are developing these markets through such measures as running television commercials to increase awareness of Gatsby as well as maintaining and expanding distribution networks. With Laos also showing promise as a growth market, we will expand the scale of our business operations throughout Indochina.
●IndiaIndia boasts the second largest population in the world. With Indian consumers preferring fragrances while possessing a high awareness of personal grooming, this promising cosmetics market is expected to grow in tandem with India’s economic expansion. With the aim of further expanding in this burgeoning market, we have successfully increased our position in India as part of our existing trading business area of Indonesia through the establishment of Mandom Corporation (India) Pvt. Ltd. in March 2012. This new subsidiary began full operations in July 2012. In addition to building a distribution network in growth areas, we are working to increase recognition of the Gatsby brand and become entrenched in this market by enhancing marketing primarily focusing on promotional events for university students and young consumers.
mandom Annual Report 2013 28
Operating Results for Fiscal 2013
Aggressive promotions to expand brand recognition overseas
20132012
5,000
10,000
20132012
1,000
00
2,000
7,403
812
8,708
908
Net Sales by Business
Net Sales and Operating Income
(Net Sales) (Operating Income)
(Millions of yen)
Men’s Grooming Business Women’s Cosmetics Business
Women’s Cosmetries Business Other Business
Net Sales Operating Income (Years ended March 31)
(Years ended March 31)
mandom Annual Report 201329
Aiming to Provide a Comfortable LifestyleSupported by Health and Beauty
The following principles are the standards of our daily operations.When conducting our operations, we always keep in mind that the society is developing day-by-day. To catch up with the latest trends, we are determined to exercise ingenuity by thinking and working simultaneously, and this resolution is represented by our coined word “KohDoh”, which literally means, “thinking and working”. Daily efforts of “KohDoh” are the key to the realization of the “Only One” company.
1 “KohDoh” for Value Maximization2 “KohDoh” for Self-actualization3 “KohDoh” for Profi tability Enhancement4 “KohDoh” for Good Ethics5 “KohDoh” for Successful Business Partnerships6 “KohDoh” for Environmental Preservation7 “KohDoh” for Philanthropy
We believe that a company will continue to grow and be respected in the society if it can successfully balance of the satisfaction of its consumers, employees and other stakeholders, while at the same time, embodying its corporate philosophy.
Social Responsibility and SustainabilityWe will try to establish mutual communication with our stakeholders in order to build and sustain favorable relationships with them. We aim to respond quickly to their demands on our economic and social responsibilities. We will also be “a good corporate citizen” and dedicate ourselves to society’s development.
Our Mission
Our Values
Our Principles
The Concept Of Our Philosophy
The mission : Contribution to a Comfortable Life of Consumers
The Values to Be Retained toRealize Our Mission
The Principles to Make Our Values Fully Understood
The Operational Foundation of the Mandom Group
Ou
r P
hilo
so
ph
y
Philosophy, DNA
“Only One” and the Spirit of “OYAKUDACHI”
OurMission
Our Values
Our Principles
Management Information The Philosophy of the Mandom Group
Creating Lifestyle Value With Consumers, For ConsumersThe words “beauty”, “health”,“cleanliness” and “fun” summarize our business. We will do our best to listen to our consumers’ needs and wants and turn them into attractive products and services, and to bring those “values” to as many consumers as possible.
Active Employee ParticipationThe corporate name “Mandom”, deriving from “Human” and“Freedom”, represents the respect for human dignity and a liberal atmosphere. At the core of the Mandom Group is an environment where employees can freely demonstrate their creativity through open and lively discussions. The continuous growth of both the individuals and the entire organization will enhance our value.
Experiencing beauty and the feeling of excitement and gratification beauty produces, has a positive impact on the human
body and mind, resulting in a healthy condition. This is why we adhere to the words, “health and beauty”.
In our opinion, contributions to a comfortable life can be achieved by creating valuable and attractive products or
services that appeal to the consumers' sense of beauty, and by acquiring as many customers as possible. We aim, above
all, to maximize consumer satisfaction.
mandom Annual Report 2013 30
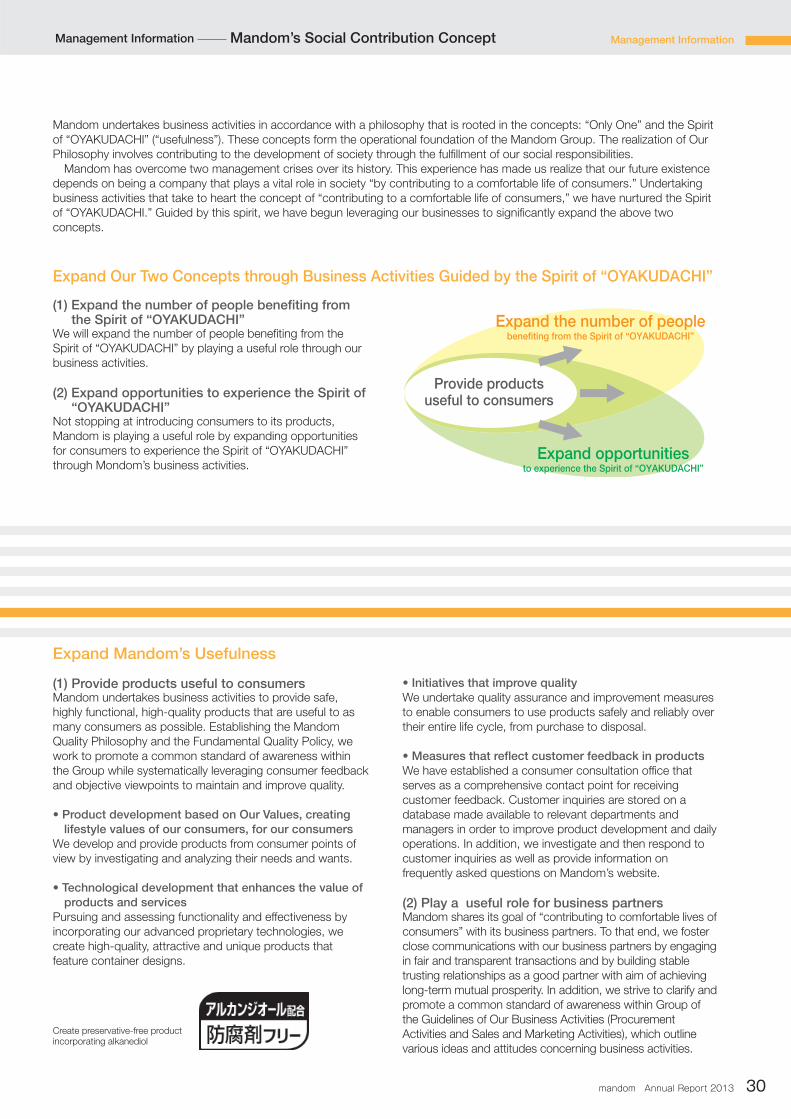
(1) Provide products useful to consumersMandom undertakes business activities to provide safe, highly functional, high-quality products that are useful to as many consumers as possible. Establishing the Mandom Quality Philosophy and the Fundamental Quality Policy, we work to promote a common standard of awareness within the Group while systematically leveraging consumer feedback and objective viewpoints to maintain and improve quality.
• Product development based on Our Values, creating lifestyle values of our consumers, for our consumers
We develop and provide products from consumer points of view by investigating and analyzing their needs and wants.
• Technological development that enhances the value of products and services
Pursuing and assessing functionality and effectiveness by incorporating our advanced proprietary technologies, we create high-quality, attractive and unique products that feature container designs.
• Initiatives that improve qualityWe undertake quality assurance and improvement measures to enable consumers to use products safely and reliably over their entire life cycle, from purchase to disposal.
• Measures that reflect customer feedback in productsWe have established a consumer consultation office that serves as a comprehensive contact point for receiving customer feedback. Customer inquiries are stored on adatabase made available to relevant departments and managers in order to improve product development and daily operations. In addition, we investigate and then respond to customer inquiries as well as provide information on frequently asked questions on Mandom’s website.
(2) Play a useful role for business partners Mandom shares its goal of “contributing to comfortable lives of consumers” with its business partners. To that end, we foster close communications with our business partners by engaging in fair and transparent transactions and by building stable trusting relationships as a good partner with aim of achieving long-term mutual prosperity. In addition, we strive to clarify and promote a common standard of awareness within Group of the Guidelines of Our Business Activities (Procurement Activities and Sales and Marketing Activities), which outline various ideas and attitudes concerning business activities.
(1) Expand the number of people benefiting from the Spirit of “OYAKUDACHI”
We will expand the number of people benefiting from the Spirit of “OYAKUDACHI” by playing a useful role through our business activities.
(2) Expand opportunities to experience the Spirit of “OYAKUDACHI”
Not stopping at introducing consumers to its products, Mandom is playing a useful role by expanding opportunities for consumers to experience the Spirit of “OYAKUDACHI” through Mondom’s business activities.
Mandom undertakes business activities in accordance with a philosophy that is rooted in the concepts: “Only One” and the Spirit of “OYAKUDACHI” (“usefulness”). These concepts form the operational foundation of the Mandom Group. The realization of Our Philosophy involves contributing to the development of society through the fulfillment of our social responsibilities. Mandom has overcome two management crises over its history. This experience has made us realize that our future existence depends on being a company that plays a vital role in society “by contributing to a comfortable life of consumers.” Undertaking business activities that take to heart the concept of “contributing to a comfortable life of consumers,” we have nurtured the Spirit of “OYAKUDACHI.” Guided by this spirit, we have begun leveraging our businesses to significantly expand the above two concepts.
Expand opportunitiesto experience the Spirit of “OYAKUDACHI”
Expand the number of peoplebenefiting from the Spirit of “OYAKUDACHI”
Provide productsuseful to consumers
Expand Our Two Concepts through Business Activities Guided by the Spirit of “OYAKUDACHI”
Expand Mandom’s Usefulness
Management InformationManagement Information Mandom’s Social Contribution Concept
Create preservative-free product incorporating alkanediol

mandom Annual Report 201331
• Various training program and systems to realize employee self-actualization
• Measures that ensure fair and transparent transactions
(3) Play a useful role for shareholders and investorsMandom works to disclose corporate information in a proactive, timely, proper and fair manner to enable a wide array of stakeholders to appropriately determine the Company’s corporate value. In addition, we strive to clarify and promote a common standard of awareness within Group of our Corporate IR Activities.
• Measures to accelerate information provision
(4) Play a useful role for employees Considering employees to be assets to the Company, or more specifically, Jinzai (“human treasure”), Mandom is a place where people can find self-fulfillment on the job. Creating work environments where all employees can maximize their individuality and abilities, we offer learning opportunities intended to help them grow together with our corporate value. We also strive to build a safe and healthy work environment at the Fukusaki Factory in accordance with our Occupational Safety and Health Policy.
Mandom IR Email Delivery Service
Undertake the Overseas Training System, a short-term study exchange program for employeesOffer overseas exchange training for Mandom Group employees
In the “GATSBY DANCE COMPETITION,” contestants are not only judged on their dance moves, but also on their overall attractiveness in such areas as hairstyle and fashion sense.
The “GATSBY Student Commercial Awards” supports the creative activities of young people through the creation of GATSBY brand-themed television commercials.
• Work to maintain work-life balance that enables employees to work effectively at each life stage
(5) Play a useful role for societyMandom contributes to society in the long term by being “a good corporate citizen” that dedicates itself to society’s development and undertaking CSR activities through its businesses.
• Pursue activities to achieve the dreams of Asian youth and encourage personal expression
• Develop Youth
Management Information Mandom’s Social Contribution Concept
Hold seminars based on Antimonopoly Act compliance programsMake available our internal reporting system, Helpline System, to business partners
Maintain support systems for such programs as the childcare/work, childcare leave and nursing leave systemsConduct career design training for employees in their 30s and 40s as well as second career seminars for employees in their 50s
• Supporting education, culture and sports
Ran “Science Experiment Classes” for elementary school students
Sponsor the Japan Sport Council Support the Japanese Society for Alternatives to Animal Experiments
Support green space projects in Osaka Prefecture Participate annually in Clean Osaka
• Engage in volunteer activities
Support wheelchair athlete Jun Hiromichi
and Fundamental Environmental Policy, which enable the construction of an environmental management system that will contribute toward initiatives for even more substantial environmental preservation activities.
• Develop low-environmental load products by promoting the 3Rs (reduce, reuse and recycle) in their designs
• Initiate measures to prevent global warming, including energy conservation and the reduction of CO2 and other greenhouse gas emissions
• Take actions to prevent pollution, including reducing atmospheric contaminants along with managing chemical substances and wastewater quality
• Undertake initiatives to create a recycling-oriented society that include reducing and reusing waste materials and effectively utilizing water resources
Developed paper pack and standing pouch refillable products
Focused on modal shifts to reduce CO2 emissions during transport
Implemented measures that included improving boiler usage efficiency and introducing electrical water heaters
Promoted resource recycling including the manufacture of pellets from plastic(6) Undertake environmental initiatives Recognizing that environmental protection is an integral aspect of its CSR, Mandom works to preserve the environment in all of its business activities. In addition, we have formulated and promote our Environmental Philosophy
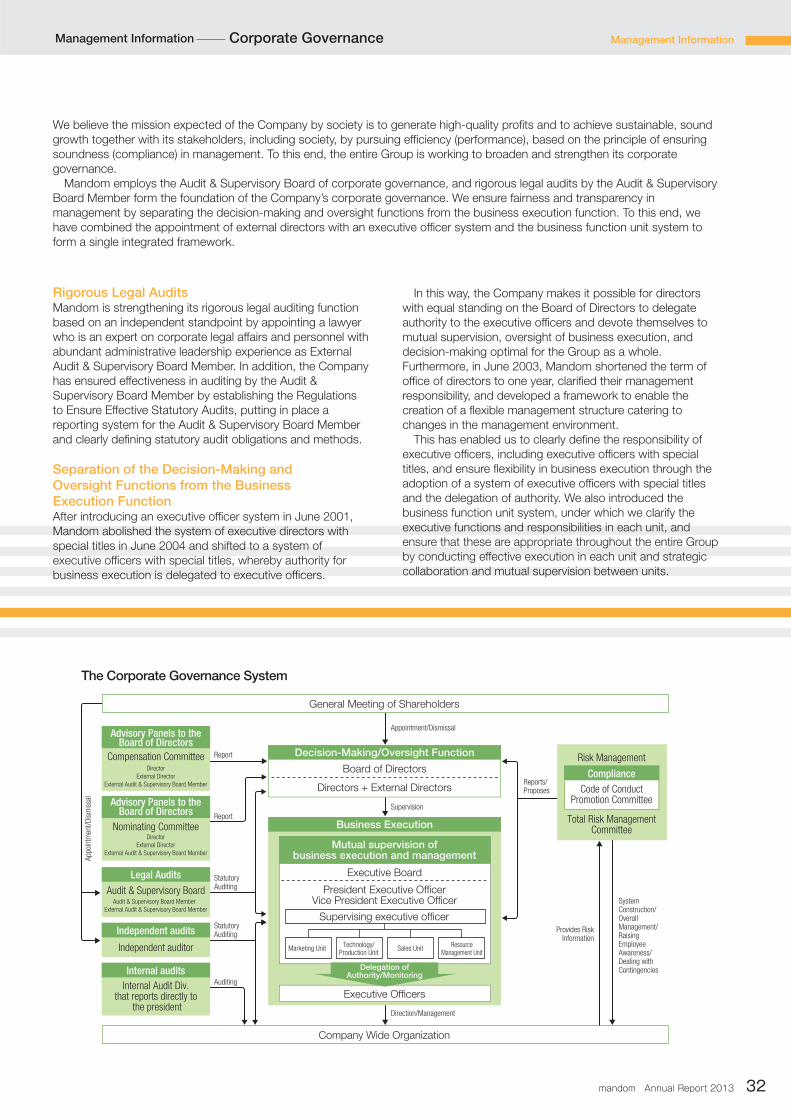
mandom Annual Report 2013 32
Rigorous Legal AuditsMandom is strengthening its rigorous legal auditing function based on an independent standpoint by appointing a lawyer who is an expert on corporate legal affairs and personnel with abundant administrative leadership experience as External Audit & Supervisory Board Member. In addition, the Company has ensured effectiveness in auditing by the Audit & Supervisory Board Member by establishing the Regulations to Ensure Effective Statutory Audits, putting in place a reporting system for the Audit & Supervisory Board Member and clearly defining statutory audit obligations and methods.
Separation of the Decision-Making andOversight Functions from the BusinessExecution FunctionAfter introducing an executive officer system in June 2001, Mandom abolished the system of executive directors with special titles in June 2004 and shifted to a system of executive officers with special titles, whereby authority for business execution is delegated to executive officers.
We believe the mission expected of the Company by society is to generate high-quality profits and to achieve sustainable, sound growth together with its stakeholders, including society, by pursuing efficiency (performance), based on the principle of ensuring soundness (compliance) in management. To this end, the entire Group is working to broaden and strengthen its corporate governance. Mandom employs the Audit & Supervisory Board of corporate governance, and rigorous legal audits by the Audit & Supervisory Board Member form the foundation of the Company’s corporate governance. We ensure fairness and transparency in management by separating the decision-making and oversight functions from the business execution function. To this end, we have combined the appointment of external directors with an executive officer system and the business function unit system to form a single integrated framework.
In this way, the Company makes it possible for directors with equal standing on the Board of Directors to delegate authority to the executive officers and devote themselves to mutual supervision, oversight of business execution, and decision-making optimal for the Group as a whole. Furthermore, in June 2003, Mandom shortened the term of office of directors to one year, clarified their management responsibility, and developed a framework to enable the creation of a flexible management structure catering to changes in the management environment. This has enabled us to clearly define the responsibility of executive officers, including executive officers with special titles, and ensure flexibility in business execution through the adoption of a system of executive officers with special titles and the delegation of authority. We also introduced the business function unit system, under which we clarify the executive functions and responsibilities in each unit, and ensure that these are appropriate throughout the entire Group by conducting effective execution in each unit and strategic collaboration and mutual supervision between units.
The Corporate Governance System
General Meeting of Shareholders
Company Wide Organization
Appointment/Dismissal
Supervision
Direction/Management
Report
Report
StatutoryAuditing
StatutoryAuditing
Auditing
Appo
intm
ent/
Dis
mis
sal
Marketing Unit Technology/Production Unit
Sales Unit ResourceManagement Unit
Reports/Proposes
Provides RiskInformation
SystemConstruction/OverallManagement/RaisingEmployeeAwareness/Dealing withContingencies
Board of Directors
Executive Board
Executive Officers
Vice President Executive OfficerPresident Executive Officer
Supervising executive officer
Directors + External Directors
Decision-Making/Oversight Function
Mutual supervision ofbusiness execution and management
Business Execution
Delegation ofAuthority/Monitoring
DirectorExternal Director
External Audit & Supervisory Board Member
Compensation Committee
Advisory Panels to theBoard of Directors
Advisory Panels to theBoard of Directors
DirectorExternal Director
External Audit & Supervisory Board Member
Nominating Committee
Audit & Supervisory Board Member External Audit & Supervisory Board Member
Audit & Supervisory Board
Legal Audits
Independent auditor
Independent audits
Internal Audit Div.that reports directly to
the president
Internal audits
Total Risk ManagementCommittee
Code of ConductPromotion Committee
Risk Management
Compliance
Management InformationManagement Information Corporate Governance

mandom Annual Report 201333
Appointment of External OfficersMandom recognized from an early stage that appointing external officers contributes to the reinforcement of corporate governance. Accordingly, we began appointing an External Audit & Supervisory Board Member in 1986, in advance of legislation providing for such appointments, and we have been appointing an External Director since 1995. Mandom currently has two external directors and two External Audit & Supervisory Board Members. Mandom’s external officers are independent from the Company’s management team and adequately fulfill their duties from the standpoint of protecting the interests of general shareholders
Establishment of the Compensation Committee and Nominating CommitteeMandom has established the Compensation Committee and the Nominating Committee, advisory panels to the Board of Directors that have external corporate officers comprising at least half their members. The Compensation Committee helps to ensure fairness and transparency in the executive compensation system by making recommendations to the Board of Directors from an objective shareholder perspective concerning the establishment of the executive compensation system, the formulation of executive performance evaluation standards, and the decision process relating to amounts of executive compensation.
The Nominating Committee helps to ensure fairness and transparency in the executive selection process by making recommendations to the Board of Directors from an objective shareholder perspective concerning director and Audit & Supervisory Board Member candidate decisions and the selection of representative directors and executive officers with titles.
Development and Operation of Internal Controls Related to Financial ReportingMandom considers ensuring the reliability and appropriateness of financial reports to be an important management duty, and has established a basic policy of developing fair internal control systems on a companywide basis under the leadership of the president. To implement this policy, we have established the Internal Audit Div. that reports directly to the president and put in place a structure to develop appropriate internal control systems, verify the systems’ operation, report appropriately to the Board of Directors and Audit & Supervisory Board and enable continuous monitoring of the systems by the Board of Directors and Audit & Supervisory Board.
Risk ManagementMandom is managing risks throughout the Company through the establishment of a total risk management system. This system is designed to avoid and minimize risks that impede the enhancement of corporate value and the achievement of sustainable, sound growth in tandem with stakeholders. To that end, based on the Total Risk Management Promotion Regulations, we have established the Total Risk Management Committee, which is chaired by the President Executive Officer. It performs supervision and management of the development and operation of our risk management systems. This committee regards the management of risks that have a severe impact on business continuity and risks that hinder the reliability and appropriateness of financial reporting as important issues. It is therefore putting priority on performing risk management related to this important issue by promoting the creation of manuals for the implementation of risk management.
ComplianceThe Mandom Group’s compliance is rooted in Our Philosophy (Contribute to a comfortable life for consumers) and our Management Philosophy (Be honest with the public). Above all, our view on compliance is not simply that we should obey laws; rather, we believe that to fulfill our philosophy of contributing to a comfortable life for
consumers, we must go beyond simply abiding by laws and instead take the initiative to create in-house rules that are stricter than society’s laws so that we can ensure that consumers derive safety and benefits. We established the Mandom Group Code of Conduct (in 1999; revised in 2002, 2007, and 2011) as a common global compliance program. This document is aimed at making compliance a key part of our management by having all officers and employees abide by laws as well as conducting themselves ethically using common sense. The Code of Conduct Promotion Committee was established to be in charge of promoting the Code of Conduct throughout the Mandom Group. This committee leads compliance education and awareness activities that include the building of a compliance-oriented corporate climate. In December 2002, we introduced the Helpline System (which was expanded to cover business partners in 2007) to give employees, or “whistleblowers,” a chance to inform us when they notice any laws being broken at work. This allows us to quickly discover non-compliance and subsequently prevent problems before they occur. Under this system, the anonymity of whistleblowers is protected and retaliatory measures against them are strictly forbidden.
Management Information Corporate Governance

mandom Annual Report 2013 34
Directors
Executive Officers
Audit & Supervisory Board Member
(As of June 21, 2013)
(Excluding Company Directors Holding Two Posts Concurrently)
Representative DirectorPresident Executive Officer
Motonobu Nishimura
Representative DirectorVice President Executive Officer
Masayoshi Momota
DirectorSenior Managing Executive Officer
Ryuichi Terabayashi
Managing Executive Officer
Tatsuyoshi Kitamura
Managing Executive Officer
Hironao Suzuki
Managing Executive Officer
Shinichiro Koshiba
Managing Executive Officer
Tatsuya Arichi
Executive Officer
Akira Tanaka
Executive Officer
Yasuaki Kameda
Executive Officer
Kazunori Koshikawa
Executive Officer
Norikazu Furubayashi
Executive Officer
Hiroshi Kanayama
DirectorManaging Executive Officer
Kazuyoshi Okada
Back row, from left: Kazuyoshi Okada, Ryuichi Terabayashi, Tsutomu Tsukada, Satoshi Nakajima
Front row, from left: Motonobu Nishimura, Masayoshi Momota
From left: Takaji Matsuo, Yoshiaki Saito, Masatoshi Tsuda, Yukihiro Tsujimura
External Director
Tsutomu Tsukada
External Director
Satoshi Nakajima
Audit & Supervisory Board Member
Yoshiaki Saito
Audit & Supervisory Board Member
Takaji Matsuo
External Audit & Supervisory Board Member
Masatoshi Tsuda
External Audit & Supervisory Board Member
Yukihiro Tsujimura
Management InformationManagement Information Executives, Audit & Supervisory Board Member

mandom Annual Report 201335
Operating Results (Millions of yen)
Net Sales 45,364 47,546 47,923 51,250 56,289
Overseas Ratio 21.3% 25.0% 27.0% 29.7% 32.6%
Operating Income 6,680 6,700 6,065 5,195 6,837
Overseas Ratio 21.3% 26.3% 27.4% 36.7% 38.0%
Ordinary Income 6,304 6,281 6,120 5,109 6,704
Net Income 3,253 3,211 3,099 2,488 3,499
Capital Investment 1,042 1,791 2,862 2,541 2,096
Depreciation 1,694 1,632 1,653 1,856 2,236
Research and Development 1,574 1,888 1,688 1,866 2,024
Financial Position (Millions of yen)
Total Assets 45,474 47,397 51,320 51,620 54,218
Liabilities 7,087 7,329 8,190 7,438 8,349
Net Assets 36,687 38,168 40,568 44,182 45,868
Cash Flows (Millions of yen)
Cash Flows from Operating Activities 4,396 6,061 4,911 3,411 7,614
Cash Flows from Investing Activities (1,810) (6,919) (2,444) (1,120) (5,040)
Cash Flows from Financing Activities (1,456) (1,345) (1,196) (2,554) (1,659)
Per Share Data (Yen)
Book Value per Share (BPS) 1,516.70 1,577.94 1,677.82 1,727.55 1,779.67
Earnings per Share (EPS) 130.83 128.73 124.36 104.28 147.13
Cash Dividends per Share 50.00 55.00 60.00 60.00 80.00
Financial Index
Operating Income Margin 14.7% 14.1% 12.7% 10.1% 12.1%
Shareholders’ Equity Ratio 80.7% 80.5% 79.1% 79.6% 78.1%
Return on Equity (ROE) 9.1% 8.6% 7.9% 6.1% 8.4%
Return on Assets (ROA) 14.1% 13.5% 12.4% 9.9% 12.7%
Payout Ratio 36.3% 42.7% 48.2% 57.5% 54.4%
20082007200620052004
MANDOM CORPORATION and its Consolidated Subsidiaries
Years ended March 31
Financial Data Consolidated Financial Indicators
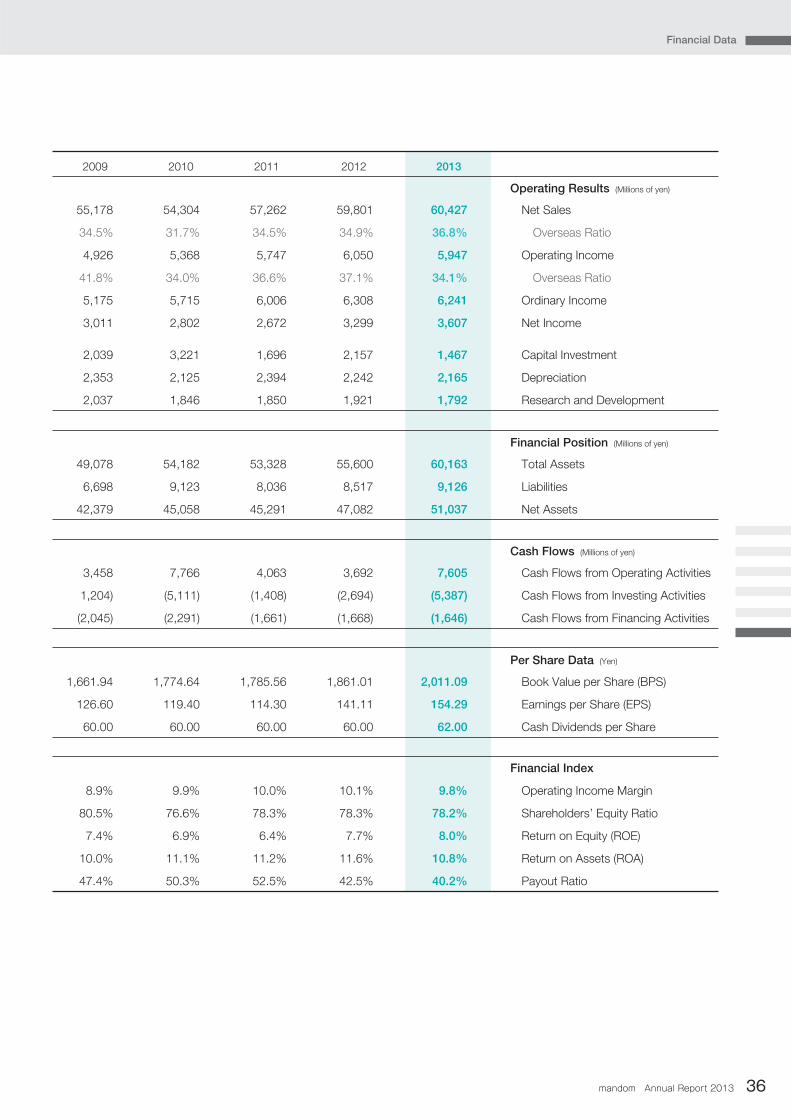
mandom Annual Report 2013 36
8.9% 9.9% 10.0% 10.1% 9.8%
80.5% 76.6% 78.3% 78.3% 78.2%
7.4% 6.9% 6.4% 7.7% 8.0%
10.0% 11.1% 11.2% 11.6% 10.8%
47.4% 50.3% 52.5% 42.5% 40.2%
55,178 54,304 57,262 59,801 60,427
34.5% 31.7% 34.5% 34.9% 36.8%
4,926 5,368 5,747 6,050 5,947
41.8% 34.0% 36.6% 37.1% 34.1%
5,175 5,715 6,006 6,308 6,241
3,011 2,802 2,672 3,299 3,607
2,039 3,221 1,696 2,157 1,467
2,353 2,125 2,394 2,242 2,165
2,037 1,846 1,850 1,921 1,792
49,078 54,182 53,328 55,600 60,163
6,698 9,123 8,036 8,517 9,126
42,379 45,058 45,291 47,082 51,037
3,458 7,766 4,063 3,692 7,605
1,204) (5,111) (1,408) (2,694) (5,387)
(2,045) (2,291) (1,661) (1,668) (1,646)
1,661.94 1,774.64 1,785.56 1,861.01 2,011.09
126.60 119.40 114.30 141.11 154.29
60.00 60.00 60.00 60.00 62.00
20132012201120102009
Financial Data
Financial Index
Operating Income Margin
Shareholders’ Equity Ratio
Return on Equity (ROE)
Return on Assets (ROA)
Payout Ratio
Operating Results (Millions of yen)
Net Sales
Overseas Ratio
Operating Income
Overseas Ratio
Ordinary Income
Net Income
Capital Investment
Depreciation
Research and Development
Financial Position (Millions of yen)
Total Assets
Liabilities
Net Assets
Cash Flows (Millions of yen)
Cash Flows from Operating Activities
Cash Flows from Investing Activities
Cash Flows from Financing Activities
Per Share Data (Yen)
Book Value per Share (BPS)
Earnings per Share (EPS)
Cash Dividends per Share
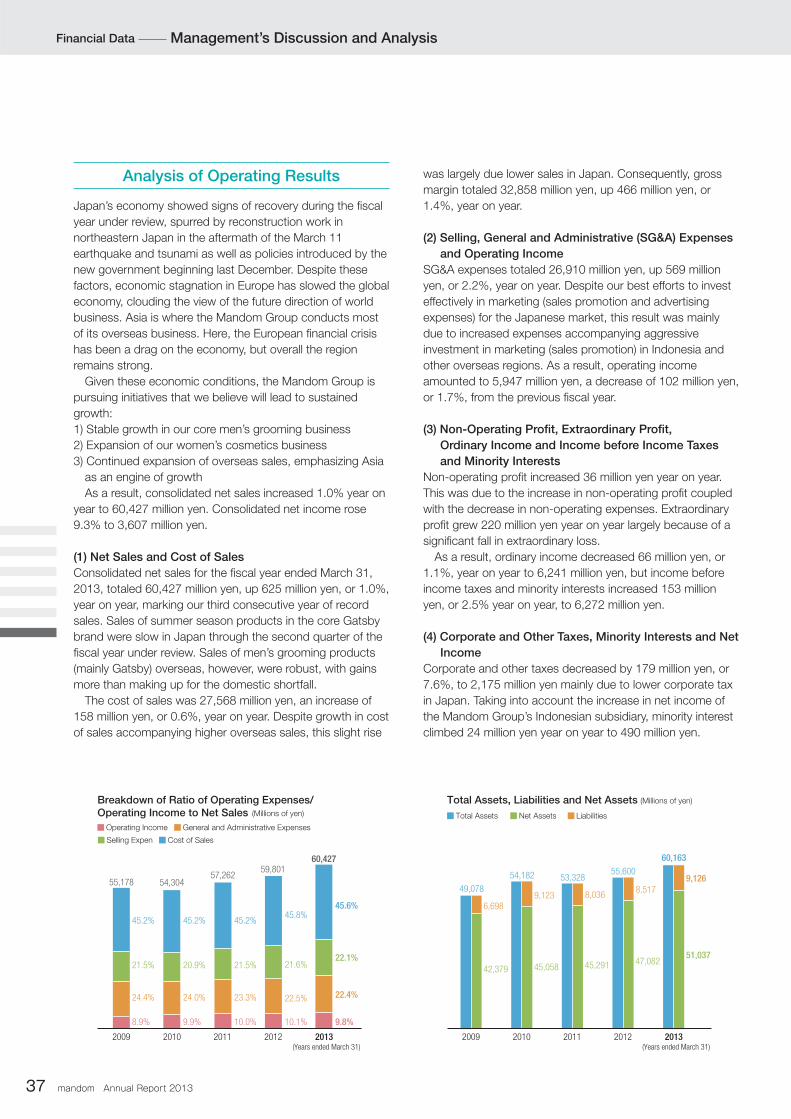
mandom Annual Report 201337
8.9%
24.4%
21.5%
45.2%
9.9%
24.0%
20.9%
45.2%
10.0%
23.3%
21.5%
45.2%
10.1%
22.5%
21.6%
45.8%
(Millions of yen)
9.8%
22.4%
22.1%
45.6%
55,178 54,30457,262
59,80160,427
2012201120102009 2013
Operating Income General and Administrative Expenses
Selling Expen Cost of Sales
(Years ended March 31)
Breakdown of Ratio of Operating Expenses/Operating Income to Net Sales
6,6989,123 8,036
8,5179,126
42,379 45,058 45,291 47,08251,037
49,078
54,182 53,32855,600
60,163
Total Assets Net Assets Liabilities
2012201120102009 2013(Years ended March 31)
(Millions of yen)Total Assets, Liabilities and Net Assets
Analysis of Operating Results
Japan’s economy showed signs of recovery during the fiscal
year under review, spurred by reconstruction work in
northeastern Japan in the aftermath of the March 11
earthquake and tsunami as well as policies introduced by the
new government beginning last December. Despite these
factors, economic stagnation in Europe has slowed the global
economy, clouding the view of the future direction of world
business. Asia is where the Mandom Group conducts most
of its overseas business. Here, the European financial crisis
has been a drag on the economy, but overall the region
remains strong.
Given these economic conditions, the Mandom Group is
pursuing initiatives that we believe will lead to sustained
growth:
1) Stable growth in our core men’s grooming business
2) Expansion of our women’s cosmetics business
3) Continued expansion of overseas sales, emphasizing Asia
as an engine of growth
As a result, consolidated net sales increased 1.0% year on
year to 60,427 million yen. Consolidated net income rose
9.3% to 3,607 million yen.
(1) Net Sales and Cost of Sales
Consolidated net sales for the fiscal year ended March 31,
2013, totaled 60,427 million yen, up 625 million yen, or 1.0%,
year on year, marking our third consecutive year of record
sales. Sales of summer season products in the core Gatsby
brand were slow in Japan through the second quarter of the
fiscal year under review. Sales of men’s grooming products
(mainly Gatsby) overseas, however, were robust, with gains
more than making up for the domestic shortfall.
The cost of sales was 27,568 million yen, an increase of
158 million yen, or 0.6%, year on year. Despite growth in cost
of sales accompanying higher overseas sales, this slight rise
was largely due lower sales in Japan. Consequently, gross
margin totaled 32,858 million yen, up 466 million yen, or
1.4%, year on year.
(2) Selling, General and Administrative (SG&A) Expenses
and Operating Income
SG&A expenses totaled 26,910 million yen, up 569 million
yen, or 2.2%, year on year. Despite our best efforts to invest
effectively in marketing (sales promotion and advertising
expenses) for the Japanese market, this result was mainly
due to increased expenses accompanying aggressive
investment in marketing (sales promotion) in Indonesia and
other overseas regions. As a result, operating income
amounted to 5,947 million yen, a decrease of 102 million yen,
or 1.7%, from the previous fiscal year.
(3) Non-Operating Profit, Extraordinary Profit,
Ordinary Income and Income before Income Taxes
and Minority Interests
Non-operating profit increased 36 million yen year on year.
This was due to the increase in non-operating profit coupled
with the decrease in non-operating expenses. Extraordinary
profit grew 220 million yen year on year largely because of a
significant fall in extraordinary loss.
As a result, ordinary income decreased 66 million yen, or
1.1%, year on year to 6,241 million yen, but income before
income taxes and minority interests increased 153 million
yen, or 2.5% year on year, to 6,272 million yen.
(4) Corporate and Other Taxes, Minority Interests and Net
Income
Corporate and other taxes decreased by 179 million yen, or
7.6%, to 2,175 million yen mainly due to lower corporate tax
in Japan. Taking into account the increase in net income of
the Mandom Group’s Indonesian subsidiary, minority interest
climbed 24 million yen year on year to 490 million yen.
Financial Data Management’s Discussion and Analysis
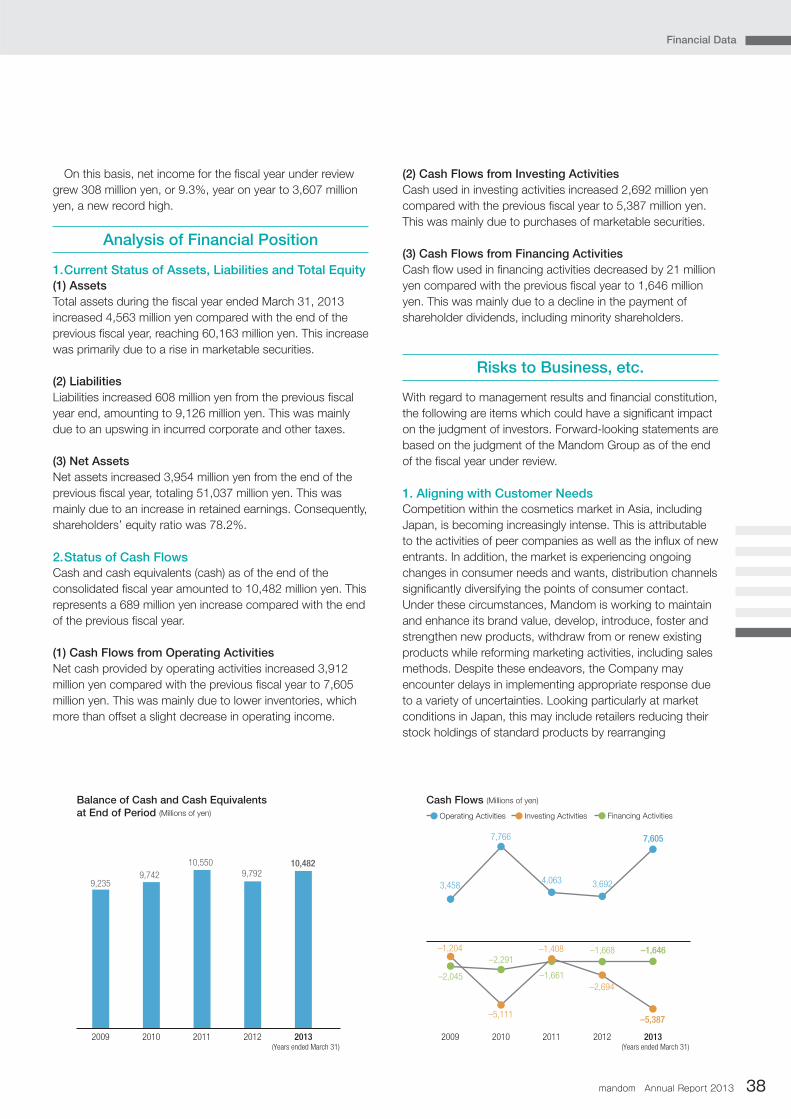
mandom Annual Report 2013 38
Financial Data
(Millions of yen)
9,235
10,4829,742
10,5509,792
2012201120102009 2013(Years ended March 31)
Balance of Cash and Cash Equivalentsat End of Period
(Millions of yen)
4,063
7,766
3,692
7,605
3,458
–1,661
–2,291–1,668 –1,646
–2,045
2012201120102009 2013
–5,111
–2,694
–1,204 –1,408
–5,387
Financing ActivitiesInvesting ActivitiesOperating Activities
(Years ended March 31)
Cash Flows
On this basis, net income for the fiscal year under review
grew 308 million yen, or 9.3%, year on year to 3,607 million
yen, a new record high.
Analysis of Financial Position
1. Current Status of Assets, Liabilities and Total Equity(1) Assets
Total assets during the fiscal year ended March 31, 2013
increased 4,563 million yen compared with the end of the
previous fiscal year, reaching 60,163 million yen. This increase
was primarily due to a rise in marketable securities.
(2) Liabilities
Liabilities increased 608 million yen from the previous fiscal
year end, amounting to 9,126 million yen. This was mainly
due to an upswing in incurred corporate and other taxes.
(3) Net Assets
Net assets increased 3,954 million yen from the end of the
previous fiscal year, totaling 51,037 million yen. This was
mainly due to an increase in retained earnings. Consequently,
shareholders’ equity ratio was 78.2%.
2. Status of Cash FlowsCash and cash equivalents (cash) as of the end of the
consolidated fiscal year amounted to 10,482 million yen. This
represents a 689 million yen increase compared with the end
of the previous fiscal year.
(1) Cash Flows from Operating Activities
Net cash provided by operating activities increased 3,912
million yen compared with the previous fiscal year to 7,605
million yen. This was mainly due to lower inventories, which
more than offset a slight decrease in operating income.
(2) Cash Flows from Investing Activities
Cash used in investing activities increased 2,692 million yen
compared with the previous fiscal year to 5,387 million yen.
This was mainly due to purchases of marketable securities.
(3) Cash Flows from Financing Activities
Cash flow used in financing activities decreased by 21 million
yen compared with the previous fiscal year to 1,646 million
yen. This was mainly due to a decline in the payment of
shareholder dividends, including minority shareholders.
Risks to Business, etc.
With regard to management results and financial constitution,
the following are items which could have a significant impact
on the judgment of investors. Forward-looking statements are
based on the judgment of the Mandom Group as of the end
of the fiscal year under review.
1. Aligning with Customer NeedsCompetition within the cosmetics market in Asia, including
Japan, is becoming increasingly intense. This is attributable
to the activities of peer companies as well as the influx of new
entrants. In addition, the market is experiencing ongoing
changes in consumer needs and wants, distribution channels
significantly diversifying the points of consumer contact.
Under these circumstances, Mandom is working to maintain
and enhance its brand value, develop, introduce, foster and
strengthen new products, withdraw from or renew existing
products while reforming marketing activities, including sales
methods. Despite these endeavors, the Company may
encounter delays in implementing appropriate response due
to a variety of uncertainties. Looking particularly at market
conditions in Japan, this may include retailers reducing their
stock holdings of standard products by rearranging
mandom Annual Report 201339
inventories and the return of excess inventory from agents.
Taking into consideration the aforementioned, the value of
merchandise thus returned may exert an impact of the
Group’s consolidated performance.
2. Extent of Mandom’s Reliance on Specific PartnersDuring the fiscal years ended March 31, 2012 and 2013,
there were two wholesalers on which the Mandom Group
relied for more than 10% of its consolidated net sales: Paltac
Corporation in Japan (30.2% in fiscal 2012, 30.2% in fiscal
2013) and PT Asia Paramita Indah in Indonesia (18.5% in
fiscal 2012, 19.0% in fiscal 2013). Mandom and PT Mandom
Indonesia Tbk have long-term, stable and continuous
business relationships with the above two companies. In the
future distribution of cosmetics and other products, there will
be a stronger market tendency to allow the dominance of a
few large-scale wholesalers. This may lead to a further
increase in dependence on specific distributors who are likely
to provide earnings accounting for relatively large portions of
the Group’s sales.
3. Legal RegulationsThe Mandom Group manufactures (imports in some cases)
and sells quasi-drugs and cosmetics in accordance with
various acts including the Pharmaceutical Affairs Law as well
as standards relating to quality and the environment. In the
event, however, of a major breach of statutory or regulatory
requirements, potential exists for difficulties to arise with
respect to production and by association impediments to the
ongoing viability of the subject business. Moreover,
restrictions may be placed on the Company’s business due
to revisions to existing legislation or the enactment of new
laws. In the event that Mandom incurs increased costs in its
efforts to comply with statutory and regulatory requirements,
its operating performance may be affected.
4. Foreign Exchange Rate FluctuationsThe Mandom Group is focused on business in Asia, where
solid market growth is expected in the future. Overseas net
sales accounted for 35.8% and 37.8% of consolidated net
sales in the fiscal years ended March 31, 2012 and March
31, 2013, respectively, and the weight of overseas business
is anticipated to increase in the future. Accordingly,
fluctuations in foreign exchange rates have the potential to
impact the Group’s performance, and prevent the operating
results of overseas Group companies from being accurately
represented in the Group’s business performance when
translated into yen.
5. Overseas Business DevelopmentThe Mandom Group continues to focus on expanding its
business in the Asia region, which is positioned as a growth
engine under its business strategy. In the event of a natural
disaster or significant breach of applicable laws, trading
policies or customs and taxation regulations in the area, or a
drop in consumer demand, the Group’s business activities
may be restricted, impacting its overall business
performance.
6. Factors Causing Fluctuation in ProfitabilityThe business environment surrounding the Group is marked
by intense competition and continuing mild deflation in Japan.
There are inherent factors that drive down profit margins,
such as falling sales prices and upward pressure on cost of
sales due to competition in a mature market. Moreover, since
the life cycle of Mandom’s key product lines is short, the
success or failure of new products is a major factor
underlying fluctuating results. Mandom always carries out
brand renewal before the end of the product life cycle, and
develops and markets new products based on consumers’
underlying preferences. The impact on operating results of
merchandise returned as a result of this approach is another
significant cause of fluctuations in profitability. In addition,
since the inventory on which the Group’s continued
operations depend is produced mainly based on estimates of
future demand and market trend projections, this method
may, depending on actual demand or unanticipated changes
in market trends, require disposal of stagnant inventory,
adversely affecting the Group’s performance in the form of a
loss due to inventory disposal, recorded under cost of sales.
It is the Mandom Group’s policy to follow internal rules and
dispose of such inventory immediately after confirming
impairment of market value, rather than postponing such
disposal.
7. Foreign Exchange and Resource Price FluctuationsIn overseas operations, the costs of procuring imported raw
materials at production sites in Indonesia and China may
have an effect on Group competitiveness due to the rise in
prices of materials refined from oil caused by foreign
exchange fluctuations or rising crude oil prices. The Group’s
overseas operations are conducted entirely in Asia, and some
regions are subject to event risk in the form of possible legal
or economic changes accompanying a sudden political
event. Such developments could have an impact on the
Group’s management and financial performance.
Issues to Be Addressed
The Mandom Group recognizes the following as issues that
need to be addressed.
1. Responses to Changes in the Men’s Cosmetics
Market in JapanMen’s cosmetics constitute a core part of Mandom’s
business operations: for the business year just ended, this
sector comprised well over 60% share in turnover.
Financial Data Management’s Discussion and Analysis
mandom Annual Report 2013 40
Financial Data
Competition in the business environment in the sector,
however, has increased in intensity. We are well aware that
the market environment is set to change permanently, with
companies from different business sectors and from overseas
eagerly entering into the market. Against this backdrop,
management pledges to engage in the exploration and
pursuit of customer needs and wants, product development
backed by technological excellence and the delivery of
marketing innovation to respond to diversification in customer
interface. In addition to bolstering the young men’s market,
we aim to expand the market for the middle age bracket.
2. Addressing Cost Rises Due to Crude Oil Price
IncreasesAnalysis of recent moves by oil producers leads us to expect
that crude oil prices will remain high. The impact on costs is
inevitable. To restrain this rise in costs, we will adopt such
measures as production optimization though the use of
overseas plants including production transfers of some
products, the promotion of local procurement of materials
and the widening of our network of overseas suppliers.
3. Strengthening Human Resources Development, the
Driver of Global BusinessA notable fact in the Group’s pursuit of business globalization
centering on Asia is that the ratio of overseas business
turnover in consolidated sales has already topped 30%. As
well as in order to strengthen our business in countries where
we already operate, if we are to start marketing in new areas,
the development of globally viable and valuable human
resources is a key task. We will engage in the development of
human resources who are well equipped with not only
communication skills but with understanding and
accommodation for different cultures, customs and religions.
4. Corporate Social Responsibility Activities,
Prioritizing Quality Assurance and Environmental
Measures With ever stronger demand to fulfill corporate social
responsibility (CSR), the Group has designated CSR activities
as a management issue. Thus, we will continue to reinforce
our efforts to achieve quality assurance and to address
environmental issues. We will create a CSR framework that
would enable the Group as a whole to play our proper part in
CSR activities as a good corporate citizen.
Management’s Awareness of Challenges and Policy Going Forward
Mandom’s management strives to formulate optimal
management policies in light of the current business
environment and any available data and information. Their
key concern is to sustain business development. Recognizing
that the engine for business expansion lies in overseas
business, management will strive to achieve further business
growth by developing the Southeast Asian market— which is
likely to show increasing demand for Mandom products— as
well as new markets in other Asian regions. Going forward,
the Group will position its women’s cosmetics business as a
new growth area to make progress in forging a path for
further expansion. The Group’s management is always aware
of the importance of promoting capital efficiency, and regards
the return of profits to shareholders in the form of dividends
as an important capital policy. The Group will repurchase its
own shares as required in order to return more profits to
shareholders, and curb increases in equity (retained earnings),
thereby improving capital efficiency.
1. Current Status of Management Strategies and
OutlookThe “sustained growth of Group operations” is the core
management strategy of the Group’s medium- to long-term
business strategy. To achieve phased expansion of the
Group’s business, we will deploy a well-planned input of
business resources to achieve sustainable growth in income
and profits. Thus, in the current Middle Range Plan:
1. sustained growth of the core business, men’s grooming;
2. speeding up of the women’s cosmetics business by
embarking on global marketing in Asia; and 3. continued
expansion of our overseas business, which is to continue to
serve as the growth engine in this new Middle Range Plan.
Furthermore, when implementing our strategic objectives, we
will be expeditious in exploiting external capital through M&A/
business alliances.
(1) Sustained growth of the core business, men’s
grooming
The core brand Gatsby will be further strengthened as our
global brand in Asia. In Japan, we will aim to expand market
share in hair styling as well as the face & body categories.
Better line-ups of products and marketing reinforcement will
be used to drive forward greater growth of Gatsby. Overseas,
hair styling will be our priority category. We will expand
market share by enhancing comparative advantage in the
market through our hair wax line-up. At the same time, we
will reinforce expansion efforts for the face & body category in
line with improved consumer recognition of the Gatsby brand,
with the aim of expanding its scale. As for the Lúcido brand,
we will make staged proposals of products that focus on the
concept of aging care.
(2) Speeding up of the women’s cosmetries and women’s
cosmetics businesses by embarking on global
marketing in Asia
In Japan, marketing reinforcement will be applied to the
Women’s skincare category so as to accelerate growth.
Meanwhile, in overseas markets, we will step up efforts in the

mandom Annual Report 201341
cosmetics business by implementing product launch and
merchandising tailored to the local market. To this end we will
strengthen the marketing of base make-up products in
Indonesia and the “in-depth approach” introduced in the
skincare product sector in China during the previous financial
year.
(3) Ongoing expansion of our overseas business
In our effort to achieve the expansion of our overseas
business, Indonesia and China will be our primary targets.
These are the most important areas for our initiatives among
countries where we have a presence. We will develop the
market more deeply through a heavy input of resources
including marketing investment in men’s styling, alongside
stronger nurturing of women’s skincare products. We have
identified Southeast Asia and India as areas of high
importance for our initiatives, and in the former, have
established and expanded our distribution network through
which we will steadily implement new market expansion. In
the Indian market where growth is promising, we will leverage
the market through our overseas subsidiary company. We
established this company in March 2012 to create the
foundation of our cosmetics business and then to expand its
scale.
2. Financial PoliciesThe Mandom Group’s financial policies entail maintaining a
sound balance sheet and the liquid assets necessary to
pursue its business. Capital is used primarily to fund
operations and for capital investment, and is derived from
internal reserves. If any domestic subsidiary lacks necessary
funds, the shortfall is covered by a loan from the parent
company, while demand for short-term funds by overseas
subsidiaries is met by a local-currency-based short-term loan
acquired by Mandom’s main representative office in the
region. The Company regards any additional funds in hand as
cash reserves for business investment, and places the utmost
priority on ensuring their liquidity and security. We in the
Mandom Group believe that the Company can procure the
funds necessary to ensure dramatic growth based on its
sound finances and capacity to generate cash flows through
operating activities, even if the need should arise for
investment funds exceeding the liquid funds currently
available.
3. Earnings Distribution PolicyReturning profit to shareholders through dividend payments
is a core management policy within the constraints of
earmarking adequate internal reserves for operational
development and new business development for the medium
to long term and for addressing corporate risks. Thus, under
this strong commitment to dividend policy, the Group will
endeavor to deliver shareholder return through dividend
payout. The numerical target set for the fiscal year ended
March 31, 2013 and the fiscal year ending March 31, 2014 is
a dividend payout ratio of not less than 40% of net income
on a consolidated basis.
Internal reserves will be allocated to strategic investments
covering investment into facilities for expanding existing
business operations and to strategic investment for R&D
investment and other corporate value enhancement. The
reserves also serve as a safety net to help us deal with
diverse corporate risks arising out of the difficult business
conditions we are subject to. As a means of delivering a
return to shareholder and of improving capital efficiency, the
purchase of treasury stock will be considered as an option.
Financial Data Management’s Discussion and Analysis
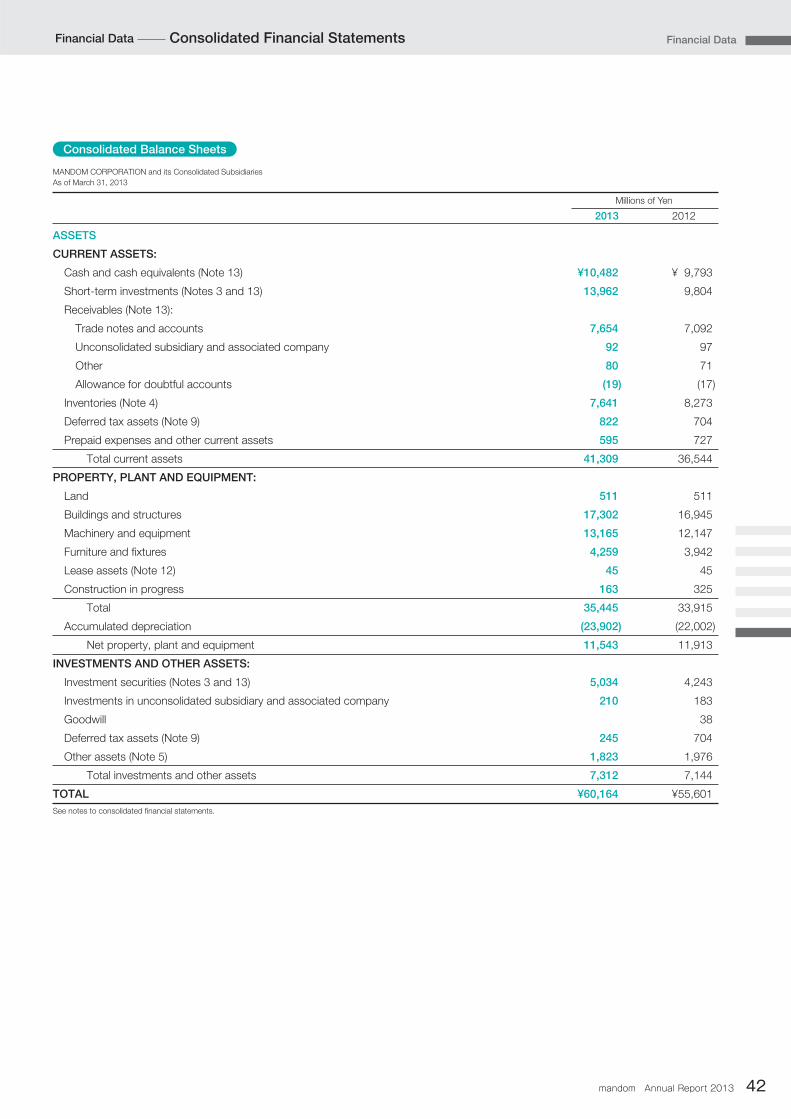
mandom Annual Report 2013 42
Financial Data
ASSETS
CURRENT ASSETS:
Cash and cash equivalents (Note 13) ¥10,482 ¥ 9,793
Short-term investments (Notes 3 and 13) 13,962 9,804
Receivables (Note 13):
Trade notes and accounts 7,654 7,092
Unconsolidated subsidiary and associated company 92 97
Other 80 71
Allowance for doubtful accounts (19) (17)
Inventories (Note 4) 7,641 8,273
Deferred tax assets (Note 9) 822 704
Prepaid expenses and other current assets 595 727
Total current assets 41,309 36,544
PROPERTY, PLANT AND EQUIPMENT:
Land 511 511
Buildings and structures 17,302 16,945
Machinery and equipment 13,165 12,147
Furniture and fixtures 4,259 3,942
Lease assets (Note 12) 45 45
Construction in progress 163 325
Total 35,445 33,915
Accumulated depreciation (23,902) (22,002)
Net property, plant and equipment 11,543 11,913
INVESTMENTS AND OTHER ASSETS:
Investment securities (Notes 3 and 13) 5,034 4,243
Investments in unconsolidated subsidiary and associated company 210 183
Goodwill 38
Deferred tax assets (Note 9) 245 704
Other assets (Note 5) 1,823 1,976
Total investments and other assets 7,312 7,144
TOTAL ¥60,164 ¥55,601
2013 2012
Millions of Yen
See notes to consolidated financial statements.
Financial Data Consolidated Financial Statements
MANDOM CORPORATION and its Consolidated Subsidiaries
As of March 31, 2013
Consolidated Balance Sheets
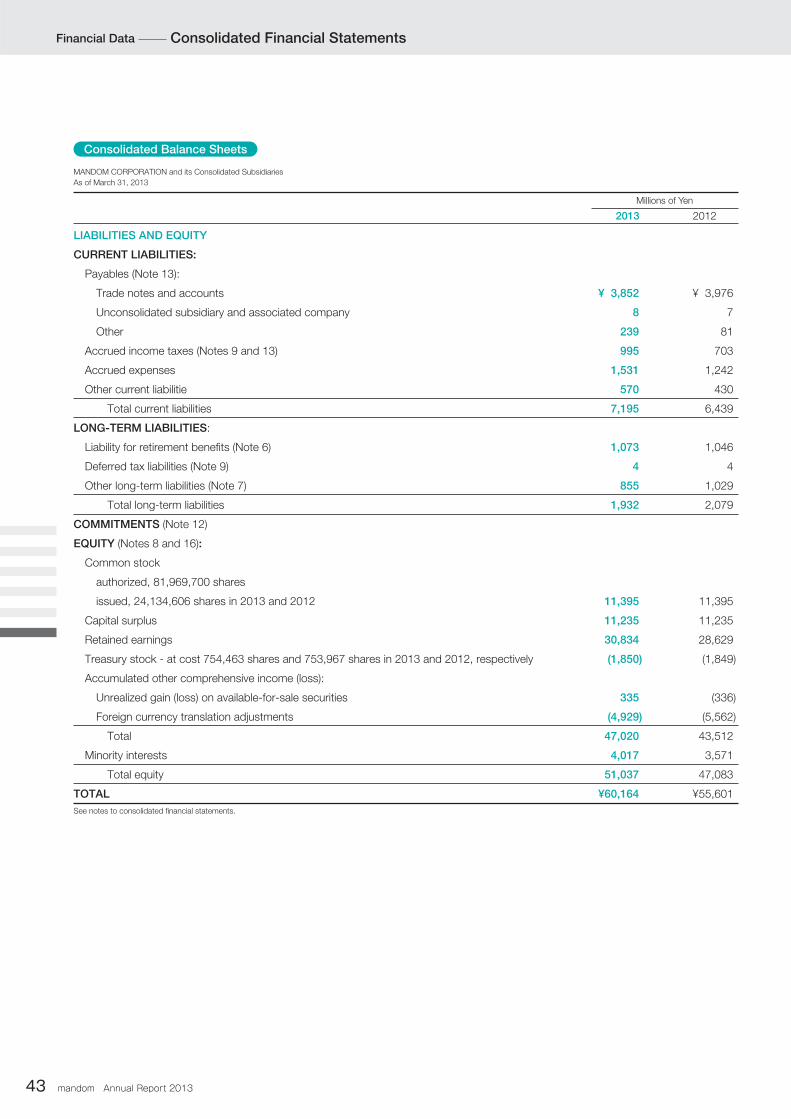
mandom Annual Report 201343
MANDOM CORPORATION and its Consolidated Subsidiaries
As of March 31, 2013
LIABILITIES AND EQUITY
CURRENT LIABILITIES:
Payables (Note 13):
Trade notes and accounts ¥ 3,852 ¥ 3,976
Unconsolidated subsidiary and associated company 8 7
Other 239 81
Accrued income taxes (Notes 9 and 13) 995 703
Accrued expenses 1,531 1,242
Other current liabilitie 570 430
Total current liabilities 7,195 6,439
LONG-TERM LIABILITIES:
Liability for retirement benefits (Note 6) 1,073 1,046
Deferred tax liabilities (Note 9) 4 4
Other long-term liabilities (Note 7) 855 1,029
Total long-term liabilities 1,932 2,079
COMMITMENTS (Note 12)
EQUITY (Notes 8 and 16):
Common stock
authorized, 81,969,700 shares
issued, 24,134,606 shares in 2013 and 2012 11,395 11,395
Capital surplus 11,235 11,235
Retained earnings 30,834 28,629
Treasury stock - at cost 754,463 shares and 753,967 shares in 2013 and 2012, respectively (1,850) (1,849)
Accumulated other comprehensive income (loss):
Unrealized gain (loss) on available-for-sale securities 335 (336)
Foreign currency translation adjustments (4,929) (5,562)
Total 47,020 43,512
Minority interests 4,017 3,571
Total equity 51,037 47,083
TOTAL ¥60,164 ¥55,601
2013 2012
Millions of Yen
See notes to consolidated financial statements.
Financial Data Consolidated Financial Statements
Consolidated Balance Sheets

mandom Annual Report 2013 44
Financial Data
MANDOM CORPORATION and its Consolidated Subsidiaries
For the Year Ended March 31, 2013
MANDOM CORPORATION and its Consolidated Subsidiaries
For the Year Ended March 31, 2013
NET SALES (Note 15) ¥60,427 ¥59,802
COST OF SALES (Note 15) 27,568 27,410
Gross profit 32,859 32,392
SELLING, GENERAL AND ADMINISTRATIVE EXPENSES (Notes 10, 11 and 15) 26,911 26,342
Operating income 5,948 6,050
OTHER INCOME (EXPENSES):
Interest and dividend income (Note 15) 237 218
Foreign exchange loss (26) (56)
Loss on disposal of property, plant and equipment (18) (72)
Loss on sales of investment securities (3) (88)
Other - net (Note 15) 135 67
Other income - net 325 69
INCOME BEFORE INCOME TAXES AND MINORITY INTERESTS 6,273 6,119
INCOME TAXES (Note 9):
Current 2,208 2,155
Deferred (33) 200
Total income taxes 2,175 2,355
NET INCOME BEFORE MINORITY INTERESTS 4,098 3,764
MINORITY INTERESTS IN NET INCOME OF CONSOLIDATED SUBSIDIARIES 491 465
NET INCOME ¥ 3,607 ¥ 3,299
NET INCOME BEFORE MINORITY INTERESTS ¥4,098 ¥3,764
OTHER COMPREHENSIVE INCOME (LOSS) (Note 14):
Unrealized gain on available-for-sale securities 673 223
Foreign currency translation adjustments 794 (532)
Share of other comprehensive income (loss) in associate 28 (7)
Total other comprehensive income (loss) 1,495 (316)
COMPREHENSIVE INCOME (Note 14) ¥5,593 ¥3,448
TOTAL COMPREHENSIVE INCOME ATTRIBUTABLE TO (Note 14):
Owners of the parent ¥4,912 ¥3,167
Minority interests 681 281
PER SHARE OF COMMON STOCK (Note 2.m):
Basic net income ¥154.29 ¥141.11
Cash dividends applicable to the year 60.00 60.00
2013 2012
Millions of Yen
2013 2012
Millions of Yen
2013 2012
Yen
See notes to consolidated financial statements.
Diluted net income per share is not presented because no dilutive securities exist.
See notes to consolidated financial statements.
Consolidated Statement of Income
Consolidated Statement of Comprehensive Income
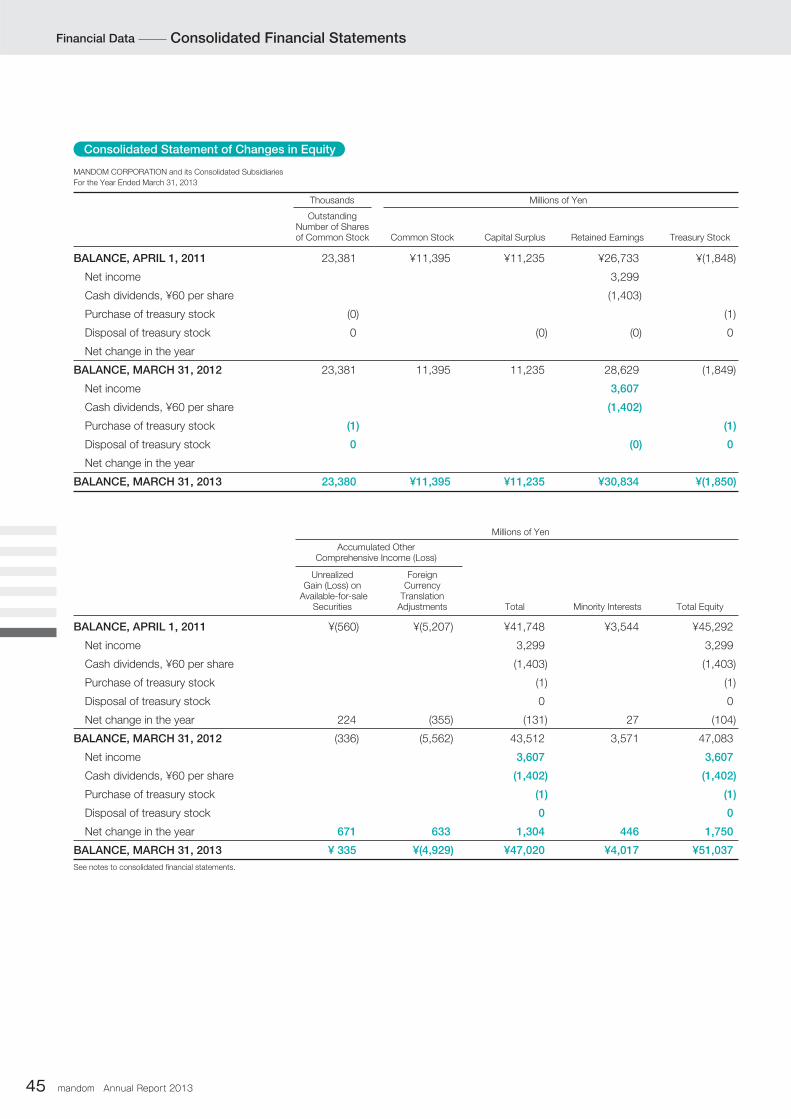
mandom Annual Report 201345
MANDOM CORPORATION and its Consolidated Subsidiaries
For the Year Ended March 31, 2013
BALANCE, APRIL 1, 2011 23,381 ¥11,395 ¥11,235 ¥26,733 ¥(1,848)
Net income 3,299
Cash dividends, ¥60 per share (1,403)
Purchase of treasury stock (0) (1)
Disposal of treasury stock 0 (0) (0) 0
Net change in the year
BALANCE, MARCH 31, 2012 23,381 11,395 11,235 28,629 (1,849)
Net income 3,607
Cash dividends, ¥60 per share (1,402)
Purchase of treasury stock (1) (1)
Disposal of treasury stock 0 (0) 0
Net change in the year
BALANCE, MARCH 31, 2013 23,380 ¥11,395 ¥11,235 ¥30,834 ¥(1,850)
BALANCE, APRIL 1, 2011 ¥(560) ¥(5,207) ¥41,748 ¥3,544 ¥45,292
Net income 3,299 3,299
Cash dividends, ¥60 per share (1,403) (1,403)
Purchase of treasury stock (1) (1)
Disposal of treasury stock 0 0
Net change in the year 224 (355) (131) 27 (104)
BALANCE, MARCH 31, 2012 (336) (5,562) 43,512 3,571 47,083
Net income 3,607 3,607
Cash dividends, ¥60 per share (1,402) (1,402)
Purchase of treasury stock (1) (1)
Disposal of treasury stock 0 0
Net change in the year 671 633 1,304 446 1,750
BALANCE, MARCH 31, 2013 ¥ 335 ¥(4,929) ¥47,020 ¥4,017 ¥51,037
Millions of YenThousands
Outstanding Number of Shares of Common Stock Common Stock Capital Surplus Retained Earnings Treasury Stock
Millions of Yen
Accumulated OtherComprehensive Income (Loss)
UnrealizedGain (Loss) on
Available-for-sale Securities
ForeignCurrency
TranslationAdjustments Total Minority Interests Total Equity
See notes to consolidated financial statements.
Financial Data Consolidated Financial Statements
Consolidated Statement of Changes in Equity
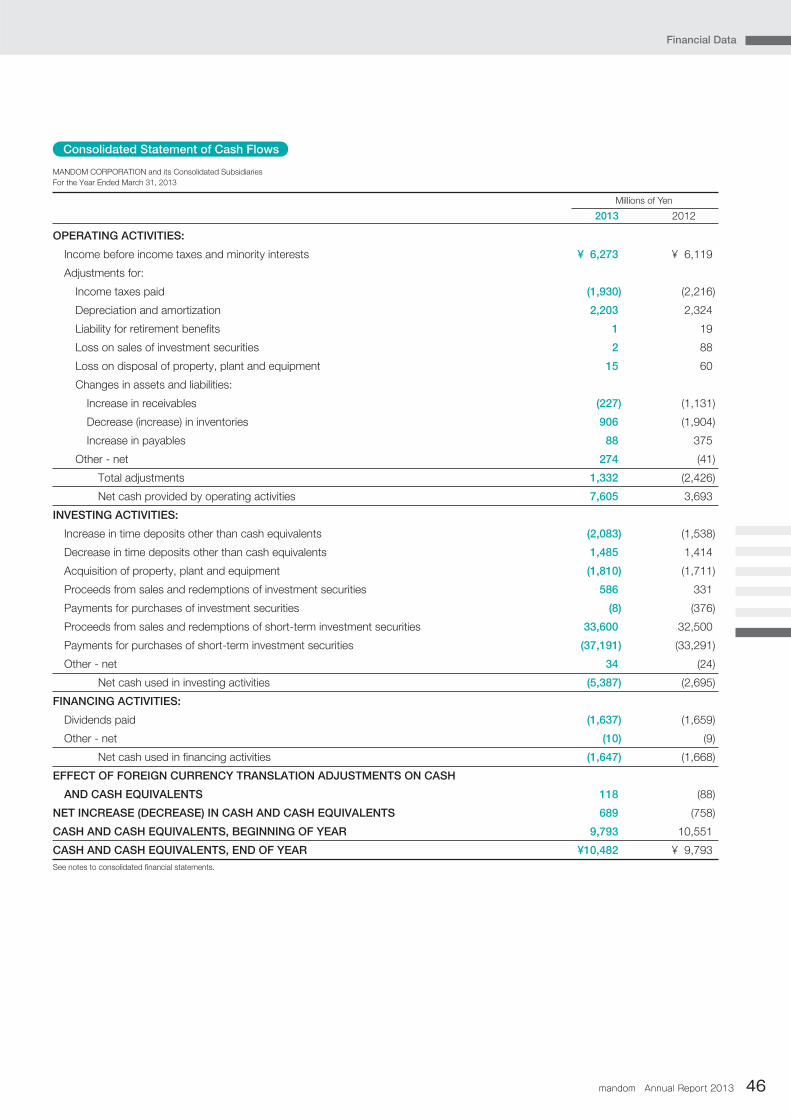
mandom Annual Report 2013 46
Financial Data
MANDOM CORPORATION and its Consolidated Subsidiaries
For the Year Ended March 31, 2013
OPERATING ACTIVITIES:
Income before income taxes and minority interests ¥ 6,273 ¥ 6,119
Adjustments for:
Income taxes paid (1,930) (2,216)
Depreciation and amortization 2,203 2,324
Liability for retirement benefits 1 19
Loss on sales of investment securities 2 88
Loss on disposal of property, plant and equipment 15 60
Changes in assets and liabilities:
Increase in receivables (227) (1,131)
Decrease (increase) in inventories 906 (1,904)
Increase in payables 88 375
Other - net 274 (41)
Total adjustments 1,332 (2,426)
Net cash provided by operating activities 7,605 3,693
INVESTING ACTIVITIES:
Increase in time deposits other than cash equivalents (2,083) (1,538)
Decrease in time deposits other than cash equivalents 1,485 1,414
Acquisition of property, plant and equipment (1,810) (1,711)
Proceeds from sales and redemptions of investment securities 586 331
Payments for purchases of investment securities (8) (376)
Proceeds from sales and redemptions of short-term investment securities 33,600 32,500
Payments for purchases of short-term investment securities (37,191) (33,291)
Other - net 34 (24)
Net cash used in investing activities (5,387) (2,695)
FINANCING ACTIVITIES:
Dividends paid (1,637) (1,659)
Other - net (10) (9)
Net cash used in financing activities (1,647) (1,668)
EFFECT OF FOREIGN CURRENCY TRANSLATION ADJUSTMENTS ON CASH
AND CASH EQUIVALENTS 118 (88)
NET INCREASE (DECREASE) IN CASH AND CASH EQUIVALENTS 689 (758)
CASH AND CASH EQUIVALENTS, BEGINNING OF YEAR 9,793 10,551
CASH AND CASH EQUIVALENTS, END OF YEAR ¥10,482 ¥ 9,793
2013 2012
Millions of Yen
See notes to consolidated financial statements.
Consolidated Statement of Cash Flows

mandom Annual Report 201347
1. BASIS OF PRESENTATION OF CONSOLIDATED FINANCIAL STATEMENTS
The accompanying consolidated financial statements have been
prepared in accordance with the provisions set forth in the Japanese
Financial Instruments and Exchange Act and its related accounting
regulations and in accordance with accounting principles generally
accepted in Japan (“Japanese GAAP”), which are different in certain
respects as to the application and disclosure requirements from
International Financial Reporting Standards.
In preparing these consolidated financial statements, certain
reclassifications and rearrangements have been made to the
consolidated financial statements issued domestically in order to
present them in a form which is more familiar to readers outside Japan.
In addition, certain reclassifications have been made in the 2012
consolidated financial statements to conform to the classifications used
in 2013.
The consolidated financial statements are stated in Japanese yen,
the currency of the country in which MANDOM CORPORATION (the
“Company”) is incorporated and operates.
the related unrealized gains and losses included in earnings;
2) held-to-maturity debt securities, which are expected to be held to
maturity with the positive intent and ability to hold to maturity, are
reported at amortized cost; and 3) available-for-sale securities, which
are not classified as either of the aforementioned securities, are
reported at fair value, with unrealized gains and losses, net of
applicable taxes, reported in a separate component of equity. The
Group’s securities (included in “short-term investments” and
“investment securities”) are all classified as available for sale.
Nonmarketable available-for-sale securities are stated at cost
determined by the moving-average method. For other-than-
temporary declines in fair value, investment securities are reduced to
net realizable value by a charge to income.
d. Inventories - Inventories are stated at the lower of cost, determined
by the average method, or net selling value.
e. Property, Plant and Equipment - Property, plant and equipment are
stated at cost. Depreciation of property, plant and equipment of the
Company and its consolidated domestic subsidiary is computed
substantially by the declining-balance method, while the straight-line
method is applied to buildings of the Company acquired after April 1,
1998, and lease assets of the Company and its consolidated
domestic subsidiary. The straight-line method is principally applied to
the property, plant and equipment of consolidated foreign
subsidiaries. The range of useful lives is principally from 15 to 50
years for buildings and structures and from 4 to 12 years for
machinery and equipment. The useful lives for lease assets are the
terms of the respective leases.
f. Long-Lived Assets - The Group reviews its long-lived assets for
impairment whenever events or changes in circumstance indicate the
carrying amount of an asset or asset group may not be recoverable.
An impairment loss would be recognized if the carrying amount of an
asset or asset group exceeds the sum of the undiscounted future
cash flows expected to result from the continued use and eventual
disposition of the asset or asset group. The impairment loss would
be measured as the amount by which the carrying amount of the
asset exceeds its recoverable amount, which is the higher of the
discounted cash flows from the continued use and eventual
disposition of the asset or the net selling price at disposition.
g. Retirement Benefits and Pension Plans - The Company and
certain consolidated subsidiaries have funded defined benefit pension
plans, defined contribution pension plans, and advance payment
systems which cover substantially all of their employees. The Group
accounts for the liability for the pension plans based on the projected
benefit obligations and plan assets at the balance sheet date.
h. Research and Development Costs - Research and development
costs are charged to income as incurred.
i. Leases - In March 2007, the Accounting Standards Board of Japan
(ASBJ) issued ASBJ Statement No. 13, “Accounting Standard for
Lease Transactions,” which revised the previous accounting standard
for lease transactions. The revised accounting standard for lease
2. SUMMARY OF SIGNIFICANT ACCOUNTING POLICIES
a. Consolidation - The consolidated financial statements as of March
31, 2013, include the accounts of the Company and its eleven (eleven
in 2012) significant subsidiaries (collectively, the “Group”).
Under the control or influence concept, those companies in which
the Company, directly or indirectly, is able to exercise control over
operations are consolidated and those companies over which the
Group has the ability to exercise significant influence are accounted
for under the equity method.
Investment in one (one in 2012) associated company is accounted
for under the equity method.
Investment in the remaining one unconsolidated subsidiary (two in
2012) is stated at cost. If the equity method of accounting had been
applied to the investment in this company, the effect on the
accompanying consolidated financial statements would not be
material.
The excess of the cost of acquisition over the fair value of the net
assets of an acquired subsidiary at the date of acquisition is being
amortized over a period of five years.
All significant intercompany balances and transactions have been
eliminated in consolidation. All material unrealized profit included in
assets resulting from transactions within the Group is also eliminated
in consolidation.
b. Cash Equivalents - Cash equivalents are short-term investments
that are readily convertible into cash and that are exposed to
insignificant risk of changes in value. Cash equivalents include time
deposits and bond funds, all of which mature or become due within
three months of the date of acquisition.
c. Short-term Investments and Investment Securities - Securities
included in short-term investments and investment securities are
classified and accounted for, depending on management’s intent, as
follows: 1) trading securities, which are held for the purpose of
earning capital gains in the near term, are reported at fair value, with
Financial Data Notes to Consolidated Financial Statements MANDOM CORPORATION and its Consolidated Subsidiaries
As of and for the Year Ended March 31, 2013
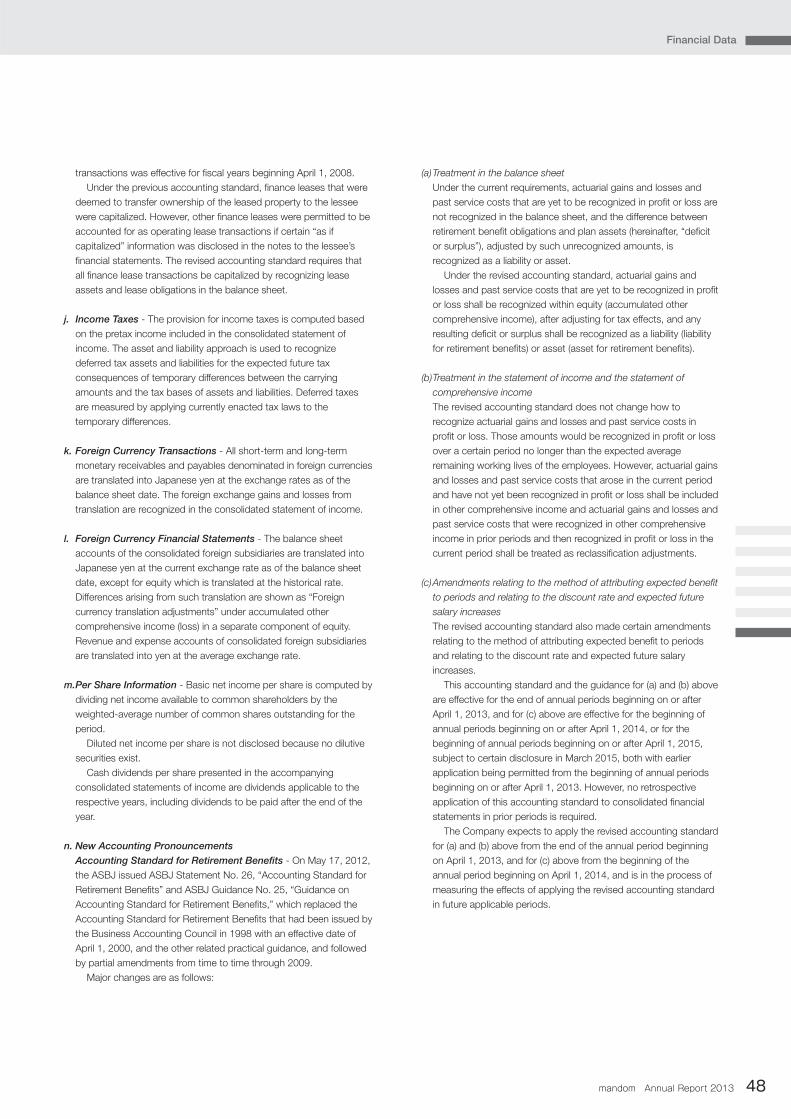
mandom Annual Report 2013 48
Financial Data
transactions was effective for fiscal years beginning April 1, 2008.
Under the previous accounting standard, finance leases that were
deemed to transfer ownership of the leased property to the lessee
were capitalized. However, other finance leases were permitted to be
accounted for as operating lease transactions if certain “as if
capitalized” information was disclosed in the notes to the lessee’s
financial statements. The revised accounting standard requires that
all finance lease transactions be capitalized by recognizing lease
assets and lease obligations in the balance sheet.
j. Income Taxes - The provision for income taxes is computed based
on the pretax income included in the consolidated statement of
income. The asset and liability approach is used to recognize
deferred tax assets and liabilities for the expected future tax
consequences of temporary differences between the carrying
amounts and the tax bases of assets and liabilities. Deferred taxes
are measured by applying currently enacted tax laws to the
temporary differences.
k. Foreign Currency Transactions - All short-term and long-term
monetary receivables and payables denominated in foreign currencies
are translated into Japanese yen at the exchange rates as of the
balance sheet date. The foreign exchange gains and losses from
translation are recognized in the consolidated statement of income.
l. Foreign Currency Financial Statements - The balance sheet
accounts of the consolidated foreign subsidiaries are translated into
Japanese yen at the current exchange rate as of the balance sheet
date, except for equity which is translated at the historical rate.
Differences arising from such translation are shown as “Foreign
currency translation adjustments” under accumulated other
comprehensive income (loss) in a separate component of equity.
Revenue and expense accounts of consolidated foreign subsidiaries
are translated into yen at the average exchange rate.
m. Per Share Information - Basic net income per share is computed by
dividing net income available to common shareholders by the
weighted-average number of common shares outstanding for the
period.
Diluted net income per share is not disclosed because no dilutive
securities exist.
Cash dividends per share presented in the accompanying
consolidated statements of income are dividends applicable to the
respective years, including dividends to be paid after the end of the
year.
n. New Accounting Pronouncements
Accounting Standard for Retirement Benefits - On May 17, 2012,
the ASBJ issued ASBJ Statement No. 26, “Accounting Standard for
Retirement Benefits” and ASBJ Guidance No. 25, “Guidance on
Accounting Standard for Retirement Benefits,” which replaced the
Accounting Standard for Retirement Benefits that had been issued by
the Business Accounting Council in 1998 with an effective date of
April 1, 2000, and the other related practical guidance, and followed
by partial amendments from time to time through 2009.
Major changes are as follows:
(a) Treatment in the balance sheet
Under the current requirements, actuarial gains and losses and
past service costs that are yet to be recognized in profit or loss are
not recognized in the balance sheet, and the difference between
retirement benefit obligations and plan assets (hereinafter, “deficit
or surplus”), adjusted by such unrecognized amounts, is
recognized as a liability or asset.
Under the revised accounting standard, actuarial gains and
losses and past service costs that are yet to be recognized in profit
or loss shall be recognized within equity (accumulated other
comprehensive income), after adjusting for tax effects, and any
resulting deficit or surplus shall be recognized as a liability (liability
for retirement benefits) or asset (asset for retirement benefits).
(b) Treatment in the statement of income and the statement of
comprehensive income
The revised accounting standard does not change how to
recognize actuarial gains and losses and past service costs in
profit or loss. Those amounts would be recognized in profit or loss
over a certain period no longer than the expected average
remaining working lives of the employees. However, actuarial gains
and losses and past service costs that arose in the current period
and have not yet been recognized in profit or loss shall be included
in other comprehensive income and actuarial gains and losses and
past service costs that were recognized in other comprehensive
income in prior periods and then recognized in profit or loss in the
current period shall be treated as reclassification adjustments.
(c) Amendments relating to the method of attributing expected benefit
to periods and relating to the discount rate and expected future
salary increases
The revised accounting standard also made certain amendments
relating to the method of attributing expected benefit to periods
and relating to the discount rate and expected future salary
increases.
This accounting standard and the guidance for (a) and (b) above
are effective for the end of annual periods beginning on or after
April 1, 2013, and for (c) above are effective for the beginning of
annual periods beginning on or after April 1, 2014, or for the
beginning of annual periods beginning on or after April 1, 2015,
subject to certain disclosure in March 2015, both with earlier
application being permitted from the beginning of annual periods
beginning on or after April 1, 2013. However, no retrospective
application of this accounting standard to consolidated financial
statements in prior periods is required.
The Company expects to apply the revised accounting standard
for (a) and (b) above from the end of the annual period beginning
on April 1, 2013, and for (c) above from the beginning of the
annual period beginning on April 1, 2014, and is in the process of
measuring the effects of applying the revised accounting standard
in future applicable periods.
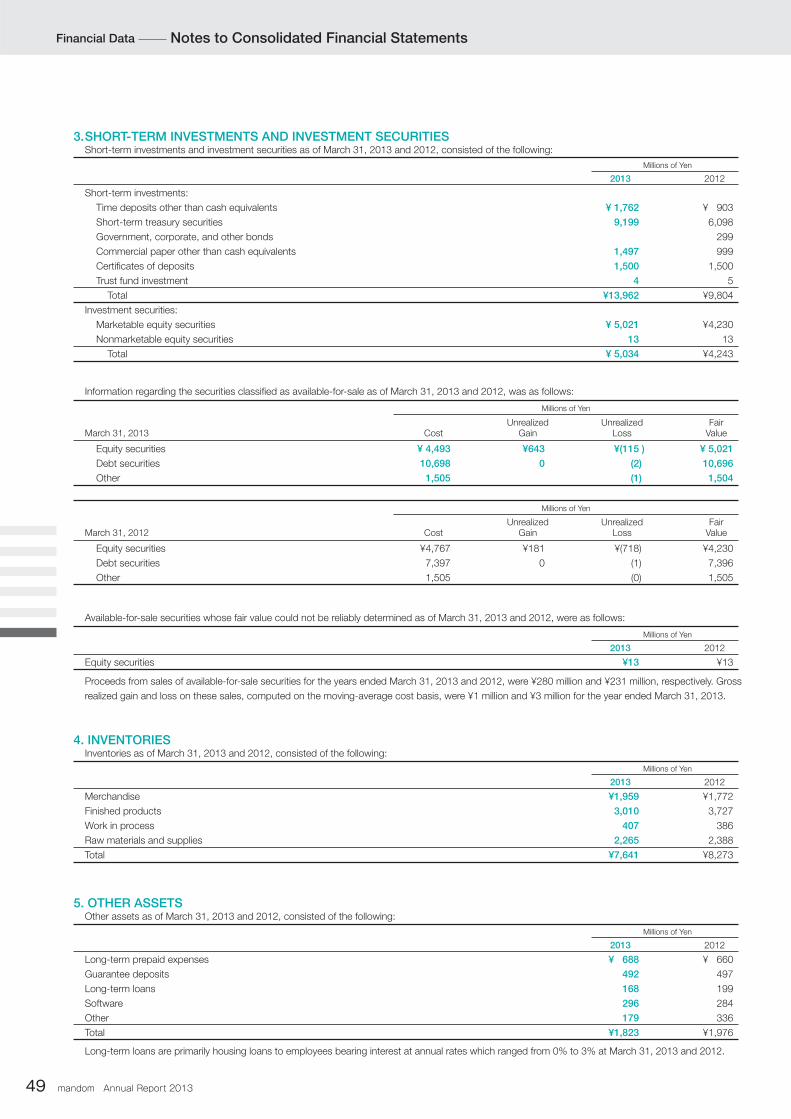
mandom Annual Report 201349
Short-term investments:
Time deposits other than cash equivalents ¥ 1,762 ¥ 903
Short-term treasury securities 9,199 6,098
Government, corporate, and other bonds 299
Commercial paper other than cash equivalents 1,497 999
Certificates of deposits 1,500 1,500
Trust fund investment 4 5
Total ¥13,962 ¥9,804
Investment securities:
Marketable equity securities ¥ 5,021 ¥4,230
Nonmarketable equity securities 13 13
Total ¥ 5,034 ¥4,243
Merchandise ¥1,959 ¥1,772
Finished products 3,010 3,727
Work in process 407 386
Raw materials and supplies 2,265 2,388
Total ¥7,641 ¥8,273
Long-term prepaid expenses ¥ 688 ¥ 660
Guarantee deposits 492 497
Long-term loans 168 199
Software 296 284
Other 179 336
Total ¥1,823 ¥1,976
Equity securities ¥13 ¥13
Equity securities ¥ 4,493 ¥643 ¥(115 ) ¥ 5,021
Debt securities 10,698 0 (2) 10,696
Other 1,505 (1) 1,504
Equity securities ¥4,767 ¥181 ¥(718) ¥4,230
Debt securities 7,397 0 (1) 7,396
Other 1,505 (0) 1,505
3. SHORT-TERM INVESTMENTS AND INVESTMENT SECURITIES Short-term investments and investment securities as of March 31, 2013 and 2012, consisted of the following:
4. INVENTORIES Inventories as of March 31, 2013 and 2012, consisted of the following:
5. OTHER ASSETSOther assets as of March 31, 2013 and 2012, consisted of the following:
Available-for-sale securities whose fair value could not be reliably determined as of March 31, 2013 and 2012, were as follows:
Proceeds from sales of available-for-sale securities for the years ended March 31, 2013 and 2012, were ¥280 million and ¥231 million, respectively. Gross
realized gain and loss on these sales, computed on the moving-average cost basis, were ¥1 million and ¥3 million for the year ended March 31, 2013.
Long-term loans are primarily housing loans to employees bearing interest at annual rates which ranged from 0% to 3% at March 31, 2013 and 2012.
Information regarding the securities classified as available-for-sale as of March 31, 2013 and 2012, was as follows:
FairValue
UnrealizedLoss
UnrealizedGainCostMarch 31, 2012
Millions of Yen
2013 2012
Millions of Yen
2013 2012
Millions of Yen
2013 2012
Millions of Yen
2013 2012
Millions of Yen
FairValue
UnrealizedLoss
UnrealizedGainCostMarch 31, 2013
Millions of Yen
Financial Data Notes to Consolidated Financial Statements

mandom Annual Report 2013 50
Financial Data
Projected benefit obligation ¥3,694 ¥3,321
Fair value of plan assets (2,377) (2,001)
Unrecognized actuarial loss (406) (456)
Unrecognized past service cost 162 181
Net liability ¥1,073 ¥1,045
Attributed to:
Prepaid pension expense ¥ (0) ¥ (1)
Liability for retirement benefits 1,073 1,046
Service cost ¥229 ¥218
Interest cost 96 104
Expected return on plan assets (46) (42)
Amortization of past service cost (19) 27
Recognized actuarial loss 74 102
Subtotal 334 409
Contribution for the multiemployer pension plan 271 271
Contribution for the defined contribution pension plan 85 85
Net periodic retirement benefit costs ¥690 ¥765
Fair value of plan assets ¥ 31,565
Projected benefit obligation (43,870)
Net ¥(12,305)
Discount rate 1.2% 1.5%
Expected rate of return on plan assets 2.0% 2.0%
Amortization period of past service cost 7 years 7 years
Recognition period of actuarial gain/loss 7 years 7 years
6. RETIREMENT BENEFITS AND PENSION PLANSThe Company and certain consolidated subsidiaries have funded defined benefit pension plans, defined contribution pension plans, and advance
payment systems for employees.
Under most circumstances, employees terminating their employment are entitled to retirement benefits determined based on the rate of pay at the
time of termination, years of service, and certain other factors. Such retirement benefits are made in the form of a lump-sum severance payment and
annuity payments from a trustee.
2013 2012
Millions of Yen
2013 2012
Millions of Yen
Millions of Yen
2013 2012
The liability for retirement benefits as of March 31, 2013 and 2012, consisted of the following:
The components of net periodic retirement benefit costs for the years ended March 31, 2013 and 2012, were as follows:
The financial statement of the Plan as of March 31, 2012, is as follows:
<Note>
The main reason for the difference between the fair value of plan assets and the projected benefit obligation represented the past service obligation of
¥13,567 million. The past service obligation is evenly amortized over 17 years. The Company and certain consolidated subsidiaries recognized ¥124
million of special contribution expense for the year ended March 31, 2013.
Assumptions used for the years ended March 31, 2013 and 2012, are set forth as follows:
The Company and certain consolidated subsidiaries participate in a contributory multiemployer pension plan (the “Plan”) covering substantially all of their
employees. The pension fund assets available for benefits under this plan at March 31, 2013 and 2012, were approximately ¥4,078 million and ¥3,844
million, respectively.
Contributions to the Plan are expensed as retirement benefit costs. Based on the Group’s salary expense in comparison to the total salary expense of
all employees who participate in the Plan, the Group’s share of the Plan is 12.4% at March 31, 2013. However, the share is not equal to the actual
contribution percentage of the Group.
Deposits received ¥376 ¥ 344
Liabilities for retirement benefits to directors and Audit & Supervisory Board members 351 572
Other 128 113
Total ¥855 ¥1,029
7. OTHER LONG-TERM LIABILITIESOther long-term liabilities as of March 31, 2013 and 2012, consisted of the following:
2013 2012
Millions of Yen
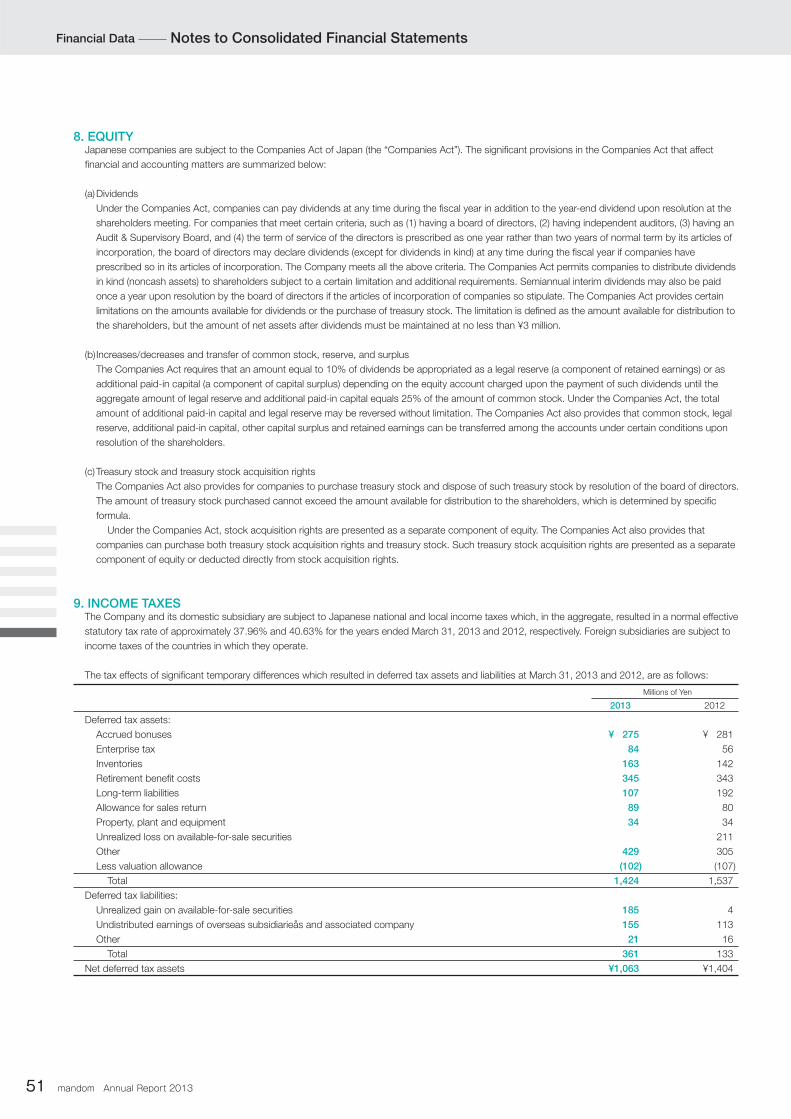
mandom Annual Report 201351
8. EQUITYJapanese companies are subject to the Companies Act of Japan (the “Companies Act”). The significant provisions in the Companies Act that affect
financial and accounting matters are summarized below:
(a) Dividends
Under the Companies Act, companies can pay dividends at any time during the fiscal year in addition to the year-end dividend upon resolution at the
shareholders meeting. For companies that meet certain criteria, such as (1) having a board of directors, (2) having independent auditors, (3) having an
Audit & Supervisory Board, and (4) the term of service of the directors is prescribed as one year rather than two years of normal term by its articles of
incorporation, the board of directors may declare dividends (except for dividends in kind) at any time during the fiscal year if companies have
prescribed so in its articles of incorporation. The Company meets all the above criteria. The Companies Act permits companies to distribute dividends
in kind (noncash assets) to shareholders subject to a certain limitation and additional requirements. Semiannual interim dividends may also be paid
once a year upon resolution by the board of directors if the articles of incorporation of companies so stipulate. The Companies Act provides certain
limitations on the amounts available for dividends or the purchase of treasury stock. The limitation is defined as the amount available for distribution to
the shareholders, but the amount of net assets after dividends must be maintained at no less than ¥3 million.
(b) Increases/decreases and transfer of common stock, reserve, and surplus
The Companies Act requires that an amount equal to 10% of dividends be appropriated as a legal reserve (a component of retained earnings) or as
additional paid-in capital (a component of capital surplus) depending on the equity account charged upon the payment of such dividends until the
aggregate amount of legal reserve and additional paid-in capital equals 25% of the amount of common stock. Under the Companies Act, the total
amount of additional paid-in capital and legal reserve may be reversed without limitation. The Companies Act also provides that common stock, legal
reserve, additional paid-in capital, other capital surplus and retained earnings can be transferred among the accounts under certain conditions upon
resolution of the shareholders.
(c) Treasury stock and treasury stock acquisition rights
The Companies Act also provides for companies to purchase treasury stock and dispose of such treasury stock by resolution of the board of directors.
The amount of treasury stock purchased cannot exceed the amount available for distribution to the shareholders, which is determined by specific
formula.
Under the Companies Act, stock acquisition rights are presented as a separate component of equity. The Companies Act also provides that
companies can purchase both treasury stock acquisition rights and treasury stock. Such treasury stock acquisition rights are presented as a separate
component of equity or deducted directly from stock acquisition rights.
Deferred tax assets:
Accrued bonuses ¥ 275 ¥ 281
Enterprise tax 84 56
Inventories 163 142
Retirement benefit costs 345 343
Long-term liabilities 107 192
Allowance for sales return 89 80
Property, plant and equipment 34 34
Unrealized loss on available-for-sale securities 211
Other 429 305
Less valuation allowance (102) (107)
Total 1,424 1,537
Deferred tax liabilities:
Unrealized gain on available-for-sale securities 185 4
Undistributed earnings of overseas subsidiarieås and associated company 155 113
Other 21 16
Total 361 133
Net deferred tax assets ¥1,063 ¥1,404
2013 2012
Millions of Yen
9. INCOME TAXESThe Company and its domestic subsidiary are subject to Japanese national and local income taxes which, in the aggregate, resulted in a normal effective
statutory tax rate of approximately 37.96% and 40.63% for the years ended March 31, 2013 and 2012, respectively. Foreign subsidiaries are subject to
income taxes of the countries in which they operate.
The tax effects of significant temporary differences which resulted in deferred tax assets and liabilities at March 31, 2013 and 2012, are as follows:
Financial Data Notes to Consolidated Financial Statements

mandom Annual Report 2013 52
Financial Data
A reconciliation between the normal effective statutory tax rate and the actual effective tax rate reflected in the accompanying consolidated statement of
income for the year ended March 31, 2013, with the corresponding figures for the year ended March 31, 2012, is as follows:
10. RESEARCH AND DEVELOPMENT COSTSResearch and development costs charged to income for the years ended March 31, 2013 and 2012, were ¥1,793 million and ¥1,922 million,
respectively.
13. FINANCIAL INSTRUMENTS AND RELATED DISCLOSURES(1) Group policy for financial instruments
The Group uses financial instruments to invest cash surplus amounts in low-risk and highly liquid financial instruments. Derivatives are used, not for
speculative purposes, but to achieve higher yields within specified limits on the amounts.
(2) Nature and extent of risks arising from financial instruments
Receivables, such as trade notes and trade accounts, are exposed to customer credit risk. Short-term investments and investment securities, mainly
debt securities with maturities and equity instruments of customers and suppliers of the Group, are exposed to the risk of market price fluctuations.
Payment terms of payables, such as trade notes and trade accounts, are mainly less than three months.
Receivables and payables in foreign currencies are exposed to the market risk of fluctuation in foreign currency exchange rates.
(3) Risk management for financial instruments
Credit risk management
The Group manages its credit risk from receivables on the basis of internal guidelines, which include monitoring on a regular basis of payment terms
and balances of major customers by the sales planning division to identify the default risk of customers in the early stages.
With respect to financial investments with maturities, since the Group manages its exposure to credit risk by limiting its funding to high credit rating
bonds in accordance with its internal guidelines, the credit risk associated with this investment is not considered to be significant.
Normal effective statutory tax rate 37.96% 40.63%
Expenses not deductible for income tax purposes 1.63 2.56
Adjustment of undistributed earnings of overseas subsidiaries and associated company 0.67 0.04
Difference in subsidiaries’ tax rates (4.67) (5.61)
Tax credit for research and development costs and others (1.49) (1.43)
Change in valuation allowance (0.08) (1.97)
Capital levy on inhabitant tax 0.36 0.36
Decrease adjustment of deferred tax assets for changing the tax rate 1.46
Other - net 0.30 2.44
Actual effective tax rate 34.68% 38.48%
2013 2012
Millions of Yen
Due within one year ¥ 6 ¥150 ¥ 8 ¥ 145
Due after one year 11 722 14 865
Total ¥17 ¥872 ¥22 ¥1,010
Operating Leases
Operating Leases
FinanceLeases
FinanceLeases
Millions of Yen
2013 2012
11. ADVERTISING COSTSAdvertising costs charged to income for the years ended March 31, 2013 and 2012, were ¥3,105 million and ¥3,169 million, respectively.
12. LEASESThe Group leases office space, office equipment, and certain other assets.
Total rental expenses for the years ended March 31, 2013 and 2012, were ¥1,349 million and ¥1,411 million, respectively.
Obligations under finance leases and future minimum payments under noncancelable operating leases were as follows:
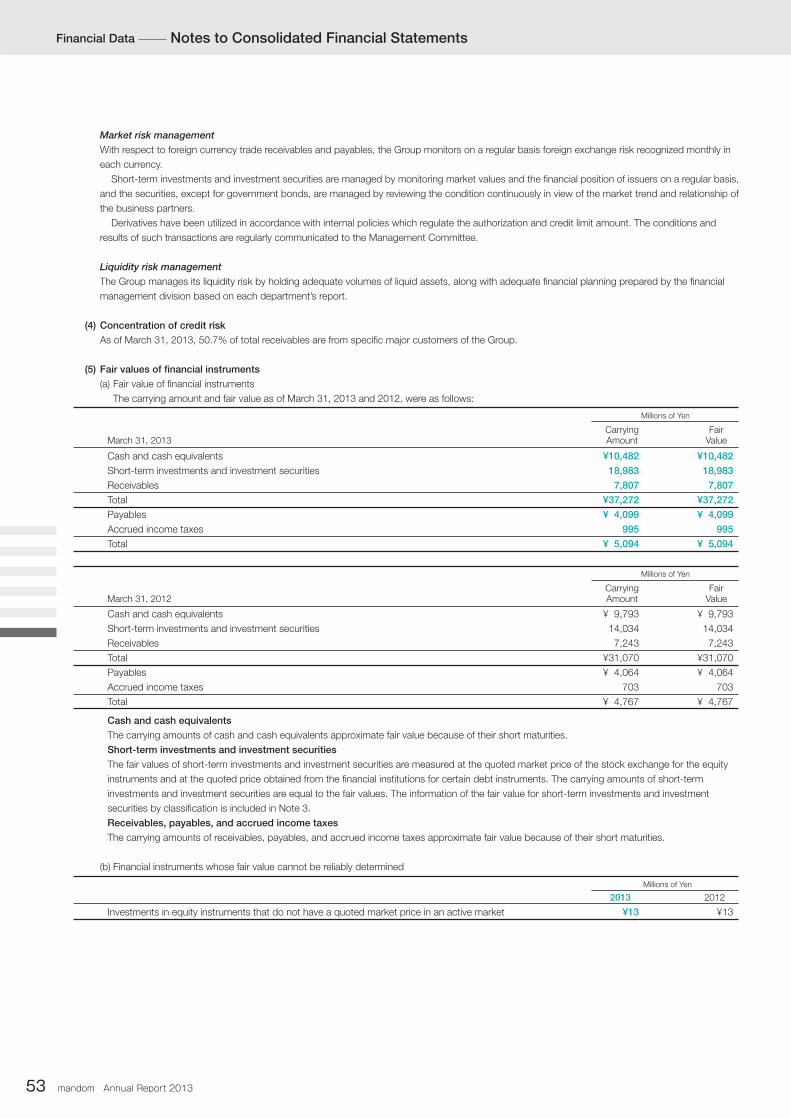
mandom Annual Report 201353
Market risk management
With respect to foreign currency trade receivables and payables, the Group monitors on a regular basis foreign exchange risk recognized monthly in
each currency.
Short-term investments and investment securities are managed by monitoring market values and the financial position of issuers on a regular basis,
and the securities, except for government bonds, are managed by reviewing the condition continuously in view of the market trend and relationship of
the business partners.
Derivatives have been utilized in accordance with internal policies which regulate the authorization and credit limit amount. The conditions and
results of such transactions are regularly communicated to the Management Committee.
Liquidity risk management
The Group manages its liquidity risk by holding adequate volumes of liquid assets, along with adequate financial planning prepared by the financial
management division based on each department’s report.
(4) Concentration of credit risk
As of March 31, 2013, 50.7% of total receivables are from specific major customers of the Group.
(5) Fair values of financial instruments
(a) Fair value of financial instruments
The carrying amount and fair value as of March 31, 2013 and 2012, were as follows:
Cash and cash equivalents
The carrying amounts of cash and cash equivalents approximate fair value because of their short maturities.
Short-term investments and investment securities
The fair values of short-term investments and investment securities are measured at the quoted market price of the stock exchange for the equity
instruments and at the quoted price obtained from the financial institutions for certain debt instruments. The carrying amounts of short-term
investments and investment securities are equal to the fair values. The information of the fair value for short-term investments and investment
securities by classification is included in Note 3.
Receivables, payables, and accrued income taxes
The carrying amounts of receivables, payables, and accrued income taxes approximate fair value because of their short maturities.
(b) Financial instruments whose fair value cannot be reliably determined
Cash and cash equivalents ¥10,482 ¥10,482
Short-term investments and investment securities 18,983 18,983
Receivables 7,807 7,807
Total ¥37,272 ¥37,272
Payables ¥ 4,099 ¥ 4,099
Accrued income taxes 995 995
Total ¥ 5,094 ¥ 5,094
Cash and cash equivalents ¥ 9,793 ¥ 9,793
Short-term investments and investment securities 14,034 14,034
Receivables 7,243 7,243
Total ¥31,070 ¥31,070
Payables ¥ 4,064 ¥ 4,064
Accrued income taxes 703 703
Total ¥ 4,767 ¥ 4,767
FairValue
CarryingAmountMarch 31, 2013
Millions of Yen
FairValue
CarryingAmountMarch 31, 2012
Millions of Yen
Investments in equity instruments that do not have a quoted market price in an active market ¥13 ¥13
2013 2012
Millions of Yen
Financial Data Notes to Consolidated Financial Statements
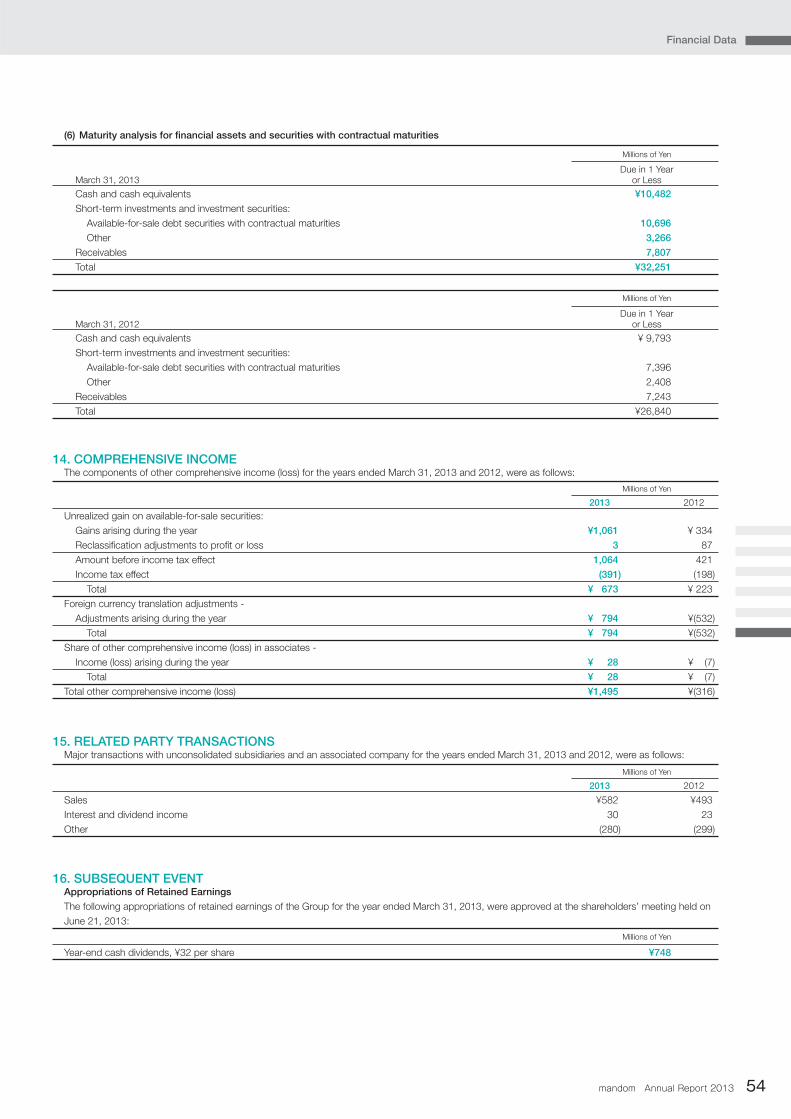
mandom Annual Report 2013 54
Financial Data
2013 2012
Millions of Yen
(6) Maturity analysis for financial assets and securities with contractual maturities
14. COMPREHENSIVE INCOMEThe components of other comprehensive income (loss) for the years ended March 31, 2013 and 2012, were as follows:
15. RELATED PARTY TRANSACTIONSMajor transactions with unconsolidated subsidiaries and an associated company for the years ended March 31, 2013 and 2012, were as follows:
16. SUBSEQUENT EVENTAppropriations of Retained Earnings
The following appropriations of retained earnings of the Group for the year ended March 31, 2013, were approved at the shareholders’ meeting held on
June 21, 2013:
Cash and cash equivalents ¥10,482
Short-term investments and investment securities:
Available-for-sale debt securities with contractual maturities 10,696
Other 3,266
Receivables 7,807
Total ¥32,251
Unrealized gain on available-for-sale securities:
Gains arising during the year ¥1,061 ¥ 334
Reclassification adjustments to profit or loss 3 87
Amount before income tax effect 1,064 421
Income tax effect (391) (198)
Total ¥ 673 ¥ 223
Foreign currency translation adjustments -
Adjustments arising during the year ¥ 794 ¥(532)
Total ¥ 794 ¥(532)
Share of other comprehensive income (loss) in associates -
Income (loss) arising during the year ¥ 28 ¥ (7)
Total ¥ 28 ¥ (7)
Total other comprehensive income (loss) ¥1,495 ¥(316)
Year-end cash dividends, ¥32 per share ¥748
Cash and cash equivalents ¥ 9,793
Short-term investments and investment securities:
Available-for-sale debt securities with contractual maturities 7,396
Other 2,408
Receivables 7,243
Total ¥26,840
Millions of Yen
Due in 1 Yearor LessMarch 31, 2013
Millions of Yen
Millions of Yen
Due in 1 Yearor LessMarch 31, 2012
Sales ¥582 ¥493
Interest and dividend income 30 23
Other (280) (299)
2013 2012
Millions of Yen
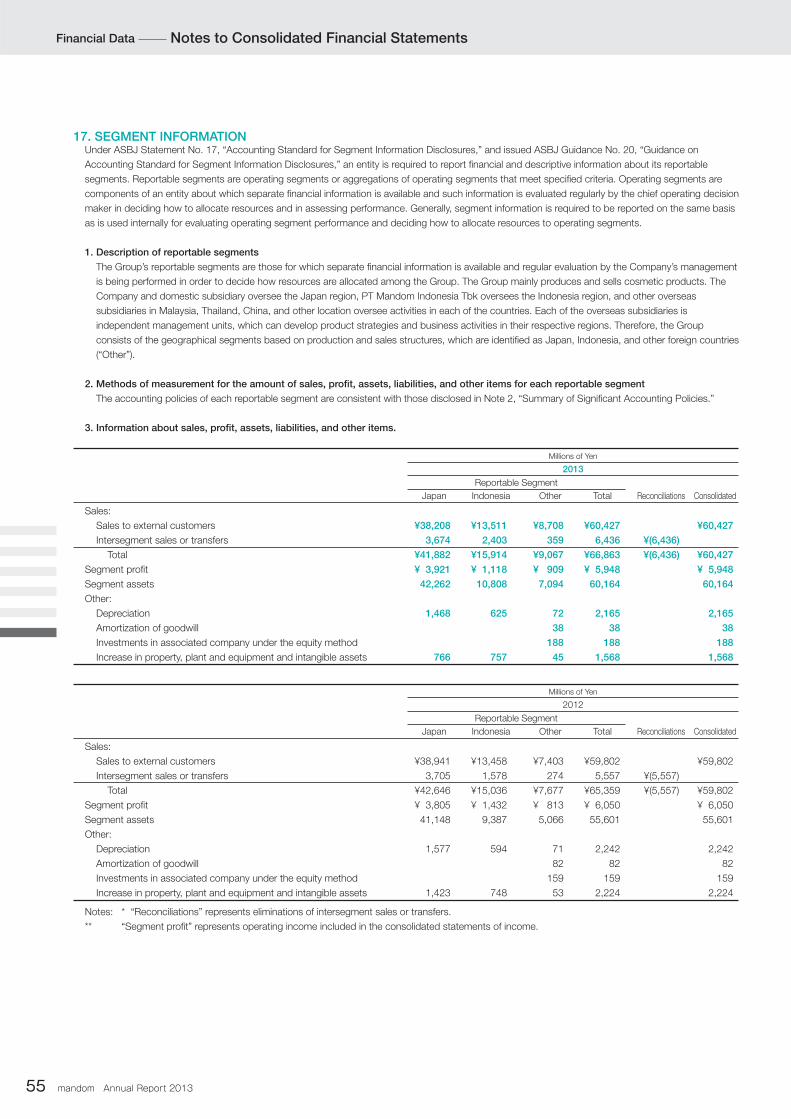
mandom Annual Report 201355
17. SEGMENT INFORMATIONUnder ASBJ Statement No. 17, “Accounting Standard for Segment Information Disclosures,” and issued ASBJ Guidance No. 20, “Guidance on
Accounting Standard for Segment Information Disclosures,” an entity is required to report financial and descriptive information about its reportable
segments. Reportable segments are operating segments or aggregations of operating segments that meet specified criteria. Operating segments are
components of an entity about which separate financial information is available and such information is evaluated regularly by the chief operating decision
maker in deciding how to allocate resources and in assessing performance. Generally, segment information is required to be reported on the same basis
as is used internally for evaluating operating segment performance and deciding how to allocate resources to operating segments.
1. Description of reportable segments
The Group’s reportable segments are those for which separate financial information is available and regular evaluation by the Company’s management
is being performed in order to decide how resources are allocated among the Group. The Group mainly produces and sells cosmetic products. The
Company and domestic subsidiary oversee the Japan region, PT Mandom Indonesia Tbk oversees the Indonesia region, and other overseas
subsidiaries in Malaysia, Thailand, China, and other location oversee activities in each of the countries. Each of the overseas subsidiaries is
independent management units, which can develop product strategies and business activities in their respective regions. Therefore, the Group
consists of the geographical segments based on production and sales structures, which are identified as Japan, Indonesia, and other foreign countries
(“Other”).
2. Methods of measurement for the amount of sales, profit, assets, liabilities, and other items for each reportable segment
The accounting policies of each reportable segment are consistent with those disclosed in Note 2, “Summary of Significant Accounting Policies.”
3. Information about sales, profit, assets, liabilities, and other items.
Sales:
Sales to external customers ¥38,208 ¥13,511 ¥8,708 ¥60,427 ¥60,427
Intersegment sales or transfers 3,674 2,403 359 6,436 ¥(6,436)
Total ¥41,882 ¥15,914 ¥9,067 ¥66,863 ¥(6,436) ¥60,427
Segment profit ¥ 3,921 ¥ 1,118 ¥ 909 ¥ 5,948 ¥ 5,948
Segment assets 42,262 10,808 7,094 60,164 60,164
Other:
Depreciation 1,468 625 72 2,165 2,165
Amortization of goodwill 38 38 38
Investments in associated company under the equity method 188 188 188
Increase in property, plant and equipment and intangible assets 766 757 45 1,568 1,568
Sales:
Sales to external customers ¥38,941 ¥13,458 ¥7,403 ¥59,802 ¥59,802
Intersegment sales or transfers 3,705 1,578 274 5,557 ¥(5,557)
Total ¥42,646 ¥15,036 ¥7,677 ¥65,359 ¥(5,557) ¥59,802
Segment profit ¥ 3,805 ¥ 1,432 ¥ 813 ¥ 6,050 ¥ 6,050
Segment assets 41,148 9,387 5,066 55,601 55,601
Other:
Depreciation 1,577 594 71 2,242 2,242
Amortization of goodwill 82 82 82
Investments in associated company under the equity method 159 159 159
Increase in property, plant and equipment and intangible assets 1,423 748 53 2,224 2,224
ReconciliationsTotalOtherIndonesia
Reportable Segment
Japan Consolidated
Millions of Yen
2013
ReconciliationsTotalOtherIndonesia
Reportable Segment
Japan Consolidated
Millions of Yen
2012
Notes: * “Reconciliations” represents eliminations of intersegment sales or transfers.
** “Segment profit” represents operating income included in the consolidated statements of income.
Financial Data Notes to Consolidated Financial Statements
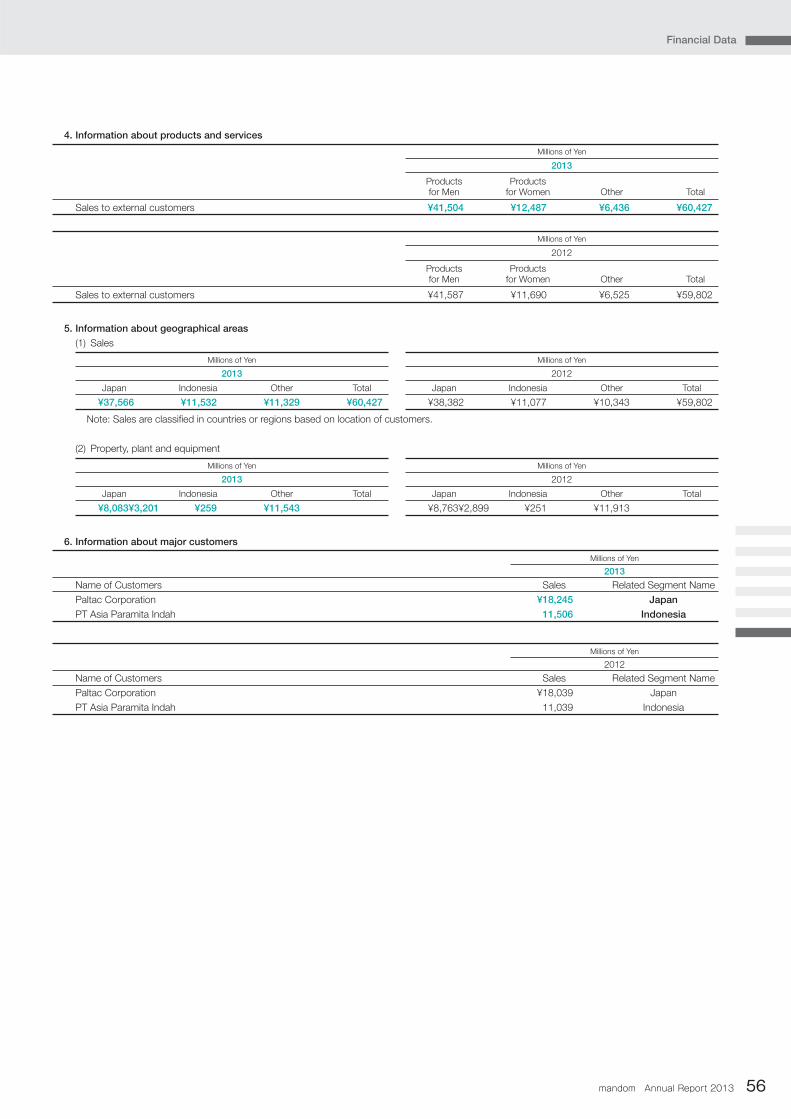
mandom Annual Report 2013 56
Financial Data
Sales to external customers ¥41,504 ¥12,487 ¥6,436 ¥60,427
Sales to external customers ¥41,587 ¥11,690 ¥6,525 ¥59,802
¥37,566 ¥11,532 ¥11,329 ¥60,427
¥8,083 ¥3,201 ¥259 ¥11,543
¥38,382 ¥11,077 ¥10,343 ¥59,802
¥8,763 ¥2,899 ¥251 ¥11,913
4. Information about products and services
5. Information about geographical areas
(1) Sales
6. Information about major customers
Note: Sales are classified in countries or regions based on location of customers.
(2) Property, plant and equipment
TotalOtherProducts
for WomenProducts for Men
Millions of Yen
2013
TotalOtherProducts
for WomenProducts for Men
Millions of Yen
2012
TotalOtherIndonesiaJapan
Millions of Yen
2013
TotalOtherIndonesiaJapan
Millions of Yen
2013
TotalOtherIndonesiaJapan
Millions of Yen
2012
TotalOtherIndonesiaJapan
Millions of Yen
2012
Name of Customers Sales Related Segment Name
Paltac Corporation ¥18,245 Japan
PT Asia Paramita Indah 11,506 Indonesia
Name of Customers Sales Related Segment Name
Paltac Corporation ¥18,039 Japan
PT Asia Paramita Indah 11,039 Indonesia
2013
Millions of Yen
2012
Millions of Yen

mandom Annual Report 201357
Financial DataFinancial Data Independent Auditor’s Report
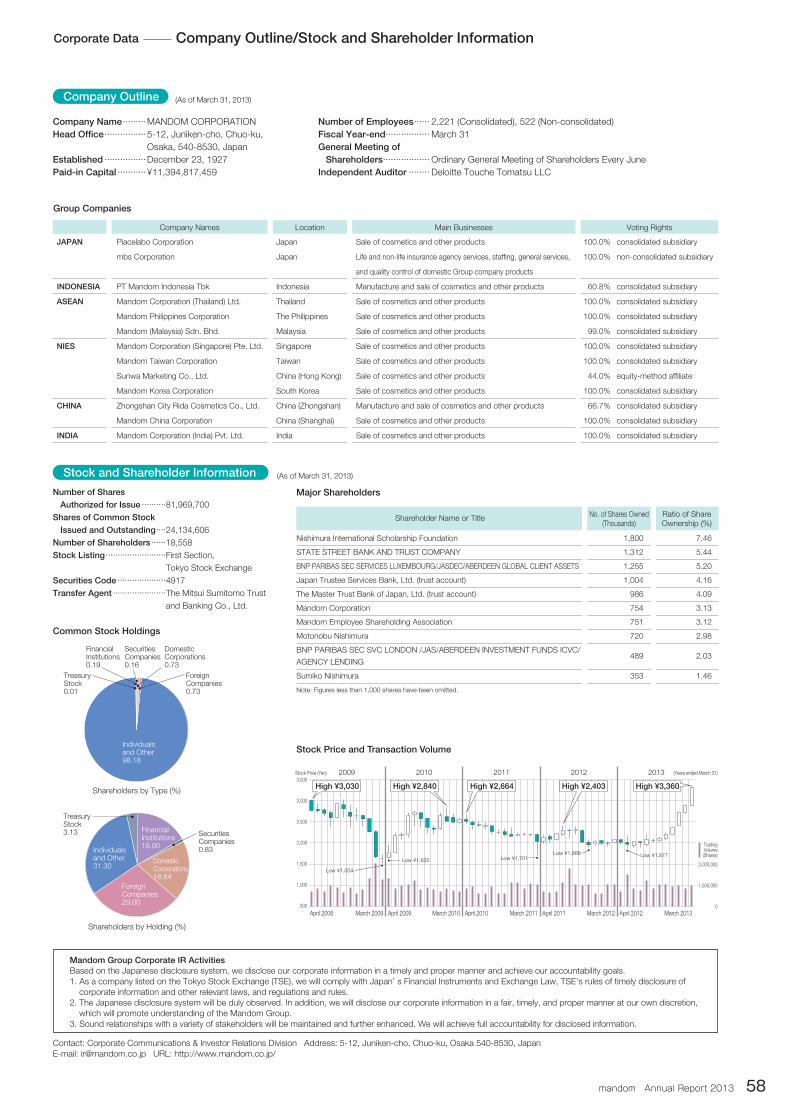
mandom Annual Report 2013 58
April 2008 March 2009 April 2009 March 2010 April 2010 March 2011 April 2011 March 2012 April 2012 March 2013
3,500
3,000
2,500
2,000
1,500
1,000
500
3,000,000
1,500,000
0
TradingVolume
(Shares)
High ¥3,030 High ¥2,840 High ¥3,360High ¥2,664 High ¥2,403
Low ¥1,504
Low ¥1,632Low ¥1,877
Low ¥1,701Low ¥1,888
2009 2010 2011 2012 2013Stock Price (Yen) (Years ended March 31)
JAPAN Piacelabo Corporation Japan Sale of cosmetics and other products 100.0% consolidated subsidiary
mbs Corporation Japan Life and non-life insurance agency services, staffing, general services, 100.0% non-consolidated subsidiary
and quality control of domestic Group company products
INDONESIA PT Mandom Indonesia Tbk Indonesia Manufacture and sale of cosmetics and other products 60.8% consolidated subsidiary
ASEAN Mandom Corporation (Thailand) Ltd. Thailand Sale of cosmetics and other products 100.0% consolidated subsidiary
Mandom Philippines Corporation The Philippines Sale of cosmetics and other products 100.0% consolidated subsidiary
Mandom (Malaysia) Sdn. Bhd. Malaysia Sale of cosmetics and other products 99.0% consolidated subsidiary
NIES Mandom Corporation (Singapore) Pte. Ltd. Singapore Sale of cosmetics and other products 100.0% consolidated subsidiary
Mandom Taiwan Corporation Taiwan Sale of cosmetics and other products 100.0% consolidated subsidiary
Sunwa Marketing Co., Ltd. China (Hong Kong) Sale of cosmetics and other products 44.0% equity-method affiliate
Mandom Korea Corporation South Korea Sale of cosmetics and other products 100.0% consolidated subsidiary
CHINA Zhongshan City Rida Cosmetics Co., Ltd. China (Zhongshan) Manufacture and sale of cosmetics and other products 66.7% consolidated subsidiary
Mandom China Corporation China (Shanghai) Sale of cosmetics and other products 100.0% consolidated subsidiary
INDIA Mandom Corporation (India) Pvt. Ltd. India Sale of cosmetics and other products 100.0% consolidated subsidiary
Company Name .........MANDOM CORPORATION
Head Office ................5-12, Juniken-cho, Chuo-ku,
Osaka, 540-8530, Japan
Established ................December 23, 1927
Paid-in Capital ...........¥11,394,817,459
Number of Employees ...... 2,221 (Consolidated), 522 (Non-consolidated)
Fiscal Year-end ................. March 31
General Meeting of
Shareholders .................. Ordinary General Meeting of Shareholders Every June
Independent Auditor ........ Deloitte Touche Tomatsu LLC
Group Companies
Major Shareholders
Stock Price and Transaction Volume
Common Stock Holdings
Contact: Corporate Communications & Investor Relations Division Address: 5-12, Juniken-cho, Chuo-ku, Osaka 540-8530, JapanE-mail: [email protected] URL: http://www.mandom.co.jp/
Based on the Japanese disclosure system, we disclose our corporate information in a timely and proper manner and achieve our accountability goals.1. As a company listed on the Tokyo Stock Exchange (TSE), we will comply with Japan’ s Financial Instruments and Exchange Law, TSE’s rules of timely disclosure of
corporate information and other relevant laws, and regulations and rules.2. The Japanese disclosure system will be duly observed. In addition, we will disclose our corporate information in a fair, timely, and proper manner at our own discretion,
which will promote understanding of the Mandom Group.3. Sound relationships with a variety of stakeholders will be maintained and further enhanced. We will achieve full accountability for disclosed information.
Shareholders by Type (%)
TreasuryStock0.01
FinancialInstitutions0.19
SecuritiesCompanies0.16
DomesticCorporations0.73
ForeignCompanies0.73
Individualsand Other98.18
TreasuryStock3.13 Financial
Institutions16.90
SecuritiesCompanies0.83
DomesticCorporations18.84
ForeignCompanies29.00
Individualsand Other31.30
Shareholders by Holding (%)
Company Names Location Main Businesses Voting Rights
Number of Shares
Authorized for Issue ..........81,969,700
Shares of Common Stock
Issued and Outstanding ....24,134,606
Number of Shareholders ......18,558
Stock Listing .........................First Section,
Tokyo Stock Exchange
Securities Code ....................4917
Transfer Agent ......................The Mitsui Sumitomo Trust
and Banking Co., Ltd.
Nishimura International Scholarship Foundation 1,800 7.46
STATE STREET BANK AND TRUST COMPANY 1,312 5.44
BNP PARIBAS SEC SERVICES LUXEMBOURG/JASDEC/ABERDEEN GLOBAL CLIENT ASSETS 1,255 5.20
Japan Trustee Services Bank, Ltd. (trust account) 1,004 4.16
The Master Trust Bank of Japan, Ltd. (trust account) 986 4.09
Mandom Corporation 754 3.13
Mandom Employee Shareholding Association 751 3.12
Motonobu Nishimura 720 2.98
BNP PARIBAS SEC SVC LONDON /JAS/ABERDEEN INVESTMENT FUNDS ICVC/
AGENCY LENDING 489 2.03
Sumiko Nishimura 353 1.46
Shareholder Name or Title No. of Shares Owned(Thousands)
Ratio of Share Ownership (%)
Note: Figures less than 1,000 shares have been omitted.
Mandom Group Corporate IR Activities
Corporate Data Company Outline/Stock and Shareholder Information
(As of March 31, 2013)
(As of March 31, 2013)
Company Outline
Stock and Shareholder Information