ANNUAL REPORT 2005
Contents
Vision 1
Operational Philosophy 1
Ethos 2
Group Statistics 3
Directorate 4 – 5
Chairman’s Report 6 – 8
Chief Executive Officer’s Report 9 – 12
Corporate Governance 13 – 20
Annual Financial Statements 21
Report of the Independent Auditors 22
Directors’ Report 23 – 27
Income Statements 28
Balance Sheets 29
Statements of Changes in Equity 30
Cash Flow Statements 31
Notes to the Cash Flow Statements 32
Notes to the Financial Statements 33 – 62
Subsidiary Companies 63
Joint Ventures 64
Segmental Reports 65 – 66
Directors’ Remuneration 67
Directors’ Share Options 68 – 69
Notice of Annual General Meeting 70 – 71
Annual General Meeting – Explanatory Notes 72 – 75
Administration 76
Shareholders’ Diary 76
Form of Proxy Inserted
Shareholders’ Update Form Inserted
Contact Details Inside Back cover

Spescom Vision
To see all leading organisations worldwide utilising Spescom’s products and solutions
to manage information and connect to the networked knowledge economy.
Operational Philosophy
In pursuit of our vision, Spescom promotes a culture that focuses on a five-point operational strategy:
1. COMMITMENT TO QUALITY – As an ISO 9001 company, Spescom’s commitment to quality is effected by
developing and maintaining close relationships with all stakeholders, thereby enabling us to understand and
cater for their requirements in an innovative and cost-effective manner.
2. COMPETE THROUGH INNOVATION – We are committed to sustained innovation through continued research
and development in our selected markets. Speed in bringing product to market is our priority. We encourage
our people to be innovative, not only technologically but in all aspects of business.
3. COMPETITIVE ADVANTAGE – Our objective is to dominate the markets in which we operate by formulating a
comprehensive competitive strategy that takes cognisance of the characteristics of the market as well as
knowledge of competitors.
4. GLOBALISATION – We strive to globalise our business in terms of allocation of resources and market
penetration. We will continue to identify and establish markets offshore.
5. SHORTER LEAD TIMES – We are committed to sustained programmes that lead to cost reduction and
productivity improvement in all areas of operation. Our objective is to shorten cycle times in all we do.
Spe
scom
ann
ual r
epor
t 20
05
1

Ethos
Ethos: Spirit or values of a community
THE SPESCOM ENVIRONMENT
Business is conducted in an atmosphere of professional entrepreneurship. Spescom’s perspective is global, thus
constant change is inevitable as we strive to be innovative in a highly competitive market. Successful growth is
achieved through individuals committing themselves to customer satisfaction and ‘the greater good of the
company’. This is to enhance the pervading sense of purpose – of building for the future.
Spescom has a long-term view of business
SPESCOM IN BUSINESS
To be proactive and achieve innovation, one must be passionate about business. However, the aggressive business
attitude is always influenced by the deep respect for human dignity and ethics so essential in negotiation. At
Spescom, we believe in the notion of ‘a deal is a deal’. It is expected that all who interact with Spescom mirror this
strong sense of business ethics that characterises operations. This sense of dignity is harnessed in entrepreneurial
individuals who are businesspeople, who respond to quick-paced action and change effectively, realising the
opportunities and outperforming the competition.
Spescom is passion and competence in business
THE SPESCOM FAMILY
In a dynamic, innovative industry, only a certain type of businessperson flourishes. Spescom is ideally suited to the
assertive self-starter who operates best in a team environment. Competency combines with honesty when one
respects the dignity of others in all transactions. We do not hide bad news from each other. Spescom recognises
and rewards performance, banking on the high level of intellectual capital available and supporting ambitious
business people with clearly defined company and personal goals.
When a group of winners work together, the result is success
Spe
scom
ann
ual r
epor
t 20
05
2

Group Statistics
Africa
International
15,4
84,6
38,2
61,8
2005 2004GEOGRAPHICAL REVENUE STREAMS
Own IP
3rd Party IP
2005 2004
61,4 38,6 53,0 47,0
PROPRIETARY TECHNOLOGY
Enterprise contentmanagement solutions
Communications
Services & other
2005 2004
21,5 59,8
18,7
10,4 71,2
18,4
REVENUE SPLIT
Spe
scom
ann
ual r
epor
t 20
05
3

Directorate
Tony Farah (57) BSc (Eng), MBA, AMP (Harvard)
Chief Executive Officer – Spescom Group
Member of Nomination Committee
Hilton J Isaacman (52) CA (SA)
Executive Director – Corporate Finance
Thomas Makore (40) Bsc Eng (Hons), MBL, Pr Eng, C Eng
Chief Executive Officer – Spescom Telecommunications
Dr James P Myers (65) American
PhD (Maths)
Independent Non-Executive Director and Chairperson
Acting Chairperson of Nomination Committee
Member of Audit Committee
Walter Kansteiner (51) American
Independent Non-Executive Director
Spe
scom
ann
ual r
epor
t 20
05
4

Mutle C Mogase (41) BCom, EDP (New York)
Non-Executive Director
Member of Audit Committee
Member of Nomination Committee
Colin Rezek (50) BCom, MBA
Alternate Non-Executive Director
Directorate
Lynne Ogilvy (51) BSc (Maths)
Independent Non-Executive Director
Chairperson of Remuneration Committee
Nyeleti Magadze (32) BProc, HDip Tax
Company Secretary
Phillip Vallet (58) BA LLB
Non-Executive Director
Chairperson of Audit Committee
Member of Remuneration Committee
Jené I Palmer (35) BCom, BCompt (Hons), CA (SA)
Chief Financial Officer
Member of Nomination Committee
Spe
scom
ann
ual r
epor
t 20
05
5
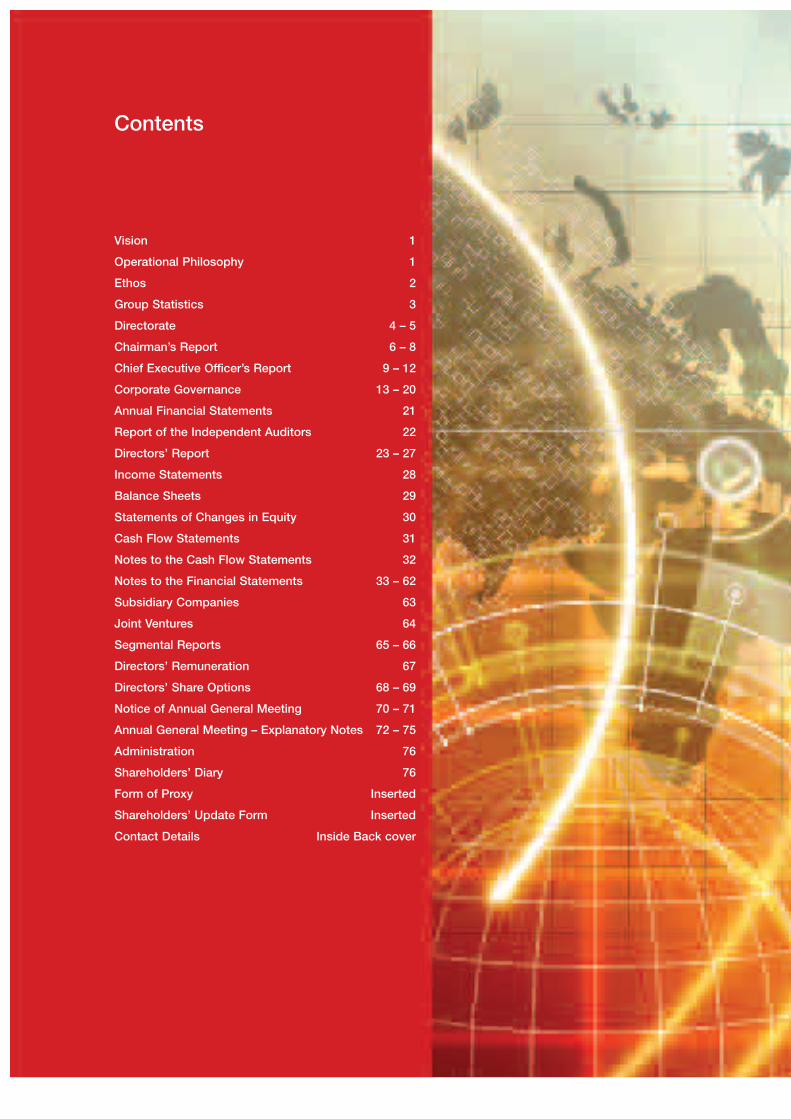
Chairman’s Report
This has been a demanding year in
the South African ICT arena.
Companies specifically involved in
telecommunications have been
frustrated by the lack of movement
in the sector. Deregulation became
a legislative reality on 1 February
2005, but little followed in the way
of true liberalisation of the market.
It would be inappropriate to
minimise the challenges we have
faced this past year. Difficult
decisions had to be made to
ensure Spescom remains well
positioned to capitalise on
opportunities resulting from the full
deregulation of the telecoms
sector. We have been forced to
manage costs in a manner that
guarantees that situation. This
strategy is evidenced by the
manner in which we supported
Spescom Software in its efforts to
obtain the necessary financing to
bolster product marketing. The
result has been a change in the
relationship between Spescom and
Spescom Software that over time
should benefit both companies.
We expect to continue in our
support of their efforts and believe
their future will be secured by
aligning with a powerful market
leader in their specific business
arena. The altered relationship will
allow Spescom’s management
team to devote their energies to
prospects that will more directly
impact value enhancement for
group shareholders and
employees.
Looking at the history of the South
African telecoms industry it is
difficult to predict how the market
will evolve. However, the SNO was
licensed at the end of 2005 and it
is expected that this development
will produce lucid information on
where Telkom will focus its efforts.
The anticipated aggressive start up
budget of the SNO alone should
stimulate the sector and promote
competitive expansion in the
market as a whole.
Spe
scom
ann
ual r
epor
t 20
05
6
Spescom’s strategic direction remainsfocused on value creation for allstakeholders. In this regard we are devoting our energies to maximising ourpotential and growing the business.
Jim Myers
Independent Non-Executive
Chairman
Chairman’s Report
It is predicted that the SNO will
emphasise a more modern,
upgraded network for corporate
business. Our challenge will be to
assure this focus will result in
business opportunities for Spescom.
Internationally, telecoms has also
been in a slump but trends are
indicating that this is changing. We
anticipate the world market will
improve this year, providing an
additional catalyst for local
advancement.
Moreover, the telecoms needs on
the African continent hold great
promise for the company in light of
the unique understanding and
knowledge we can bring to bear
on the technology requirements of
emerging nations. This expertise is
founded on almost 30 years’
experience of doing business in
this region. At considerable
expense, we have maintained our
key resources, without which we
would not be positioned to take
advantage of these opportunities.
GLOBALLY
Last year we experienced a weak
global economy, the effects of
which were clearly visible in the
telecommunications sector which
experienced very poor growth.
However, there are signs of a
recovery underway which will
positively impact on spending.
Africa specifically is recognised as
one of the few remaining
developing markets where
aggressive expansion is predicted
for telecommunications.
Spescom’s strategic direction
remains focused on value creation
for all stakeholders. Our
unwavering commitment to this
objective has underpinned all of
the difficult tactical decisions that
have recently been made.
In this regard we are devoting our
energies to maximising our
potential and growing the
business. This will be achieved by
maintaining strong client
relationships, preserving key
growth skills, expanding our
knowledge base in line with the
evolving sector and diligently
preserving our financial capability.
Our globalisation strategies are
very much on track. Spescom
DataVoice has made substantial
progress in broadening its
international channels to market.
New distributors and value added
resellers have been signed up in
both Europe and the Middle East.
Our assertive marketing campaign
is already yielding results with
orders emanating from these new
business conduits.
On the South African front, the
addition of a performance
management component, in the
shape of the Qnique Insight
product, to Spescom DataVoice’s
current market offerings is an
exciting prospect. It positions both
the call centre operation and the
voice transaction management
division to bring a comprehensive
contact centre and voice recording
solution to the market.
PROSPECTS
The long awaited opening up of the
telecommunications sector is
expected to become a reality in
South Africa. We are seeing clear
indicators that global investors
recognise the potential for value
creation in emerging markets such
as sub-Saharan Africa. It is
acknowledged that the region is
viewed as one of the few remaining
areas capable of yielding strong
growth in the next ten years.
ICT sector valuations have
significantly increased in the last
year with foreign investment being
seen as a boost to expansion,
which should in turn attract
attention from South African
suppliers and operators.
Spescom’s continued focus on
telecoms as one of its core
business activities puts the
Spe
scom
ann
ual r
epor
t 20
05
7
Chairman’s Report
company in a strong position to
take advantage of the dynamics at
play in this market. Through
existing relationships, augmented
by our reputation for service and
quality, we expect to see
opportunities emerge.
The business plans implemented
for our in-house developed
DataVoice technology products are
beginning to show results. The
restructured operation with a
closer association with the
DataFusion division is yielding
results. We are finding that South
African based technology provides
some unique advantages in the
global market. Spescom’s voice
solutions remain one of the most
advanced technology offerings
available, all of which translates
into competitive edge.
As the South African and other
African economies continue to
develop with increasing business
competition and capacity,
DataFusion should see improved
opportunities to offer turnkey
services in the call centre market.
Spescom’s product line and
service continues to be recognised
as best in class.
WORLD CUP FEVER
The positive economic effects of
hosting the world’s biggest
sporting event, after the Olympic
Games, in the shape of the 2010
World Cup, cannot be
underestimated.
It may seem very far away but
preparation and planning for the
right technology to be in place to
assure a successful hosting is
already underway. The media are
currently exposing the
implementation of plans for
upgrades in various sectors
including security, rail and airport
services.
The technology needs on the
broadcast and telecommunications
side will hold great opportunity for
Spescom’s divisions operating in
these areas.
The company is looking forward to
the challenges and business
potential that South Africa’s
hosting of this major event will
afford.
APPRECIATION
I would like to take this opportunity
to thank management, staff and all
stakeholders for their continued
hard work and support.
The Spescom team all join me in
expressing our appreciation of our
customers and their continued
confidence in our products,
services and staff. As with any
company, Spescom’s success
hinges on their ongoing
commitment and loyalty.
Jim Myers
Independent Non-Executive
Chairman
Spe
scom
ann
ual r
epor
t 20
05
8
Chief Executive Officer’s Report
FINANCIAL RESULTS
Spescom achieved a headline
earnings profit of R26,2 million.
This translates into 36,1 cents per
share (cps) for the year in contrast
to 63,5 cps for the comparative
year.
Subsequent to taking into account
the non-trading items and the
decision to write off all offshore
loans owing to the Group,
Spescom reports a loss for the
year of R3,4 million as compared
to a profit of R29,4 million for the
previous year.
However, it is rewarding to note
that the results for the second
six months of the year reflect a
vast improvement on those of
the first half.
During the year under review, the
Group restructured its shareholding
in its US operation, Spescom
Software Inc., facilitating external
financing and permitting the
redeployment of critical resources.
This has resulted in this investment
being equity accounted with effect
1 April 2005 as well as in a
recoupment of R52,6 million prior
year minority losses.
The gearing levels of the Group
remain satisfactory and largely
unchanged. Subsequent to year
end, the Group made further debt
repayments.
A RETROSPECTIVE VIEW OF
THE YEAR
This challenging year has been
characterised by business gaps in
the form of large contracts coming
to an end and not being replaced
swiftly enough by new deals. This,
of course, translates into
undesirable lulls in the revenue
stream. Spescom’s
telecommunications business in
the United Kingdom is one such
example. One large commitment
Spe
scom
ann
ual r
epor
t 20
05
9
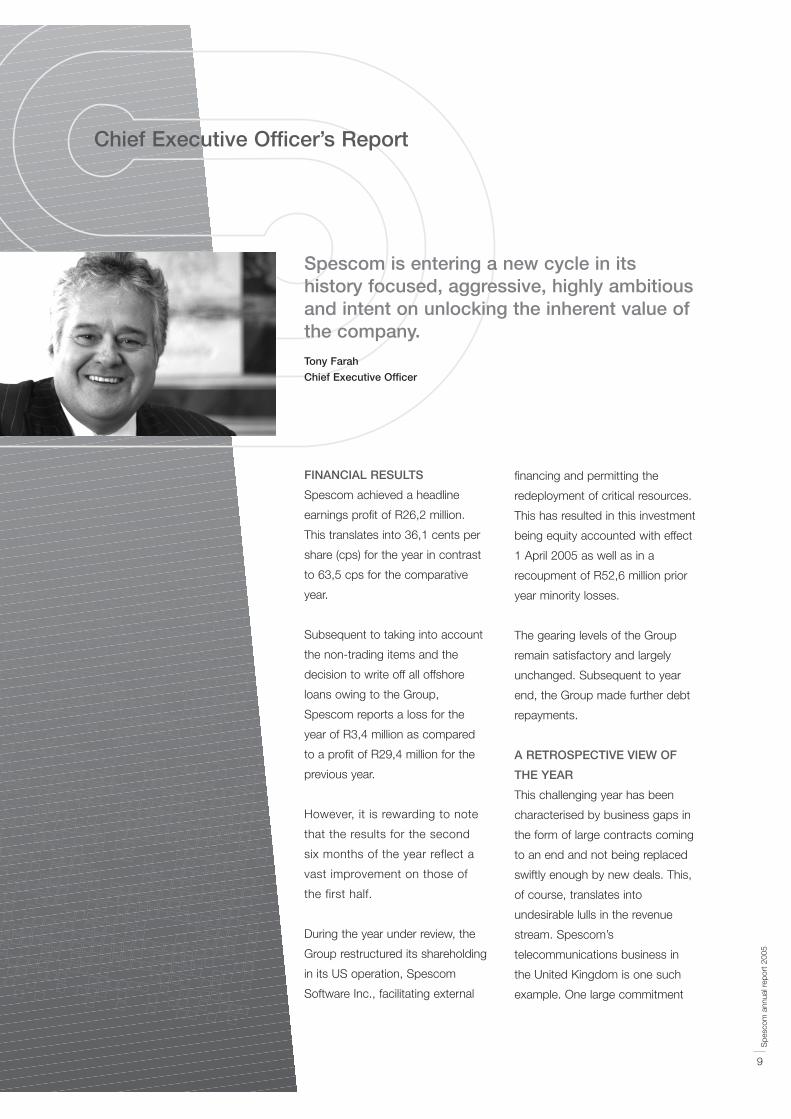
Spescom is entering a new cycle in itshistory focused, aggressive, highly ambitiousand intent on unlocking the inherent value ofthe company. Tony Farah
Chief Executive Officer
Chief Executive Officer’s Report
came to an end and despite
arduous commercial exertions,
replacement with a contract of
similar size and value has proven
to be difficult to date.
The depressed revenues in the first
financial half can be directly
attributed to the unpredictability and
lack of movement in the South
African telecommunications market.
Deregulation remains little more than
an announcement – made earlier in
2005 – with the reality of the
situation being that this proclamation
has had little or no positive impact
on trading conditions in this arena.
Liberalisation is slow to take place,
leaving the telecoms business still
heavily dependent on large deals
and a small customer base.
Uncertainty in this market has also
contributed to delays in the
finalisation of large commitments as
well as the awarding of new
contracts.
However, it is hoped that the
licensing of the second network
operator will lead to movement in
the sector.
The first half of the year also saw
Spescom divesting itself of its Test
and Measurement operation,
which market sector formed the
foundation of the company’s early
days. Despite not being core
business for some time, Spescom
continued with this operation due
to its profitability. However, grey
importing and eroded margins
have latterly led to a steep decline
in profit prompting the decision to
exit this arena.
IMPROVED SECOND HALF
Overall the performance for the
second half of the year was much
improved. Notably, the Group’s
broadcast division, Spescom
Media IT, and contact centre
operation, Spescom DataFusion,
performed exceptionally well. This
included major institutional
corporate network rollout with
voice over IP functionality.
There are even more exciting
prospects for Spescom Media IT
with Avid Technology broadening
the terms of its current sole
distributorship agreement to
encompass exclusive rights to
market Avid’s newly acquired
range of Pinnacle broadcast
products. This development
followed on the heels of Avid’s
acquisition of Pinnacle Systems.
During the period under review,
Spescom DataVoice entered into a
strategic alliance with Key
Performance Technologies (KPT),
extending its range of market
offerings to include Qnique, a
powerful contact centre
performance assessment tool. The
product has been rebranded
DataVoice Qnique Insight and will
include a DataVoice
communications recording
component.
Spescom Telecommunications
successfully concluded strategic
alliances with the global leaders in
the wireless market – Samsung,
Redline and Gilat – a leading
supplier of satellite products. This
leaves Spescom uniquely well
positioned in this arena for the
expected uptake of these
technologies in South Africa.
Overall for the year, the Group’s
expense base has been up due to
investment in greater skills levels
and the acquisition of new people
aimed at driving an aggressive
sales and marketing campaign.
It is pleasing to note that our
customer base of “blue chip”
companies continues to grow and
includes such well known names as
IBM, Telkom, SABC, Old Mutual
and Auto & General, to name a few.
EXPANDING GLOBAL
CHANNELS TO MARKET
Internationally Spescom remains
focused on the globalisation of its
own products and technology.
Spe
scom
ann
ual r
epor
t 20
05
10
Chief Executive Officer’s Report
In support of these objectives
Spescom increased its global
footprint by breaking into Middle
Eastern markets. The channels to
market set up in that region by
Spescom DataVoice have started
to yield results.
Moreover, the UK office has
successfully focused its energies
on growing and working the
channel to identify specialised
niche applications for the
DataVoice range.
Spescom Software Inc. the
NASDAQ bulletin board
company, has excelled in
establishing the product range
in the content management
space, which is identified as the
future technology wave.
However, during the build-up
phase over the last few years the
brunt of the financial losses have
been fully borne by Spescom –
due to its 51% shareholding. The
returns for the first half of the
year under review exemplify the
situation. Moreover, the ongoing
cost of going to market and
providing the required level of
financial support for a US$
operation from a Rand-based
concern is punitive. This has
necessitated the raising of
expensive short-term funds from
US sources.
The resultant dilution of Spescom’s
interest in this enterprise – bringing
it below 51% – has brought about
the decision not to consolidate the
Group’s investment in Spescom
Software Inc. This can be viewed as
the first step in Spescom’s tactical
plan to find a powerful equity
partner to broaden Spescom
Software’s marketing footprint.
This opens up a possibility of new
structures to bring in the necessary
strategic ownership by leaders in
the market.
The profits arising on the minority
interest, due to the restructuring of this
offshore investment, have positively
affected headline earnings per share.
The Group has taken a conservative
view in writing off loans owed to it
by Spescom Software Inc.
BLACK ECONOMIC
EMPOWERMENT
Spescom continues to prioritise its
BEE programmes.
From an equity perspective the
Group’s BEE standing is high, with
25,4% of Spescom Limited being
owned by Vantage Capital – a
majority black owned venture
capital concern. Moreover, 40% of
Spescom Telecommunications is
held by wholly black owned
Puisano Telecommunications.
The Group is already actively
pursuing plans to upgrade its
empowerment status in all areas
and in this regard has
commissioned a BEE audit in order
to highlight where improvements
can be effected.
PROSPECTS
Business is cyclical in nature. It is
affected by market conditions and
the prevailing economic climate.
Companies go through a well-
defined life-cycle pattern which
includes a peak and trough
scenario.
Earlier this year one of the South
Africa’s major daily newspapers –
Business Report National,
March 7, 2005 – took a
retrospective look at the
Johannesburg Stock Exchange
and examined the listings over the
past ten years.
The first time the stocks page was
published in Business Report,
there were 638 listings. Ten years
later, the number had shrunk by a
staggering 37% to 400.
Only 60 of the companies currently
listed on today’s exchange
survived the decade.
Spescom is cited as one of those
enduring names.
Spe
scom
ann
ual r
epor
t 20
05
11
Chief Executive Officer’s Report
Spescom is an interesting enterprise
that has prevailed in the face of ups
and downs in the IT industry. It is a
company that boasts many
technological world firsts.
It has always been the company to
watch – this has been shown time
and again since its listing in 1987.
Spescom is entering a new cycle
in its history focused, aggressive,
highly ambitious and intent on
unlocking the inherent value of the
company.
The business targets for the next
two to three years are ambitious.
The Group intends to take a
forceful lead in the core business
areas of the ICT sector. In doing
this Spescom will explore
acquisitions in order to accomplish
its strategic objectives.
Spescom will continue to focus on
content management and is actively
strengthening the application side of
its technology offerings.
The main emphasis will be on
telecommunications and voice.
In the telecommunications sector
opportunities are expected to come
on line in 2006. However, the results
of this may not become apparent
until the 2007 financial year.
Voice is recognised as a key
technology driver in 21st century
business. Spescom is a leader in
this field, as evidenced by the
global achievements already on
record, including the world’s first
speaker verification technology and
other applied applications in this
field. The company’s
understanding of this market
sector is formidable.
Business is increasingly conducted
on the move, with the demands on
customer service levels growing
exponentially. Contact centres,
voice recording, speaker
recognition and performance
management assessment – for
both customer service and legal
requirements – denote voice as a
major technology mover.
The contact centre business
continues to grow with the world
trend towards offshoring holding
great potential. Market research
houses have indicated that India’s
grip on this market is decreasing,
which in turn will provide
opportunity for South Africa.
The reality of the convergence and
synergy of contact centre and
voice technologies is unassailable.
Spescom is exceptionally placed
to benefit from these trends.
Spescom Media IT is well
positioned to take advantage of
the opportunities that will emanate
from the awarding of the soccer
World Cup in 2010.
In any country the business
landscape changes all the time.
One of the most important
changes in the history of South
African business is imminent –
namely the opening up of the
telecommunications arena through
the introduction of competition.
Telecoms is acknowledged as a
growth enabler in all sectors of any
economy.
From Spescom’s perspective, the
company is well placed, with its
product and service profile and
strategic planning, to capitalise on
the opportunities expected to
emanate from the expected new
phase of the SA business
environment.
Tony Farah
Chief Executive Officer
Spe
scom
ann
ual r
epor
t 20
05
12

Corporate Governance
Corporate governance may be
defined as the guardianship of a
company’s standards of integrity
and dedication to the interests of
all stakeholders, including investors,
customers and staff.
It is an intricate and diverse subject
composed of an anthology of
ideologies. Moreover, good
governance is far more complex
than the mere confines of statutory
compliance. It should encompass
active concern for a company’s
strategy and how it is implemented.
Global market research indicates
that companies reflecting
transparency of dealings,
augmented by good governance
practices, show a stronger
investment profile. Therefore, it can
be said that success in the
modern business environment is
inextricably linked to the
implementation of sound
governance procedures.
Spescom’s approach to corporate
governance is founded on six
fundamental principles, namely:
accountability, transparency,
responsibility, independence, fairness
and corporate social development.
These principles serve to boost
Spescom’s existing strong set of
values and business ethics, as
detailed in the company ethos.
The Spescom Group is committed
to adhering to the doctrines of
good governance as detailed in the
King Report on Corporate
Governance for South Africa
2002 (hereafter referred to as “the
King Report”).
The Spescom Board continually
strives to adhere to these values
and applies them in decision
making processes as well as all
aspects of its business dealings.
The Board of Directors is satisfied
that the correct systems are in
Spe
scom
ann
ual r
epor
t 20
05
13
“Organisations endure, however, in proportionto the breadth of the morality by which theyare governed. Thus the endurance of anorganisation depends upon the quality ofleadership; and that quality derives from thebreadth of the morality upon which it rests.”Chester Irving Barnard (1886 – 1961)
American business executive, public administrator and sociological theorist
Nyeleti MagadzeCompany Secretary
Corporate Governance
place to practise and improve the
principles of good corporate
governance within the Group.
BOARD OF DIRECTORS
The Spescom Board Charter
defines the parameters of
interaction for the Board. It is a
comprehensive policy document
the contents of which clearly define
the Board ethos, its constitution,
the roles of the Chairman, CEO,
and the appointment of directors.
The Charter also details the
responsibilities of the Audit
Committee.
The establishment of a charter is a
King Report requirement as well as
a recommendation of the JSE. The
full Charter may be viewed on the
Spescom website by clicking on
the appropriate link.
The Board structure and
composition has been devised in
accordance with the dictates of the
King Report and JSE Listings
Requirements and predominantly
consists of non-executive
directors. The composition
guarantees a balance of power
and circumvents dominance, by
any individual, in decision making
processes.
Non-executive directors are
selected for the broad base of
knowledge and experience that
they bring to the Board.
As reported in the previous financial
year, and in accordance with the
JSE Listings Requirements and the
King Report recommendations, the
roles of CEO and Chairman have
been divided.
Non-executive directors:
• Mr M Mogase
• Mr P Vallet
• Mr C Rezek (alternate non-
executive director to
Mr M Mogase)
Independent non-executive
directors:
• Ms L Ogilvy
• Mr W Kansteiner
• Dr J Myers
During the period under review, the
Remuneration Committee adopted
a decision to institute service
contracts for executive directors.
At the expense of the company,
directors may also seek counsel
from independent professionals,
when required. The Company
Secretary acts in an advisory
capacity to the Board.
Board members are compelled to
declare their interests in material
contracts regarding the Group.
This serves to negate conflicts of
interests. These include
shareholdings in Spescom and
other directorships. Where
necessary, it is mandatory for
Board members to excuse
themselves from involvement in
discussions or decisions that could
be influenced by vested interests.
The table on page 15 details
Board meeting attendance by
Spescom directors, for the period
under review, noting both
resignations of previous, and
appointment of new members.
Directors are subject to retirement
by rotation and re-election by
shareholders at least once every
three years in accordance with
Article 13.1 of Spescom’s Articles
of Association.
Appointment of Directors
During the period under review, the
Board resolved to reinstate a
dedicated nomination committee
tasked with the selection of
appropriately skilled and
experienced Board members. The
purpose of the Nomination
Committee is to evaluate the
structure and composition of the
Board and appoint members in
accordance with company
requirements, current trends and
business climate. The Committee
Spe
scom
ann
ual r
epor
t 20
05
14

Corporate Governance
Spe
scom
ann
ual r
epor
t 20
05
15
Board Meetings
1 October 2004 – 30 September 2005
During the past financial year, the Board has met on six occasions. Attendance of directors at Board meetings for
the period under review was as follows:
08/10/04 12/11/04 11/03/05 24/05/05 12/08/05 20/09/05
Special Special
Directors’ Directors’ Directors’ Directors’ Directors’ Directors’
Meeting Meeting Meeting Meeting Meeting Meeting
Executive Directors
A Farah P2 P P P P P
H Isaacman P2 P P P P P
C Mostert P2 A A1 A1 A1 A1
J Palmer P2 P A P P P
Non-Executive Directors
J Myers (Chairman) P P P P P P
W Kansteiner A P P2 P P2 A
M Mogase A P P P A P
C Rezek (Alt) P P P A P P
L Ogilvy P2 P P P P P2
P Vallet P2 P P P P P
1 C Mostert resigned from the Board on 1 March 20052 Attended by teleconference
A = Absent
P = Present
R = Recused
Corporate Governance
serves to ensure that the presence
of a self-perpetuating board is
avoided. The Committee is made
up of executive and non-executive
directors to ensure a balance of
technical and financial expertise.
Members of the Nomination
Committee:
• Mr A Farah
• Ms J Palmer
• Dr J Myers
• Mr M Mogase
During the past financial year, the
Nomination Committee has met
once to review the composition of
the Board.
Members 28/09/2005
J Myers (Chairperson) P
M Mogase P
J Palmer P
A Farah P
P = Present
REMUNERATION COMMITTEE
Remuneration
Philosophy/Policies
Remuneration polices are devised
in accordance with trends and the
prevailing business climate. They
are designed to attract and retain
highly skilled and experienced
individuals from the ICT industry
for appointment to all levels within
the Group.
The main function of the
Remuneration Committee is to
formulate policies that concur with
the Group’s strategic aims. The
Committee devises appropriate
salaries and benefits for senior
management and executives, in
accordance with industry standards
and shareholder interests.
The Committee is chaired by
independent non-executive director,
Ms L Ogilvy and is wholly made up
of non-executive directors.
Remuneration Committee
Meetings
1 October 2004 – 30 September
2005
The Remuneration Committee
convened on two occasions during
the period under review and
attendance was as follows:
12/11 12/08
Members 2004 2005
L Ogilvy
(Chairperson) P P
P Vallet P P
P = Present
Spescom Group CEO, Mr A Farah
and the Group Human Resources
Manager, Mrs C Lamprecht attend
committee meetings by invitation
only. Mr Farah does not partake in
resolutions regarding his
remuneration package.
The Committee safeguards the
interests of stakeholders by
collaborating with the Spescom
Share Trust to match the share
incentive scheme with the JSE
Listings Requirements, the King
Report and current developments.
At the Annual General Meeting on
April 1, 2005, shareholders approved
an amendment to the share incentive
scheme whereby share options are
considered part of the remuneration
package for directors and
employees. The allocation of share
options to staff is discussed and
approved by the Board and Trustees
of the share incentive scheme. The
Trustees are independent individuals
who are not directors or beneficiaries
of the scheme.
The Committee has defined and
agreed its terms of reference,
which are regularly re-evaluated
and adjusted when necessary, and
then referred to the Board for
approval. Directors’ emoluments
are referred to in detail on page 67.
The Chairperson of the Remuneration
Committee attends the Annual
General Meeting and responds to
queries from shareholders.
AUDIT COMMITTEE
During the period under review,
Spescom’s Audit Committee was
Spe
scom
ann
ual r
epor
t 20
05
16
Corporate Governance
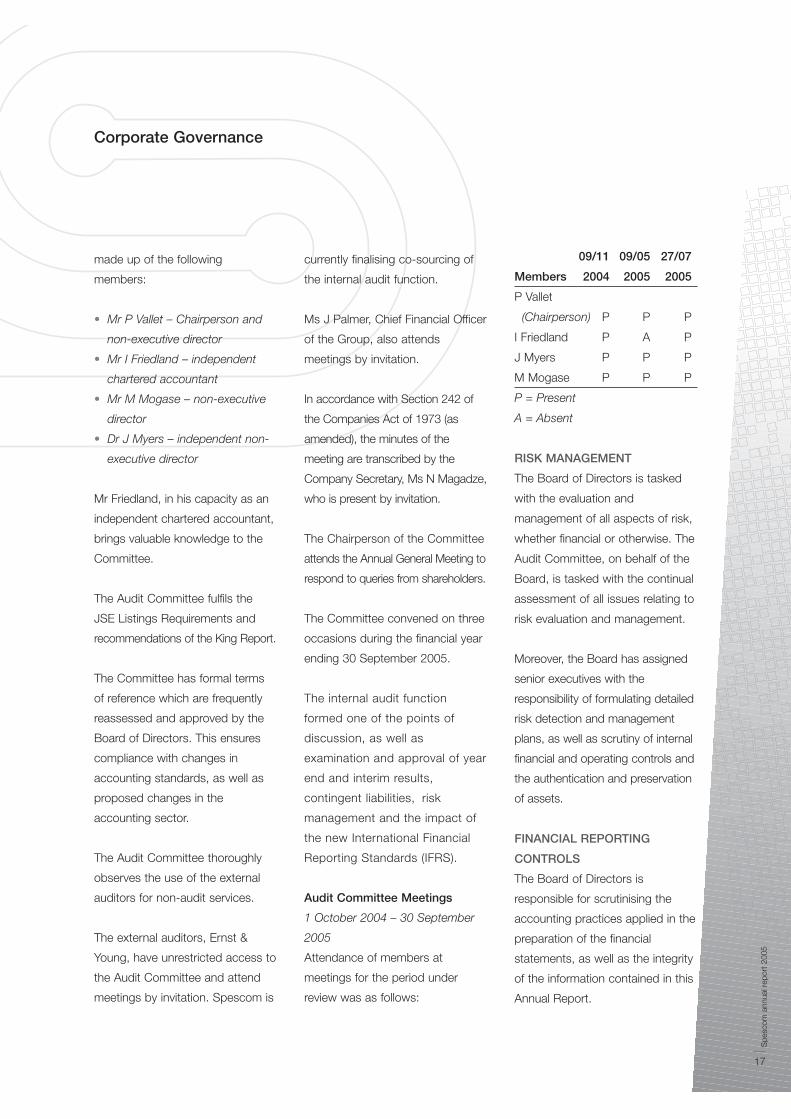
made up of the following
members:
• Mr P Vallet – Chairperson and
non-executive director
• Mr I Friedland – independent
chartered accountant
• Mr M Mogase – non-executive
director
• Dr J Myers – independent non-
executive director
Mr Friedland, in his capacity as an
independent chartered accountant,
brings valuable knowledge to the
Committee.
The Audit Committee fulfils the
JSE Listings Requirements and
recommendations of the King Report.
The Committee has formal terms
of reference which are frequently
reassessed and approved by the
Board of Directors. This ensures
compliance with changes in
accounting standards, as well as
proposed changes in the
accounting sector.
The Audit Committee thoroughly
observes the use of the external
auditors for non-audit services.
The external auditors, Ernst &
Young, have unrestricted access to
the Audit Committee and attend
meetings by invitation. Spescom is
currently finalising co-sourcing of
the internal audit function.
Ms J Palmer, Chief Financial Officer
of the Group, also attends
meetings by invitation.
In accordance with Section 242 of
the Companies Act of 1973 (as
amended), the minutes of the
meeting are transcribed by the
Company Secretary, Ms N Magadze,
who is present by invitation.
The Chairperson of the Committee
attends the Annual General Meeting to
respond to queries from shareholders.
The Committee convened on three
occasions during the financial year
ending 30 September 2005.
The internal audit function
formed one of the points of
discussion, as well as
examination and approval of year
end and interim results,
contingent liabilities, risk
management and the impact of
the new International Financial
Reporting Standards (IFRS).
Audit Committee Meetings
1 October 2004 – 30 September
2005
Attendance of members at
meetings for the period under
review was as follows:
09/11 09/05 27/07
Members 2004 2005 2005
P Vallet
(Chairperson) P P P
I Friedland P A P
J Myers P P P
M Mogase P P P
P = Present
A = Absent
RISK MANAGEMENT
The Board of Directors is tasked
with the evaluation and
management of all aspects of risk,
whether financial or otherwise. The
Audit Committee, on behalf of the
Board, is tasked with the continual
assessment of all issues relating to
risk evaluation and management.
Moreover, the Board has assigned
senior executives with the
responsibility of formulating detailed
risk detection and management
plans, as well as scrutiny of internal
financial and operating controls and
the authentication and preservation
of assets.
FINANCIAL REPORTING
CONTROLS
The Board of Directors is
responsible for scrutinising the
accounting practices applied in the
preparation of the financial
statements, as well as the integrity
of the information contained in this
Annual Report.
Spe
scom
ann
ual r
epor
t 20
05
17

Corporate Governance
The independent auditors endorse
the accuracy of the financial
statements and certify that they
properly reflect the financial
position, results of operations,
cash flow and changes in
Spescom equity.
Financial statements have been
drawn up in concurrence with
South African Statements of
Generally Accepted Accounting
Practices and include feasible and
sensible accounting
approximations and judgements,
except where otherwise stated.
THE ROLE OF THE COMPANY
SECRETARY
Ms N Magadze, the Spescom
Group Company Secretary, was
appointed by the Board on
11 March 2005. Ms Magadze is a
qualified and admitted attorney.
The Company Secretary is tasked
with offering counsel and assistance
to the Board, individually or
collectively, on all matters relating to
their responsibilities and powers.
The Company Secretary is also
responsible for providing training to
new directors regarding the Group’s
core business activities, ethics and
corporate governance policies.
Furthermore, the Company
Secretary assists in the recognition
and management of risk, provides
the foundation for ongoing legislative
compliance and is required to report
failures in this regard to stakeholders
and the Board.
Ms Magadze fulfils the functions
set out in Section 268G of the
Companies Act of 1973 (as
amended) and records the minutes
of shareholder meetings, directors’
meetings and Audit Committee
meetings in accordance with
Section 242 of the Companies Act
of 1973 (as amended).
INFORMING STAKEHOLDERS
Corporate communications
procedures and disclosure policies
are in place to ensure transparent
communication with the media,
institutional investors, stakeholders
and staff.
Continuous updates are conveyed to
institutional, domestic and
international shareholders, fund and
asset managers and financial analysts
through investor road shows,
presentations and one on one liaison.
Annual General Meetings
provide shareholders with a
platform for participation in
significant and proactive
discussion and debate with the
Board. Accordingly, shareholders
are encouraged to attend.
The Spescom Group operates
closed periods as set out in the
JSE Listings Requirements. These
closed periods are communicated
to directors, officers, members of
the Spescom Limited Share Trust
and employees, via email, intranet
and corporate policy documents
available in hard copy. During
closed periods, directors, officers,
participants in the share incentive
scheme and staff may not trade in
Spescom securities. Further closed
periods are imposed, when
necessary, in terms of corporate
activities.
A written policy is also in place that
regulates securities dealings by
Spescom’s directors and other
officers. The policy is in line with
the JSE Listings Requirements and
forms part of the Group’s ISO9001
quality system.
DEMATERIALISATION OF
SHARES
Shareholders must convert all share
certificates into an electronic record
before they may be traded and
settled on the JSE. This is achieved
via STRATE, the electronic
settlement system for securities on
the JSE (dematerialisation).
Shareholders who do not have a
Central Securities Depository
Participant (CSDP) or broker may
Spe
scom
ann
ual r
epor
t 20
05
18
Corporate Governance
contact STRATE Share Care Line
on 0800 202 363 or contact
Computershare Investor Services
2004 (Pty) Limited on
011 370 5000 for assistance.
SPESCOM’S TRIPLE BOTTOM
LINE APPROACH
PEOPLE PLANET PROFIT
The Spescom Group adheres to a
triple bottom line philosophy that
continuously assesses the effects
of its activities on people, the
environment and financial gain.
The three Ps are systems within
themselves and cannot be
evaluated or changed in isolation.
Spescom’s Greatest Asset
– Its People
The Group is committed to
providing a fair and balanced
working environment for all levels
of staff.
Spescom is an equal
opportunities employer and is
steadfast in its recruitment,
training, and development of
employees regardless of race,
creed, or sex.
The Employment Equity
Committee, in co-operation with
the Board, surveys affirmative
action legislative requirements and
trends in this arena.
Employment Equity
Spescom is committed to its
Employment Equity programmes
aimed at satisfying requirements of
the Employment Equity Act and
the Broad Based Black Economic
Empowerment Act. This is evident
in the implementation of
comprehensive employment
initiatives that are continually
evaluated to ensure compliance
with legislative criteria and
relevance to employees.
These policies outline the
Group’s aims in the equity arena
and detail strategies to support
and motivate the development
and career advancement of all
staff members, particularly those
from historically disadvantaged
groups.
Employment equity and
transformation policies are
reviewed and executed by
Spescom’s Employment Equity
and Black Economic Forum in
conjunction with a dedicated
manager in this arena.
Skills Development
Spescom’s employment policies
tackle issues such as skills
shortages and past inequalities.
They include a separate budget
over and above operating costs for
skills development.
The policies exist to ensure staff
members are educated,
encouraged and developed with a
view to personal empowerment,
realising career potential and
capitalising on opportunities.
Training needs are evaluated
annually as part of an internal skills
development programme.
Spescom complies fully with the
Skills Development Act (as
amended) and the Skills
Development Levies Act.
Health Policies
The Spescom Group meets the
terms of South Africa’s
Occupational Health and Safety
Act of 1993, as amended.
The Group is committed to the
support and maintenance of good
health for all staff members.
An HIV/AIDS management policy
exists to ensure that the rights and
dignity of employees are safeguarded.
The policy encompasses Spescom’s
responsibilities in this arena and
details interaction guidelines for staff
diagnosed with life threatening
diseases.
Black Economic Empowerment
The road to true transformation lies
in empowerment and enablement.
Spe
scom
ann
ual r
epor
t 20
05
19

Corporate Governance
Spescom’s BEE philosophy is built
on four main pillars that support
these themes, namely:
shareholding, employment equity,
procurement and social
responsibility.
Shareholding with
Representation
Spescom’s commitment to BEE
endeavours in the ICT industry is
evidenced by the fact that
historically disadvantaged
individuals own 31,42% of the
Group.
Employment Equity
Policies exist to guide the
selection, development and
retention of all staff.
Procurement
Constantly evolving policies exist
that aid Spescom in achieving its
aims in the areas of affirmative
procurement and retention of high
quality black professionals. These
policies also focus on the use of
BEE subcontractors.
Social Responsibility
Spescom is dedicated to
community development and
upliftment. The Leseding
Electronics Investment Trust is an
equity sharing programme that
sees historically disadvantaged
employees owning 90% of the
trust with Spescom holding the
remaining 10%.
Spescom’s commitment to BEE is
further evidenced by the fact that
the company has commissioned a
BEE audit in order to highlight
areas where improvements can be
implemented.
STRATE Charity Shares Initiative
This initiative seeks to allocate the
proceeds from donated cash and
shares to various charitable
organisations.
Shareholders wishing to contribute
to the scheme can contact
STRATE Charity Shares Toll Free
on 0800 202 363 (+27 11 870 8207
if outside SA) or on
SOCIAL AND ENVIRONMENTAL
RESPONSIBILITY
Spescom’s commitment to the
community and the larger
environment is clear in its definitive
and sustained education initiatives.
Through education Spescom
endeavours to uplift and develop
the community with a view to
utilising technology as the enabler.
The Group is engaged in various
science, technology and
management programmes that
focus on enhancing the national
skills base and addressing the IT
skills shortage.
These initiatives include a
programme at the University of the
Witwatersrand Graduate School of
Business and scholarship
sponsorship for second year
Computer Science students from
previously disadvantaged
communities.
Spe
scom
ann
ual r
epor
t 20
05
20

Spe
scom
ann
ual r
epor
t 20
05
21
Annual Financial Statements
Report of the Independent Auditors 22
Directors’ Report 23 – 27
Income Statements 28
Balance Sheets 29
Statements of Changes in Equity 30
Cash Flow Statements 31
Notes to the Cash Flow Statements 32
Notes to the Financial Statements 33 – 62
Subsidiary Companies 63
Joint Ventures 64
Segmental Reports 65 – 66
Directors’ Remuneration 67
Directors’ Share Options 68 – 69
Jené Palmer
Chief Financial Officer

Spe
scom
ann
ual r
epor
t 20
05
22
Report of the Independent Auditors
TO THE MEMBERS OF SPESCOM LIMITED
We have audited the annual financial statements and Group annual financial statements of Spescom Limited set out
on pages 23 to 69 for the year ended 30 September 2005. These financial statements are the responsibility of the
company’s directors. Our responsibility is to express an opinion on these financial statements based on our audit.
SCOPE
We conducted our audit in accordance with statements of South African Auditing Standards. Those standards
require that we plan and perform the audit to obtain reasonable assurance that the financial statements are free of
material misstatement. An audit includes:
• examining, on a test basis, evidence supporting the amounts and disclosures in the financial statements
• assessing the accounting principles used and significant estimates made by management
• evaluating the overall financial statement presentation
We believe that our audit provides a reasonable basis for our opinion.
AUDIT OPINION
In our opinion, the financial statements fairly present, in all material respects, the financial position of the company
and the Group at 30 September 2005 and the results of their operations, cash flows and changes in equity for the
year then ended in accordance with South African Statements of Generally Accepted Accounting Practice, and in
the manner required by the Companies Act in South Africa.
ERNST & YOUNG
Chartered Accountants (S.A.)
Johannesburg
27 January 2006

Spe
scom
ann
ual r
epor
t 20
05
23
Directors’ Reportfor the year ended 30 September 2005
Your directors have pleasure in submitting their report together with the annual financial statements of SpescomLimited (“Spescom” or “the company”) and of the Spescom Group for the year ended 30 September 2005.
NATURE OF BUSINESS
Spescom, a Proudly South African group of companies, is a multi-national technology innovator with directoperations in the United States, United Kingdom and South Africa. The Group is publicly listed on the JSE Limited(Spescom Limited) and Spescom Software Inc., an associate company is listed on the NASDAQ OTCBB:SPCO.OB.
Spescom is an information and communications technology group focused on various aspects of enterprise contentmanagement. The Group provides products and solutions to connect to the networked economy, as well asenterprise software to manage information and knowledge. Spescom successfully competes in a crowded globalICT (Information and Communication Technology) marketplace due to its innovative and entrepreneurial businessapproach, coupled with its leading proprietary technology and products.
Spescom markets its products worldwide through appointed partners and distributors under the eB brand for itsenterprise software, and the DataVoice brand for its multimedia transaction recording solutions. The Group’s globalcustomer base consists of multi-national organisations including leading enterprises in utilities, telecommunications,transportation, financial, banking and insurance.
OVERVIEW OF RESULTSSpescom reflects a headline earnings profit of R26,2 million which translates into 36,1 cents per share for the yearas compared to 63,5 cents per share for the comparative year.
After taking into account the non-trading items and the write off of all offshore loans owing to the Group, Spescomreports a loss for the year of R3,4 million as compared to a profit of R29,4 million for the previous year.
It is rewarding to note, however, that the operating results for the second six months of the year reflect a vastimprovement on those of the first half.
During the year under review, the Group restructured its shareholding in its US operation, Spescom Software Inc.,facilitating external financing and permitting the redeployment of critical resources. This opens up a possibility ofnew structures to bring in the necessary strategic ownership by leaders in the market. This restructuring hasresulted in this investment now being accounted for as an associate company and being equity accounted witheffect 1 April 2005. The effect of this change in holding from a subsidiary to an associate company resulted in achange in holding of profit of R52,6 million.
Spescom’s reduced turnover can be mainly attributed to:
– equity accounting instead of consolidating the US operation– completion of major international telecommunications contracts with British Telecoms (BT) and delays in the
awarding of replacement business– discontinuation of non-core test and measurement activities– continued delays in the full deregulation of the telecommunications sector in South Africa
The gearing levels of the Group remain satisfactory and largely unchanged. Subsequent to year end, the Group hasmade further debt repayments.
Spescom is entering a new cycle in its history. The Group intends to take a forceful lead in core business areas ofthe ICT sector. This includes considering all the opportunities for growth, such as exploring acquisitions, in order toaccomplish its strategic objectives.
Spe
scom
ann
ual r
epor
t 20
05
24
Directors’ Reportfor the year ended 30 September 2005
Spescom will continue to focus on content management and is actively strengthening the application side of itstechnology offerings. The main emphasis will be on telecommunications and voice.
Internationally, Spescom remains focused on the globalisation of its own products and technology. In support ofthese objectives Spescom increased its global footprint by breaking into Middle Eastern markets.
The telecommunications industry continues to be characterised by delays and uncertainties. However, it isanticipated that the landscape will change significantly over the next year revealing above average growth, for whichthe Group is well positioned. The ongoing momentum of this transformation is expected to be realised in the 2007financial year.
The contact centre business continues to grow with the world trend towards offshoring, holding great potential asIndia’s grip on this market lessens, providing opportunities for South Africa.
The reality of convergence and synergy of contact centre and voice technologies is unassailable. Spescom is wellplaced to take advantage of these trends.
FINANCIAL RESULTS
The financial results of the company and the Group are fully disclosed on pages 28 to 69.
DIVIDENDS
Due to Spescom’s position in the dynamic ICT arena, and taking into consideration trends for similar companies inthis rapidly changing sector, the directors have resolved not to declare a dividend for the financial year under review.This will provide additional funds to position Spescom to take advantage of local acquisition opportunities, marketchanges as well as to finance globalisation plans.
SUBSIDIARIES
During the year under review, the Group’s US operation successfully raised US$2,2 million in cash by way of aprivate placement of convertible preference shares. The issuance of these shares diluted the Group’s interest inSpescom Software Inc. from 51% to 42,6% and consequently required that the Group’s investment in SpescomSoftware Inc. no longer be accounted for as a subsidiary. As the Group still has significant influence over thisoperation, Spescom Software Inc. with effect 1 April 2005 is being treated as an associate company and has beenequity accounted from that date.
Details of the company’s interest in its subsidiaries, including the aggregate profits and losses of these subsidiaries,are set out on page 63.
DIRECTORS AND SECRETARY
Mrs N Magadze succeeded Mr AG Johnston as company secretary on 11 March 2005. Mr AG Johnston resignedfrom the company and as company secretary with effect 15 February 2005. Mrs N Magadze’s business and postaladdresses appear on page 76 of this annual report.
The directors of the company during the period under review and up to the date of this annual report are set out onpages 4 and 5 respectively.
The following changes were made to the composition of the board of directors.
Executive appointmentsT Makore 21 October 2005
ResignationsC Mostert 1 March 2005H Isaacman 21 October 2005

Spe
scom
ann
ual r
epor
t 20
05
25
Directors’ Reportfor the year ended 30 September 2005
In line with the recommendations of King II, the Spescom Board is currently constituted by more non-executive
directors than executive directors and the roles of Chairperson and Chief Executive Officer continue to be separated.
Details of the directors’ emoluments and benefits as well as their participation in the Group’s share option schemes
are detailed on pages 67 to 69.
SHARE CAPITAL
Details of the company’s authorised and issued share capital appear in note 18 to the financial statements.
• Directors’ interest in shares
The beneficial interest of directors, directly and indirectly, in the share capital of the company at 30 September
2005 was:
DIRECT INDIRECT
Director Beneficial Non-beneficial Beneficial Non-beneficial Total
Number Number Number Number Number
A Farah 3 678 944 – 608 893 24 891 4 312 728
H Isaacman 521 674 – – 439 000 960 674
J Myers – – – – –
L Ogilvy – – – – –
J Palmer – – – – –
P Vallet – – – – –
M Mogase – – – – –
C Rezek – – – – –
W Kansteiner – – – – –
Total 4 200 618 – 608 893 463 891 5 273 402
The beneficial interest of directors, directly and indirectly, in the share capital of the company at 30 September
2004 was:
DIRECT INDIRECT
Director Beneficial Non-beneficial Beneficial Non-beneficial Total
Number Number Number Number Number
A Farah 515 594 – 3 588 870 14 531 4 118 995
H Isaacman 521 674 – – 439 000 960 674
C Mostert (resigned 1 March 2005) 134 122 – – – 134 122
J Myers – – – – –
L Ogilvy – – – – –
J Palmer – – – – –
P Vallet – – – – –
M Mogase – – – – –
C Rezek – – – – –
W Kansteiner – – – – –
Total 1 171 390 – 3 588 870 453 531 5 213 791

Spe
scom
ann
ual r
epor
t 20
05
26
Directors’ Reportfor the year ended 30 September 2005
No material changes in their holdings have taken place between balance sheet date and the date of this annual
report.
• Major shareholders
According to the register of shareholders at 30 September 2005, the following are the only shareholders/nominee
holdings, other than directors of the company as disclosed above, who hold in excess of 3% of the shareholding
of the company at that date.
Shareholder Number of shares % of total shareholding
Vantage Capital Fund Managers (Proprietary) Limited 20 000 000 25,4%
The Spescom Limited Share Trust 6 447 516 8,2%
Allan Gray Fund Managers (Proprietary) Limited 4 368 800 5,5%
Farah Anthony Family Trust 2 979 977 3,8%
Credit Suisse Zurich 2 717 712 3,5%
Total 36 514 005 46,4%
No non-public shareholders, other than directors, hold 10% or more of the issued share capital of the company
for the financial year under review (2004 – nil).
• Share analysis
2005 2004
% %
Non-public 40,3 39,5
Public (consisting of 2 561 shareholders (2004 – 2 697)) 59,7 60,5
100,0 100,0
• Shareholder spread
Number of Number of
Shares shareholders % shares %
1 – 1 000 1 066 41,3 425 392 0,5
1 001 – 10 000 1 047 40,6 4 565 906 5,8
10 001 – 100 000 386 14,9 12 634 600 16,1
100 001 – 1 000 000 72 2,8 22 392 424 28,4
1 000 001 and over 9 0,4 38 749 734 49,2
2 580 100,0 78 768 056 100,0
The above information was supplied by the company’s registrars.

Spe
scom
ann
ual r
epor
t 20
05
27
Directors’ Reportfor the year ended 30 September 2005
RESOLUTIONS
No special resolutions, the nature of which might be significant to shareholders in their appreciation of the state ofaffairs of the Group, were passed by any subsidiary companies during the period covered by this annual report.
MATERIAL EVENTS SUBSEQUENT TO THE 2005 FINANCIAL YEAR END
During October 2005, the Group’s US-based associate company, Spescom Software Inc., successfully raised US$500 000 through a private placement of shares with Mercator Advisory Group LLC and Monarch Pointe Fund LLC.
Subsequent to year end, the Group made further debt repayments of US$350 000 in respect of its foreign loanfacility as well as a further R1,75 million repayment of its local loan facilities.
The directors are not aware of any other facts or circumstances that took place between financial year end being30 September 2005 and the date of this annual report which would be of importance in assessing the Group’sstate of affairs.
APPROVAL OF ANNUAL FINANCIAL STATEMENTS
The financial statements set out in this annual report have been prepared in accordance with Statements ofGenerally Accepted Accounting Practice in South Africa and are based on appropriate accounting policies, whichare supported by reasonable and prudent judgements and estimates. These have been consistently applied.
The directors are responsible for the preparation of the financial statements and related financial information thatfairly presents the state of affairs and results of the company and Group.
These financial statements have been prepared on the going concern basis. This basis presumes that the assetswill be realised and the liabilities settled in the normal course of business.
The directors have every reason to believe that the company and the Group will be able to continue in operation forthe foreseeable future. Accordingly, no adjustments have been made to the valuation or classification of assets orliabilities, which may have been necessary if the Group had been unable to continue as a going concern.
The annual financial statements set out on pages 28 to 69 were approved by the Board of Directors on 27 January 2006and are signed on its behalf by:
A FARAH J PALMERChief Executive Officer Chief Financial Officer
27 January 2006
COMPANY SECRETARY’S STATEMENTI certify that the company has lodged with the Registrar of Companies all such returns as are required of a publiccompany in terms of section 268G(d) of the Companies' Act and that all such returns are true, correct and up to date.
N MAGADZECompany Secretary
27 January 2006

Spe
scom
ann
ual r
epor
t 20
05
28
Income Statementsfor the year ended 30 September 2005
NOTES GROUP COMPANY
2005 2004 2005 2004
(Restated)
R R R R
Revenue 2 223 466 630 356 517 227 – –
From continuing operations 212 823 776 316 268 227 – –
From discontinued operations 3 10 642 854 40 249 000 – –
Other income 2 9 920 589 13 420 758 5 695 812 7 084 640
Total revenue 233 387 219 369 937 985 5 695 812 7 084 640
Cost of sales 103 467 826 139 124 547 – –
From continuing operations 95 646 879 113 584 721 – –
From discontinued operations 3 7 820 947 25 539 826 – –
Gross profit 119 998 804 217 392 680 – –
From continuing operations 117 176 897 202 683 506 – –
From discontinued operations 3 2 821 907 14 709 174 – –
Expenses (143 942 186) (185 940 602) (3 903 612) (1 098 708)
Selling and general (138 018 131) (171 361 155) (3 903 612) (1 098 708)
Direct marketing (5 924 055) (14 579 447) – –
Operating (loss)/profit 4 (17 094 274) 41 730 325 (1 765 223) 3 258 862
From continuing operations (17 234 225) 40 918 999 (1 765 223) 3 258 862
From discontinued operations 3 139 951 811 326 – –
Amortisation of goodwill 5 – (6 485 248) – –
Finance charges 6 (4 727 529) (5 879 600) (5 535 007) (6 773 852)
Investment income 3 071 481 3 142 511 3 557 423 2 727 070
Net (loss)/profit before non-trading items (18 750 322) 32 507 988 (3 742 807) (787 920)
Non-trading items 7 (29 532 842) (1 522 907) (33 599 374) –
Net (loss)/profit before taxation (48 283 164) 30 985 081 (37 342 181) (787 920)
Taxation 8 (2 461 699) (1 682 331) – (2 337 705)
Net (loss)/profit after taxation (50 744 863) 29 302 750 (37 342 181) (3 125 625)
Loss from associate company (6 214 422) – – –
Attributable to minorities 53 513 124 100 264 – –
Net (loss)/profit for the year attributable to
holding company shareholders (3 446 161) 29 403 014 (37 342 181) (3 125 625)
Headline earnings per share (cents) 9 36,1 63,5
(Loss)/earnings per share (cents) 9 (4,8) 49,4
Diluted (loss)/earnings per share (cents) 9 (4,8) 49,4
Spe
scom
ann
ual r
epor
t 20
05
29
Balance Sheetsat 30 September 2005
NOTES GROUP COMPANY
2005 2004 2005 2004
(Restated)
R R R R
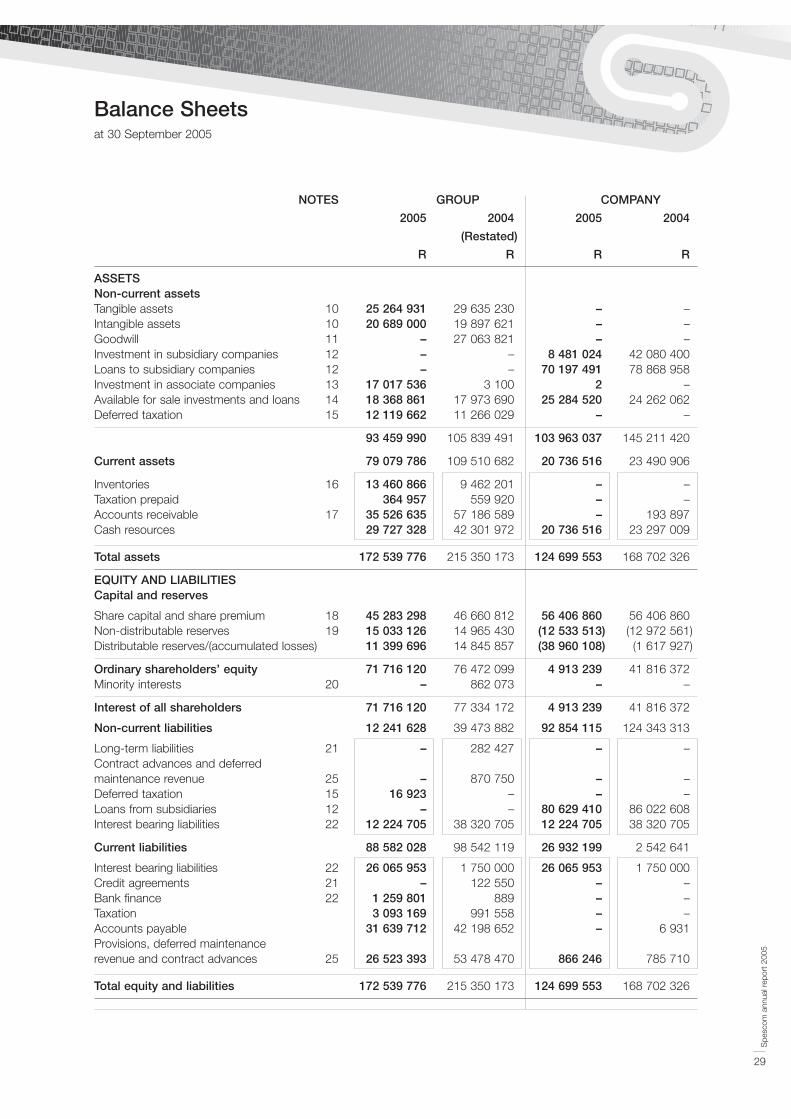
ASSETSNon-current assetsTangible assets 10 25 264 931 29 635 230 – –Intangible assets 10 20 689 000 19 897 621 – –Goodwill 11 – 27 063 821 – –Investment in subsidiary companies 12 – – 8 481 024 42 080 400Loans to subsidiary companies 12 – – 70 197 491 78 868 958Investment in associate companies 13 17 017 536 3 100 2 –Available for sale investments and loans 14 18 368 861 17 973 690 25 284 520 24 262 062Deferred taxation 15 12 119 662 11 266 029 – –
93 459 990 105 839 491 103 963 037 145 211 420
Current assets 79 079 786 109 510 682 20 736 516 23 490 906
Inventories 16 13 460 866 9 462 201 – –Taxation prepaid 364 957 559 920 – –Accounts receivable 17 35 526 635 57 186 589 – 193 897Cash resources 29 727 328 42 301 972 20 736 516 23 297 009
Total assets 172 539 776 215 350 173 124 699 553 168 702 326
EQUITY AND LIABILITIESCapital and reserves
Share capital and share premium 18 45 283 298 46 660 812 56 406 860 56 406 860Non-distributable reserves 19 15 033 126 14 965 430 (12 533 513) (12 972 561)Distributable reserves/(accumulated losses) 11 399 696 14 845 857 (38 960 108) (1 617 927)
Ordinary shareholders’ equity 71 716 120 76 472 099 4 913 239 41 816 372Minority interests 20 – 862 073 – –
Interest of all shareholders 71 716 120 77 334 172 4 913 239 41 816 372
Non-current liabilities 12 241 628 39 473 882 92 854 115 124 343 313
Long-term liabilities 21 – 282 427 – –Contract advances and deferred maintenance revenue 25 – 870 750 – –Deferred taxation 15 16 923 – – –Loans from subsidiaries 12 – – 80 629 410 86 022 608Interest bearing liabilities 22 12 224 705 38 320 705 12 224 705 38 320 705
Current liabilities 88 582 028 98 542 119 26 932 199 2 542 641
Interest bearing liabilities 22 26 065 953 1 750 000 26 065 953 1 750 000Credit agreements 21 – 122 550 – –Bank finance 22 1 259 801 889 – –Taxation 3 093 169 991 558 – –Accounts payable 31 639 712 42 198 652 – 6 931Provisions, deferred maintenance revenue and contract advances 25 26 523 393 53 478 470 866 246 785 710
Total equity and liabilities 172 539 776 215 350 173 124 699 553 168 702 326
Spe
scom
ann
ual r
epor
t 20
05
30
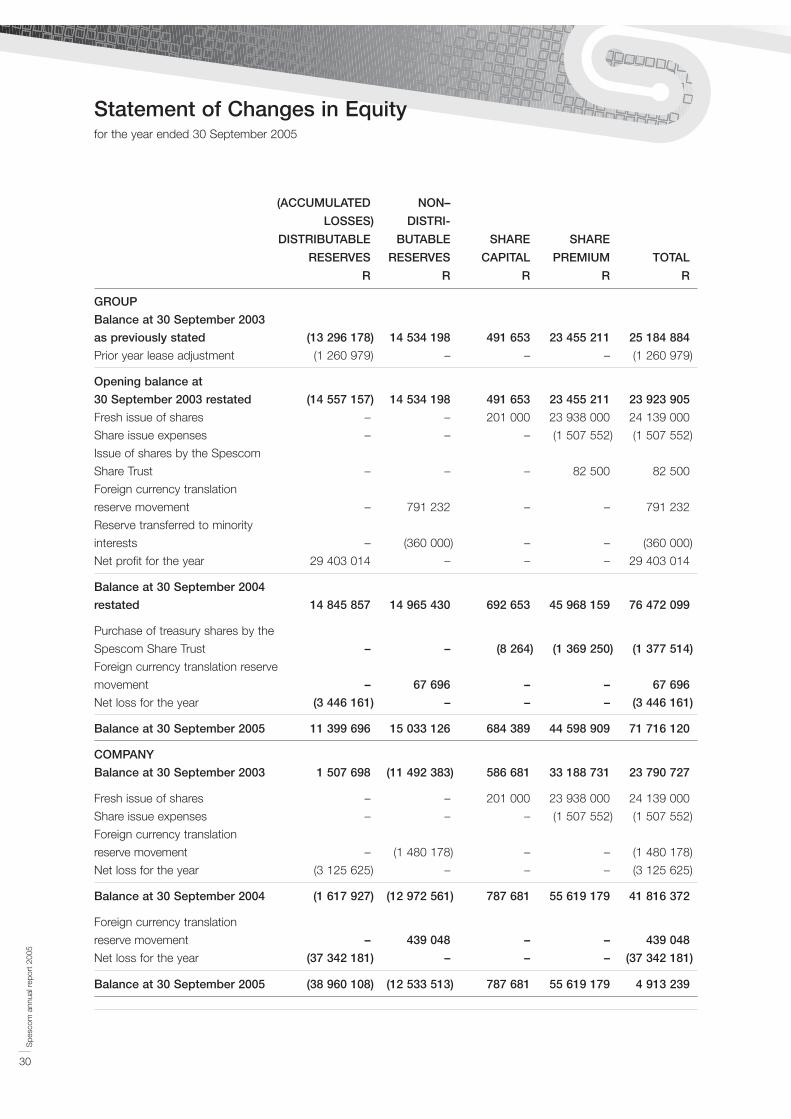
Statement of Changes in Equityfor the year ended 30 September 2005
(ACCUMULATED NON–
LOSSES) DISTRI-
DISTRIBUTABLE BUTABLE SHARE SHARE
RESERVES RESERVES CAPITAL PREMIUM TOTAL
R R R R R
GROUP
Balance at 30 September 2003
as previously stated (13 296 178) 14 534 198 491 653 23 455 211 25 184 884
Prior year lease adjustment (1 260 979) – – – (1 260 979)
Opening balance at
30 September 2003 restated (14 557 157) 14 534 198 491 653 23 455 211 23 923 905
Fresh issue of shares – – 201 000 23 938 000 24 139 000
Share issue expenses – – – (1 507 552) (1 507 552)
Issue of shares by the Spescom
Share Trust – – – 82 500 82 500
Foreign currency translation
reserve movement – 791 232 – – 791 232
Reserve transferred to minority
interests – (360 000) – – (360 000)
Net profit for the year 29 403 014 – – – 29 403 014
Balance at 30 September 2004
restated 14 845 857 14 965 430 692 653 45 968 159 76 472 099
Purchase of treasury shares by the
Spescom Share Trust – – (8 264) (1 369 250) (1 377 514)
Foreign currency translation reserve
movement – 67 696 – – 67 696
Net loss for the year (3 446 161) – – – (3 446 161)
Balance at 30 September 2005 11 399 696 15 033 126 684 389 44 598 909 71 716 120
COMPANY
Balance at 30 September 2003 1 507 698 (11 492 383) 586 681 33 188 731 23 790 727
Fresh issue of shares – – 201 000 23 938 000 24 139 000
Share issue expenses – – – (1 507 552) (1 507 552)
Foreign currency translation
reserve movement – (1 480 178) – – (1 480 178)
Net loss for the year (3 125 625) – – – (3 125 625)
Balance at 30 September 2004 (1 617 927) (12 972 561) 787 681 55 619 179 41 816 372
Foreign currency translation
reserve movement – 439 048 – – 439 048
Net loss for the year (37 342 181) – – – (37 342 181)
Balance at 30 September 2005 (38 960 108) (12 533 513) 787 681 55 619 179 4 913 239
Spe
scom
ann
ual r
epor
t 20
05
31
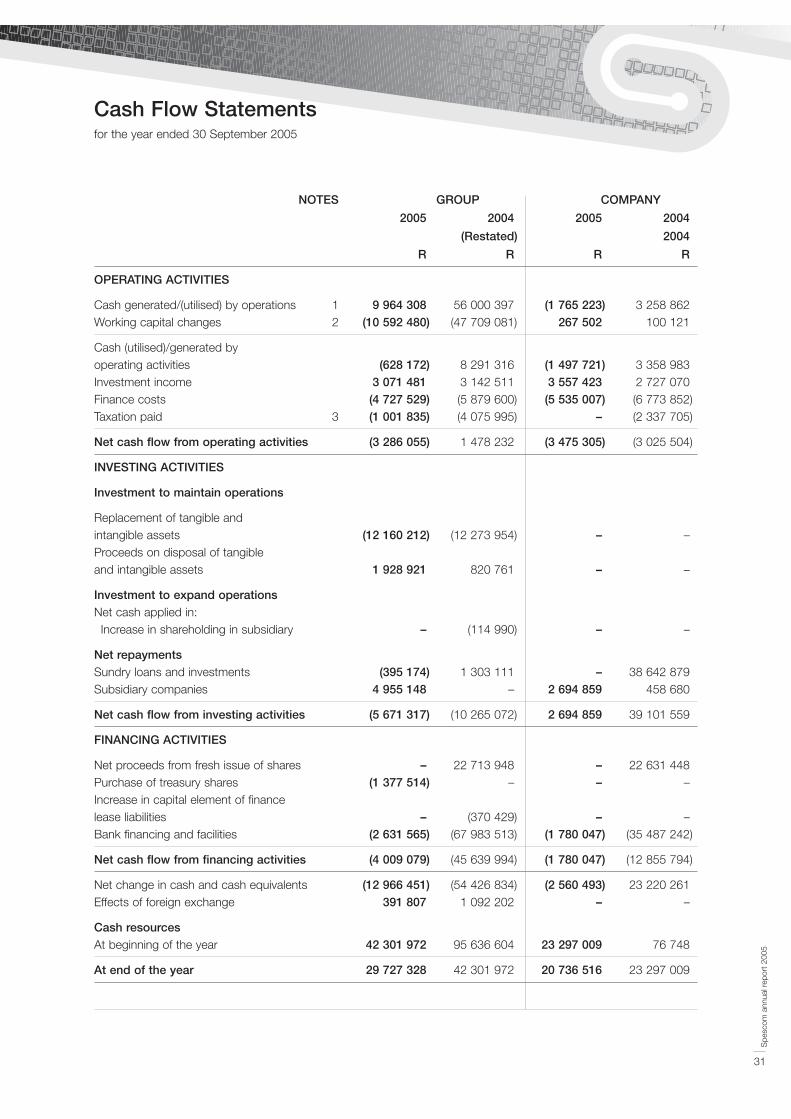
Cash Flow Statements for the year ended 30 September 2005
NOTES GROUP COMPANY
2005 2004 2005 2004
(Restated) 2004
R R R R
OPERATING ACTIVITIES
Cash generated/(utilised) by operations 1 9 964 308 56 000 397 (1 765 223) 3 258 862Working capital changes 2 (10 592 480) (47 709 081) 267 502 100 121
Cash (utilised)/generated by operating activities (628 172) 8 291 316 (1 497 721) 3 358 983Investment income 3 071 481 3 142 511 3 557 423 2 727 070Finance costs (4 727 529) (5 879 600) (5 535 007) (6 773 852)Taxation paid 3 (1 001 835) (4 075 995) – (2 337 705)
Net cash flow from operating activities (3 286 055) 1 478 232 (3 475 305) (3 025 504)
INVESTING ACTIVITIES
Investment to maintain operations
Replacement of tangible and intangible assets (12 160 212) (12 273 954) – –Proceeds on disposal of tangible and intangible assets 1 928 921 820 761 – –
Investment to expand operationsNet cash applied in:Increase in shareholding in subsidiary – (114 990) – –
Net repaymentsSundry loans and investments (395 174) 1 303 111 – 38 642 879Subsidiary companies 4 955 148 – 2 694 859 458 680
Net cash flow from investing activities (5 671 317) (10 265 072) 2 694 859 39 101 559
FINANCING ACTIVITIES
Net proceeds from fresh issue of shares – 22 713 948 – 22 631 448Purchase of treasury shares (1 377 514) – – –Increase in capital element of finance lease liabilities – (370 429) – –Bank financing and facilities (2 631 565) (67 983 513) (1 780 047) (35 487 242)
Net cash flow from financing activities (4 009 079) (45 639 994) (1 780 047) (12 855 794)
Net change in cash and cash equivalents (12 966 451) (54 426 834) (2 560 493) 23 220 261Effects of foreign exchange 391 807 1 092 202 – –
Cash resourcesAt beginning of the year 42 301 972 95 636 604 23 297 009 76 748
At end of the year 29 727 328 42 301 972 20 736 516 23 297 009
Spe
scom
ann
ual r
epor
t 20
05
32
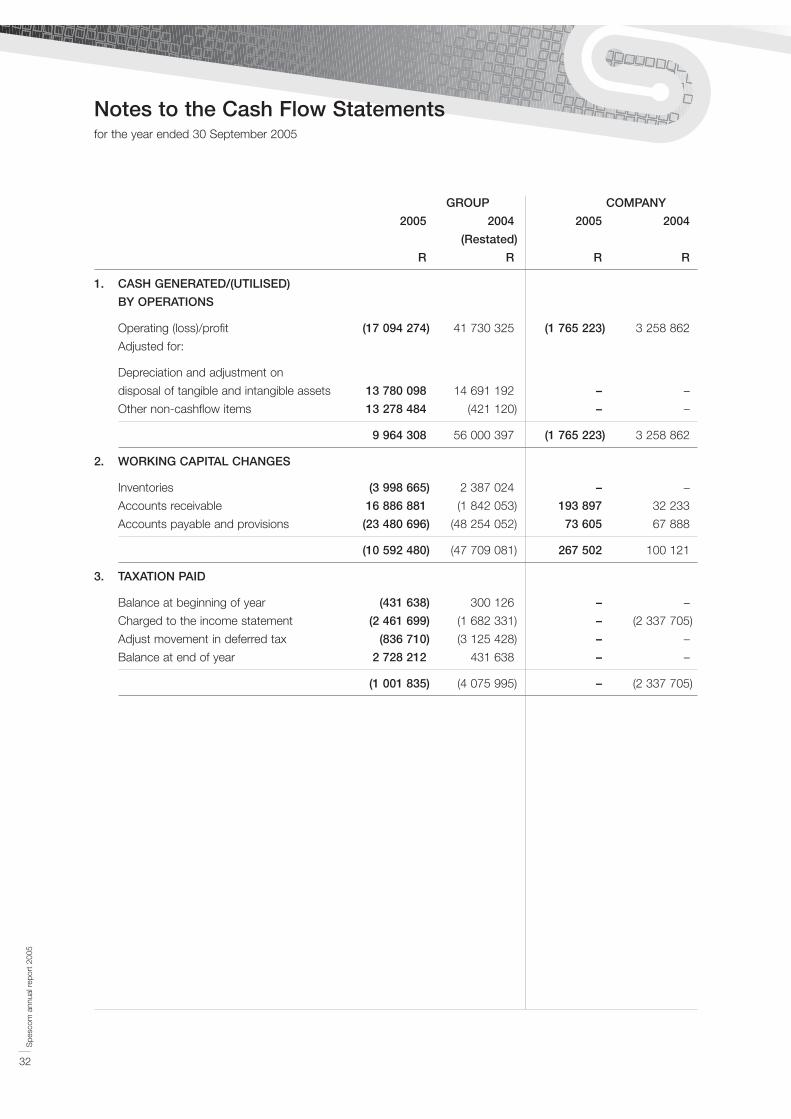
Notes to the Cash Flow Statementsfor the year ended 30 September 2005
GROUP COMPANY
2005 2004 2005 2004
(Restated)
R R R R
1. CASH GENERATED/(UTILISED)
BY OPERATIONS
Operating (loss)/profit (17 094 274) 41 730 325 (1 765 223) 3 258 862
Adjusted for:
Depreciation and adjustment on
disposal of tangible and intangible assets 13 780 098 14 691 192 – –
Other non-cashflow items 13 278 484 (421 120) – –
9 964 308 56 000 397 (1 765 223) 3 258 862
2. WORKING CAPITAL CHANGES
Inventories (3 998 665) 2 387 024 – –
Accounts receivable 16 886 881 (1 842 053) 193 897 32 233
Accounts payable and provisions (23 480 696) (48 254 052) 73 605 67 888
(10 592 480) (47 709 081) 267 502 100 121
3. TAXATION PAID
Balance at beginning of year (431 638) 300 126 – –
Charged to the income statement (2 461 699) (1 682 331) – (2 337 705)
Adjust movement in deferred tax (836 710) (3 125 428) – –
Balance at end of year 2 728 212 431 638 – –
(1 001 835) (4 075 995) – (2 337 705)
Spe
scom
ann
ual r
epor
t 20
05
33
Notes to the Financial Statementsat 30 September 2005
1. ACCOUNTING POLICIES
The financial statements are prepared on the historical cost basis, except where indicated otherwise, and
incorporate the following principal accounting policies which conform with South African Statements of
Generally Accepted Accounting Practice.
The Group’s measurement currency is South African Rand.
Changes in accounting policy
The accounting policies adopted are consistent with those adopted in the previous financial year, with the
exception of the adoption of AC 140/IFRS 3: Business Combinations, AC 128/IAS 36: Impairment of Assets
and AC 129/IAS 39: Intangible Assets.
The effective date of adopting these statements was for accounting periods beginning after 31 March 2004.
The principal effects of adopting the statements are discussed below.
AC 140 applies to business combinations for which the agreement date is on or after 31 March 2004. The
adoption of AC 140 has impacted on the recognition of restructuring provisions arising upon acquisition. The
Group is now only permitted to recognise an existing liability contained in the acquiree’s financial statements on
acquisition. Previously this type of restructuring provision could be recognised regardless of whether the
acquiree recognised this type of liability or not.
Further, upon acquisition, the Group initially measures the identifiable assets and liabilities acquired at their fair
values as at acquisition date hence causing any minority interest in the acquiree to be stated at the majority
proportion of the net fair values of those items.
Additionally, the adoption of AC 140 and AC 128 has resulted in the Group ceasing annual goodwill
amortisation. Goodwill is now tested for impairment annually at the cash generating unit level (unless an event
occurs during the year which requires goodwill to be tested more frequently) from 1 October 2004. The
transitional provisions of AC 140 required the Group to eliminate the carrying value of the accumulated
amortisation with a corresponding decrease in goodwill. The adoption of this statement resulted in goodwill
amortisation of R6,5 million ceasing.
Moreover, the useful life of intangible assets is now assessed at the individual asset level as having either a finite
or indefinite life. Where an intangible asset has a finite life, it has been amortised over its useful life. Amortisation
periods and methods for intangible assets with finite useful lives are viewed annually or earlier where an indicator
of impairment exists. Intangibles assessed as having indefinite useful lives are not amortised, as there is no
foreseeable limit to the period over which the asset is expected to generate net cash inflows for the Group.
However, intangibles with indefinite useful lives are reviewed annually to ensure the carrying value does not
exceed the recoverable amount regardless of whether an indicator of impairment is present.
Basis of consolidation
The Group financial statements incorporate the financial statements of the company, its subsidiaries,
proportionately consolidated joint ventures and equity accounted associates. The results of these entities are
included from effective dates of acquisition and up to the effective date control ceases. Profits and losses
arising on change of control are included in the income statement.
Unrealised income arising from transactions within the Group and inter-company balances and transactions are
eliminated in full in respect of subsidiaries and to the extent of the Group’s holding in joint ventures. Unrealised
losses are also eliminated, but only to the extent that they do not represent an impairment.
Spe
scom
ann
ual r
epor
t 20
05
34
Notes to the Financial Statementsat 30 September 2005
1. ACCOUNTING POLICIES (continued)
Basis of consolidation (continued)
Subsidiaries are defined as those companies in which the Group, either directly or indirectly, has more than one
half of the voting rights, has the right to appoint more than half the board of directors or otherwise has the
power to control the financial and operating activities of the entity.
The financial statements of the subsidiaries are prepared for the same reporting year as the parent company,
using consistent accounting policies.
Significant accounting estimates
The key assumptions concerning the future and other key sources of estimation uncertainty at the balance
sheet date, that have a significant risk of causing material adjustment to the carrying amounts of assets and
liabilities within the next financial year, are discussed below:
Impairment of goodwill
The Group determines whether goodwill is impaired at least on an annual basis. This requires an estimation of
the value in use of the cash-generating units to which the goodwill is allocated. Estimating the value in use
requires the Group to make an estimate of the expected future cash flows from the cash-generating unit and
also to choose a suitable discount rate in order to calculate the present value of those cash flows. Goodwill
impairments cannot be reversed.
Goodwill
Goodwill acquired in a business combination is initially measured at cost being the excess of the cost of the
business combination over the Group’s interest in the net fair value of the identifiable assets, liabilities and
contingent liabilities. Following initial recognition, goodwill is measured at cost less any accumulated
impairment losses. Goodwill is reviewed for impairment annually or more frequently if events or changes in
circumstances indicate that the carrying value may be impaired.
At the acquisition date, any goodwill acquired is allocated to each of the Group’s cash-generating units
expected to benefit from the combination’s synergies. Impairment is determined by assessing the recoverable
amount of the cash-generating unit to which the goodwill relates. Where the recoverable amount of the cash-
generating unit is less than the carrying amount, an impairment loss is recognised. Where goodwill forms part
of a cash-generating unit and part of the operation within that unit is disposed of, the goodwill associated with
the operation disposed of is included in the carrying amount of the operation when determining the gain or loss
on disposal of the operation. Goodwill disposed of in these circumstances is measured on the basis of the
relative values of the operation disposed of and the portion of the cash-generating unit retained.
Joint ventures
Joint ventures are those entities in which the Group and one or more other venturers undertake an economic
activity which is subject to joint control over the financial and operating policy decisions under a contractual
agreement.
Joint ventures are accounted for by means of the proportionate consolidation method whereby the attributable
share of each of the assets, liabilities, income and expenses and cash flows of the jointly controlled entity is
combined on a line by line basis with similar items in the Group’s annual financial statements. A proportionate
share of inter-company items is eliminated.
Spe
scom
ann
ual r
epor
t 20
05
35
Notes to the Financial Statementsat 30 September 2005
1. ACCOUNTING POLICIES (continued)
Joint ventures (continued)
Any difference between the cost of acquisition and the Group’s share of the fair value of the net identifiable
assets at acquisition date is recognised and treated according to the Group’s accounting policy for goodwill.
Where the joint venture applies accounting policies that are recognised as being materially different to those
adopted by the Group, adjustments are made to the financial statements of the joint venture prior to inclusion in
the Group financial statements.
Associated companies
An associated company is one in which the Group exercises significant influence, but not control, over the
financial and operating policies of that company.
The equity method is used to account for the Group’s share of post-acquisition reserves of such companies.
Under the equity method of accounting the Group’s post-acquisition share of the associate’s profit or loss for
the year is recognised in the income statement. In the balance sheet, the investment in the associate is carried
at cost plus post acquisition changes in the Group’s share of net assets of the associate. Goodwill relating to
an associate is included in the carrying amount of the investment and is not amortised.
After application of the equity method, the Group determines whether it is necessary to recognise any additional
impairment loss with respect to the Group’s net investment in the associate.
Where there has been a change recognised directly in the equity of the associate, the Group recognises its
share of any changes and discloses this, when applicable, in the Statement of Changes in Equity.
If an associate company applies accounting policies that are materially different to those adopted by the Group,
adjustments are made to the financial statements of the associated company prior to equity accounting the
investment.
Foreign currencies
Foreign currency transactions are recorded at the exchange rate ruling on the transaction date. Foreign
monetary currency assets and liabilities are brought to account at the rates of exchange ruling at the financial
year end. Non-monetary assets and liabilities denominated in foreign currencies are translated at the rates of
exchange ruling on the later of acquisition or revaluation dates. Foreign currency gains and losses are included
in operating income.
The Group uses derivative financial instruments such as foreign exchange contracts to hedge its risk associated
with foreign currency fluctuations. It is the Group’s policy not to trade in derivative financial instruments. Details
of the Group’s financial risk management objectives are set out in note 26.
Foreign subsidiaries
The Group has investments in foreign subsidiary companies which are classified as foreign entities. The financial
statements of these subsidiaries are translated for incorporation into the group financial statements on the
following basis:
• Monetary assets and liabilities at the closing rate
• Non-monetary assets and liabilities at the closing rate
Spe
scom
ann
ual r
epor
t 20
05
36
Notes to the Financial Statementsat 30 September 2005
1. ACCOUNTING POLICIES (continued)
Foreign subsidiaries (continued)
• Income statement items at a weighted average rate for the period
• Exchange differences arising on translation are recognised in the Statement of Changes in Equity as a
foreign currency translation reserve
• Goodwill and fair value adjustments arising on acquisition of a foreign entity are treated as assets and
liabilities of the foreign entity and are translated at the closing rate
• On disposal of part or all of the investment, the proportionate share of the related cumulative gains and
losses previously recognised in the foreign currency translation reserve in the Statement of Changes in
Equity are included in determining the profit or loss on disposal of that investment recognised in the
income statement
Subsidiaries which are classified as foreign operations will have their financial statements translated for
incorporation into the Group financial statements on the following basis:
• Monetary assets and liabilities at the closing rate
• Non-monetary assets and liabilities at the closing rate ruling on the later of the acquisition or revaluation
date
• Income statement items at a weighted average rate for the period
• Exchange differences arising on translation are taken directly to income
Finance charges
Finance charges on suspensive sale agreements are written off over the period of the agreements in relation to
the capital balance outstanding from time to time.
Capitalised finance leases
Leases are classified as finance leases where substantially all the risks and rewards associated with ownership
of an asset are transferred from the lessor to the Group as lessee. All other leases are treated as operating
leases.
Assets acquired in terms of finance leases are capitalised at the lower of fair value and the present value of the
minimum lease payments at inception of the lease and are depreciated at the same rates as property, plant and
equipment.
The capital element of future obligations is included as a liability in the balance sheet. Lease payments are
allocated between lease finance costs and capital repayments using the effective interest method.
Operating leases
Leases of assets under which all the risks and benefits of ownership are effectively retained by the lessor are
classified as operating leases. Lease payments under an operating lease are recognised in the income
statement on a straight line basis over the lease term.
Contracts in progress
Contracts in progress are valued by recognising revenue and expenses respectively by reference to the stage of
completion of the contract activity at the balance sheet date. The stage of completion is determined based on
the work performed at the balance sheet date.
Spe
scom
ann
ual r
epor
t 20
05
37
Notes to the Financial Statementsat 30 September 2005
1. ACCOUNTING POLICIES (continued)
Contracts in progress (continued)
Progress payments received in excess of the measured value of work determined on each contract are
included in the composition of contracts in progress. Cost includes direct costs and overheads allocated to the
contract.
Profit is brought to account on the percentage of completion basis. Where a loss is anticipated on any
particular contract, provision is made in full for such loss.
Impairment
The carrying amounts of tangible and intangible assets are reviewed at each balance sheet date to determine
whether there is any indication of impairment. If any such indication exists, the recoverable amount is estimated
as the higher of an asset’s or cash-generating unit’s fair value less cost to sell and the value in use and is
determined for an individual asset, unless the asset does not generate cash inflows that are largely independent
from those of other assets or groups of assets. Where the carrying values exceed the estimated recoverable
amount, assets are written down to their recoverable amount.
In assessing value in use, the estimated future cash flows are discounted to their present value using a pre-tax
discount rate that reflects current market assessments of the time value of money and the risks specific to the
asset. Impairment losses of continuing operations are recognised in the income statement in those expense
categories consistent with the function of the impaired asset.
A previously recognised impairment is reversed if there has been a change in the estimates used to determine
the recoverable amount, but not, however, to an amount higher than the carrying amount that would have been
determined (net of depreciation) had no impairment loss been recognised in prior years. Such a reversal is
recognised in the income statement unless the asset is carried at its revalued amount, in which case the
reversal is treated as a revaluation increase. After such a reversal, the depreciation charge is adjusted in future
periods to allocate the asset’s revised carrying amount, less any residual value, on a systematic basis over its
remaining useful life.
Deferred taxation
Deferred taxation is provided on the liability basis for all temporary differences arising between the tax bases of
assets and liabilities and their carrying amounts on the balance sheet. Current tax rates at balance sheet date
are used to determine the deferred tax balance.
Provision is made for deferred tax on the revaluation of property, plant and equipment and on adjustments on
business acquisitions. The amount of deferred tax provided is based on the expected manner of realisation or
settlement of the carrying amount of assets and liabilities.
Deferred tax for the period is charged to the income statement except to the extent that it relates to a
transaction that is recognised directly in equity, or a business combination that is an acquisition.
The effect on deferred tax of any changes in the tax rates is recognised in the income statement, except to the
extent that it relates to items previously charged or credited directly to equity.
A deferred tax asset relating to deductible temporary differences is recognised to the extent that it is probable
that future taxable profits will be available against which the associated unused tax losses and deductible
temporary differences can be utilised. The carrying amount of deferred tax assets are reviewed at each balance
sheet date and are reduced to the extent that it is no longer probable that the related tax benefit will be
realised.

Spe
scom
ann
ual r
epor
t 20
05
38
Notes to the Financial Statementsat 30 September 2005
1. ACCOUNTING POLICIES (continued)
Intangible assets
Intangible assets acquired separately are measured on initial recognition at cost. The cost of intangible assetsacquired in a business combination is the fair value as at the date of acquisition. Internally generated intangibleassets, excluding capitalised development costs, are not capitalised and expenditure is charged to the incomestatement in the year in which the cost is incurred.
The useful lives of intangible assets are assessed to be either finite or indefinite. Intangible assets with finite livesare amortised over the useful economic life and assessed for impairment annually or whenever there is anindication that the intangible asset may be impaired. The amortisation expense on intangible assets with finitelives is recognised in the income statement in the expense category consistent with the function of theintangible asset.
The rate of amortisation applied to technology developments which meet the requirements of intangible assetswith finite lives is 33,3%.
Intangible assets with indefinite lives are tested for impairment annually either individually or at the cash-generating unit level. Such intangibles are not amortised. The useful life of an intangible asset with an indefinitelife is reviewed annually to determine whether indefinite life assessment continues to be supportable. If not, thechange in the useful life assessment from indefinite to finite is made on a prospective basis.
Research and development costs
Expenditure on the concept and design of possible new or improved products is written off in the year in whichit is incurred.
Expenditure on the further development or commercialisation of products in respect of which there is probabilityof receiving future economic benefits is recognised as an asset and amortised in the accounting period duringwhich the income is anticipated to be received. Following initial recognition of development expenditure, thecost model is applied requiring an asset to be carried at cost less any accumulated amortisation andaccumulated impairment losses.
Impairment tests are carried out on intangible assets that are not yet available for use annually or morefrequently when an indication of impairment arises during the reporting year.
Property, vehicles and equipment
Property, vehicles and equipment are stated at cost less accumulated depreciation and impairment in value.Land is not depreciated. Depreciation is calculated on a reducing balance basis at rates consideredappropriate to reduce book values to estimated residual values over their useful lives. The properties arerevalued at appropriate intervals, not exceeding five years.
Increases in carrying amounts as a result of revaluations are credited directly to a non-distributable revaluationreserve. Decreases in valuation that offset previous increases of the same asset are charged against therevaluation reserve and all other decreases are charged to the income statement.
The difference between the net proceeds on disposal and the carrying amount of property is charged to theincome statement. Any balance in the revaluation reserve relating to the disposed property is transferred toretained earnings.
Spe
scom
ann
ual r
epor
t 20
05
39
Notes to the Financial Statementsat 30 September 2005
1. ACCOUNTING POLICIES (continued)
Property, vehicles and equipment (continued)
The actual rates of depreciation applied to the various categories of assets are:
• Motor vehicles 20,0% per annum
• Computer and manufacturing equipment 33,3% per annum
• Buildings 5,0% per annum
• Test equipment 15,0% per annum
• Office equipment, furniture and fittings 10,0% per annum
• Leasehold improvements 10,0% per annum
Assets acquired under finance leases are capitalised and are depreciated in accordance with Group policy.
Financial instruments
Financial instruments, including derivatives, recognised on the balance sheet include cash and cash
equivalents, investments, trade receivables, trade payables, borrowings and forward rate agreements. All
financial instruments are initially measured at cost. The Group enters into derivative financial instruments to
reduce exposure to fluctuations in foreign currency and interest rates. It is the policy of the Group not to trade
in derivative financial instruments for speculative purposes.
Cash and cash equivalents are subsequently measured at fair value and consist of cash on hand and short-
term deposits. Fair value adjustments are recognised in the income statement.
Derivative financial instruments are classified as held for sale and are subsequently measured at fair value.
Gains from forward exchange contracts, options and currency swaps used to hedge potential exchange rate
exposures are offset against losses on the specific transactions being hedged and recognised in the income
statement. Balance sheet amounts are not set off.
Interest differentials under swap arrangements, forward rate agreements and interest rate caps used to manage
interest rate exposure are included in the financing costs for the period.
Loans and receivables are non-derivative financial assets with fixed or determinable payments that are not
quoted in an active market. Such assets are carried at amortised cost using the effective interest method.
Gains and losses are recognised in income when the loans and receivables are derecognised or impaired, as
well as through the amortisation process.
Available for sale financial assets include equity investments and are those non-derivative financial assets that are
designated as available-for-sale or are not classified in any of the preceding categories or as held to maturity
investments. After initial recognition available-for-sale financial assets are measured at fair value with gains and
losses being recognised as a separate component of equity until the investment is derecognised or until the
investment is determined to be impaired at which time the cumulative gain or loss previously reported in equity is
included in the income statement.
Financial liabilities, other than derivatives, are amortised at their original debt value less principal payments and
amortisations.
Preference shares, which are redeemable on a specific date or at the option of the shareholder, are disclosed
together with long-term liabilities. The dividends paid on these shares are recognised in the income statement
as an interest expense.

Spe
scom
ann
ual r
epor
t 20
05
40
Notes to the Financial Statementsat 30 September 2005
1. ACCOUNTING POLICIES (continued)
Borrowing costs
Borrowing costs that are directly attributable to the acquisition or construction of a qualifying fixed asset that
requires a substantial period of time to prepare for its intended use, are capitalised until such time as
substantially all activities necessary to prepare the qualifying asset for its intended use are completed. All other
borrowing costs are written off in the year in which they are incurred.
Inventories
Inventories are stated at the lower of cost and net realisable value. Cost has been established on the following
bases:
• Merchandise for resale – First in, first out
• Components and raw material – Weighted average
• Work in progress – Includes materials, direct labour and production overheads
• Demonstration stock – First in, first out
Net realisable value is the estimated selling price in the ordinary course of business, less estimated costs of
completion and the estimated costs necessary to make the sale.
Provisions
Provisions are recognised where the Group has a present legal or constructive obligation as a result of a past
event, a reliable estimate of the obligation can be made and it is probable that an outflow of resources
embodying economic benefits will be required to settle the obligation. Where the effect is material, provisions
are determined by discounting to present value.
Employee benefits
• Equity-based compensation
The Group operates the Spescom Limited Share Trust, a share incentive plan, for the purpose of
incentivising employees of the Group and promoting the continued growth of the Group by giving such
employees an opportunity to acquire shares. In terms of the Share Trust Deed the directors may extend an
offer to employees in terms of the Cash Purchase Scheme or the Credit Purchase Scheme, or grant an
option in terms of the Option Scheme, or any combination thereof. The price payable per share purchased
or option exercised will be 90% of the market price determined for the month in which the offer is
extended or the option is granted. No more than 25% of the shares acquired and paid for in terms of the
Cash Purchase Scheme or the Credit Purchase Scheme may be sold in any financial year. Options not
taken up expire after 10 years.
• Short-term employee benefits
All short-term benefits, including leave pay, are fully provided in the period in which the related service is
rendered by the employee. The Group contributes to defined medical aid schemes for the benefit of
permanent employees.
• Post retirement benefits
Payments to the defined contribution retirement benefit plan are charged as an expense in the year to
which they relate.
Spe
scom
ann
ual r
epor
t 20
05
41
Notes to the Financial Statementsat 30 September 2005
1. ACCOUNTING POLICIES (continued)
Share capitalisation awards and cash dividends
The full cash equivalent of capitalisation share awards, and cash dividends, are recorded and disclosed as
dividends declared in the Statement of Changes in Equity. The current dividend liability is that amount
reasonably estimated to be paid in cash. Any difference between total dividends declared and this estimate is
transferred to a non-distributable share election reserve pending the outcome of the final share awards. Upon
allotment of shares the relevant amounts are transferred to the share capital and share premium account and
cash dividend election amounts are paid.
Treasury shares
Shares in Spescom Limited held by the Group are treated as treasury shares. These shares are treated as a
deduction from the issued and weighted average number of shares and the cost price of the shares is
deducted from share capital and share premium in the balance sheet on consolidation. Dividends received on
treasury shares are eliminated on consolidation.
Revenue recognition
Revenue is recognised only when it is probable that the economic benefits associated with a transaction will
flow to the Group and the amount of the revenue can be reliably measured. Value-added taxation is excluded.
The Group derives gross revenues from sale of product and supporting software applications, charges under
contracts for maintenance of technology solutions supplied to customers and from the development and sale of
customised technology.
Revenue is brought to account in these financial statements as follows:
• Sale of product
– is recognised when substantially all the risks and rewards of ownership have passed to the buyer on
delivery
• Royalties
– are recognised on an accrual basis in accordance with the substance of the relevant agreement
• Rental income
– is recognised on an accrual basis in accordance with the substance of the relevant rental agreement
• Maintenance contracts
– are recognised evenly over the life of the lease
• Development and sale of technology
– is recognised in accordance with progress milestones, which approximate percentage of completion,
specified in a contract entered into with a third party, or on the sale of internally developed projects,
revenue is recognised when all significant performance obligations have been satisfied
• Interest income
– is recognised on a time proportioned basis recognising the effective yield on the underlying asset and an
appropriate accrual is made at each accounting reference date
Spe
scom
ann
ual r
epor
t 20
05
42
Notes to the Financial Statementsat 30 September 2005
1. ACCOUNTING POLICIES (continued)
Revenue recognition (continued)
• Dividends
– are recognised when the right to receive payment is established, with the exception of dividends on
preference share investments which are recognised on a time proportioned basis in the period to which
they relate.
Segmental reporting
Segment information is reported on both a nature of business (primary) and geographical (secondary) basis.
This approach is based on the manner in which segments are organised and managed. All segment revenue
and expenses are directly attributable to the segments.
Segment assets include all operating assets used by a segment and consist principally of property, plant and
equipment, as well as current assets. Segment liabilities include all operating liabilities and consist principally of
trade and other payables. These assets and liabilities are directly attributable to the segments.
The segmental report is set out on pages 65 to 66.
Dividends payable
Dividends payable and secondary tax thereon are recognised in the period in which such dividends are
declared.
Earnings per share
Earnings per share is based on the earnings attributable to shareholders and is calculated on the weighted
average number of shares in issue during the period.
Spe
scom
ann
ual r
epor
t 20
05
43
Notes to the Financial Statementsat 30 September 2005
2. REVENUE
Revenue comprises turnover and other income.
Turnover represents net invoiced sales of products and services after eliminating inter-company sales within the
Group and value added tax.
GROUP COMPANY
2005 2004 2005 2004
(Restated)
R R R R
Turnover comprises:
Sale of technological products and
communications solutions 95 993 495 100 921 636 – –
Maintenance and service contract revenues 41 210 130 66 777 936 – –
Revenues from development of proprietary
technology 86 263 005 188 817 655 – –
223 466 630 356 517 227 – –
From continuing operations 212 823 776 346 838 679 – –
From discontinued operations 10 642 854 9 678 548 – –
Total turnover 223 466 630 356 517 227 – –
Other income comprises:
Royalties received 1 255 976 2 215 865 – –
Management fee 1 923 819 50 000 1 923 819 50 000
Foreign exchange differences 147 986 4 698 737 214 570 4 307 570
Rent received 3 521 327 3 313 645 – –
Premises 3 446 383 3 238 701 – –
Other 74 944 74 944 – –
Investment income 3 071 481 3 142 511 3 557 423 2 727 070
Total other income 9 920 589 13 420 758 5 695 812 7 084 640
Total revenue 233 387 219 369 937 985 5 695 812 7 084 640

Spe
scom
ann
ual r
epor
t 20
05
44
Notes to the Financial Statementsat 30 September 2005
3. DISCONTINUED OPERATIONS
During the year under review, the Group disposed of the
following interests:
GROUP
2005 2004
(Restated)
R R
Test and measurement sales and customer support divisionThe decline in the worldwide test and measurement market, increasedcompetition and grossly decreased margins, negatively impacted on theGroup’s general test and measurement sales and support division. As aresult thereof, the Group resolved to shut down this division. Formalnotification of the discontinuance plan for the support business unit wascommunicated on 17 September 2004. The Group also entered into abinding sale agreement for substantially all the assets attributable to thisbusiness unit. The remaining test and measurement sales business unitwas closed down on 31 December 2005. The results of the customersupport business unit were previously reported in the services industrysegment while the results of the sales business unit were reported in theenterprise content management segment. Both business units previouslyformed part of the Africa geographical segment.
The results of the test and measurement division are presented below:Revenue 10 462 854 40 249 000Expenses (10 322 903) (39 437 674)
Operating profit for the year 139 951 811 326Non-trading items attributable to discontinuance – (1 204 755)
Net profit/(loss) for the year from discontinued operations 139 951 (393 429)
The major classes of assets and liabilities of the test and measurement division as at 30 September are:
AssetsProperty, plant and equipment – 1 206 952Inventories – 2 806 405Accounts receivable – 5 100 485
– 9 113 842
LiabilitiesAccounts payable and provisions (950 193) (4 822 671)
Net (liabilities)/assets directly associated with the closure of the division (950 193) 4 291 171
The net cash flows incurred by the test and measurement division are as follows:Operating 5 381 315 1 606 963
Net cash inflow 5 381 315 1 606 963

Spe
scom
ann
ual r
epor
t 20
05
45
Notes to the Financial Statementsat 30 September 2005
GROUP COMPANY
2005 2004 2005 2004
(Restated)
R R R R
4. OPERATING (LOSS)/PROFIT:Is stated after taking into account:IncomeRoyalties received 1 255 976 2 215 865 – –Management fee 1 923 819 50 000 1 923 819 30 000Foreign exchange differences 147 986 4 698 737 214 570 27 274 113Rent received 3 521 327 3 313 645 – –
Premises 3 446 383 3 238 701 – –Other 74 944 74 944 – –
ExpensesAdministration fees (83 853) – – –Secretarial fees (546 515) (213 284) – –Auditors’ remuneration (2 647 488) (3 289 461) (566 782) (363 160)
Audit fees – provision (2 272 500) (2 600 596) (546 824) (333 160)For other services (374 988) (688 865) (19 958) (30 000)
Depreciation of tangible and intangible assets (13 677 850) (14 307 839) – –
Owned (13 677 850) (14 194 504) – –Leased – (113 335) – –
Gross employment costs (86 580 692) (130 237 276) (832 500) (662 500)Loss on disposal of tangible and intangible assets (102 248) (383 353) – –Foreign exchange differences (606 359) (1 089 000) – –Impairment of loans – – (1 923 819) –Management fee (100 000) – – –Royalties (973 813) (1 073 578) – –Operating lease charges (8 896 988) (11 918 092) – –
Premises (7 668 494) (10 431 062) – –Other (1 228 494) (1 487 030) – –
Directors’ remuneration (refer to page 67 for more details)
Non-executive directors (832 500) (662 500) (832 500) (662 500)Executive directors (5 556 385) (8 688 849) – –
Total directors’ remuneration (6 388 885) (9 351 349) (832 500) (662 500)
Paid byThe company (832 500) (662 500) (832 500) (662 500)Subsidiaries (5 556 385) (8 688 849) – –
(6 388 885) (9 351 349) (832 500) (662 500)
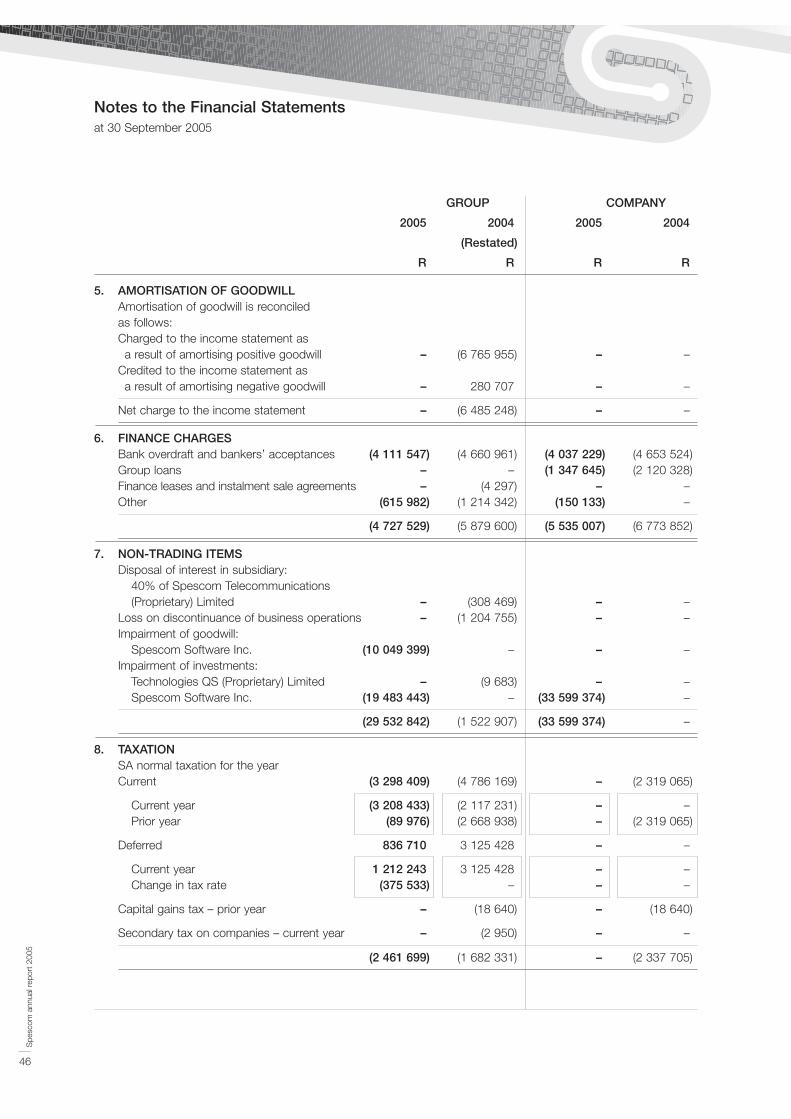
Spe
scom
ann
ual r
epor
t 20
05
46
Notes to the Financial Statementsat 30 September 2005
GROUP COMPANY
2005 2004 2005 2004
(Restated)
R R R R
5. AMORTISATION OF GOODWILLAmortisation of goodwill is reconciled as follows:Charged to the income statement asa result of amortising positive goodwill – (6 765 955) – –
Credited to the income statement asa result of amortising negative goodwill – 280 707 – –
Net charge to the income statement – (6 485 248) – –
6. FINANCE CHARGESBank overdraft and bankers’ acceptances (4 111 547) (4 660 961) (4 037 229) (4 653 524)Group loans – – (1 347 645) (2 120 328)Finance leases and instalment sale agreements – (4 297) – –Other (615 982) (1 214 342) (150 133) –
(4 727 529) (5 879 600) (5 535 007) (6 773 852)
7. NON-TRADING ITEMSDisposal of interest in subsidiary:
40% of Spescom Telecommunications (Proprietary) Limited – (308 469) – –
Loss on discontinuance of business operations – (1 204 755) – –Impairment of goodwill:
Spescom Software Inc. (10 049 399) – – –Impairment of investments:
Technologies QS (Proprietary) Limited – (9 683) – –Spescom Software Inc. (19 483 443) – (33 599 374) –
(29 532 842) (1 522 907) (33 599 374) –
8. TAXATIONSA normal taxation for the yearCurrent (3 298 409) (4 786 169) – (2 319 065)
Current year (3 208 433) (2 117 231) – –Prior year (89 976) (2 668 938) – (2 319 065)
Deferred 836 710 3 125 428 – –
Current year 1 212 243 3 125 428 – –Change in tax rate (375 533) – – –
Capital gains tax – prior year – (18 640) – (18 640)
Secondary tax on companies – current year – (2 950) – –
(2 461 699) (1 682 331) – (2 337 705)

Spe
scom
ann
ual r
epor
t 20
05
47
Notes to the Financial Statementsat 30 September 2005
GROUP COMPANY2005 2004 2005 2004
(Restated)R R R R
% % % %
8. TAXATION (continued)Reconciliation of tax rateStandard tax rate (29,0) (30,0) (29,0) (30,0)
Adjusted for:Change in tax rate (0,8) – – –Disallowable expenditure 16,6 28,6 29,0 27,1Capital gains – – – (2,4)Tax losses utilised 8,3 4,5 – 2,9Prior years (0,2) (8,5) – (294,3)
Effective tax rate (5,1) (5,4) – (296,7)
Certain Group companies have computed tax losses. Aggregated computed unutilised tax losses available forset-off against future taxable income are estimated at R176 799 863 (2004 – R127 713 206). Deferred taxassets have been raised where appropriate.
The Group has unutilised input credits for secondary taxation on companies which would result in tax relieftotalling R565 578 (2004 – R565 578).
9. EARNINGS PER SHARE9.1 Headline (loss)/earnings per share
Based on net (loss)/profit after taxation, minority shareholders’ interests and adjusted for capital itemsincluded in non-trading items as set out in the following reconciliation, and 72 590 276 (2004 – 59 529 071) weighted shares in issue.
GROUP2005 2004
(Restated)R R
Net (loss)/profit for the year attributable to the holding company’s shareholders (3 466 161) 29 403 014Amortisation of goodwill – 6 485 248Impairment of goodwill 10 049 399 –Disposal of interest in subsidiary – 308 469Impairment in value of investments: Technologies QS (Proprietary) Limited – 9 683
Spescom Software Inc. 19 483 443 –Loss on discontinuance of business operations – 1 204 755Loss on sale of tangible and intangible assets 102 248 383 353
Profit for calculation of headline earnings 26 188 929 37 794 522
9.2 (Loss)/earnings per shareBased on net loss after taxation of R3 466 161 (2004 – net profit of R29 403 014) and 72 590 276 (2004 –59 529 071) weighted average shares in issue.
9.3 Diluted (loss)/earnings per shareThere are no existing instruments which will have a further diluting effect on the earnings of the company.The diluted (loss)/earnings per share thus equates to the (loss/)earnings per share as calculated in note 9.2.
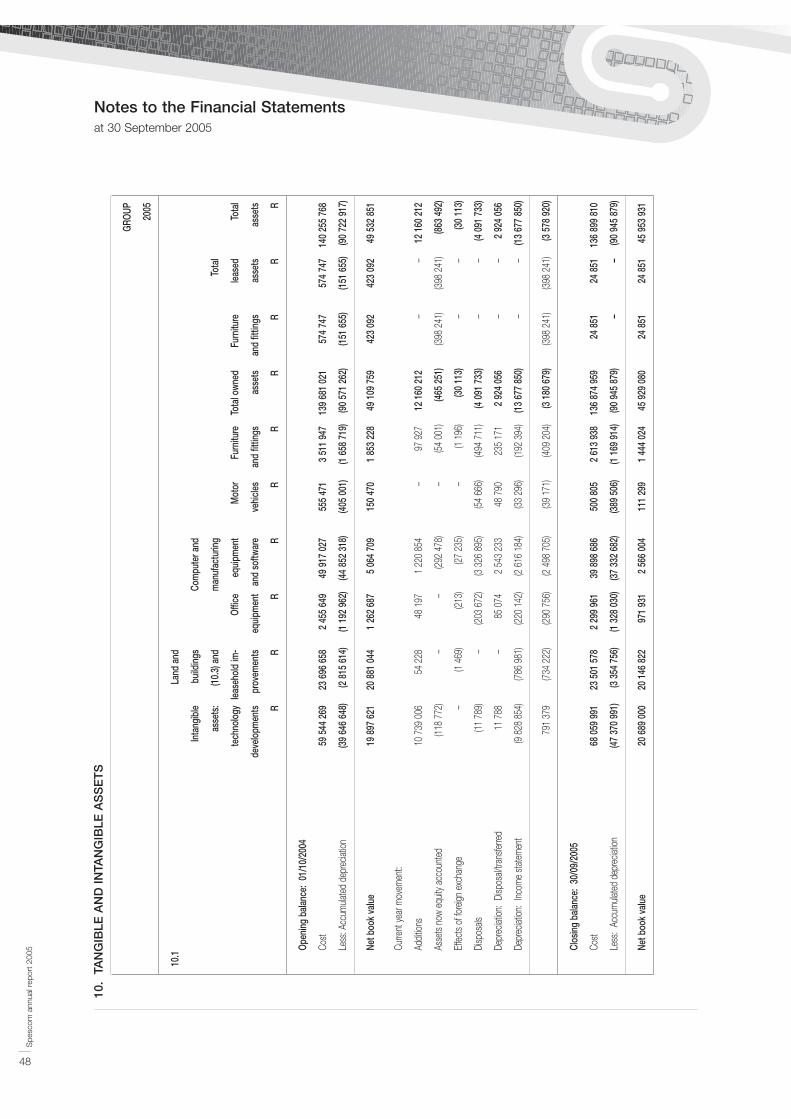
Spe
scom
ann
ual r
epor
t 20
05
48
Notes to the Financial Statementsat 30 September 2005
10.
TAN
GIB
LE A
ND
INTA
NG
IBLE
AS
SE
TS
GROU
P
2005
10.1
La
nd a
nd
Inta
ngib
lebu
ildin
gsCo
mpu
ter a
nd
asse
ts:
(10.
3) a
ndm
anuf
actu
ring
Tota
l
tech
nolo
gyle
aseh
old
im-
Offic
eeq
uipm
ent
Mot
orFu
rnitu
reTo
tal o
wned
Furn
iture
leas
edTo
tal
deve
lopm
ents
prov
emen
tseq
uipm
ent
and
softw
are
vehi
cles
and
fittin
gsas
sets
and
fittin
gsas
sets
asse
ts
RR
RR
RR
RR
RR
Open
ing
bala
nce:
01/
10/2
004
Cost
59 5
44 2
6923
696
658
2 45
5 64
949
917
027
555
471
3 51
1 94
713
9 68
1 02
157
4 74
757
4 74
714
0 25
5 76
8
Less
: Acc
umula
ted
depr
eciat
ion(3
9 64
6 64
8)(2
815
614
)(1
192
962
)(4
4 85
2 31
8)(4
05 0
01)
(1 6
58 7
19)
(90
571
262)
(151
655
)(1
51 6
55)
(90
722
917)
Net b
ook
valu
e19
897
621
20 8
81 0
441
262
687
5 06
4 70
915
0 47
01
853
228
49 1
09 7
5942
3 09
242
3 09
249
532
851
Curre
nt ye
ar m
ovem
ent:
Addit
ions
10 7
39 0
0654
228
48 1
971
220
854
–97
927
12 1
60 2
12–
–12
160
212
Asse
ts no
w eq
uity a
ccou
nted
(118
772
)–
–(2
92 4
78)
–(5
4 00
1)(4
65 2
51)
(398
241
)(3
98 2
41)
(863
492
)
Effec
ts of
fore
ign e
xcha
nge
–(1
469
)(2
13)
(27
235)
–(1
196
)(3
0 11
3)–
–(3
0 11
3)
Disp
osals
(11
789)
–(2
03 6
72)
(3 3
26 8
95)
(54
666)
(494
711
)(4
091
733
)–
–(4
091
733
)
Depr
eciat
ion:
Disp
osal/
trans
ferre
d11
788
–85
074
2 54
3 23
348
790
235
171
2 92
4 05
6–
–2
924
056
Depr
eciat
ion:
Incom
e sta
tem
ent
(9 8
28 8
54)
(786
981
)(2
20 1
42)
(2 6
16 1
84)
(33
296)
(192
394
)(1
3 67
7 85
0)–
–(1
3 67
7 85
0)
791
379
(734
222
)(2
90 7
56)
(2 4
98 7
05)
(39
171)
(409
204
)(3
180
679
)(3
98 2
41)
(398
241
)(3
578
920
)
Clos
ing
bala
nce:
30/
09/2
005
Cost
68 0
59 9
9123
501
578
2 29
9 96
139
898
686
500
805
2 61
3 93
813
6 87
4 95
924
851
24 8
5113
6 89
9 81
0
Less
: Ac
cum
ulate
d de
prec
iation
(47
370
991)
(3 3
54 7
56)
(1 3
28 0
30)
(37
332
682)
(389
506
)(1
169
914
)(9
0 94
5 87
9)–
–(9
0 94
5 87
9)
Net b
ook
valu
e20
689
000
20 1
46 8
2297
1 93
12
566
004
111
299
1 44
4 02
445
929
080
24 8
5124
851
45 9
53 9
31
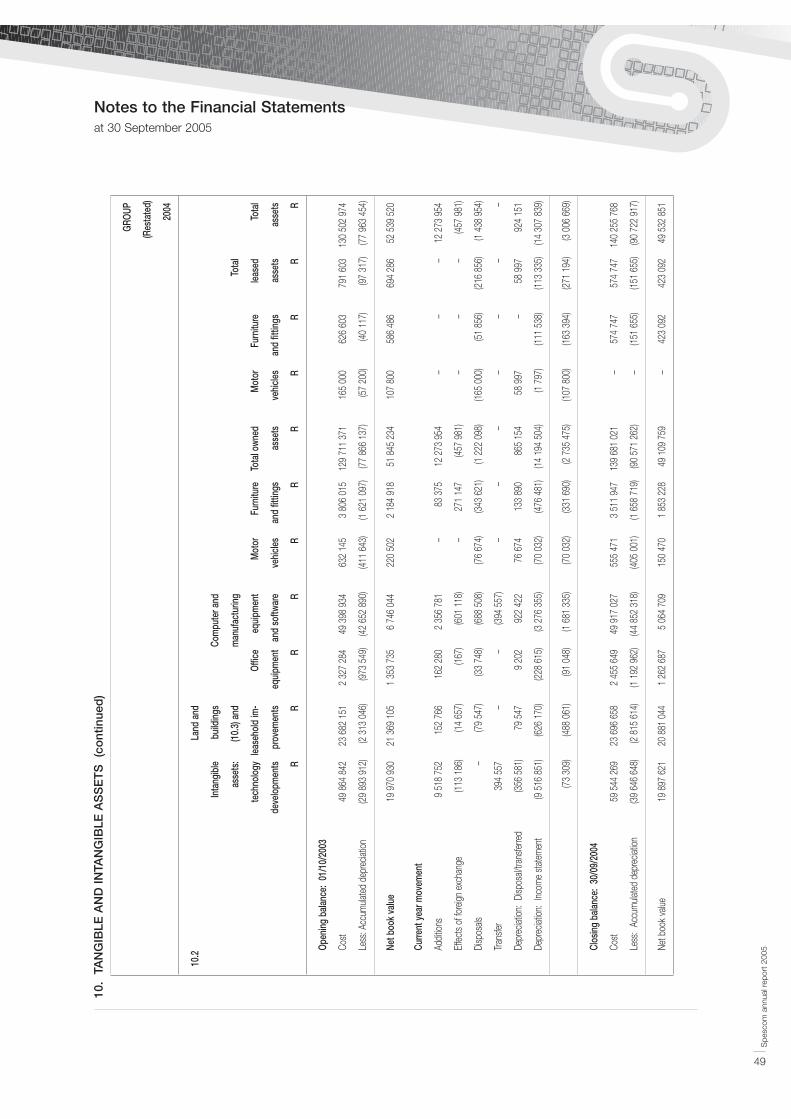
Spe
scom
ann
ual r
epor
t 20
05
49
Notes to the Financial Statementsat 30 September 2005
10.
TAN
GIB
LE A
ND
INTA
NG
IBLE
AS
SE
TS
(c
ont
inue
d)
GROU
P
(Res
tate
d)
2004
10.2
La
nd a
nd
Inta
ngib
lebu
ildin
gsCo
mpu
ter a
nd
asse
ts:
(10.
3) a
ndm
anuf
actu
ring
Tota
l
tech
nolo
gyle
aseh
old
im-
Offic
eeq
uipm
ent
Mot
orFu
rnitu
reTo
tal o
wned
Mot
orFu
rnitu
rele
ased
Tota
l
deve
lopm
ents
prov
emen
tseq
uipm
ent
and
softw
are
vehi
cles
and
fittin
gsas
sets
vehi
cles
and
fittin
gsas
sets
asse
ts
RR
RR
RR
RR
RR
R
Open
ing
bala
nce:
01/
10/2
003
Cost
49 8
64 8
4223
682
151
2 32
7 28
449
398
934
632
145
3 80
6 01
512
9 71
1 37
116
5 00
062
6 60
379
1 60
313
0 50
2 97
4
Less
: Acc
umula
ted
depr
eciat
ion(2
9 89
3 91
2)(2
313
046
)(9
73 5
49)
(42
652
890)
(411
643
)(1
621
097
)(7
7 86
6 13
7)(5
7 20
0)(4
0 11
7)(9
7 31
7)(7
7 96
3 45
4)
Net b
ook
valu
e19
970
930
21 3
69 1
051
353
735
6 74
6 04
422
0 50
22
184
918
51 8
45 2
3410
7 80
058
6 48
669
4 28
652
539
520
Curre
nt y
ear m
ovem
ent
Addit
ions
9 51
8 75
215
2 76
616
2 28
02
356
781
–83
375
12 2
73 9
54–
––
12 2
73 9
54
Effec
ts of
fore
ign e
xcha
nge
(113
186
)(1
4 65
7)(1
67)
(601
118
)–
271
147
(457
981
)–
––
(457
981
)
Disp
osals
–(7
9 54
7)(3
3 74
8)(6
88 5
08)
(76
674)
(343
621
)(1
222
098
)(1
65 0
00)
(51
856)
(216
856
)(1
438
954
)
Trans
fer39
4 55
7–
–(3
94 5
57)
––
––
––
–
Depr
eciat
ion:
Disp
osal/
trans
ferre
d(3
56 5
81)
79 5
479
202
922
422
76 6
7413
3 89
086
5 15
458
997
–58
997
924
151
Depr
eciat
ion:
Incom
e sta
tem
ent
(9 5
16 8
51)
(626
170
)(2
28 6
15)
(3 2
76 3
55)
(70
032)
(476
481
)(1
4 19
4 50
4)(1
797
)(1
11 5
38)
(113
335
)(1
4 30
7 83
9)
(73
309)
(488
061
)(9
1 04
8)(1
681
335
)(7
0 03
2)(3
31 6
90)
(2 7
35 4
75)
(107
800
)(1
63 3
94)
(271
194
)(3
006
669
)
Clos
ing
bala
nce:
30/
09/2
004
Cost
59 5
44 2
6923
696
658
2 45
5 64
949
917
027
555
471
3 51
1 94
713
9 68
1 02
1–
574
747
574
747
140
255
768
Less
: Ac
cum
ulate
d de
prec
iation
(39
646
648)
(2 8
15 6
14)
(1 1
92 9
62)
(44
852
318)
(405
001
)(1
658
719
)(9
0 57
1 26
2)–
(151
655
)(1
51 6
55)
(90
722
917)
Net b
ook
value
19 8
97 6
2120
881
044
1 26
2 68
75
064
709
150
470
1 85
3 22
849
109
759
–42
3 09
242
3 09
249
532
851
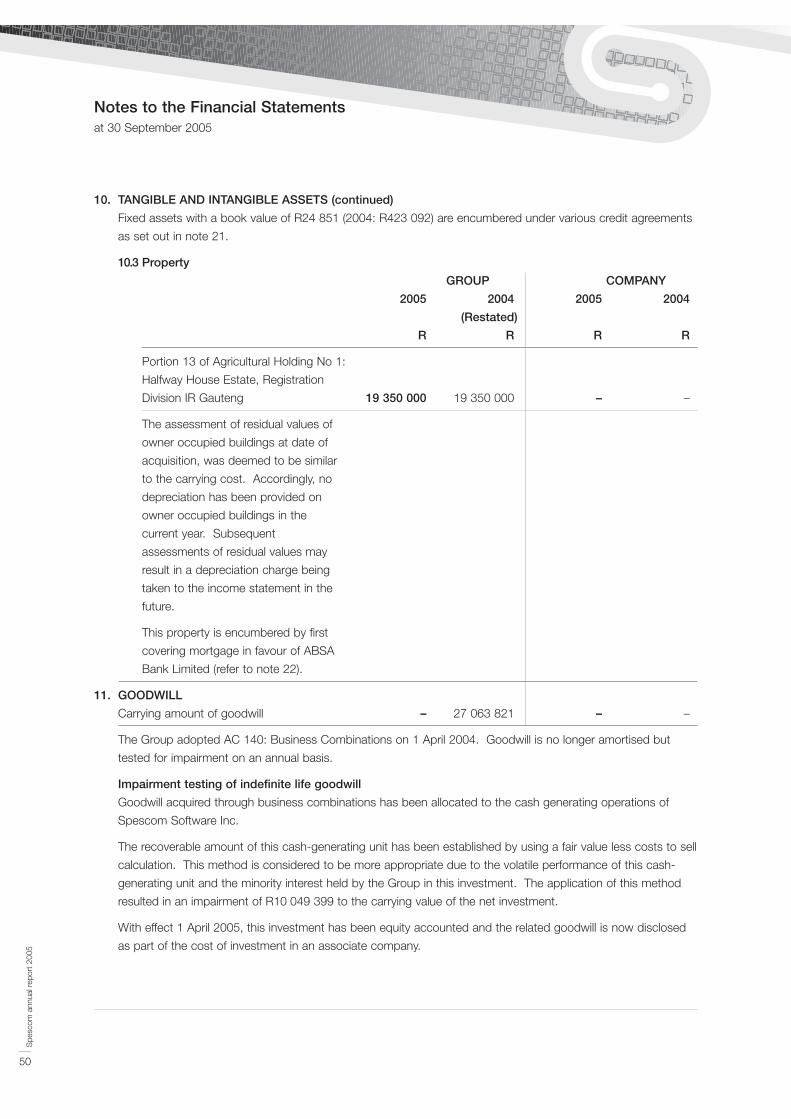
Spe
scom
ann
ual r
epor
t 20
05
50
Notes to the Financial Statementsat 30 September 2005
10. TANGIBLE AND INTANGIBLE ASSETS (continued)
Fixed assets with a book value of R24 851 (2004: R423 092) are encumbered under various credit agreements
as set out in note 21.
10.3 Property
GROUP COMPANY
2005 2004 2005 2004
(Restated)
R R R R
Portion 13 of Agricultural Holding No 1:
Halfway House Estate, Registration
Division IR Gauteng 19 350 000 19 350 000 – –
The assessment of residual values of
owner occupied buildings at date of
acquisition, was deemed to be similar
to the carrying cost. Accordingly, no
depreciation has been provided on
owner occupied buildings in the
current year. Subsequent
assessments of residual values may
result in a depreciation charge being
taken to the income statement in the
future.
This property is encumbered by first
covering mortgage in favour of ABSA
Bank Limited (refer to note 22).
11. GOODWILL
Carrying amount of goodwill – 27 063 821 – –
The Group adopted AC 140: Business Combinations on 1 April 2004. Goodwill is no longer amortised but
tested for impairment on an annual basis.
Impairment testing of indefinite life goodwill
Goodwill acquired through business combinations has been allocated to the cash generating operations of
Spescom Software Inc.
The recoverable amount of this cash-generating unit has been established by using a fair value less costs to sell
calculation. This method is considered to be more appropriate due to the volatile performance of this cash-
generating unit and the minority interest held by the Group in this investment. The application of this method
resulted in an impairment of R10 049 399 to the carrying value of the net investment.
With effect 1 April 2005, this investment has been equity accounted and the related goodwill is now disclosed
as part of the cost of investment in an associate company.

Spe
scom
ann
ual r
epor
t 20
05
51
Notes to the Financial Statementsat 30 September 2005
GROUP COMPANY
2005 2004 2005 2004
(Restated)
R R R R
12. SUBSIDIARY COMPANIES
(refer to schedule of subsidiary companies)
Carrying value of shares – – 8 481 024 42 080 400
Amounts owed by subsidiaries – – 70 197 491 78 868 958
Amounts owed to subsidiaries – – (80 629 410) (86 022 608)
– – (1 950 895) 34 926 750
Amounts owing by subsidiary companies are
unsecured, bear interest at variable rates and
have no fixed terms of repayment, except for
the amounts owing by Spescom Software Inc.
The latter amounts are secured in terms of a
security agreement dated 15 February 2002.
13. INVESTMENT IN ASSOCIATE COMPANIES
13.1 Decision Technologies
(Proprietary) Limited 3 100 3 100 – –
Attributable cost of shares 200 200 – –
Loan owing: this amount is
unsecured, interest free and
not subject to any fixed terms
of repayment. 2 900 2 900 – –
13.2 Spescom Software Inc.
Carrying amount after
impairment 17 014 436 – 2 –
During the year, Spescom Software Inc.
raised capital by issuing fresh
convertible preference shares to an
outside party, thereby effectively
reducing the Group’s interest in its
former subsidiary to 42,6%. With effect
1 April 2005, this investment has been
treated as an associate company.
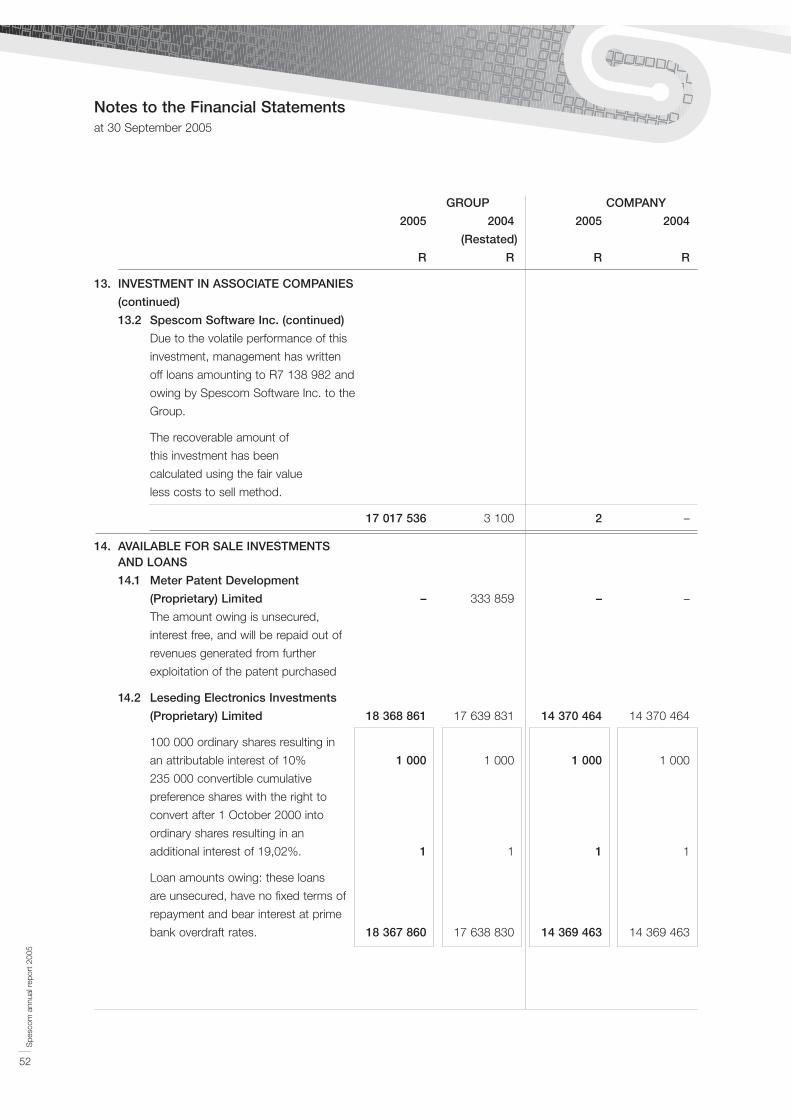
Spe
scom
ann
ual r
epor
t 20
05
52
Notes to the Financial Statementsat 30 September 2005
GROUP COMPANY
2005 2004 2005 2004
(Restated)
R R R R
13. INVESTMENT IN ASSOCIATE COMPANIES
(continued)
13.2 Spescom Software Inc. (continued)
Due to the volatile performance of this
investment, management has written
off loans amounting to R7 138 982 and
owing by Spescom Software Inc. to the
Group.
The recoverable amount of
this investment has been
calculated using the fair value
less costs to sell method.
17 017 536 3 100 2 –
14. AVAILABLE FOR SALE INVESTMENTSAND LOANS
14.1 Meter Patent Development
(Proprietary) Limited – 333 859 – –
The amount owing is unsecured,
interest free, and will be repaid out of
revenues generated from further
exploitation of the patent purchased
14.2 Leseding Electronics Investments
(Proprietary) Limited 18 368 861 17 639 831 14 370 464 14 370 464
100 000 ordinary shares resulting in
an attributable interest of 10% 1 000 1 000 1 000 1 000
235 000 convertible cumulative
preference shares with the right to
convert after 1 October 2000 into
ordinary shares resulting in an
additional interest of 19,02%. 1 1 1 1
Loan amounts owing: these loans
are unsecured, have no fixed terms of
repayment and bear interest at prime
bank overdraft rates. 18 367 860 17 638 830 14 369 463 14 369 463
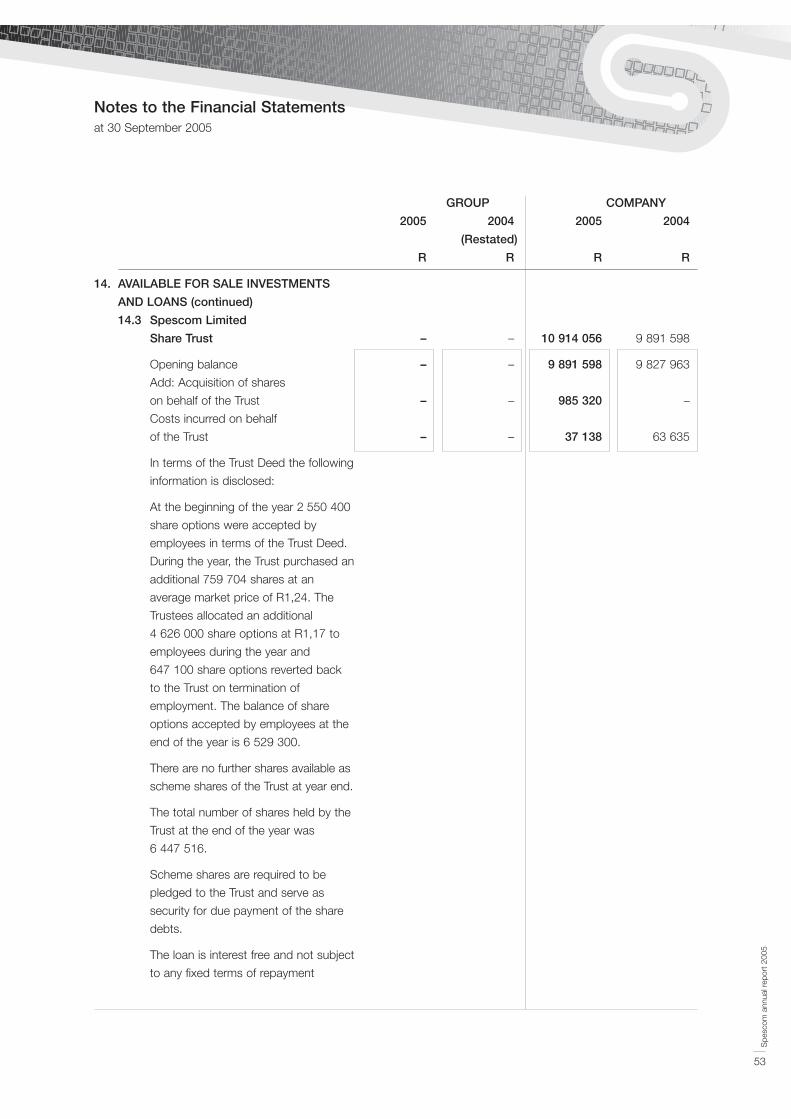
Spe
scom
ann
ual r
epor
t 20
05
53
Notes to the Financial Statementsat 30 September 2005
GROUP COMPANY
2005 2004 2005 2004
(Restated)
R R R R
14. AVAILABLE FOR SALE INVESTMENTS
AND LOANS (continued)
14.3 Spescom Limited
Share Trust – – 10 914 056 9 891 598
Opening balance – – 9 891 598 9 827 963
Add: Acquisition of shares
on behalf of the Trust – – 985 320 –
Costs incurred on behalf
of the Trust – – 37 138 63 635
In terms of the Trust Deed the following
information is disclosed:
At the beginning of the year 2 550 400
share options were accepted by
employees in terms of the Trust Deed.
During the year, the Trust purchased an
additional 759 704 shares at an
average market price of R1,24. The
Trustees allocated an additional
4 626 000 share options at R1,17 to
employees during the year and
647 100 share options reverted back
to the Trust on termination of
employment. The balance of share
options accepted by employees at the
end of the year is 6 529 300.
There are no further shares available as
scheme shares of the Trust at year end.
The total number of shares held by the
Trust at the end of the year was
6 447 516.
Scheme shares are required to be
pledged to the Trust and serve as
security for due payment of the share
debts.
The loan is interest free and not subject
to any fixed terms of repayment
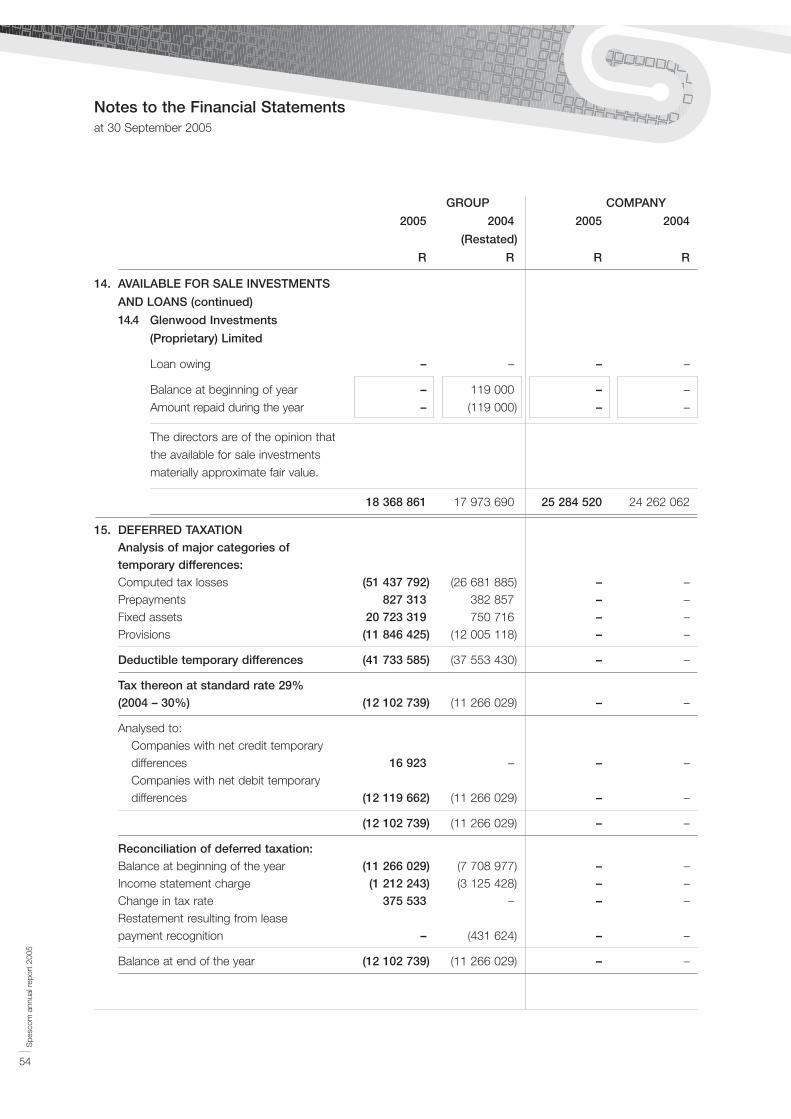
Spe
scom
ann
ual r
epor
t 20
05
54
Notes to the Financial Statementsat 30 September 2005
GROUP COMPANY
2005 2004 2005 2004
(Restated)
R R R R
14. AVAILABLE FOR SALE INVESTMENTS
AND LOANS (continued)
14.4 Glenwood Investments
(Proprietary) Limited
Loan owing – – – –
Balance at beginning of year – 119 000 – –
Amount repaid during the year – (119 000) – –
The directors are of the opinion that
the available for sale investments
materially approximate fair value.
18 368 861 17 973 690 25 284 520 24 262 062
15. DEFERRED TAXATIONAnalysis of major categories of temporary differences:Computed tax losses (51 437 792) (26 681 885) – –Prepayments 827 313 382 857 – –Fixed assets 20 723 319 750 716 – –Provisions (11 846 425) (12 005 118) – –
Deductible temporary differences (41 733 585) (37 553 430) – –
Tax thereon at standard rate 29% (2004 – 30%) (12 102 739) (11 266 029) – –
Analysed to:Companies with net credit temporary differences 16 923 – – –Companies with net debit temporary differences (12 119 662) (11 266 029) – –
(12 102 739) (11 266 029) – –
Reconciliation of deferred taxation:Balance at beginning of the year (11 266 029) (7 708 977) – –Income statement charge (1 212 243) (3 125 428) – –Change in tax rate 375 533 – – –Restatement resulting from lease payment recognition – (431 624) – –
Balance at end of the year (12 102 739) (11 266 029) – –
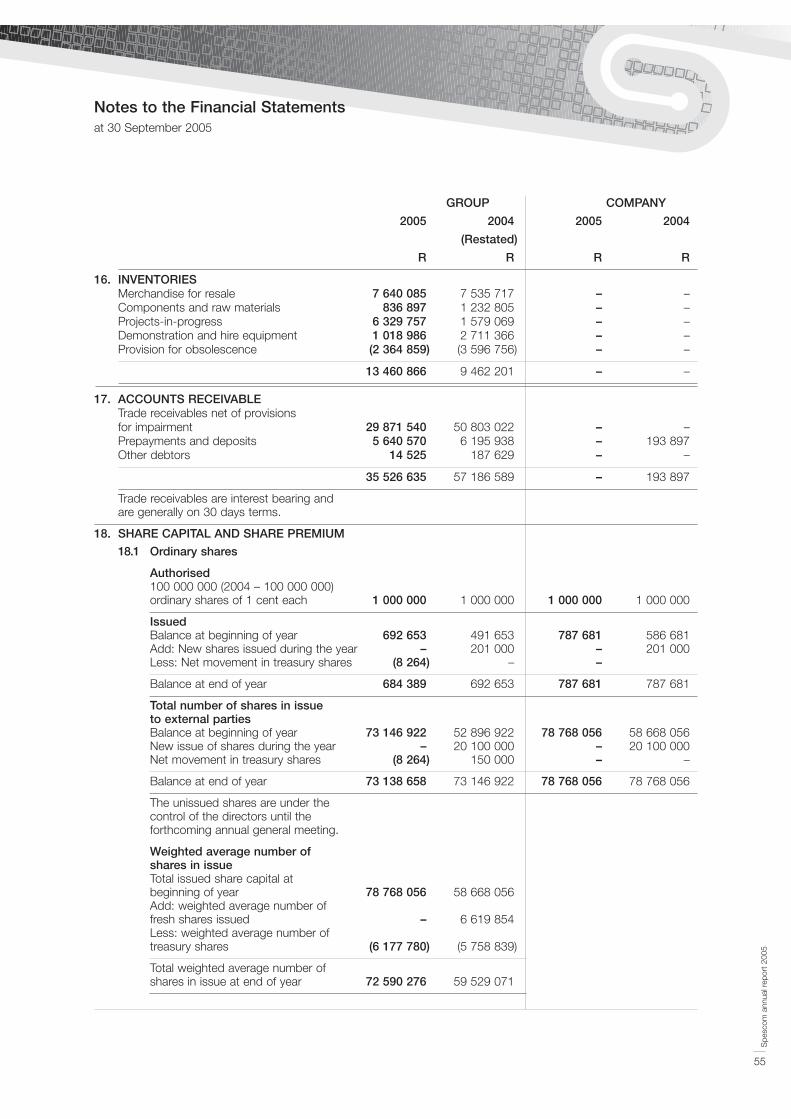
Spe
scom
ann
ual r
epor
t 20
05
55
Notes to the Financial Statementsat 30 September 2005
GROUP COMPANY
2005 2004 2005 2004
(Restated)
R R R R
16. INVENTORIESMerchandise for resale 7 640 085 7 535 717 – –Components and raw materials 836 897 1 232 805 – –Projects-in-progress 6 329 757 1 579 069 – –Demonstration and hire equipment 1 018 986 2 711 366 – –Provision for obsolescence (2 364 859) (3 596 756) – –
13 460 866 9 462 201 – –
17. ACCOUNTS RECEIVABLETrade receivables net of provisions for impairment 29 871 540 50 803 022 – –Prepayments and deposits 5 640 570 6 195 938 – 193 897Other debtors 14 525 187 629 – –
35 526 635 57 186 589 – 193 897
Trade receivables are interest bearing and are generally on 30 days terms.
18. SHARE CAPITAL AND SHARE PREMIUM
18.1 Ordinary shares
Authorised100 000 000 (2004 – 100 000 000) ordinary shares of 1 cent each 1 000 000 1 000 000 1 000 000 1 000 000
IssuedBalance at beginning of year 692 653 491 653 787 681 586 681Add: New shares issued during the year – 201 000 – 201 000Less: Net movement in treasury shares (8 264) – –
Balance at end of year 684 389 692 653 787 681 787 681
Total number of shares in issue to external partiesBalance at beginning of year 73 146 922 52 896 922 78 768 056 58 668 056New issue of shares during the year – 20 100 000 – 20 100 000Net movement in treasury shares (8 264) 150 000 – –
Balance at end of year 73 138 658 73 146 922 78 768 056 78 768 056
The unissued shares are under the control of the directors until the forthcoming annual general meeting.
Weighted average number of shares in issueTotal issued share capital at beginning of year 78 768 056 58 668 056Add: weighted average number of fresh shares issued – 6 619 854Less: weighted average number of treasury shares (6 177 780) (5 758 839)
Total weighted average number of shares in issue at end of year 72 590 276 59 529 071

Spe
scom
ann
ual r
epor
t 20
05
56
Notes to the Financial Statementsat 30 September 2005
GROUP COMPANY
2005 2004 2005 2004
(Restated)
R R R R
18. SHARE CAPITAL AND SHARE PREMIUM (continued)
18.2 Share premiumPremium arising on issue of sharesBalance at beginning of year 45 968 159 23 455 211 55 619 179 33 188 731Share issue expenses incurred during the year – (1 507 552) – (1 507 552)Net movement in treasury shares (1 369 250) 82 500 – –Shares issued during the year – 23 938 000 – 23 938 000
44 598 909 45 968 159 55 619 179 55 619 179
19. NON–DISTRIBUTABLE RESERVESForeign currency translation reserve 14 493 126 14 425 430 (12 533 513) (12 972 561)
Balance at beginning of the year 14 425 430 13 634 198 (12 972 561) (11 492 383)Movement for the year 67 696 791 232 439 048 (1 480 178)
Capital redemption reserve fund 540 000 540 000 – –
Balance at beginning of the year 540 000 900 000 – –Amount transferred to outside shareholders – (360 000) – –
15 033 126 14 965 430 (12 533 513) (12 972 561)
20. MINORITY INTERESTInterest in equity shares of subsidiary companies – 862 073 – –
21. LONG-TERM LIABILITIES
21.1 SecuredCapitalised finance lease agreements:Secured by assets financed and payableover periods of up to five years
at effective rates of interest between prime less 1% and prime – 404 977 – –Current portion – (122 550) – –
– 282 427 – –
Operating lease commitments:Premises
Long-term (> 3 years) – 77 138 – –Medium-term (2 – 3 years) 582 110 5 595 669 – –Short-term (0 – 1 years) 5 232 780 7 317 567 – –
5 814 890 12 990 374 – –

Spe
scom
ann
ual r
epor
t 20
05
57
Notes to the Financial Statementsat 30 September 2005
GROUP COMPANY
2005 2004 2005 2004
(Restated)
R R R R
21. LONG-TERM LIABILITIES (continued)
21.2 Cavendish Securities LimitedThis loan originated in terms of theagreement to advance US$1,6 million toSpescom Limited UK. This facility wassecured by a call option over the sharesof the borrower and interest was chargedat 10% per annum compounded. Theloan was repaid in full during November2003.Balance at beginning of year – 11 867 181 – –Less: Amount repaid – (11 867 181) – –
Current portion – – – –
22. BANK FINANCE
22.1 Overdraft facilities:Overdraft facilities, limited to a maximumof R10 million, are secured by suretyships,the cession and pledge of all debit bankbalances as well as debtors balances.These facilities bear interest at the banks’corporate base wholesale rate plus 2%per annum. There are no fixed terms ofrepayment. 1 259 801 889 – –
22.2 Revolving credit facility: Amalgamated
Banks of Southern Africa Limited
(United Kingdom):The Group had a revolving credit facility ofUS$3,5 million which was reduced toUS$3,15 million subsequent to year endfollowing a repayment of US$350 000.This facility is secured by a cession andpledge of Spescom Software Inc.(incorporated in the United States ofAmerica) ordinary and preference sharesheld by Spescom Limited. The facility isalso secured by way of unlimitedguarantees from each of the Group’s mainoperating subsidiaries. This facility bearsinterest at LIBOR plus 2,5% per annumand is repayable no later than 31 October 2006. 22 565 953 22 596 000 22 565 953 22 596 000Long-term portion – (22 596 000) – (22 596 000)
Current portion 22 565 953 – 22 565 953 –
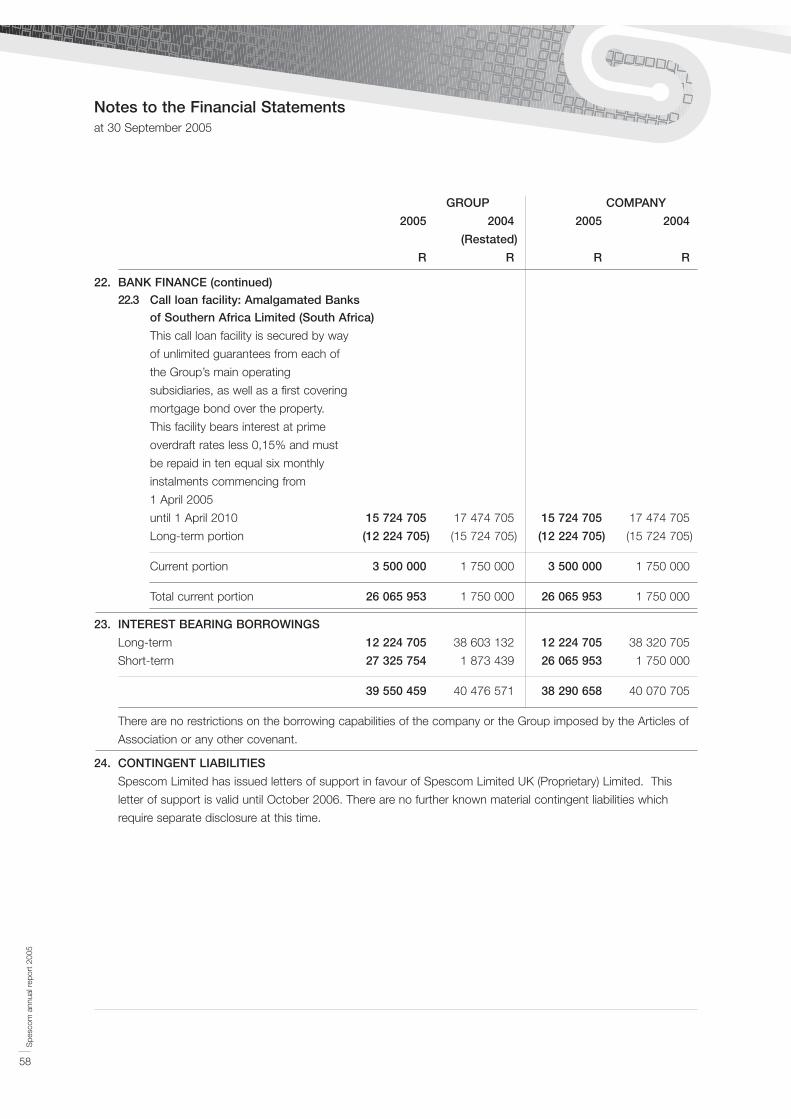
Spe
scom
ann
ual r
epor
t 20
05
58
Notes to the Financial Statementsat 30 September 2005
GROUP COMPANY
2005 2004 2005 2004
(Restated)
R R R R
22. BANK FINANCE (continued)
22.3 Call loan facility: Amalgamated Banks
of Southern Africa Limited (South Africa)
This call loan facility is secured by way
of unlimited guarantees from each of
the Group’s main operating
subsidiaries, as well as a first covering
mortgage bond over the property.
This facility bears interest at prime
overdraft rates less 0,15% and must
be repaid in ten equal six monthly
instalments commencing from
1 April 2005
until 1 April 2010 15 724 705 17 474 705 15 724 705 17 474 705
Long-term portion (12 224 705) (15 724 705) (12 224 705) (15 724 705)
Current portion 3 500 000 1 750 000 3 500 000 1 750 000
Total current portion 26 065 953 1 750 000 26 065 953 1 750 000
23. INTEREST BEARING BORROWINGS
Long-term 12 224 705 38 603 132 12 224 705 38 320 705
Short-term 27 325 754 1 873 439 26 065 953 1 750 000
39 550 459 40 476 571 38 290 658 40 070 705
There are no restrictions on the borrowing capabilities of the company or the Group imposed by the Articles of
Association or any other covenant.
24. CONTINGENT LIABILITIES
Spescom Limited has issued letters of support in favour of Spescom Limited UK (Proprietary) Limited. This
letter of support is valid until October 2006. There are no further known material contingent liabilities which
require separate disclosure at this time.
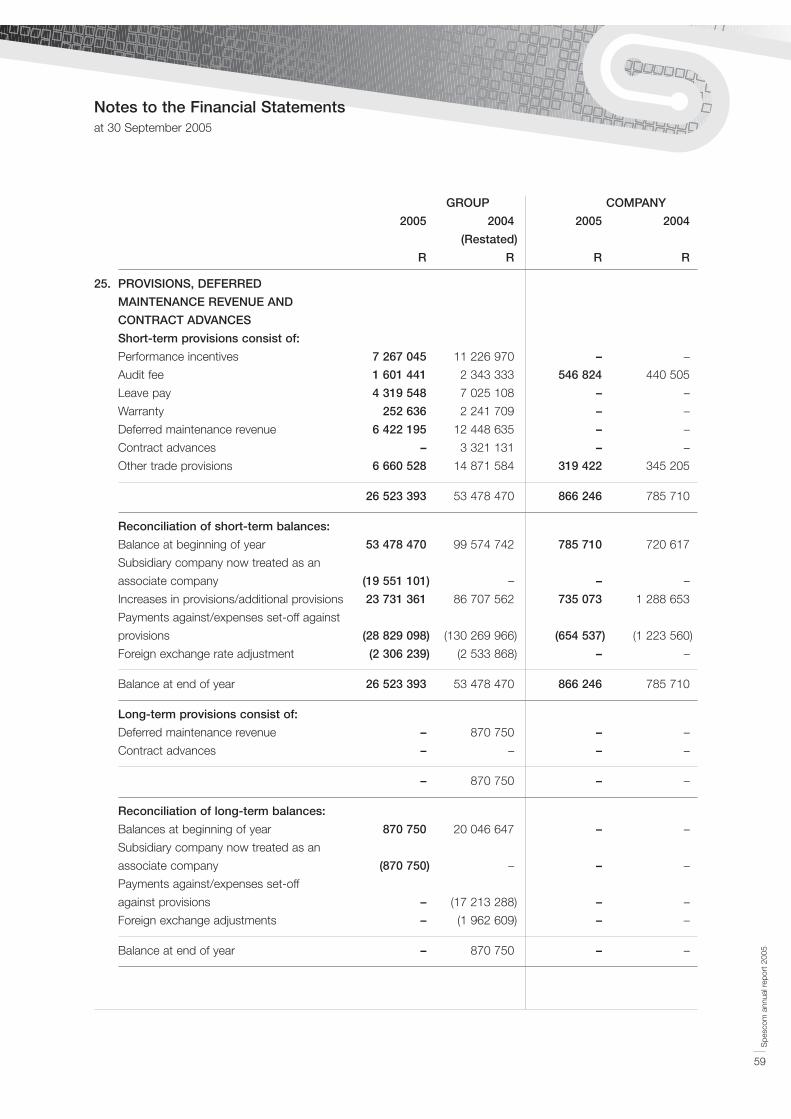
Spe
scom
ann
ual r
epor
t 20
05
59
Notes to the Financial Statementsat 30 September 2005
GROUP COMPANY
2005 2004 2005 2004
(Restated)
R R R R
25. PROVISIONS, DEFERRED
MAINTENANCE REVENUE AND
CONTRACT ADVANCES
Short-term provisions consist of:
Performance incentives 7 267 045 11 226 970 – –
Audit fee 1 601 441 2 343 333 546 824 440 505
Leave pay 4 319 548 7 025 108 – –
Warranty 252 636 2 241 709 – –
Deferred maintenance revenue 6 422 195 12 448 635 – –
Contract advances – 3 321 131 – –
Other trade provisions 6 660 528 14 871 584 319 422 345 205
26 523 393 53 478 470 866 246 785 710
Reconciliation of short-term balances:
Balance at beginning of year 53 478 470 99 574 742 785 710 720 617
Subsidiary company now treated as an
associate company (19 551 101) – – –
Increases in provisions/additional provisions 23 731 361 86 707 562 735 073 1 288 653
Payments against/expenses set-off against
provisions (28 829 098) (130 269 966) (654 537) (1 223 560)
Foreign exchange rate adjustment (2 306 239) (2 533 868) – –
Balance at end of year 26 523 393 53 478 470 866 246 785 710
Long-term provisions consist of:
Deferred maintenance revenue – 870 750 – –
Contract advances – – – –
– 870 750 – –
Reconciliation of long-term balances:
Balances at beginning of year 870 750 20 046 647 – –
Subsidiary company now treated as an
associate company (870 750) – – –
Payments against/expenses set-off
against provisions – (17 213 288) – –
Foreign exchange adjustments – (1 962 609) – –
Balance at end of year – 870 750 – –

Spe
scom
ann
ual r
epor
t 20
05
60
Notes to the Financial Statementsat 30 September 2005
26. FINANCIAL INSTRUMENTS AND RISK MANAGEMENT POLICIES
The Group does not trade in derivative financial instruments but, in the normal course of operations, the Group
is exposed to currency, credit and liquidity risk. In order to manage these risks, the Group may enter into
transactions which make use of derivative financial instruments. The Group has developed a risk management
process to facilitate, control and monitor these risks. This process includes formal documentation of policies,
including limits, controls and reporting structures.
26.1 Foreign currency management
The Group enters into forward exchange contracts to cover all foreign purchases in order to manage its
foreign currency exposure. All outstanding forward exchange contracts are due to mature within three
months of the year end. Material forward exchange contracts at 30 September are summarised below:
Rand Average
equivalent rate
2005
US Dollars 10 575 190 6,51
Japanese Yen 733 371 0,06
Euro 255 521 7,86
2004
US Dollars 9 824 996 6,50
Japanese Yen 108 036 0,06
British Pound 77 632 11,71
Euro 1 129 506 7,89
26.2 Foreign companies
The Group has investments in foreign companies which are classified
as foreign entities. The rates used in translating the income
statements and balance sheets of these entities are as follows:
Average Closing
rate rate
2005
US Dollars 6,26 6,37
British Pound 11,56 11,22
2004
US Dollars 6,63 6,45
British Pound 11,89 11,62
26.3 Interest rate management
As part of the process of managing the Group's interest rate risk, interest rate characteristics of new
borrowings and the refinancing of existing borrowings are positioned according to expected movements
in interest rates. Full details of interest rates relating to borrowings are detailed in notes 21 and 22.
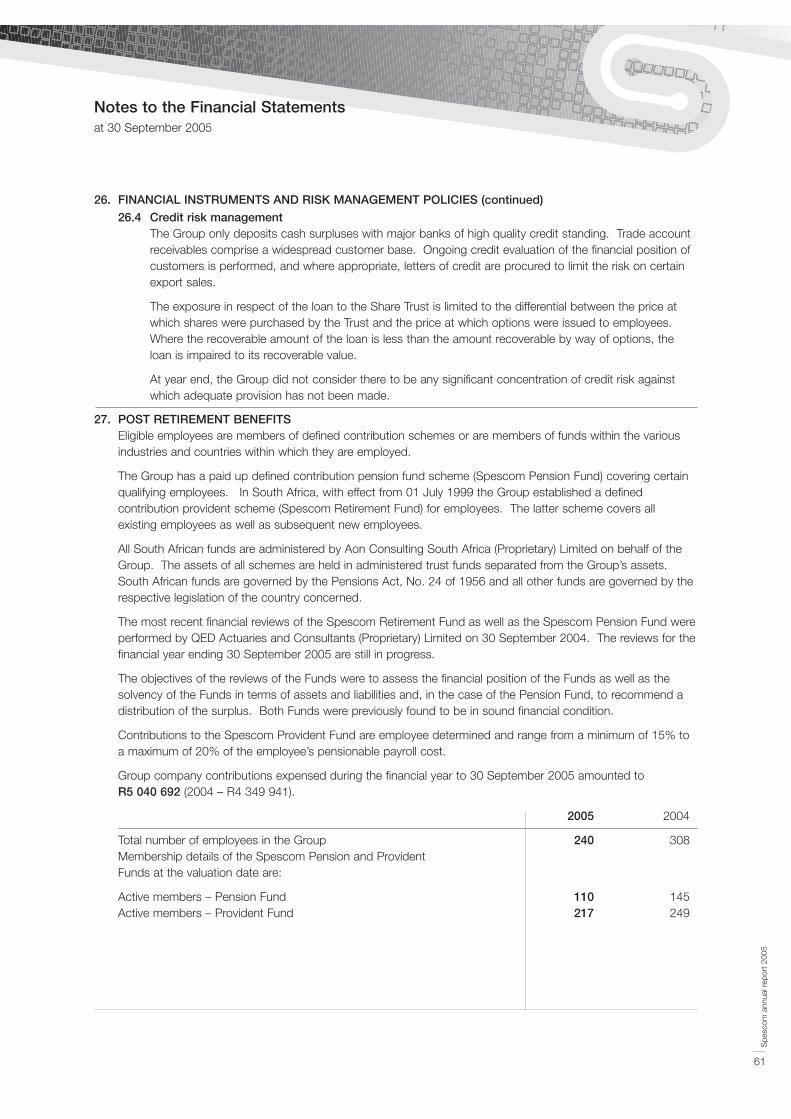
Spe
scom
ann
ual r
epor
t 20
05
61
Notes to the Financial Statementsat 30 September 2005
26. FINANCIAL INSTRUMENTS AND RISK MANAGEMENT POLICIES (continued)
26.4 Credit risk managementThe Group only deposits cash surpluses with major banks of high quality credit standing. Trade accountreceivables comprise a widespread customer base. Ongoing credit evaluation of the financial position ofcustomers is performed, and where appropriate, letters of credit are procured to limit the risk on certainexport sales.
The exposure in respect of the loan to the Share Trust is limited to the differential between the price atwhich shares were purchased by the Trust and the price at which options were issued to employees.Where the recoverable amount of the loan is less than the amount recoverable by way of options, theloan is impaired to its recoverable value.
At year end, the Group did not consider there to be any significant concentration of credit risk againstwhich adequate provision has not been made.
27. POST RETIREMENT BENEFITSEligible employees are members of defined contribution schemes or are members of funds within the variousindustries and countries within which they are employed.
The Group has a paid up defined contribution pension fund scheme (Spescom Pension Fund) covering certainqualifying employees. In South Africa, with effect from 01 July 1999 the Group established a definedcontribution provident scheme (Spescom Retirement Fund) for employees. The latter scheme covers allexisting employees as well as subsequent new employees.
All South African funds are administered by Aon Consulting South Africa (Proprietary) Limited on behalf of theGroup. The assets of all schemes are held in administered trust funds separated from the Group’s assets.South African funds are governed by the Pensions Act, No. 24 of 1956 and all other funds are governed by therespective legislation of the country concerned.
The most recent financial reviews of the Spescom Retirement Fund as well as the Spescom Pension Fund wereperformed by QED Actuaries and Consultants (Proprietary) Limited on 30 September 2004. The reviews for thefinancial year ending 30 September 2005 are still in progress.
The objectives of the reviews of the Funds were to assess the financial position of the Funds as well as thesolvency of the Funds in terms of assets and liabilities and, in the case of the Pension Fund, to recommend adistribution of the surplus. Both Funds were previously found to be in sound financial condition.
Contributions to the Spescom Provident Fund are employee determined and range from a minimum of 15% toa maximum of 20% of the employee’s pensionable payroll cost.
Group company contributions expensed during the financial year to 30 September 2005 amounted toR5 040 692 (2004 – R4 349 941).
2005 2004
Total number of employees in the Group 240 308Membership details of the Spescom Pension and Provident Funds at the valuation date are:
Active members – Pension Fund 110 145Active members – Provident Fund 217 249
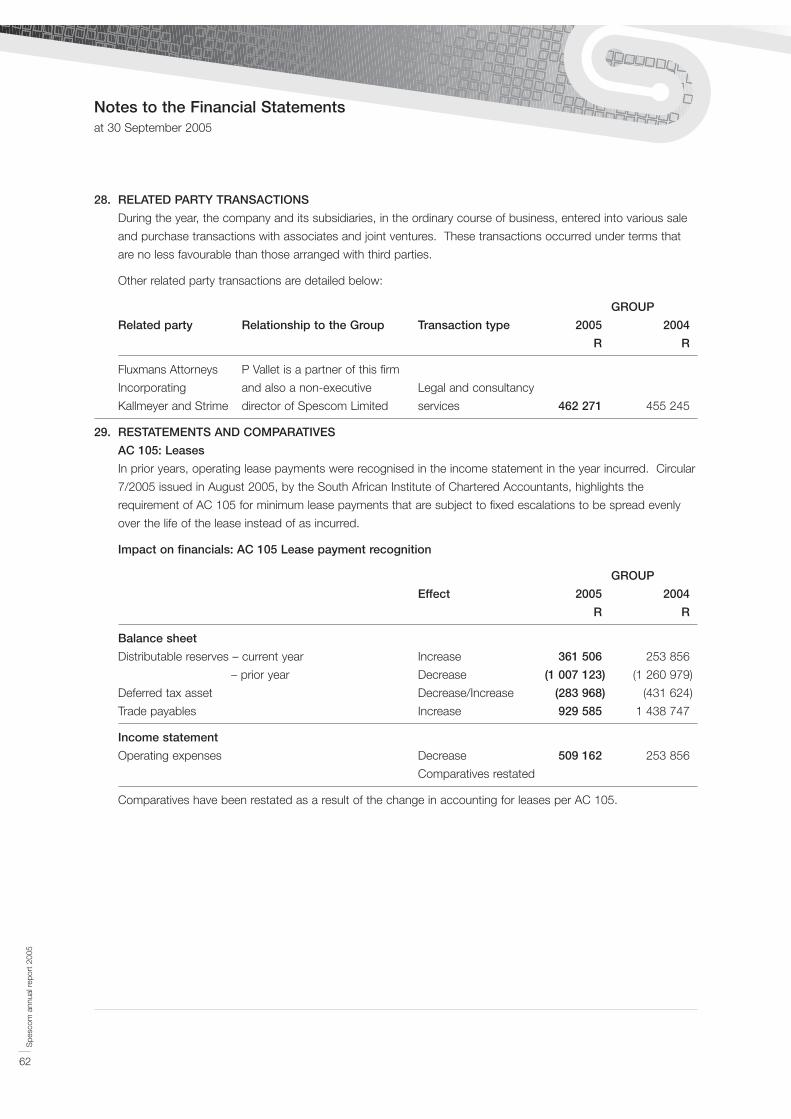
Spe
scom
ann
ual r
epor
t 20
05
62
Notes to the Financial Statementsat 30 September 2005
28. RELATED PARTY TRANSACTIONS
During the year, the company and its subsidiaries, in the ordinary course of business, entered into various sale
and purchase transactions with associates and joint ventures. These transactions occurred under terms that
are no less favourable than those arranged with third parties.
Other related party transactions are detailed below:
GROUP
Related party Relationship to the Group Transaction type 2005 2004
R R
Fluxmans Attorneys P Vallet is a partner of this firm
Incorporating and also a non-executive Legal and consultancy
Kallmeyer and Strime director of Spescom Limited services 462 271 455 245
29. RESTATEMENTS AND COMPARATIVES
AC 105: Leases
In prior years, operating lease payments were recognised in the income statement in the year incurred. Circular
7/2005 issued in August 2005, by the South African Institute of Chartered Accountants, highlights the
requirement of AC 105 for minimum lease payments that are subject to fixed escalations to be spread evenly
over the life of the lease instead of as incurred.
Impact on financials: AC 105 Lease payment recognition
GROUP
Effect 2005 2004
R R
Balance sheet
Distributable reserves – current year Increase 361 506 253 856
– prior year Decrease (1 007 123) (1 260 979)
Deferred tax asset Decrease/Increase (283 968) (431 624)
Trade payables Increase 929 585 1 438 747
Income statement
Operating expenses Decrease 509 162 253 856
Comparatives restated
Comparatives have been restated as a result of the change in accounting for leases per AC 105.
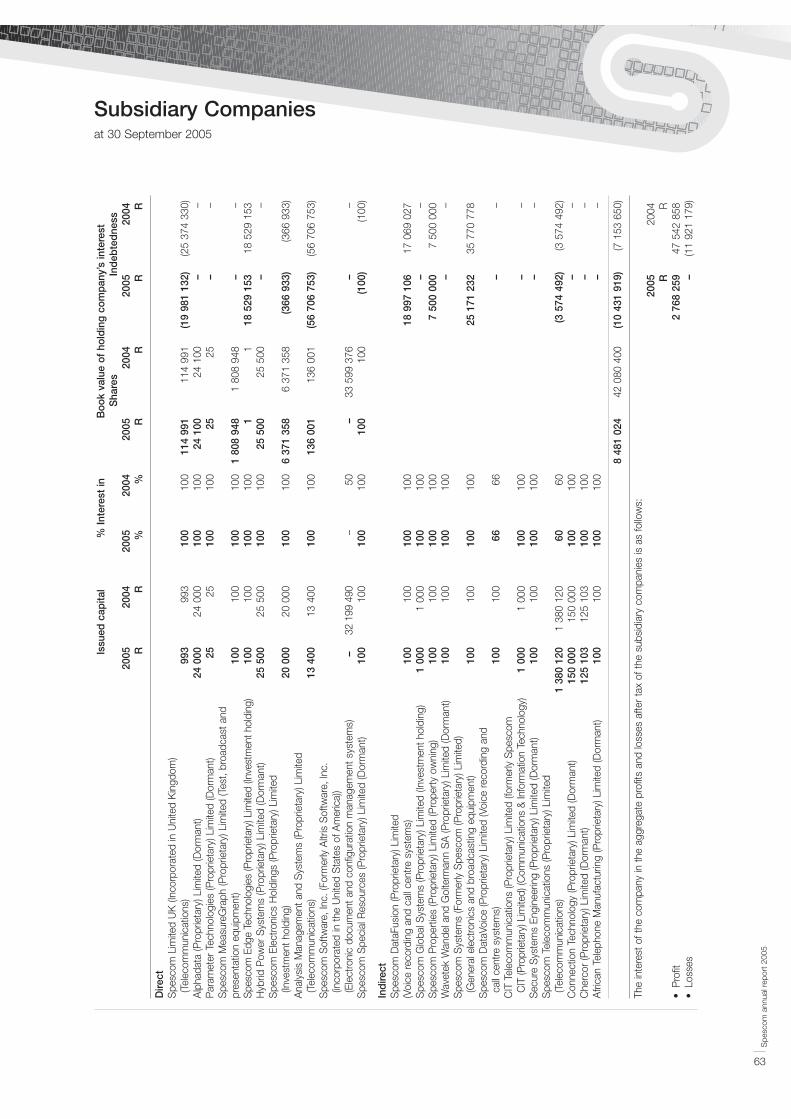
Spe
scom
ann
ual r
epor
t 20
05
63
Subsidiary Companiesat 30 September 2005
Issu
ed c
apita
l%
Inte
rest
inB
ook
valu
e of
hol
ding
com
pany
’s in
tere
stS
hare
sIn
debt
edne
ss20
0520
0420
0520
0420
0520
0420
0520
04R
R%
%R
RR
R
Dire
ctS
pesc
om L
imite
d U
K (I
ncor
pora
ted
in U
nite
d K
ingd
om)
(Tel
ecom
mun
icat
ions
)99
399
310
010
011
4 99
111
4 99
1(1
9 98
1 13
2)(2
5 37
4 33
0)A
lpha
data
(Pro
prie
tary
) Lim
ited
(Dor
man
t)24
000
24 0
0010
010
024
100
24 1
00–
–P
aram
eter
Tec
hnol
ogie
s (P
ropr
ieta
ry) L
imite
d (D
orm
ant)
2525
100
100
2525
––
Spe
scom
Mea
sure
Gra
ph (P
ropr
ieta
ry) L
imite
d (T
est,
broa
dcas
t and
pr
esen
tatio
n eq
uipm
ent)
100
100
100
100
1 80
8 94
81
808
948
––
Spes
com
Edg
e Te
chno
logi
es (P
ropr
ieta
ry) L
imite
d (In
vest
men
t hol
ding
)10
010
010
010
01
118
529
153
18 5
29 1
53H
ybrid
Pow
er S
yste
ms
(Pro
prie
tary
) Lim
ited
(Dor
man
t)25
500
25 5
0010
010
025
500
25 5
00–
–S
pesc
om E
lect
roni
cs H
oldi
ngs
(Pro
prie
tary
) Lim
ited
(Inve
stm
ent h
oldi
ng)
20 0
0020
000
100
100
6 37
1 35
86
371
358
(366
933
)(3
66 9
33)
Ana
lysi
s M
anag
emen
t and
Sys
tem
s (P
ropr
ieta
ry) L
imite
d (T
elec
omm
unic
atio
ns)
13 4
0013
400
100
100
136
001
136
001
(56
706
753)
(56
706
753)
Spe
scom
Sof
twar
e, In
c. (F
orm
erly
Altr
is S
oftw
are,
Inc.
(in
corp
orat
ed in
the
Uni
ted
Sta
tes
of A
mer
ica)
) (E
lect
roni
c do
cum
ent a
nd c
onfig
urat
ion
man
agem
ent s
yste
ms)
–32
199
490
–50
–33
599
376
––
Spe
scom
Spe
cial
Res
ourc
es (P
ropr
ieta
ry) L
imite
d (D
orm
ant)
100
100
100
100
100
100
(100
)(1
00)
Indi
rect
S
pesc
om D
ataF
usio
n (P
ropr
ieta
ry) L
imite
d (V
oice
reco
rdin
g an
d ca
ll ce
ntre
sys
tem
s)10
010
010
010
018
997
106
17 0
69 0
27S
pesc
om G
loba
l Sys
tem
s (P
ropr
ieta
ry) L
imite
d (In
vest
men
t hol
ding
)1
000
1 00
010
010
0–
–S
pesc
om P
rope
rties
(Pro
prie
tary
) Lim
ited
(Pro
perty
ow
ning
)10
010
010
010
07
500
000
7 50
0 00
0W
avet
ek W
ande
l and
Gol
term
ann
SA
(Pro
prie
tary
) Lim
ited
(Dor
man
t)10
010
010
010
0–
–S
pesc
om S
yste
ms
(For
mer
ly S
pesc
om (P
ropr
ieta
ry) L
imite
d)
(Gen
eral
ele
ctro
nics
and
bro
adca
stin
g eq
uipm
ent)
100
100
100
100
25 1
71 2
3235
770
778
Spe
scom
Dat
aVoi
ce (P
ropr
ieta
ry) L
imite
d (V
oice
reco
rdin
g an
d ca
ll ce
ntre
sys
tem
s)10
010
066
66–
–C
IT T
elec
omm
unic
atio
ns (P
ropr
ieta
ry) L
imite
d (fo
rmer
ly S
pesc
om
CIT
(Pro
prie
tary
) Lim
ited)
(Com
mun
icat
ions
& In
form
atio
n Te
chno
logy
)1
000
1 00
010
010
0–
–S
ecur
e S
yste
ms
Engi
neer
ing
(Pro
prie
tary
) Lim
ited
(Dor
man
t)10
010
010
010
0–
–S
pesc
om T
elec
omm
unic
atio
ns (P
ropr
ieta
ry) L
imite
d (T
elec
omm
unic
atio
ns)
1 38
0 12
01
380
120
6060
(3 5
74 4
92)
(3 5
74 4
92)
Con
nect
ion
Tech
nolo
gy (P
ropr
ieta
ry) L
imite
d (D
orm
ant)
150
000
150
000
100
100
––
Che
rcor
(Pro
prie
tary
) Lim
ited
(Dor
man
t)12
5 10
312
5 10
310
010
0–
–A
frica
n Te
leph
one
Man
ufac
turin
g (P
ropr
ieta
ry) L
imite
d (D
orm
ant)
100
100
100
100
––
8 48
1 02
442
080
400
(10
431
919)
(7 1
53 6
50)
The
inte
rest
of t
he c
ompa
ny in
the
aggr
egat
e pr
ofits
and
loss
es a
fter t
ax o
f the
sub
sidi
ary
com
pani
es is
as
follo
ws:
2005
2004
RR
•P
rofit
2
768
259
47 5
42 8
58•
Loss
es
–(1
1 92
1 17
9)

Spe
scom
ann
ual r
epor
t 20
05
64
Joint Venturesat 30 September 2005
Proportion of
ownership
2005 2004
UNLISTED JOINT VENTURE
Technologies QS (Proprietary) Limited (formerly Quante Spescom (Proprietary) Limited) 39,0% 39,0%
Telecommunications interconnection technology
– voluntary liquidation confirmed by the Master of the Court during September 2004
Group’s proportionate
share of joint venture
financial statements
INCOME STATEMENT
Turnover – –
Income before taxation – 12 828
Net attributable income – 12 828
2005 2004
R R
CASH FLOW STATEMENT
Operating activities
Cash generated by operations – (246)
Working capital changes – 3 791 219
Cash generated by operating activities – 3 790 973
Net finance costs – 13 075
Taxation paid – (8 062)
Cash available from operating activities – 3 795 986
Financing activities
Repayment of net asset value – (4 293 467)
– (4 293 467)
Cash and cash equivalents
Net movement in year – (497 481)
At beginning of year – 497 481
At end of year – –
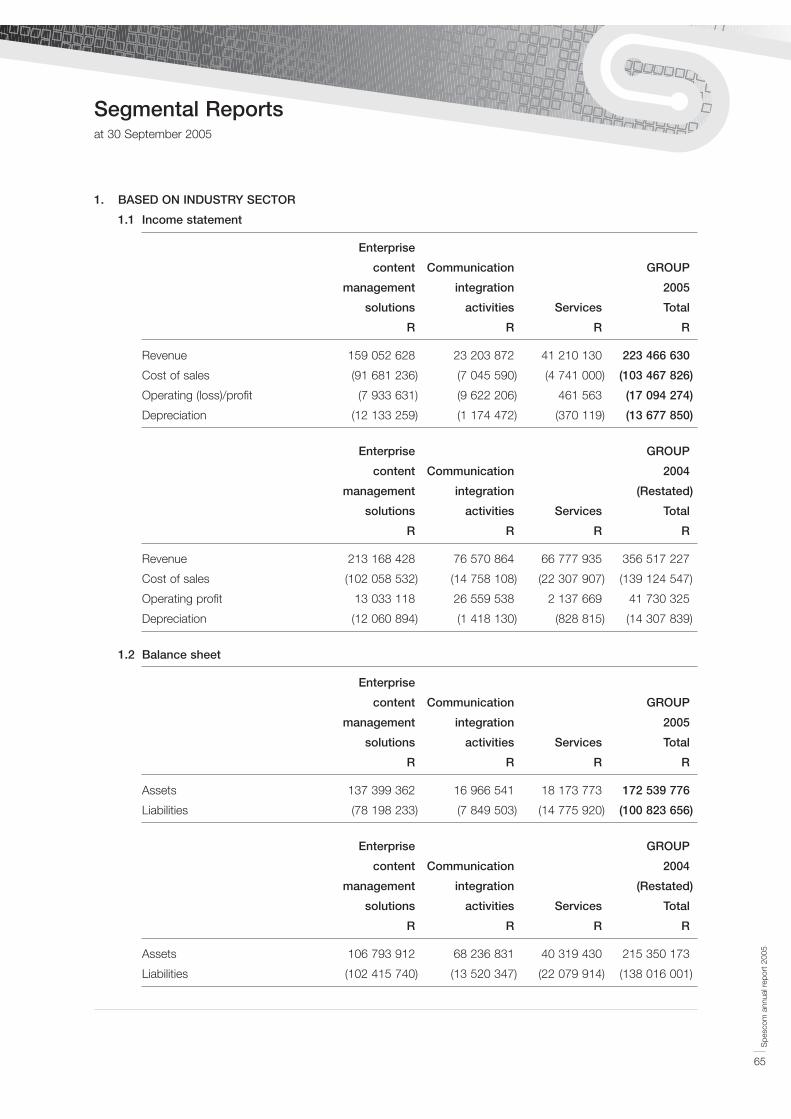
Spe
scom
ann
ual r
epor
t 20
05
65
Segmental Reportsat 30 September 2005
1. BASED ON INDUSTRY SECTOR
1.1 Income statement
Enterprise
content Communication GROUP
management integration 2005
solutions activities Services Total
R R R R
Revenue 159 052 628 23 203 872 41 210 130 223 466 630
Cost of sales (91 681 236) (7 045 590) (4 741 000) (103 467 826)
Operating (loss)/profit (7 933 631) (9 622 206) 461 563 (17 094 274)
Depreciation (12 133 259) (1 174 472) (370 119) (13 677 850)
Enterprise GROUP
content Communication 2004
management integration (Restated)
solutions activities Services Total
R R R R
Revenue 213 168 428 76 570 864 66 777 935 356 517 227
Cost of sales (102 058 532) (14 758 108) (22 307 907) (139 124 547)
Operating profit 13 033 118 26 559 538 2 137 669 41 730 325
Depreciation (12 060 894) (1 418 130) (828 815) (14 307 839)
1.2 Balance sheet
Enterprise
content Communication GROUP
management integration 2005
solutions activities Services Total
R R R R
Assets 137 399 362 16 966 541 18 173 773 172 539 776
Liabilities (78 198 233) (7 849 503) (14 775 920) (100 823 656)
Enterprise GROUP
content Communication 2004
management integration (Restated)
solutions activities Services Total
R R R R
Assets 106 793 912 68 236 831 40 319 430 215 350 173
Liabilities (102 415 740) (13 520 347) (22 079 914) (138 016 001)
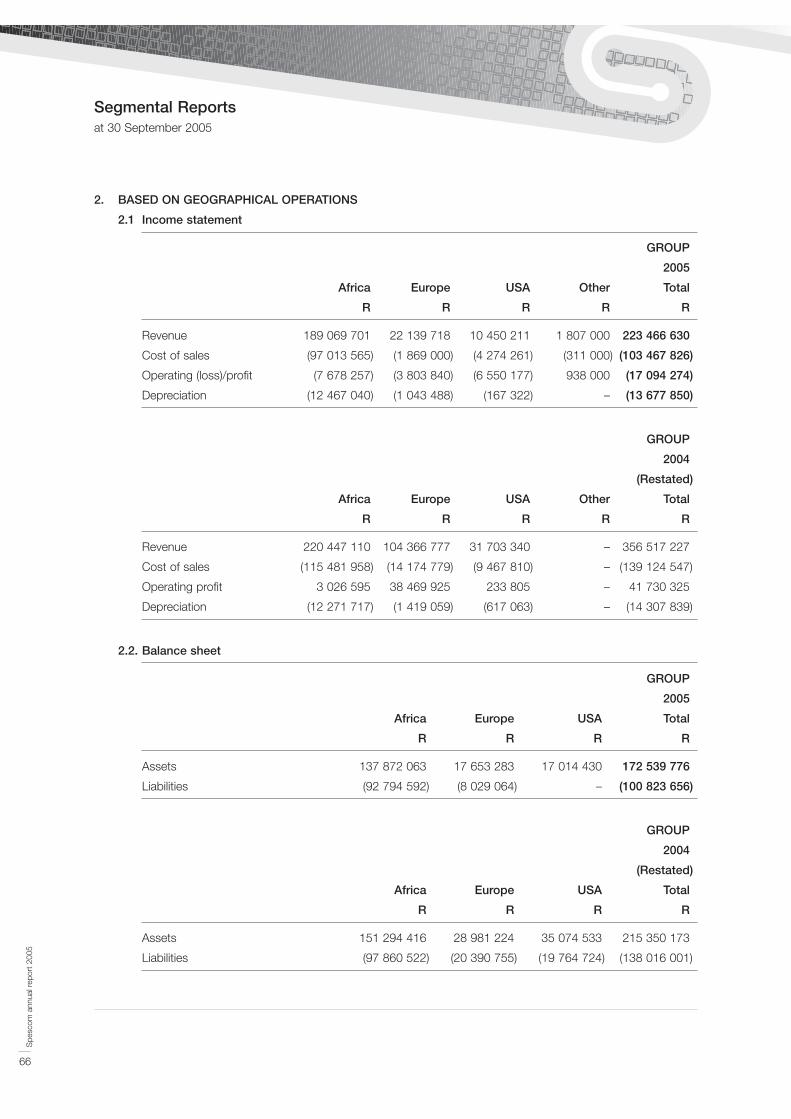
Spe
scom
ann
ual r
epor
t 20
05
66
Segmental Reports at 30 September 2005
2. BASED ON GEOGRAPHICAL OPERATIONS
2.1 Income statement
GROUP
2005
Africa Europe USA Other Total
R R R R R
Revenue 189 069 701 22 139 718 10 450 211 1 807 000 223 466 630
Cost of sales (97 013 565) (1 869 000) (4 274 261) (311 000) (103 467 826)
Operating (loss)/profit (7 678 257) (3 803 840) (6 550 177) 938 000 (17 094 274)
Depreciation (12 467 040) (1 043 488) (167 322) – (13 677 850)
GROUP
2004
(Restated)
Africa Europe USA Other Total
R R R R R
Revenue 220 447 110 104 366 777 31 703 340 – 356 517 227
Cost of sales (115 481 958) (14 174 779) (9 467 810) – (139 124 547)
Operating profit 3 026 595 38 469 925 233 805 – 41 730 325
Depreciation (12 271 717) (1 419 059) (617 063) – (14 307 839)
2.2. Balance sheet
GROUP
2005
Africa Europe USA Total
R R R R
Assets 137 872 063 17 653 283 17 014 430 172 539 776
Liabilities (92 794 592) (8 029 064) – (100 823 656)
GROUP
2004
(Restated)
Africa Europe USA Total
R R R R
Assets 151 294 416 28 981 224 35 074 533 215 350 173
Liabilities (97 860 522) (20 390 755) (19 764 724) (138 016 001)

Spe
scom
ann
ual r
epor
t 20
05
67
Directors’ Remunerationat 30 September 2005
Non-executive directors:
GROUP
Retirement
Name Basic Performance and other Total Total
Fees salary bonus benefits 2005 2004
R R R R R R
J Myers 345 500 – – – 345 500 242 500
M Mogase 138 500 – – – 138 500 117 500
P Vallet 147 000 – – – 147 000 142 500
L Ogilvy 119 000 – – – 119 000 137 500
W Kansteiner 82 500 – – – 82 500 22 500
Total 832 500 – – – 832 500 662 500
Executive directors:
GROUP
Retirement
Basic Performance and other Total Total
Name Fees salary bonus benefits 2005 2004
R R R R R R
A Farah – 1 431 424 380 000 425 839 2 237 263 1 979 683
H Isaacman – 1 053 333 – 184 025 1 237 358 1 542 685
J Palmer – 906 359 450 000 162 006 1 518 365 1 093 703
C Mostert (resigned 1 March 2005) – 537 172 – 26 227 563 399 1 452 930
V Leas (resigned 20 August 2004) – – – – – 2 619 848
Total – 3 928 288 830 000 798 097 5 556 385 8 688 849
Messrs C Mostert and W Kansteiner are resident in the United States of America and their remuneration is
denominated in US Dollars. For the purposes of reporting, their remuneration has been converted into South African
Rand (ZAR).

Spe
scom
ann
ual r
epor
t 20
05
68
Directors’ Share Options at 30 September 2005
Spescom Limited share options: 30 September 2005
Weighted
Options held Granted average –
at beginning during Options held price
Name of year the year at year end closing
A Farah 150 000 190 000 340 000 0,90
H Isaacman 150 000 190 000 340 000 0,90
J Palmer 130 000 190 000 320 000 1,13
L Ogilvy – – – –
W Kansteiner – – – –
P Vallet – – – –
M Mogase – – – –
J Myers – – – –
C Rezek – – – –
Total 430 000 570 000 1 000 000
Spescom Software Inc. share options: 30 September 2005
Weighted
Options held Granted average –
at beginning during Options held price
Name of year the year at year end closing
USD
A Farah 300 000 – 300 000 0,21
H Isaacman 300 000 – 300 000 0,21
J Myers 125 000 – 125 000 0,22
Total 725 000 – 725 000

Spe
scom
ann
ual r
epor
t 20
05
69
Directors’ Share Options at 30 September 2005
Spescom Limited share options: 30 September 2004
Weighted
Options held Granted average –
at beginning during Options held price
Name of year the year at year end closing
R
A Farah 150 000 – 150 000 0,55
H Isaacman 150 000 – 150 000 0,55
J Palmer 130 000 – 130 000 1,08
C Mostert (resigned 1 March 2005) 150 000 – 150 000 0,55
L Ogilvy – – – –
P Vallet – – – –
M Mogase – – – –
J Myers – – – –
C Rezek – – – –
W Kansteiner – – – –
Total 580 000 – 580 000
Spescom Software Inc. share options: 30 September 2004
Weighted
Options held Granted average –
at beginning during Options held price
Name of year the year at year end closing
USD
A Farah 300 000 – 300 000 0,21
H Isaacman 300 000 – 300 000 0,21
C Mostert (resigned 1 March 2005) 750 000 – 750 000 0,20
J Myers 100 000 25 000 125 000 0,22
Total 1 450 000 25 500 1 475 000

Notice is hereby given that the eighteenth Annual General Meeting of members of Spescom Limited, registration
number 1987/001083/06, will be held in the Spescom Boardroom, 1st Floor, Spescom Park, Cnr. Alexandra Avenue
and Second Road, Halfway House, Midrand on Friday, 31 March 2006 at 09h00 to conduct the following business:
Ordinary Resolution 1
To receive and adopt the consolidated audited annual financial statements of the company and its subsidiaries,
incorporating the auditors’ and directors’ reports for the year ended 30 September 2005.
Ordinary Resolution 2
To re-elect by way of separate resolutions directors in the place of those retiring in accordance with the company’s
Articles of Association. The directors retiring are Messrs T Makore, M Mogase, J Myers, J Palmer and P Vallet, all of
whom, being eligible, offer themselves for re-election.
An abbreviated curriculum vitae in respect of each director offering him/herself for re-election is contained in the
explanatory notes to the notice of Annual General Meeting.
Ordinary Resolution 3
To sanction the current remuneration payable to non-executive directors as set out in the table contained in the
explanatory notes to the notice of Annual General Meeting.
Ordinary Resolution 4
To sanction the proposed remuneration payable to non-executive directors, payable from 31 March 2006 as set out
in the table contained in the explanatory notes to the notice of Annual General Meeting.
Ordinary Resolution 5
To re-appoint Ernst & Young as independent auditors of the company and to authorise the directors to determine
the remuneration of the auditors for the past year’s audit as reflected in note 4 of the annual financial statements.
As special business, to consider and if deemed fit, pass with or without modification the following ordinary
resolutions numbered 6, 7 and 8:
Ordinary Resolution 6
That the unissued authorised shares in the capital of the company be and are hereby placed under the control of
the directors until the next Annual General Meeting of the company for allotment and issue to such persons and
upon such terms and subject to such conditions as the directors in their sole discretion may determine from time to
time, but at all times subject to the provisions of the Companies Act No. 61 of 1973, as amended, and to the rules
and regulations of the JSE Limited (“the JSE”).
Ordinary Resolution 7
That in terms of the Listings Requirements of the JSE, the directors be given the general authority to issue ordinary
shares of one cent each for cash to the public as and when suitable situations arise, subject to the following
conditions:
• That this authority is in the form of a renewable mandate and is valid until the company’s next Annual General
Meeting, but it shall not extend beyond 15 (fifteen) months from the date of this Annual General Meeting.
• That a paid press announcement giving full details, including the impact on net asset value and earnings per
share, will be published at the time of any issue representing, on a cumulative basis within one year, 5% or more
of the number of shares of that class in issue prior to the issues.
Spe
scom
ann
ual r
epor
t 20
05
70
Notice of Annual General Meeting
• That issues in the aggregate in any one year may not exceed 15% of the number of shares of that class of the
company’s issued share capital.
• That, in determining the price at which an issue of shares will be made in terms of this authority, the maximum
discount permitted will be 10% of the weighted average ruling price of the shares in question, as determined over
the 30 business days prior to the date that the price of the issue is determined or agreed by the directors of the
company.
• That the shares must be issued to public shareholders and not to related parties.
• That approval is required by achieving a 75% majority of the votes cast in favour of the resolution by all equity
security holders present or represented by proxy at this Annual General Meeting convened to approve such
resolution.
Ordinary Resolution 8
That any one director or the Secretary of the company be and are hereby authorised to do all such things and sign
all documents and take all such action as they consider necessary to implement the resolutions set out in the notice
convening the Annual General Meeting at which this ordinary resolution will be considered.
Any shareholder holding shares in certificated form or recorded on the company’s sub-register in electronic
dematerialised form in “own name” and entitled to attend, speak and vote at the meeting is entitled to appoint a
proxy to attend, speak and on a poll vote in his stead. A proxy need not be a member of the company.
Proxy forms must be lodged at the registered office of the company at Spescom Park, Cnr. Alexandra Avenue &
2nd Road, Halfway House, Midrand, 1685, South Africa (Postal address P O Box 288, Halfway House, 1685) or at
the offices of the transfer secretaries, Computershare Investor Services 2004 (Proprietary) Limited (70 Marshall
Street, Corner Sauer Street, Johannesburg; P O Box 61051, Marshalltown, 2107) by no later than 09h00 on
Wednesday, 29 March 2006.
All beneficial owners whose shares have been dematerialised through a Central Securities Depository Participant
(“CSDP”) or broker other than with “own name” registration, must provide the CSDP or broker with their voting
instructions in terms of their custody agreement should they wish to vote at the Annual General Meeting.
Alternatively, they may request the CSDP or broker to provide them with a letter of representation, in terms of their
custody agreements, should they wish to attend the Annual General Meeting.
By order of the Board
NYELETI MAGADZE
Company Secretary
Midrand
31 January 2006
Spe
scom
ann
ual r
epor
t 20
05
71
Notice of Annual General Meeting
Spe
scom
ann
ual r
epor
t 20
05
72
Notice of Annual General Meeting Explanatory Notes
Ordinary Resolution 1 – Adoption of annual financial statements
At the Annual General Meeting, the directors must present the annual financial statements for the year ended
30 September 2005 to shareholders, together with the reports of the directors and the auditors. These are
contained within the Annual Report.
Ordinary Resolution 2 – Re-election of directors
In accordance with the company’s Articles of Association, one third of the directors are required to retire at each
Annual General Meeting and may offer themselves for re-election. In addition, any person appointed to the Board of
Directors is similarly required to retire and is eligible for re-election at the next Annual General Meeting.
The following Directors are eligible for re-election:
Thomas Makore
Mutle Mogase
James Myers
Jené Palmer
Phillip Vallet
Brief biographical details of each of the above directors and the remaining members of the Board are set out
hereunder.
James Myers (65)
is Chairperson as well as an independent non-executive director of the company, having been appointed to the
Board on 23 October 2003. He is a past President of the American Chamber of Commerce in South Africa and is
currently a director of African Merchant Bank Limited, Spescom Software Inc., and Econet Wireless Global.
Tony Farah (57)
is Chief Executive Officer of the Spescom Group, a position he has held since 1977. He is a founding member and
Vice President (1993) of the Electronics Industries Federation. In 2000, he was the only South African nominated as
a Technology Pioneer and represented South Africa at the World Economic Forum at Davos. He was elected to
serve on the Presidential National Commission on Information Society and Development in 2002.
Walter Kansteiner III (51)
joined the Board of the company as an independent non-executive director on 5 April 2004. He was until recently
the Assistant Secretary of State for African Affairs reporting directly to Colin Powell. He is now a senior partner of the
Scowcroft Group (of which he was a founding principal). Mr Kansteiner has more than 20 years experience with
African and emerging market business issues and has advised corporations on a wide range of mergers,
acquisitions and privatisation throughout Africa involving amongst others the telecommunications sector. In this
respect Mr Kansteiner recently advised the buy side on the $1.3 billion privatisation of Telkom SA Limited, the
largest privatisation in Africa to date.
Thomas Makore (40)
joined Spescom Telecommunications (Pty) Limited as Chief Executive Officer on 1 March 2005 and was appointed
to the Board of Spescom Limited on 21 October 2005. Prior to joining the Spescom Group, he was the Managing
Director of Diebold South Africa (Pty) Limited and Siemens Power. Mr Makore’s experience covers management,
customer relationship management, sales and marketing, project management and systems engineering. He is
registered with various professional institutions including ECSA, SAIEE, UK Engineering Council and the IEE and
holds a BSc Eng Hons Electrical and a Masters of Business Leadership.
Spe
scom
ann
ual r
epor
t 20
05
73
Notice of Annual General Meeting Explanatory Notes
Mutle Mogase (41)
is an independent non-executive director of the company having been appointed to the Board on 23 October 2003.
He is presently the Chairman of Vantage Capital. Mr Mogase was also instrumental in the establishment of Real
Africa Investments Limited and Nubank of which he was Chief Executive Officer for three years. He is a current
director of Gemini Consulting (Pty) Limited, Air Liquide (Pty) Limited and the Micro-Finance Regulatory Council.
Lynne Ogilvy (51)
joined the Board of the company as an independent non-executive director on 15 September 2002. Ms Ogilvy has
25 years experience in the computer and IT industry in South Africa and was previously a director of Hi Performance
Systems (Pty) Limited and Usko Limited as well as the Managing Director of Hewlett Packard SA (Pty) Limited.
Jené Palmer (35)
is Chief Financial Officer of the company, having been appointed to the Board as an executive director on
23 October 2003. Ms Palmer joined the Spescom Group in 1998 having previously been the financial accountant
for Intaba Chemicals (Pty) Limited, a subsidiary of Omnia Limited. She completed her accounting articles of clerkship
with McAllister Dobeyn in 1995.
Colin Rezek (50)
joined the Board of the company as an alternate non-executive director to Mutle Mogase on 13 May 2004.
Mr Rezek’s previous experience includes senior management positions in the operational, marketing and new
business development of the listed group Venture Motor Holdings. In 1998 and 1999, he assisted in the
establishment and management of the Equity Africa Fund. Pursuant thereto he has been involved in the
establishment of MMR Equity Capital, a private equity management company and MMR Advisory, a corporate
finance advisory business which became Vantage Capital.
Phillip Vallet (59)
joined the Board of the company as an independent non-executive director on 23 October 2003. He is presently
the Chief Executive Officer of Fluxmans Attorneys, the Chairman of Super Group Limited as well as being a director
of Caxton and CTP Publishers and Printers Limited. In 2003, Mr Vallet was listed in Chambers Global World
Leading Lawyers as a leading individual in corporate and M&A work in Southern Africa.
Ordinary Resolution 3 – Current remuneration of non-executive directors
Shareholders are requested to sanction the current remuneration payable to non-executive directors as set out in
the table hereunder. Full particulars of all fees and remuneration for the past financial year are contained on page 67
of the annual report.
Ordinary Resolution 4 – Proposed remuneration of non-executive directors payable from 31 March 2006
Shareholders are requested to consider and if deemed appropriate, sanction the proposed remuneration payable to
non-executive directors with effect from 31 March 2006 as set out in the table hereunder. Full particulars of all fees
and remuneration for the past financial year are contained on page 67 of the annual report.

Spe
scom
ann
ual r
epor
t 20
05
74
Notice of Annual General Meeting Explanatory Notes
Proposed remuneration
payable with effect from
Category Current remuneration 31 March 2006 Note
Spescom Limited Board
Chairman R210 000 annual retainer R210 000 annual retainer (1)
R20 000 per meeting attended R20 000 per meeting attended
Board member R40 000 annual retainer R40 000 annual retainer (2)
R10 000 per meeting attended R10 000 per meeting attended
Audit Committee
Chairman R26 000 annual retainer R15 000 per meeting attended (3)
Audit Committee member (ACM) R13 000 per meeting attended R13 000 per meeting attended (4)
Remuneration Committee
Chairman R13 000 annual retainer R8 000 per meeting attended (5)
R6 500 per meeting attended
Remuneration Committee
member (RCM) R6 500 per meeting attended R 6 500 per meeting attended (6)
Nomination Committee
Chairman R5 000 per meeting attended R5 000 per meeting attended (7)
Nomination Committee member R4 000 per meeting attended R4 000 per meeting attended (8)
Notes
(1) It is proposed that the non-executive chairman of the Board receives a fee calculated at three times the total
annual Board fees payable to a Board member (retainer plus minimum four Board meetings), in addition to the
other committee fees set out above.
(2) The company holds minimum four Board meetings during any 12 month period.
(3) The Audit Committee chairman receives a higher fee than the fee payable to non-executive directors who serve
on the Audit Committee.
(4) The company holds a minimum of three Audit Committee meetings during any 12 month period.
(5) The Remuneration Committee chairman receives a higher fee than the fee payable to non-executive directors
who serve on the Remuneration Committee.
(6) The company holds a minimum of two Remuneration Committee meetings during any 12 month period.
(7) The Nomination Committee chairman receives a higher fee than the fee payable to non-executive directors who
serve on the Nomination Committee.
(8) The company holds a minimum of one Nomination Committee meeting during any 12 month period.
Spe
scom
ann
ual r
epor
t 20
05
75
Notice of Annual General Meeting Explanatory Notes
Ordinary Resolution 5 – Auditors
Ernst & Young has indicated its willingness to continue in office and resolution 5 proposes the re-appointment of
that firm as the company’s auditors until the next Annual General Meeting. The resolution also gives authority to the
directors to fix the auditors’ remuneration.
Ordinary Resolutions 6 and 7 – Placement and Issue of shares
In terms of Sections 221 and 222 of the Companies Act No. 61 of 1973, as amended, the shareholders have to
approve the placement of the unissued shares under the control of the directors. A general authority to issue
shares for cash has also been granted to the directors. The authorities will be subject to the Companies Act No. 61
of 1973, as amended, and the JSE Listings Requirements.
The effect of ordinary resolution number 7 and the reason therefor is that as more than 35% of the company’s
issued shares are in the hands of the public as defined by the JSE, the approval of a 75% majority of the votes cast
by shareholders present or represented by proxy at this Annual General Meeting is required for this ordinary
resolution to become effective.
Ordinary Resolution 8
One director or the Secretary of the company be authorised to do all such things and sign all documents and take
all such action as they consider necessary to implement the resolutions set out in the notice convening the Annual
General Meeting at which this ordinary resolution will be considered.
Spe
scom
ann
ual r
epor
t 20
05
76
Administration
COMPANY DETAILS
Spescom Limited
Registration No. 1987/001083/06
Share Code: SPS
ISIN: ZAE000017919
Listed on the JSE Securities Exchange South Africa
(JSE) under the name “Spescom” in the
“Information Technology” sub-section.
REGISTERED OFFICE
Spescom Limited
Spescom Park
Cnr. Alexandra Avenue and 2nd Road
Midrand, 1685, South Africa
Telephone: +27 11 266 1500
Facsimile: +27 11 266 1532
E-mail address: [email protected]
Website address: www.spescom.com
POSTAL ADDRESS
PO Box 288, Halfway House, 1685, South Africa
COMPANY SECRETARY
Nyeleti Magadze (32)
BProc, HDip Tax
Cnr. Alexandra Ave & 2nd Road, Midrand, 1685
PO Box 288, Halfway House, 1685,
South Africa
TRANSFER SECRETARIES
Computershare Investor Services 2004 (Proprietary)
Limited
70 Marshall Street, Johannesburg, 2001
PO Box 61051, Marshalltown, 2017, South Africa
BANKERS
First National Bank of Southern Africa Limited
No. 4 First Place, BankCity, Cnr. Simmonds
& Pritchard Streets, Johannesburg, 2001
PO Box 7791, Johannesburg, 2000, South Africa
ATTORNEYS
Fluxmans Inc Attorneys
Incorporating Kallmeyer & Strime
11 Biermann Ave, Cnr. Cradock
& Biermann Avenues, Rosebank, 2196
Private Bag X41, Saxonwold, 2132, South Africa
AUDITORS
Ernst & Young
Wanderers Office Park, 52 Corlett Drive, Illovo, 2000
PO Box 2322, Johannesburg, 2000, South Africa
SPONSOR
Investec Bank Limited
100 Grayston Drive, Sandown
Sandton, 2196, South Africa
PO Box 785700, Sandton, 2146, South Africa
Shareholders’ diary
Financial year-end 30 September 2006
Annual General Meeting 31 March 2006
Interim Report: October 2004 to March 2005 May 2006
Preliminary announcement of final results November 2006
Annual financial statements March 2007
Printed by Ince (Pty) Ltd

Spe
scom
ann
ual r
epor
t 20
05
Form of Proxy
SPESCOM LIMITED(Registration Number 1987/001083/06)
(“the company”)
Important note concerning this form of proxy.
For use at the seventeenth annual general meeting of the holders of ordinary shares in the company (“Spescom Limited shareholders”) to be held atthe registered office of Spescom Limited, Spescom Park, Corner Alexandra Avenue and Second Road, Halfway House, Midrand at 09h00 on Friday,31 March 2006 (“the annual general meeting”).
Spescom Limited shareholders who have dematerialised their Spescom Limited shares through a CSDP or broker must not complete thisform of proxy and must provide their CSDP or broker with their voting instructions, except for Spescom Limited shareholders who haveelected own name registration in the sub-register through a CSDP or broker, which shareholders must complete this form of proxy andlodge it with the transfer secretaries.
Holders of dematerialised Spescom Limited shares, other than with own name registration, wishing to attend the annual general meeting must informtheir CSDP or broker of such intention and request their CSDP/broker to issue them with the relevant authorisation to attend.
I/We
(Name (s) in full in block letters)
of
being the holder/s of ordinary shares in the company do hereby appoint:
1 or failing him/her
2 or failing him/her
3 the chairman of the Annual General Meeting;
as my/our proxy to act for me/us and on my/our behalf at the Annual General Meeting which will be held for the purpose of considering and, ifdeemed fit, passing, with or without modification, the resolutions to be proposed thereat and at any adjournment thereof, and to vote for and/oragainst the resolutions and/or abstain from voting in respect of the shares registered in my/our name/s, in accordance with the following instructions:
My/our proxy shall vote as follows: In favour of Against Abstain
Ordinary Resolution 1Adopt the annual financial statements
Ordinary Resolution 2Re-elect retiring directors: T Makore
M Mogase
J Myers
J Palmer
P Vallet
Ordinary Resolution 3 Sanction the current remuneration of the non-executive directors
Ordinary Resolution 4Sanction the proposed remuneration of the non-executive directors payable from 31 March 2006
Ordinary Resolution 5Reappoint the auditors and determine the auditors’ remuneration
Ordinary Resolution 6 The placing of the unissued shares under the control of the directors
Ordinary Resolution 7 An issue of ordinary shares for cash
Ordinary Resolution 8Authorising of any director or secretary of the company to implement resolutions
Signed at on 2006
Signature
Assisted by me (where applicable)
An entitled shareholder may appoint one or more proxies (none of whom need be a member of the company) to attend, speak and vote or abstainfrom voting in place of that entitled shareholder at the Annual General Meeting.
Please read the notes on the reverse side hereof.

Spe
scom
ann
ual r
epor
t 20
05
Notes
1. Proxies must be lodged at the company’s transfer secretary, Computershare Investor Services 2004
(Proprietary) Limited, 70 Marshall Street, Corner Sauer Street, Johannesburg; P O Box 61051, Marshalltown,
2107, so as to be received no later than 48 hours before the time fixed for the Annual General Meeting,
excluding Saturdays, Sundays and public holidays.
2. An entitled shareholder may appoint one or more persons of his own choice as his proxy/ies by inserting the
name/s of such proxy/ies in the space provided and any such proxy need not be a shareholder of the company.
Should this space be left blank, the proxy will be exercised by the chairman of the Annual General Meeting.
3. An entitled shareholder’s instructions to the proxy must be indicated by the insertion of the relevant number of
shares to be voted on behalf of that shareholder in the appropriate space provided. Failure to comply with the
above will be deemed to authorise the chairman of the Annual General Meeting, if the chairman is the
authorised proxy, to vote in favour of the resolutions at the Annual General Meeting, or any other proxy, to vote
or abstain from voting at the Annual General Meeting as the shareholder deems fit, in respect of all the shares
concerned.
4. An entitled shareholder or such shareholder’s proxy is not obliged to vote in respect of all of the shares held or
represented by such shareholder but the total number of votes for or against the resolutions and in respect of
which any abstention is recorded, may not exceed the total number of votes to which the shareholder or such
shareholder’s proxy is entitled.
5. The authority of the person signing the form of proxy under a power of attorney must be attached hereto,
unless that power of attorney has already been recorded by the transfer secretaries of the company or waived
by the chairman of the Annual General Meeting. A minor must be assisted by his/her parents or guardian
unless the relevant documents establishing his/her capacity are produced or have been registered by the
transfer secretaries of the company.
6. The completion and lodging of a form of proxy will not preclude the relevant entitled shareholder from attending
the Annual General Meeting and speaking and voting or abstaining from voting in person thereat to the
exclusion of any proxy appointed in terms hereof, should such entitled shareholder wish to do so.
7. Any alteration or correction made to this form of proxy must be initialled by the signatory/ies.
8. The chairman of the Annual General Meeting may reject or accept a form of proxy, which is completed and/or
received other than in accordance with these instructions and notes.
9. For assistance in completing this form of proxy please phone the Spescom ShareCare Line on 0861 100 634
or on +27 11 870 8216 if you are phoning from outside South Africa.

Shareholders’ Update Form
VERY IMPORTANT!
All Spescom Limited shareholders are requested to kindly complete this form and return it to the Chief
Communications Officer, Spescom Limited, fax +27 11 266 1553 or PO Box 288, Halfway House, 1685, South
Africa. This will ensure you receive all official communications.
Shareholder’s Name
Title Designation
Company Name
Postal Address
Postal Code Country
Physical Address
Postal Code Country
Tel Fax
E-mail address
Please complete the following very important information:
Would you prefer to receive your communications electronically or in printed form?
Comments or special requests
All information supplied to Spescom Limited will be treated as strictly confidential.