ANALYZINGTHETRENDOFSTUDENTSSTUDYINGABROADASARESULTOFVARIOUSPARAMETERSOFHOMECOUNTRY
ArjunSehgal–[email protected]

TABLEOFCONTENTS
1. Abstract 1
2. Introduction 1
3. DataSources 1
4. SQLPre-Processing 2
5. HiveProcessing 3
6. TableauVisualizations 5
7. PredictiveAnalyticsinH2O 8
8. Conclusions 16
9. FutureScope 16
10. References 16

ARJUNSEHGAL 1
1. ABSTRACTAsweallknowthenumberofstudentsstudyingabroad,isincreasingeveryyearonaglobalscale.Thisflowofstudentsfromdifferentcultures,isdetrimentaltothegrowthoftheworldeconomy. For countries like USA, which are considered to be the hotspots of foreigneducation,thenumberofforeignstudentsalsohasamajorfinancialadvantage.As,aprojectformycourseCS-GY9223BigDataAnalytics,Ihavedecidedtoundertakeaprojectinwhich,Ihaveidentifiedfewfactorswhichmightaffectthenumberofstudentsstudyingabroad.Andthenusingvarioustechnologiestaughtthroughoutthiscourse,Ihavetriedtogaininsightsintothedatasetsobtained.
2. INTRODUCTIONInthisprojectIhaveobtainedthedataonthenumberofstudentsstudyingabroad,thegrossdomestic product(GDP) of various countries, the expenditure on education by thegovernment,therateofunemploymentwithintheyouthofthatcountryandthenumberofinternetuserswithinthecountryasapercentageofthetotalpopulation.Iconsideredthesethreefactorstobedetrimentaltothenumberofstudentsgoingabroadforeducationas,theGDPisaneconomicindicatorwhichshowsusthetotalmonetaryvalueofallthegoodsandservicesproducedwithinacountryinagiventimeframe.Itcanbeusefultodeterminetheeconomichealthofacountry.ThesecondfactorIchoseistheexpenditureoneducationbythecountry.Thiscanbeusedasatooltodeterminewhetherthegovernmentisdevotingenoughresourcestoeducationanditsdevelopment.Naturally,ifthequalityofeducationispoorweshouldbeexpectingagreaternumberofstudentstostudyabroad.Thevaluesforthesehavebeenrepresentedastheexpenditureoneducationasapercentageofthe total expenditureby thegovernment. The thirdand final indicator that I chose is theunemploymentrateamongsttheyouthofthatcountry,i.e.thepopulationthatisaged18-24.Ifeltthatthisfactorwasalsoimportant,asithelpsusindescribingwhethertheyouthwhichprimarilyconsistsofstudentsisabletoobtainjobsintheircountry,ordotheyhavetosearchforbetteropportunitiesabroad,whichcanbethemotivationforstudyingabroad.Ihavealsousedthedatasetfor internetusersfromamongstthepopulation,becauseI feelthat the greater the percentage of population that has access to internet the moreknowledgeablethepopulationwillbeandhencehaveincreasedchancesforstudyingabroad.IreceivedthedatasetforallthefourfromtheUnitedNationsDataset.
3. DATASOURCESThelinksfromwherethedatasetswereobtainedisasfollows:
o Dataset for students studying abroad from a country: http://data.un.org/Data.aspx?q=student&d=UNESCO&f=series%3aED_FSOABS
ARJUNSEHGAL 2
o Dataset for GDP of a country: http://data.un.org/Data.aspx?q=GDP&d=WDI&f=Indicator_Code%3aNY.GDP.MKTP.CD
o Dataset for Youth unemployment rates (ages 15-24): http://data.un.org/Data.aspx?q=unemployment&d=MDG&f=seriesRowID%3a630
o Dataset for Expenditure by Government on Education in home country: http://data.un.org/Data.aspx?d=UNESCO&f=series%3aXGDP_FSGOV
o Dataset for Percentage of Internet Users in home country: http://data.un.org/Data.aspx?d=ITU&f=ind1Code%3aI99H
4. SQLPRE-PROCESSINGAll the dataset’s that I downloaded were in .csv format and were stored using commadelimiter.Firstly,thedatawasloadedontoSQL.InthisIprocessedthedatainordertoensurethatthedataintegritywasmaintained.Inthisprocessofpre-processingthedata,IhaveusedSQL&Exceltocleanthedataandtransformitintoasuitableformat.Inordertodothis,IcreatedrelevanttablesinSQLwiththerespectivedatatypesforeachcolumn for the .csv files.While pre-processing the data, I observed that the data for thecountrynamecolumnwascreatingproblems,assomeofthecountrieshadcomma’sintheirname,whichwasalsobeingusedasthedelimitedthuscausingconfusionwhenloadingthedata.WheneverSQLincorrectlyprocessedacolumn,itencounteredanerror,asanincorrectdatatypewouldbeplacedinthenextcolumn.Also,somefileshadcommentsloadedattheendalongwithfootnotevaluescreatingunequalcolumnwidths.FromtheerrorsobservedinSQLIthencorrectedthedataandsubsequentlyloadedthedatainSQL.WhenthedatawassuccessfullyloadedintoSQL,itwasthenreadytobeloadedinotherapplicationslikePigandHive. Also, for the table of GDP of a country, I noticed that loading the data in HadooptechnologieslikePig&Hivewascreatingproblemsasitwasn’tabletoalwayscorrectlydetectthevalues,astheywereofextremelylargemagnitudes.Asaworkaroundforit,IfirstloadedthedatainSQLandthencreatedtheIDcolumnwhichwillbeexplainedahead.Oncethenewcolumnwascreatedandpopulated,IthenexportedthenewtableanduseditinHivealongwiththeotherdatasets.Oncethedata-setswerepreprocessedandcleanedasshownintheprevioussteps,thedatawasthenloadedintoHDFSbyusingtheHueUI.Onceallthedata-setswereloadedontoHDFS,thenthedatawasprocessedinHive.InthisIhadtocreateakeywithinallthetablessothattheindividualrecordscouldbematchedandidentifieduniquely.Inordertoachievethis,Icreated a new column called ID, which has been derived from two pre existing columnsCountryNameandYear.Byconcatenatingthetwofields,Icreatedanewcolumnwhichwasuniqueforeachrecord.Thebenefitfromthisisthat,whenwearerequiredtoperformjoins,wenowhaveauniquecolumntobereferenced.

ARJUNSEHGAL 3
5. HIVEPROCESSINGInordertoloadthedataintoHivewecanusetwomethods.ThefirstoneisthatwecangotoMetastoreTablesfromtheHueUIandcreateanewtablefromafileloadedontheHDFS.Oncethefileisselected,youcanspecifythedelimiterusedandmentionthecolumnnamesalongwiththeirrespectivedatatypes.Onceallthishasbeenspecified,thenthetablecanbeoperateduponbyexecutingqueriesinHive.ThesecondmethodistocreatethetableusingHiveitself,bywritingaquerytofirstlycreateatable,andthenanotherquerytopopulatethat table. I have used Hive commands to execute the creation of the table and thenpopulatingitwiththerelevantdata.InHive,IcreatedanewcolumncalledIDasmentionedpreviouslyfortheothertablessothatall records can be uniquely accessed and identified. Once the query is executed and the
ARJUNSEHGAL 4
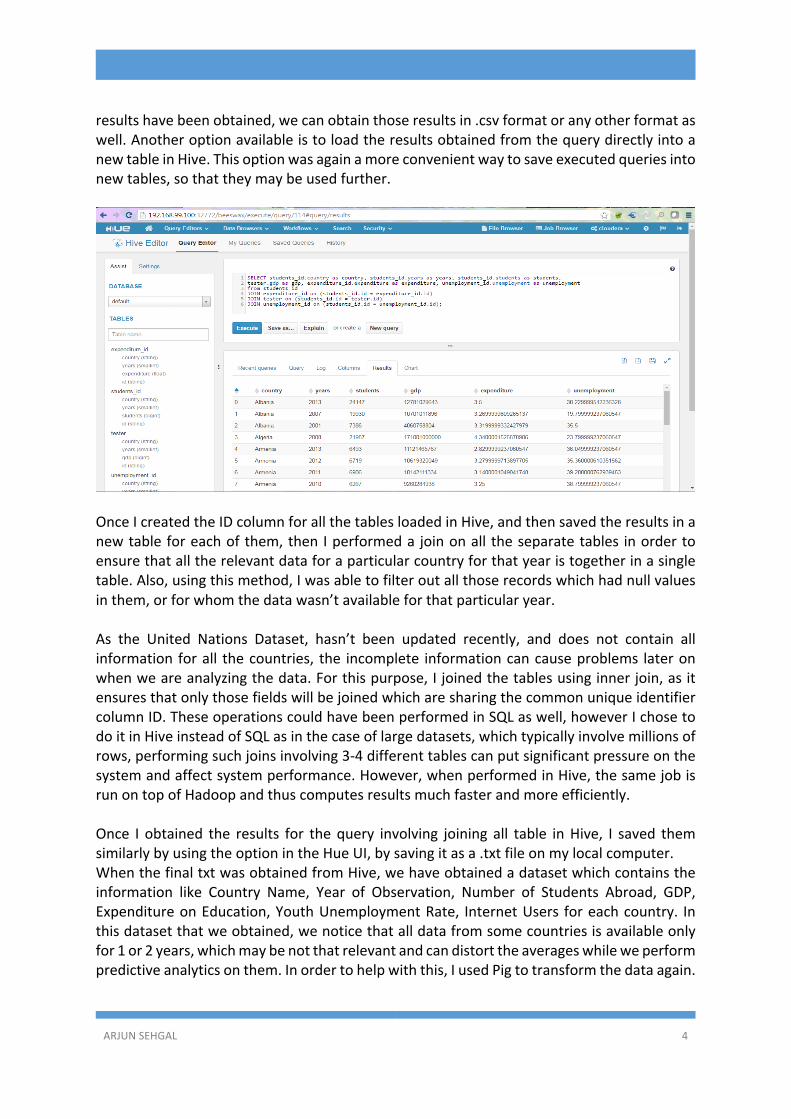
resultshavebeenobtained,wecanobtainthoseresultsin.csvformatoranyotherformataswell.AnotheroptionavailableistoloadtheresultsobtainedfromthequerydirectlyintoanewtableinHive.Thisoptionwasagainamoreconvenientwaytosaveexecutedqueriesintonewtables,sothattheymaybeusedfurther.
OnceIcreatedtheIDcolumnforallthetablesloadedinHive,andthensavedtheresultsinanewtableforeachofthem,thenIperformeda joinonall theseparatetables inordertoensurethatalltherelevantdataforaparticularcountryforthatyearistogetherinasingletable.Also,usingthismethod,Iwasabletofilteroutallthoserecordswhichhadnullvaluesinthem,orforwhomthedatawasn’tavailableforthatparticularyear.As the United Nations Dataset, hasn’t been updated recently, and does not contain allinformation forall thecountries, the incomplete informationcancauseproblems lateronwhenweareanalyzingthedata.Forthispurpose,Ijoinedthetablesusinginnerjoin,asitensuresthatonlythosefieldswillbejoinedwhicharesharingthecommonuniqueidentifiercolumnID.TheseoperationscouldhavebeenperformedinSQLaswell,howeverIchosetodoitinHiveinsteadofSQLasinthecaseoflargedatasets,whichtypicallyinvolvemillionsofrows,performingsuchjoinsinvolving3-4differenttablescanputsignificantpressureonthesystemandaffectsystemperformance.However,whenperformedinHive,thesamejobisrunontopofHadoopandthuscomputesresultsmuchfasterandmoreefficiently.Once I obtained the results for thequery involving joining all table inHive, I saved themsimilarlybyusingtheoptionintheHueUI,bysavingitasa.txtfileonmylocalcomputer.WhenthefinaltxtwasobtainedfromHive,wehaveobtainedadatasetwhichcontainstheinformation like Country Name, Year of Observation, Number of Students Abroad, GDP,ExpenditureonEducation,YouthUnemploymentRate, InternetUsers foreachcountry. Inthisdatasetthatweobtained,wenoticethatalldatafromsomecountriesisavailableonlyfor1or2years,whichmaybenotthatrelevantandcandistorttheaverageswhileweperformpredictiveanalyticsonthem.Inordertohelpwiththis,IusedPigtotransformthedataagain.

ARJUNSEHGAL 5
Iloadedthe.txtfileIsavedfromHivetomylocaldesktopbymakinguseoftheHueUI.OnceI loaded it, then Imadeuseofapigscript to filteroutonly thosecountrieswhichhaveasignificantnumberofresultsintheoutput.Ihaveassumedhere,thatanycountrywithgreaterthanorequaltothreeobservationscanbeconsideredsignificant.Therestoftheobservationshavebeenignored.This step isperformed forall thedatasets thatwerecreated inHive,asacombinationofvariousdifferentfactorsgivesusdifferentlistsofcountriesbecausetheinformationofallthefieldshasnotbeenmadepublicbyallcountries,whichledtoinconsistencieswithinthedata.The data once processed and transformed in Pig, has then been stored locally. It isdownloadedto the localdesktopusingtheHueUI.Afterall thedataprocessinghasbeencompleted,TableauwasusedtocreatevariousdifferentvisualizationsfromtheobtaineddataandH2Owasusedtoperformpredictiveanalyticsontheobtaineddata.
6. TABLEAUVISUALIZATIONSFrom the final analyzed dataset as obtained from Pig, the following visualizations wereobtainedinTableau.Thefollowingfigureisrepresentingthenumberofstudentswhicharegoingtostudyabroadfromeachcountryasshowninthefinaldataset.Fromtheconcludeddataecancorrectlyinferthatamongstallcountries,Chinahasthehighestnumberofstudentsstudyingabroadthananyothercountry,withIndiafallingsecondinthatposition

ARJUNSEHGAL 6
TheDatafromothercountriescanbeseenisfallinginasinglerange,indicatingthatthesetwocountriesarecontributingaheavymajorityofthestudentsstudyingabroadthroughouttheworld.Also,weseethatthecountriesforwhichdataisn’tavailablehavebeengreyedout.Thetotalsumofallstudentsstudyingabroadforallyearshasbeencolorcoded,whichcanbedecodedusingthekeygivenabove.The next visualization created is presenting the number of students which are studyingabroadascomparedwiththeGDPofthatcountryforthatparticularyear.ThisvisualizationhasbeencolorcodedaccordingtothenumberofstudentsstudyingabroadforthatparticularyearforwhichtheGDPhasbeenplotted.Colorcodingthisfigureisespeciallyimportant,aswehavealotofplotpointsinthestartofthefigure,whichcancauseconfusion.However,usingcolorcoding,wecanidentifyavariationamongstthosepointbythechangeincolor.
TheabovevisualizationofGDPandstudents,helpsustogetanideaofthefactthatforamajorityofthecountriesandplotpoints,wecansummarizethegraphusingapolynomialtrendlineoforderthree.However,aswecanseethatcountrieslikeIndiaandChina,whichhaveanabnormallyhighnumberofstudentsstudyingabroad,thosepointsdon’tfallonthistrendlineandcreateananomaly.Thenextvisualizationiscreatedtorepresentthevariationbetweenthenumberofinternetusers in thepopulationof a country and thenumberof students goingabroad from thatcountry.Yetagainasthenumberofstudentshasbeencolorcodedtoensurethatweareabletoidentifythevariousdifferentlevelsofstudentsstudyingabroadforcloselylocatedlevelsofinternetusageincountries.

ARJUNSEHGAL 7
Again, a polynomial trend line has been used with degree three to estimate the data.However,thedatathatisfallingoutofthetrendlineisforthecountriesinwhichthenumberof students studying abroad is abnormal like India and China. These countries can beidentifiedasthehighorangecoloredpeaksintheabovefigure.Inthefollowingvisualizationshowingusthenumberofstudentsstudyingabroadandtherateofunemploymentamongstyouthaged15-24inacountryalsofollowsasimilarpattern,likethe lastgraphof internetusersvs.students. Inthisplotalso,wehaveestimatedthedatapointsusingapolynomialtrendline,howevertheexceptionsforcountrieswithextremelyhighstudentsabroadarepresent.

ARJUNSEHGAL 8
7. PREDICTIVEANALYTICSINH2O
Oncethedatawasanalyzedusingthevisualizationscreatedpreviously,predictiveanalyticswere performed on the data. Thiswas done so thatwe can predict and further emulatevariousscenarioswhichmightaffectthenumberofstudentsstudyingabroad.For this purpose, the software H2O has been used, which can be used for performingpredictiveanalyticsusingthelocalmachine,orontopofR,TableauorHadoop.Mainlytwodifferentmodelshavebeenusedwhilepreparingdifferentanalysis,andfromthesethemodelinwhichthepredictionshadtheminimumerror.Alsotwodifferentdatasetswereusedforthispurpose,inordertoincreasetheefficiencyofthemodelsandidentifythemostrelevantfactors,withwhichthebestresultswereobtained.Thefirstdatasetthatwasused,hadallforfactorsthathavebeenpreviouslydiscussed,thatisunemployment,educationalexpenditure internetusersandGDP. Intheseconddataset,thecolumnforunemploymenthasbeenomitted.Thishasbeendoneasforalargenumberofcountriestheunemploymentpercentagewasn’tavailableandtryingthisdatabaseagainstthesamemodelsmightgiveabetter resultdue the thegreaterversatilityof thedataset.However, at the same time there is trade off between greater number of results andincreasednumberoffactorswhichcanaffecttheresult.ThetwomodelswhichhavebeenuseareGradientBoostingLearningModelandthesecondoneisDeepLearningModel.Boththemodelscanbeusedforregressions,andgiveustheimportanceofthevariableswhichwespecifyshouldbetestedforpredictingthevaluesofthetargetvariable.AGradientBoostingMachine(GBM)isanensembleoftreemodels(eitherregressionorclassification).Bothareforward-learningensemblemethodsthatobtainpredictiveresultsthroughgraduallyimprovedestimates.Boostingisaflexiblenonlinearregressionprocedurethathelpsimprovetheaccuracyoftrees.Bysequentiallyapplyingweakclassificationalgorithmstoincrementallychangingdata,aseriesofdecisiontreesarecreatedthatproduceanensembleofweakpredictionmodels.GBMisthemostaccurategeneralpurposealgorithm.Itcanbeusedforanalysisonnumeroustypesofmodelsandwillalwayspresentrelativelyaccurateresults.Additionally,GradientBoostingMachinesareextremelyrobust,meaningthattheuserdoesnothavetoimputevaluesorscaledata(theycandisregarddistribution).ThismakesGBMthego-tochoiceformanyusers,aslittletweakingisrequiredinordertogetaccurateresults.Inthebelowfigures,GradientBoostingModelhasbeenappliedtothedatasetthatcontainedall the four fields.Firstly, thedata fromthe fileall_fields.csvwas loadedtoh2oasadataframe.Thisframewasthenspitinto25:75inordertocreateavalidationframe,whichistoensurethatthemodelhasconverged.Whilespecifyingthemodelparameters,thevalueofn-foldswassetat8,whichisusedtodeterminethenumberoffoldsforcross-validation.

ARJUNSEHGAL 9
Theresponsecolumnwasthenspecifiedtobestudents,andthecolumnstobeignoredweremarked.Wealsospecifythenumberoftreestobecreatedandthemaximumdepthforthetrees.Alsowecanchangeaparametercalledlearningrate,whichvariesfrom0to1.0.Thisratehasbeensetto0.12.thedefaultvalueforitis0.1.
Oncethemodelwascreated,thenitsparameterswerenoted.Aswecanseefromabovetheblue line represents thescoringhistory for the training frameandtheorangeone for thevalidationframespecified.Also,inthismodelweobtaintherelativeimportanceforthevariablesthatwehadspecified.FromthefollowingtwofigureswecannotethatGDPhasthegreatestimportanceat54%,Unemployment at 16%, Internet users at 10%, Expenditure at 10.12% and the year ofobservationat8.31%.Thuswecanconcludeaccording to thismodel that theyearof theobservationisnotthatrelevanttowardspredictingthenumberofstudentsstudyingabroad.

ARJUNSEHGAL 10
Aftercreatingthemodel,anotherdataframewascreatedwhichhadsamplevaluesforwhichthenumberofstudentsstudyingabroadwasalreadyknown.Thesevalueswerethenfedintoallthemodelssothattheycanbejudgedondeviationfromacommondatasource.Forthisdatamodel,theresultsarecanbeseenbelowareimpressive,withthepercentageoferrorbetweentherealandpredictedvaluebeinglowthroughout,withtheexceptionofafewentries.
Country Year RealValue Error %ErrorPredictedValue
Brazil 2011 29218 6348.00 21.73 35566.00
Brazil 2012 30235 8856.39 29.29 39091.39
Albania 2013 24147 -9505.45 39.36 14641.55
Denmark 2011 6064 760.04 12.53 6824.04
Denmark 2010 5328 1341.83 25.18 6669.83
SouthKorea 2012 121023 3751.17 3.10 124774.17
India 2012 188791 -9810.31 5.20 178980.69
Malaysia 2011 59855 -6918.67 11.56 52936.33Fromtheabovetabletherealvaluesofthenumberofstudentsstudyingabroadandtheirvaluesaspredictedbythemodelhavebeencomparedusinga3-DBarGraph.Fromthisgraphalsowecanviewthatthereisnotmucherrorbetweentherealandpredictedvaluesofthemodel.

ARJUNSEHGAL 11
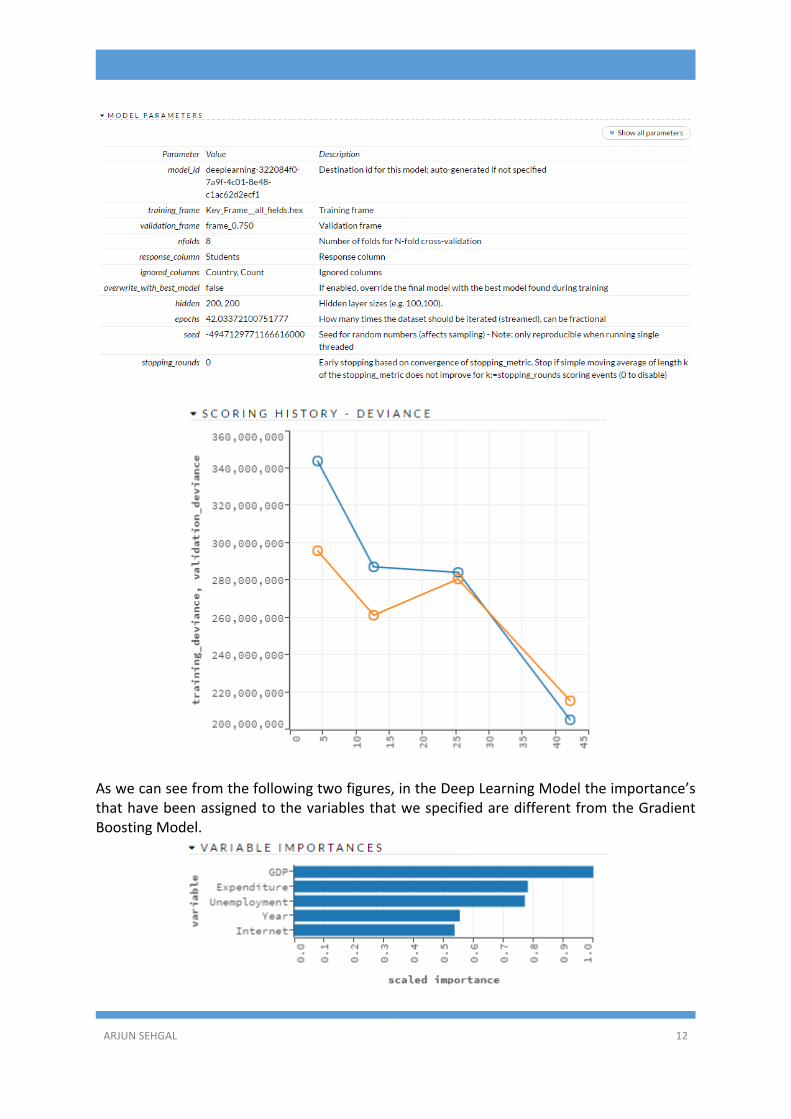
Thesecondmodelthatwascreatedforthedatasetthatcontainedallthefields,wasDeepLearning.DeepLearningisanotherpopularmodelthatisbeingdeveloped.Itsalgorithmsarebased on distributed representations with the underlying assumption behind distributedrepresentationsisthatobserveddataaregeneratedbytheinteractionsoffactorsorganizedinlayers.DeepLearningwithH2Ofeaturesautomaticadaptiveweight initialization,automaticdatastandardization, expansion of categorical data, automatic handling of missing values,automaticadaptivelearningrates,variousregularizationtechniques,automaticperformancetuning, load balancing, grid-search, N-fold cross-validation, checkpointing and differentdistributedtrainingmodesonclustersforlargedatasets.Thetechnologydoesnotrequirecomplicated configuration files and H2O Deep Learning is highly optimized formaximumperformance.Likethelastmodelinthismodelalsowehaveusedthesamelearningframeandvalidationframe,then-foldsvaluehasbeenkeptsame.Alsotheresponsecolumnhasbeenselectedtobethatofstudentsandthecolumnstobeignoredhavebeenselected.Also,theoptiontospecifytheimportanceofvariousvariablesthathavebeenspecifiedhasalsobeenmarked,toseethedifferencebetweenthepreviousmodelandthisoneonhowtheyaredifferentlyassigningimportance’stovariousdifferentvariables.
0
20000
40000
60000
80000
100000
120000
140000
160000
180000
200000
BRAZIL BRAZIL ALBANIA DENMARK DENMARK SOUTHKOREA
INDIA MALAYSIA
ComparisonofRealvsPredictedValuesforGradientBoostedLearningModel
RealValue PredictedValue
ARJUNSEHGAL 12
Aswecanseefromthefollowingtwofigures,intheDeepLearningModeltheimportance’sthathavebeenassignedtothevariablesthatwespecifiedaredifferentfromtheGradientBoostingModel.

ARJUNSEHGAL 13
ThedeeplearningmodelisheavilyfavoringthevariablesofexpenditureandunemploymentascomparedtotheGradientBoostingModelwhichisevidentasthereisa6%increaseinUnemployment,11%increaseinExpenditure,4%increaseinInternetUsers.
Forthedeeplearningmodel,howeverwhenwepredictvaluesbyusingthesamepredictionframeasweusedinthegradientboostingmodel,wenoticethatthevaluesthatitpredictsareextremelyfarawayfromtherealvalueswhichwealreadyknow.Thiscanbeobservedastheaverageerrorinthiscaseisfargreaterthanthatofthepreviousmodel.Itcanalsobenoticedfromthedifferenceofheightsbetweentherealandpredictedvaluesinthegraphgeneratedbelowthegiventable.Country Year RealValue PredictedValue Error %ERROR
Brazil 2011 29218 34999.26 5781.26 19.79Brazil 2012 30235 33222.91 2987.91 9.88Albania 2013 24147 13657.50 -10489.50 43.44Denmark 2011 6064 16227.10 10163.10 167.60Denmark 2010 5328 13790.95 8462.95 158.84SouthKorea 2012 121023 23365.10 -97657.90 80.69India 2012 188791 108642.89 -80148.11 42.45Malaysia 2011 59855 27459.23 -32395.77 54.12
0
50000
100000
150000
200000
BRAZIL BRAZIL ALBANIA DENMARK DENMARK SOUTHKOREA
INDIA MALAYSIA
ComparisonofRealvsPredictedValuesforDeepLearningModel
RealValue PredictedValue

ARJUNSEHGAL 14
Inthelastmodelthatwastested,thedatasetusedisdifferent.Inthisdatasetwehavenotusedthecolumnforyouthunemployment,asitwasnotavailableforalargenumberofthecountries from the UN Dataset which was used as our source. In this case the GradientBoostingModelhasbeenusedastheDeepLearningModelwashavinggreatererrorthanwhatcanbeallowedinapredictivemodel.
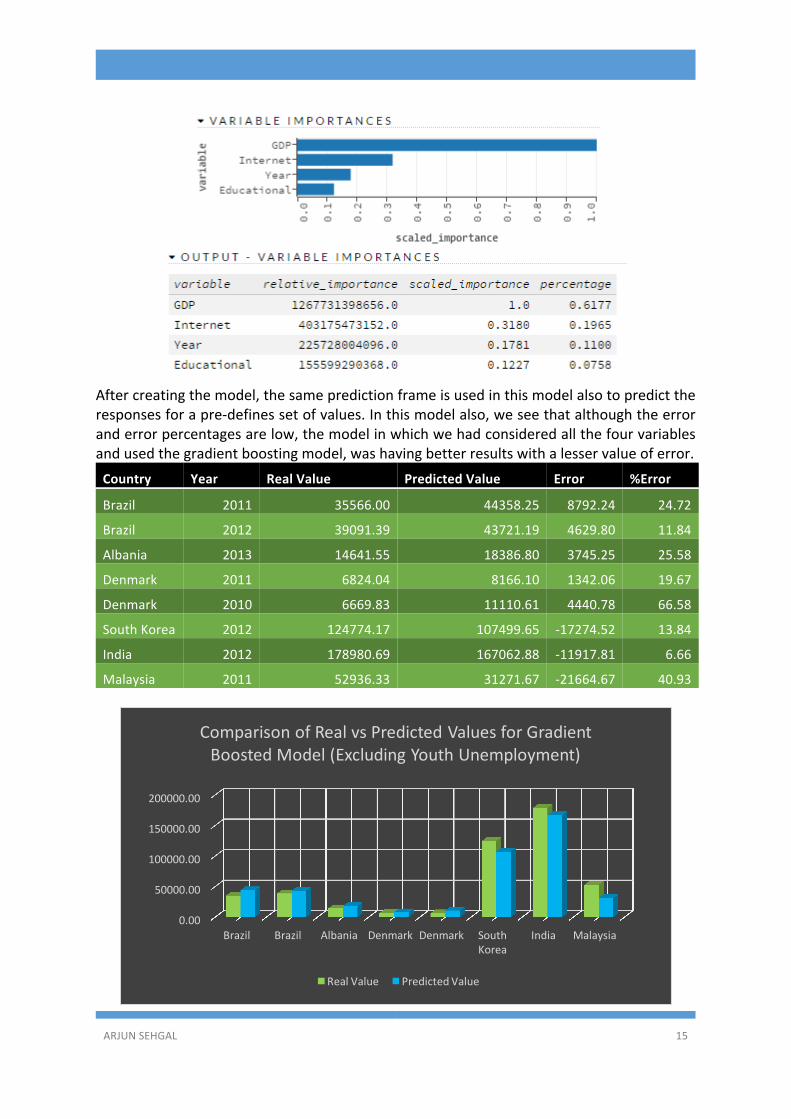
Inthismodelalso,weseethatthebasicparametersfrothemodelarestillthesame.Alsowecan see that GDP is still themost important variable, having61.77% importance, and thenumber of internet users has 19.65% importance, 11% importance for the year ofobservation,withEducationalexpenditurebeingplacedat7.5%.
ARJUNSEHGAL 15
Aftercreatingthemodel,thesamepredictionframeisusedinthismodelalsotopredicttheresponsesforapre-definessetofvalues.Inthismodelalso,weseethatalthoughtheerroranderrorpercentagesarelow,themodelinwhichwehadconsideredallthefourvariablesandusedthegradientboostingmodel,washavingbetterresultswithalesservalueoferror.Country Year RealValue PredictedValue Error %Error
Brazil 2011 35566.00 44358.25 8792.24 24.72
Brazil 2012 39091.39 43721.19 4629.80 11.84
Albania 2013 14641.55 18386.80 3745.25 25.58
Denmark 2011 6824.04 8166.10 1342.06 19.67
Denmark 2010 6669.83 11110.61 4440.78 66.58
SouthKorea 2012 124774.17 107499.65 -17274.52 13.84
India 2012 178980.69 167062.88 -11917.81 6.66
Malaysia 2011 52936.33 31271.67 -21664.67 40.93
0.00
50000.00
100000.00
150000.00
200000.00
Brazil Brazil Albania Denmark Denmark SouthKorea
India Malaysia
ComparisonofRealvsPredictedValuesforGradientBoostedModel(ExcludingYouthUnemployment)
RealValue PredictedValue

ARJUNSEHGAL 16
Wecannowsuccessfullyinferthatthebestfittingmodelforthedatasetthatweobtainedisthegradientboostingmodel,andinordertogetthebestresultsweshouldusethedatasetinwhichallthefourvariablesarepresent.
8. CONCLUSIONHence,wecansuccessfullyinferthatGDPofacountrypaysthemostdominantroleinthedecision of a student to study abroad. Also, Unemployment amongst the youth and thenumber of internet users although might not be that significant factors in terms ofpercentages,theyarealsoafactorwhichshouldbekeptinmindwhilepredictingthevaluesforfutureyearsforvariouscountries.
9. FUTURESCOPEFuture Scope for this project can be increased to adding further variables, which can berelevanttothematter.Addingagreaternumberofvariableswillnodoubteddecreasethepercentage importance of various factors like GDP, which are currently enjoying a highpercentage.However,addingmorediverse factorswill increase thechance topredict thevaluemoreaccurately.Itwillalsohelpusstabilizetheeffectofroguevalueslikeaspikeinanyvaluewhichmightcreateananomalyandgiveusanincorrectpredictionforthevalues.
10. REFERENCES
• discuss.analyticsvidhya.com• en.wikipedia.org• pig.apache.org• cwiki.apache.org• hortonworks.com/hadoop-tutorial• www.stackoverflow.com/• www.h2o.ai/verticals/algos