University of Plymouth
PEARL https://pearl.plymouth.ac.uk
04 University of Plymouth Research Theses 01 Research Theses Main Collection
2019
AN OBJECT-BASED MULTIMEDIA
FORENSIC ANALYSIS TOOL
MASHHADANI, SHAHLAA TALIB
http://hdl.handle.net/10026.1/15214
University of Plymouth
All content in PEARL is protected by copyright law. Author manuscripts are made available in accordance with
publisher policies. Please cite only the published version using the details provided on the item record or
document. In the absence of an open licence (e.g. Creative Commons), permissions for further reuse of content
should be sought from the publisher or author.

This copy of the thesis has been supplied on condition that anyone who
consults it is understood to recognise that its copyright rests with its author and that no quotation from the thesis and no information derived from it may
be published without the author's prior consent.
AN OBJECT-BASED MULTIMEDIA FORENSIC ANALYSIS TOOL
by
SHAHLAA TALIB MASHHADANI
A thesis submitted to University of Plymouth in partial
fulfilment for the degree of
DOCTOR OF PHILOSOPHY
School of Engineering, Computing and Mathematics
November 2019

I
Acknowledgements
First and foremost, I would like to thank Allah (God) Almighty for giving me the
strength, knowledge, ability, and opportunity to undertake this research study and
to persevere and complete it satisfactorily. Without his blessings, this
achievement would not have been possible.
I would like to express my appreciation and gratitude to my supervisor Prof.
Nathan Clarke for his continuous support, interest, patience, and guidance
throughout my studies. Thanks must also go to my other supervisor, Dr Fudong
Li, who has spent a lot of time proofreading papers and my thesis, in addition to
providing helpful experience and guidance throughout my studies.
My acknowledgement would be incomplete without thanking the biggest source
of my strength, my family. Thank you for encouraging me in all of my pursuits and
inspiring me to follow my dreams. I am especially grateful to my father (Talib) for
his support and never-ending love.
My unreserved love, thanks, and appreciation must go to my husband (Ahmed)
and my daughters who have been very patient, understanding, and inspiring to
me throughout this endeavour, spending days, nights, and sometimes even
holidays without me. I hope the potential success of this research will compensate
some of what they have missed. May Allah bless them.
Many thanks to my colleague Dany Joy and my best friend Noor Bahjat for their
support and for the motivating ideas and thoughts they provided during my PhD
journey.
Finally, I would like to acknowledge, with thanks and appreciation, the
government of Iraq and the Higher Committee for Education Development in Iraq,
for granting me a scholarship and sponsoring my PhD studies.
II
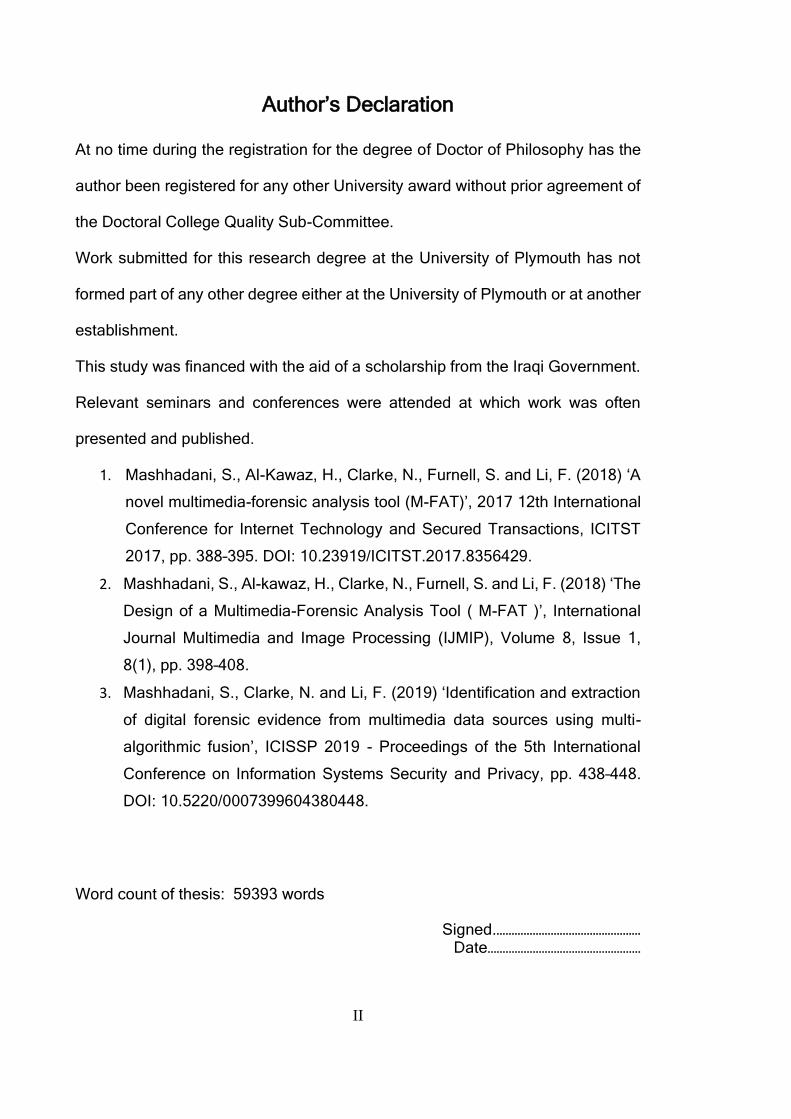
Author’s Declaration
At no time during the registration for the degree of Doctor of Philosophy has the
author been registered for any other University award without prior agreement of
the Doctoral College Quality Sub-Committee.
Work submitted for this research degree at the University of Plymouth has not
formed part of any other degree either at the University of Plymouth or at another
establishment.
This study was financed with the aid of a scholarship from the Iraqi Government.
Relevant seminars and conferences were attended at which work was often
presented and published.
1. Mashhadani, S., Al-Kawaz, H., Clarke, N., Furnell, S. and Li, F. (2018) ‘A
novel multimedia-forensic analysis tool (M-FAT)’, 2017 12th International
Conference for Internet Technology and Secured Transactions, ICITST
2017, pp. 388–395. DOI: 10.23919/ICITST.2017.8356429.
2. Mashhadani, S., Al-kawaz, H., Clarke, N., Furnell, S. and Li, F. (2018) ‘The
Design of a Multimedia-Forensic Analysis Tool ( M-FAT )’, International
Journal Multimedia and Image Processing (IJMIP), Volume 8, Issue 1,
8(1), pp. 398–408.
3. Mashhadani, S., Clarke, N. and Li, F. (2019) ‘Identification and extraction
of digital forensic evidence from multimedia data sources using multi-
algorithmic fusion’, ICISSP 2019 - Proceedings of the 5th International
Conference on Information Systems Security and Privacy, pp. 438–448.
DOI: 10.5220/0007399604380448.
Word count of thesis: 59393 words
Signed.………………………………………… Date……………………………………………
III
Abstract
An Object-based Multimedia Forensic Analysis Tool
Shahlaa Mashhadani
With the enormous increase in the use and volume of photographs and videos,
multimedia-based digital evidence now plays an increasingly fundamental role in
criminal investigations. However, with the increase, it is becoming time-
consuming and costly for investigators to analyse content manually. Within the
research community, focus on multimedia content has tended to be on highly
specialised scenarios such as tattoo identification, number plate recognition, and
child exploitation. An investigator’s ability to search multimedia data based on
keywords (an approach that already exists within forensic tools for character-
based evidence) could provide a simple and effective approach for identifying
relevant imagery.
This thesis proposes and demonstrates the value of using a multi-algorithmic
approach via fusion to achieve the best image annotation performance. The
results show that from existing systems, the highest average recall was achieved
by Imagga with 53% while the proposed multi-algorithmic system achieved 77%
across the select datasets.
Subsequently, a novel Object-based Multimedia Forensic Analysis Tool (OM-
FAT) architecture was proposed. The OM-FAT automates the identification and
extraction of annotation-based evidence from multimedia content. Besides
making multimedia data searchable, the OM-FAT system enables investigators
to perform various forensic analyses (search using annotations, metadata, object
IV
matching, text similarity and geo-tracking) to help investigators understand the
relationship between artefacts, thus reducing the time taken to perform an
investigation and the investigator’s cognitive load. It will enable investigators to
ask higher-level and more abstract questions of the data, then find answers to the
essential questions in the investigation: what, who, why, how, when, and where.
The research includes a detailed illustration of the architectural requirements,
engines, and complete design of the system workflow, which represents a full
case management system.
To highlight the ease of use and demonstrate the system’s ability to correlate
between multimedia, a prototype was developed. The prototype integrates the
functionalities of the OM-FAT tool and demonstrates how the system would help
digital investigators find pieces of evidence among a large number of images
starting from the acquisition stage and ending in the reporting stage with less
effort and in less time.
V
Table of Contents
Acknowledgements .......................................................................................................... I
Author’s Declaration ..................................................................................................... II
Abstract ......................................................................................................................... III
1 Introduction .............................................................................................................. 1
1.1 Introduction ........................................................................................................ 1
1.2 Research Aim and Objectives ............................................................................ 4
1.3 Thesis Structure .................................................................................................. 5
2 Digital Forensics and Image Analysis .................................................................... 7
2.1 Introduction ........................................................................................................ 7
2.2 Digital Forensics ................................................................................................. 8
2.3 Digital Evidence and Forensic Tools ............................................................... 10
2.4 Forensics Investigation Methods of Multimedia Data ..................................... 11
2.5 Forensic Image Analysis .................................................................................. 14
2.6 Challenges of Image Analysis in Digital Forensics ......................................... 19
2.7 The Current State of Art ................................................................................... 29
2.8 Review Methodology ....................................................................................... 31
2.8.1 Image Analysis in Digital Forensics ......................................................... 33
2.8.2 Object-Based Image Retrieval .................................................................. 47
2.8.2.1 Single Object-Based Image Retrieval ................................................ 48
2.8.2.2 Multiple Objects-Based Image Retrieval ........................................... 48
2.8.3 Automatic Image Annotation .................................................................... 49
2.9 Discussion ........................................................................................................ 80
2.10 Conclusion ........................................................................................................ 92
3 Evaluation of a Multi-Algorithmic Approach Performance.............................. 93
3.1 Introduction ...................................................................................................... 93
3.2 Research Hypothesis ........................................................................................ 94
3.3 Understand and Evaluate the Performance of Commercial Systems ............... 95
3.3.1 Experimental Methodology ....................................................................... 97
3.3.2 Results ..................................................................................................... 102
VI
3.4 Determining whether a multi-algorithmic approach of the aforementioned
commercial systems would improve the performance .............................................. 106
3.4.1 Experimental Methodology..................................................................... 107
3.4.2 Results ..................................................................................................... 112
3.5 Re-evaluate the performance of Commercial Systems and the Multi-
algorithmic Approach Based on More Robust Dataset ............................................. 117
3.5.1 Experimental Methodology..................................................................... 118
3.5.2 Results ..................................................................................................... 119
3.6 Discussion ...................................................................................................... 121
3.7 Conclusion ...................................................................................................... 124
4 A Novel Framework for Object-based Multimedia Forensic Analysis Tool .. 126
4.1 Introduction .................................................................................................... 126
4.2 System Requirements ..................................................................................... 127
4.2.1 High-Level Requirements ....................................................................... 127
4.2.2 Low-Level Requirement ......................................................................... 128
4.3 Object-based Multimedia Forensic Analysis Tool Architecture .................... 130
4.3.1 Case Management Engine ....................................................................... 133
4.3.2 Data Acquisition Engine ......................................................................... 140
4.3.3 Automatic Image Annotation Engine ..................................................... 145
4.3.4 Correlation Engine .................................................................................. 148
4.3.5 Visualization Engine ............................................................................... 159
4.3.6 Reporting ................................................................................................. 161
4.4 Workflow System Design Based on OM-FAT Architecture ......................... 162
4.5 Conclusion ...................................................................................................... 167
5 OM-FAT Prototype Implementation ................................................................. 168
5.1 Introduction .................................................................................................... 168
5.2 Development Environment............................................................................. 168
5.3 OM-FAT Prototype Implementation .............................................................. 171
5.4 Login .............................................................................................................. 171
5.5 Dashboard ....................................................................................................... 172
5.5.1 Add New Case ........................................................................................ 173
5.5.2 Editing Case Information ........................................................................ 177
5.5.3 Open Case ............................................................................................... 178
VII
5.5.3.1 Search Tab ....................................................................................... 179
5.5.3.2 Data Filtering Tab ............................................................................ 183
5.5.3.3 Text Similarity Tab .......................................................................... 185
5.5.3.4 Geo Tracking Tab ............................................................................ 187
5.5.3.5 Bookmark Tab ................................................................................. 190
5.5.3.6 Reporting Tab .................................................................................. 192
5.5.3.7 Log Tab ............................................................................................ 194
5.5.3.8 Object Matching Tab ....................................................................... 195
5.5.4 Case History ............................................................................................ 197
5.5.5 Account Management ............................................................................. 199
5.5.6 Global Settings ........................................................................................ 201
5.6 Conclusion ...................................................................................................... 203
6 The Evaluation ..................................................................................................... 204
6.1 Introduction .................................................................................................... 204
6.2 Evaluation Methodology ................................................................................ 205
6.2.1 Preparation Phase .................................................................................... 205
6.2.2 Participants Selection .............................................................................. 208
6.2.3 Interviewees ............................................................................................ 209
6.3 The Feedback ................................................................................................. 209
6.4 Discussion ...................................................................................................... 212
6.5 Conclusion ...................................................................................................... 213
7 Conclusion and Future Work ............................................................................. 215
7.1 Achievements of the Research ....................................................................... 215
7.2 Limitations of Research .................................................................................. 217
7.3 Future Work ................................................................................................... 219
7.3.1 Evaluation of the Image Quality Criteria and Enhancement .................. 219
7.3.2 Privacy..................................................................................................... 220
7.3.3 Improving the Geo-Tracking System ...................................................... 220
7.3.4 Improving Image-Matching Based on Image Content ............................ 221
References .................................................................................................................... 222
Appendices ................................................................................................................... 233
Appendix A: Centric and Non-Centric Single Object-Based Image Retrieval ..... 234

VIII
Appendix B: Multiple Objects-Based Image Retrieval ........................................... 256
Appendix C: Approval Forms and Ethical Approval Notifications ....................... 268
IX
List of Figures
Figure 1.1: Comparison of Image Volume ........................................................... 2
Figure 2.1: Relationship between Identified Fields of Research ....................... 11
Figure 2.2: Examples of Impression Evidence Images ..................................... 15
Figure 2.3: Examples of Image Content ............................................................ 16
Figure 2.4: Examples of Image Tampering ....................................................... 17
Figure 2.5: Examples of Image Enhancement .................................................. 18
Figure 2.6: An Example of a Photogrammetric Analysis ................................... 19
Figure 2.7: The Masked Robbers Who Targeted a Bank in Hull ....................... 23
Figure 2.8: The Suspect Different CCTV Images .............................................. 24
Figure 2.9: CCTV Footage Shows the Two Men Pointing What Appears To Be a
Handgun at Bank Staff ...................................................................................... 25
Figure 2.10: The Two Men Wore Black Clothing and Scarves over Their Faces
.......................................................................................................................... 26
Figure 2.11: Change in Volume of Car Theft Claims, 2014 to 2018 .................. 27
Figure 2.12: The Murderer of 55 Women .......................................................... 28
Figure 2.13: An Example of Image Color Histogram ......................................... 35
Figure 2.14: Examples of Forensic Images ....................................................... 39
Figure 2.15: Different Types of Combinations ................................................... 43
Figure 2.16: Screen Shot of the Image Set ....................................................... 43
Figure 2.17: Object Detection in Video with Different Angle .............................. 45
Figure 2.18: Low Quality of Video Can Significantly Affect the Detection
Performance ..................................................................................................... 45
Figure 2.19: Example of GCI and Vandalism Scenes in CCTV Videos ............. 46
Figure 2.20: Example of Object-Based Image Retrieval System....................... 48
Figure 2.21: System Framework ....................................................................... 50
Figure 2.22: A Framework of the Proposed System .......................................... 51
Figure 2.23: Automatic Annotations Compared With The Original Manual
Annotations. (a) Shows the Image in Core 5K and (b) Shows the Image in MIR
Flickr ................................................................................................................. 55
Figure 2.24: Block Diagram of the SIRBOT System .......................................... 56
Figure 2.25: The Proposed Method Diagram (IAGA) ........................................ 57
X
Figure 2.26: Architecture of the Proposed System ............................................ 63
Figure 2.27: Feature Extraction and Labelling Model ........................................ 65
Figure 2.28: Block Diagram of the Proposed Annotation System ..................... 69
Figure 2.29: Semantic Retrieval Results on Corel5k Data Set .......................... 74
Figure 2.30: Automatic Annotation Stages Proposed ....................................... 75
Figure 2.31: Annotation Based Image Retrieval Methodology .......................... 76
Figure 2.32: Comparison of Image Annotation .................................................. 78
Figure 2.33: System Flowchart of Proposed Method ........................................ 79
Figure 2.34: (A) Simple Image and (B and C) Images with Multiple Objects and
Complicated Background .................................................................................. 82
Figure 3.1: Examples of Corel, Caltech256 and Flickr Datasets ....................... 98
Figure 3.2: Block Diagram of the Multi-Algorithmic Approach ......................... 107
Figure 3.3: Normalisation of the Clarifai Annotation Result: (a) As Gained from
Clarifai (b) After Normalisation ........................................................................ 109
Figure 3.4: Example of Fusion Result ............................................................. 110
Figure 3.5: Precision of 100 Images Based On Fusion (All) and Fusion
(Threshold) Results ........................................................................................ 117
Figure 3.6: Average Precision of the Six Systems with Two Different Annotation
Datasets .......................................................................................................... 120
Figure 3.7: Average Recall of the Six Systems with Two Different Annotation
Datasets .......................................................................................................... 121
Figure 3.8: F-Measure of the Six Systems with Two Different Annotation
Datasets .......................................................................................................... 121
Figure 4.1: Overall OM-FAT System Architecture ........................................... 131
Figure 4.2: Case Management Engine ........................................................... 134
Figure 4.3: Data Acquisition Engine ................................................................ 140
Figure 4.4: AIA Engine .................................................................................... 146
Figure 4.5: Correlation Engine ........................................................................ 149
Figure 4.6: Search Phase (Text Query and Filters) ......................................... 151
Figure 4.7: Object Recognition Approach ....................................................... 156
Figure 4.8: Text Recognition Approach ........................................................... 157
Figure 4.9: Examples of Visualization Styles .................................................. 161
Figure 4.10: OM-FAT Workflow ...................................................................... 163
Figure 4.11: System Database Schema Diagram ........................................... 166
XI
Figure 5.1: OM-FAT Development Environment ............................................. 170
Figure 5.2: OM-FAT Login Page ..................................................................... 172
Figure 5.3: Dashboard Page ........................................................................... 173
Figure 5.4: Adding New Case ......................................................................... 174
Figure 5.5: Adding New Data Source .............................................................. 175
Figure 5.6: Filter CCTV/Database Data .......................................................... 176
Figure 5.7: Edit Case Details .......................................................................... 177
Figure 5.8: Case Resources ........................................................................... 178
Figure 5.9: Search Tab ................................................................................... 180
Figure 5.10: Browsing the Retrieved Images .................................................. 183
Figure 5.11: Data Filtering Tab ....................................................................... 185
Figure 5.12: Text Similarity Tab ...................................................................... 186
Figure 5.13: Geo Tracking Tab (Route) .......................................................... 189
Figure 5.14: Geo Tracking Tab (Show photos) ............................................... 190
Figure 5.15: Bookmark Tab ............................................................................. 191
Figure 5.16: Reporting Tab ............................................................................. 193
Figure 5.17: Log Tab ....................................................................................... 195
Figure 5.18: Object Matching Tab ................................................................... 196
Figure 5.19: Case History ............................................................................... 198
Figure 5.20: Account Management ................................................................. 199
Figure 5.21: Adding New User Information ..................................................... 200
Figure 5.22: Set Privileges .............................................................................. 201
Figure 5.23: Global Settings............................................................................ 202
Figure 6.1: Phases of Evaluation .................................................................... 205
Figure A.1: Processing Flow of Extraction the Main Object Region ................ 235
Figure A.2: ANMRR and ANMTKRR of the Descriptors .................................. 236
Figure A.3: Segmentation of Regional Object: (a) flower; (b) horse; (c) elephant;
(d) dinosaur .................................................................................................... 237
Figure A.4: Performance Comparison between Segmentation and No
Segmentation Methods ................................................................................... 239
Figure A.5: Performance Comparison between Correlation Coefficient and No
Correlation Coefficient Techniques ................................................................. 239
XII
Figure A.6: Ten Samples of Columbia Object Image Library Dataset ............. 242
Figure A.7: Examples of Experiment Images .................................................. 244
Figure A.8: Circular Image Decomposition Method ......................................... 245
Figure A.9: Accuracy Comparison of Retrieval Methods ................................. 247
Figure A.10: Block Distribution to BG-Blocks and OB-Blocks ......................... 248
Figure A.11: Setting of Blocks ......................................................................... 248
Figure A.12: Examples of Block Allocations .................................................... 249
Figure A.13: Query Image and Correct Answer for Query Image .................... 249
Figure A.14: Example of Retrieval Results by the Proposed Method .............. 250
Figure A.15: Image Representation through Semantic Modelling ................... 251
Figure A.16: Feature Extraction Process Data Flow ....................................... 252
Figure A.17: Object Identification and Recognition Process Data Flows ........ 253
Figure B.1: The Proposed MRIA Framework for Hierarchical Image
Representation ............................................................................................... 259
Figure B.2: Matching Two Hierarchical Region Trees ..................................... 260
Figure B.3: An Example of User’s Requirements, (a) Example of Images (b)
Graphical Query Representation and (c) Ideal Retrieved Image ..................... 262
Figure B.4: The Proposed Approach ............................................................... 264
Figure B.5: Block Diagram of the Video Indexing Module ............................... 266
Figure B.6: Results Comparison on Foreground Extraction by Using: (a) the
Original and (b) the Proposed Mog In HSV Color Space ................................ 267
XIII
List of Tables
Table 2.1: Number of Returned References ..................................................... 33
Table 2.2: Comparison between Corel Database and Forensic Database under
Different Features and Similarity Measures ...................................................... 40
Table 2.3: Criminal Event Classes Considered ................................................. 46
Table 2.4: Examples for Image Annotation ....................................................... 61
Table 2.5: Predicted Keywords versus Human Annotations for the Images from
IAPR TC 12. Keywords Are Predicted Using Our Proposed Algorithm. The
Differences Are Marked In Bold Font ................................................................ 66
Table 2.6: Comparison between Keywords Query and Natural Query .............. 66
Table 2.7: Examples of Automatic Annotation of Proposed System Matching
With Ground Truth for All Three Datasets. Each Row Corresponds To a
Different Dataset, First Row: Corel-5k, Second Row: ESP-Game, Third Row:
IAPRTC-12........................................................................................................ 72
Table 2.8: Summary of Forensic Image Analyses studies ................................ 80
Table 2.9: Summary upon a Single Object Based Image Retrieval Approaches
.......................................................................................................................... 83
Table 2.10: Summary upon Multiple Objects-Based Image Retrieval
Approaches ....................................................................................................... 87
Table 2.11: Summary upon Automatic Image Annotation Approaches ............. 88
Table 3.1: Comparison between the Most Popular Cloud APIs Features.......... 96
Table 3.2: Example images with IAPR-TC 12 and ESP-Game Annotations ..... 99
Table 3.3: Comparison between Four Commercial Systems’ Annotation Output
Forms .............................................................................................................. 101
Table 3.4: The Comparison of Annotation Performance for Microsoft, Google
Cloud, Imagga, and Clarifai on the IAPR-TC 12 Dataset ................................ 103
Table 3.5: The Comparison of Annotation Performance for Microsoft, Google
Cloud, Imagga, and Clarifai on ESP-Game Dataset ....................................... 104
Table 3.6: Difference between Vocabulary Sizes of Systems from IAPR-TC 12
and ESP-Game Datasets ................................................................................ 105
Table 3.7: Example of Word Repetition by Different Systems ......................... 110
Table 3.8: Results of Comparison of the Multi-Algorithmic Approach with the
Commercial Systems in the IAPR-TC 12 Dataset ........................................... 112
XIV
Table 3.9: The Results of Comparison of the Multi-Algorithmic Approach with
Commercial Systems in the ESP-Game dataset ............................................. 113
Table 3.10: The Retrieval Performance Based on One-Word Queries (Those in
red refer to the superiority of the proposed approach) .................................... 115
Table 3.11: Examples of Fusion Annotation Matching with Ground Truth
Annotation for Two Datasets (APR-TC 12 and ESP-Game) ........................... 116
Table 3.12: Examples of Missing Annotations ................................................ 118
Table 3.13: Examples of Image Re-annotation ............................................... 119
Table 4.1: Investigator Information.................................................................. 135
Table 4.2: Roles .............................................................................................. 135
Table 4.3: List of Permissions ......................................................................... 136
Table 4.4: Role Permissions ........................................................................... 136
Table 4.5: Case Information ............................................................................ 137
Table 4.6: Case Investigator ........................................................................... 137
Table 4.7: Case Archive .................................................................................. 138
Table 4.8: Actions ........................................................................................... 139
Table 4.9: Case Sources ................................................................................ 144
Table 4.10: Source Information ....................................................................... 144
Table 4.11: Image Information ........................................................................ 145
Table 4.12: JPEG Metadata ............................................................................ 145
Table 4.13: Image Annotations ....................................................................... 147
Table 4.14: Words ........................................................................................... 147
Table 4.15: Search Information ....................................................................... 151
Table 4.16: Search Filters ............................................................................... 152
Table 4.17: Search Results ............................................................................. 152
Table 4.18: Bookmarks ................................................................................... 153
Table 4.19: Bookmark Images ........................................................................ 153
Table 4.20: Forensic Analyses Information ..................................................... 159
Table 4.21: Forensic Analyses Results ........................................................... 159
Table A.1: Overall Accuracy for Different Grid Size ........................................ 252
Table B.1: Average precision of different methods ......................................... 257
1
1 Introduction
1.1 Introduction
Digital forensics is the science concerned with identifying, collecting, examining,
and analysing digital evidence found on digital devices (Palmer, 2001). Various
types of digital evidence, such as computer documents, text and instant
messages, emails, images, and browsing histories can be collected from
electronic devices and used effectively to solve investigations (NFSTC, 2007;
NIST, 2018). Images represent efficient and simple communication media for
people compared to text because of their immediacy and how easy it is for a
human to understand their content. A video recorded by CCTV cameras could be
used as crucial evidence showing exactly what happened at a crime scene, such
as a bank robbery or undercover sting operation. Therefore, images and videos
have become major information sources in the digital age and widely utilized in
criminal investigations (Redi, Taktak and Dugelay, 2011; Xiao, Li and Xu, 2019),
and may represent the best form of electronic evidence as it can be considered a
real-time eyewitnesses (Singh, 2015).
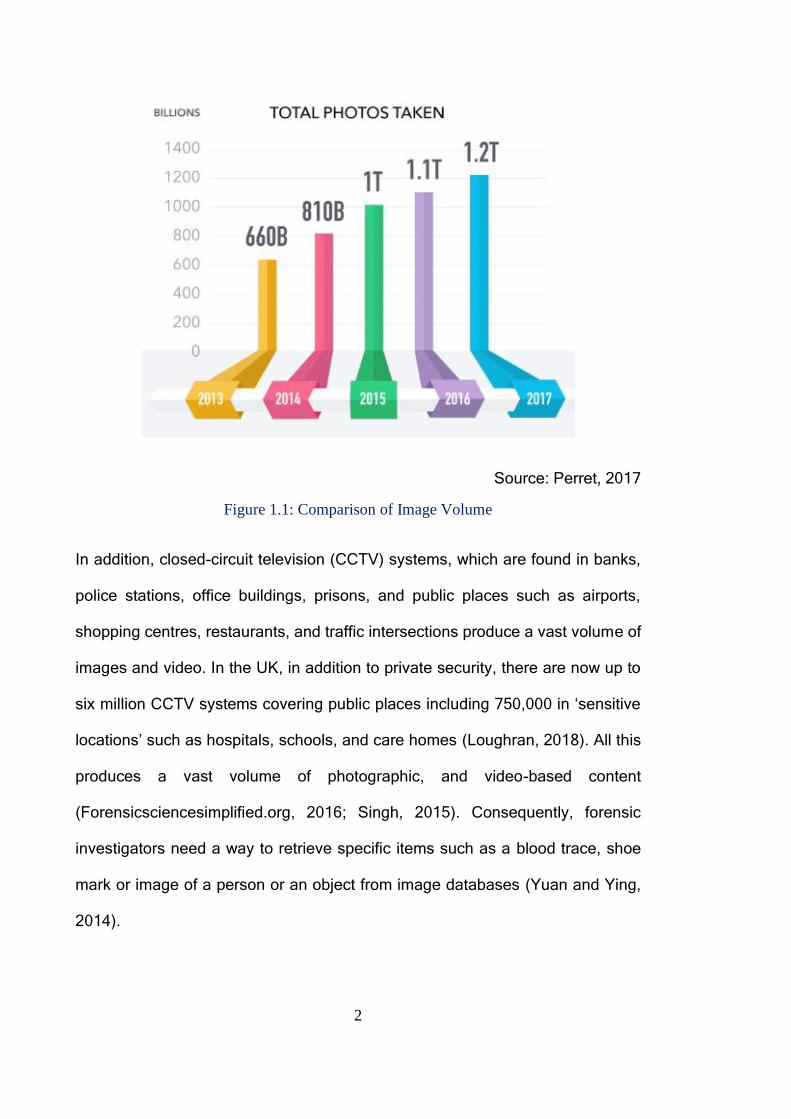
In recent years, the volume of digital photos has grown rapidly with 1.2 trillion
digital photos taken worldwide in 2017 as shown in Figure 1.1 (Perret, 2017).
Among the main factors, the smartphone is probably the biggest factor
contributing to this sudden boom in the number of photographs taken (Richter,
2017). Smartphones are now considered the easiest way to take pictures rather
than tablets or digital cameras (Richter, 2017). In 2018, 95% of households in the
UK owned mobile phones, compared to only 44% in 2000 (Office for National
Statistics (UK), 2019).
2
Source: Perret, 2017
Figure 1.1: Comparison of Image Volume
In addition, closed-circuit television (CCTV) systems, which are found in banks,
police stations, office buildings, prisons, and public places such as airports,
shopping centres, restaurants, and traffic intersections produce a vast volume of
images and video. In the UK, in addition to private security, there are now up to
six million CCTV systems covering public places including 750,000 in ‘sensitive
locations’ such as hospitals, schools, and care homes (Loughran, 2018). All this
produces a vast volume of photographic, and video-based content
(Forensicsciencesimplified.org, 2016; Singh, 2015). Consequently, forensic
investigators need a way to retrieve specific items such as a blood trace, shoe
mark or image of a person or an object from image databases (Yuan and Ying,
2014).
3
Because of the increase in volumes of images and video, it is becoming too time-
consuming and costly for investigators to analyse the images manually.
Therefore, forensic investigators require an intelligent and efficient method of
retrieving specific items from a large amount of multimedia data (Yuan and Ying,
2014). As a result, forensic image analysis has emerged as a new branch of
digital forensics that enables investigators to effectively and accurately extract
evidence from a huge number of images in an automatic and forensically sound
manner that meets forensics requirements (Hanji and Rajpurohit, 2013).
However, at present, many challenges are posed in image analysis for digital
forensics: the huge volume is not the lone challenge facing forensic image
analysis and each case has its own requirements. In addition, the content of
images that come with cases is diverse and acquired from various data sources.
The images themselves are realistic e.g. unconstrained illumination conditions,
unknown position, noise, blurry and irregular texture (background). Also they vary
in size, format, pattern of the shoe or tyres marks and number of objects that exist
each image. Further, the objects inside the image differ in size, colour, shape,
texture, and orientation. In addition, captured images from CCTV cameras may
be faded (inaccurate colours), grainy, poor contrast, night vision, resolution, and
light balance (Conzer security marketing, 2018; Allababidi, 2018). Further,
investigators need to use a wide range of information to filter images so as to find
crucial evidence. Unfortunately, existing forensic tools such as EnCase and
Forensic Toolkit (FTK) are insufficient in areas such as automatic content image
analysis, extraction of evidence, and in identifying the correlation between
images. In addition, forensically, little work has been undertaken using image
analysis to better understand the context of images. Accuracy and speed of
4
retrieving images are additional challenges faced in using image analysis in
digital forensics.
The above challenges raise two research questions that need to be addressed
which are:
Exploring the performance of image annotation systems.
Exploring the approaches that enable the investigator to ask complex
questions of the data and get more time response, meaningful response
to understand the nature question he has been asked.
1.2 Research Aim and Objectives
This research is aimed at developing a novel framework that can aid the
investigation process in analysing, interpreting, and creating a multimedia-based
context. The proposed framework will be developed to analyse a large volume of
image sources in an efficient and accurate manner through creating the
necessary annotations and developing analyses method to inspect, correlate,
and interpret the evidence. This will reduce the cognitive burden placed on the
investigator when handling large volumes of data and provide more timely data
analysis. To achieve this, the following research objectives were established:
Develop a current state-of-the-art understanding of digital forensics and
forensic image analysis, including the challenges and available research.
Morover, investigate the current state-of-the-art in object-based image
retrieval and automatic image annotation (AIA).
Propose an approach to improve image recognition.
5
Design a novel architecture that enables investigators to perform various
forensic analyses that aid in reducing the time, effort, and cognitive load
being placed on investigators to identify relevant evidence.
Develop and implement a prototype of the proposed architecture to
demonstrate its practical effectiveness.
Evaluate the framework through presenting the work via a video and then
send it to the academic experts in order to receive their unbiased and
objective feedback.
1.3 Thesis Structure
To fulfil the aims and objectives stated in the previous section, this thesis
continues in Chapter 2 by providing an overview of the digital forensic process. In
addition, it lists methods for the forensic investigation of multimedia data. The
chapter defines forensic image analysis and its various categories and provides
a literature review of image analysis studies on digital forensics. The challenges
and problems in the current state-of-the-art of forensic image analysis are also
discussed. In addition, it presents a literature review of the existing research on
object-based image retrieval (single or multiple objects) and automatic image
annotation methods. The chapter discusses employing these methods in forensic
image analysis to solve previously highlighted challenges.
Chapter 3 begins by illustrating the problems and issues faced by automatic
image annotation studies and justifies the unsuitability of the approaches. The
chapter investigates the performance of existing commercial systems and
proposes the multi-algorithmic approach. The performance of commercial
systems and the proposed approach based on a more robust dataset annotation

6
are also re-evaluated. Following this, the chapter presents each experiment
individually and discusses the results.
Chapter 4 starts with the system requirements devised for the proposed Object-
based Multimedia Forensic Analysis Tool (OM-FAT). The next section of the
chapter presents the novel OM-FAT architecture followed by a discussion of its
operation. Finally, the chapter presents the workflow system design based on
OM-FAT architecture.
Chapter 5 demonstrates the functional prototype that was implemented based
upon the proposed OM-FAT architecture. The first section of the chapter
illustrates the system’s development environment, including the front-end and
back-end. The next sections of the chapter explain the ability of the tool to
facilitate and expedite the investigation process in cases (e.g. Child abduction
case) dealing with a large number of images.
Chapter 6 begins by presenting the methodology that illustrates the steps of the
evaluation process to determine the usability, functionality, and appropriateness
of the system. Followed by the participants' selection phase followed by the
methods are used to carry out the interviewee. The next sections discuss the
participant’s feedbacks and its discussion.
Finally, Chapter 7 concludes the research by identifying the main achievements
made during the research. The limitations and future work are also identified and
discussed.
7
2 Digital Forensics and Image Analysis
2.1 Introduction
There is a considerable number of images that can be used as clues from every
crime scene. Therefore, during the different stages of the investigative process,
forensic tools are needed to support the protection, management, processing,
interpretation, and visualisation of multimedia data (Shriram, Priyadarsini and
Baskar, 2015). Researchers have shown an increased interest in developing
tools and protocols for dealing with images, audio and video footage, and other
multimedia content coming from digital sources, which include evidence
extraction, automatic categorization, and indexing.
This chapter introduces digital forensics, its stages, and the various types of
digital forensic evidence. In addition, techniques for analysing multimedia data
are also presented. An overview of the challenges of image analysis that face
image analysis in digital forensic is also outlined. Additionally, the current state of
forensic image analysis, single/multiple object-based image retrieval and
automatic image annotation approaches are also discussed. The chapter
concludes with a discussion section that scientifically discusses how these
approaches could be employed on forensic images to retrieve specific evidence
and thus to solve the current challenges of image analysis within the forensic
domain.
8
2.2 Digital Forensics
The recovery and analysis of digital information has become a major component
of many criminal investigations. Explosive growth in the number of personal
digital devices, such as notebooks, tablets, and smartphones, as well as the
development of communication infrastructure, has generated huge amounts of
data. Some of this information may be valuable evidence and play a fundamental
role in criminal investigations (van Baar, van Beek and van Eijk, 2014; Anthony
T. S. Ho, 2015). Digital evidence can vary from child pornography images to
encrypted data used in different criminal activities. In order to locate, maintain,
and examine all types of digital evidence, specified methods and resources are
required. This growth in the size of digital material, as well as the complexity and
diversity of the digital evidence, requires a new understanding of forensic data
analysis techniques that can keep up with the evolving digital society (van Baar,
van Beek and van Eijk, 2014; Van Beek et al., 2015).
According to the Digital Forensic Research Workshop (DFRWS) in 2001, digital
forensics science can be defined as ‘the use of scientifically derived and proven
methods toward the preservation, collection, validation, identification, analysis,
interpretation, documentation, and presentation of digital evidence derived from
digital sources for the purpose of facilitating or furthering the reconstruction of
events found to be criminal, or helping to anticipate unauthorized actions shown
to be disruptive to planned operations’ (Palmer, 2001). The digital forensics
process can be categorized into different stages according to the DFRWS
Investigative Model (2001) as follows (Patil and Kapse 2015):
9
Identification: Includes recognising an incident from indicators and
determining its type; profile detection, system monitoring, and audit
analyses are also performed in this stage.
Preservation: The task of the investigator in this stage is to preserve data
that offer evidence by using hash signatures such as MD5 or SHA1 to
maintain the integrity of the data collected. In addition, the investigator
deals with other data types, such as documents stored in a computer, voice
and video files, e-mail and SMS conversations, lists of telephone contacts
and calls made, patterns of network traffic, and virus intrusion and
detection activity. In addition, all user data and associated metadata,
including activity and system logs from different locations or storage
devices, are copied by the investigator so that they can be examined
separately without changing the original data collected.
Collection: In this stage, the investigator is responsible for collecting
relevant data physically by employing approved methods.
Examination: In this stage, the data collected in the previous stage are
examined using various forensic tools in order to extract information from
the digital evidence and to configure that information for the analysis stage.
Analysis: The aim of this stage is to analyse the results obtained from the
examination stage to derive useful information that addresses the
questions to draw the conclusion and find the answers for the essential six
questions: who, how, why, what, when, and where.
Presentation: The work that has been performed in all previous stages is
documented and presented during this stage either as preparation for
submission to the court or for returning to the work later, when required.
10
2.3 Digital Evidence and Forensic Tools
The term digital evidence typically refers to information stored or transmitted on
digital devices, such as computer hard drives, Personal Digital Assistants (PDAs),
mobile phones, flash cards in a digital camera, and CDs, that can be relied upon
in court. Digital evidence can be helpful in criminal investigations, including
missing persons, homicides, drug dealing, sex offenses, fraud, child abuse, and
theft of personal data (National Institute of Justice, 2014). Civil cases can also
rely on digital evidence and electronic detection is becoming a regular part of civil
contentions. As a result, the use of digital evidence has become more common
for all types of crimes, not only e-crime. There are many different types of digital
information that can be gathered from electronic devices and used as evidence.
Examples of this kind of information include computer documents, e-mails, text
and instant messages, electronic transactions, images, and Internet histories
(Gubanov, 2012).
The tools that are used to acquire and analyse digital evidence, however, may
pose a challenge for investigators, because they are typically designed only to do
specific tasks; e.g., Encase and FTK are utilised to retrieve data from hard drives
and memory dumps. Another challenge that investigators face is the difficulty
integrating the different functionalities of different tools. However, the investigator
still must manually analyse the digital evidence and recognise interrelationships
between artefacts in order to extract potential clues, because of limitations of the
current forensic tools for analysing multimedia file content (image or video) to
extract objects that could represent substantial evidence for the investigation
process (Al Fahdi et al., 2016).
11
2.4 Forensics Investigation Methods of Multimedia Data
Recently, a proliferation of multimedia data has taken place throughout many
communities. Because of the abundance of high-quality audio recorders along
with digital image and video cameras, anyone can capture multimedia content. In
addition, access to digital data anywhere and at any time has become easy with
the broad availability of landline and mobile Internet access. Digital evidence has
become as important as DNA and physical evidence. Because 80-90% of cases
involve some type of digital evidence, it is crucial to extract evidence from
multimedia devices so as to ensure better law enforcement (Kim Medaris, 2008).
Therefore, protecting multimedia content from illegal use, revealing and
reconstruct illegal activities from it, and utilising it as a source of intelligence have
become necessary. Also, investigators must learn how to find what they are
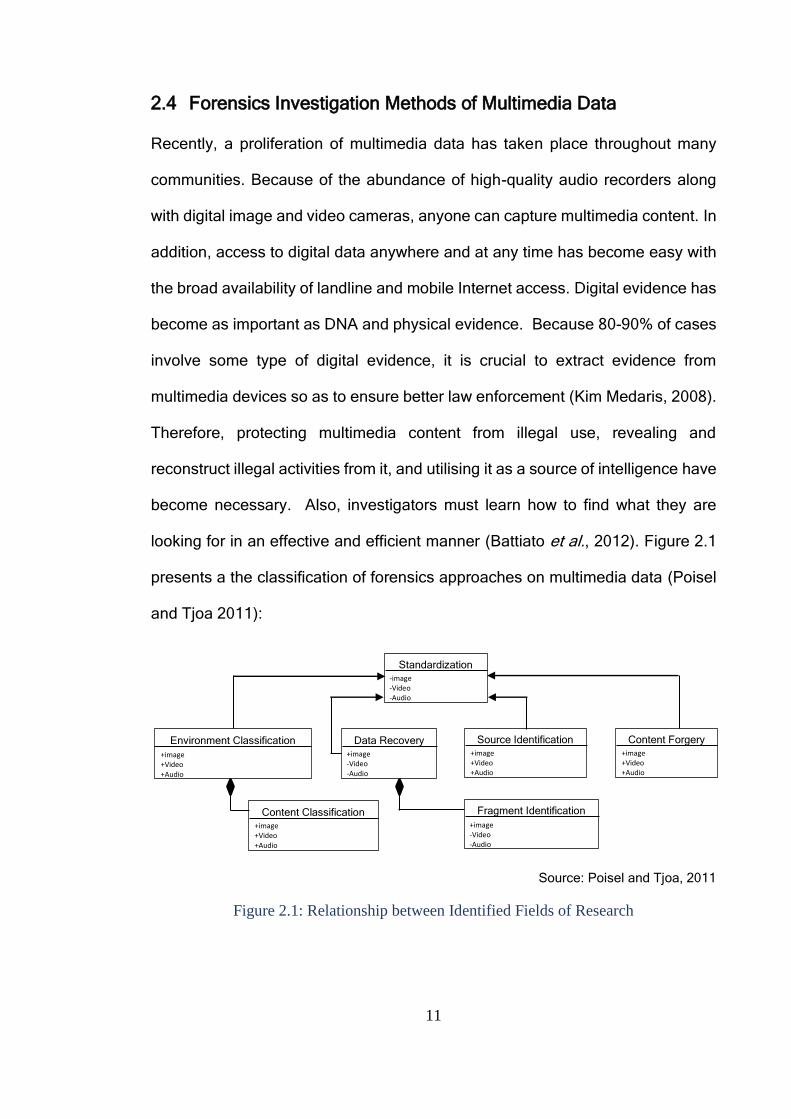
looking for in an effective and efficient manner (Battiato et al., 2012). Figure 2.1
presents a the classification of forensics approaches on multimedia data (Poisel
and Tjoa 2011):
Source: Poisel and Tjoa, 2011
Figure 2.1: Relationship between Identified Fields of Research
Standardization -image -Video -Audio
Environment Classification
+image +Video +Audio
Data Recovery +image -Video -Audio
Source Identification +image +Video +Audio
Content Forgery +image +Video +Audio
Content Classification +image +Video +Audio
Fragment Identification
+image -Video -Audio
12
Source Identification: The goal of this method is to determine the devices,
such as digital cameras, scanners, or video cameras, which were used to
create digital content.
Environment Classification: This method tries to identify the location and
the local conditions in which the data was taken or recorded. The context
of such a classification depends on the type of media investigated, such
as image data, audio data, or video data.
Content Classification: As storage media has become cheaper, it has
become common for computers to be equipped with large capacity hard
drives (e.g., one Terabyte). In addition, a suspect may have number of
digital devices, with the result that several terabytes of data may need to
be examined in a single case. In such cases, it is difficult for investigators
to process this information manually. It becomes important to classify data
based on its content in order to minimise the effort and time consumed.
Typical applications in the field of content classification could assist
identification for any data type, but most existing research has focused on
the classification of retrieved video and digital image files. This
classification concentrates on pornography from computer systems as well
as evidence related to financial crimes and data from surveillance
cameras.
Content Forgery: This method implements different approaches to detect
whether the digital multimedia data content has been modified or not, such
as by image retouching, image splicing, or a copy-move attack.
Data Recovery Approaches for Multimedia Files: These approaches are
concerned with recovering unreachable data from damaged storage disks
13
or removable files when the normal approaches to access stored data fail;
this includes file carving, which is independent of the system metadata. A
significant increase in the number of data recovery techniques has
occurred because of the increase of digital content being stored on a wide
number of storage devices.
Fragment Identification: An important step in finding all parts of a file is
classifying fragments discovered during file recovery. Several methods
have been successfully used to achieve this purpose. One early method
used “magic numbers” that persist in files of the same type; however, this
method can be inaccurate, because locating whole files or fragments that
contain these magic numbers is coincidentally. Therefore, new
approaches have been advanced that deal with the statistical evaluation
of the fragment content.
Steganography and Steganalysis: Steganography is utilised to hide
information in the form of digital files, text, or images so it can be
transmitted covertly. Steganalysis is the term used to refer to the
technologies utilised to detect the presence of steganography.
Standardisation: In the context of forensics, standards ensure precise and
trustworthy results. Such standards can be classified into two groups:
paper and material standards. The first concerns the description of sets of
procedures for the execution of specific activities, while the second refers
to actual tools that can be used when conducting procedures.
Standardisation is a key element for all research areas to better support
collaboration as well as utilisation by practitioners and researchers (Poisel
and Tjoa 2011).
14
Despite studies that have sought to develop efficient methods for conserving and
analysing multimedia content, this process still suffers from several major
drawbacks, such as multiple formats, the emergence of huge volume of data, and
the complexity of the targeted material. Other shortcomings include the lack of
structure and metadata, time restrictions, security, intelligence, and other
application-specific constraints (Battiato et al., 2012; Poisel and Tjoa, 2011). In
addition, it is evident from the aforementioned methods that most attention has
been paid to activities that deal with the multimedia file. However, there is
presently no method for examining multimedia file content in order to extract
evidence that could help to solve the crime. Therefore, there is still a need to
explore multimedia investigation methods that can examine and analyse
multimedia file content in order to extract valuable evidence.
2.5 Forensic Image Analysis
According to the definition provided by SWGIT (2007), ‘Forensic image analysis
is the application of image science and domain expertise to interpret the content
of an image and/or image itself in legal matters’.
The aims of Forensic Image Analysis (FIA) include feature recognition,
measurement of similarities between image components, and extraction of
meaningful information for comparison and/or analysis (Hanji and Rajpurohit,
2013). Forensic image analysis can be divided into five main categories, which
are presented below (Hanji and Rajpurohit, 2013):
1. Photo Image Comparison
Image comparison finds similarities, differences, or common
characteristics through comparisons between query image features and
15
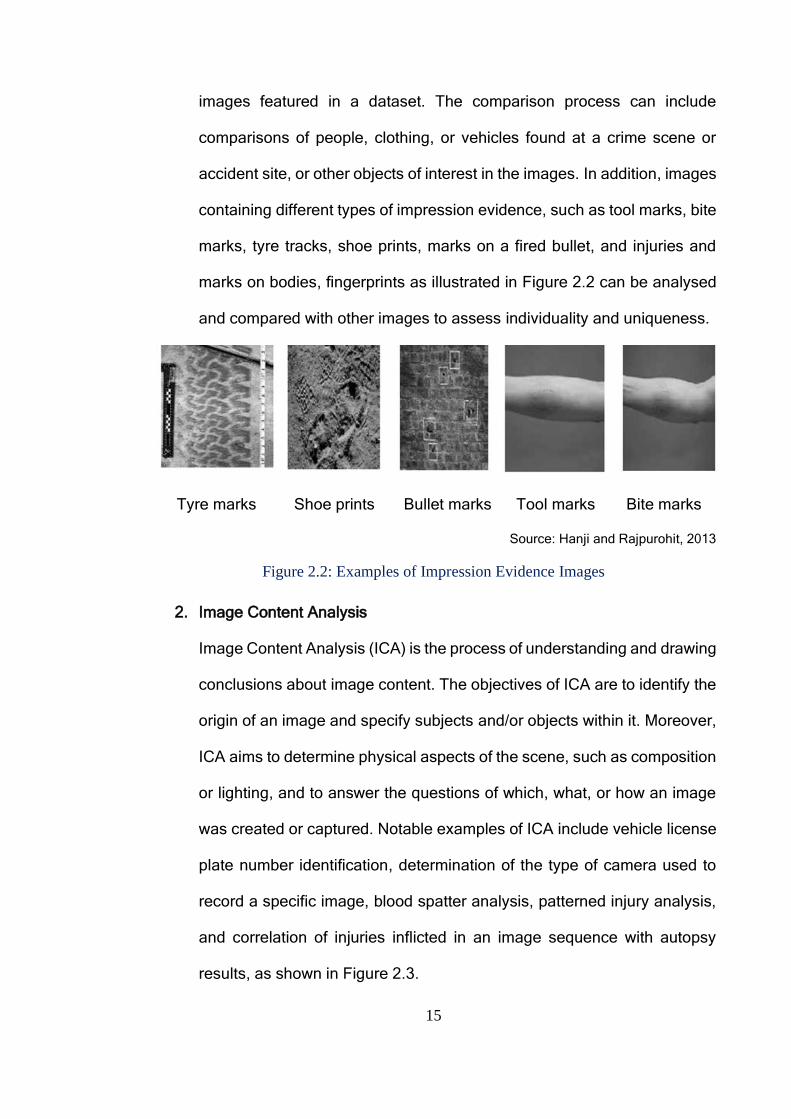
images featured in a dataset. The comparison process can include
comparisons of people, clothing, or vehicles found at a crime scene or
accident site, or other objects of interest in the images. In addition, images
containing different types of impression evidence, such as tool marks, bite
marks, tyre tracks, shoe prints, marks on a fired bullet, and injuries and
marks on bodies, fingerprints as illustrated in Figure 2.2 can be analysed
and compared with other images to assess individuality and uniqueness.
Tyre marks Shoe prints Bullet marks Tool marks Bite marks
Source: Hanji and Rajpurohit, 2013
Figure 2.2: Examples of Impression Evidence Images
2. Image Content Analysis
Image Content Analysis (ICA) is the process of understanding and drawing
conclusions about image content. The objectives of ICA are to identify the
origin of an image and specify subjects and/or objects within it. Moreover,
ICA aims to determine physical aspects of the scene, such as composition
or lighting, and to answer the questions of which, what, or how an image
was created or captured. Notable examples of ICA include vehicle license
plate number identification, determination of the type of camera used to
record a specific image, blood spatter analysis, patterned injury analysis,
and correlation of injuries inflicted in an image sequence with autopsy
results, as shown in Figure 2.3.
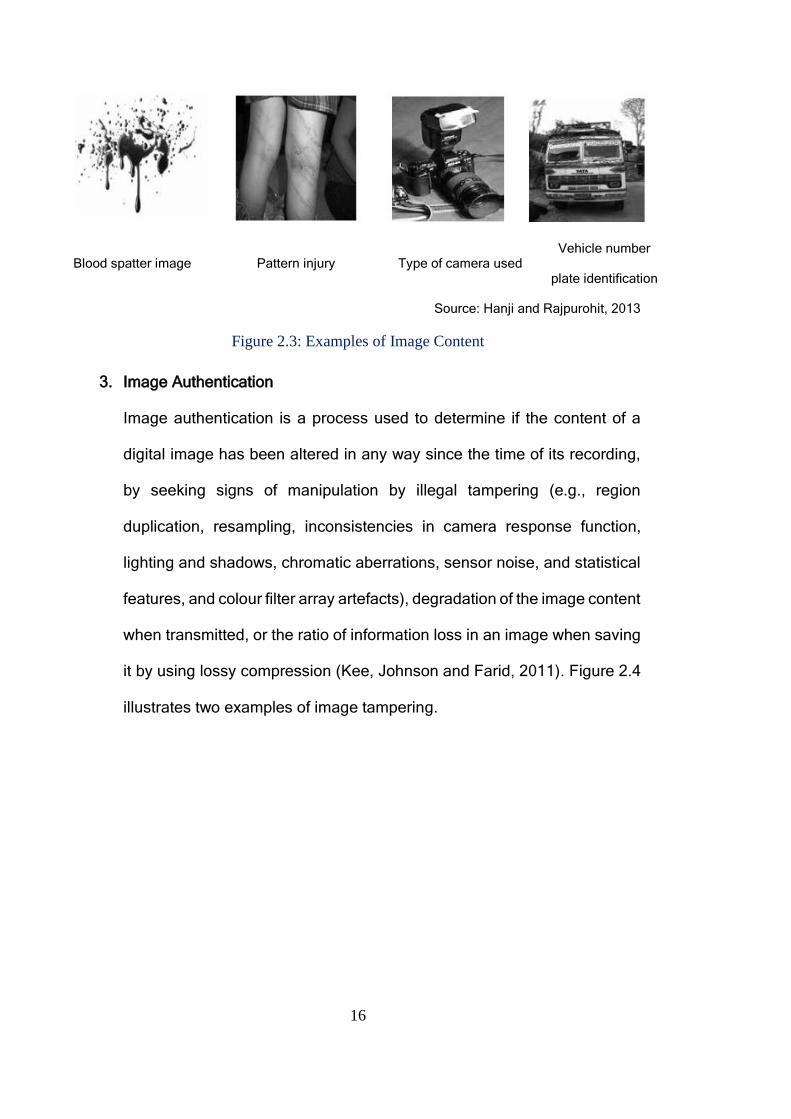
16
Blood spatter image Pattern injury Type of camera used Vehicle number
plate identification
Source: Hanji and Rajpurohit, 2013
Figure 2.3: Examples of Image Content
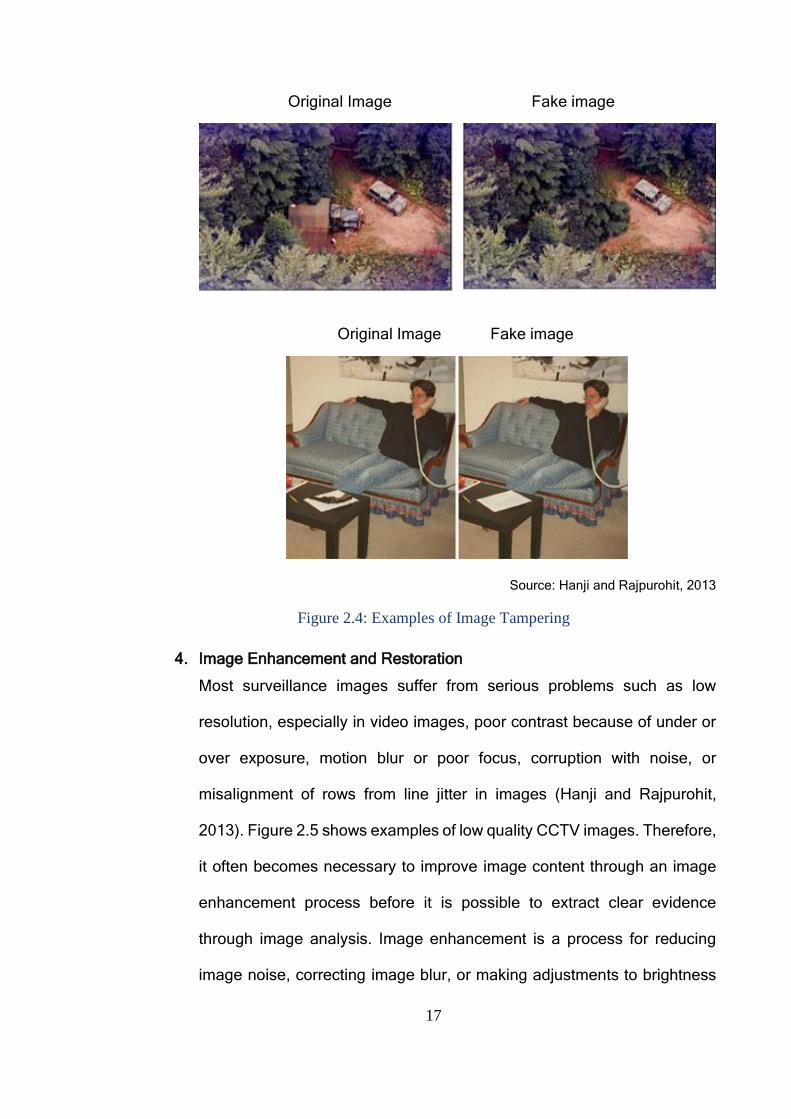
3. Image Authentication
Image authentication is a process used to determine if the content of a
digital image has been altered in any way since the time of its recording,
by seeking signs of manipulation by illegal tampering (e.g., region
duplication, resampling, inconsistencies in camera response function,
lighting and shadows, chromatic aberrations, sensor noise, and statistical
features, and colour filter array artefacts), degradation of the image content
when transmitted, or the ratio of information loss in an image when saving
it by using lossy compression (Kee, Johnson and Farid, 2011). Figure 2.4
illustrates two examples of image tampering.
17
Original Image Fake image
Original Image Fake image
Source: Hanji and Rajpurohit, 2013
Figure 2.4: Examples of Image Tampering
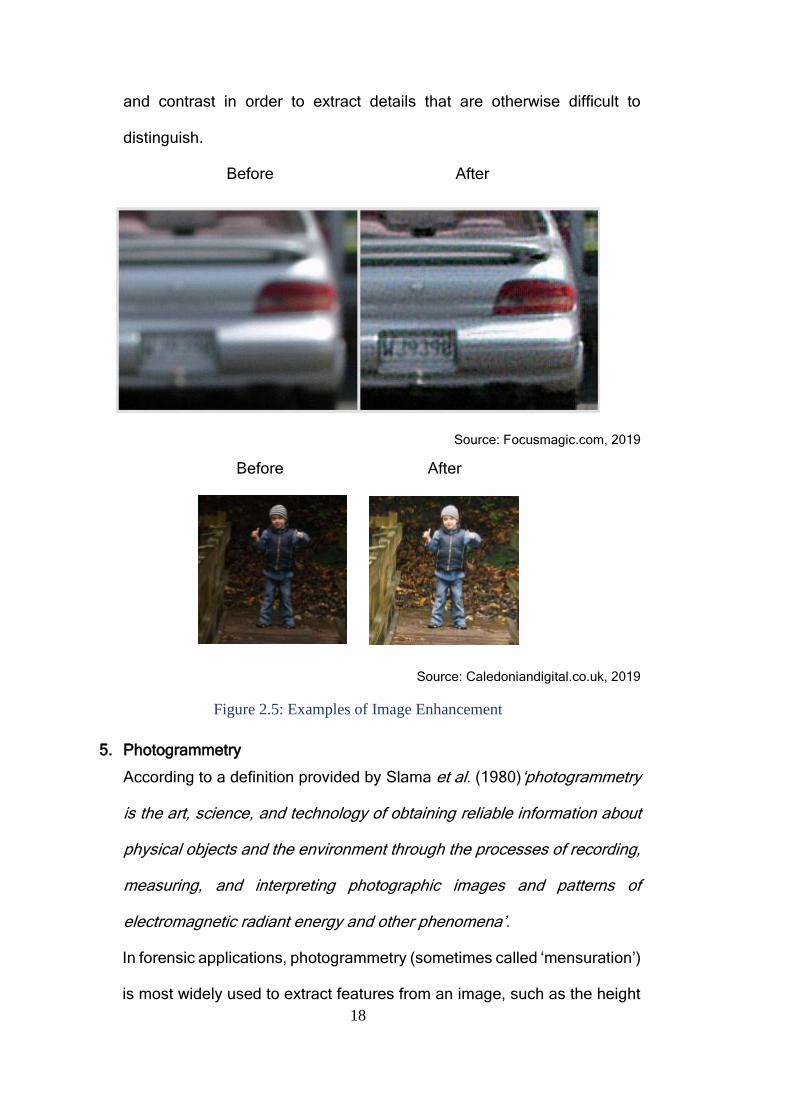
4. Image Enhancement and Restoration
Most surveillance images suffer from serious problems such as low
resolution, especially in video images, poor contrast because of under or
over exposure, motion blur or poor focus, corruption with noise, or
misalignment of rows from line jitter in images (Hanji and Rajpurohit,
2013). Figure 2.5 shows examples of low quality CCTV images. Therefore,
it often becomes necessary to improve image content through an image
enhancement process before it is possible to extract clear evidence
through image analysis. Image enhancement is a process for reducing
image noise, correcting image blur, or making adjustments to brightness
18
and contrast in order to extract details that are otherwise difficult to
distinguish.
Before After
Source: Focusmagic.com, 2019
Before After
Source: Caledoniandigital.co.uk, 2019
Figure 2.5: Examples of Image Enhancement
5. Photogrammetry
According to a definition provided by Slama et al. (1980)‘photogrammetry
is the art, science, and technology of obtaining reliable information about
physical objects and the environment through the processes of recording,
measuring, and interpreting photographic images and patterns of
electromagnetic radiant energy and other phenomena’.
In forensic applications, photogrammetry (sometimes called ‘mensuration’)
is most widely used to extract features from an image, such as the height
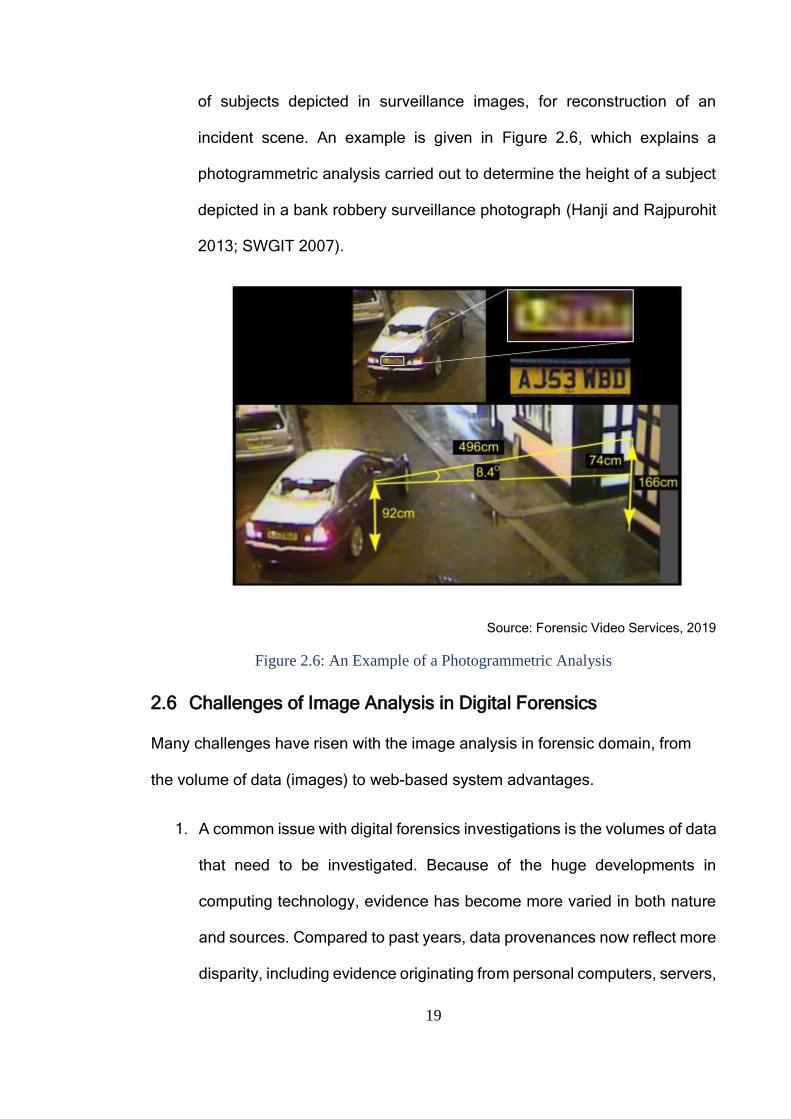
19
of subjects depicted in surveillance images, for reconstruction of an
incident scene. An example is given in Figure 2.6, which explains a
photogrammetric analysis carried out to determine the height of a subject
depicted in a bank robbery surveillance photograph (Hanji and Rajpurohit
2013; SWGIT 2007).
Source: Forensic Video Services, 2019
Figure 2.6: An Example of a Photogrammetric Analysis
2.6 Challenges of Image Analysis in Digital Forensics
Many challenges have risen with the image analysis in forensic domain, from
the volume of data (images) to web-based system advantages.
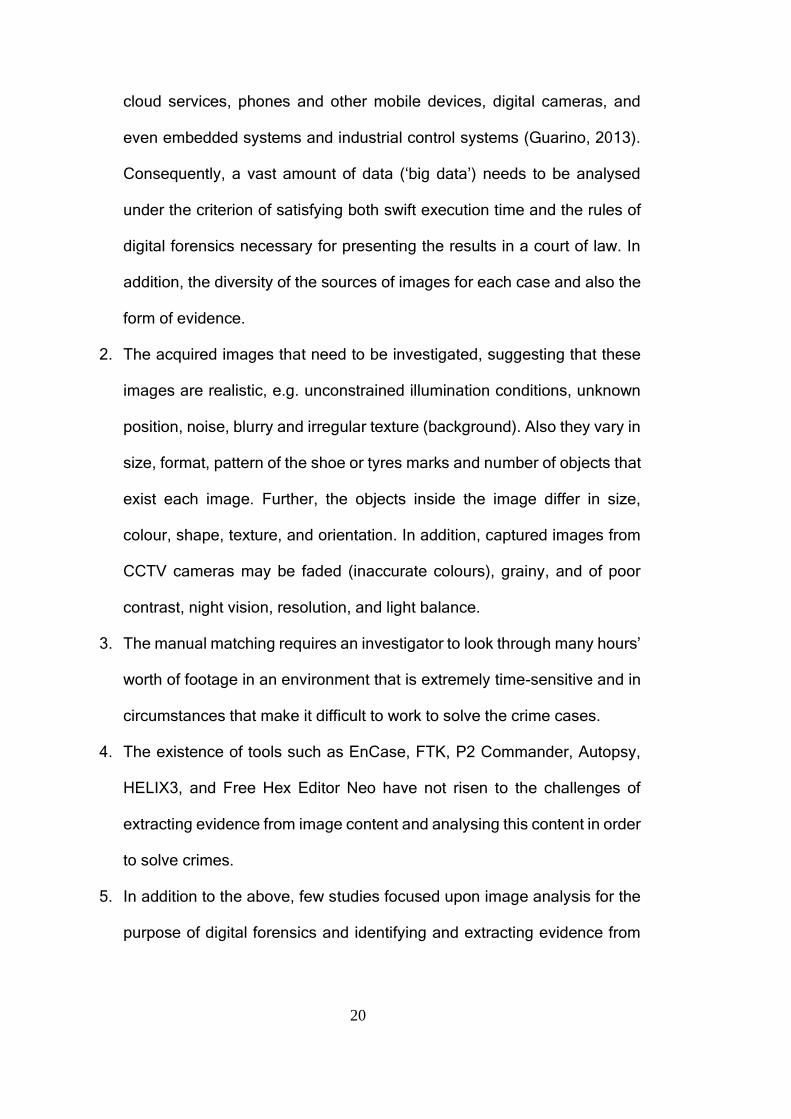
1. A common issue with digital forensics investigations is the volumes of data
that need to be investigated. Because of the huge developments in
computing technology, evidence has become more varied in both nature
and sources. Compared to past years, data provenances now reflect more
disparity, including evidence originating from personal computers, servers,
20
cloud services, phones and other mobile devices, digital cameras, and
even embedded systems and industrial control systems (Guarino, 2013).
Consequently, a vast amount of data (‘big data’) needs to be analysed
under the criterion of satisfying both swift execution time and the rules of
digital forensics necessary for presenting the results in a court of law. In
addition, the diversity of the sources of images for each case and also the
form of evidence.
2. The acquired images that need to be investigated, suggesting that these
images are realistic, e.g. unconstrained illumination conditions, unknown
position, noise, blurry and irregular texture (background). Also they vary in
size, format, pattern of the shoe or tyres marks and number of objects that
exist each image. Further, the objects inside the image differ in size,
colour, shape, texture, and orientation. In addition, captured images from
CCTV cameras may be faded (inaccurate colours), grainy, and of poor
contrast, night vision, resolution, and light balance.
3. The manual matching requires an investigator to look through many hours’
worth of footage in an environment that is extremely time-sensitive and in
circumstances that make it difficult to work to solve the crime cases.
4. The existence of tools such as EnCase, FTK, P2 Commander, Autopsy,
HELIX3, and Free Hex Editor Neo have not risen to the challenges of
extracting evidence from image content and analysing this content in order
to solve crimes.
5. In addition to the above, few studies focused upon image analysis for the
purpose of digital forensics and identifying and extracting evidence from
21
images (Hsu, Kang and Mark Liao, 2013) as will be demonstrated later.
These studies are incapable of meeting the investigators’ requirements.
6. The current tools and systems (proposed in forensic studies) do not
provide the investigator the ability to ask higher-level more abstract
questions of the data because there is no automatic correlation between
images based on metadata and image content.
7. The current tools and systems (proposed in forensic studies) are not web-
based applications. The web systems are accessible anytime, anywhere
and via any computer or device with an Internet connection. This makes
the sharing of data and collaborating on cases much easier because data
is stored in one central location, so investigators can share data and work
together to solve crime cases.
To help exemplify the above problems and challenges investigators face when
dealing with the huge number of images to find the right pieces of evidence to
solve a crime, the following different real crime cases were selected. The cases
have been selected to demonstrate the several categories of evidential artifacts
that need to be extracted to solve the crimes. Each case deals with different types
of evidence or may need to extract more than one category within a single
forensic case. For all cases, a number of metadata types such as date and time
should be used to refine the search domain.
Child abduction (car specifications or plate number): in situations where a
child is abducted, there is a need to collect all videos from surveillance
cameras at the crime scene and nearby locations that could provide
valuable footage to assist in finding the abducted child and the suspect.
The problem that investigators face is the large number of images that
22
must be analysed in the shortest possible time because hours can literally
mean the difference between life and death for the victim or escape for the
suspect (Sephton, 2017). At present, this would involve teams of
investigators manually trawling through the footage. Having identified
possible leads, such as a child being seen getting into a car, an
investigator may also try to identify and track the car. Currently, this would
involve a manual process of selecting possible CCTV feeds based on an
analysis of maps, sorting based on the time, and trawling through the
video. The use of a manual human matching process is a laborious and
time-consuming means of examining a large amount of image data
collected from surveillance systems in such cases.
Bank robbery (suspect’s descriptions): There are many bank robbery
cases happened and reported. The bank’s surveillance cameras captured
images of the perpetrators when they did their crimes. Based on the
captured images and/or the people were in the bank at the time, the
suspect description and possible escape direction can be identified. For
example, on November 01, 2017, Robbers wearing Halloween masks (as
shown in Figure 2.7) escaped with cash after targeting Lloyds TSB in
Newland Avenue, Hull, U.K. The police obtained CCTV images of the
masked men believed to have been involved in this robbery. One of the
men was holding a knife when they demanded money from a cashier. A
quantity of cash was handed over before the men quickly left branch. No
one was injured during the robbery, which happened just before 4.30pm.
The case detective used the CCTV footage to enquire some information
that may led to catch them. Such enquiries include their clothing, speaking

23
to local retailers who might stock this kind of mask, or, maybe some people
bandits (MORRIS, 2017).
Source: MORRIS, 2017
Figure 2.7: The Masked Robbers Who Targeted a Bank in Hull
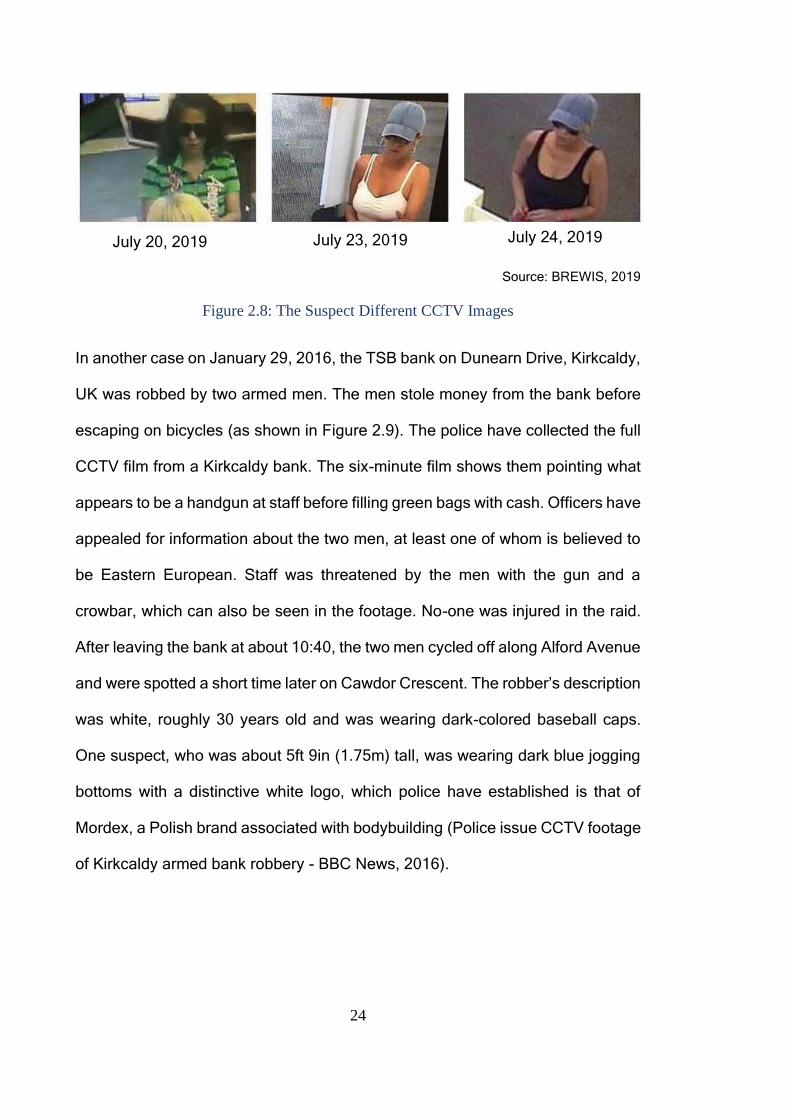
Another case is the robbery of four banks along the US east coast over five days
(July 20, 2019 to July 24, 2019). According to the FBI’s Charlotte division, the
suspect was described as a white or Hispanic woman who is around 5ft 3in tall
and weighs around 60kg. The bandit carried her pink handbag during at least two
of the robberies, and also wore leggings, a strappy top and a navy baseball hat,
based on the CCTV footage (as shown in Figure 2.8). The first heist took place at
Orrstown Bank in Carlisle, Pennsylvania, on July 20. Three days later, she was
spotted across state lines at the M&T Bank in Rehoboth Beach, Delaware. The
following day she crossed state lines again to hit the Southern Bank in Ayden,
North Carolina, on July 24. The same day, she did her fourth bank robbery, again
in Hamlet, North Carolina (BREWIS, 2019).
24
Source: BREWIS, 2019
Figure 2.8: The Suspect Different CCTV Images
In another case on January 29, 2016, the TSB bank on Dunearn Drive, Kirkcaldy,
UK was robbed by two armed men. The men stole money from the bank before
escaping on bicycles (as shown in Figure 2.9). The police have collected the full
CCTV film from a Kirkcaldy bank. The six-minute film shows them pointing what
appears to be a handgun at staff before filling green bags with cash. Officers have
appealed for information about the two men, at least one of whom is believed to
be Eastern European. Staff was threatened by the men with the gun and a
crowbar, which can also be seen in the footage. No-one was injured in the raid.
After leaving the bank at about 10:40, the two men cycled off along Alford Avenue
and were spotted a short time later on Cawdor Crescent. The robber’s description
was white, roughly 30 years old and was wearing dark-colored baseball caps.
One suspect, who was about 5ft 9in (1.75m) tall, was wearing dark blue jogging
bottoms with a distinctive white logo, which police have established is that of
Mordex, a Polish brand associated with bodybuilding (Police issue CCTV footage
of Kirkcaldy armed bank robbery - BBC News, 2016).
July 20, 2019 July 23, 2019 July 24, 2019
25
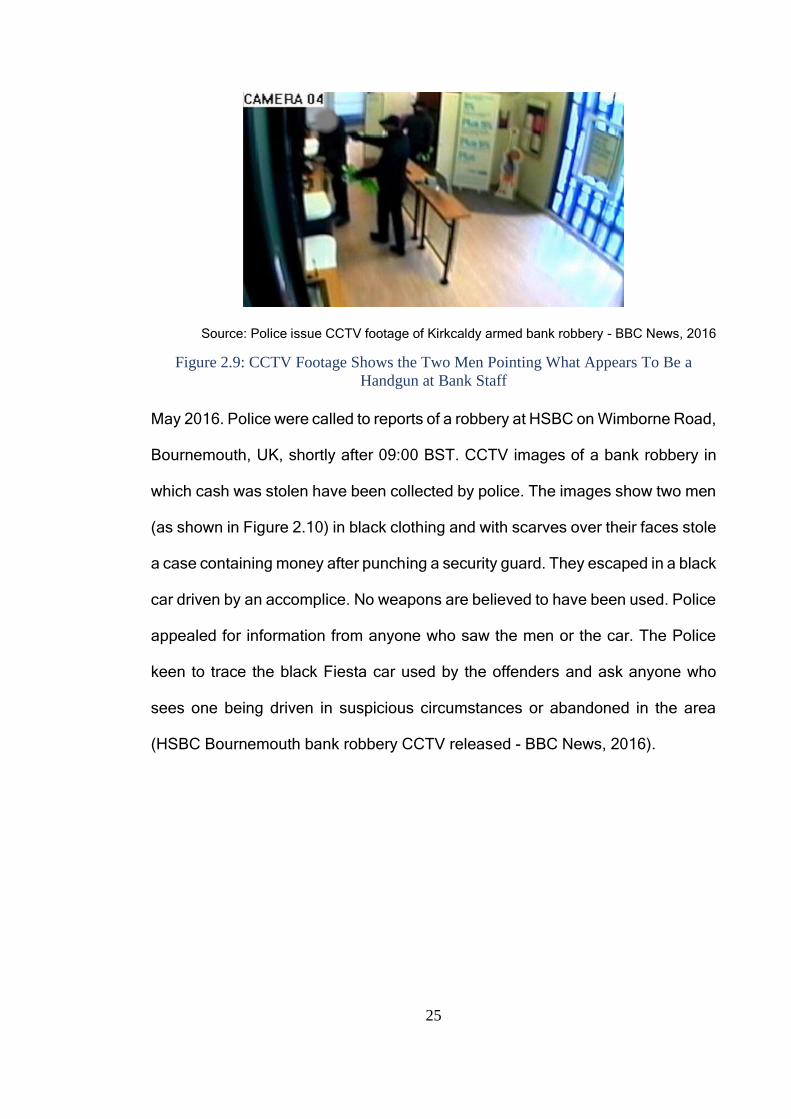
Source: Police issue CCTV footage of Kirkcaldy armed bank robbery - BBC News, 2016
Figure 2.9: CCTV Footage Shows the Two Men Pointing What Appears To Be a
Handgun at Bank Staff
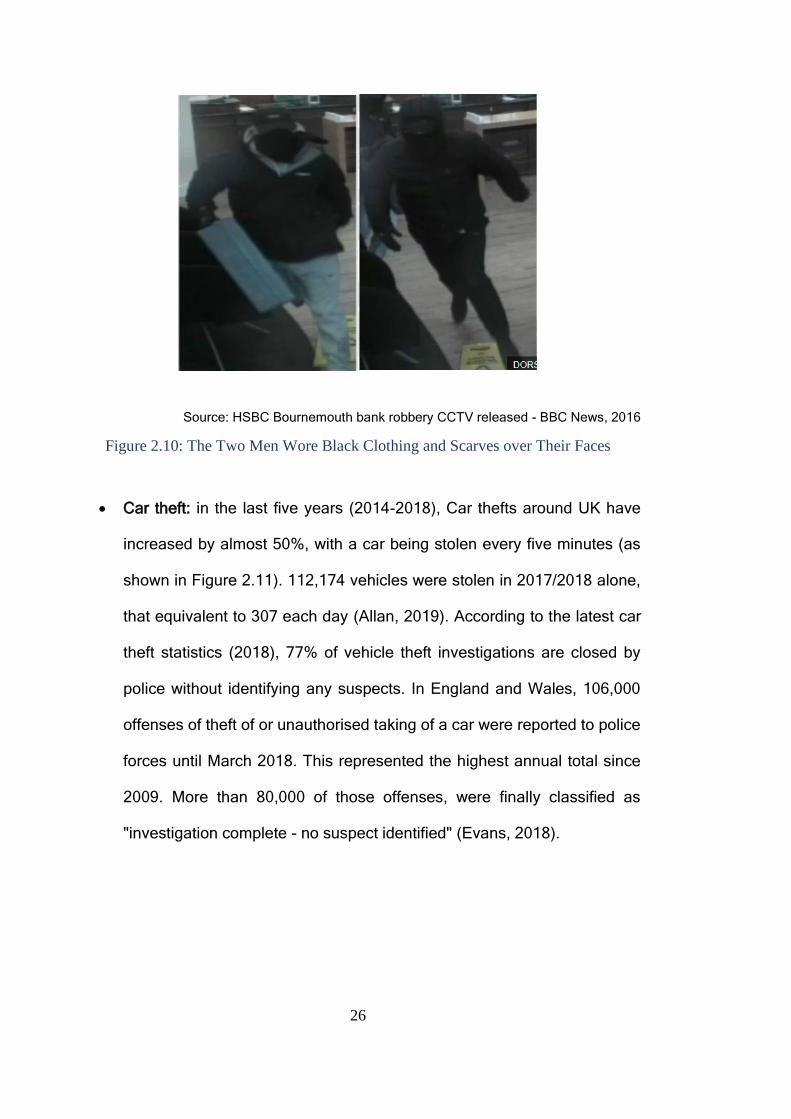
May 2016. Police were called to reports of a robbery at HSBC on Wimborne Road,
Bournemouth, UK, shortly after 09:00 BST. CCTV images of a bank robbery in
which cash was stolen have been collected by police. The images show two men
(as shown in Figure 2.10) in black clothing and with scarves over their faces stole
a case containing money after punching a security guard. They escaped in a black
car driven by an accomplice. No weapons are believed to have been used. Police
appealed for information from anyone who saw the men or the car. The Police
keen to trace the black Fiesta car used by the offenders and ask anyone who
sees one being driven in suspicious circumstances or abandoned in the area
(HSBC Bournemouth bank robbery CCTV released - BBC News, 2016).
26
Source: HSBC Bournemouth bank robbery CCTV released - BBC News, 2016
Figure 2.10: The Two Men Wore Black Clothing and Scarves over Their Faces
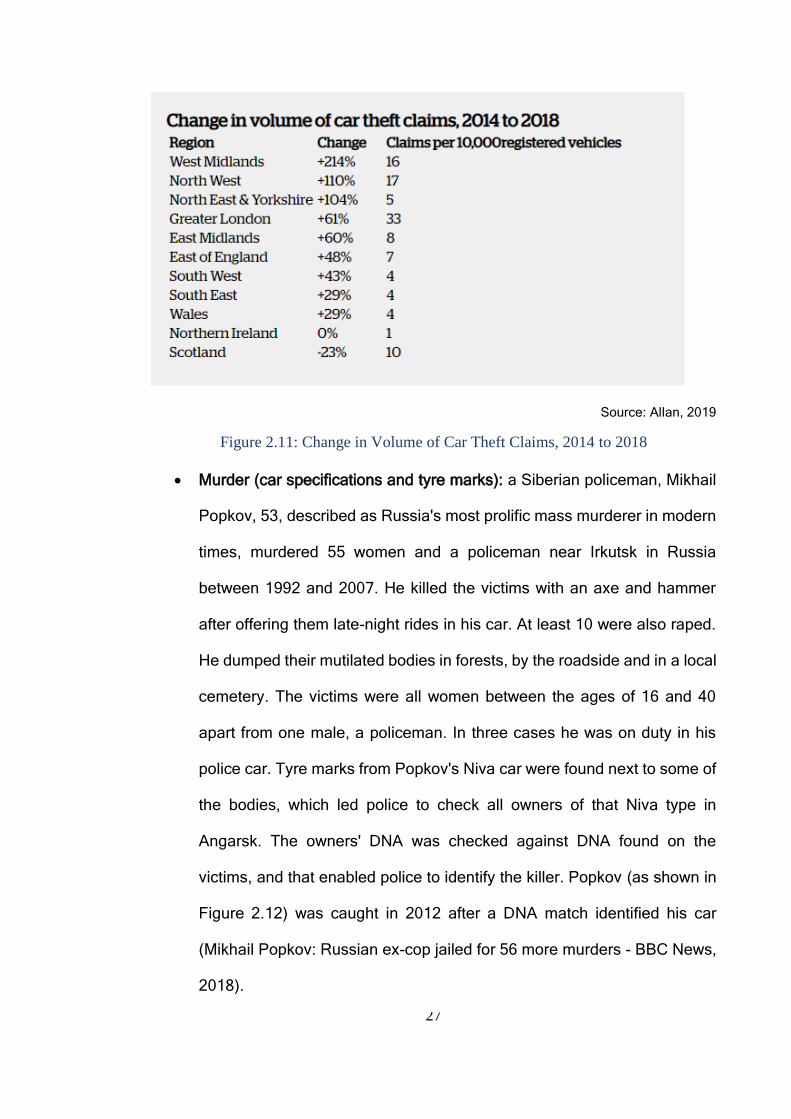
Car theft: in the last five years (2014-2018), Car thefts around UK have
increased by almost 50%, with a car being stolen every five minutes (as
shown in Figure 2.11). 112,174 vehicles were stolen in 2017/2018 alone,
that equivalent to 307 each day (Allan, 2019). According to the latest car
theft statistics (2018), 77% of vehicle theft investigations are closed by
police without identifying any suspects. In England and Wales, 106,000
offenses of theft of or unauthorised taking of a car were reported to police
forces until March 2018. This represented the highest annual total since
2009. More than 80,000 of those offenses, were finally classified as
"investigation complete - no suspect identified" (Evans, 2018).
27
Source: Allan, 2019
Figure 2.11: Change in Volume of Car Theft Claims, 2014 to 2018
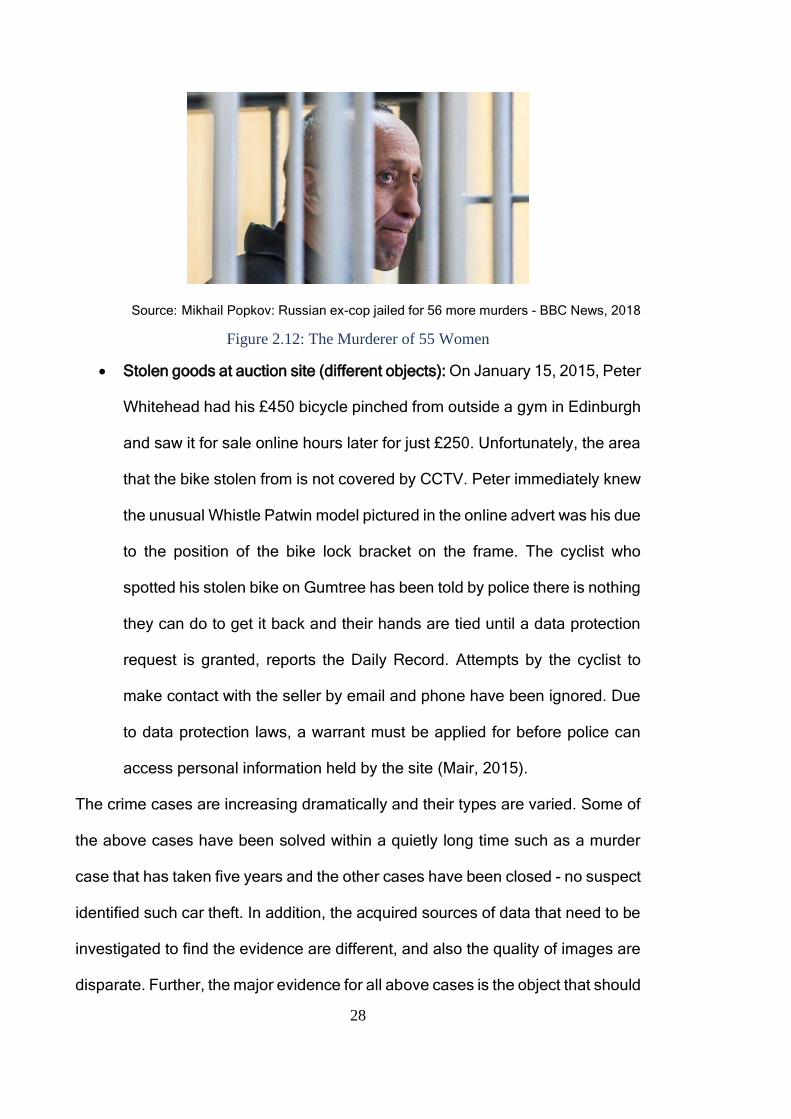
Murder (car specifications and tyre marks): a Siberian policeman, Mikhail
Popkov, 53, described as Russia's most prolific mass murderer in modern
times, murdered 55 women and a policeman near Irkutsk in Russia
between 1992 and 2007. He killed the victims with an axe and hammer
after offering them late-night rides in his car. At least 10 were also raped.
He dumped their mutilated bodies in forests, by the roadside and in a local
cemetery. The victims were all women between the ages of 16 and 40
apart from one male, a policeman. In three cases he was on duty in his
police car. Tyre marks from Popkov's Niva car were found next to some of
the bodies, which led police to check all owners of that Niva type in
Angarsk. The owners' DNA was checked against DNA found on the
victims, and that enabled police to identify the killer. Popkov (as shown in
Figure 2.12) was caught in 2012 after a DNA match identified his car
(Mikhail Popkov: Russian ex-cop jailed for 56 more murders - BBC News,
2018).
28
Source: Mikhail Popkov: Russian ex-cop jailed for 56 more murders - BBC News, 2018
Figure 2.12: The Murderer of 55 Women
Stolen goods at auction site (different objects): On January 15, 2015, Peter
Whitehead had his £450 bicycle pinched from outside a gym in Edinburgh
and saw it for sale online hours later for just £250. Unfortunately, the area
that the bike stolen from is not covered by CCTV. Peter immediately knew
the unusual Whistle Patwin model pictured in the online advert was his due
to the position of the bike lock bracket on the frame. The cyclist who
spotted his stolen bike on Gumtree has been told by police there is nothing
they can do to get it back and their hands are tied until a data protection
request is granted, reports the Daily Record. Attempts by the cyclist to
make contact with the seller by email and phone have been ignored. Due
to data protection laws, a warrant must be applied for before police can
access personal information held by the site (Mair, 2015).
The crime cases are increasing dramatically and their types are varied. Some of
the above cases have been solved within a quietly long time such as a murder
case that has taken five years and the other cases have been closed - no suspect
identified such car theft. In addition, the acquired sources of data that need to be
investigated to find the evidence are different, and also the quality of images are
disparate. Further, the major evidence for all above cases is the object that should
29
be extracted from images (and maybe has been traced it on the Google Map) and
differs from case to another- car cases that include child abduction and car theft
(car module, car color or car plate number), person identifications (length, weight,
clothes or carry something), tyre marks, other objects (bicycle, bag, hat), etc. In
most cases, the evidence is not a single item; it is a collection of evidence (e.g.
person, hat, green bag, etc.). The current forensic tools such as FTK and Encase
are insufficient in processing, analyse and extract the aforementioned evidence
types, therefore they cannot help to facilitate the investigation process and solve
the crimes (AccessData Group, 2018 and Guidance software, 2008). Accordingly,
there is a need to design an automatic system that can deal with these forensic
image analysis challenges in order to minimise the time required for extraction,
indexing, and analysis of the recovered images to guide investigators in finding
the requested evidence. This system will help reduce the investigative effort to
extract accurate evidence in a short time. And finally, the system should be
designed as a platform independent, easy to use and provide different
approaches to visualize the results.
2.7 The Current State of Art
The internet's fast development and the dropping cost of digital cameras and
image scanners have led to a significant increase in the number of digital images.
These criteria paved the way for effective storage and image retrieval systems.
In 1970, image retrieval was based on text to retrieve the images. Because the
manual naming and annotating of the images is laborious and time-consuming,
CBIR systems were developed in the early 1980s. CBIR is a technique that uses
visual contents to retrieve images from a largescale image database
automatically and computationally faster (Kavitha and Sudhamani, 2014; Singh,
30
Singh and Sinha, 2012). In general, however, the user of this technology is
usually interested in objects that appear in an image rather than in the image
itself. Therefore, sometimes the user is dissatisfied with the search result that
comes from traditional CBIR. To overcome this problem, Object-Based Image
Retrieval (OBIR) has been proposed as a new branch of CBIR, which can be used
to retrieve images that contain certain objects and meet the user’s specified
search requirements (Wen, Geng and Zhu, 2011). Moreover, there is a
substantial gap between low-level content features (colour, shape, etc.) and
semantic concepts (keyword, text, descriptor, etc.) used by humans to interpret
images. Furthermore, in CBIR, users must have an example or a query image at
hand, because the query must be an image. To overcome the semantic gap,
relevant feedback from users is obtained. However, this solution requires
considerable intervention from the user and is similar to traditional manual
annotation. As a result, the next-generation approach is to develop an automatic
system that is able to describe the content of the image semantically by a set of
semantic labels through assigned images (Zhang, Monirul Islam and Lu, 2013).
This system is called an Automatic Image Annotation (AIA) or linguistic indexing,
which is able to assign words to every new test image after training the model for
similarities between visual features and tags of images. Thus, the image retrieval
process can be performed using input texts provided by the user (Hamid Amiri
and Jamzad, 2015). AIA is thus considered a highly valuable tool for image
search, retrieval, and archival systems.
The performance of the retrieval results is measured by Precision and Recall.
According to a definition by Hannan et al., 2016, ‘Precision is defined as the
proportion of images among all those retrieved that are truly relevant to a given
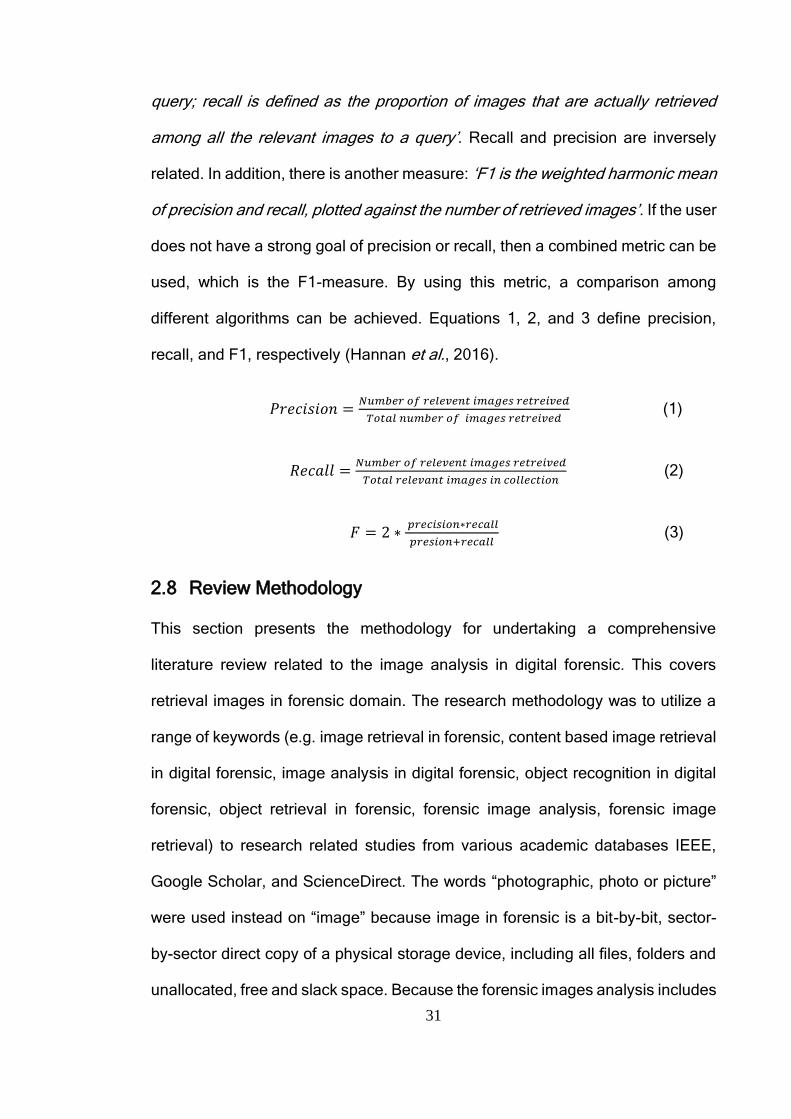
31
query; recall is defined as the proportion of images that are actually retrieved
among all the relevant images to a query’. Recall and precision are inversely
related. In addition, there is another measure: ‘F1 is the weighted harmonic mean
of precision and recall, plotted against the number of retrieved images’. If the user
does not have a strong goal of precision or recall, then a combined metric can be
used, which is the F1-measure. By using this metric, a comparison among
different algorithms can be achieved. Equations 1, 2, and 3 define precision,
recall, and F1, respectively (Hannan et al., 2016).
𝑃𝑟𝑒𝑐𝑖𝑠𝑖𝑜𝑛 =𝑁𝑢𝑚𝑏𝑒𝑟 𝑜𝑓 𝑟𝑒𝑙𝑒𝑣𝑒𝑛𝑡 𝑖𝑚𝑎𝑔𝑒𝑠 𝑟𝑒𝑡𝑟𝑒𝑖𝑣𝑒𝑑
𝑇𝑜𝑡𝑎𝑙 𝑛𝑢𝑚𝑏𝑒𝑟 𝑜𝑓 𝑖𝑚𝑎𝑔𝑒𝑠 𝑟𝑒𝑡𝑟𝑒𝑖𝑣𝑒𝑑 (1)
𝑅𝑒𝑐𝑎𝑙𝑙 =𝑁𝑢𝑚𝑏𝑒𝑟 𝑜𝑓 𝑟𝑒𝑙𝑒𝑣𝑒𝑛𝑡 𝑖𝑚𝑎𝑔𝑒𝑠 𝑟𝑒𝑡𝑟𝑒𝑖𝑣𝑒𝑑
𝑇𝑜𝑡𝑎𝑙 𝑟𝑒𝑙𝑒𝑣𝑎𝑛𝑡 𝑖𝑚𝑎𝑔𝑒𝑠 𝑖𝑛 𝑐𝑜𝑙𝑙𝑒𝑐𝑡𝑖𝑜𝑛 (2)
𝐹 = 2 ∗ 𝑝𝑟𝑒𝑐𝑖𝑠𝑖𝑜𝑛∗𝑟𝑒𝑐𝑎𝑙𝑙
𝑝𝑟𝑒𝑠𝑖𝑜𝑛+𝑟𝑒𝑐𝑎𝑙𝑙 (3)
2.8 Review Methodology
This section presents the methodology for undertaking a comprehensive
literature review related to the image analysis in digital forensic. This covers
retrieval images in forensic domain. The research methodology was to utilize a
range of keywords (e.g. image retrieval in forensic, content based image retrieval
in digital forensic, image analysis in digital forensic, object recognition in digital
forensic, object retrieval in forensic, forensic image analysis, forensic image
retrieval) to research related studies from various academic databases IEEE,
Google Scholar, and ScienceDirect. The words “photographic, photo or picture”
were used instead on “image” because image in forensic is a bit-by-bit, sector-
by-sector direct copy of a physical storage device, including all files, folders and
unallocated, free and slack space. Because the forensic images analysis includes
32
many subjects, the papers took about extracting meaningful information from
images are selected and other subjects such as determining the origin and
authenticity of an image, JPEG compression, image steganography, etc. have
been ignored.
In addition, this research is undertaken in an effort to better understand the
different types of object-based image retrieval and automatic image annotation
methods that can improve the efficiency and effectiveness of forensic image
analysis and can facilitate forensic investigation work for the purpose of solving
forensic cases (from an academic perspective).
Filters were applied to the literature search results in order to identify the most
relevant studies:
1. Publications less than two pages long (including posters, presentations,
abstracts, or short theoretical papers) were excluded.
2. Non-peer-reviewed publications were eliminated.
3. The language of this literature review is English; therefore, any reference
written in a language other than English was considered not relevant.
4. Site number, impact factor, and publication year of the selected papers
were arranged in descending order.
Table 2.1 illustrates the number of papers returned and the final number of studies
selected for each database after application of the above expressions. The
papers returned from Google Scholar are not duplicated of the papers already
identified from the other three additional sources, which represent publisher
specific sources (IEEE Xplore, ScienceDirect and ACM Digital Library). The final
papers were filtered based on their content because not all returned papers
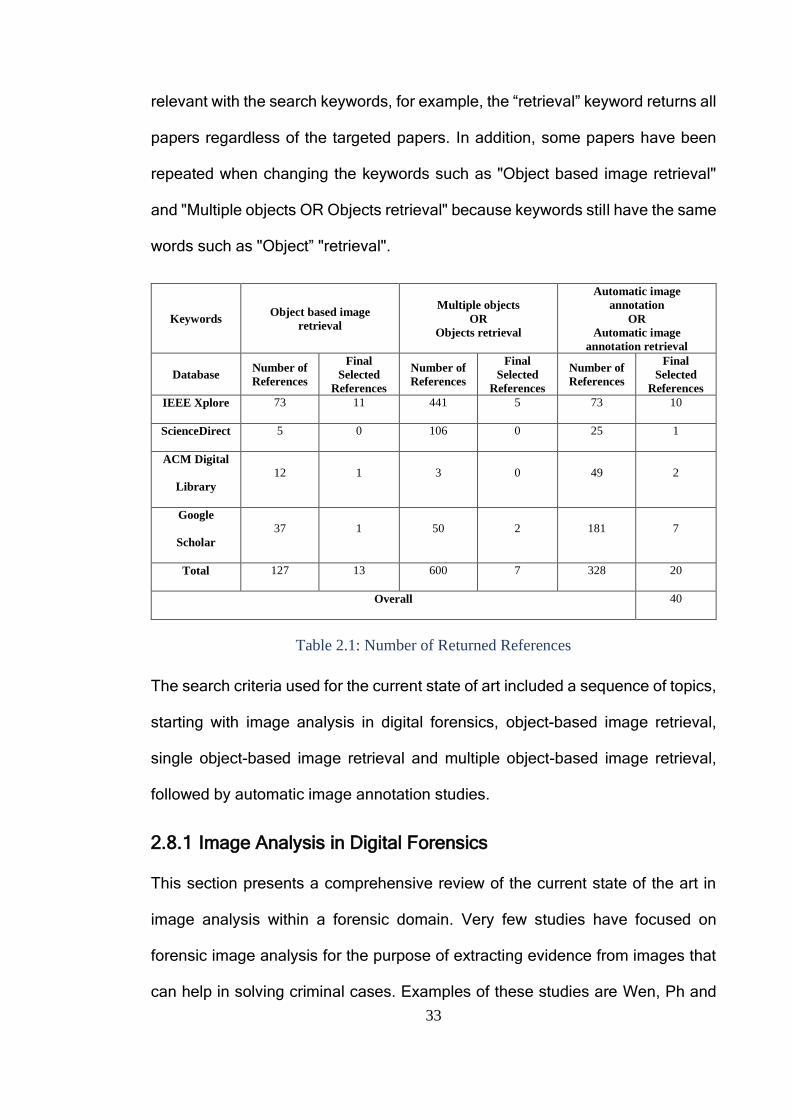
33
relevant with the search keywords, for example, the “retrieval” keyword returns all
papers regardless of the targeted papers. In addition, some papers have been
repeated when changing the keywords such as "Object based image retrieval"
and "Multiple objects OR Objects retrieval" because keywords still have the same
words such as "Object” "retrieval".
Keywords Object based image
retrieval
Multiple objects
OR
Objects retrieval
Automatic image
annotation
OR
Automatic image
annotation retrieval
Database Number of
References
Final
Selected
References
Number of
References
Final
Selected
References
Number of
References
Final
Selected
References
IEEE Xplore 73 11 441 5 73 10
ScienceDirect 5 0 106 0 25 1
ACM Digital
Library
12 1 3 0 49 2
Scholar
37 1 50 2 181 7
Total 127 13 600 7 328 20
Overall 40
Table 2.1: Number of Returned References
The search criteria used for the current state of art included a sequence of topics,
starting with image analysis in digital forensics, object-based image retrieval,
single object-based image retrieval and multiple object-based image retrieval,
followed by automatic image annotation studies.
2.8.1 Image Analysis in Digital Forensics
This section presents a comprehensive review of the current state of the art in
image analysis within a forensic domain. Very few studies have focused on
forensic image analysis for the purpose of extracting evidence from images that
can help in solving criminal cases. Examples of these studies are Wen, Ph and
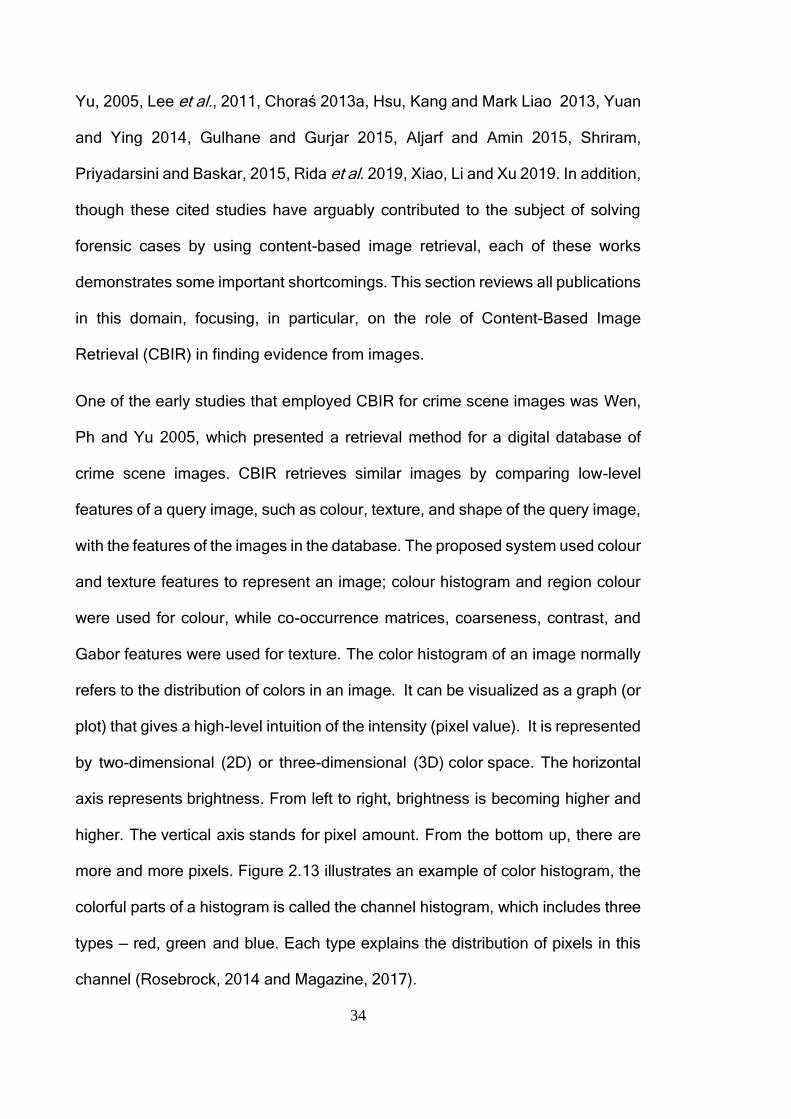
34
Yu, 2005, Lee et al., 2011, Choraś 2013a, Hsu, Kang and Mark Liao 2013, Yuan
and Ying 2014, Gulhane and Gurjar 2015, Aljarf and Amin 2015, Shriram,
Priyadarsini and Baskar, 2015, Rida et al. 2019, Xiao, Li and Xu 2019. In addition,
though these cited studies have arguably contributed to the subject of solving
forensic cases by using content-based image retrieval, each of these works
demonstrates some important shortcomings. This section reviews all publications
in this domain, focusing, in particular, on the role of Content-Based Image
Retrieval (CBIR) in finding evidence from images.
One of the early studies that employed CBIR for crime scene images was Wen,
Ph and Yu 2005, which presented a retrieval method for a digital database of
crime scene images. CBIR retrieves similar images by comparing low-level
features of a query image, such as colour, texture, and shape of the query image,
with the features of the images in the database. The proposed system used colour
and texture features to represent an image; colour histogram and region colour
were used for colour, while co-occurrence matrices, coarseness, contrast, and
Gabor features were used for texture. The color histogram of an image normally
refers to the distribution of colors in an image. It can be visualized as a graph (or
plot) that gives a high-level intuition of the intensity (pixel value). It is represented
by two-dimensional (2D) or three-dimensional (3D) color space. The horizontal
axis represents brightness. From left to right, brightness is becoming higher and
higher. The vertical axis stands for pixel amount. From the bottom up, there are
more and more pixels. Figure 2.13 illustrates an example of color histogram, the
colorful parts of a histogram is called the channel histogram, which includes three
types — red, green and blue. Each type explains the distribution of pixels in this
channel (Rosebrock, 2014 and Magazine, 2017).
35
Source: Sardana, 2017
Figure 2.13: An Example of Image Color Histogram
Gabor Features: Gabor features, which is extracted by using Gabor filter, have
been widely used in image analysis and processing to extract local pieces of
information which is combined to recognise an object or a region of interest.
(Kamarainen, 2012).
Grey Level Co-occurrence Matrices (GLCM): it is also frequently called the spatial
gray level dependence matrix (SGLDM). It represents one of the earliest
statistical methods that extracts texture feature from grayscale image. Texture
feature represents an important characteristics used in identifying regions of
interest in an image (Gadelmawla, 2004 and Sebastian, Unnikrishnan and
Balakrishnan, 2012).
In addition, it used a Roman numeral recognition system to find license plate
numbers in crime scene images. The purpose of the paper was to utilise colour
and texture features in order to retrieve crime scene photos from a digital image
database and achieve acceptable results, and to demonstrate an ability to
36
manage a forensic image database. However, experimental results were not
presented in detail to highlight the efficiency and accuracy of their proposed
approach.
Lee et al. (2011) employed CBIR to deal with a particular forensic image database
containing a large collection of tattoo images (64,000 tattoo images, provided by
the Michigan State Police). Their proposed system applied Scale-Invariant
Feature Transform (SIFT) on a query image to extract a Tattoo-ID, then used a
matching algorithm to retrieve images from the large database that were similar
to a query image. The proposed system achieved 90.5% retrieval accuracy;
however, the retrieval performance was affected by low-quality query images,
such as images with low contrast, uneven illumination, small tattoo size, or heavy
body hair covering the tattoo. Therefore, robust similarity measures (symmetric
matching and keypoint weighted matching) and metadata associated with the
tattoo images were used to overcome the low quality of such images. Despite the
high retrieval accuracy, the proposed systems were dependent on manual
annotations of the image, which is a time consuming task.
Another work on forensic image analysis (Choraś, 2013) focused on forensic
image retrieval for firearms. This article introduced a new method for comparison
between marks of firearm bullets and featured vectors extraction to represent
striation characteristics. Initially, a query image was given to the system. Then, a
Grey Level Co-Occurrence Matrix (GLCM) was applied to the query image. After
that, contrast, dissimilarity, homogeneity, angular second moment, energy, and
entropy were calculated to extract texture features from the GLCM. The system
was tested by using five classes of images: fired bullets, firing pins, extractor
marks, ejector marks, and cartridges, and each class had 10 images. The best
37
five images were reviewed. The author claimed that all images were retrieved
correctly and that the proposed system was thus convenient for forensic image
retrieval. The main limitation of the experiment, however, is that a very low
number of images were used. Also, the results of this study should be compared
with the outcomes of other studies to further validate the efficiency of the
proposed method.
A study by Hsu, Kang and Mark Liao (2013) proposed an efficient cross-camera
vehicle tracking technique using affine invariant object matching. Cross-camera
vehicle tracking was formulated as an object matching problem under various
viewing angles. The proposed system included four steps. Firstly, they used the
Visual Background extractor (ViBe) background subtraction algorithm in order to
detect each vehicle object. Secondly, for each detected vehicle in a camera
network, the invariant image feature was extracted by using affine and Scale-
Invariant Feature Transform (ASIFT). Thirdly, the Bag-of-Words (BoW) model
was employed to quantize each descriptor into a visual word based on an offline-
trained vocabulary. Thus, in this study, each vehicle object in the database was
stored with its own set of visual words. Finally, the spatially invariant property of
ASIFT and the min-hash technique were employed to enhance the accuracy of
ASIFT feature matching between images from various viewpoints. The authors
used three different videos (V0, V1, and V2) from three static cameras placed in
different locations to create a database containing 203 vehicle object images in
order to evaluate the system’s performance. The hierarchical K-means algorithm
was applied to train a vocabulary of 50,000 visual words based on a pre-collected
training set of 1,000 vehicle objects, where each training object had from 10,000
to 20,000 descriptors. The results showed that the proposed system
38
outperformed the SIFT and ASIFT methods in term of precision, with results of
85.62%, 30.77%, and 46.15% for V0 and 96.15%, 53.85%, and 69.23% for V1,
respectively. Their paper was the first to find that ASIFT is not strong enough for
affine transforms of vehicle objects, especially for those involving considerable
viewpoint changes. In addition, this paper discovered that, after the affine
transform process, although most of the feature points in a vehicle object will
survive, their ASIFT descriptors will be distorted, which causes deficient matching
performance. Furthermore, the authors achieved improvements in matching
accuracy by presenting a novel matching criterion that depended on the spatially
invariant property of ASIFT. One of the major challenges of image matching is
the difficulty in retrieving images that contain an object with a certain viewpoint
based on a query image of the same object from a different view. In addition, the
authors noted that better matching performance could be achieved by using
metadata.
A comparison between the performance of different image features and different
similarity measurements in a CBIR system using forensic images was carried out
by Yuan and Ying (2014). Colour and texture features were extracted by using a
colour histogram in HSV colour space (HSV stands for Hue, Saturation, and
Value) and 2-D wavelet decomposition, respectively. Colour, texture, and colour-
texture features were used as image descriptors. Then, similarities between a
query image and images in a database were found using Euclidean distance and
city block distance as similarity measures. Experimentally, two databases were
utilised. The first was generated from actual cases and included 400 forensic
images, which were divided into eight categories: cars, roads, houses, doors,
fingerprints, bloodstains, show marks, and tools, as shown in Figure 2.14. The
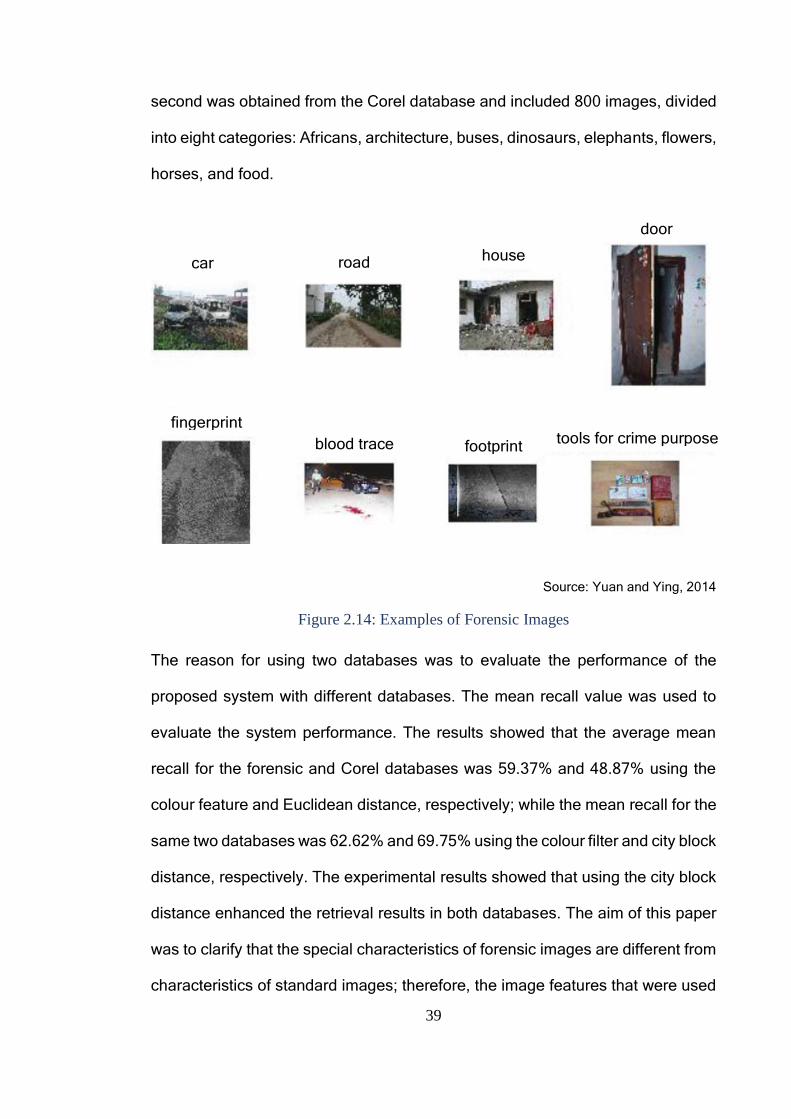
39
second was obtained from the Corel database and included 800 images, divided
into eight categories: Africans, architecture, buses, dinosaurs, elephants, flowers,
horses, and food.
Source: Yuan and Ying, 2014
Figure 2.14: Examples of Forensic Images
The reason for using two databases was to evaluate the performance of the
proposed system with different databases. The mean recall value was used to
evaluate the system performance. The results showed that the average mean
recall for the forensic and Corel databases was 59.37% and 48.87% using the
colour feature and Euclidean distance, respectively; while the mean recall for the
same two databases was 62.62% and 69.75% using the colour filter and city block
distance, respectively. The experimental results showed that using the city block
distance enhanced the retrieval results in both databases. The aim of this paper
was to clarify that the special characteristics of forensic images are different from
characteristics of standard images; therefore, the image features that were used
car road house
door
fingerprint
blood trace footprint tools for crime purpose
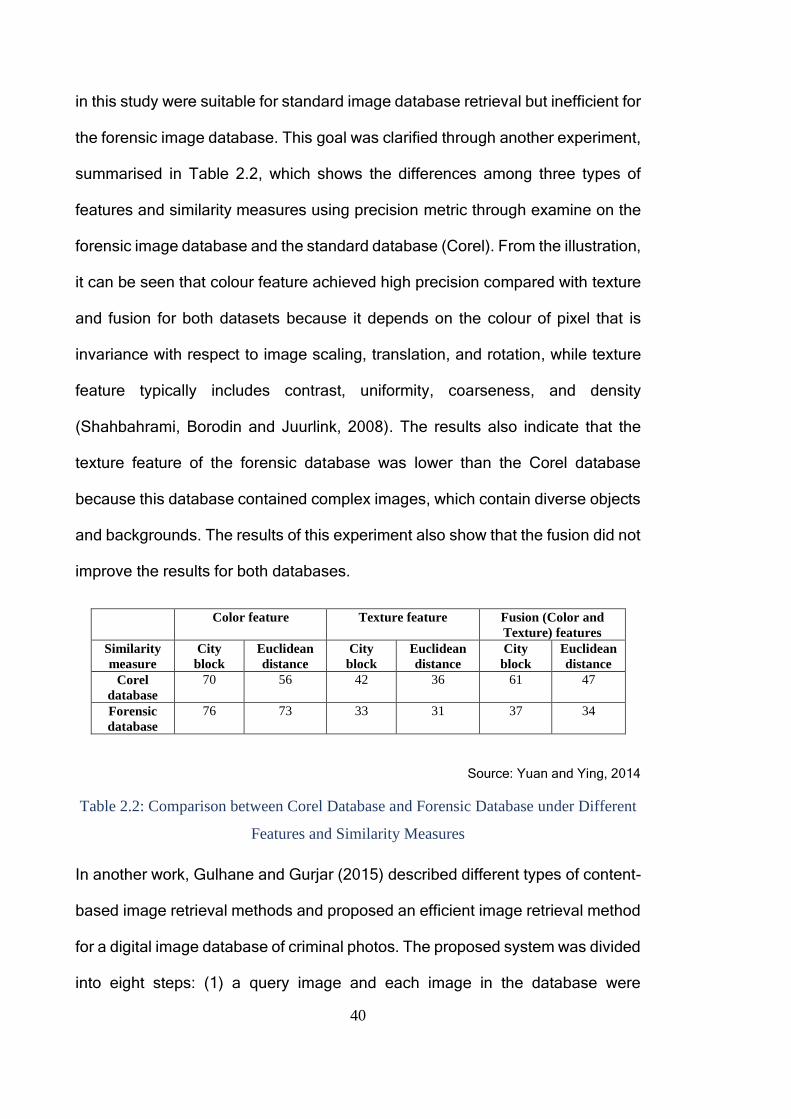
40
in this study were suitable for standard image database retrieval but inefficient for
the forensic image database. This goal was clarified through another experiment,
summarised in Table 2.2, which shows the differences among three types of
features and similarity measures using precision metric through examine on the
forensic image database and the standard database (Corel). From the illustration,
it can be seen that colour feature achieved high precision compared with texture
and fusion for both datasets because it depends on the colour of pixel that is
invariance with respect to image scaling, translation, and rotation, while texture
feature typically includes contrast, uniformity, coarseness, and density
(Shahbahrami, Borodin and Juurlink, 2008). The results also indicate that the
texture feature of the forensic database was lower than the Corel database
because this database contained complex images, which contain diverse objects
and backgrounds. The results of this experiment also show that the fusion did not
improve the results for both databases.
Color feature Texture feature Fusion (Color and
Texture) features
Similarity
measure
City
block
Euclidean
distance
City
block
Euclidean
distance
City
block
Euclidean
distance
Corel
database
70 56 42 36 61 47
Forensic
database
76 73 33 31 37 34
Source: Yuan and Ying, 2014
Table 2.2: Comparison between Corel Database and Forensic Database under Different
Features and Similarity Measures
In another work, Gulhane and Gurjar (2015) described different types of content-
based image retrieval methods and proposed an efficient image retrieval method
for a digital image database of criminal photos. The proposed system was divided
into eight steps: (1) a query image and each image in the database were
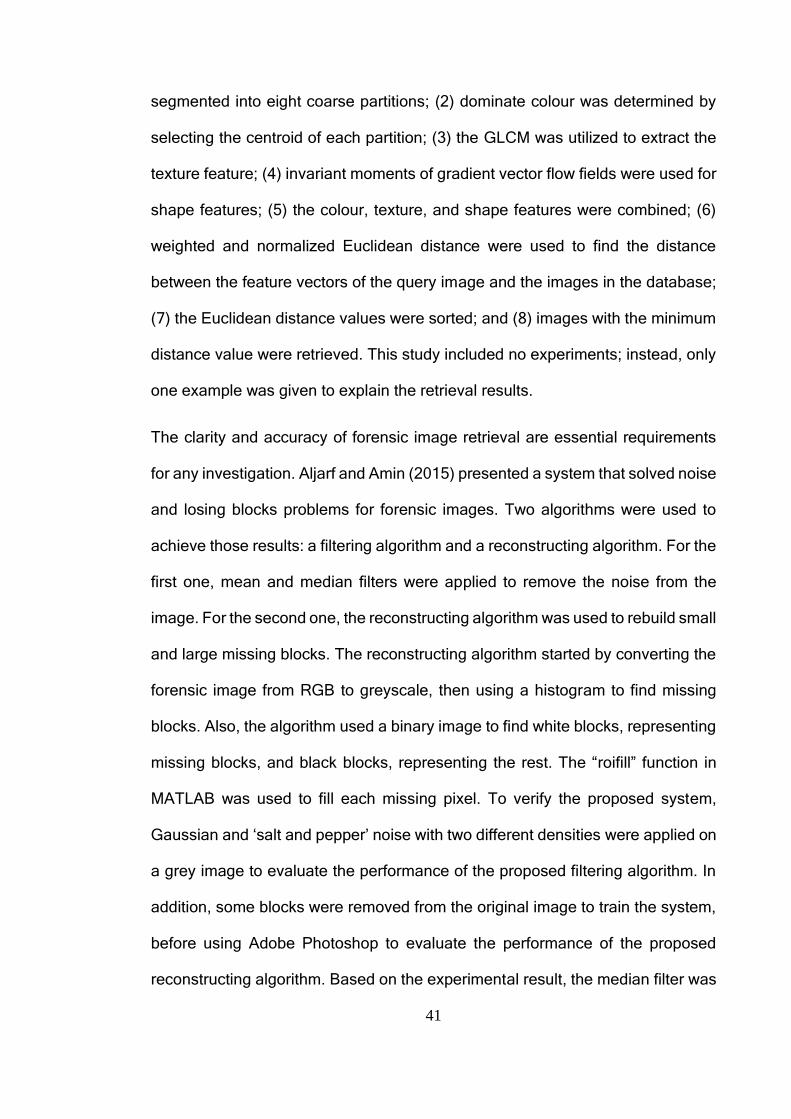
41
segmented into eight coarse partitions; (2) dominate colour was determined by
selecting the centroid of each partition; (3) the GLCM was utilized to extract the
texture feature; (4) invariant moments of gradient vector flow fields were used for
shape features; (5) the colour, texture, and shape features were combined; (6)
weighted and normalized Euclidean distance were used to find the distance
between the feature vectors of the query image and the images in the database;
(7) the Euclidean distance values were sorted; and (8) images with the minimum
distance value were retrieved. This study included no experiments; instead, only
one example was given to explain the retrieval results.
The clarity and accuracy of forensic image retrieval are essential requirements
for any investigation. Aljarf and Amin (2015) presented a system that solved noise
and losing blocks problems for forensic images. Two algorithms were used to
achieve those results: a filtering algorithm and a reconstructing algorithm. For the
first one, mean and median filters were applied to remove the noise from the
image. For the second one, the reconstructing algorithm was used to rebuild small
and large missing blocks. The reconstructing algorithm started by converting the
forensic image from RGB to greyscale, then using a histogram to find missing
blocks. Also, the algorithm used a binary image to find white blocks, representing
missing blocks, and black blocks, representing the rest. The “roifill” function in
MATLAB was used to fill each missing pixel. To verify the proposed system,
Gaussian and ‘salt and pepper’ noise with two different densities were applied on
a grey image to evaluate the performance of the proposed filtering algorithm. In
addition, some blocks were removed from the original image to train the system,
before using Adobe Photoshop to evaluate the performance of the proposed
reconstructing algorithm. Based on the experimental result, the median filter was
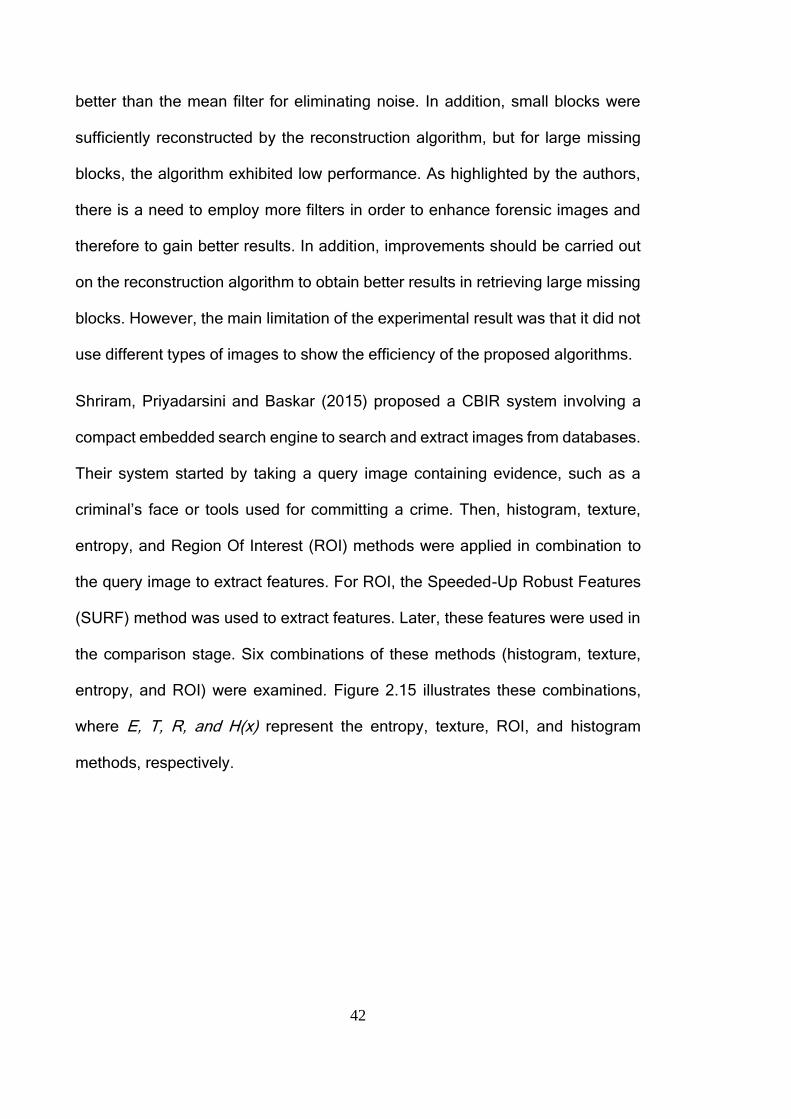
42
better than the mean filter for eliminating noise. In addition, small blocks were
sufficiently reconstructed by the reconstruction algorithm, but for large missing
blocks, the algorithm exhibited low performance. As highlighted by the authors,
there is a need to employ more filters in order to enhance forensic images and
therefore to gain better results. In addition, improvements should be carried out
on the reconstruction algorithm to obtain better results in retrieving large missing
blocks. However, the main limitation of the experimental result was that it did not
use different types of images to show the efficiency of the proposed algorithms.
Shriram, Priyadarsini and Baskar (2015) proposed a CBIR system involving a
compact embedded search engine to search and extract images from databases.
Their system started by taking a query image containing evidence, such as a
criminal’s face or tools used for committing a crime. Then, histogram, texture,
entropy, and Region Of Interest (ROI) methods were applied in combination to
the query image to extract features. For ROI, the Speeded-Up Robust Features
(SURF) method was used to extract features. Later, these features were used in
the comparison stage. Six combinations of these methods (histogram, texture,
entropy, and ROI) were examined. Figure 2.15 illustrates these combinations,
where E, T, R, and H(x) represent the entropy, texture, ROI, and histogram
methods, respectively.
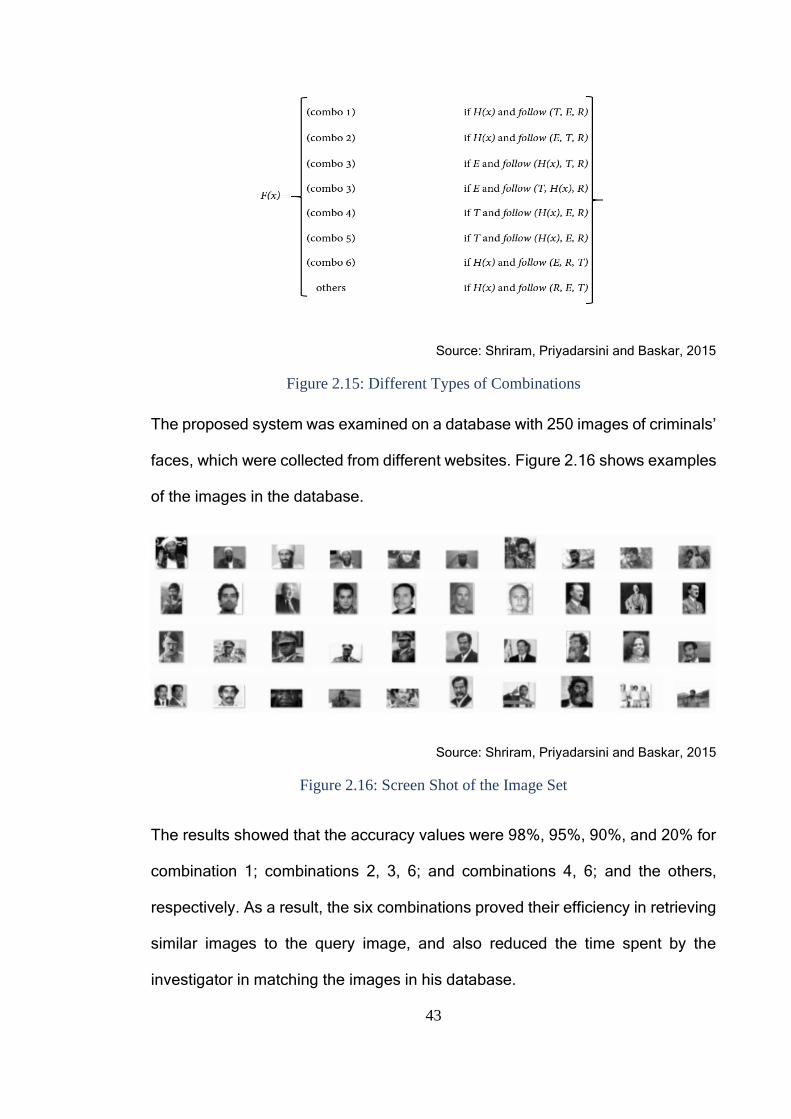
43
Source: Shriram, Priyadarsini and Baskar, 2015
Figure 2.15: Different Types of Combinations
The proposed system was examined on a database with 250 images of criminals’
faces, which were collected from different websites. Figure 2.16 shows examples
of the images in the database.
Source: Shriram, Priyadarsini and Baskar, 2015
Figure 2.16: Screen Shot of the Image Set
The results showed that the accuracy values were 98%, 95%, 90%, and 20% for
combination 1; combinations 2, 3, 6; and combinations 4, 6; and the others,
respectively. As a result, the six combinations proved their efficiency in retrieving
similar images to the query image, and also reduced the time spent by the
investigator in matching the images in his database.
44
Rida et al. (2019) presented a brief survey of the state-of-the-art performance of
forensic shoe-print identification. The survey illustrated the challenges that still
face forensic shoe-print identification and have influenced performance. The
noise, occlusions, rotation and various scale distortions are represented as one
of the challenges that cause large intra-class variations. To overcome this
challenge, a large variety of handcrafted features was used. However, these
features have shown good performance in limited and controlled scenarios and
failed when they are dealing with large intra-class variations. Another challenge
is the limited size of a database that has mainly one example per each shoe class
used for evaluation and the absence of public benchmarks with pre-defined. This
led to the usage of non-realistic and synthetically generated images for
performance evaluation by most published techniques in the literature. In
addition, there are no standardized evaluation protocols in order to compare
performance.
According to Xiao, Li and Xu (2019), it important to detect and recognize persons,
objects, cars, from a good quality image and CCTV footage to solve the cases.
Through identifying the object in the crime scenes such as knife or firearm, it could
help to track the object holder (suspect) that might has link with the case. The
relation between object and subjects, environment, scenarios, and timeline is
useful in the case investigation. The Yolov3 model was applied to detect the
suspicious objects in crime scene and it was trained to identify knife, gun, and
other firearms’ in video. The model failed to identify the same object when the
camera was turned -90 degrees as illustrated in Figure 2.17. In addition, the
model also failed to identify the main suspect when it was used to detect video
with different quality as shown in Figure 2.18.
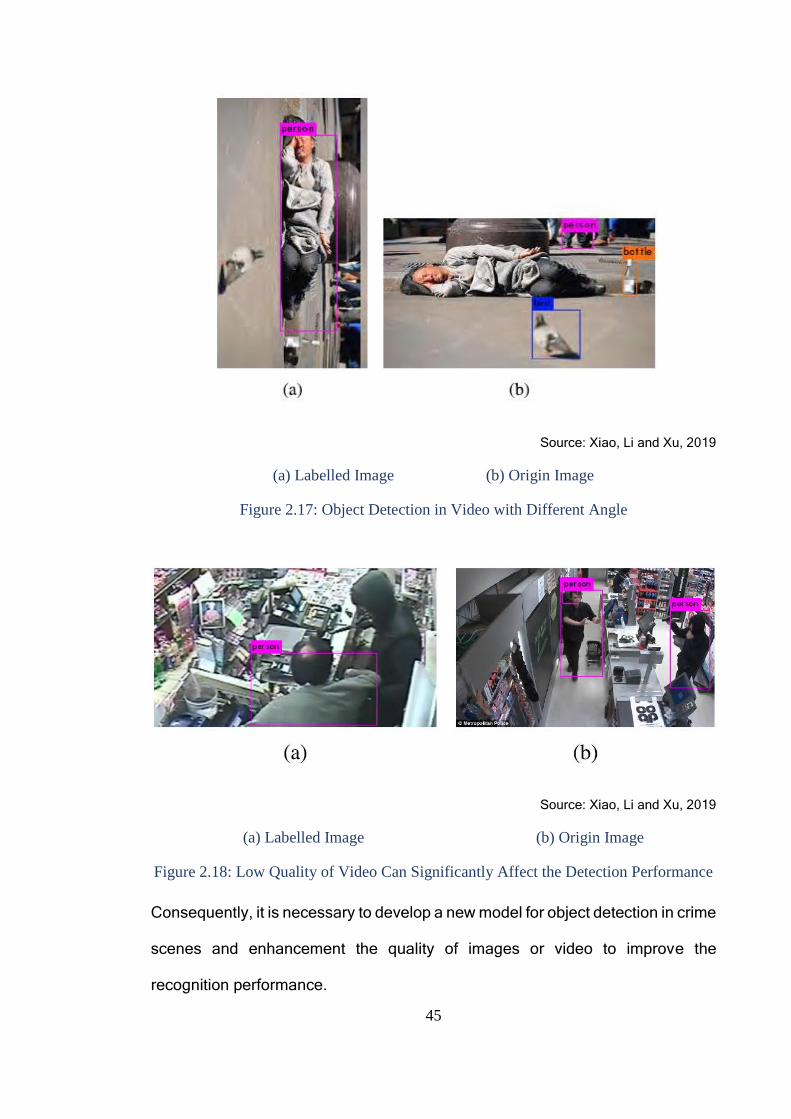
45
Source: Xiao, Li and Xu, 2019
(a) Labelled Image (b) Origin Image
Figure 2.17: Object Detection in Video with Different Angle
Source: Xiao, Li and Xu, 2019
(a) Labelled Image (b) Origin Image
Figure 2.18: Low Quality of Video Can Significantly Affect the Detection Performance
Consequently, it is necessary to develop a new model for object detection in crime
scenes and enhancement the quality of images or video to improve the
recognition performance.
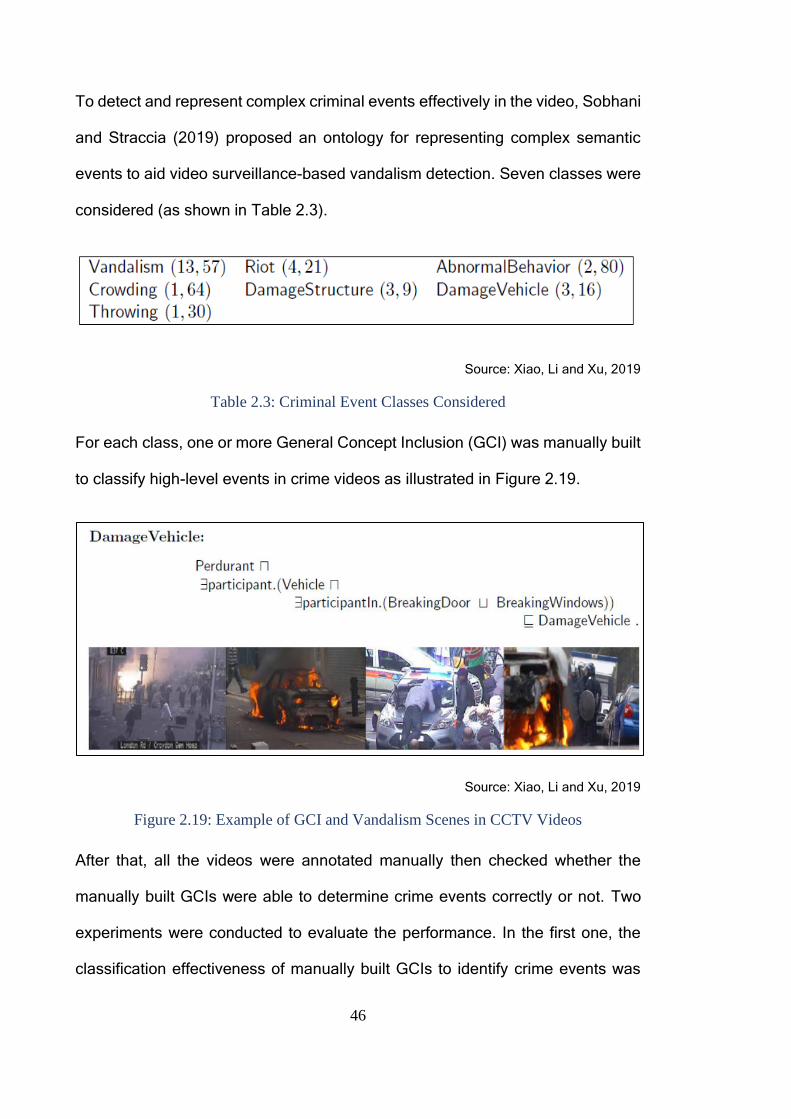
46
To detect and represent complex criminal events effectively in the video, Sobhani
and Straccia (2019) proposed an ontology for representing complex semantic
events to aid video surveillance-based vandalism detection. Seven classes were
considered (as shown in Table 2.3).
Source: Xiao, Li and Xu, 2019
Table 2.3: Criminal Event Classes Considered
For each class, one or more General Concept Inclusion (GCI) was manually built
to classify high-level events in crime videos as illustrated in Figure 2.19.
Source: Xiao, Li and Xu, 2019
Figure 2.19: Example of GCI and Vandalism Scenes in CCTV Videos
After that, all the videos were annotated manually then checked whether the
manually built GCIs were able to determine crime events correctly or not. Two
experiments were conducted to evaluate the performance. In the first one, the
classification effectiveness of manually built GCIs to identify crime events was
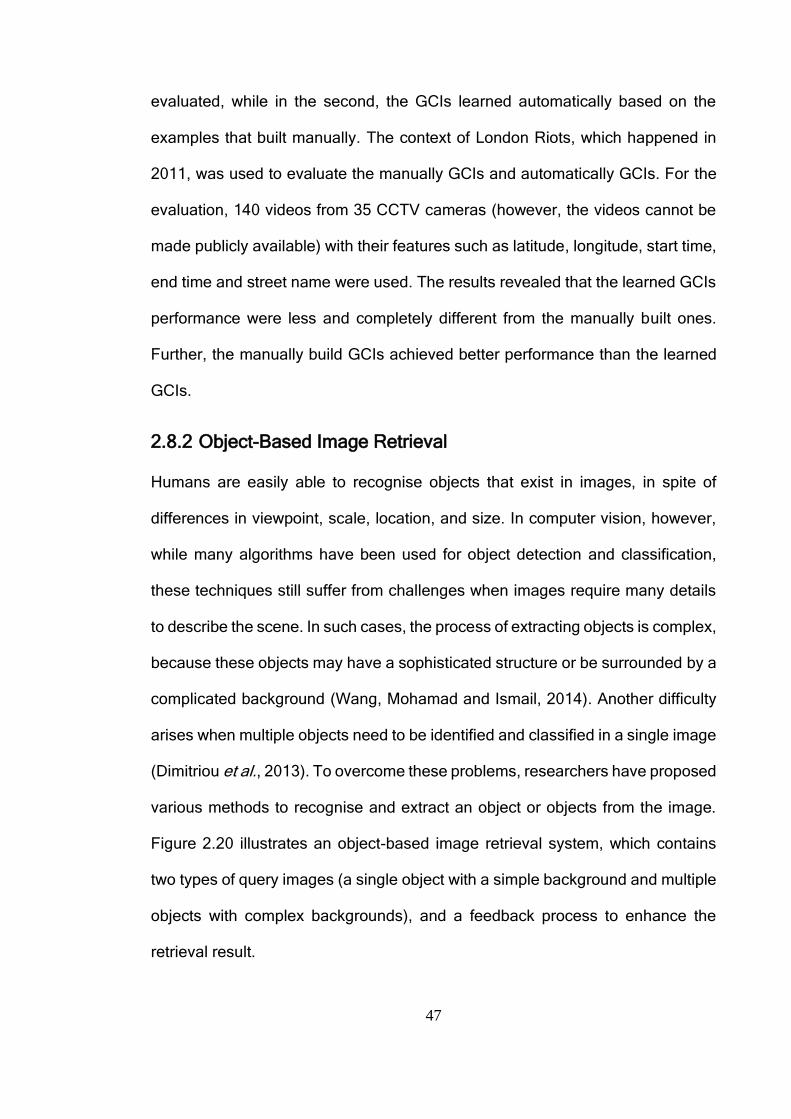
47
evaluated, while in the second, the GCIs learned automatically based on the
examples that built manually. The context of London Riots, which happened in
2011, was used to evaluate the manually GCIs and automatically GCIs. For the
evaluation, 140 videos from 35 CCTV cameras (however, the videos cannot be
made publicly available) with their features such as latitude, longitude, start time,
end time and street name were used. The results revealed that the learned GCIs
performance were less and completely different from the manually built ones.
Further, the manually build GCIs achieved better performance than the learned
GCIs.
2.8.2 Object-Based Image Retrieval
Humans are easily able to recognise objects that exist in images, in spite of
differences in viewpoint, scale, location, and size. In computer vision, however,
while many algorithms have been used for object detection and classification,
these techniques still suffer from challenges when images require many details
to describe the scene. In such cases, the process of extracting objects is complex,
because these objects may have a sophisticated structure or be surrounded by a
complicated background (Wang, Mohamad and Ismail, 2014). Another difficulty
arises when multiple objects need to be identified and classified in a single image
(Dimitriou et al., 2013). To overcome these problems, researchers have proposed
various methods to recognise and extract an object or objects from the image.
Figure 2.20 illustrates an object-based image retrieval system, which contains
two types of query images (a single object with a simple background and multiple
objects with complex backgrounds), and a feedback process to enhance the
retrieval result.
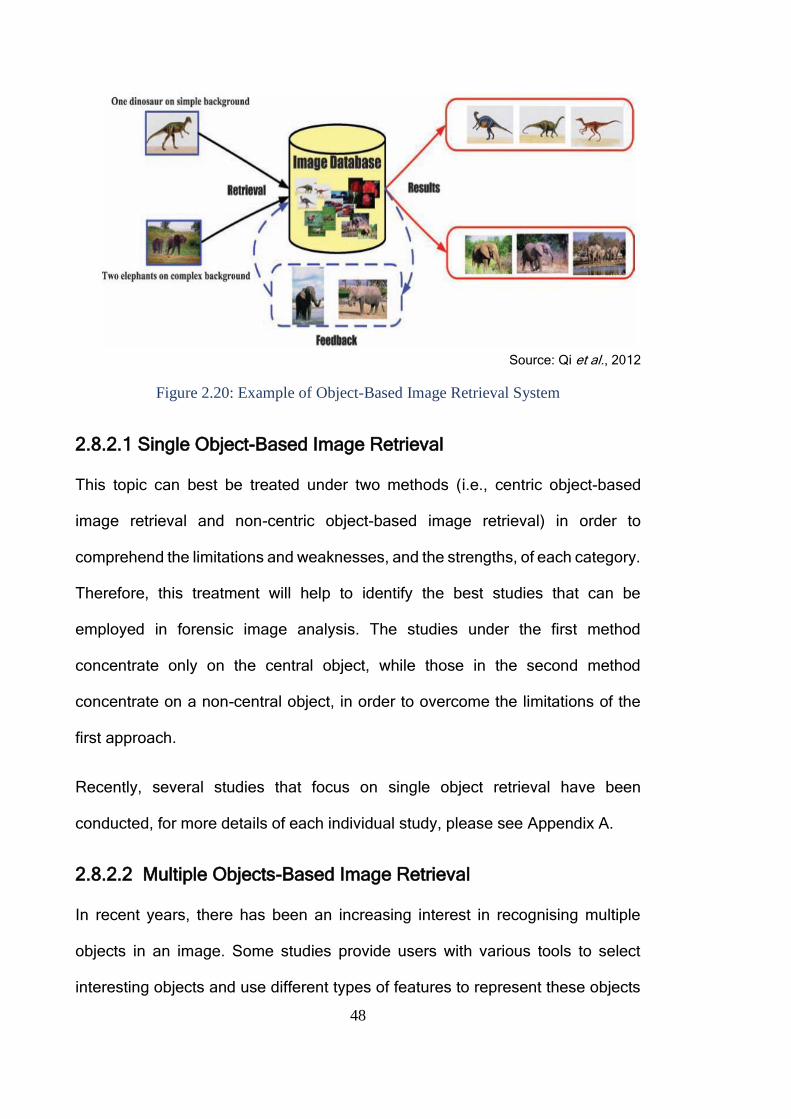
48
Source: Qi et al., 2012
Figure 2.20: Example of Object-Based Image Retrieval System
2.8.2.1 Single Object-Based Image Retrieval
This topic can best be treated under two methods (i.e., centric object-based
image retrieval and non-centric object-based image retrieval) in order to
comprehend the limitations and weaknesses, and the strengths, of each category.
Therefore, this treatment will help to identify the best studies that can be
employed in forensic image analysis. The studies under the first method
concentrate only on the central object, while those in the second method
concentrate on a non-central object, in order to overcome the limitations of the
first approach.
Recently, several studies that focus on single object retrieval have been
conducted, for more details of each individual study, please see Appendix A.
2.8.2.2 Multiple Objects-Based Image Retrieval
In recent years, there has been an increasing interest in recognising multiple
objects in an image. Some studies provide users with various tools to select
interesting objects and use different types of features to represent these objects
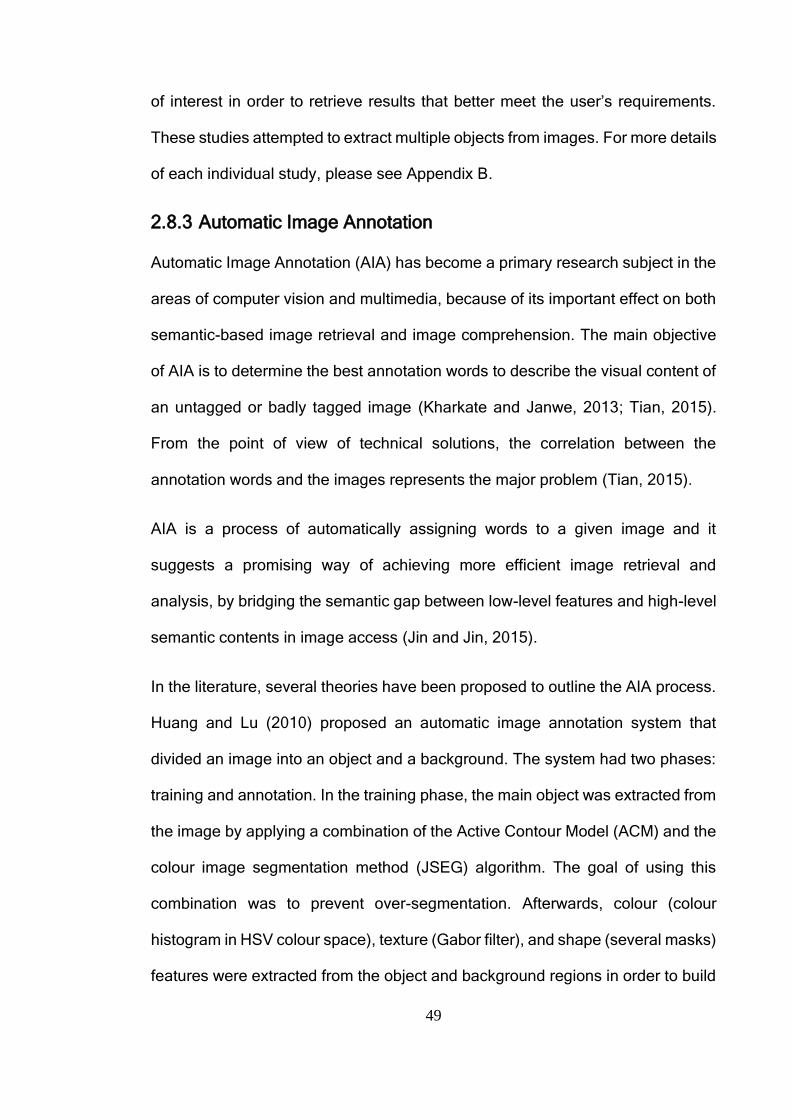
49
of interest in order to retrieve results that better meet the user’s requirements.
These studies attempted to extract multiple objects from images. For more details
of each individual study, please see Appendix B.
2.8.3 Automatic Image Annotation
Automatic Image Annotation (AIA) has become a primary research subject in the
areas of computer vision and multimedia, because of its important effect on both
semantic-based image retrieval and image comprehension. The main objective
of AIA is to determine the best annotation words to describe the visual content of
an untagged or badly tagged image (Kharkate and Janwe, 2013; Tian, 2015).
From the point of view of technical solutions, the correlation between the
annotation words and the images represents the major problem (Tian, 2015).
AIA is a process of automatically assigning words to a given image and it
suggests a promising way of achieving more efficient image retrieval and
analysis, by bridging the semantic gap between low-level features and high-level
semantic contents in image access (Jin and Jin, 2015).
In the literature, several theories have been proposed to outline the AIA process.
Huang and Lu (2010) proposed an automatic image annotation system that
divided an image into an object and a background. The system had two phases:
training and annotation. In the training phase, the main object was extracted from
the image by applying a combination of the Active Contour Model (ACM) and the
colour image segmentation method (JSEG) algorithm. The goal of using this
combination was to prevent over-segmentation. Afterwards, colour (colour
histogram in HSV colour space), texture (Gabor filter), and shape (several masks)
features were extracted from the object and background regions in order to build
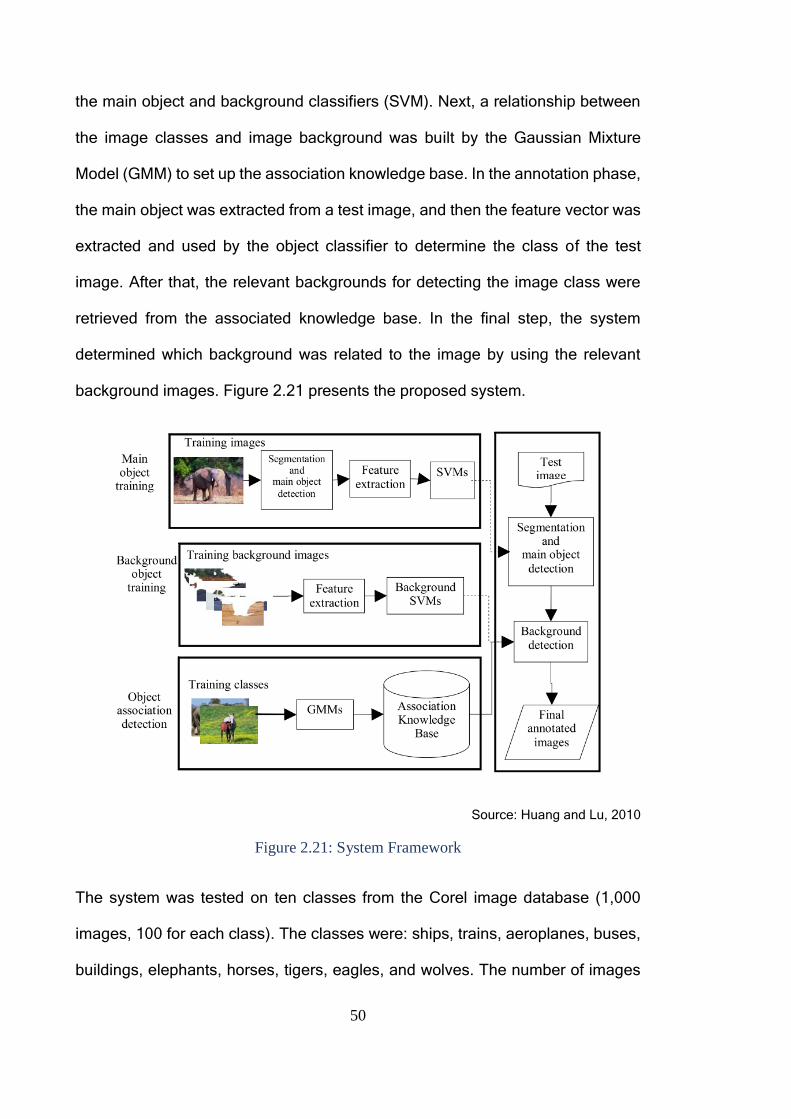
50
the main object and background classifiers (SVM). Next, a relationship between
the image classes and image background was built by the Gaussian Mixture
Model (GMM) to set up the association knowledge base. In the annotation phase,
the main object was extracted from a test image, and then the feature vector was
extracted and used by the object classifier to determine the class of the test
image. After that, the relevant backgrounds for detecting the image class were
retrieved from the associated knowledge base. In the final step, the system
determined which background was related to the image by using the relevant
background images. Figure 2.21 presents the proposed system.
Source: Huang and Lu, 2010
Figure 2.21: System Framework
The system was tested on ten classes from the Corel image database (1,000
images, 100 for each class). The classes were: ships, trains, aeroplanes, buses,
buildings, elephants, horses, tigers, eagles, and wolves. The number of images
51
in each class was divided into two halves. The first half was used as the training
images. The second half was divided into 20 images that were for building the
association knowledge base, while the remaining images were used as testing
images (i.e., 30 images for testing). The results showed that the proposed system
achieved precision=88%, recall=94% and F-measure=91% for the final
annotation for ten classes. In addition, the system was validated by yielding
correct background image annotations even if its image class implied different
backgrounds in the associated knowledge base.
Most systems treat annotation as a translation from image instances into
keywords. However, Sumathi and Hemalatha (2011) considered annotation as a
retrieval problem and established a hybrid framework for image annotation. Their
system started by extracting the feature vector using the Joint Equal Contribution
(JEC) method for an RGB colour image. Next, several SVMs, such as the flat-
wise, axis-wise, and position-wise approaches, were trained in order to prepare
different strings for annotation. After that, a final string was obtained by using a
pair-wise fusion method for summing strings obtained from the three types of
SVMs. Figure 2.22 depicts the framework of the proposed system.
Source: Sumathi and Hemalatha, 2011
Figure 2.22: A Framework of the Proposed System
Train/
Test Set
JEC Method
Baseline
From New
Baseline
SVM Mode 1
Flat wise
Axis wise
Position wise
Methods
Fusion
Final
Annotation
52
This method was examined on a Flickr dataset containing 500 images: 450
images for training and 50 images for testing. To evaluate the system
performance, two types of comparisons were applied by the authors. In the first
comparison, the proposed system was compared with other feature extraction
methods. In the second comparison, the system was compared with a new
baseline method, hierarchical method, MBRM method, CRM method, and NPDE
method. Regarding the first comparison, the results for the mean precision, mean
recall, and N+ (N+ denotes the number of recalled keywords) were 19%, 22%, and
110, respectively. In the second comparison, the results for precision, recall, and
common E measure of the proposed method were 77%, 35%, and 51%,
respectively. The E measure is a metric based on precision (p) and recall (r)
values, and the equation that describes it is as follows:
E(p, r) = 1 − 2/([1/p] + [1/r]) (4)
The experiment results demonstrated that the proposed framework outperformed
other current methods and did not require much time for training data, in
comparison with other methods.
A method proposed by Li et al. (2012) used both generative and discriminative
learning models for automatic image annotation. Firstly, an image was divided
into blocks, each with a size of 16x16 pixels. A 36-dimensional feature vector was
extracted from each block that was composed of 24 colour features (auto-
correlogram calculated over eight quantized colours and three Manhattan
distances) and 12 texture features (Gabor energy computed over three scales
and four orientations). The continuous probabilistic latent semantic analysis
(PLSA) was used to model continuous quantity and evolve an EM-based iterative
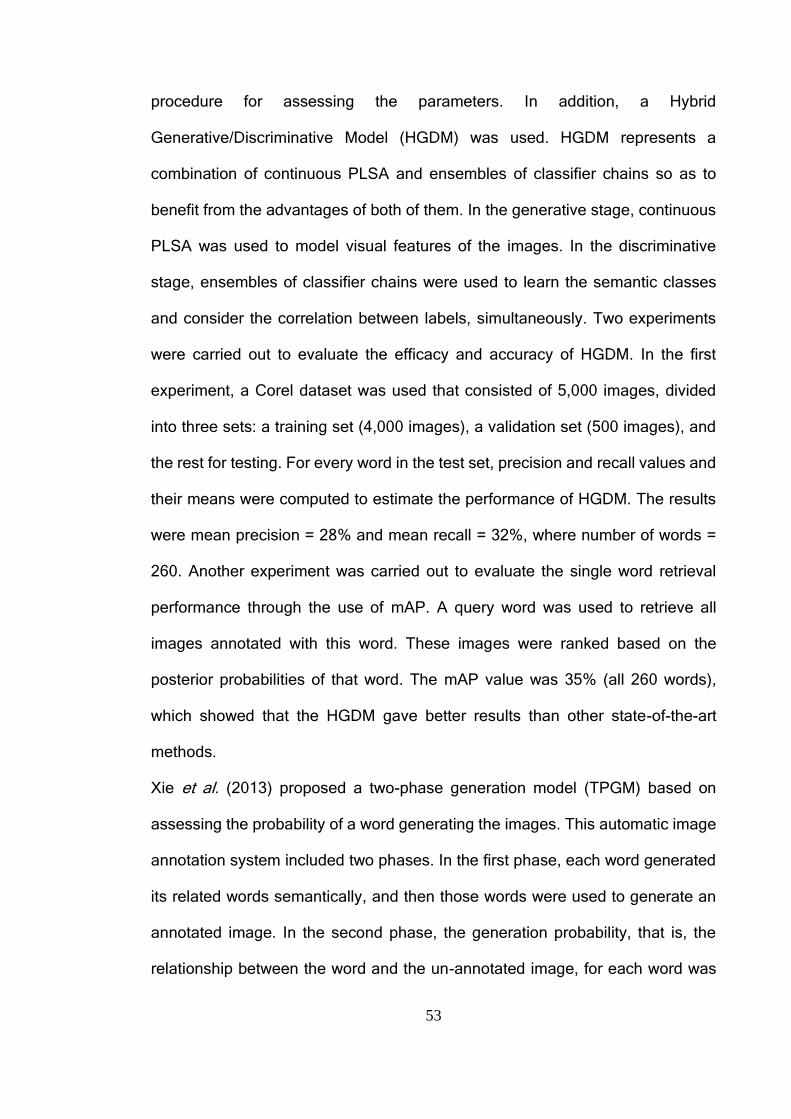
53
procedure for assessing the parameters. In addition, a Hybrid
Generative/Discriminative Model (HGDM) was used. HGDM represents a
combination of continuous PLSA and ensembles of classifier chains so as to
benefit from the advantages of both of them. In the generative stage, continuous
PLSA was used to model visual features of the images. In the discriminative
stage, ensembles of classifier chains were used to learn the semantic classes
and consider the correlation between labels, simultaneously. Two experiments
were carried out to evaluate the efficacy and accuracy of HGDM. In the first
experiment, a Corel dataset was used that consisted of 5,000 images, divided
into three sets: a training set (4,000 images), a validation set (500 images), and
the rest for testing. For every word in the test set, precision and recall values and
their means were computed to estimate the performance of HGDM. The results
were mean precision = 28% and mean recall = 32%, where number of words =
260. Another experiment was carried out to evaluate the single word retrieval
performance through the use of mAP. A query word was used to retrieve all
images annotated with this word. These images were ranked based on the
posterior probabilities of that word. The mAP value was 35% (all 260 words),
which showed that the HGDM gave better results than other state-of-the-art
methods.
Xie et al. (2013) proposed a two-phase generation model (TPGM) based on
assessing the probability of a word generating the images. This automatic image
annotation system included two phases. In the first phase, each word generated
its related words semantically, and then those words were used to generate an
annotated image. In the second phase, the generation probability, that is, the
relationship between the word and the un-annotated image, for each word was
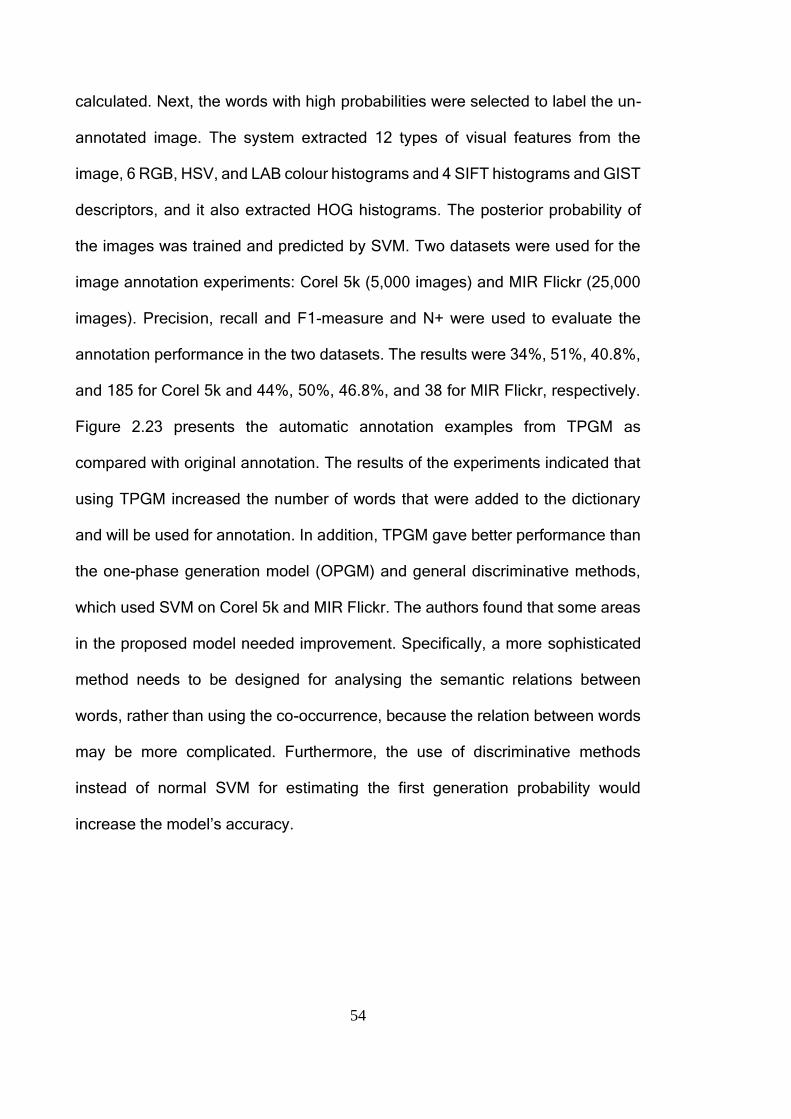
54
calculated. Next, the words with high probabilities were selected to label the un-
annotated image. The system extracted 12 types of visual features from the
image, 6 RGB, HSV, and LAB colour histograms and 4 SIFT histograms and GIST
descriptors, and it also extracted HOG histograms. The posterior probability of
the images was trained and predicted by SVM. Two datasets were used for the
image annotation experiments: Corel 5k (5,000 images) and MIR Flickr (25,000
images). Precision, recall and F1-measure and N+ were used to evaluate the
annotation performance in the two datasets. The results were 34%, 51%, 40.8%,
and 185 for Corel 5k and 44%, 50%, 46.8%, and 38 for MIR Flickr, respectively.
Figure 2.23 presents the automatic annotation examples from TPGM as
compared with original annotation. The results of the experiments indicated that
using TPGM increased the number of words that were added to the dictionary
and will be used for annotation. In addition, TPGM gave better performance than
the one-phase generation model (OPGM) and general discriminative methods,
which used SVM on Corel 5k and MIR Flickr. The authors found that some areas
in the proposed model needed improvement. Specifically, a more sophisticated
method needs to be designed for analysing the semantic relations between
words, rather than using the co-occurrence, because the relation between words
may be more complicated. Furthermore, the use of discriminative methods
instead of normal SVM for estimating the first generation probability would
increase the model’s accuracy.
55
(a) (b) Source: Xie et al., 2013
Figure 2.23: Automatic Annotations Compared With The Original Manual Annotations.
(a) Shows the Image in Core 5K and (b) Shows the Image in MIR Flickr
Zhang, Monirul Islam and Lu, (2013) presented a structural image retrieval
method called Semantic Image Retrieval Based On Object Translation (SIRBOT),
which is based on automatic image annotation and a region-based inverted file.
The proposed system treated regions in an image in the same way as keywords
are treated in a structural text document. The system started with a segmentation
process, in which each image was segmented into regions using the JSEG
algorithm. After that, a post-segmentation process was implemented to remove
noisy information, which represents the mixed-up section between neighbouring
regions. Then, colour, texture, and shape features were extracted for each region
by employing the MPEG-7 Dominant Colour Descriptor (DCD), the curvelet
transform, and the 10 shape features [that is, the seven Hu invariant moments
and the three Tamura features (directionality, line-likeness, and regularity)],
respectively. Subsequently, an Adaptive Vector Quantization (AVQ) algorithm
was used to build a set of visual dictionaries that were comparable to monolingual
dictionaries. Thereafter, a Decision Tree (DT) was applied to build a mapping
between a semantic concept and code words from different visual dictionaries.
56
Finally, a novel region-based inverted file data structure was utilised to index and
retrieve images. Figure 2.24 shows the stages of the proposed system.
Source: Zhang et al., 2013
Figure 2.24: Block Diagram of the SIRBOT System
The system was examined using 10,000 images collected from two datasets: the
Corel 5k dataset and Google images (5,000 from each dataset). Three criteria
were applied to evaluate the SIRBOT performance: precision, recall, and F1-
measure. The overall annotation precision-recall of the SIRBOT was 42%, which
was higher than the methods of Duygulo and Carnerio, which were compared
with it. In addition, the retrieval performance was also evaluated, and the results
showed that the proposed system outperformed the Bayesian annotation model.
According to the authors, images were considered as structural documents using
the same process as used for textual documents. Then, a systematic
investigation and modelling of inverted file indexing was created in order to
capture structural information for image retrieval. Finally, a big visual dictionary
was constructed along with the development of the DT tool in order to obtain
human-understandable rules for image annotation.
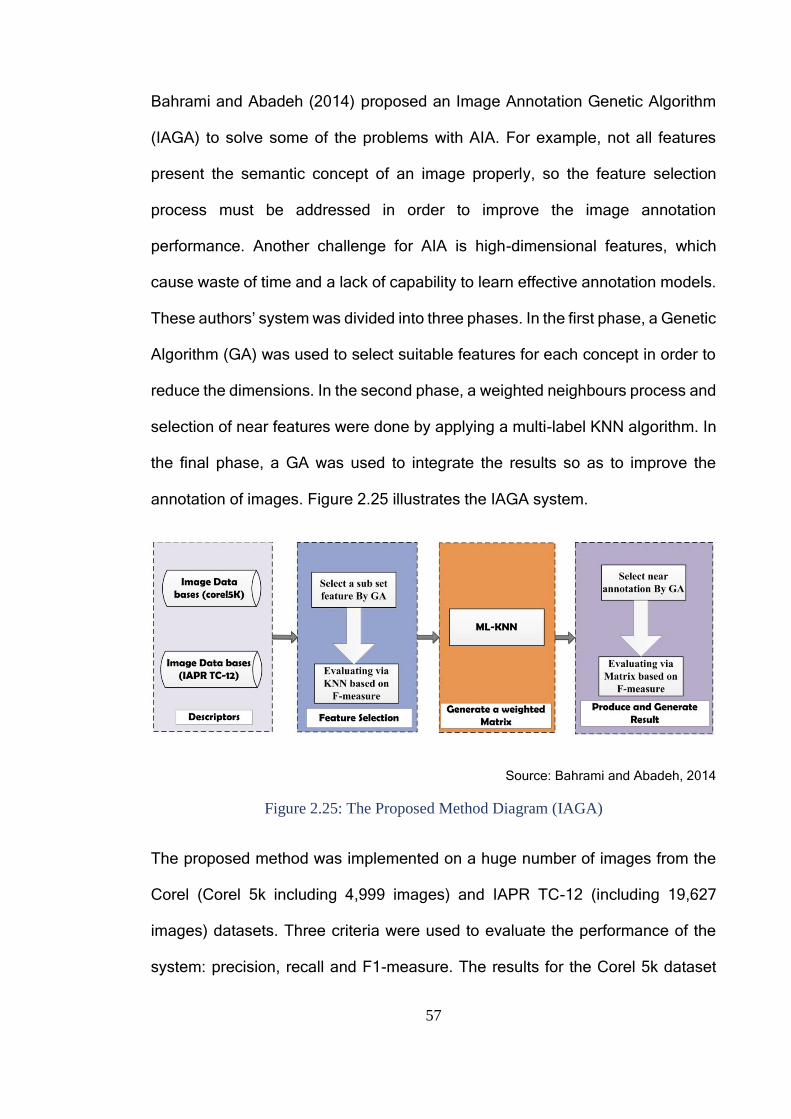
57
Bahrami and Abadeh (2014) proposed an Image Annotation Genetic Algorithm
(IAGA) to solve some of the problems with AIA. For example, not all features
present the semantic concept of an image properly, so the feature selection
process must be addressed in order to improve the image annotation
performance. Another challenge for AIA is high-dimensional features, which
cause waste of time and a lack of capability to learn effective annotation models.
These authors’ system was divided into three phases. In the first phase, a Genetic
Algorithm (GA) was used to select suitable features for each concept in order to
reduce the dimensions. In the second phase, a weighted neighbours process and
selection of near features were done by applying a multi-label KNN algorithm. In
the final phase, a GA was used to integrate the results so as to improve the
annotation of images. Figure 2.25 illustrates the IAGA system.
Source: Bahrami and Abadeh, 2014
Figure 2.25: The Proposed Method Diagram (IAGA)
The proposed method was implemented on a huge number of images from the
Corel (Corel 5k including 4,999 images) and IAPR TC-12 (including 19,627
images) datasets. Three criteria were used to evaluate the performance of the
system: precision, recall and F1-measure. The results for the Corel 5k dataset
58
were 30.0%, 32.7%, and 31.0%, and those for the IAPR TC-12 dataset were
39.8%, 30.0%, and 35.0%, respectively. The authors argued that the IAGA
improved the efficiency and accuracy of the image annotation system in
comparison with other state-of-the-art annotation methods.
Tariq and Foroosh (2014) presented a method with the aim of using an image
scene to facilitate understanding of the visual content in the image and
determining which objects could appear in that image. Their system started by
dividing an image into sections (5x6 grid). Then, colour, texture, and shape
features were extracted for each section, including 18 colour features (mean and
standard deviation of each channel of RGB, LUV, and LAB colour spaces), 12
texture features (Gabor energy computed over three scales and four
orientations), and 4 HoG and discrete cosine transform coefficients. Next, a
holistic visual feature vector called GIST was calculated based on all feature
vectors that were extracted from all sections. The images were classified by the
type of scene presented using the holistic visual feature vector (GIST). Therefore,
there was no need for local classification or identification of individual objects in
the image. At the same time, a textual description containing a number of words
was associated with the image. Furthermore, a certain set of scene types were
available. Next, an image description pair was generated from the selection of
visual units and words based on the scene type. The image description pair
explained the importance of the scene and provided details about the image and
its description. Automatic annotation for the image was done based on the scene
type that was determined to represent the image. The training data was divided
into two halves. A clustering algorithm was done on one half to divide the images
into clusters, while images in the remaining half were distributed in these clusters
59
based on a comparison of the GIST features for the image and the cluster. The
aim of this process was to decrease computational complexity and allow more
images to be added into the training images without the need to repeat the training
process from the beginning. Two datasets were used to test the system: IAPR-
TC 12 (which has 19,846 images) and ESP (which has 67,796 images). A smaller
subset containing 21,844 images was used for the experiments (90% for training
and 10% for testing). The system was compared with other methods on the IAPR-
TC 12 and ESP datasets. The authors used the mean values for precision and
recall per word and the number of words with a positive recall (N+) for
performance evaluation and the results were 55%, 20%, and 254 for the IAPR-
TC 12 dataset and 45%, 19%, and 246 for the ESP dataset, respectively.
Additionally, the system examined the ESP-large dataset in order to prove the
scalability of the system. The authors claimed that the comparison of the results
proved that the proposed system outperformed other methods. Moreover, the
system clarified the significance of image background measurement in order to
identify details of the image.
Zhang (2014b) proposed a Linear Regression Model (LRM) for image annotation
that used well-integrated visual and textual information. The annotation process
in this system comprised several steps. Firstly, the images were segmented into
regions using the normalised cut algorithm, then a feature vector was extracted
for each region and quantized into a visual blob vector, and 36-dimensional visual
features were extracted from each region. Next, the K-mean algorithm was used
to cluster the image regions into blobs. The total number of blobs referred to the
number of objects in the training image dataset. A vocabulary was built based on
collecting keywords from the training dataset. After that, a semantic description
60
vector was built. Finally, the linear regression method, which is based on least
square estimation, was used to fit a strict mapping between the visual blob vectors
and the semantic description vectors. The author used a Corel dataset, containing
5,000 images (4,500 images for training and 500 for testing), to test the algorithm.
The total number of keywords used in annotation was 374 (1 to 5 keywords for
each image). Image annotation performance was measured by using the
annotation precision and recall. The proposed model outperformed other
systems, which were Multiple Bernoulli Relevance Model (MBRM) and
Translation Model (TM) by 10% in terms of recall (recall = 34%) and an equivalent
level of precision (precision = 24%), and also increased by 37 the number of
words with positive recalls. The advantages of the new approach can be
summarised in three points: Firstly, there is no need for any prior knowledge about
image and keywords, because the mapping function can be built visibly, which
involves the production of annotation. Secondly, it avoids tedious parameter
setting, because of the substantial use of regression models. Third, it is
computationally efficient and scalable for huge images, as well as conceptually
simple.
Repetition of the above study was done by Zhang (2014a) by following the same
steps to represent the visual blob vector and the semantic description vector,
except for the method used to find the mapping relation function between the
visual blob vector and the semantic description vector. This paper used a
nonlinear regression method for the mapping process because of its greater
suitability for complex image annotation, especially nature images, than linear
regression. The author used a Corel dataset of 5,000 images (4,500 images for
training and 500 for testing) to test the algorithm. The total number of keywords
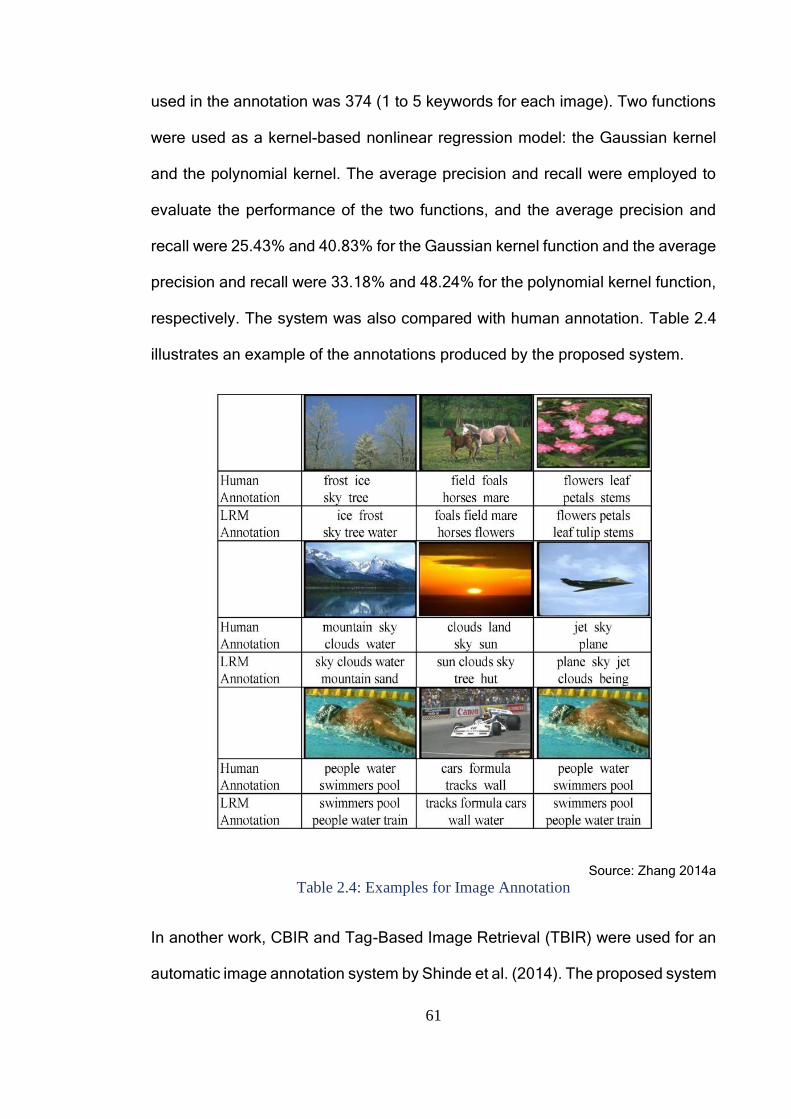
61
used in the annotation was 374 (1 to 5 keywords for each image). Two functions
were used as a kernel-based nonlinear regression model: the Gaussian kernel
and the polynomial kernel. The average precision and recall were employed to
evaluate the performance of the two functions, and the average precision and
recall were 25.43% and 40.83% for the Gaussian kernel function and the average
precision and recall were 33.18% and 48.24% for the polynomial kernel function,
respectively. The system was also compared with human annotation. Table 2.4
illustrates an example of the annotations produced by the proposed system.
Source: Zhang 2014a
Table 2.4: Examples for Image Annotation
In another work, CBIR and Tag-Based Image Retrieval (TBIR) were used for an
automatic image annotation system by Shinde et al. (2014). The proposed system
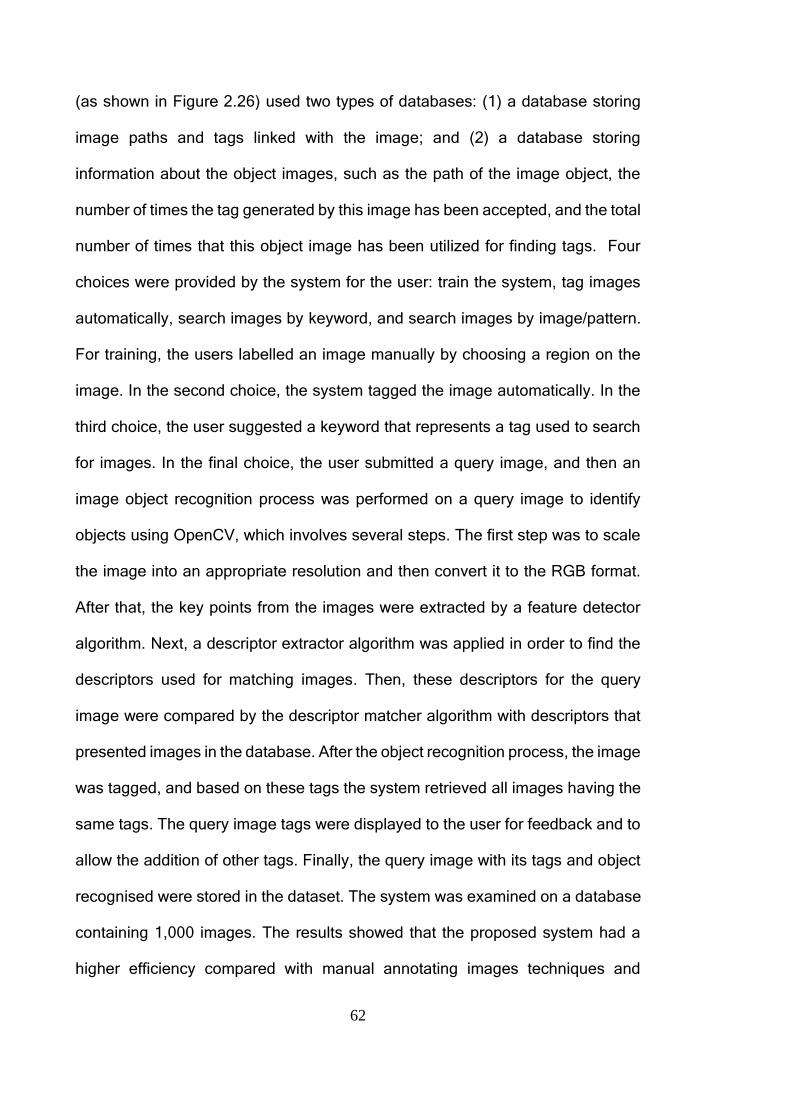
62
(as shown in Figure 2.26) used two types of databases: (1) a database storing
image paths and tags linked with the image; and (2) a database storing
information about the object images, such as the path of the image object, the
number of times the tag generated by this image has been accepted, and the total
number of times that this object image has been utilized for finding tags. Four
choices were provided by the system for the user: train the system, tag images
automatically, search images by keyword, and search images by image/pattern.
For training, the users labelled an image manually by choosing a region on the
image. In the second choice, the system tagged the image automatically. In the
third choice, the user suggested a keyword that represents a tag used to search
for images. In the final choice, the user submitted a query image, and then an
image object recognition process was performed on a query image to identify
objects using OpenCV, which involves several steps. The first step was to scale
the image into an appropriate resolution and then convert it to the RGB format.
After that, the key points from the images were extracted by a feature detector
algorithm. Next, a descriptor extractor algorithm was applied in order to find the
descriptors used for matching images. Then, these descriptors for the query
image were compared by the descriptor matcher algorithm with descriptors that
presented images in the database. After the object recognition process, the image
was tagged, and based on these tags the system retrieved all images having the
same tags. The query image tags were displayed to the user for feedback and to
allow the addition of other tags. Finally, the query image with its tags and object
recognised were stored in the dataset. The system was examined on a database
containing 1,000 images. The results showed that the proposed system had a
higher efficiency compared with manual annotating images techniques and
63
exhibited greater accuracy than simpler versions of automatic image annotation.
However, there are a number of limitations associated with this method of
annotation, such as its heavy reliance on the CBIR performance, object
recognition, and relevant user feedback algorithm, especially where there was no
initial annotation in the database.
Source: Shinde et al., 2014
Figure 2.26: Architecture of the Proposed System
Hou and Wang (2014) used Multi-Kernel Learning (MKL) methods such as the
radial basic kernel function combined with Spatial Pyramid (SP) and Histogram
Intersection Kernels (HIK) to build an automatic image annotation system. The
objective of this paper was to overcome limitations such as the lack of effective
feature information processes in previous methods using single kernel learning.
The proposed system started with feature extraction from an image using a SIFT
as a descriptor. Then, the K-mean algorithm was utilised so as to cluster feature
descriptors and build a feature dictionary of training images, considering each
clustering centre as a visual word. Thereafter, SP was used to organise the
64
features. After that, an optimal combination of histogram intersection kernels was
learned through the use of MKL. Finally, the radial basic kernel function, which is
an example of the most commonly used kernel functions, was used to predict
labels for the training images. SP and HIK were utilised to optimise parameters
during the machine learning (SVM) process. The system was tested on three
different datasets, the Caltech 256, Corel 5k, and Stanford 40 actions (In total 420
images). A dictionary size of 300 words was used for the training sets.
Performance evaluation was calculated by the mAP, and the results were around
80% for both the Corel 5k and Caltech 256 databases and 95% for the Stanford
40 actions database. Therefore, the proposed framework outperformed the state-
of-the-art on multiple databases.
Bhargava (2014) introduced an object-based image retrieval algorithm for
automatic image annotation. The aim of this method was to replace the feature
extraction process for the whole image with the object area only, in order to
reduce the feature matching process while maintaining effective retrieval based
on object selection. The proposed system was divided into two parts. In the first
part, an object selection process was conducted by applying a Hessian blob
detector on the image and feature extraction using Speeded Up Robust Features
(SURF). Next, step two involved training of the annotated images using an SVM
classifier and dividing them into groups based on different keywords. Figure 2.27
shows the framework of the proposed system.
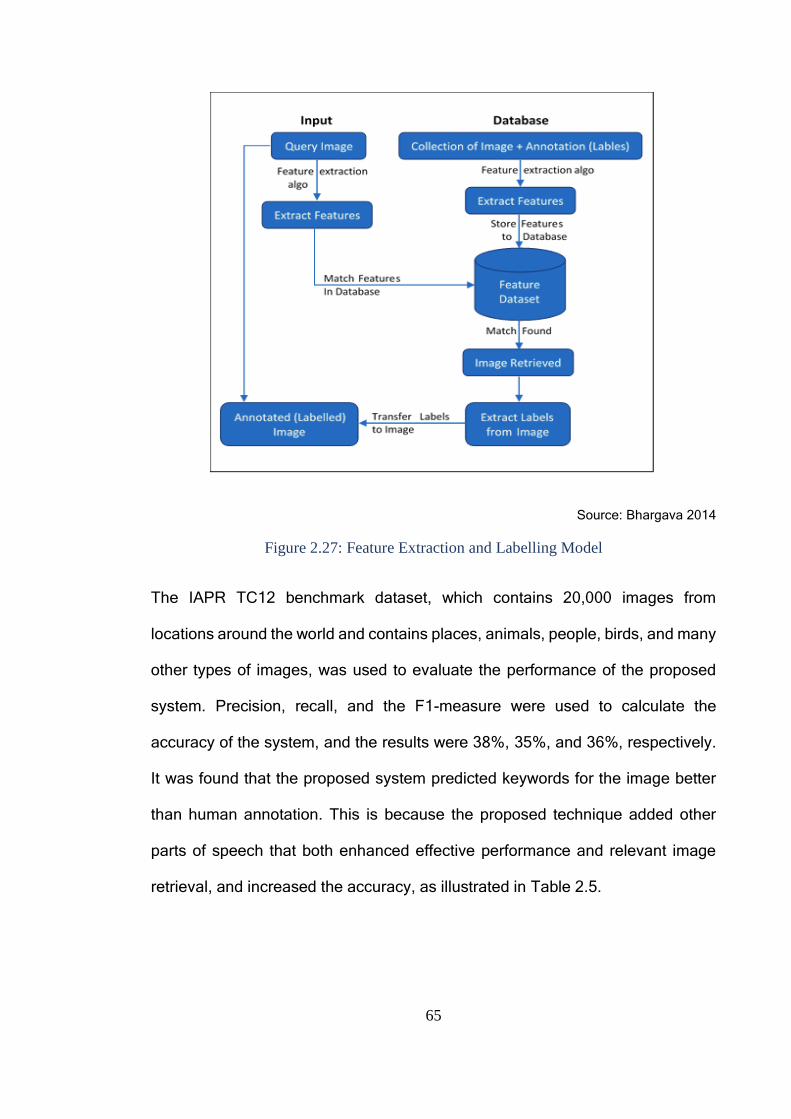
65
Source: Bhargava 2014
Figure 2.27: Feature Extraction and Labelling Model
The IAPR TC12 benchmark dataset, which contains 20,000 images from
locations around the world and contains places, animals, people, birds, and many
other types of images, was used to evaluate the performance of the proposed
system. Precision, recall, and the F1-measure were used to calculate the
accuracy of the system, and the results were 38%, 35%, and 36%, respectively.
It was found that the proposed system predicted keywords for the image better
than human annotation. This is because the proposed technique added other
parts of speech that both enhanced effective performance and relevant image
retrieval, and increased the accuracy, as illustrated in Table 2.5.
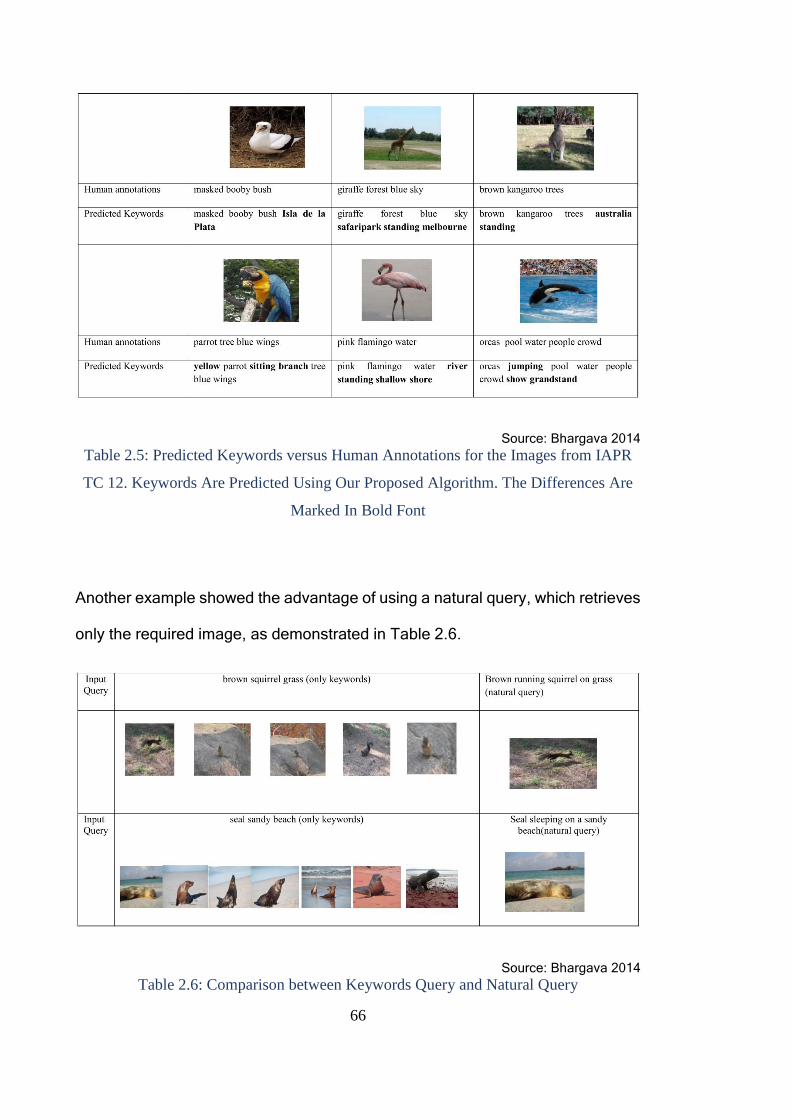
66
Source: Bhargava 2014
Table 2.5: Predicted Keywords versus Human Annotations for the Images from IAPR
TC 12. Keywords Are Predicted Using Our Proposed Algorithm. The Differences Are
Marked In Bold Font
Another example showed the advantage of using a natural query, which retrieves
only the required image, as demonstrated in Table 2.6.
Source: Bhargava 2014
Table 2.6: Comparison between Keywords Query and Natural Query
67
Yuan-Yuan et al. (2014) proposed a hierarchical model for multi-label image
annotation based on global and regional features. In the first step, their system
excluded irrelevant images from unlabelled images by using an image-filtering
algorithm. The aim of this stage was to improve the efficiency and performance
of the annotation. In the second step, two types of features were extracted from
the image: global features and region features. In the third step, the system used
the HSV histogram feature, HSV colour moment, colour correlogram, texture
based on GLCM, and Gabor wavelets to extract global features. Meanwhile, the
HSV colour moment, colour coherence vector, Gabor wavelets, and Hu invariant
moments were utilised to extract regional features. Then, two models were used
in order to find an annotation for the unlabelled image, a Baseline Model (BM)
and a No-Parameter Probabilistic Model (NPM) for global and regional features,
respectively. A simple weighted algorithm was utilised to fuse the results from the
two annotation models. After that, the results from the fusion process were used
to annotate the unlabelled image. The system was implemented on the Corel 5k
dataset, containing 5,000 images (4,500 images for training and 500 images for
testing). Each image was annotated with 1-5 labels. The dictionary contained 374
words. Three measures were utilised to evaluate the performance of the
proposed system: the precision, the recall, and the number of keywords recalled,
which were represented by P, R, and N+, respectively. The overall performance
of the proposed baseline method using the image-filtering algorithm was
compared with the same method without using the image-filtering algorithm, and
the results showed that the proposed method had better performance. The overall
performance of the proposed system was P = 26%, R = 28%, and N+ = 133,
demonstrating that the proposed system achieved precision result that was
68
higher than other state-of-the-art models by 8%. However, the values of R and N+
were not higher than all state-of-the-art methods that were compared with them.
Oujaoura, Minaoui and Fakir (2014) proposed a system that used a set of efficient
descriptors and classifiers in order to improve the accuracy of the annotation
system. Their system was divided into two phases: an offline phase and an online
phase. In the offline phase, images in a database were annotated by experts.
After that, classifiers were trained and modelled by using the annotated database
images. In the online phase, images were annotated directly. This process was
done by segmenting the images into regions, representing objects in the image,
by using the region growing method; then, features vectors were computed by
applying the colour histogram (RGB and HSV histograms), moments (Hu,
Zernike, and Legendre), texture (co-occurrence matrix), and GIST descriptors.
Afterwards, these features were passed on as inputs to the classifiers. Finally,
voting rule classifier combination schemes were used, where each classifier with
each descriptor voted for the suitable keywords. All votes were compared with
each other, and the keywords with the maximum number of votes were selected
as the final keywords to annotate the image. Figure 2.28 presents a block diagram
of the image annotation system.
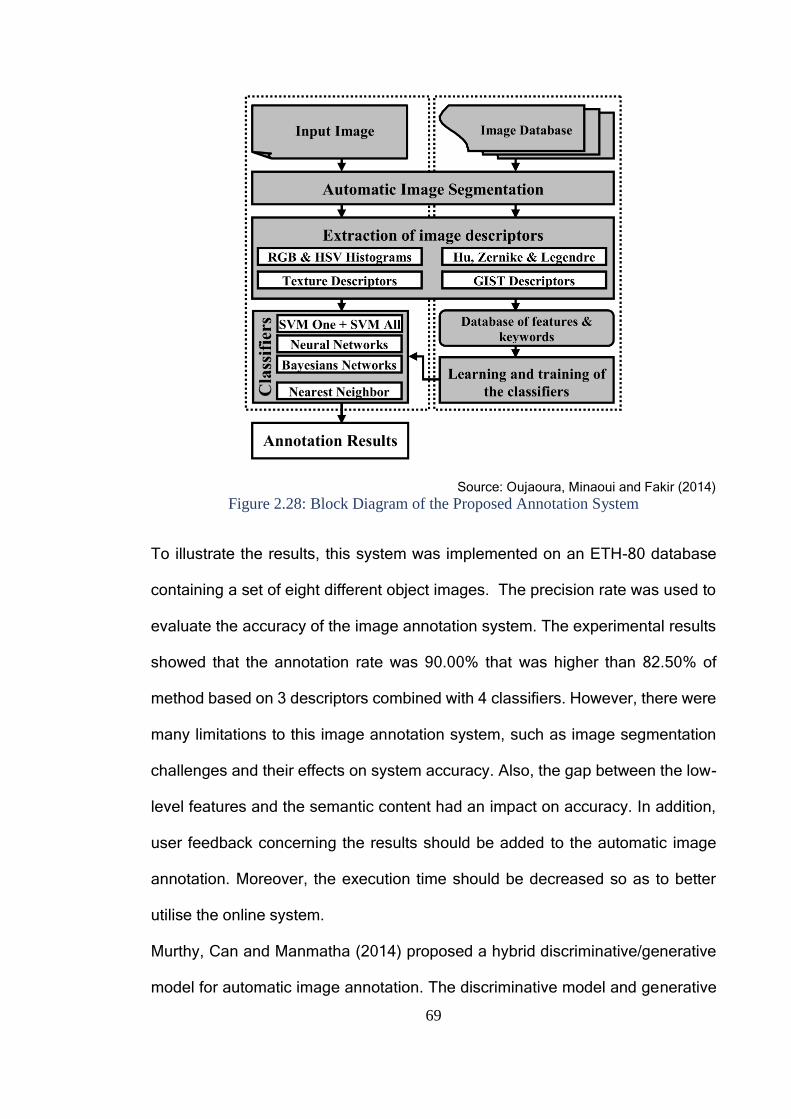
69
Source: Oujaoura, Minaoui and Fakir (2014)
Figure 2.28: Block Diagram of the Proposed Annotation System
To illustrate the results, this system was implemented on an ETH-80 database
containing a set of eight different object images. The precision rate was used to
evaluate the accuracy of the image annotation system. The experimental results
showed that the annotation rate was 90.00% that was higher than 82.50% of
method based on 3 descriptors combined with 4 classifiers. However, there were
many limitations to this image annotation system, such as image segmentation
challenges and their effects on system accuracy. Also, the gap between the low-
level features and the semantic content had an impact on accuracy. In addition,
user feedback concerning the results should be added to the automatic image
annotation. Moreover, the execution time should be decreased so as to better
utilise the online system.
Murthy, Can and Manmatha (2014) proposed a hybrid discriminative/generative
model for automatic image annotation. The discriminative model and generative
70
model were implemented by an SVM and a Discrete Multiple Bernoulli Relevance
Model (DMBRM), respectively. A Latent Dirichlet Allocation (LDA) model was
utilized to decrease the dimensionality of the vector quantized features before
using the DMBRM, because the DMBRM was found to work inefficiently with high-
dimensional data. The aim of using two models was to benefit from the distinct
capabilities of each model. The SVM was used to solve the problem of poor
annotation (images are not annotated with all relevant keywords), while the
DMBRM model was used to overcome the problem of data imbalance (large
variations in the number of positive samples). Initially, the system extracted two
types of features from an image, global features and local features, such as
histograms in RGB, HSV, and LAB colour space; SIFT descriptors extracted
densely on a multi-scale grid; and Harris-Laplacain interest points; along with four
different features such as HOG2x2, LBP, Textons, and Geotextons. Next, a
model was built for each feature type, and then all these models were combined
together appropriately. For a given test image, the SVM and DMBRM models
were used individually to compute the probabilities for each word, based on its
ability to characterize the image. Next, the normalized scores of the SVM and
DMBRM models were fused together. Finally, the top five (fixed annotation) words
having the high scores were used to annotate the image. For experimental
verification, Corel 5k (5,000 images, 4,500 for training and 500 for testing), ESP
Game (20,770 images, 18,689 for training and 2,081 for testing), and IAPRTC-12
(19,627 images, 17,665 for training, and 1,962 for testing) datasets were used.
For evaluation, the authors utilized three criteria: the average precision, the
average recall, and the non-zero recall (number of distinct words that were
correctly assigned to the test image set), represented by P, R, and N+,
71
respectively. The results showed that the proposed system outperformed other
state-of-the-art methods of automatic annotation in two criteria, but not all. The
results were (P = 36%, R = 48%, and N+ = 197), (P = 55%, R = 25%, and N+ =
259) and (P = 56%, R = 29%, and N+ = 283) for Corel 5k, ESP Game, and
IAPRTC-12, respectively. The bold numbers refer to results reflecting the
superiority of the proposed system over other systems. The proposed framework
was able to tackle imbalanced data and the poor labelling problem in an efficient
way, as demonstrate by the high N+ scores as compared with the others. Table
2.7 gives examples of automatic image annotation by the proposed system for
the Corel 5k, ESP Game, and IAPRTC-12 datasets compared with true
annotation.
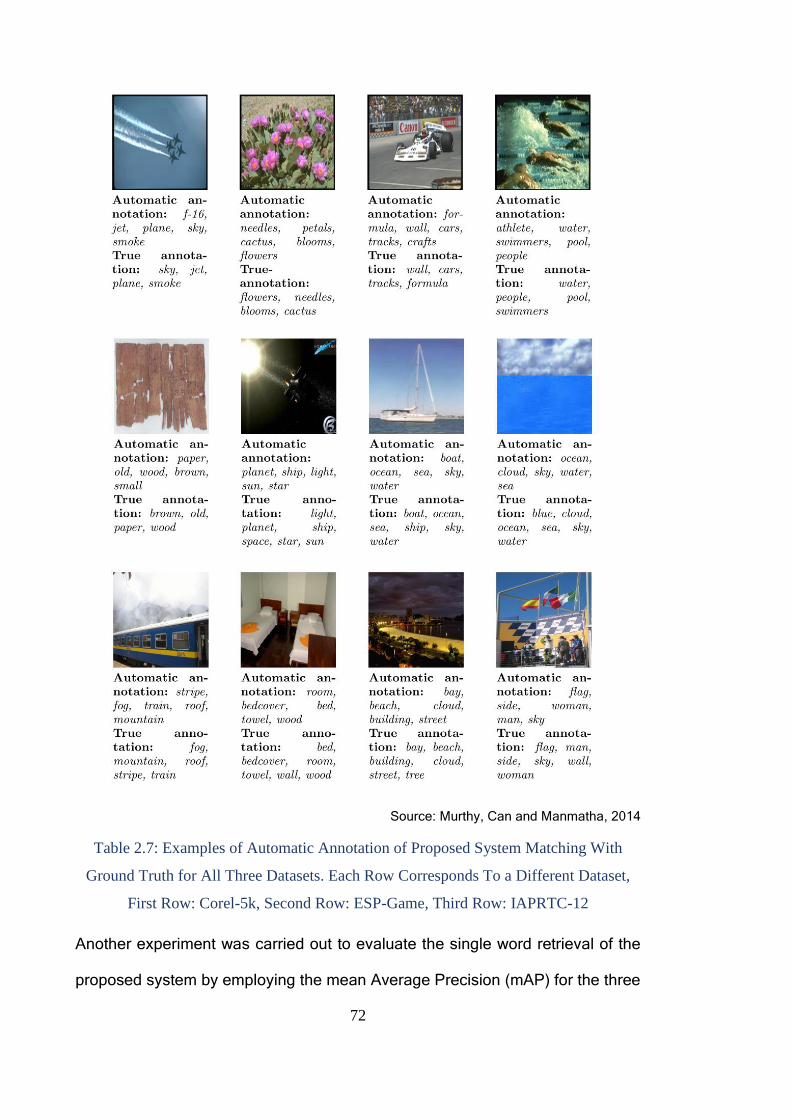
72
Source: Murthy, Can and Manmatha, 2014
Table 2.7: Examples of Automatic Annotation of Proposed System Matching With
Ground Truth for All Three Datasets. Each Row Corresponds To a Different Dataset,
First Row: Corel-5k, Second Row: ESP-Game, Third Row: IAPRTC-12
Another experiment was carried out to evaluate the single word retrieval of the
proposed system by employing the mean Average Precision (mAP) for the three
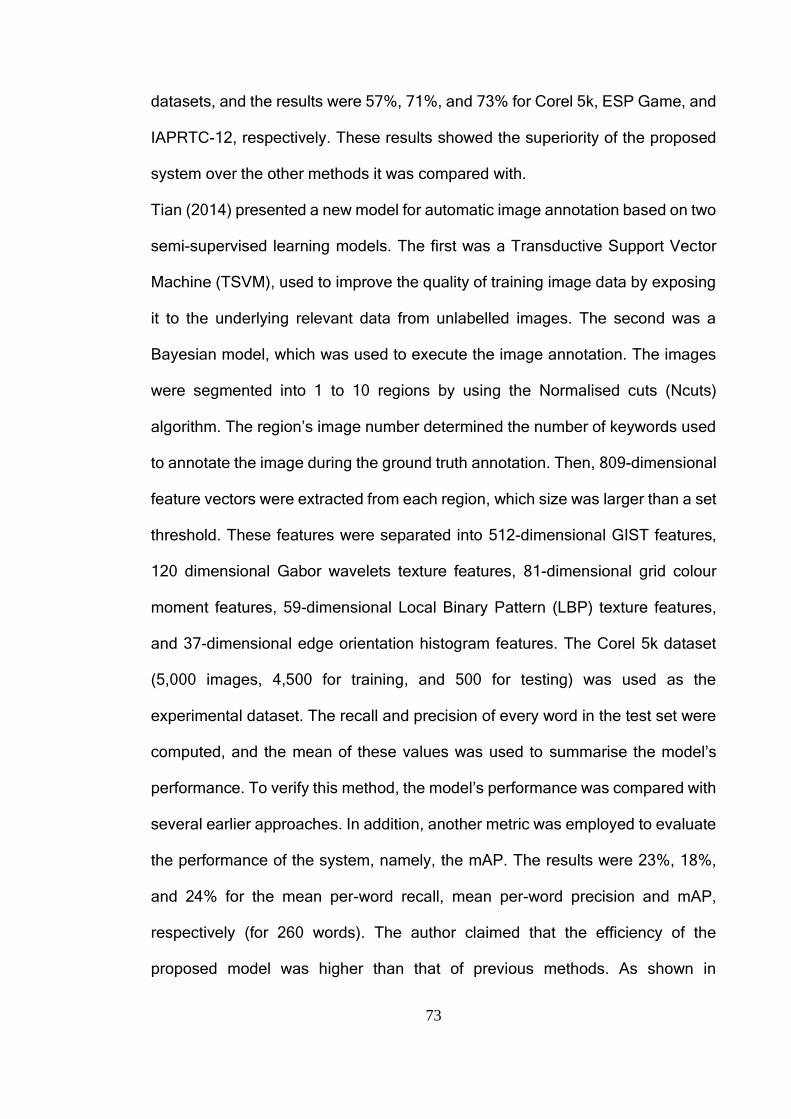
73
datasets, and the results were 57%, 71%, and 73% for Corel 5k, ESP Game, and
IAPRTC-12, respectively. These results showed the superiority of the proposed
system over the other methods it was compared with.
Tian (2014) presented a new model for automatic image annotation based on two
semi-supervised learning models. The first was a Transductive Support Vector
Machine (TSVM), used to improve the quality of training image data by exposing
it to the underlying relevant data from unlabelled images. The second was a
Bayesian model, which was used to execute the image annotation. The images
were segmented into 1 to 10 regions by using the Normalised cuts (Ncuts)
algorithm. The region’s image number determined the number of keywords used
to annotate the image during the ground truth annotation. Then, 809-dimensional
feature vectors were extracted from each region, which size was larger than a set
threshold. These features were separated into 512-dimensional GIST features,
120 dimensional Gabor wavelets texture features, 81-dimensional grid colour
moment features, 59-dimensional Local Binary Pattern (LBP) texture features,
and 37-dimensional edge orientation histogram features. The Corel 5k dataset
(5,000 images, 4,500 for training, and 500 for testing) was used as the
experimental dataset. The recall and precision of every word in the test set were
computed, and the mean of these values was used to summarise the model’s
performance. To verify this method, the model’s performance was compared with
several earlier approaches. In addition, another metric was employed to evaluate
the performance of the system, namely, the mAP. The results were 23%, 18%,
and 24% for the mean per-word recall, mean per-word precision and mAP,
respectively (for 260 words). The author claimed that the efficiency of the
proposed model was higher than that of previous methods. As shown in
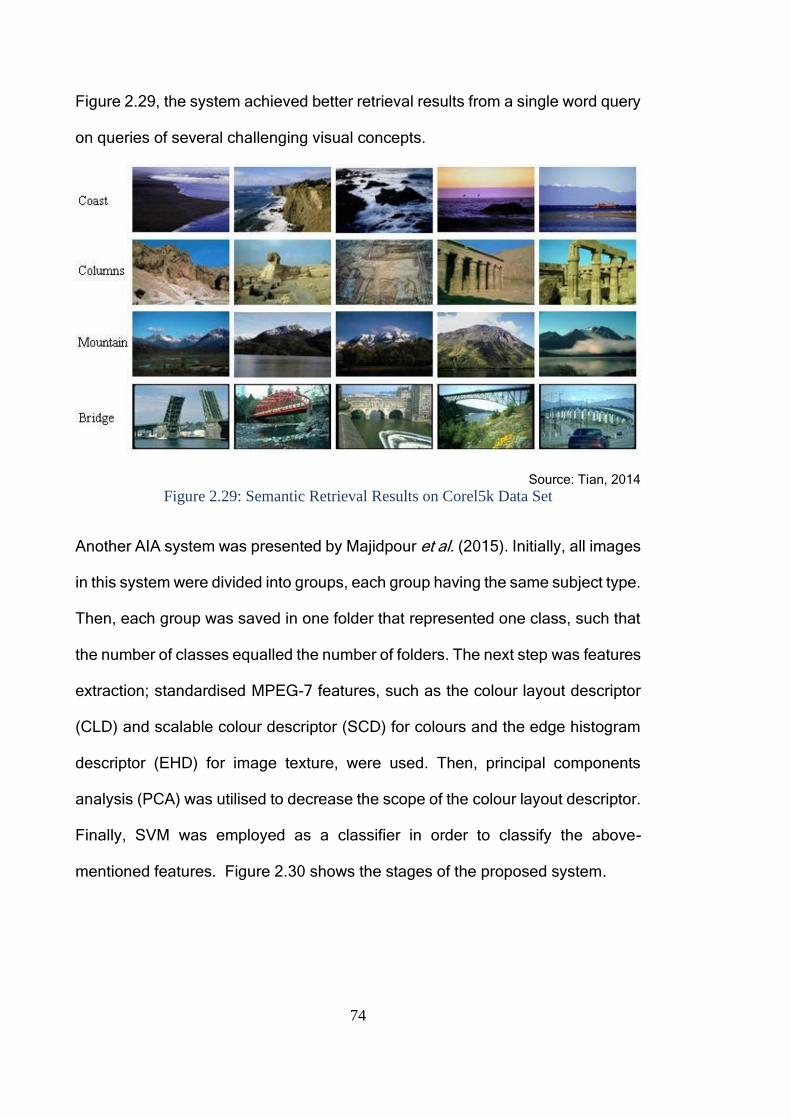
74
Figure 2.29, the system achieved better retrieval results from a single word query
on queries of several challenging visual concepts.
Source: Tian, 2014
Figure 2.29: Semantic Retrieval Results on Corel5k Data Set
Another AIA system was presented by Majidpour et al. (2015). Initially, all images
in this system were divided into groups, each group having the same subject type.
Then, each group was saved in one folder that represented one class, such that
the number of classes equalled the number of folders. The next step was features
extraction; standardised MPEG-7 features, such as the colour layout descriptor
(CLD) and scalable colour descriptor (SCD) for colours and the edge histogram
descriptor (EHD) for image texture, were used. Then, principal components
analysis (PCA) was utilised to decrease the scope of the colour layout descriptor.
Finally, SVM was employed as a classifier in order to classify the above-
mentioned features. Figure 2.30 shows the stages of the proposed system.
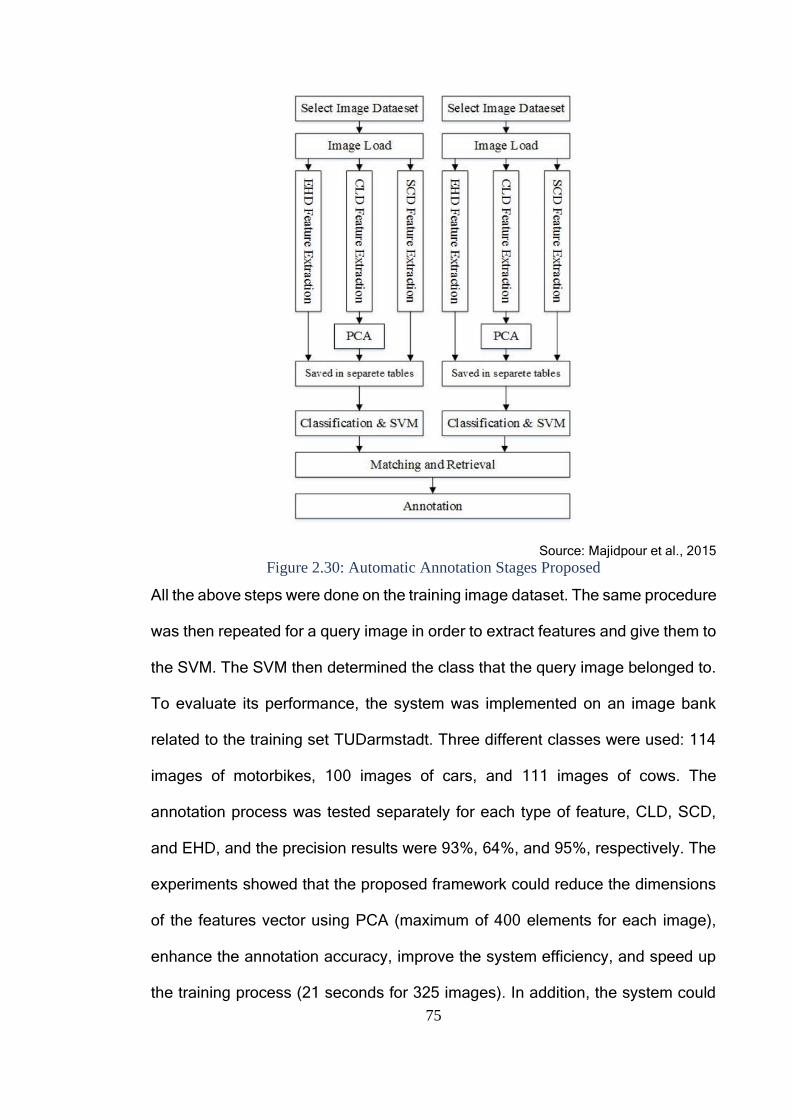
75
Source: Majidpour et al., 2015 Figure 2.30: Automatic Annotation Stages Proposed
All the above steps were done on the training image dataset. The same procedure
was then repeated for a query image in order to extract features and give them to
the SVM. The SVM then determined the class that the query image belonged to.
To evaluate its performance, the system was implemented on an image bank
related to the training set TUDarmstadt. Three different classes were used: 114
images of motorbikes, 100 images of cars, and 111 images of cows. The
annotation process was tested separately for each type of feature, CLD, SCD,
and EHD, and the precision results were 93%, 64%, and 95%, respectively. The
experiments showed that the proposed framework could reduce the dimensions
of the features vector using PCA (maximum of 400 elements for each image),
enhance the annotation accuracy, improve the system efficiency, and speed up
the training process (21 seconds for 325 images). In addition, the system could
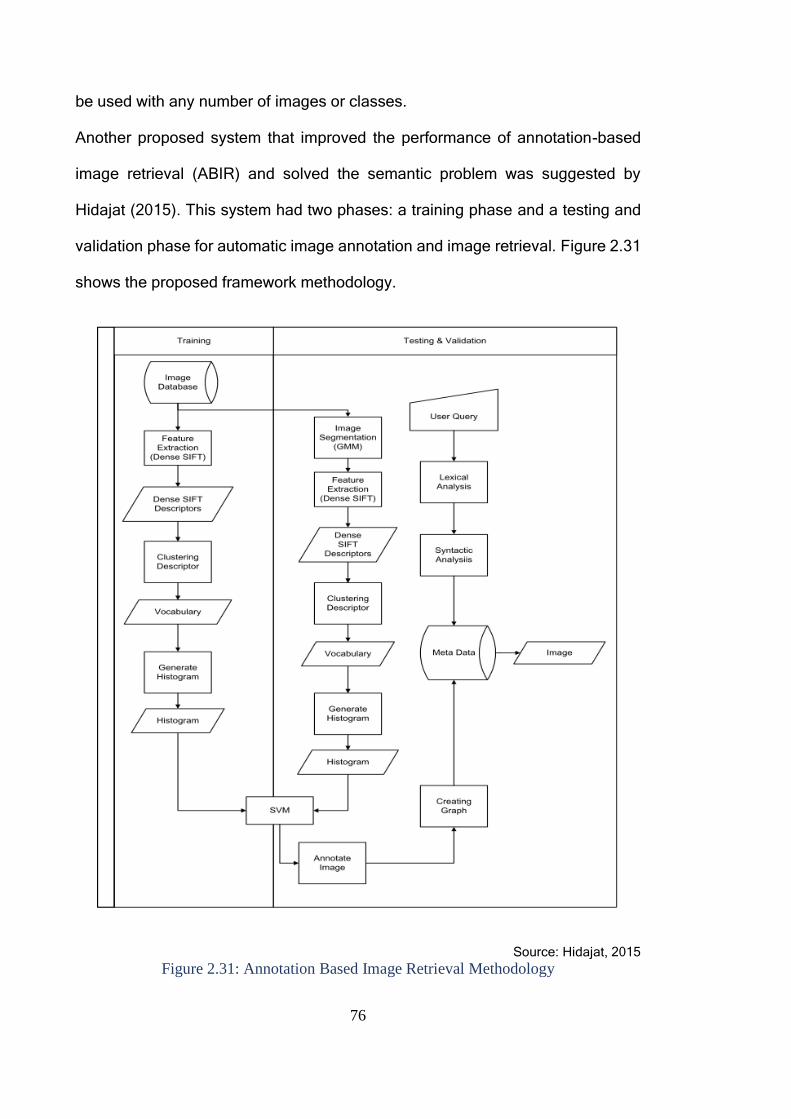
76
be used with any number of images or classes.
Another proposed system that improved the performance of annotation-based
image retrieval (ABIR) and solved the semantic problem was suggested by
Hidajat (2015). This system had two phases: a training phase and a testing and
validation phase for automatic image annotation and image retrieval. Figure 2.31
shows the proposed framework methodology.
Source: Hidajat, 2015
Figure 2.31: Annotation Based Image Retrieval Methodology
77
In order to evaluate the performance of the proposed system, the LAMDA dataset
was employed, with 84 training images and 457 testing and validation images.
The annotation keywords included dessert, mountains, sea, sky, and trees. In
addition, precision, recall and F1-measure were employed to evaluate the results
of the retrieval testing. Based on these metrics, the ranges of the precision, recall,
and F1-measure were 66.67-100%, 46.15-66.67%, and 54.54-84.85%,
respectively. Consequently, the proposed system is adequate for use in image
retrieval. The proposed framework was compared with a CBIR system using a
colour histogram for matching and sorting images based on similarity. The
average precision of the CBIR system was 31%, compared to 88% precision
demonstrated by the proposed system. Based on these results, semantic
labelling was shown to be better than the use of low-level features for matching.
In addition, the proposed system used spatial information between objects, which
was further able to improve the performance. However, this study needs to
improve upon its annotation process in order to increase its recall and precision
performance. Also, the results show that images based on image identification
resulted in displays of unrelated images among the first or second data results.
Xia, Wu and Feng (2015) proposed a probabilistic model to label un-annotated
images by finding correlations between images and texts. Their system used a
training images dataset that segmented images into regions and annotated them
manually. Then, a K-mean algorithm was used to cluster image regions into
blobs. Thereafter, the system anticipated the probability of specifying a keyword
into a blob. Finally, the image was annotated with suitable keywords. This system
focused on automatic image annotation through the probabilistic model rather
than by the segmentation process. A segmented and annotated IAPR TC-12
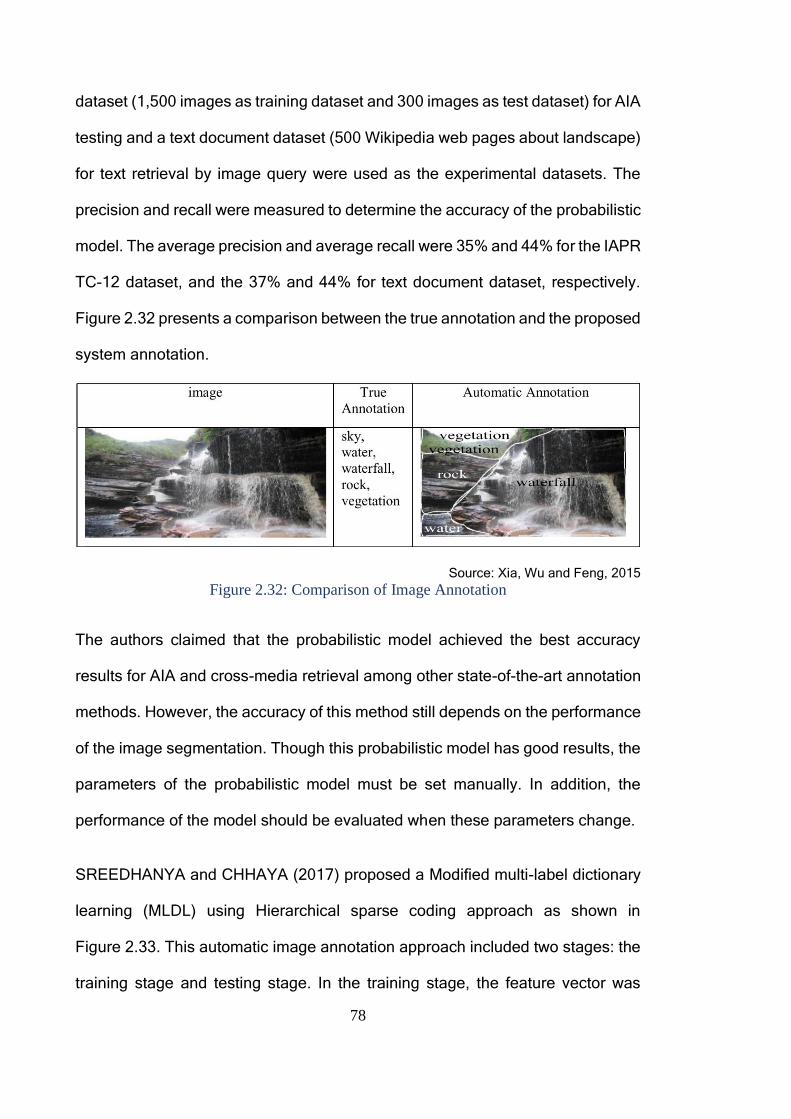
78
dataset (1,500 images as training dataset and 300 images as test dataset) for AIA
testing and a text document dataset (500 Wikipedia web pages about landscape)
for text retrieval by image query were used as the experimental datasets. The
precision and recall were measured to determine the accuracy of the probabilistic
model. The average precision and average recall were 35% and 44% for the IAPR
TC-12 dataset, and the 37% and 44% for text document dataset, respectively.
Figure 2.32 presents a comparison between the true annotation and the proposed
system annotation.
Source: Xia, Wu and Feng, 2015
Figure 2.32: Comparison of Image Annotation
The authors claimed that the probabilistic model achieved the best accuracy
results for AIA and cross-media retrieval among other state-of-the-art annotation
methods. However, the accuracy of this method still depends on the performance
of the image segmentation. Though this probabilistic model has good results, the
parameters of the probabilistic model must be set manually. In addition, the
performance of the model should be evaluated when these parameters change.
SREEDHANYA and CHHAYA (2017) proposed a Modified multi-label dictionary
learning (MLDL) using Hierarchical sparse coding approach as shown in
Figure 2.33. This automatic image annotation approach included two stages: the
training stage and testing stage. In the training stage, the feature vector was
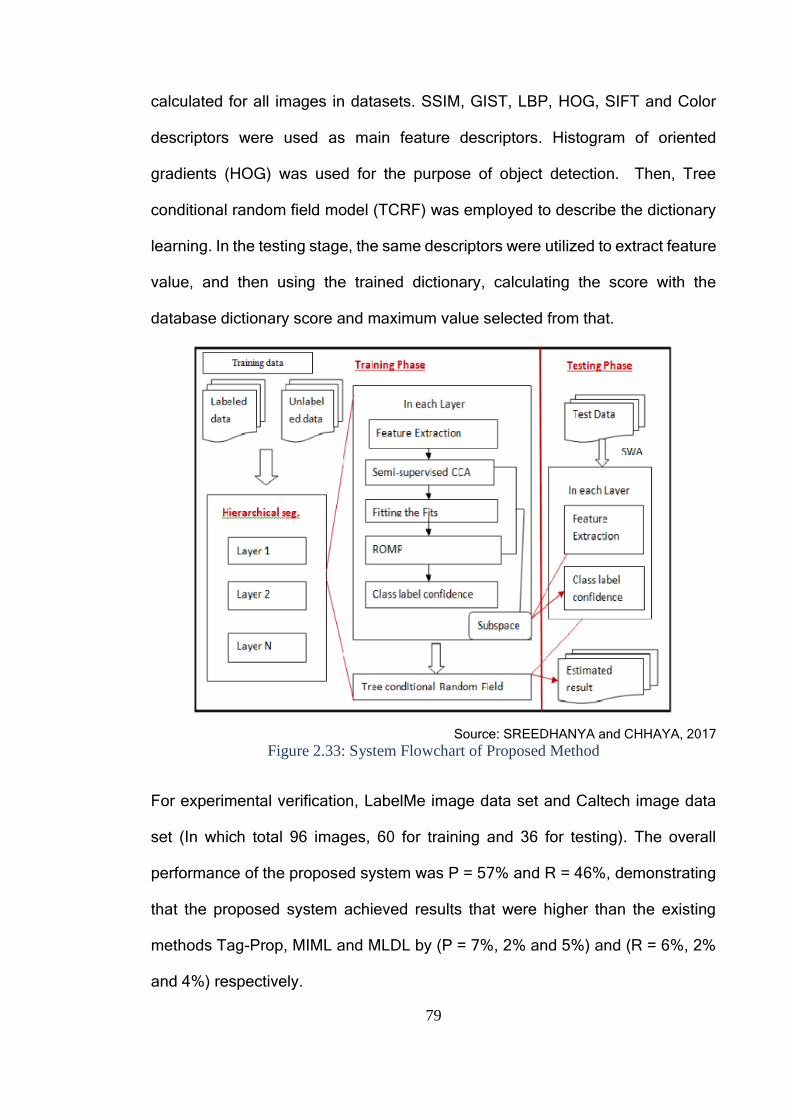
79
calculated for all images in datasets. SSIM, GIST, LBP, HOG, SIFT and Color
descriptors were used as main feature descriptors. Histogram of oriented
gradients (HOG) was used for the purpose of object detection. Then, Tree
conditional random field model (TCRF) was employed to describe the dictionary
learning. In the testing stage, the same descriptors were utilized to extract feature
value, and then using the trained dictionary, calculating the score with the
database dictionary score and maximum value selected from that.
Source: SREEDHANYA and CHHAYA, 2017
Figure 2.33: System Flowchart of Proposed Method
For experimental verification, LabelMe image data set and Caltech image data
set (In which total 96 images, 60 for training and 36 for testing). The overall
performance of the proposed system was P = 57% and R = 46%, demonstrating
that the proposed system achieved results that were higher than the existing
methods Tag-Prop, MIML and MLDL by (P = 7%, 2% and 5%) and (R = 6%, 2%
and 4%) respectively.
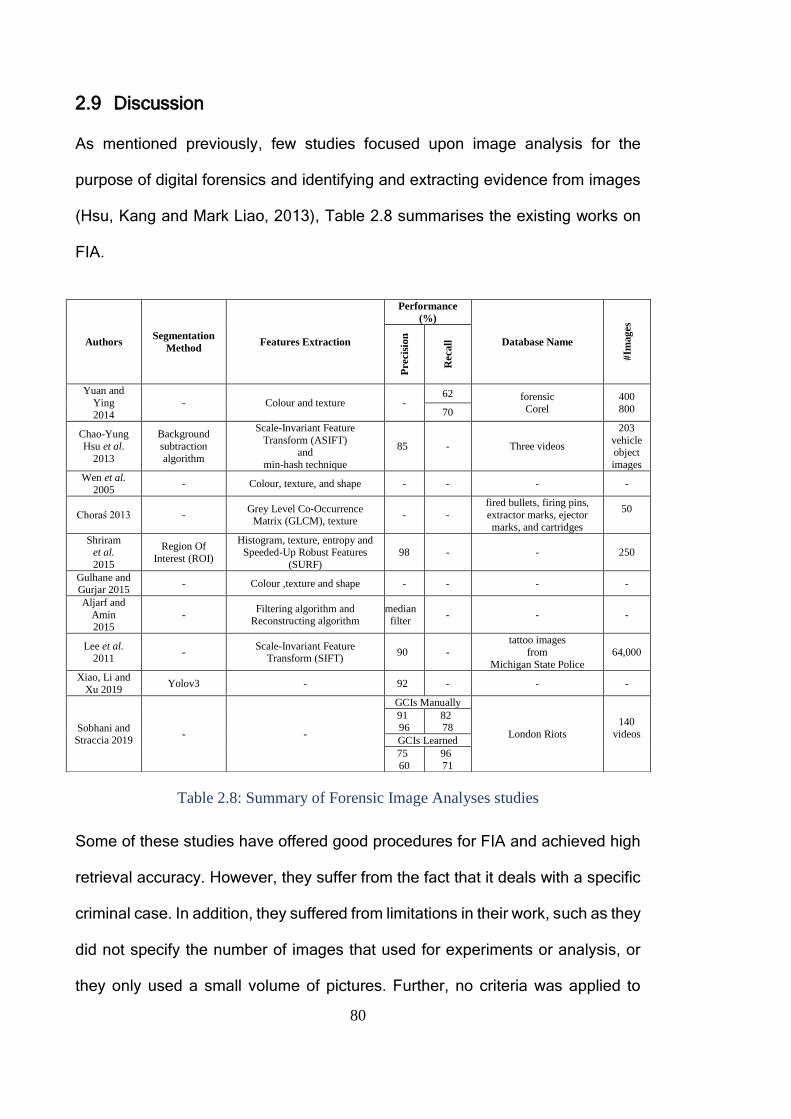
80
2.9 Discussion
As mentioned previously, few studies focused upon image analysis for the
purpose of digital forensics and identifying and extracting evidence from images
(Hsu, Kang and Mark Liao, 2013), Table 2.8 summarises the existing works on
FIA.
Table 2.8: Summary of Forensic Image Analyses studies
Some of these studies have offered good procedures for FIA and achieved high
retrieval accuracy. However, they suffer from the fact that it deals with a specific
criminal case. In addition, they suffered from limitations in their work, such as they
did not specify the number of images that used for experiments or analysis, or
they only used a small volume of pictures. Further, no criteria was applied to
Authors Segmentation
Method Features Extraction
Performance
(%)
Database Name
#Im
ag
es
Preci
sio
n
Recall
Yuan and
Ying 2014
- Colour and texture - 62 forensic
Corel
400
800 70
Chao-Yung
Hsu et al.
2013
Background
subtraction
algorithm
Scale-Invariant Feature
Transform (ASIFT) and
min-hash technique
85 - Three videos
203
vehicle object
images
Wen et al.
2005 - Colour, texture, and shape - - - -
Choraś 2013 - Grey Level Co-Occurrence
Matrix (GLCM), texture - -
fired bullets, firing pins,
extractor marks, ejector
marks, and cartridges
50
Shriram et al.
2015
Region Of
Interest (ROI)
Histogram, texture, entropy and Speeded-Up Robust Features
(SURF)
98 - - 250
Gulhane and Gurjar 2015
- Colour ,texture and shape - - - -
Aljarf and
Amin
2015
- Filtering algorithm and
Reconstructing algorithm median filter
- - -
Lee et al. 2011
- Scale-Invariant Feature
Transform (SIFT) 90 -
tattoo images
from
Michigan State Police
64,000
Xiao, Li and
Xu 2019 Yolov3 - 92 - - -
Sobhani and Straccia 2019
- -
GCIs Manually
London Riots
140
videos
91 96
82 78
GCIs Learned
75
60
96
71
81
evaluate the performance, or no comparison with other studies was performed
(e.g., Wen, Ph and Yu, 2005; Choraś, 2013; Shriram, Priyadarsini and Baskar,
2015; Gulhane and Gurjar, 2015 and Sobhani and Straccia, 2019). Moreover, the
special characteristics of forensic images are different from characteristics of
standard images; therefore, the image features that are suitable to describe
standard image databases are inefficient for forensics. For example, the
background of forensic photographs is typically far more complicated than those
used within the experimental studies, because the target object could be
damaged, deficient, or the object may appear small in the picture (Yuan and Ying,
2014). In addition, the clarity of images is an essential factor impact on the
accuracy of forensic image retrieval; however, some real-life images suffer from
noise, occlusions, rotation and various scale distortions, or losing blocks such as
losing a number of bits, when sending the image through a wireless channel, and
thus require enhancement before analysis (Aljarf and Amin, 2015; Rida et al.,
2019 and Xiao, Li and Xu, 2019). Manual image annotation is yet another
challenge, because annotating image manually needs a big effort, cost, time
consuming, etc. (Lee et al., 2011; Sobhani and Straccia, 2019).
In addition, this chapter critically analyses studies that concerned with retrieve
images for different objectives, such as object retrieval and automatic image
annotation to consider how such methods could be employed in the forensic
image analysis framework. However, in forensic image analysis, different
questions are asked by the investigator, and the images that need to be
investigated and analysed to extract evidence are usually huge, realistic
[unconstrained illumination conditions, unknown position, orientation, size, and
pattern of the marks, and irregular texture (background)], and contain multiple
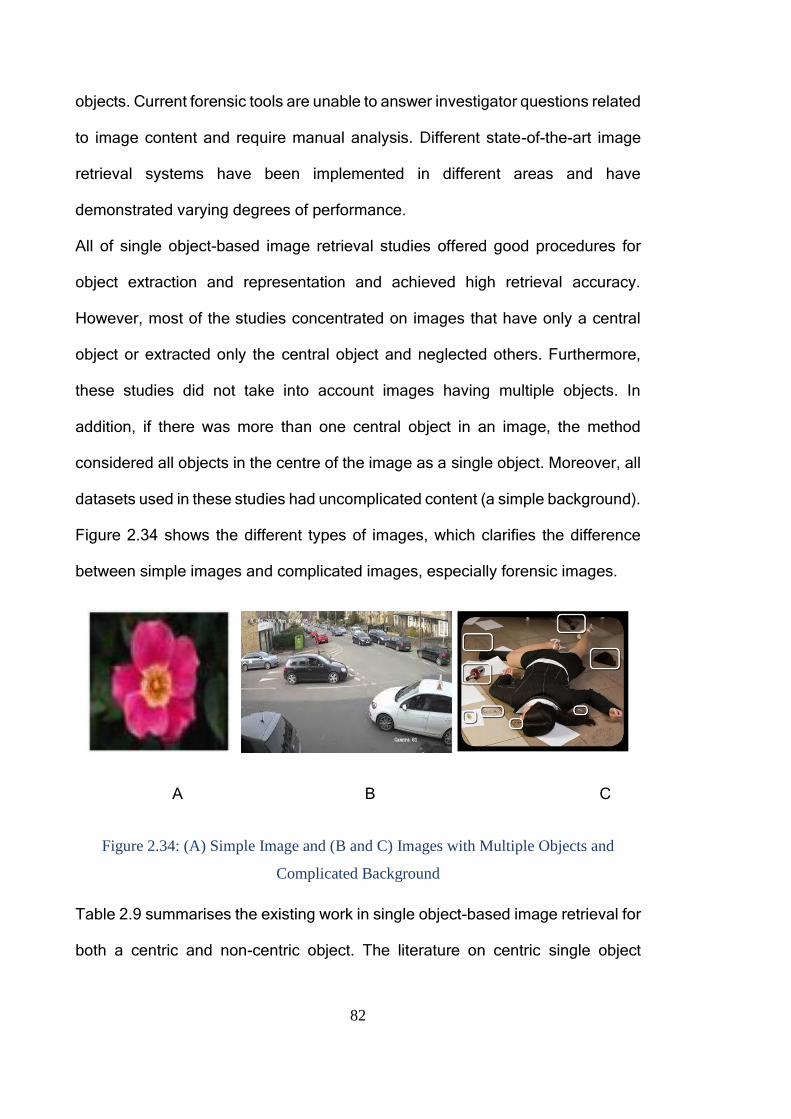
82
objects. Current forensic tools are unable to answer investigator questions related
to image content and require manual analysis. Different state-of-the-art image
retrieval systems have been implemented in different areas and have
demonstrated varying degrees of performance.
All of single object-based image retrieval studies offered good procedures for
object extraction and representation and achieved high retrieval accuracy.
However, most of the studies concentrated on images that have only a central
object or extracted only the central object and neglected others. Furthermore,
these studies did not take into account images having multiple objects. In
addition, if there was more than one central object in an image, the method
considered all objects in the centre of the image as a single object. Moreover, all
datasets used in these studies had uncomplicated content (a simple background).
Figure 2.34 shows the different types of images, which clarifies the difference
between simple images and complicated images, especially forensic images.
A B C
Figure 2.34: (A) Simple Image and (B and C) Images with Multiple Objects and
Complicated Background
Table 2.9 summarises the existing work in single object-based image retrieval for
both a centric and non-centric object. The literature on centric single object
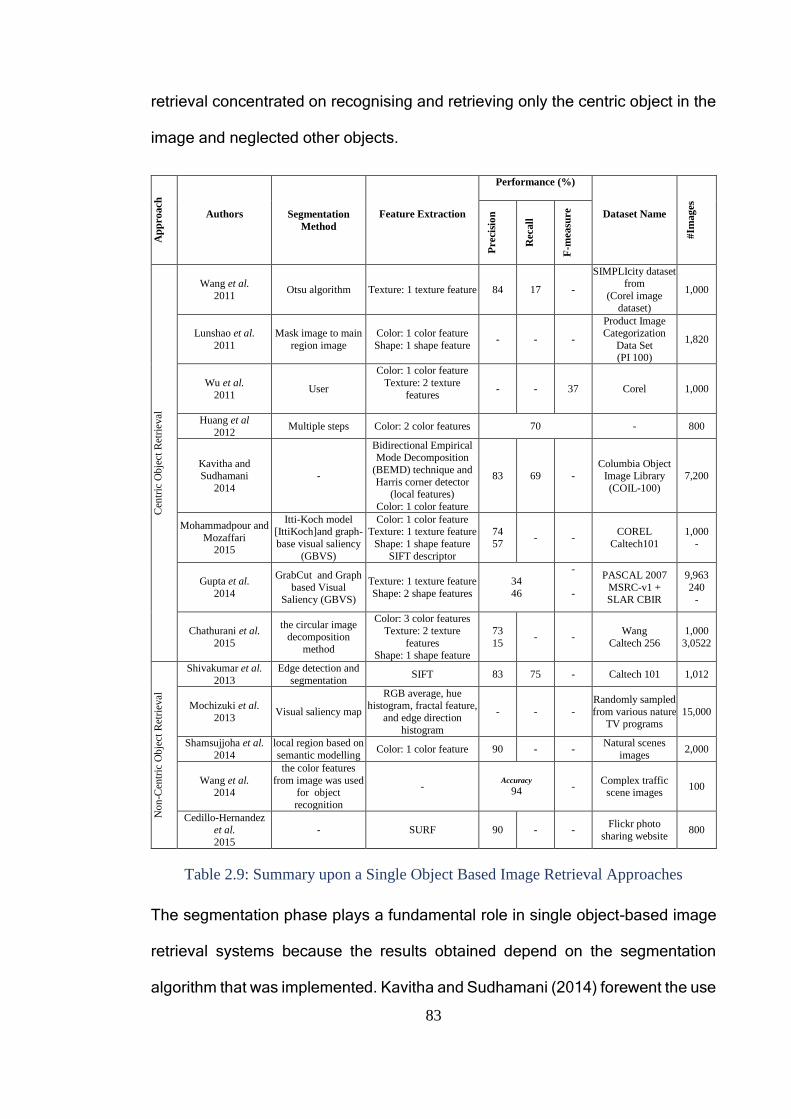
83
retrieval concentrated on recognising and retrieving only the centric object in the
image and neglected other objects. A
pp
ro
ach
Authors Segmentation
Method
Feature Extraction
Performance (%)
Dataset Name
#Im
ag
es
Preci
sio
n
Recall
F-m
easu
re
Cen
tric
Ob
ject
Ret
riev
al
No
n-C
entr
ic O
bje
ct R
etri
eval
Wang et al.
2011 Otsu algorithm Texture: 1 texture feature 84 17 -
SIMPLIcity dataset from
(Corel image
dataset)
1,000
Lunshao et al.
2011
Mask image to main
region image
Color: 1 color feature
Shape: 1 shape feature - - -
Product Image Categorization
Data Set (PI 100)
1,820
Wu et al.
2011 User
Color: 1 color feature
Texture: 2 texture
features
- -
37
Corel 1,000
Huang et al
2012 Multiple steps Color: 2 color features 70 - 800
Kavitha and Sudhamani
2014
-
Bidirectional Empirical Mode Decomposition
(BEMD) technique and
Harris corner detector (local features)
Color: 1 color feature
83 69 - Columbia Object
Image Library
(COIL-100)
7,200
Mohammadpour and
Mozaffari 2015
Itti-Koch model [IttiKoch]and graph-
base visual saliency
(GBVS)
Color: 1 color feature Texture: 1 texture feature
Shape: 1 shape feature
SIFT descriptor
74
57 - -
COREL
Caltech101
1,000
-
Gupta et al.
2014
GrabCut and Graph
based Visual Saliency (GBVS)
Texture: 1 texture feature
Shape: 2 shape features
34
46
-
-
PASCAL 2007
MSRC-v1 + SLAR CBIR
9,963
240 -
Chathurani et al.
2015
the circular image decomposition
method
Color: 3 color features
Texture: 2 texture
features Shape: 1 shape feature
73
15 - -
Wang
Caltech 256
1,000
3,0522
No
n-C
entr
ic O
bje
ct R
etri
eval
Shivakumar et al.
2013
Edge detection and
segmentation SIFT 83 75 - Caltech 101 1,012
Mochizuki et al.
2013 Visual saliency map
RGB average, hue histogram, fractal feature,
and edge direction
histogram
- - -
Randomly sampled
from various nature TV programs
15,000
Shamsujjoha et al.
2014
local region based on
semantic modelling Color: 1 color feature 90 - -
Natural scenes
images 2,000
Wang et al. 2014
the color features
from image was used for object
recognition
- Accuracy
94 - Complex traffic
scene images 100
Cedillo-Hernandez et al.
2015
- SURF 90 - - Flickr photo
sharing website 800
Table 2.9: Summary upon a Single Object Based Image Retrieval Approaches
The segmentation phase plays a fundamental role in single object-based image
retrieval systems because the results obtained depend on the segmentation
algorithm that was implemented. Kavitha and Sudhamani (2014) forewent the use
84
of a segmentation approach and treated the image as one piece. Their study
yielded a retrieval precision of 83.2% and 69.3% of recall as compared to other
studies that implemented an image segmentation phase in their systems.
However, interestingly, their approach can be helpful in the case of single-content
images. Unfortunately, this study is ineffective for use with forensic images,
because of the particular content of such images. In contrast, some studies
implemented the segmentation phase in their works to extract objects and
disregard the image background, such as Lunshao Chai et al. (2011) and
Mohammadpour and Mozaffari (2015). The aim of a segmentation approach that
focuses on the object itself rather than its background is to reduce the number of
features that need to be calculated for the object and background, consequently
reducing the time and memory size requirements that are required to deal with
these features. In a different study, Wu, Wang and Xing (2011) examined the
effect of enabling the user to select the object of interest from the image. This
approach of a manually selected object gives the user the opportunity to choose
an interesting object from the image; however, it increases the effort required to
select the correct objects and raises the possibility of an incorrect selection of the
object area.
With respect to the dataset, three studies examined their systems using the Corel
image dataset (1000 images), which are Wang et al. (2011), Wu, Wang and Xing
(2011) and Mohammadpour and Mozaffari (2015), and the performance were
84%, 37% and 74%, respectively. This diversion in performance returns to the
difference of object extraction and feature extraction methods, in addition to the
number of selected categories, which were 4, 10 and 8, respectively. Wang et al.
85
(2011) achieved the highest precision because they select only four categories to
evaluate their system performance.
Gupta, Das and Chakraborti (2014) and Chathurani et al. (2015) performed
experimental work on different types of datasets, and they reported different
results in terms of retrieval accuracy. In the study by Gupta, Das and Chakraborti
(2014), the retrieval precisions were 34% and 46% for the PASCAL (9963
images) and MSRC-V1 (240 images) datasets, respectively. In the study by
Chathurani et al. (2015), the precision values were 73% and 14% for the Wang
(1,000 images) and Caltech 265 (30,522 images) datasets, respectively. This is
expected because an increase in the number of images that need to be analysed
also leads to greater diversity in their contents, and thus the number of features
needed to describe these contents will also increase. This, in turn, means that the
feature extraction and comparison process to retrieve relevant images will be
more complicated, and so the retrieval accuracy will be more inefficient.
Within the context of object extraction, non-centric single object-based image
retrieval studies have endeavoured to solve the problem of the object
centralization condition in centric object studies. Some of these studies achieved
more than 89% retrieval precision when tested on natural images, such as
Shamsujjoha et al. (2014) and Wang, Mohamad and Ismail (2014). Shamsujjoha
et al. (2014) performed an experimental investigation on a natural scenes image
dataset (3,000 images) and the resulting degree of precision was 90%. Wang,
Mohamad and Ismail (2014) proposed a system to deal with complex traffic scene
images (using only 100 vehicles) and achieved a great retrieval precision of 94%.
Although these studies reported many interesting results, the main limitations of
them are the attention on images having a single main object only and the
86
experiments for these studies were conducted on only a small number of images.
Regarding the discussion and analysis of multiple objects- based image retrieval
papers (as illustrated in Table 2.10), Hanh and Ngoc (2012) studied the extraction
of objects in street scene images by implementing the Hmax detector and colour
feature as object segmentation and feature extraction techniques, respectively.
This study achieved 89.79% retrieval precision using the proposed method. A
lower precision value was achieved by Chen, Zhang and Gao (2012), who used
a multi-resolution hierarchical segmentation algorithm as the segmentation
algorithm. However, their study was tested on 1,000 images, and the average
segmentation efficiency was 98.26%. As such, the segmentation approach
implemented in this study was more robust. With the same objective,
Muralidharan et al. (2015) used two different approaches, the active contour
model and superpixel over-segmentation, to extract multiple objects from various
complex scenes in order to improve the results when extracting the complete set
of salient sub-regions for an image. In another study, Chamasemani et al. (2015)
achieved high accuracy in extracting objects from a video frame by employing an
adaptive background subtraction method. However, many small areas were
extracted that represented non-valuable objects along with main objects. These
useless objects have an effect on system retrieval accuracy. With respect to the
contribution of multiple object-based image retrieval studies, it is obvious that the
resulting outcomes can be employed for forensic image analysis to retrieve all
images that have the same objects at one time. This could contribute to finding
the relations among objects, and thus may help to solve the crime.
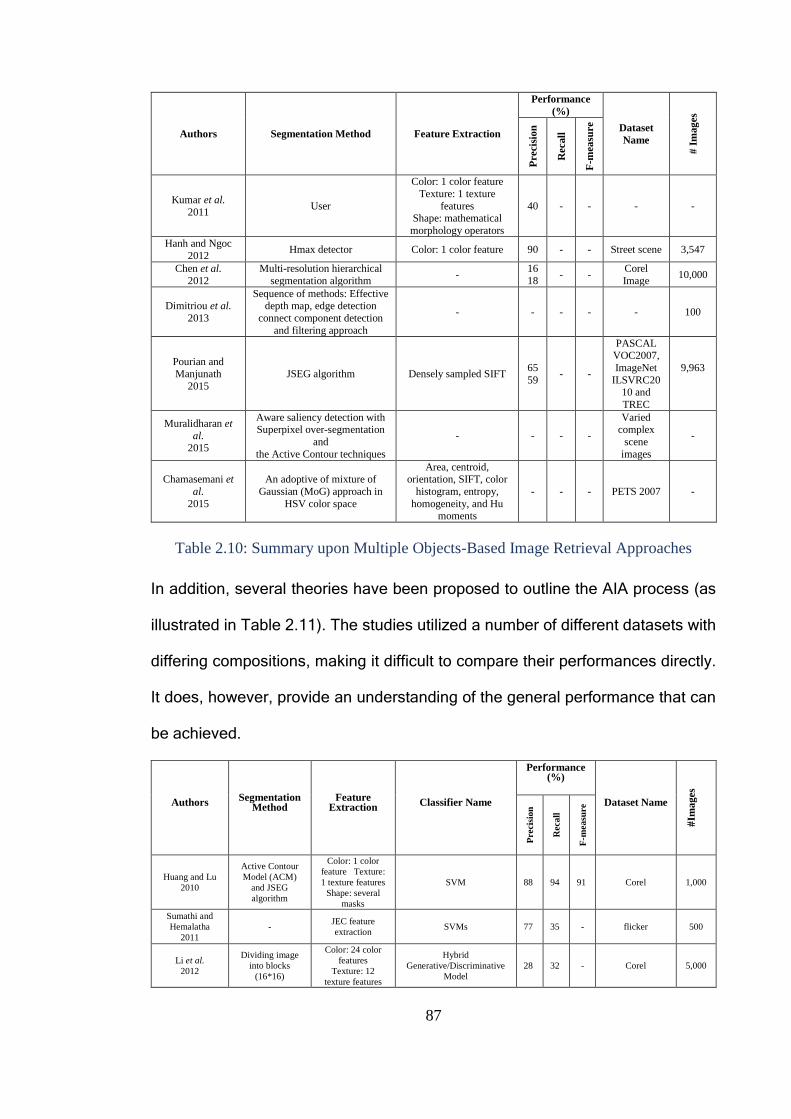
87
Authors Segmentation Method Feature Extraction
Performance
(%)
Dataset
Name
# I
mag
es
Preci
sio
n
Recall
F-m
easu
re
Kumar et al.
2011 User
Color: 1 color feature
Texture: 1 texture
features Shape: mathematical
morphology operators
40 - - - -
Hanh and Ngoc
2012 Hmax detector Color: 1 color feature 90 - - Street scene 3,547
Chen et al.
2012
Multi-resolution hierarchical
segmentation algorithm -
16
18 - -
Corel
Image 10,000
Dimitriou et al.
2013
Sequence of methods: Effective depth map, edge detection
connect component detection
and filtering approach
- - - - - 100
Pourian and
Manjunath
2015
JSEG algorithm Densely sampled SIFT 65
59 - -
PASCAL VOC2007,
ImageNet
ILSVRC2010 and
TREC
9,963
Muralidharan et
al. 2015
Aware saliency detection with Superpixel over-segmentation
and
the Active Contour techniques
- - - -
Varied complex
scene
images
-
Chamasemani et
al.
2015
An adoptive of mixture of
Gaussian (MoG) approach in
HSV color space
Area, centroid, orientation, SIFT, color
histogram, entropy,
homogeneity, and Hu moments
- - - PETS 2007 -
Table 2.10: Summary upon Multiple Objects-Based Image Retrieval Approaches
In addition, several theories have been proposed to outline the AIA process (as
illustrated in Table 2.11). The studies utilized a number of different datasets with
differing compositions, making it difficult to compare their performances directly.
It does, however, provide an understanding of the general performance that can
be achieved.
Authors Segmentation
Method Feature
Extraction Classifier Name
Performance (%)
Dataset Name
Im
ages
Precis
ion
Recall
F-m
easu
re
Huang and Lu
2010
Active Contour
Model (ACM)
and JSEG
algorithm
Color: 1 color
feature Texture:
1 texture features
Shape: several
masks
SVM 88 94 91 Corel 1,000
Sumathi and
Hemalatha
2011
- JEC feature
extraction SVMs 77 35 - flicker 500
Li et al.
2012
Dividing image
into blocks
(16*16)
Color: 24 color
features
Texture: 12
texture features
Hybrid
Generative/Discriminative
Model
28 32 - Corel 5,000
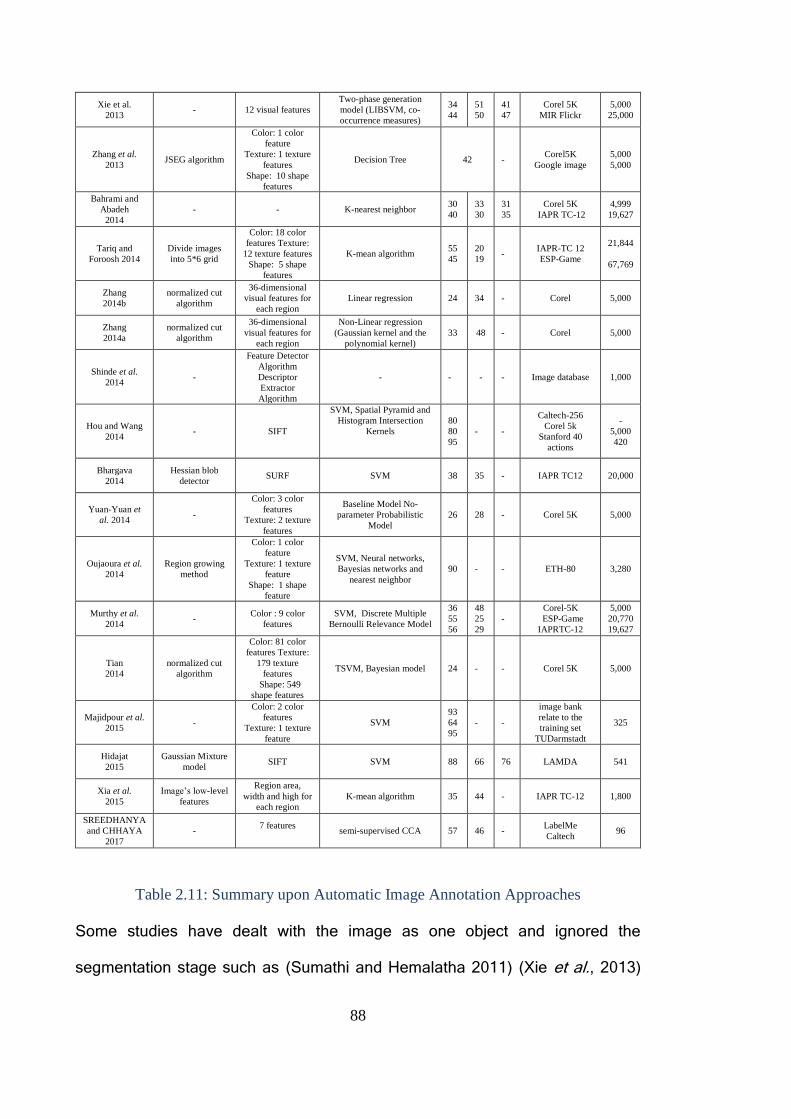
88
Xie et al.
2013 - 12 visual features
Two-phase generation
model (LIBSVM, co-
occurrence measures)
34
44
51
50
41
47
Corel 5K
MIR Flickr
5,000
25,000
Zhang et al.
2013 JSEG algorithm
Color: 1 color
feature
Texture: 1 texture
features
Shape: 10 shape
features
Decision Tree 42 - Corel5K
Google image
5,000
5,000
Bahrami and
Abadeh
2014
- - K-nearest neighbor 30
40
33
30
31
35
Corel 5K
IAPR TC-12
4,999
19,627
Tariq and
Foroosh 2014
Divide images
into 5*6 grid
Color: 18 color
features Texture:
12 texture features
Shape: 5 shape
features
K-mean algorithm 55
45
20
19 -
IAPR-TC 12
ESP-Game
21,844
67,769
Zhang
2014b
normalized cut
algorithm
36-dimensional
visual features for
each region
Linear regression 24 34 - Corel 5,000
Zhang
2014a
normalized cut
algorithm
36-dimensional
visual features for
each region
Non-Linear regression
(Gaussian kernel and the
polynomial kernel)
33 48 - Corel 5,000
Shinde et al.
2014 -
Feature Detector
Algorithm
Descriptor
Extractor
Algorithm
- - - - Image database 1,000
Hou and Wang
2014 - SIFT
SVM, Spatial Pyramid and
Histogram Intersection
Kernels
80
80
95
- -
Caltech-256
Corel 5k
Stanford 40
actions
-
5,000
420
Bhargava
2014
Hessian blob
detector SURF SVM 38 35 - IAPR TC12 20,000
Yuan-Yuan et
al. 2014 -
Color: 3 color
features
Texture: 2 texture
features
Baseline Model No-
parameter Probabilistic
Model
26 28 - Corel 5K 5,000
Oujaoura et al.
2014
Region growing
method
Color: 1 color
feature
Texture: 1 texture
feature
Shape: 1 shape
feature
SVM, Neural networks,
Bayesias networks and
nearest neighbor
90 - - ETH-80 3,280
Murthy et al.
2014 -
Color : 9 color
features
SVM, Discrete Multiple
Bernoulli Relevance Model
36
55
56
48
25
29
-
Corel-5K
ESP-Game
IAPRTC-12
5,000
20,770
19,627
Tian
2014
normalized cut
algorithm
Color: 81 color
features Texture:
179 texture
features
Shape: 549
shape features
TSVM, Bayesian model 24 - - Corel 5K 5,000
Majidpour et al.
2015 -
Color: 2 color
features
Texture: 1 texture
feature
SVM
93
64
95
- -
image bank
relate to the
training set
TUDarmstadt
325
Hidajat
2015
Gaussian Mixture
model SIFT SVM 88 66 76 LAMDA 541
Xia et al.
2015
Image’s low-level
features
Region area,
width and high for
each region
K-mean algorithm 35 44 - IAPR TC-12 1,800
SREEDHANYA
and CHHAYA
2017
- 7 features
semi-supervised CCA 57 46 -
LabelMe
Caltech 96
Table 2.11: Summary upon Automatic Image Annotation Approaches
Some studies have dealt with the image as one object and ignored the
segmentation stage such as (Sumathi and Hemalatha 2011) (Xie et al., 2013)
89
(Bahrami and Abadeh 2014) (Hou and Wang 2014) (Yuan-Yuan et al., 2014)
(Murthy, Can and Manmatha, 2014) (Majidpour et al., 2015) and (SREEDHANYA
and CHHAYA 2017). The highest P was achieved by the studies (Sumathi and
Hemalatha 2011) (Majidpour et al., 2015) and (SREEDHANYA and CHHAYA
2017) that utilized a small set of images to evaluate their performance. Indeed, it
appears that as the size of the dataset increases, the retrieval accuracy
decreases. This suggests results are particularly sensitive to the nature,
composition and size of the dataset. This finding is also repeated in the study that
employed the segmentation algorithm such as (Hidajat, 2015). This is expected
because an increase in the number of images that need to be analysed also leads
to greater diversity in their contents, and thus the number of features needed to
describe these contents will also increase. This, in turn, means that the feature
extraction and comparison process to retrieve relevant images will be more
complicated, and so the retrieval accuracy will be more inefficient.
With respect to the dataset, several authors examined their systems using the
Corel 5k dataset (Li et al., 2012), (Xie et al., 2013), (Zhang, Monirul Islam and Lu,
2013), (Bahrami and Abadeh 2014), (Zhang, 2014b), (Zhang, 2014a), (Hou and
Wang 2014), (Yuan-Yuan et al., 2014), (Murthy, Can and Manmatha, 2014) and
(Tian, 2014). The study (Hou and Wang, 2014) achieved 80% P, which is higher
than the results of other studies using the same dataset with a single or double
classifier(s). This can be explained by the fact that multiple classifiers can improve
accuracy results by combining the advantages of all implemented classifiers. In
addition, the use of multiple classifiers affords the chance to generate different
results that can be fused together in order to achieve high accuracy of annotation
results. (Zhang, 2014a), (Zhang, 2014b) and (Tian, 2014) used the same dataset
90
(Corel 5k) and segmentation method (the normalized cut algorithm) and their P
were 33%, 24%, and 24% respectively. These varying results can be attributed
to using different types of classifiers and variation in feature extraction methods.
The research studies by(Zhang, 2014a) and (Zhang, 2014b) and applied the
same segmentation approach, feature extraction methods and dataset (Corel 5K)
the former study reported 33% P and 48% R using non-linear regression for the
classification task, while the latter utilized linear regression. The prior researches
demonstrate the performance that can be achieved can vary considerably,
between classifiers and even with the same segmentation and feature extraction
approach and dataset. It is, therefore, challenging to really understand the extent
to which this approach works in practice.
On another note, (Hidajat, 2015) (Sumathi and Hemalatha 2011) (Oujaoura,
Minaoui and Fakir, 2014) and (SREEDHANYA and CHHAYA 2017) offered good
procedures for AIA and achieved high retrieval accuracy. However, these studies
have been typically evaluated against datasets with a specific focus. They do not
have the complexity and diversity that one might expect with a forensic
investigation. The need for diversity and complexity in the forensic investigation
comes from the diversity of cases that need to be solved which lead to the
diversity of images contents that required to be analysed in order to find the
evidence thereby solve the crime.
As demonstrated above, AIA studies suffer from multiple problems. First, there is
no standard annotation database for performance testing. Second, there is a
disparity in system performance, because of the divergence in segmentation,
features, and classifier approaches, as well as the number of images used in the
assessment. Third, most studies conduct experiments using unrealistic image
91
databases. Datasets that are unrelated to real-life complex and diverse imagery
as would be expected in a forensic case. This makes it impossible to determine
whether these studies would achieve a high performance in forensic image
analysis.
The forensic examiner needs an automatic system that is able to recognise
multiple objects in the same image, although these objects may differ in size,
colour, shape, texture, and orientation. In addition, this system should contain a
fast search engine that will swiftly retrieve all images that correspond to the
examiner’s requirements. In most investigations, the examiner does not have a
query image; therefore, image-based retrieval techniques are useless.
Consequently, keyword searching based on image content must be employed to
find the target images. An AIA system could thus be used instead of an image-
based retrieval system in order to describe images with words in place of using
image features. This will improve the search process and solve problems
presented by image-based retrieval system.
For forensic image analysis, it will be useful to examine different multiple object
segmentation algorithms that have the ability to recognise different objects with
different characteristics from the image, in order to improve the object extraction
process. Then, various feature extraction methods that reflect all characteristics
of an object, such as colour, texture, and shape along with size and orientation,
should be applied. As a result, multiple AIA systems should be employed and
their outputs fused in order to improve the accuracy of annotation results over the
results that can be achieved through employment of a single annotation system.
92
2.10 Conclusion
Images are one of the best forms of electronic evidence and play an important
role in the investigation of crimes because they show the exact details of what
has occurred. Therefore, images can be considered as a real-time eyewitness to
any crime. So far, however, there has been little work performed on the subject
of extracting evidence from images or solving criminal cases through forensic
image analysis. Moreover, very little studies are able to overcome the challenges
of finding and discovering forensically interesting and suspicious or beneficial
patterns within huge datasets while taking into account the requirements of
accuracy and speed.
Several studies from different perspectives have been proposed to solve the
problems of object retrieval and automatic image annotation associated with
image retrieval systems. Overall, it is difficult to make adequate comparisons
among the performance of the reviewed studies, because of variations in the
databases used in the experiments, and the different methods used by the
authors for feature extraction, segmentation, and classification in their proposed
systems. Some studies achieved high retrieval accuracy; however, there is still
the problem that none of these studies tested images related to forensic cases.
This makes it impossible to determine whether these systems could also achieve
high precision in forensic image analysis in low processing time.
93
3 Evaluation of a Multi-Algorithmic Approach Performance
3.1 Introduction
Chapter 2 has shown that existing AIA studies suffer from multiple problems.
Further, images extracted from different sources to solve crime are considerable
and changeable, which leads to difficulty building individual AIA system for each
case or building general AIA system to describe precisely the varied image
content. In addition to what has been mentioned, the ability of an investigator to
search based on keywords (an approach that already exists within forensic tools
for character-based evidence) provides a simple and effective approach to
identify relevant imagery. Moreover, many commercial computer vision API
systems have been designed by big players in the market (e.g. Google,
Microsoft). However, there is little evidence or literature to suggest how well these
systems work and to what extent the problems that exist within the academic
literature still remain.
All these problems and issues need to be solved through evaluating existing
commercial systems and introducing a fusion of multiple commercial computer
vision API systems to improve the annotation performance of forensic images and
overcome complex issues in AIA studies.
This chapter presents the understanding and evaluation of the performance of
the current computer vision API systems using real-life imagery and proposes a
multi-algorithmic approach to improve the image annotation performance. The
objective of using commercial systems over developing a system is the benefit of
using the latest developments in image analysis without having to develop and
manage the system and undertaking the aforementioned problems. Moreover,
94
the reasons for using the multi-algorithmic approach are to increase annotation
accuracy, improve the retrieval performance, and collect different annotations for
the same image (synonyms for the same object such as car and vehicle).
3.2 Research Hypothesis
It is clear from previous art that research in AIA has been undertaken independent
of the forensic domain and significant progress has been made as illustrated in
Chapter 2. This raised the question of the extent to which existing commercial
systems could be of benefit in digital forensics—where the nature of the imagery
being analysed is far more complicated than has been used in prior studies.
Therefore, the initial goal was to evaluate the performance of commercial
systems. An extension of this investigation was also to explore how the
performance would be affected by fusion. Because of missing annotations or
indeed having the incorrect classified annotation in the dataset. Therefore, a
further experiment was undertaken. Three experiments were conducted with the
aim of:
Experiment 1: understanding and evaluating the performance of the current
commercial systems using real-life imagery.
Experiment 2: determining whether a multi-algorithmic approach of the
aforementioned commercial systems would improve the performance.
Experiment 3: re-evaluating the performance based on a more robust dataset.
The following sections describe each experiment and show the results, followed
by an overall discussion.
95
3.3 Understand and Evaluate the Performance of Commercial
Systems
The purpose of this experiment was to evaluate the performance of commercial
systems to determine their accuracy and ability to comprehensively annotate
images in a forensic context (rather than simply single-object imagery, which is
typically the case). Several commercial providers were identified: Microsoft
Cognitive Services (Computer Vision API) (Microsoft Cognitive Services, 2017),
Google Cloud Vision API (Google Cloud Platform, 2017), Imagga (Imagga.com,
2016) and Clarifai (Calrifai, 2018). These systems were chosen because they
represent the top computer vision API and their mean_tags_count, which is the
number of labels for each image on average, is 6.00, 8.50, 50.00, and 20.00 for
Microsoft, Google Cloud, Imagga and Clarifai, respectively (Yao, 2017). In
addition, Clarifai has the strongest concept modelling while Google Cloud Vision
API has the best scene detection and sentiment analysis system (Scott Domes,
2017).
The aim of using multiple systems was to benefit from the distinct capabilities of
each system. Also, commercial computer vision APIs were selected because
their use as a whole will provide the following requirements (Janus, 2016;
Bobriakov, 2018 and Filestack, 2019):
1. Accepted various image formats.
2. Supported different languages.
3. Determined the dominant colour.
4. Ability to tag different areas of images such as “general”, “NSFW”,
“weddings”, “travel”, and “food,” and also tag video.
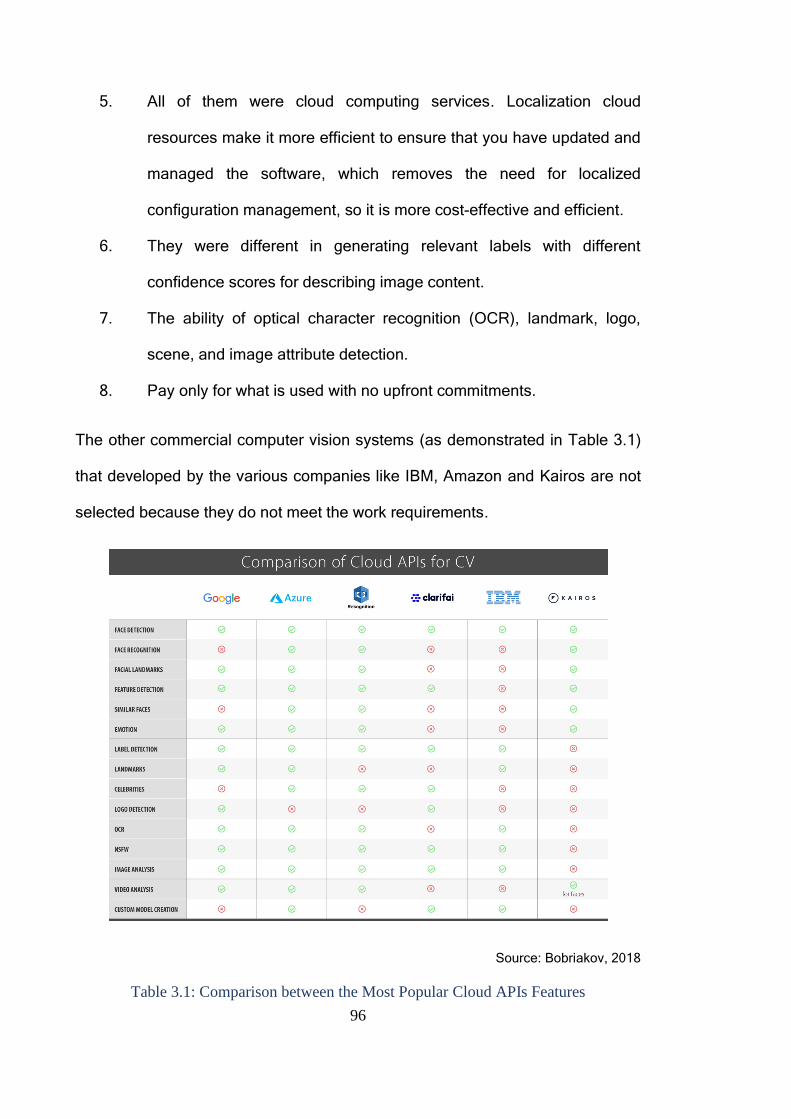
96
5. All of them were cloud computing services. Localization cloud
resources make it more efficient to ensure that you have updated and
managed the software, which removes the need for localized
configuration management, so it is more cost-effective and efficient.
6. They were different in generating relevant labels with different
confidence scores for describing image content.
7. The ability of optical character recognition (OCR), landmark, logo,
scene, and image attribute detection.
8. Pay only for what is used with no upfront commitments.
The other commercial computer vision systems (as demonstrated in Table 3.1)
that developed by the various companies like IBM, Amazon and Kairos are not
selected because they do not meet the work requirements.
Source: Bobriakov, 2018
Table 3.1: Comparison between the Most Popular Cloud APIs Features
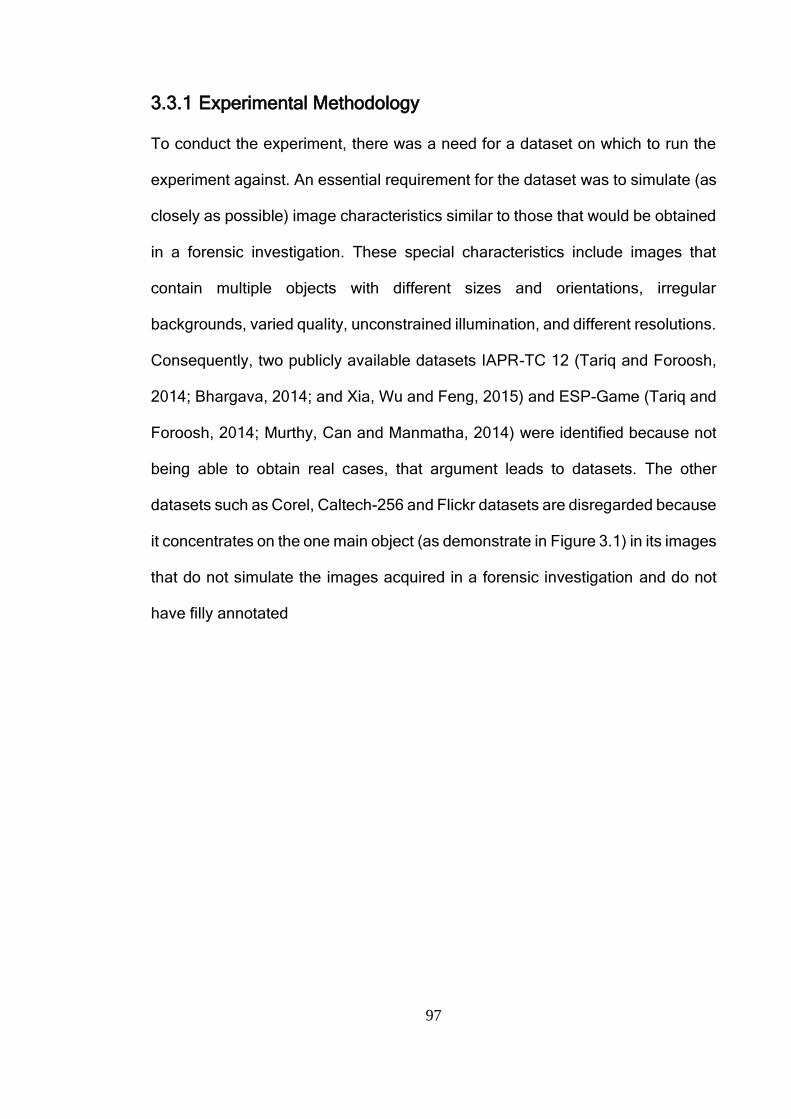
97
3.3.1 Experimental Methodology
To conduct the experiment, there was a need for a dataset on which to run the
experiment against. An essential requirement for the dataset was to simulate (as
closely as possible) image characteristics similar to those that would be obtained
in a forensic investigation. These special characteristics include images that
contain multiple objects with different sizes and orientations, irregular
backgrounds, varied quality, unconstrained illumination, and different resolutions.
Consequently, two publicly available datasets IAPR-TC 12 (Tariq and Foroosh,
2014; Bhargava, 2014; and Xia, Wu and Feng, 2015) and ESP-Game (Tariq and
Foroosh, 2014; Murthy, Can and Manmatha, 2014) were identified because not
being able to obtain real cases, that argument leads to datasets. The other
datasets such as Corel, Caltech-256 and Flickr datasets are disregarded because
it concentrates on the one main object (as demonstrate in Figure 3.1) in its images
that do not simulate the images acquired in a forensic investigation and do not
have filly annotated
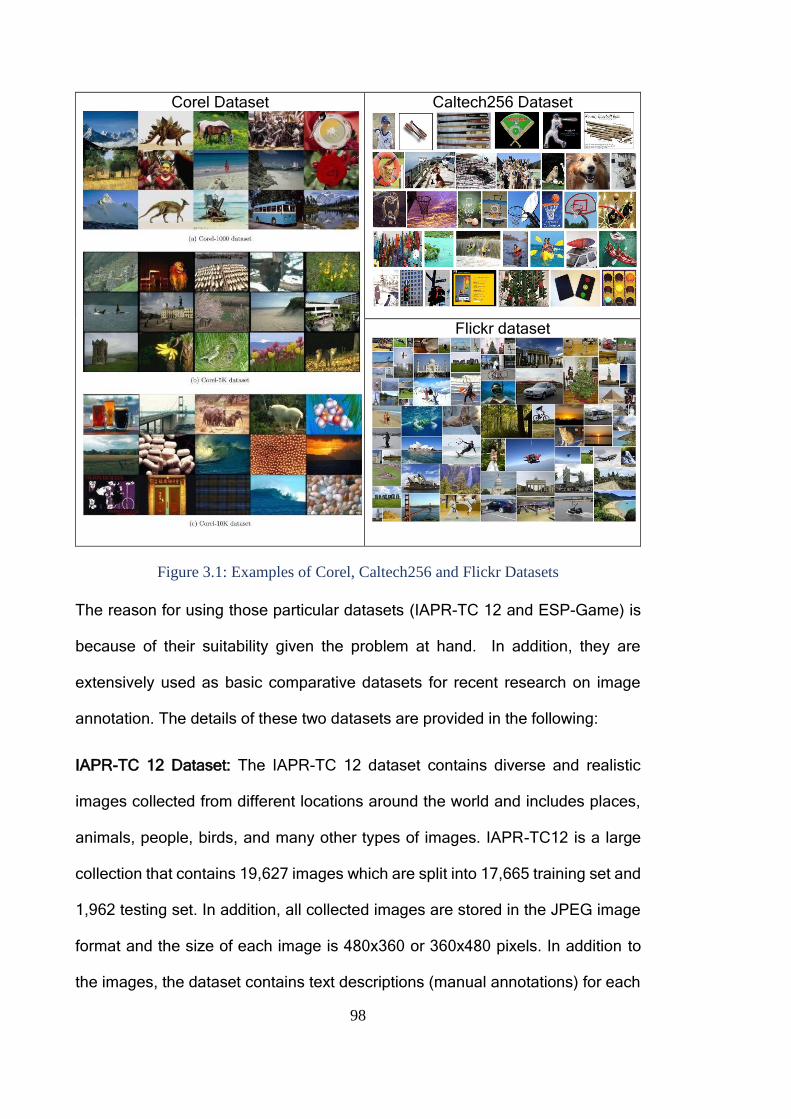
98
Corel Dataset
Caltech256 Dataset
Flickr dataset
Figure 3.1: Examples of Corel, Caltech256 and Flickr Datasets
The reason for using those particular datasets (IAPR-TC 12 and ESP-Game) is
because of their suitability given the problem at hand. In addition, they are
extensively used as basic comparative datasets for recent research on image
annotation. The details of these two datasets are provided in the following:
IAPR-TC 12 Dataset: The IAPR-TC 12 dataset contains diverse and realistic
images collected from different locations around the world and includes places,
animals, people, birds, and many other types of images. IAPR-TC12 is a large
collection that contains 19,627 images which are split into 17,665 training set and
1,962 testing set. In addition, all collected images are stored in the JPEG image
format and the size of each image is 480x360 or 360x480 pixels. In addition to
the images, the dataset contains text descriptions (manual annotations) for each
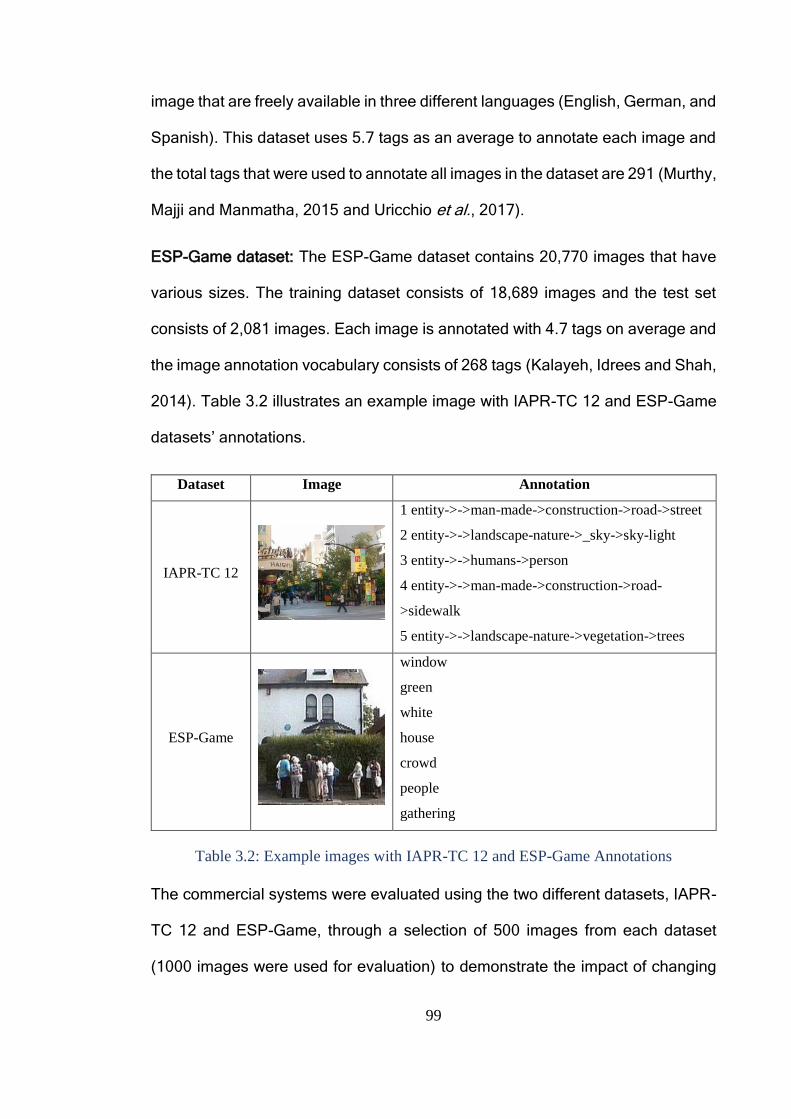
99
image that are freely available in three different languages (English, German, and
Spanish). This dataset uses 5.7 tags as an average to annotate each image and
the total tags that were used to annotate all images in the dataset are 291 (Murthy,
Majji and Manmatha, 2015 and Uricchio et al., 2017).
ESP-Game dataset: The ESP-Game dataset contains 20,770 images that have
various sizes. The training dataset consists of 18,689 images and the test set
consists of 2,081 images. Each image is annotated with 4.7 tags on average and
the image annotation vocabulary consists of 268 tags (Kalayeh, Idrees and Shah,
2014). Table 3.2 illustrates an example image with IAPR-TC 12 and ESP-Game
datasets’ annotations.
Dataset Image Annotation
IAPR-TC 12
1 entity->->man-made->construction->road->street
2 entity->->landscape-nature->_sky->sky-light
3 entity->->humans->person
4 entity->->man-made->construction->road-
>sidewalk
5 entity->->landscape-nature->vegetation->trees
ESP-Game
window
green
white
house
crowd
people
gathering
Table 3.2: Example images with IAPR-TC 12 and ESP-Game Annotations
The commercial systems were evaluated using the two different datasets, IAPR-
TC 12 and ESP-Game, through a selection of 500 images from each dataset
(1000 images were used for evaluation) to demonstrate the impact of changing
100
image content on the systems’ performance. This number of images (1000
images) is appropriate to get sufficient evaluation and show the variation between
the systems’ performance. It also proves the concept of the multi-algorithmic
approach (Experiment 2) is successful to achieve better performance than other
systems when using 1000 images; it will succeed when using a larger number of
images. Images were selected based on content diversity to get a varied
collection of images and obtain a reliable assessment, such as human
photographs, landscapes, public places, traffic, animals, clothes, tools, etc. The
vocabulary sizes for the IAPR-TC 12 and ESP-Game datasets are 153 and 752
words, respectively.
Four software development kit (SDK) script, three program scripts were written in
Microsoft Visual Studio Python (Google Cloud Vision API, Imagga, and Clarifai),
and one program script was written in Microsoft Visual Studio C# (Microsoft
Computer Vision API) were used to generate annotations. After that, various
changes should be carried out on each script depending on the system
requirements, such as installing different libraries, such as the client library and
changing or adding steps in the script in order to perform image label detection
requests for each image and saving the response in JavaScript Object Notation
(JSON) format as a text file. Additionally, four Microsoft Visual Studio Python
scripts were also written to evaluate the system's performance.
Each system provides a result that has a special form as compared to other
annotation systems’ results (as illustrated in Table 3.3). The difference appears
in the number of words used to annotate the image and in the output style of these
annotations in addition to the extra information.
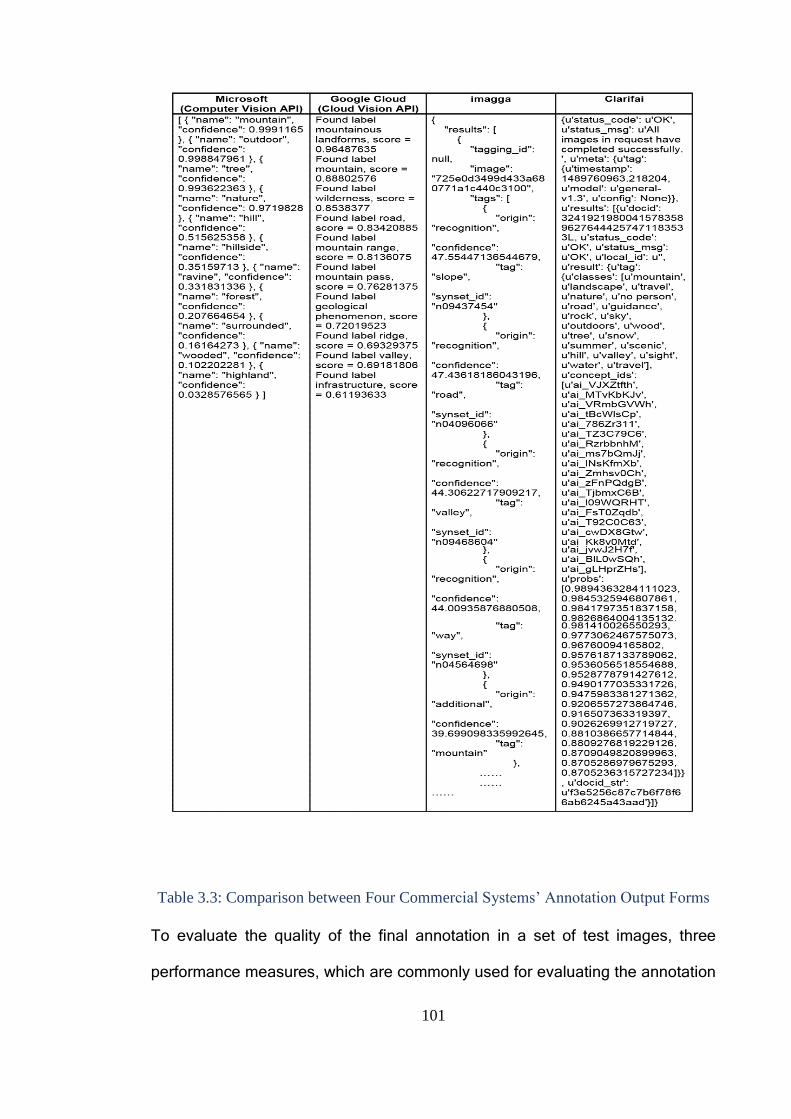
101
Table 3.3: Comparison between Four Commercial Systems’ Annotation Output Forms
To evaluate the quality of the final annotation in a set of test images, three
performance measures, which are commonly used for evaluating the annotation
102
performance, were used. Precision and recall per word were calculated based on
equations 5 and 6, respectively
𝑝𝑟𝑒𝑐𝑖𝑠𝑖𝑜𝑛 = 𝐵/𝐴 (5)
𝑟𝑒𝑐𝑎𝑙𝑙 = 𝐵/𝐶 (6)
where A is the number of images automatically annotated with a given keyword;
B is the number of images correctly annotated with that keyword; and
C is the number of images having that keyword in the ground truth-based
annotation
After that, average precision (AP) and average recall (AR) were used to
summarise the performance of each system, then the F-measure value, which
describes the semantic level, was also calculated. Two lists of words, 93 words
and 366 words from the IAPR-TC 12 and ESP-Game datasets were extracted
depending on truth-based annotation after excluding the unused words by the
four systems, respectively.
3.3.2 Results
Four commercial systems were used to produce annotations per image with
different probability scores. Each systems’ performance was compared to others
for each dataset. The following two sections outline the results and their analyses
for all systems depending on the dataset name that was employed for evaluating
the performance.
IAPR-TC 12 dataset: all systems provide suitable annotation results. The
precision and recall per word (93 words) for each system was computed, then
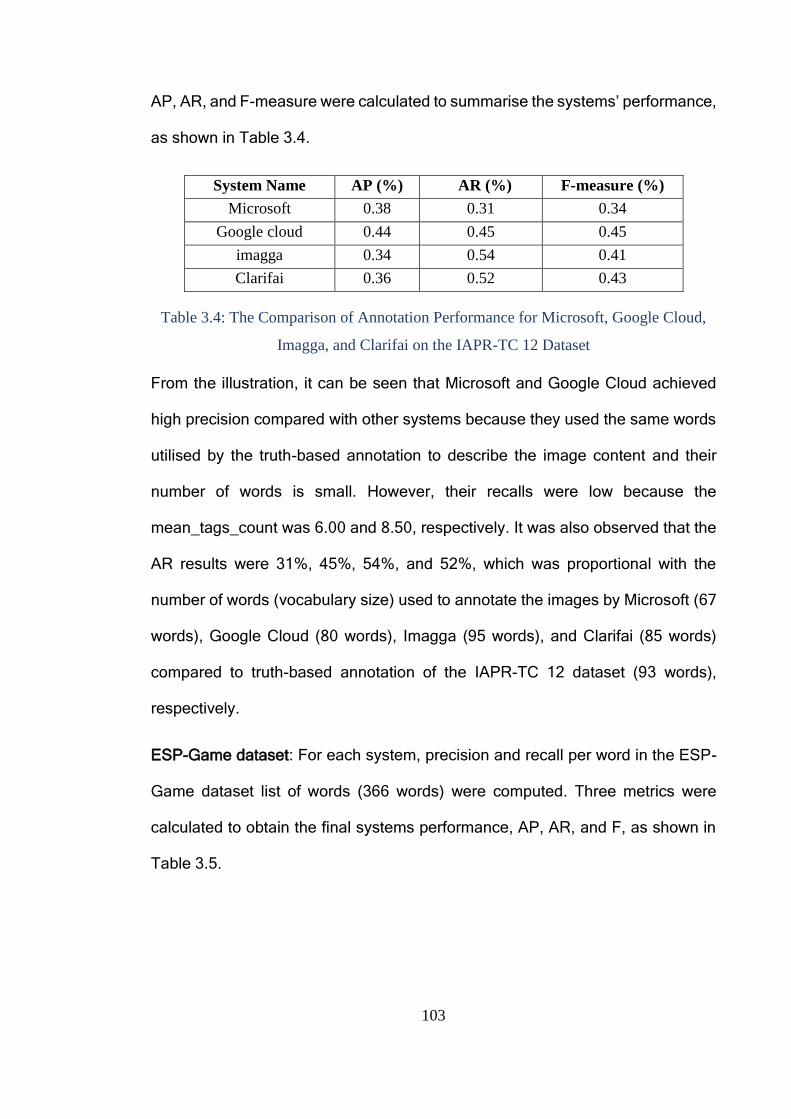
103
AP, AR, and F-measure were calculated to summarise the systems’ performance,
as shown in Table 3.4.
System Name AP (%) AR (%) F-measure (%)
Microsoft 0.38 0.31 0.34
Google cloud 0.44 0.45 0.45
imagga 0.34 0.54 0.41
Clarifai 0.36 0.52 0.43
Table 3.4: The Comparison of Annotation Performance for Microsoft, Google Cloud,
Imagga, and Clarifai on the IAPR-TC 12 Dataset
From the illustration, it can be seen that Microsoft and Google Cloud achieved
high precision compared with other systems because they used the same words
utilised by the truth-based annotation to describe the image content and their
number of words is small. However, their recalls were low because the
mean_tags_count was 6.00 and 8.50, respectively. It was also observed that the
AR results were 31%, 45%, 54%, and 52%, which was proportional with the
number of words (vocabulary size) used to annotate the images by Microsoft (67
words), Google Cloud (80 words), Imagga (95 words), and Clarifai (85 words)
compared to truth-based annotation of the IAPR-TC 12 dataset (93 words),
respectively.
ESP-Game dataset: For each system, precision and recall per word in the ESP-
Game dataset list of words (366 words) were computed. Three metrics were
calculated to obtain the final systems performance, AP, AR, and F, as shown in
Table 3.5.
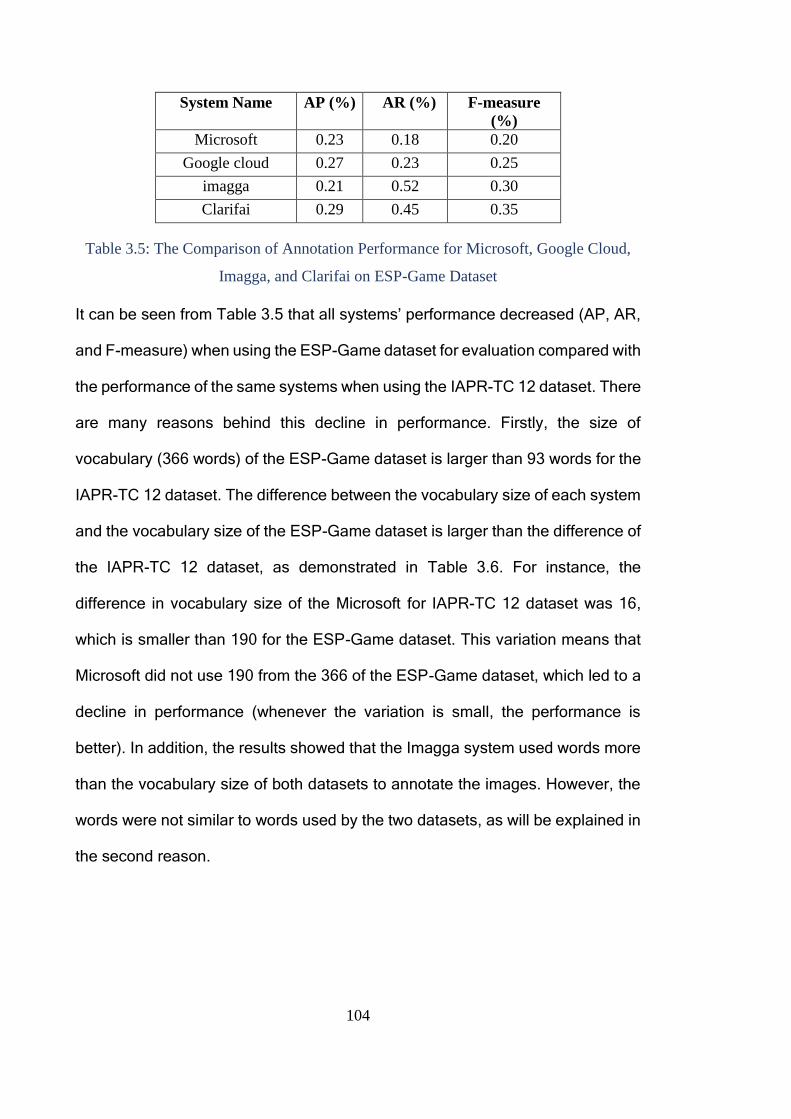
104
System Name AP (%) AR (%) F-measure
(%)
Microsoft 0.23 0.18 0.20
Google cloud 0.27 0.23 0.25
imagga 0.21 0.52 0.30
Clarifai 0.29 0.45 0.35
Table 3.5: The Comparison of Annotation Performance for Microsoft, Google Cloud,
Imagga, and Clarifai on ESP-Game Dataset
It can be seen from Table 3.5 that all systems’ performance decreased (AP, AR,
and F-measure) when using the ESP-Game dataset for evaluation compared with
the performance of the same systems when using the IAPR-TC 12 dataset. There
are many reasons behind this decline in performance. Firstly, the size of
vocabulary (366 words) of the ESP-Game dataset is larger than 93 words for the
IAPR-TC 12 dataset. The difference between the vocabulary size of each system
and the vocabulary size of the ESP-Game dataset is larger than the difference of
the IAPR-TC 12 dataset, as demonstrated in Table 3.6. For instance, the
difference in vocabulary size of the Microsoft for IAPR-TC 12 dataset was 16,
which is smaller than 190 for the ESP-Game dataset. This variation means that
Microsoft did not use 190 from the 366 of the ESP-Game dataset, which led to a
decline in performance (whenever the variation is small, the performance is
better). In addition, the results showed that the Imagga system used words more
than the vocabulary size of both datasets to annotate the images. However, the
words were not similar to words used by the two datasets, as will be explained in
the second reason.
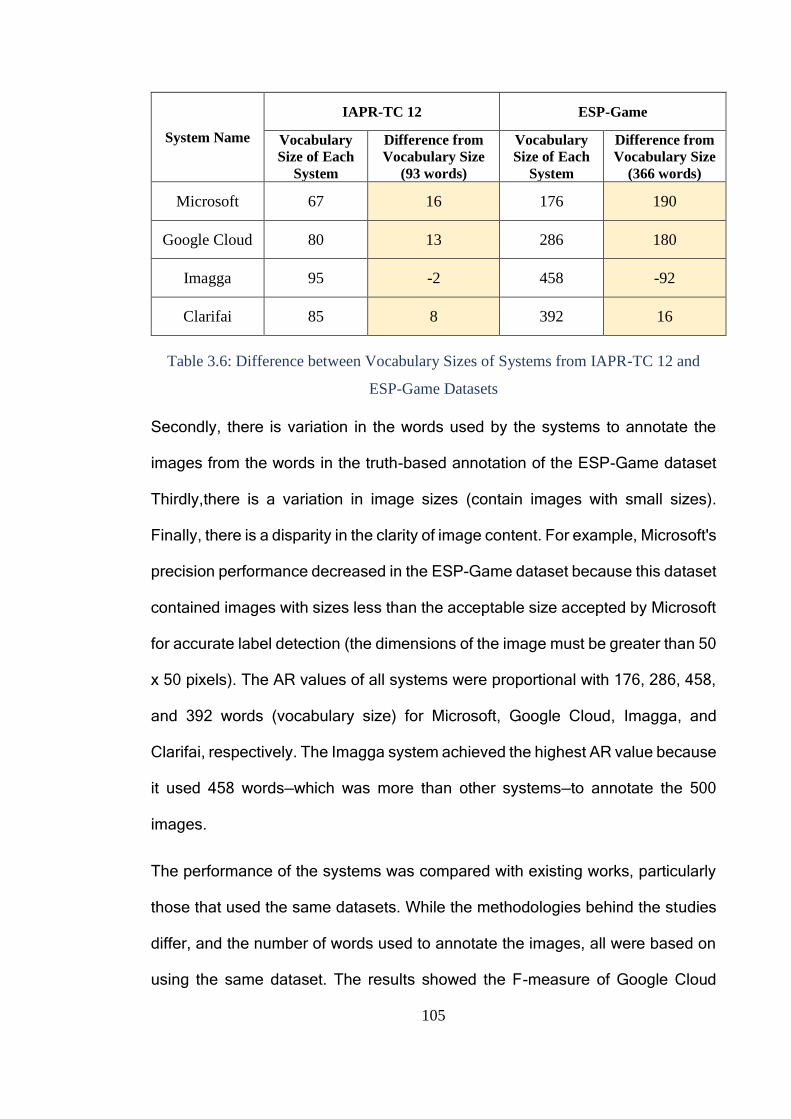
105
System Name
IAPR-TC 12 ESP-Game
Vocabulary
Size of Each
System
Difference from
Vocabulary Size
(93 words)
Vocabulary
Size of Each
System
Difference from
Vocabulary Size
(366 words)
Microsoft 67 16 176 190
Google Cloud 80 13 286 180
Imagga 95 -2 458 -92
Clarifai 85 8 392 16
Table 3.6: Difference between Vocabulary Sizes of Systems from IAPR-TC 12 and
ESP-Game Datasets
Secondly, there is variation in the words used by the systems to annotate the
images from the words in the truth-based annotation of the ESP-Game dataset
Thirdly,there is a variation in image sizes (contain images with small sizes).
Finally, there is a disparity in the clarity of image content. For example, Microsoft's
precision performance decreased in the ESP-Game dataset because this dataset
contained images with sizes less than the acceptable size accepted by Microsoft
for accurate label detection (the dimensions of the image must be greater than 50
x 50 pixels). The AR values of all systems were proportional with 176, 286, 458,
and 392 words (vocabulary size) for Microsoft, Google Cloud, Imagga, and
Clarifai, respectively. The Imagga system achieved the highest AR value because
it used 458 words—which was more than other systems—to annotate the 500
images.
The performance of the systems was compared with existing works, particularly
those that used the same datasets. While the methodologies behind the studies
differ, and the number of words used to annotate the images, all were based on
using the same dataset. The results showed the F-measure of Google Cloud
106
(45%), Imagga (41%), and Clarifai (43%) was higher than 34%, 29%, 36%, 38%,
and 39% found by Bahrami and Abadeh (2014), Tariq and Foroosh (2014),
Bhargava (2014), Murthy, Can and Manmatha (2014), and Xia, Wu and Feng
(2015) for the IAPR TC-12 dataset, respectively. For the ESP-Game dataset, only
Imagga (30%) and Clarifai (35%) achieved higher F-measure than 27% and 34%,
as found by Tariq and Foroosh (2014) and Murthy, Can and Manmatha (2014),
respectively. The reason behinds variation in the performance of the systems
(commercial systems and studies) is the number of words used by each system.
When the system used a small number of words to annotate the image precision
will be much higher, even though the recall will be a little lower, vice versa.
3.4 Determining whether a multi-algorithmic approach of the
aforementioned commercial systems would improve the
performance
Data fusion methods are often used in pattern classification if there are multiple
ways to solve a particular problem (Gökberk and Akarun, 2006). Data fusion is a
“multilevel, multifaceted process handling the automatic detection, association,
correlation, estimation, and combination of data and information from several
sources.” (Gu et al., 2015). The objective of fusion is to get a more accurate final
decision by using data from multiple knowledge sources and sensors. Data fusion
is classified into three types: data-level, feature-level, and decision-level fusion
(Gu et al., 2015). Decision-level fusion combines the decisions of multiple
classifiers into a common decision to obtain a more accurate decision
(Castanedo, 2013) which is used in this experiment.
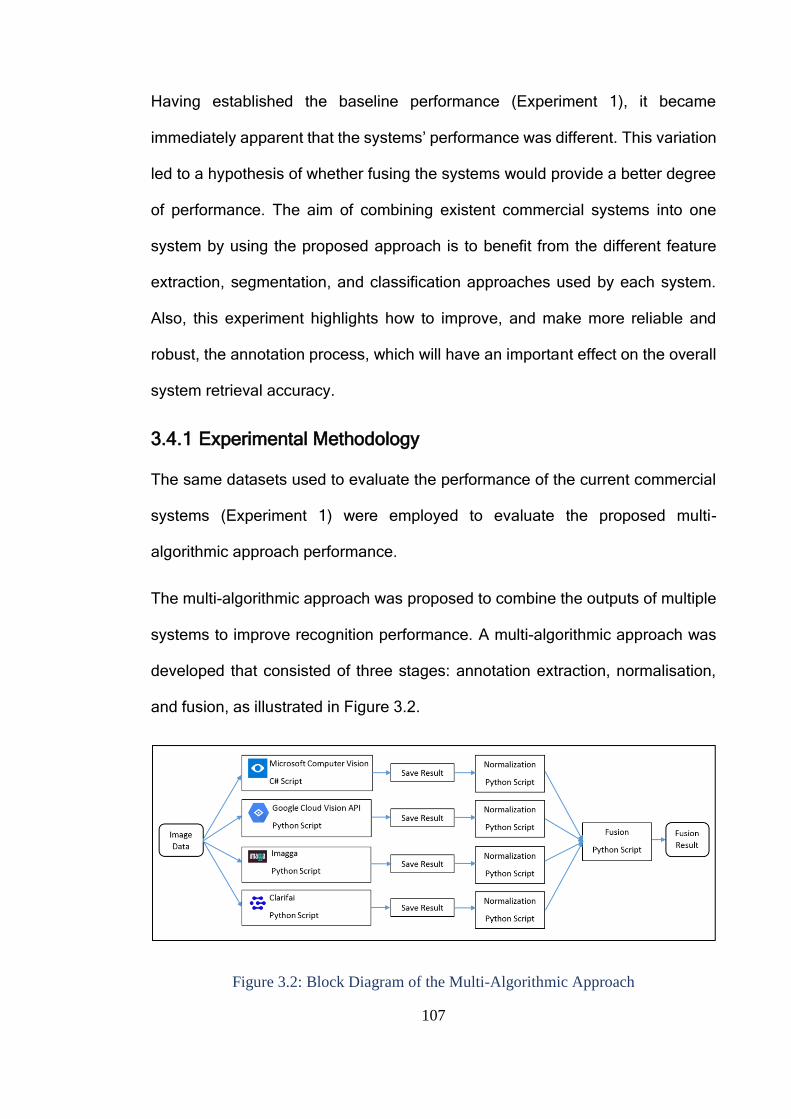
107
Having established the baseline performance (Experiment 1), it became
immediately apparent that the systems’ performance was different. This variation
led to a hypothesis of whether fusing the systems would provide a better degree
of performance. The aim of combining existent commercial systems into one
system by using the proposed approach is to benefit from the different feature
extraction, segmentation, and classification approaches used by each system.
Also, this experiment highlights how to improve, and make more reliable and
robust, the annotation process, which will have an important effect on the overall
system retrieval accuracy.
3.4.1 Experimental Methodology
The same datasets used to evaluate the performance of the current commercial
systems (Experiment 1) were employed to evaluate the proposed multi-
algorithmic approach performance.
The multi-algorithmic approach was proposed to combine the outputs of multiple
systems to improve recognition performance. A multi-algorithmic approach was
developed that consisted of three stages: annotation extraction, normalisation,
and fusion, as illustrated in Figure 3.2.
Figure 3.2: Block Diagram of the Multi-Algorithmic Approach
108
Annotation Extraction: extracts the annotations for each image in the dataset
through sending the image to multiple AIA systems, and then stores the result for
each system individually. Three program scripts were written in Microsoft Visual
Studio Python (Google Cloud Vision API, Imagga, and Clarifai), and one program
script was written in Microsoft Visual Studio C# (Microsoft Computer Vision API)
were used to generate annotations. The outputs from each system (as illustrated
in Table 3.3) have a special form compared to other systems. This difference
leads to the problem of how to combine the different styles of annotation and
express them in a unified form that can be fused to find the final image
annotations.
Multiple Normalisation Procedures: a normalisation process was required before
the fusion stage. The normalisation process was employed to exclude all useless
data and store only the words and their confidence scores for each system
individually. In addition, the confidence score (probability) for all systems was
presented in the same format. The outputs were parsed and reformatted
accordingly by implementing four Microsoft Visual Studio Python scripts. Figure
3.3 demonstrates an example of the normalisation process for Clarifai’s
annotation results.
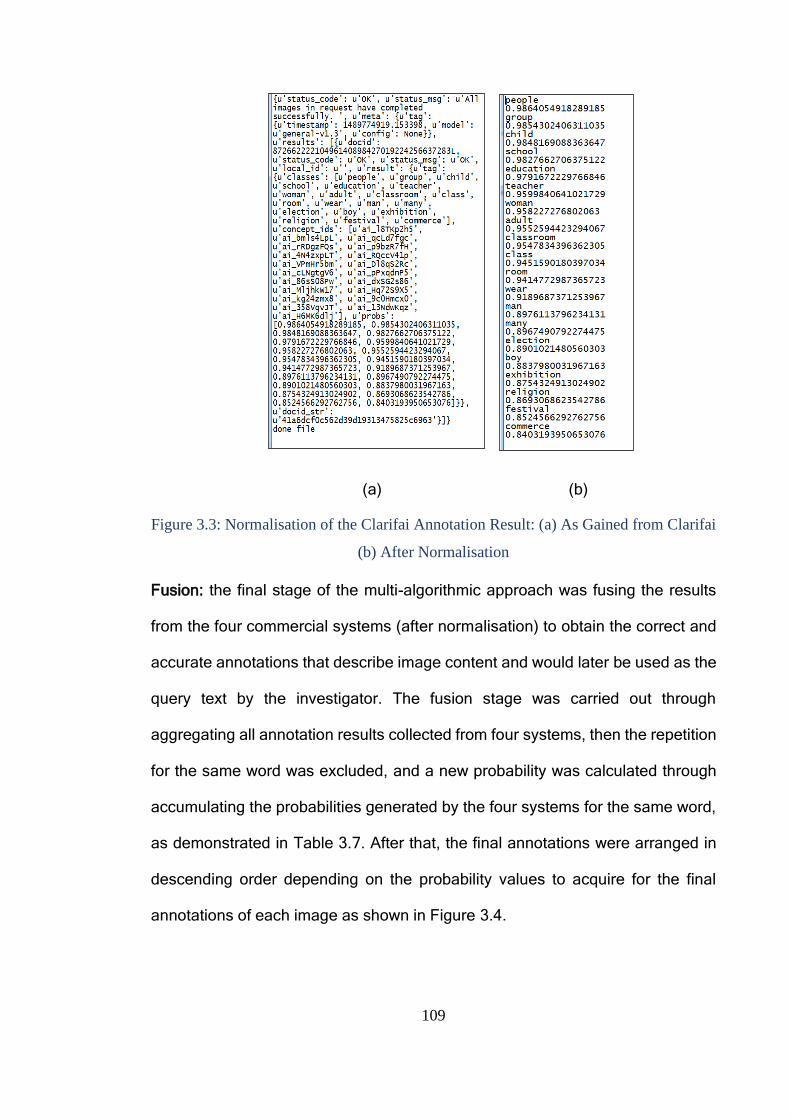
109
(a) (b)
Figure 3.3: Normalisation of the Clarifai Annotation Result: (a) As Gained from Clarifai
(b) After Normalisation
Fusion: the final stage of the multi-algorithmic approach was fusing the results
from the four commercial systems (after normalisation) to obtain the correct and
accurate annotations that describe image content and would later be used as the
query text by the investigator. The fusion stage was carried out through
aggregating all annotation results collected from four systems, then the repetition
for the same word was excluded, and a new probability was calculated through
accumulating the probabilities generated by the four systems for the same word,
as demonstrated in Table 3.7. After that, the final annotations were arranged in
descending order depending on the probability values to acquire for the final
annotations of each image as shown in Figure 3.4.
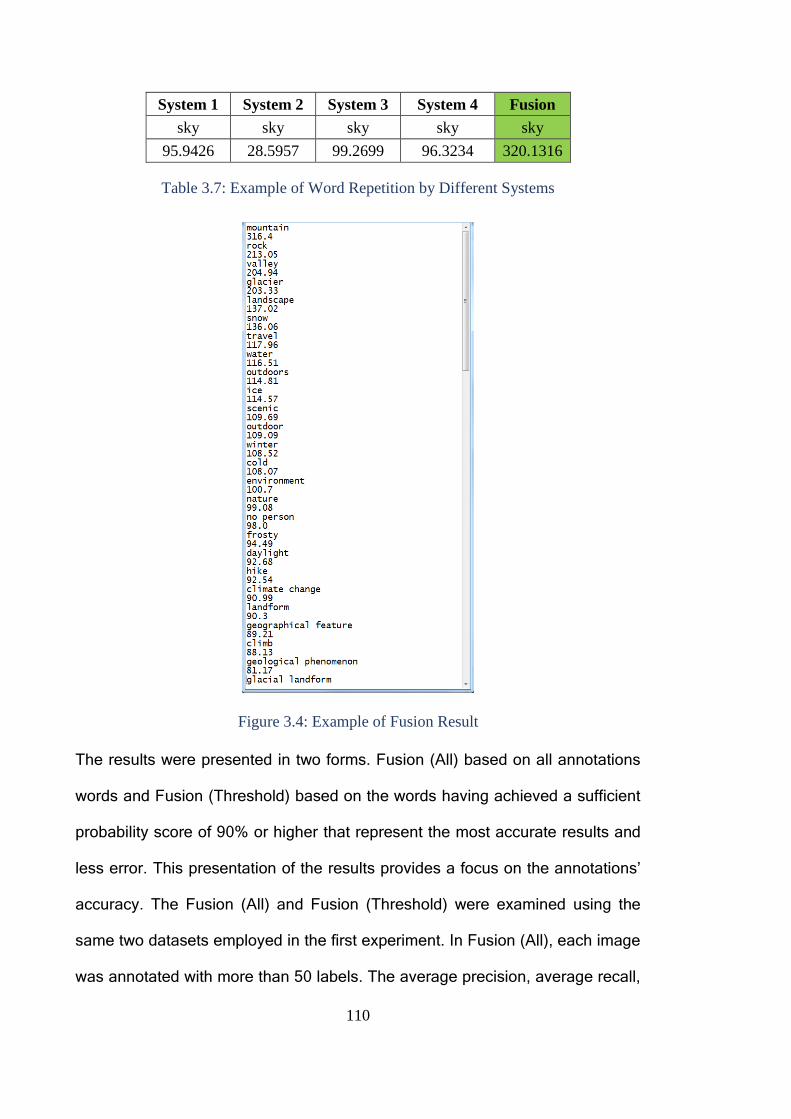
110
System 1 System 2 System 3 System 4 Fusion
sky sky sky sky sky
95.9426 28.5957 99.2699 96.3234 320.1316
Table 3.7: Example of Word Repetition by Different Systems
Figure 3.4: Example of Fusion Result
The results were presented in two forms. Fusion (All) based on all annotations
words and Fusion (Threshold) based on the words having achieved a sufficient
probability score of 90% or higher that represent the most accurate results and
less error. This presentation of the results provides a focus on the annotations’
accuracy. The Fusion (All) and Fusion (Threshold) were examined using the
same two datasets employed in the first experiment. In Fusion (All), each image
was annotated with more than 50 labels. The average precision, average recall,
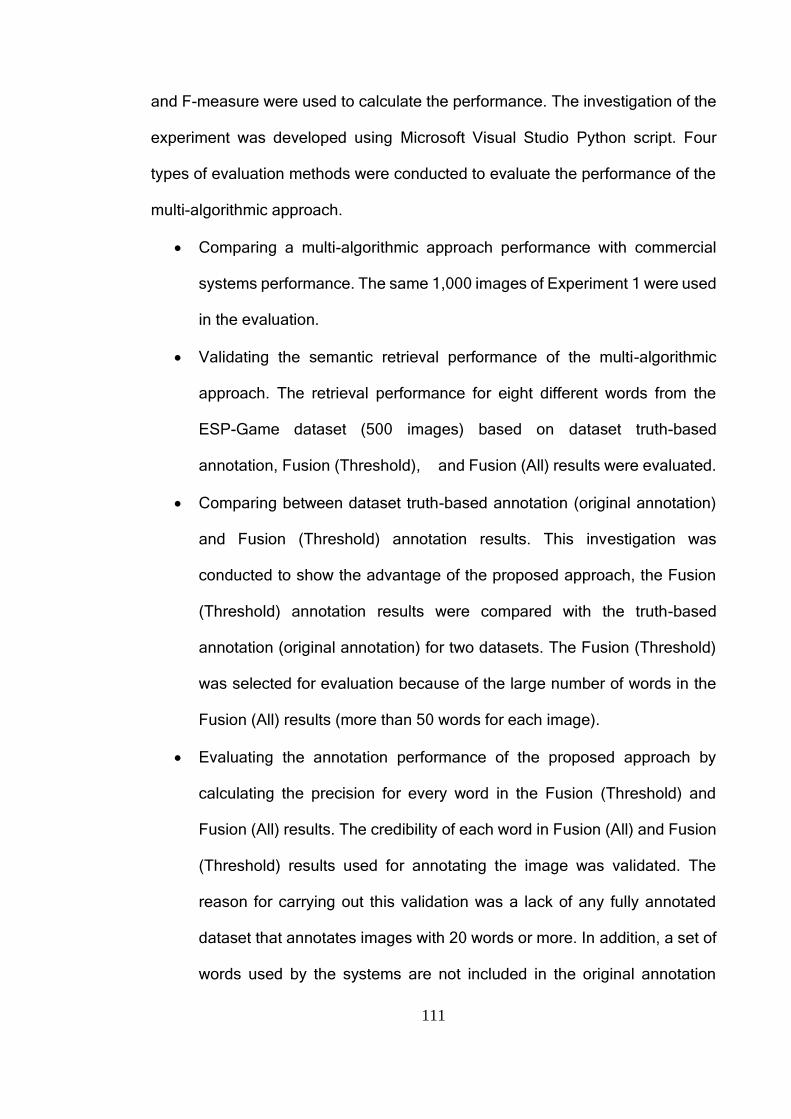
111
and F-measure were used to calculate the performance. The investigation of the
experiment was developed using Microsoft Visual Studio Python script. Four
types of evaluation methods were conducted to evaluate the performance of the
multi-algorithmic approach.
Comparing a multi-algorithmic approach performance with commercial
systems performance. The same 1,000 images of Experiment 1 were used
in the evaluation.
Validating the semantic retrieval performance of the multi-algorithmic
approach. The retrieval performance for eight different words from the
ESP-Game dataset (500 images) based on dataset truth-based
annotation, Fusion (Threshold), and Fusion (All) results were evaluated.
Comparing between dataset truth-based annotation (original annotation)
and Fusion (Threshold) annotation results. This investigation was
conducted to show the advantage of the proposed approach, the Fusion
(Threshold) annotation results were compared with the truth-based
annotation (original annotation) for two datasets. The Fusion (Threshold)
was selected for evaluation because of the large number of words in the
Fusion (All) results (more than 50 words for each image).
Evaluating the annotation performance of the proposed approach by
calculating the precision for every word in the Fusion (Threshold) and
Fusion (All) results. The credibility of each word in Fusion (All) and Fusion
(Threshold) results used for annotating the image was validated. The
reason for carrying out this validation was a lack of any fully annotated
dataset that annotates images with 20 words or more. In addition, a set of
words used by the systems are not included in the original annotation
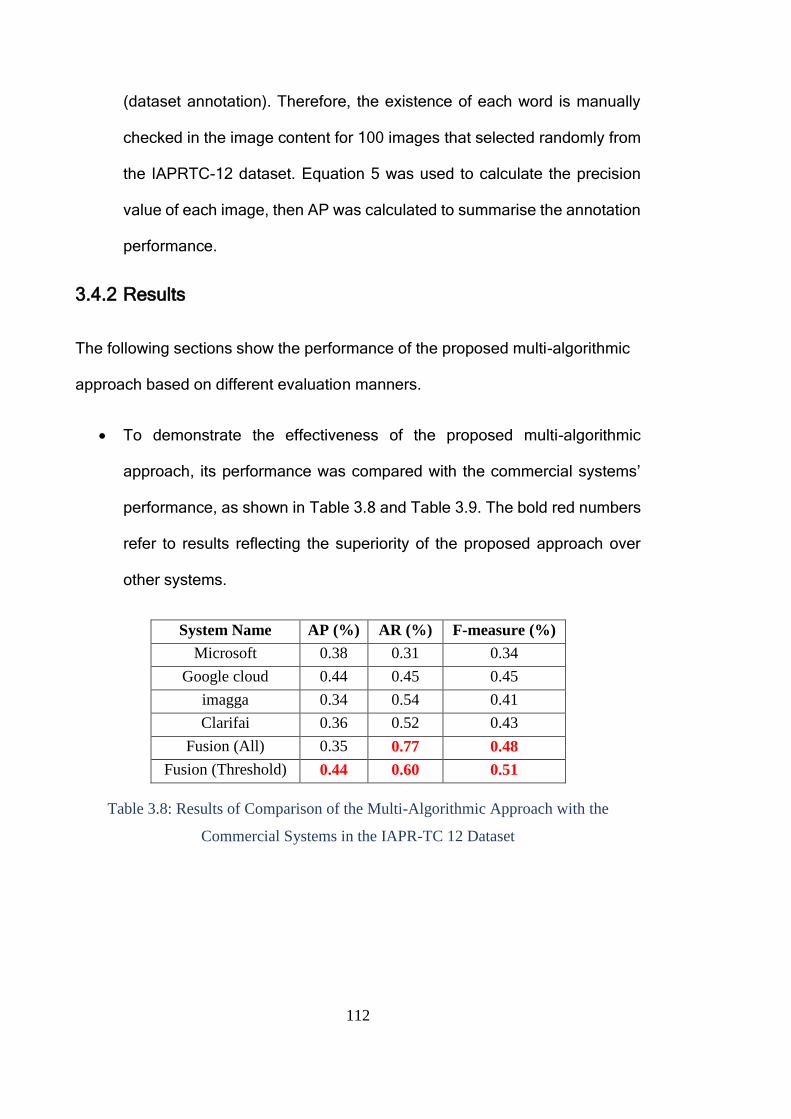
112
(dataset annotation). Therefore, the existence of each word is manually
checked in the image content for 100 images that selected randomly from
the IAPRTC-12 dataset. Equation 5 was used to calculate the precision
value of each image, then AP was calculated to summarise the annotation
performance.
3.4.2 Results
The following sections show the performance of the proposed multi-algorithmic
approach based on different evaluation manners.
To demonstrate the effectiveness of the proposed multi-algorithmic
approach, its performance was compared with the commercial systems’
performance, as shown in Table 3.8 and Table 3.9. The bold red numbers
refer to results reflecting the superiority of the proposed approach over
other systems.
System Name AP (%) AR (%) F-measure (%)
Microsoft 0.38 0.31 0.34
Google cloud 0.44 0.45 0.45
imagga 0.34 0.54 0.41
Clarifai 0.36 0.52 0.43
Fusion (All) 0.35 0.77 0.48
Fusion (Threshold) 0.44 0.60 0.51
Table 3.8: Results of Comparison of the Multi-Algorithmic Approach with the
Commercial Systems in the IAPR-TC 12 Dataset
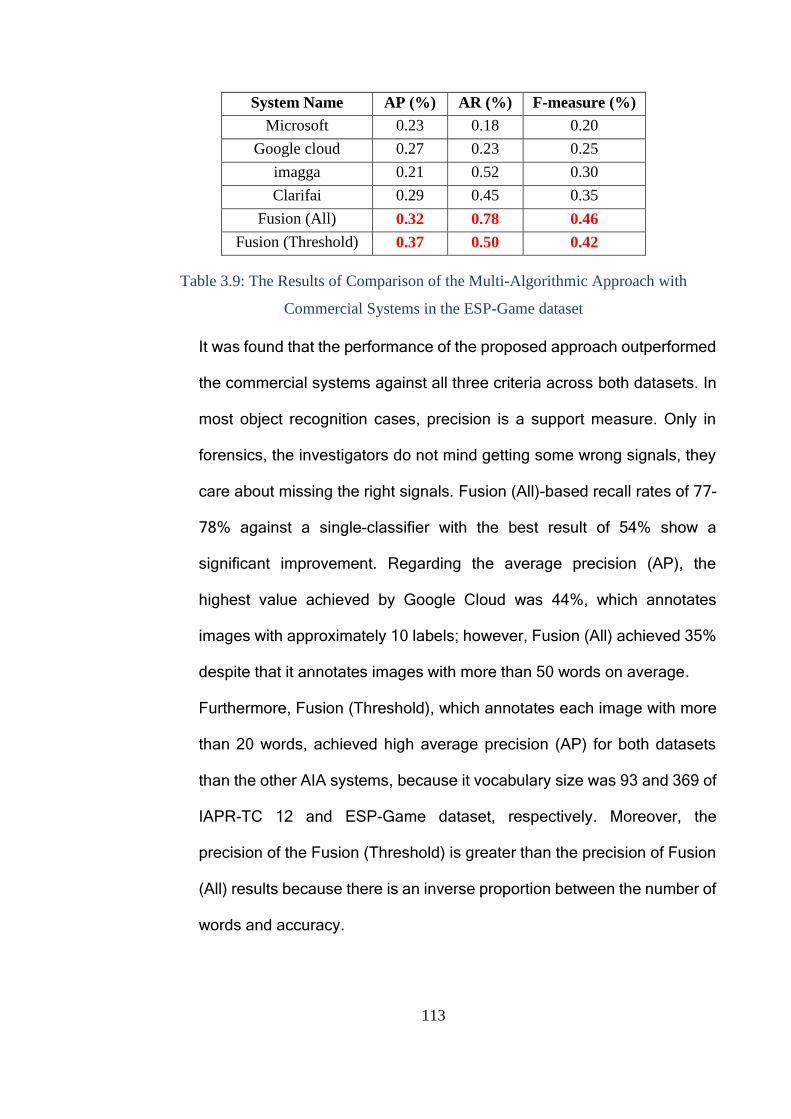
113
System Name AP (%) AR (%) F-measure (%)
Microsoft 0.23 0.18 0.20
Google cloud 0.27 0.23 0.25
imagga 0.21 0.52 0.30
Clarifai 0.29 0.45 0.35
Fusion (All) 0.32 0.78 0.46
Fusion (Threshold) 0.37 0.50 0.42
Table 3.9: The Results of Comparison of the Multi-Algorithmic Approach with
Commercial Systems in the ESP-Game dataset
It was found that the performance of the proposed approach outperformed
the commercial systems against all three criteria across both datasets. In
most object recognition cases, precision is a support measure. Only in
forensics, the investigators do not mind getting some wrong signals, they
care about missing the right signals. Fusion (All)-based recall rates of 77-
78% against a single-classifier with the best result of 54% show a
significant improvement. Regarding the average precision (AP), the
highest value achieved by Google Cloud was 44%, which annotates
images with approximately 10 labels; however, Fusion (All) achieved 35%
despite that it annotates images with more than 50 words on average.
Furthermore, Fusion (Threshold), which annotates each image with more
than 20 words, achieved high average precision (AP) for both datasets
than the other AIA systems, because it vocabulary size was 93 and 369 of
IAPR-TC 12 and ESP-Game dataset, respectively. Moreover, the
precision of the Fusion (Threshold) is greater than the precision of Fusion
(All) results because there is an inverse proportion between the number of
words and accuracy.
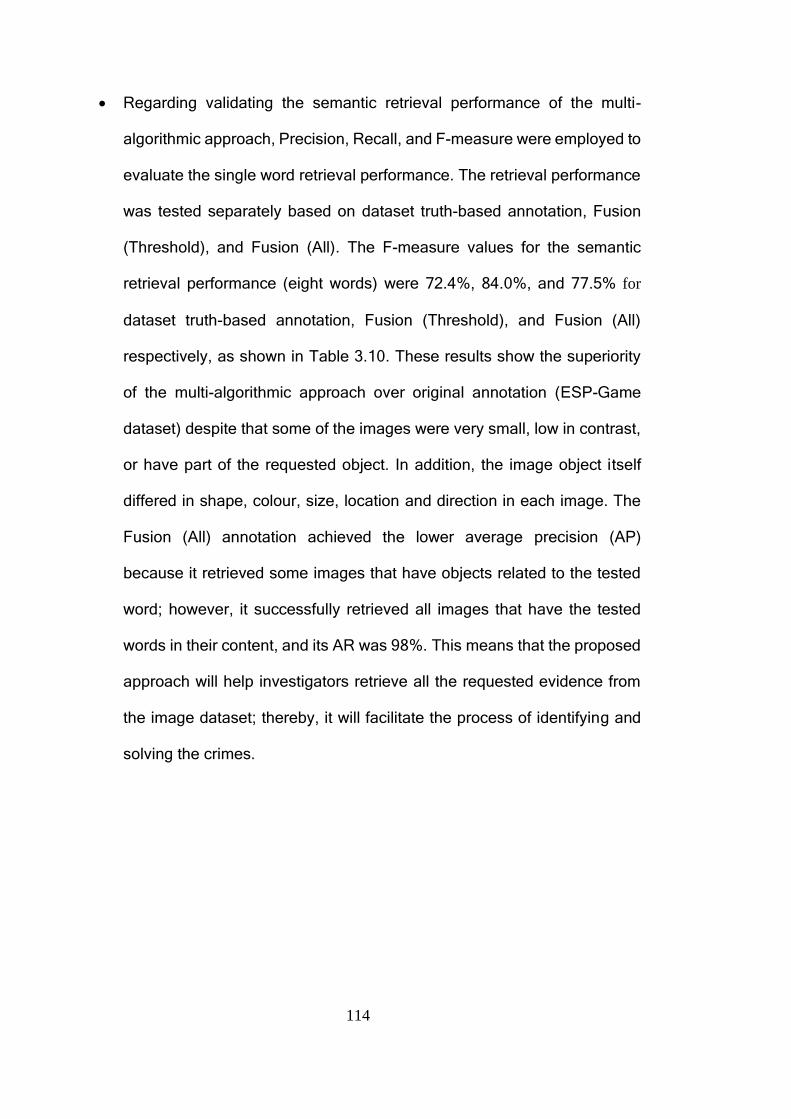
114
Regarding validating the semantic retrieval performance of the multi-
algorithmic approach, Precision, Recall, and F-measure were employed to
evaluate the single word retrieval performance. The retrieval performance
was tested separately based on dataset truth-based annotation, Fusion
(Threshold), and Fusion (All). The F-measure values for the semantic
retrieval performance (eight words) were 72.4%, 84.0%, and 77.5% for
dataset truth-based annotation, Fusion (Threshold), and Fusion (All)
respectively, as shown in Table 3.10. These results show the superiority
of the multi-algorithmic approach over original annotation (ESP-Game
dataset) despite that some of the images were very small, low in contrast,
or have part of the requested object. In addition, the image object itself
differed in shape, colour, size, location and direction in each image. The
Fusion (All) annotation achieved the lower average precision (AP)
because it retrieved some images that have objects related to the tested
word; however, it successfully retrieved all images that have the tested
words in their content, and its AR was 98%. This means that the proposed
approach will help investigators retrieve all the requested evidence from
the image dataset; thereby, it will facilitate the process of identifying and
solving the crimes.
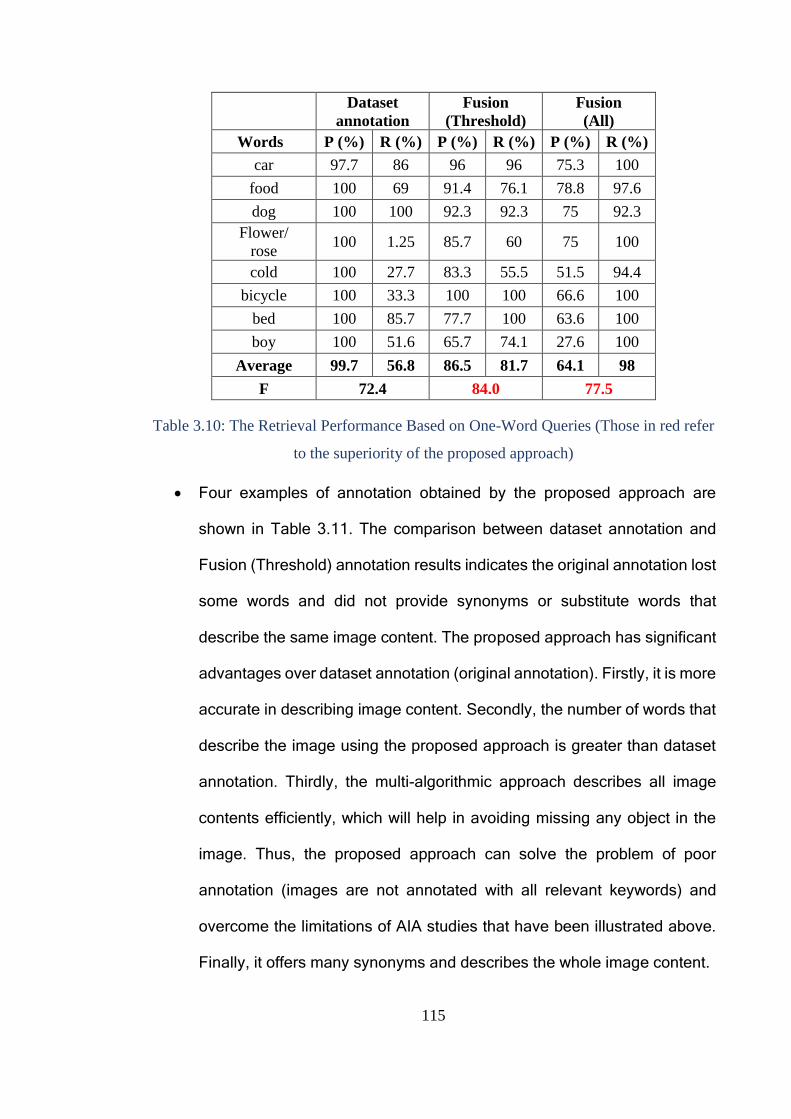
115
Dataset
annotation
Fusion
(Threshold)
Fusion
(All)
Words P (%) R (%) P (%) R (%) P (%) R (%)
car 97.7 86 96 96 75.3 100
food 100 69 91.4 76.1 78.8 97.6
dog 100 100 92.3 92.3 75 92.3
Flower/
rose 100 1.25 85.7 60 75 100
cold 100 27.7 83.3 55.5 51.5 94.4
bicycle 100 33.3 100 100 66.6 100
bed 100 85.7 77.7 100 63.6 100
boy 100 51.6 65.7 74.1 27.6 100
Average 99.7 56.8 86.5 81.7 64.1 98
F 72.4 84.0 77.5
Table 3.10: The Retrieval Performance Based on One-Word Queries (Those in red refer
to the superiority of the proposed approach)
Four examples of annotation obtained by the proposed approach are
shown in Table 3.11. The comparison between dataset annotation and
Fusion (Threshold) annotation results indicates the original annotation lost
some words and did not provide synonyms or substitute words that
describe the same image content. The proposed approach has significant
advantages over dataset annotation (original annotation). Firstly, it is more
accurate in describing image content. Secondly, the number of words that
describe the image using the proposed approach is greater than dataset
annotation. Thirdly, the multi-algorithmic approach describes all image
contents efficiently, which will help in avoiding missing any object in the
image. Thus, the proposed approach can solve the problem of poor
annotation (images are not annotated with all relevant keywords) and
overcome the limitations of AIA studies that have been illustrated above.
Finally, it offers many synonyms and describes the whole image content.
116
APR-TC 12 Dataset
Image
Original
Annotation
Humans, group of persons,
landscape nature, sky
Humans, person, child, child
girl, man made, floor
Fusion
Annotation
Snow, sky, winter, ice, cold,
outdoor, landscape, travel,
outdoors, water, beach,
people, leisure, vacation,
frosty, vehicle, froze,
recreation, frost, weather
People, group, education, class,
child, person, adult, classroom,
boy, school, man, room,
teacher, woman, indoor, wear
ESP- Game Dataset
Image
Original
Annotation
Car, building Chicken, meal, table, bowl,
food, white, Asian, dinner
Fusion
Annotation
Building, sky, road, street,
town, downtown,
architecture, city, travel,
outdoor, urban, house,
tourism, old, outdoors, car,
modern, horizontal, facade
Food, meal, plate, dish, table,
cuisine, lunch, restaurant,
dinner, meat, delicious, sauce,
vegetable, healthy, tasty,
cooking, hot, indoor, epicure,
refreshment, no person
Table 3.11: Examples of Fusion Annotation Matching with Ground Truth Annotation
for Two Datasets (APR-TC 12 and ESP-Game)
Finally, this section demonstrates the validity of the annotations that have
been generated by the proposed approach. The experiment showed the
AP of Fusion (All) (more than 50 words annotating each image) and Fusion
(Threshold) (more than 20 words annotating each image) were 55% and
80%, respectively. Although the images varied in content and some were
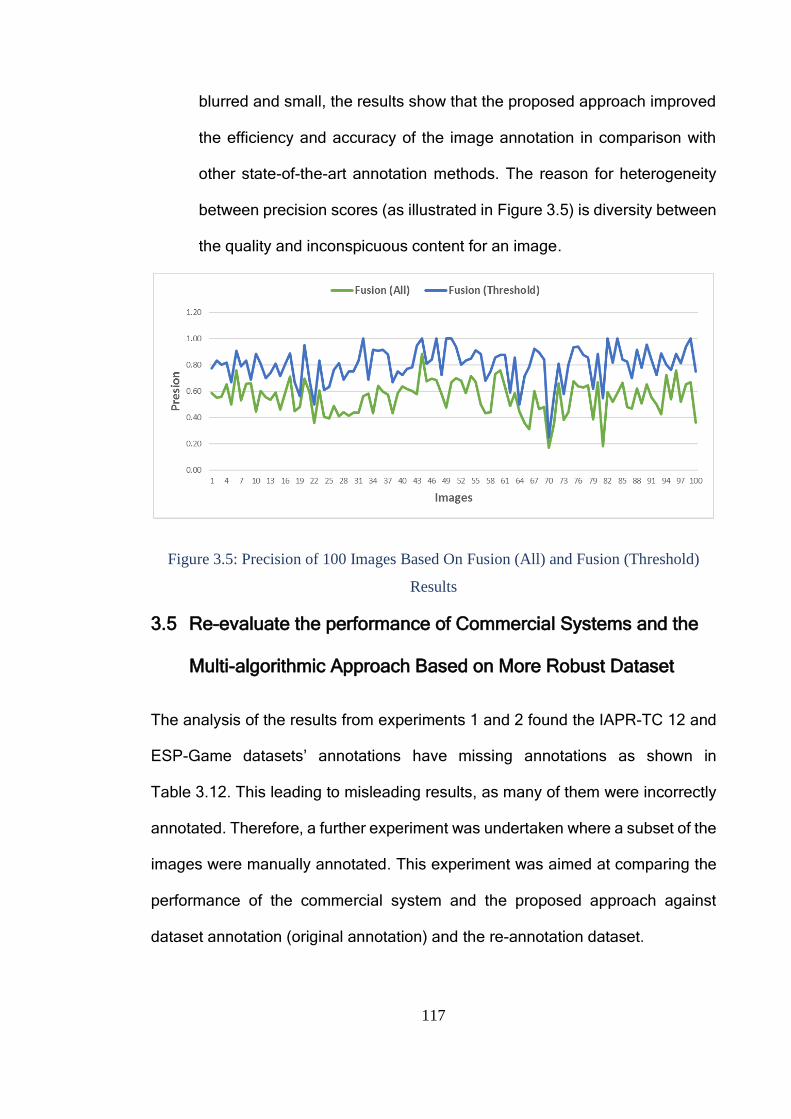
117
blurred and small, the results show that the proposed approach improved
the efficiency and accuracy of the image annotation in comparison with
other state-of-the-art annotation methods. The reason for heterogeneity
between precision scores (as illustrated in Figure 3.5) is diversity between
the quality and inconspicuous content for an image.
Figure 3.5: Precision of 100 Images Based On Fusion (All) and Fusion (Threshold)
Results
3.5 Re-evaluate the performance of Commercial Systems and the
Multi-algorithmic Approach Based on More Robust Dataset
The analysis of the results from experiments 1 and 2 found the IAPR-TC 12 and
ESP-Game datasets’ annotations have missing annotations as shown in
Table 3.12. This leading to misleading results, as many of them were incorrectly
annotated. Therefore, a further experiment was undertaken where a subset of the
images were manually annotated. This experiment was aimed at comparing the
performance of the commercial system and the proposed approach against
dataset annotation (original annotation) and the re-annotation dataset.
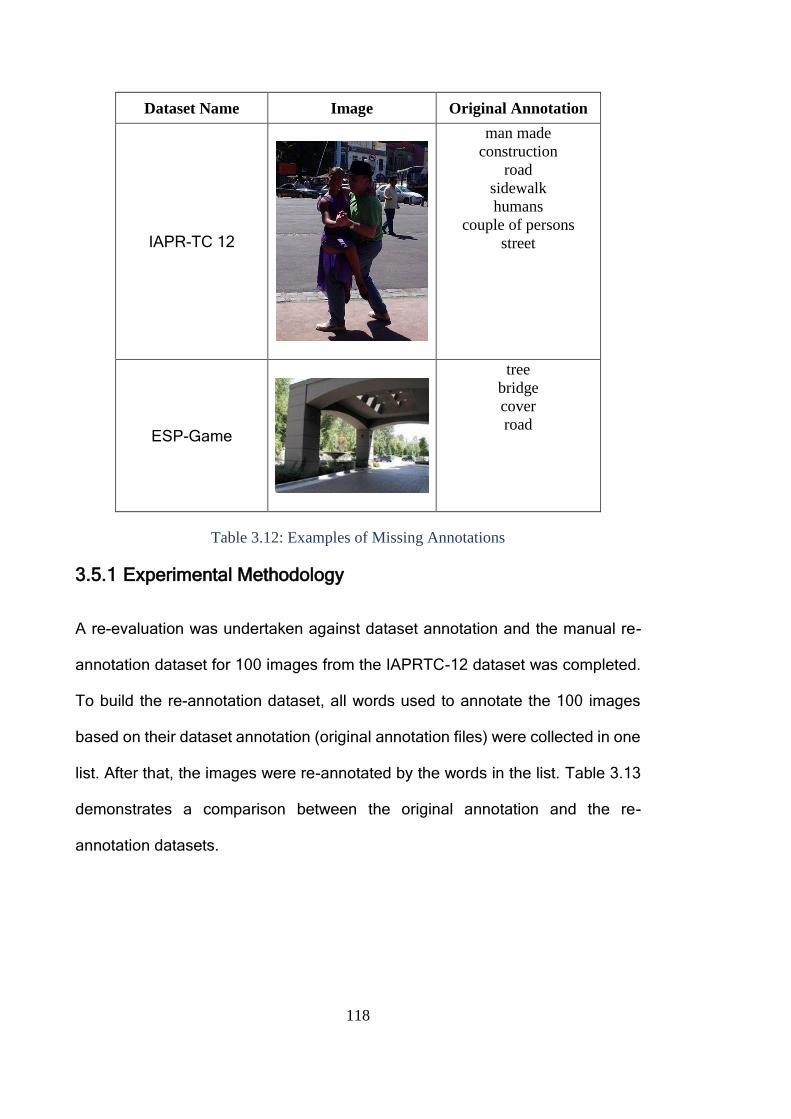
118
Dataset Name Image Original Annotation
IAPR-TC 12
man made
construction
road
sidewalk
humans
couple of persons
street
ESP-Game
tree
bridge
cover
road
Table 3.12: Examples of Missing Annotations
3.5.1 Experimental Methodology
A re-evaluation was undertaken against dataset annotation and the manual re-
annotation dataset for 100 images from the IAPRTC-12 dataset was completed.
To build the re-annotation dataset, all words used to annotate the 100 images
based on their dataset annotation (original annotation files) were collected in one
list. After that, the images were re-annotated by the words in the list. Table 3.13
demonstrates a comparison between the original annotation and the re-
annotation datasets.
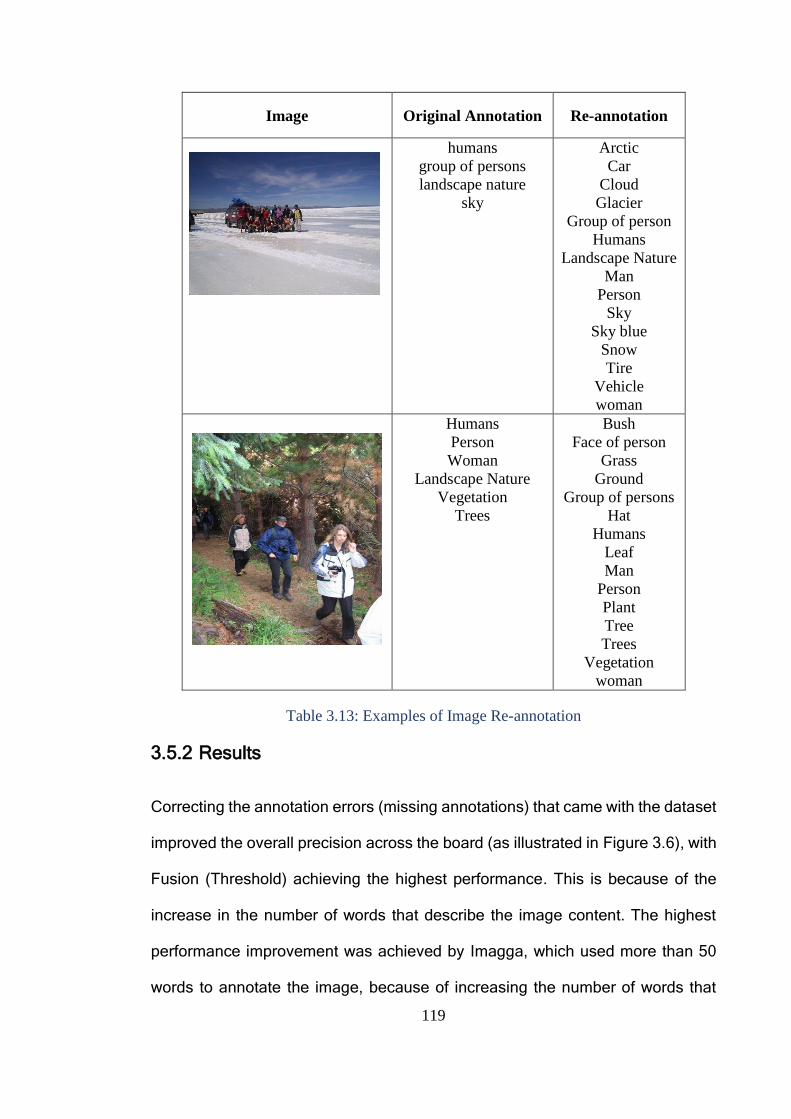
119
Image Original Annotation Re-annotation
humans
group of persons
landscape nature
sky
Arctic
Car
Cloud
Glacier
Group of person
Humans
Landscape Nature
Man
Person
Sky
Sky blue
Snow
Tire
Vehicle
woman
Humans
Person
Woman
Landscape Nature
Vegetation
Trees
Bush
Face of person
Grass
Ground
Group of persons
Hat
Humans
Leaf
Man
Person
Plant
Tree
Trees
Vegetation
woman
Table 3.13: Examples of Image Re-annotation
3.5.2 Results
Correcting the annotation errors (missing annotations) that came with the dataset
improved the overall precision across the board (as illustrated in Figure 3.6), with
Fusion (Threshold) achieving the highest performance. This is because of the
increase in the number of words that describe the image content. The highest
performance improvement was achieved by Imagga, which used more than 50
words to annotate the image, because of increasing the number of words that
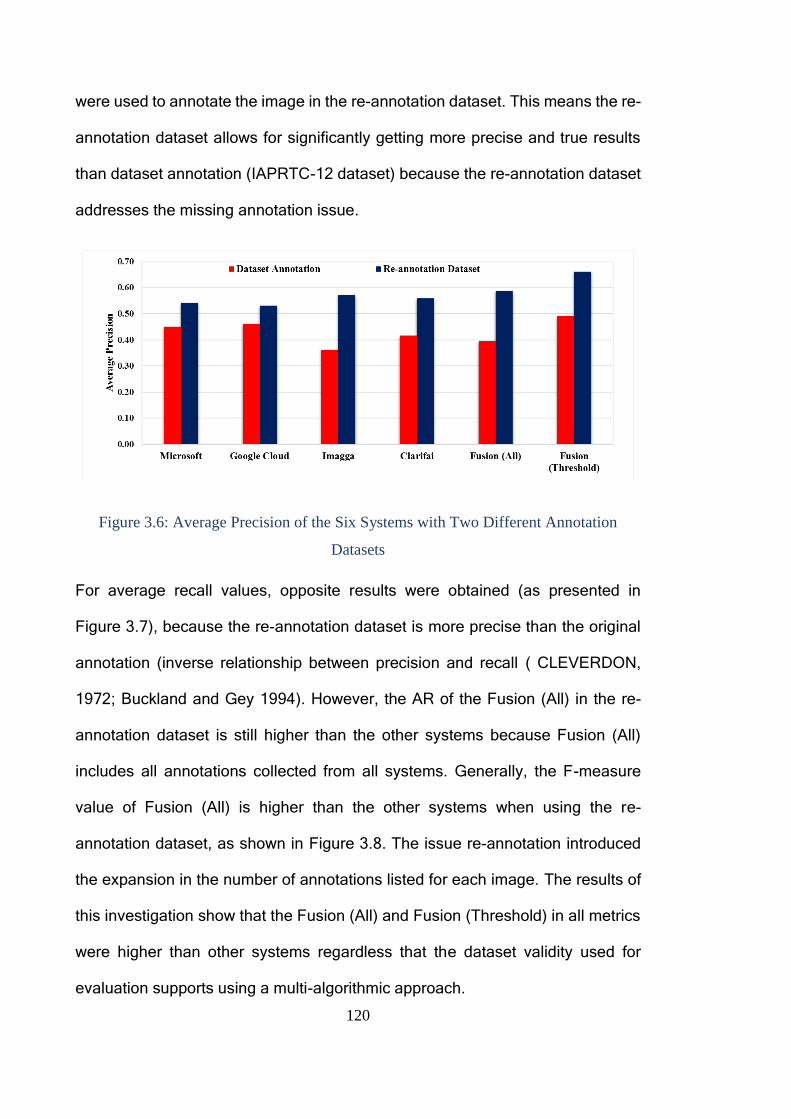
120
were used to annotate the image in the re-annotation dataset. This means the re-
annotation dataset allows for significantly getting more precise and true results
than dataset annotation (IAPRTC-12 dataset) because the re-annotation dataset
addresses the missing annotation issue.
Figure 3.6: Average Precision of the Six Systems with Two Different Annotation
Datasets
For average recall values, opposite results were obtained (as presented in
Figure 3.7), because the re-annotation dataset is more precise than the original
annotation (inverse relationship between precision and recall ( CLEVERDON,
1972; Buckland and Gey 1994). However, the AR of the Fusion (All) in the re-
annotation dataset is still higher than the other systems because Fusion (All)
includes all annotations collected from all systems. Generally, the F-measure
value of Fusion (All) is higher than the other systems when using the re-
annotation dataset, as shown in Figure 3.8. The issue re-annotation introduced
the expansion in the number of annotations listed for each image. The results of
this investigation show that the Fusion (All) and Fusion (Threshold) in all metrics
were higher than other systems regardless that the dataset validity used for
evaluation supports using a multi-algorithmic approach.
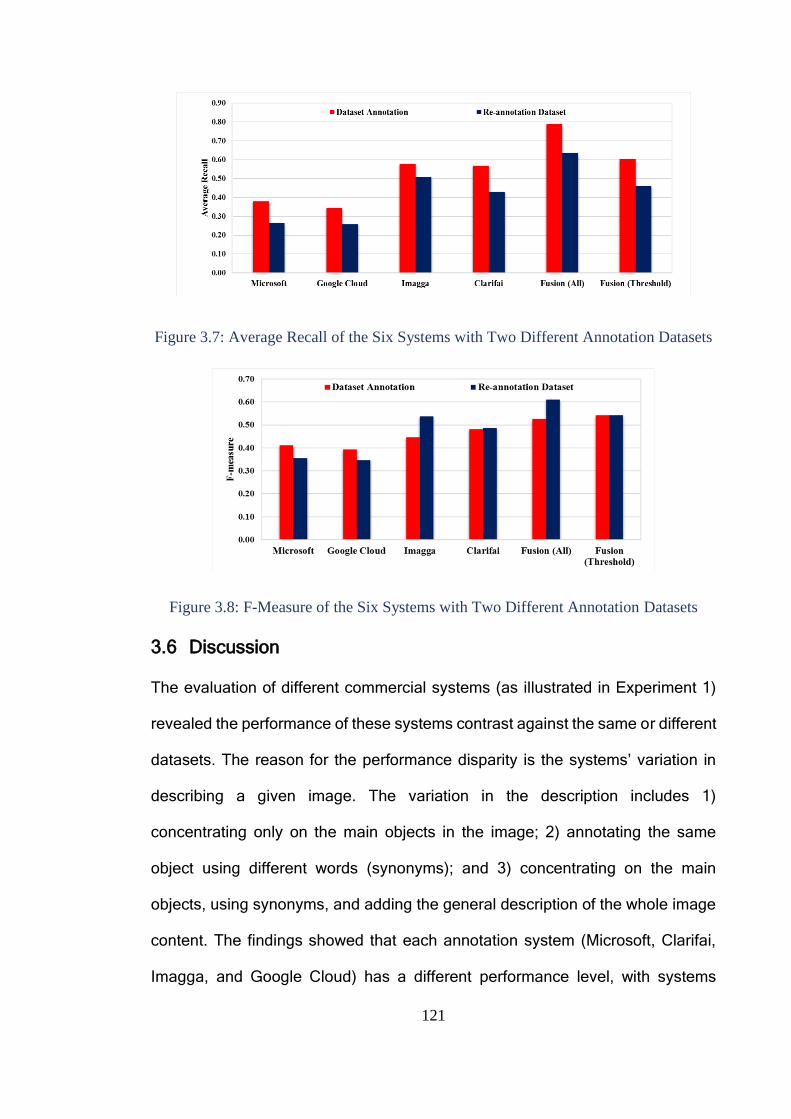
121
Figure 3.7: Average Recall of the Six Systems with Two Different Annotation Datasets
Figure 3.8: F-Measure of the Six Systems with Two Different Annotation Datasets
3.6 Discussion
The evaluation of different commercial systems (as illustrated in Experiment 1)
revealed the performance of these systems contrast against the same or different
datasets. The reason for the performance disparity is the systems’ variation in
describing a given image. The variation in the description includes 1)
concentrating only on the main objects in the image; 2) annotating the same
object using different words (synonyms); and 3) concentrating on the main
objects, using synonyms, and adding the general description of the whole image
content. The findings showed that each annotation system (Microsoft, Clarifai,
Imagga, and Google Cloud) has a different performance level, with systems
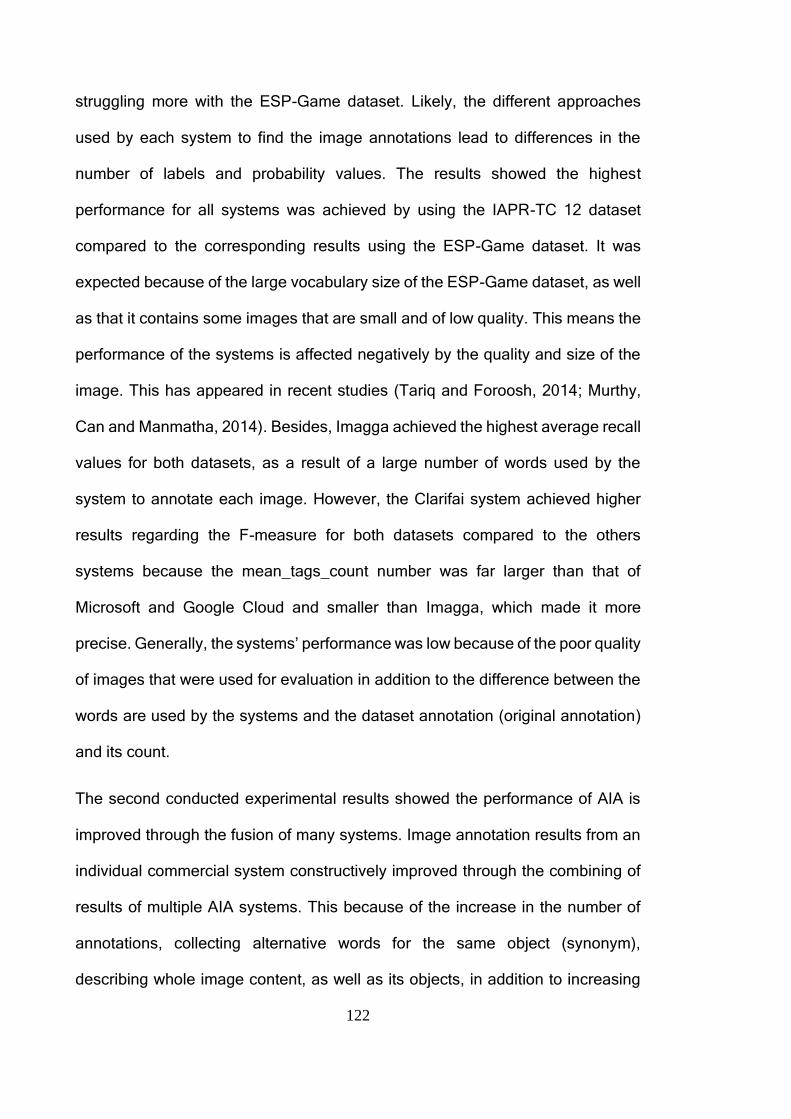
122
struggling more with the ESP-Game dataset. Likely, the different approaches
used by each system to find the image annotations lead to differences in the
number of labels and probability values. The results showed the highest
performance for all systems was achieved by using the IAPR-TC 12 dataset
compared to the corresponding results using the ESP-Game dataset. It was
expected because of the large vocabulary size of the ESP-Game dataset, as well
as that it contains some images that are small and of low quality. This means the
performance of the systems is affected negatively by the quality and size of the
image. This has appeared in recent studies (Tariq and Foroosh, 2014; Murthy,
Can and Manmatha, 2014). Besides, Imagga achieved the highest average recall
values for both datasets, as a result of a large number of words used by the
system to annotate each image. However, the Clarifai system achieved higher
results regarding the F-measure for both datasets compared to the others
systems because the mean_tags_count number was far larger than that of
Microsoft and Google Cloud and smaller than Imagga, which made it more
precise. Generally, the systems’ performance was low because of the poor quality
of images that were used for evaluation in addition to the difference between the
words are used by the systems and the dataset annotation (original annotation)
and its count.
The second conducted experimental results showed the performance of AIA is
improved through the fusion of many systems. Image annotation results from an
individual commercial system constructively improved through the combining of
results of multiple AIA systems. This because of the increase in the number of
annotations, collecting alternative words for the same object (synonym),
describing whole image content, as well as its objects, in addition to increasing
123
the reliability of the words because they are repeated by different systems. The
proposed approach was able to retrieve most images that have the text query
(tested word) in their content successfully and the average recall rate was 98%.
The approach also improved image annotation and solved the problem of poor
annotation (images are not annotated with all relevant keywords). Additionally,
the annotation performance of Fusion (Threshold) was AP=80% and its
mean_tags_count of 20 would be considered better than other state-of-the-art
annotation systems whose mean_tags_count is 5. Ultimately, the proposed
approach contributes to demonstrate that the annotation of forensic images is
possible, the using of commercial systems is set reliable and fusion based
approach is best to get better results and provide more operation flexibility.
The last conducted experiment results highlighted that the usage of the re-
annotation dataset improved all systems’ precision performance by finding
mistakes in the dataset annotation. Additionally, the proposed approach achieved
better performance than the rest of the systems, regardless of the dataset used
for evaluation.
However, the use of publicly available annotation systems introduces some
operational limitations. Firstly, some of these systems, such as Microsoft Vision
API, take a copy of the image to improve its system performance. Secondly, there
are various pieces of forensic image evidence that have been captured by
different devices; some of them are often poor quality and highly variable in size
and content. Thus, the precision of annotation obtained from available
commercial annotation systems are affected by several factors such as image
clarity, image size, and the size and direction of an object in the image.
124
Consequently, there is a need to explore and evaluate a range of pre-processing
procedures to introduce the necessary privacy required and tackle image factors.
3.7 Conclusion
The chapter experimentally investigated the performance of existing commercial
systems and the proposed multi-algorithmic approach, as well as re-evaluated
the performance based on a more robust dataset annotation. There are several
online systems supported by significant results that have developed operational
image annotation systems, such as Google Cloud Vision API, Clarifai, Imagga,
and Microsoft Cognitive Services (Computer Vision API). As such, the proposed
approach seeks to capitalise on the use of multiple existing annotation systems
and the development of a fusion engine to constructively argument the results.
This will permit investigators to retrieve multiple pieces of evidence from a
heterogeneous forensic image database efficiently. The experimental results
using two datasets (IAPR-TC 12 and ESP-Game) have proven that the proposed
approach performance outperforms existing AIA systems. The existing systems’
results show that the highest average recall was achieved by Imagga with 53%
while the proposed multi-algorithmic system achieved 77% across the selected
datasets. In addition, the F-measure of the proposed approach was higher than
all systems for both datasets. These results demonstrate the benefit of using a
multi-algorithmic approach.
The results in this context have also demonstrated the capability of the suggested
approach to retrieve most requested images. The F-measure of Fusion
(Threshold) and Fusion (All) were 84.0% and 77.5%, respectively. Thereby, the
multi-algorithmic approach will help reduce the effort exerted by the investigator
and decrease the cost and time of the investigation process, which is needed to

125
retrieve all images that have the required evidence in their content. The proposed
method annotates the image with many correct and accurate words that reflect
the image’s content and will later improve retrieval performance. The results
showed that the proposed approach improved the efficiency and accuracy of the
image annotation compared to the state-of-the-art works.
126
4 A Novel Framework for Object-based Multimedia
Forensic Analysis Tool
4.1 Introduction
As mentioned previously, multimedia forensic investigation can include an
extensive collection of data/evidence from various sources that are required to be
analysed in a short time. Given the ever-increasing volume of multimedia content
in the form of images or videos containing objects and/or scenes that may be
related to criminal behaviour, it makes searching and retrieving images/videos
from the vast quantities of such data a tedious process that requires significant
effort.
Building upon the challenges (as illustrated in section 2.6), the author is looking
for to develop the forensic image analysis system that has the capability to
automate the process of extracting, indexing, and analysing the recovered
images/videos and providing an investigator with an environment in which they
can ask more abstract and cognitively challenging questions of the data such as
identifying a particular object such as a car and then ask the system to track the
car (selected) and plot the locations of the car move around the city using a
graphical map alongside the sources of the images utilised to identify the path. In
addition, the extracted evidence must be in a form that makes it convenient and
acceptable in a court of law. This tool reflects the procedures that will be
undertaken by investigators during a typical digital forensics investigation to
detect the required evidence in a huge amount of data. This chapter describes
the OM-FAT contents that will reduce the time, effort, and cognitive load being
placed on investigators to identify relevant evidence. The chapter begins with a
127
set of requirements that must be met by the proposed system to achieve the
research goal. A detailed description of the proposed system engines and
processes is presented in the rest of this chapter.
4.2 System Requirements
Chapters 2 and 3 demonstrated many challenges faced in using image analysis
in digital forensics, such as enormous amounts of data and the diversity and
complexity of the image content. Moreover, the existing forensic tools are
insufficient in areas such as automatic content image analysis, extraction of
evidence and correlating images, and the lack of the standard annotated image
database, which can be used to learn the system used to annotate forensic
images. This leads to needing image analysis and retrieval techniques, in addition
to intelligent systems that can be used to overcome these challenges through
evidence extraction, indexing, and correlation of evidence using various methods.
The proposed system’s key requirements are divided into two levels:
4.2.1 High-Level Requirements
The high-level requirements indicate the essential requirements that should be
met in the proposed architecture because of their impact on the performance of
the evidence extraction process. And also they were placed to meet limitations
faced by the existing forensic tools regarding images analyses.
Using multi-algorithmic approach to recognize different objects with
different characteristics that exist in the images, thereby improving the
evidence extraction process.
128
Provide a range of forensic analyses and correlation capability to aid
investigators in querying the required images. By using multiple AIA
systems that can recognise different objects with different characteristics
in an image and fuse their results using the multi-algorithmic approach, the
proposed system can improve the evidence extraction process. The
objective of using the multi-algorithmic approach is to overcome the
limitations of each system individually and to look for different reliable
information. Further, the accuracy and speed of retrieving images are the
biggest challenges facing image analysis in digital forensics. However,
once annotated, merely looking at all the results of a single or a set of
keywords will not necessarily diminish the investigative task. Therefore,
the proposed system tackles this challenge by applying additional
knowledge to the retrieved images with the aim of enabling investigators
to filter evidence using a wider range of information (different types of
image retrieval methods (Malcom Marshall, 2014)). As a result, it is
important to develop the correlation engine that can link the annotation,
image feature, and text features alongside relevant metadata to enable
investigators to ask higher-level and more abstract questions of the data.
4.2.2 Low-Level Requirement
In addition to the aforementioned high-level requirements, the following
requirements must be considered to make the performance and use of the system
proper and efficient. Also, met the requirements that should look for when
selecting a digital forensics software platform (DIJKSTRA, 2016):
129
The proposed system should provide a facility that enables investigators
to access the tool anytime, anywhere and via any PC with an Internet
connection.
Execution of the system should be platform-independent, which means it
should not be restricted by the type of operating system used (Linux,
MacOS, Unix, Windows, etc.).
It should have good usability to enable investigators to achieve their tasks
easily and efficiently.
It should provide a case-based management infrastructure. Case
management introduces in order to enable the management of the forensic
processes effectively. Rather than a lot of utilities or a lot of different
providers, one tool is effectively able to get start to the end of the case.
Implement authentication, authorisation, and accounting (AAA) technology
for all investigators using the system to ensure the chain of custody.
Acquire and process a wide variety of forensic database images and live
sources (e.g. computer, mobile, CCTV).
Conduct image enhancement approaches to improve image quality that
would improve the annotation and feature extraction systems’
performance.
Visualise the results in a timely manner and different forms to help
investigators understand the significance of data by placing it in a visual
context.
130
4.3 Object-based Multimedia Forensic Analysis Tool Architecture
OM-FAT is intended to be a complete forensic image analysis tool. This could be
achieved by incorporating image analysis in a single-case management-based
system that goes beyond the current state-of-the-art in both forensics and their
specific specialist domains. Based on the requirements analysis to understand
what required of the system that included evaluation of the currently existing tools.
The author looked to how the commercial systems today work such as FTK,
Encase, which are very well known forensic case management tools and are not
object-based image retrieval, how they operate and match to forensic processes;
collection, examination, analysis, and presentation, reporting. In addition, the
working based forensic principles and the system requirements that let to achieve
OM-FAT structure.
The proposed system provides investigators with an aggregation of the image
analysis techniques in one place to extract multiple pieces of evidence from a
heterogeneous forensic image database automatically. Whether the evidence is
an object or text inside the image or metadata, OM-FAT has the ability to extract
different types of evidence. The system will process and index the image using
multiple AIA systems and incorporate the use of metadata and image features to
effectively and efficiently retrieve the evidence. The overall architecture of the
proposed Object-based Multimedia Forensic Analysis Tool (OM-FAT) system is
depicted in Figure 4.1.
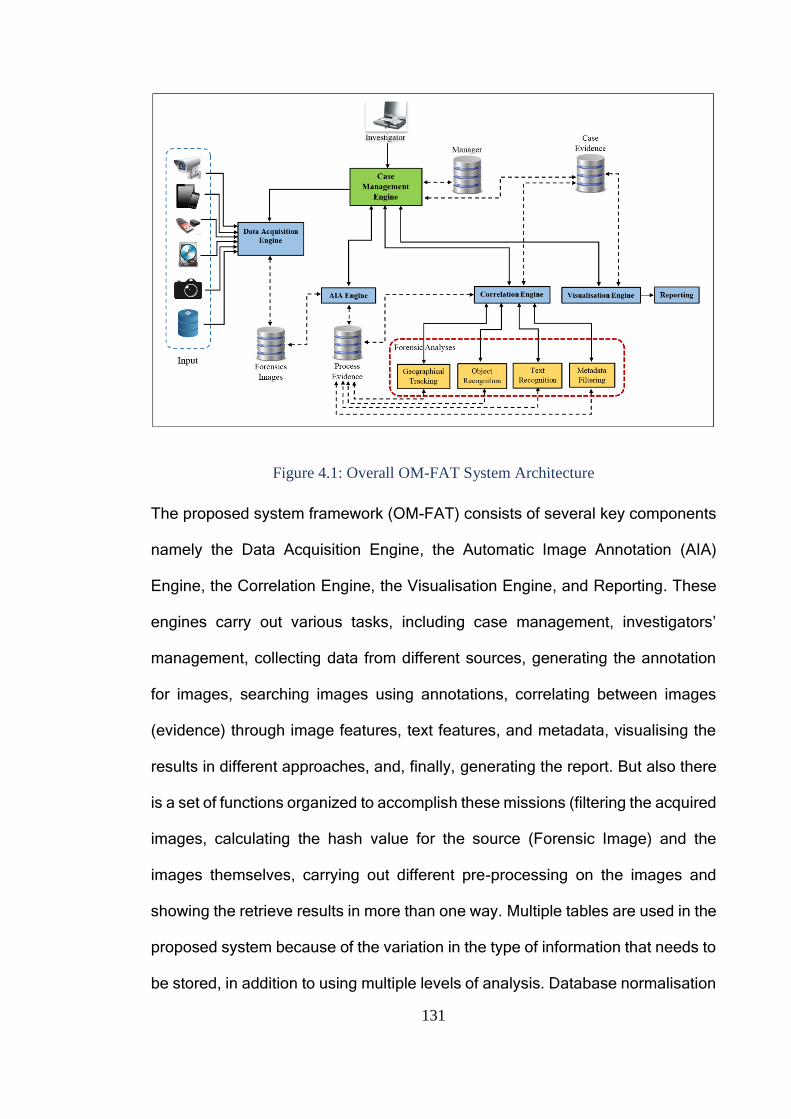
131
Figure 4.1: Overall OM-FAT System Architecture
The proposed system framework (OM-FAT) consists of several key components
namely the Data Acquisition Engine, the Automatic Image Annotation (AIA)
Engine, the Correlation Engine, the Visualisation Engine, and Reporting. These
engines carry out various tasks, including case management, investigators’
management, collecting data from different sources, generating the annotation
for images, searching images using annotations, correlating between images
(evidence) through image features, text features, and metadata, visualising the
results in different approaches, and, finally, generating the report. But also there
is a set of functions organized to accomplish these missions (filtering the acquired
images, calculating the hash value for the source (Forensic Image) and the
images themselves, carrying out different pre-processing on the images and
showing the retrieve results in more than one way. Multiple tables are used in the
proposed system because of the variation in the type of information that needs to
be stored, in addition to using multiple levels of analysis. Database normalisation
132
is employed to improve the database’s performance including accuracy, speed,
efficiency, and producing the expected data. The system operations sequence
and data flow will be explained in the following:
The investigator received the case details with sources of digital evidence
such as CCTV, hard disk or other digital media sources, etc. and also the
preliminary evidence collected from the crime scene. The investigator can
use the OM-FAT and interact with the tool components via the Case
Management engine that responsible for managing the overall system and
provides the interface to the forensics investigator. It enables the
investigator to create and configuring new cases, open a case that has
previously been created, archiving a case, adding new users to a database
and assigning roles, managing roles and customize the global settings.
After creating the case, the system will start the acquisition phase (Data
Acquisition engine) to acquire the images from the collected sources. In
this stage, the investigator uses filters to quickly locate specific objects and
exclude data that do not want to be analysed to reduce the time of
acquisition and analysis. In addition, the system will carry out different pre-
processing techniques that include calculating a hash value, convert video
files to images, extracting metadata, image resize and enhancement. After
storing the images with their details in the system database, the data
(images) will be sent to the AIA engine to generate the annotations for each
image and store them in the database.
Once the case is created and the sources are acquired and examined, the
system provides the investigator with analysis interface (Correlation
engine) that include multiple options to start conducting the analysis stage.
133
The Correlation engine employs different types of image retrieval
techniques to meet all retrieval requirements (annotation, object, text,
metadata, etc.) so as to analyse the acquired images based on the type of
evidence. The first stage of analysis is the use of search terms
(annotations) and defining search criteria (search filters, probability score
and number of retrieved images). To keep track of particular search
results, the investigator can select all or part of retrieved images that want
to include in the bookmarks. After that, the system enables the investigator
to exclude undesirable data by using forensic analysis techniques, which
correlate between images through different approaches, in order to reduce
the search domain and find the desirable images.
Finally, the investigator can create a case report includes case information,
the investigator(s) details and bookmarks, which include all detail
regarding the retrieval process such as investigator name, time, date and
search criteria, and also the retrieved images. In addition to the above-
mentioned processes, the system documents all actions performed in the
case to obtain a clear view of what has been achieved.
Each the OM_FAT engines and their functionalities will be fully discussed in the
following sections.
4.3.1 Case Management Engine
This engine represents an interface between investigators and the underlying
engines that help investigators manage the overall system. The aim of this engine
is to make sure to do not change of data chain custody and integrity of data to
keep principle in forensic. It is able to maintain both far better than non-case
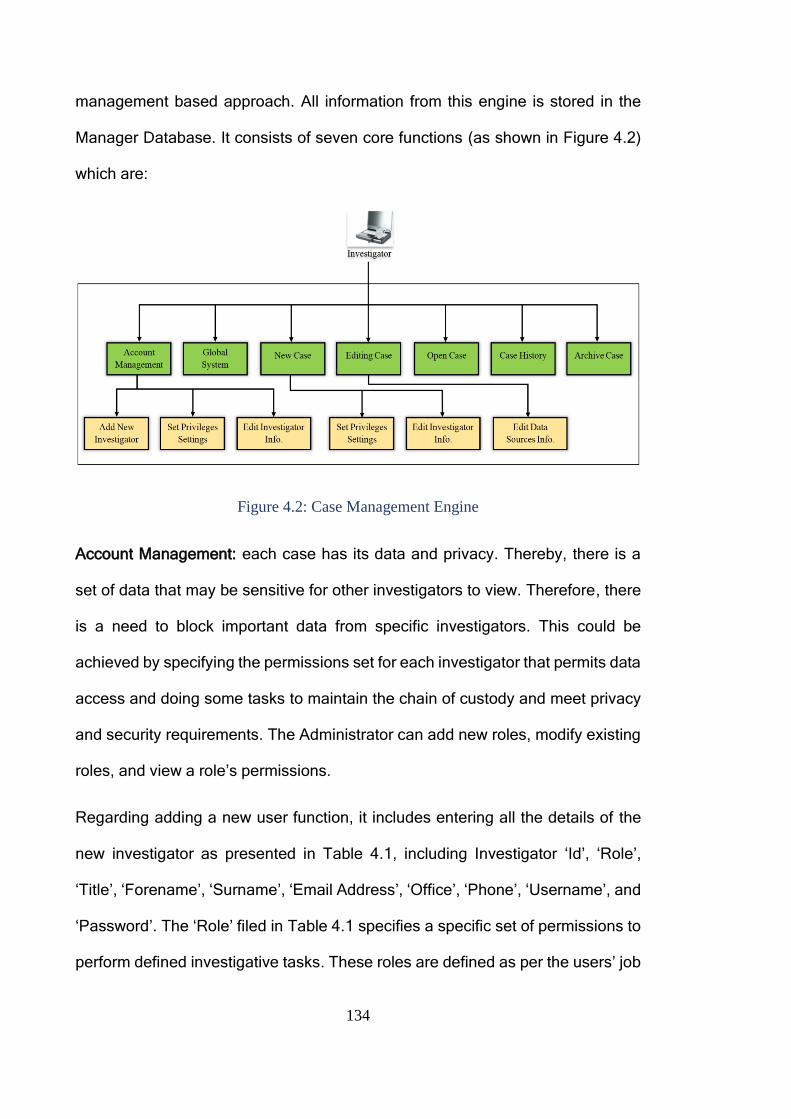
134
management based approach. All information from this engine is stored in the
Manager Database. It consists of seven core functions (as shown in Figure 4.2)
which are:
Figure 4.2: Case Management Engine
Account Management: each case has its data and privacy. Thereby, there is a
set of data that may be sensitive for other investigators to view. Therefore, there
is a need to block important data from specific investigators. This could be
achieved by specifying the permissions set for each investigator that permits data
access and doing some tasks to maintain the chain of custody and meet privacy
and security requirements. The Administrator can add new roles, modify existing
roles, and view a role’s permissions.
Regarding adding a new user function, it includes entering all the details of the
new investigator as presented in Table 4.1, including Investigator ‘Id’, ‘Role’,
‘Title’, ‘Forename’, ‘Surname’, ‘Email Address’, ‘Office’, ‘Phone’, ‘Username’, and
‘Password’. The ‘Role’ filed in Table 4.1 specifies a specific set of permissions to
perform defined investigative tasks. These roles are defined as per the users’ job
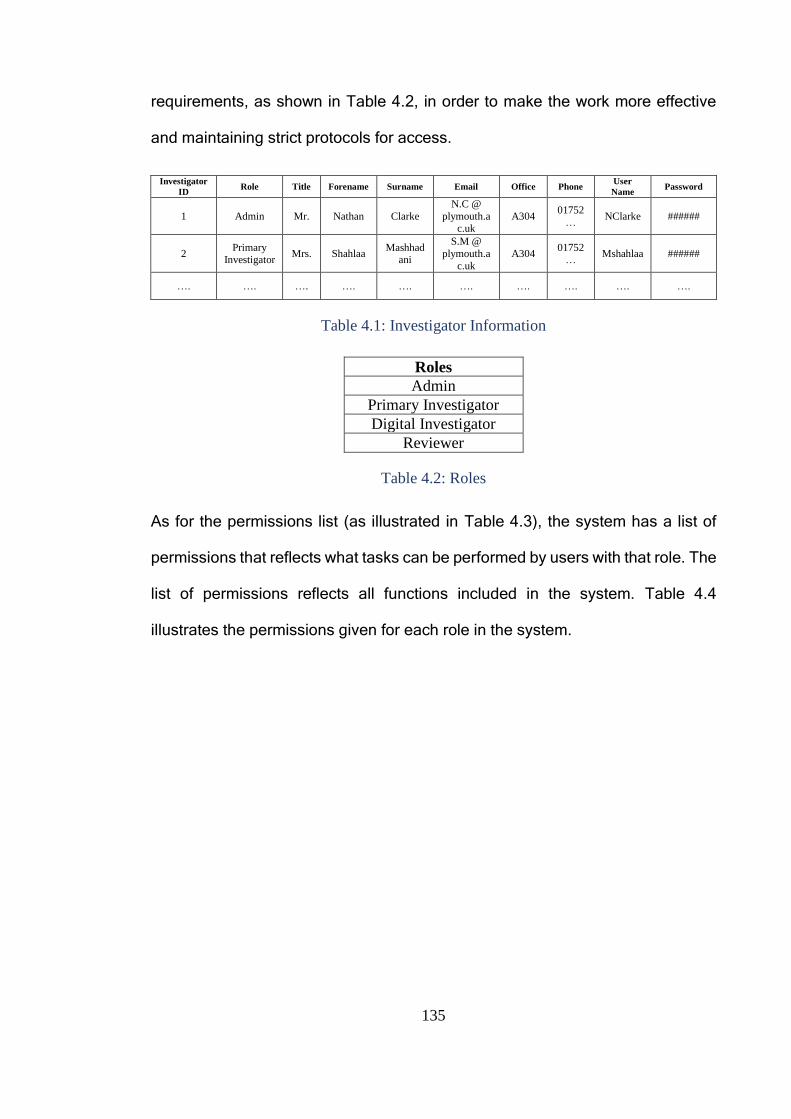
135
requirements, as shown in Table 4.2, in order to make the work more effective
and maintaining strict protocols for access.
Investigator
ID Role Title Forename Surname Email Office Phone
User
Name Password
1 Admin Mr. Nathan Clarke
N.C @
plymouth.ac.uk
A304 01752
… NClarke ######
2 Primary
Investigator Mrs. Shahlaa
Mashhadani
S.M @
plymouth.a
c.uk
A304 01752
… Mshahlaa ######
…. …. …. …. …. …. …. …. …. ….
Table 4.1: Investigator Information
Roles
Admin
Primary Investigator
Digital Investigator
Reviewer
Table 4.2: Roles
As for the permissions list (as illustrated in Table 4.3), the system has a list of
permissions that reflects what tasks can be performed by users with that role. The
list of permissions reflects all functions included in the system. Table 4.4
illustrates the permissions given for each role in the system.
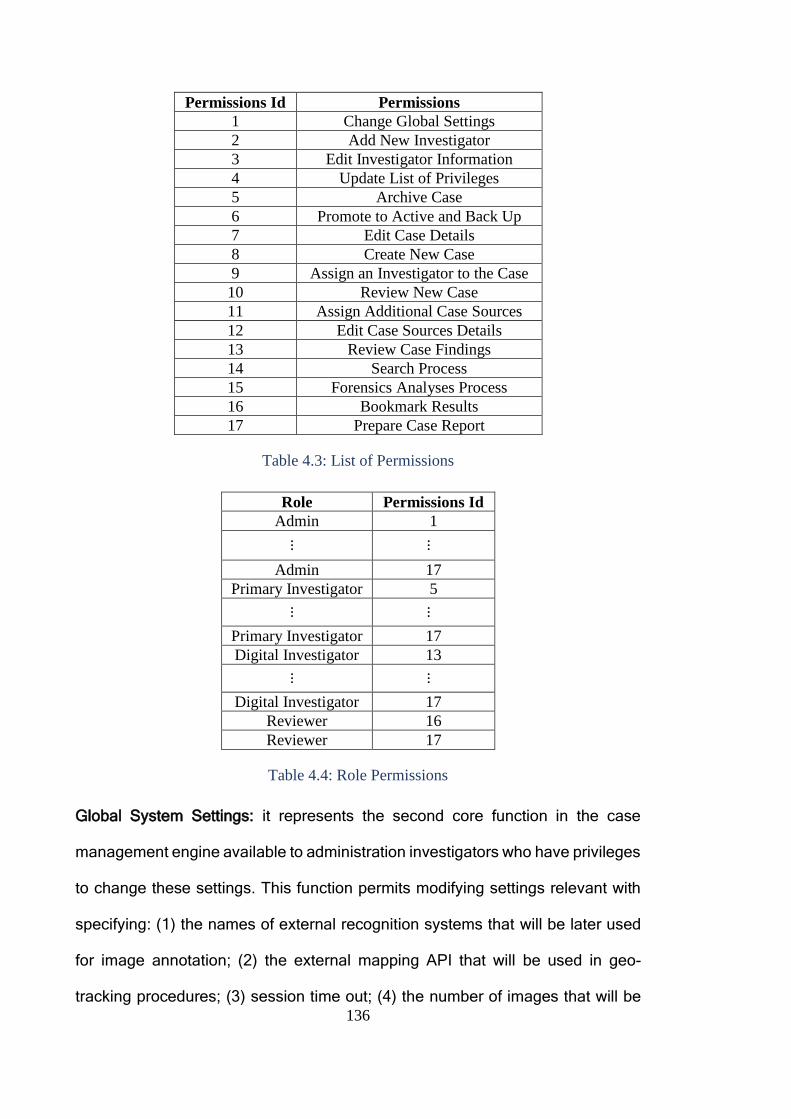
136
Permissions Id Permissions
1 Change Global Settings
2 Add New Investigator
3 Edit Investigator Information
4 Update List of Privileges
5 Archive Case
6 Promote to Active and Back Up
7 Edit Case Details
8 Create New Case
9 Assign an Investigator to the Case
10 Review New Case
11 Assign Additional Case Sources
12 Edit Case Sources Details
13 Review Case Findings
14 Search Process
15 Forensics Analyses Process
16 Bookmark Results
17 Prepare Case Report
Table 4.3: List of Permissions
Role Permissions Id
Admin 1
...
...
Admin 17
Primary Investigator 5
...
...
Primary Investigator 17
Digital Investigator 13
...
...
Digital Investigator 17
Reviewer 16
Reviewer 17
Table 4.4: Role Permissions
Global System Settings: it represents the second core function in the case
management engine available to administration investigators who have privileges
to change these settings. This function permits modifying settings relevant with
specifying: (1) the names of external recognition systems that will be later used
for image annotation; (2) the external mapping API that will be used in geo-
tracking procedures; (3) session time out; (4) the number of images that will be
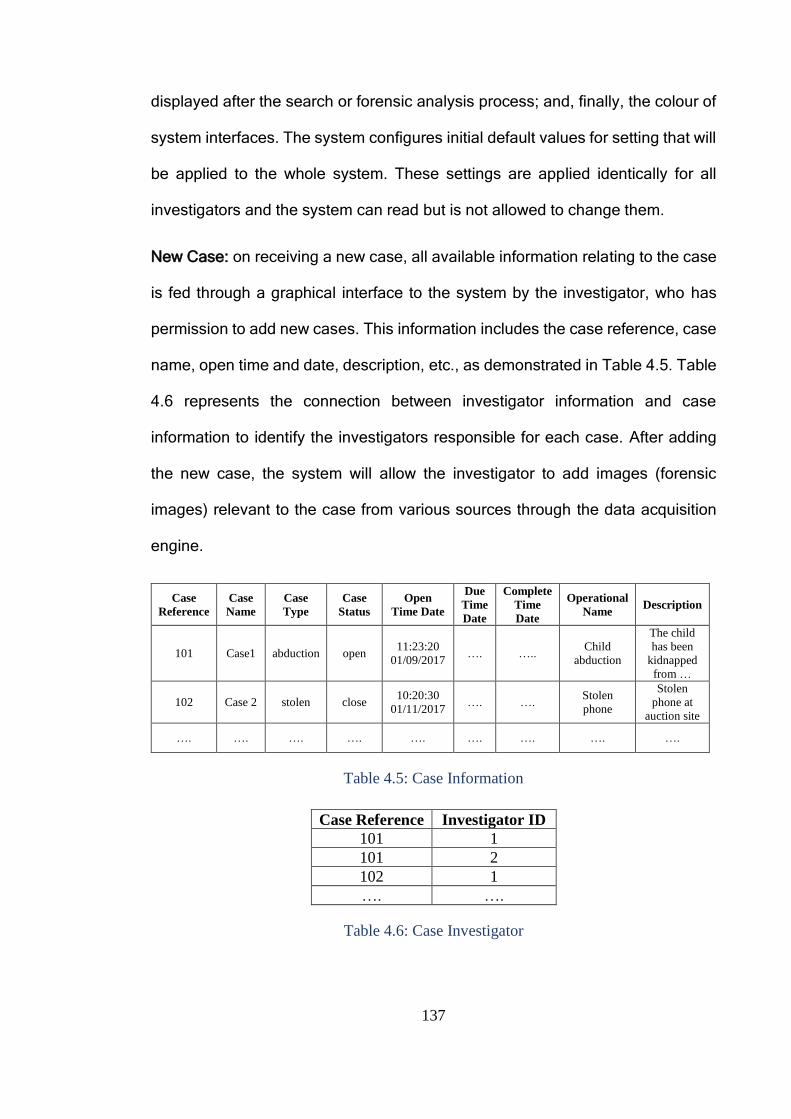
137
displayed after the search or forensic analysis process; and, finally, the colour of
system interfaces. The system configures initial default values for setting that will
be applied to the whole system. These settings are applied identically for all
investigators and the system can read but is not allowed to change them.
New Case: on receiving a new case, all available information relating to the case
is fed through a graphical interface to the system by the investigator, who has
permission to add new cases. This information includes the case reference, case
name, open time and date, description, etc., as demonstrated in Table 4.5. Table
4.6 represents the connection between investigator information and case
information to identify the investigators responsible for each case. After adding
the new case, the system will allow the investigator to add images (forensic
images) relevant to the case from various sources through the data acquisition
engine.
Case
Reference
Case
Name
Case
Type
Case
Status
Open
Time Date
Due
Time
Date
Complete
Time
Date
Operational
Name Description
101 Case1 abduction open 11:23:20
01/09/2017 …. …..
Child
abduction
The child
has been
kidnapped
from …
102 Case 2 stolen close 10:20:30
01/11/2017 …. ….
Stolen
phone
Stolen
phone at
auction site
…. …. …. …. …. …. …. …. ….
Table 4.5: Case Information
Case Reference Investigator ID
101 1
101 2
102 1
…. ….
Table 4.6: Case Investigator
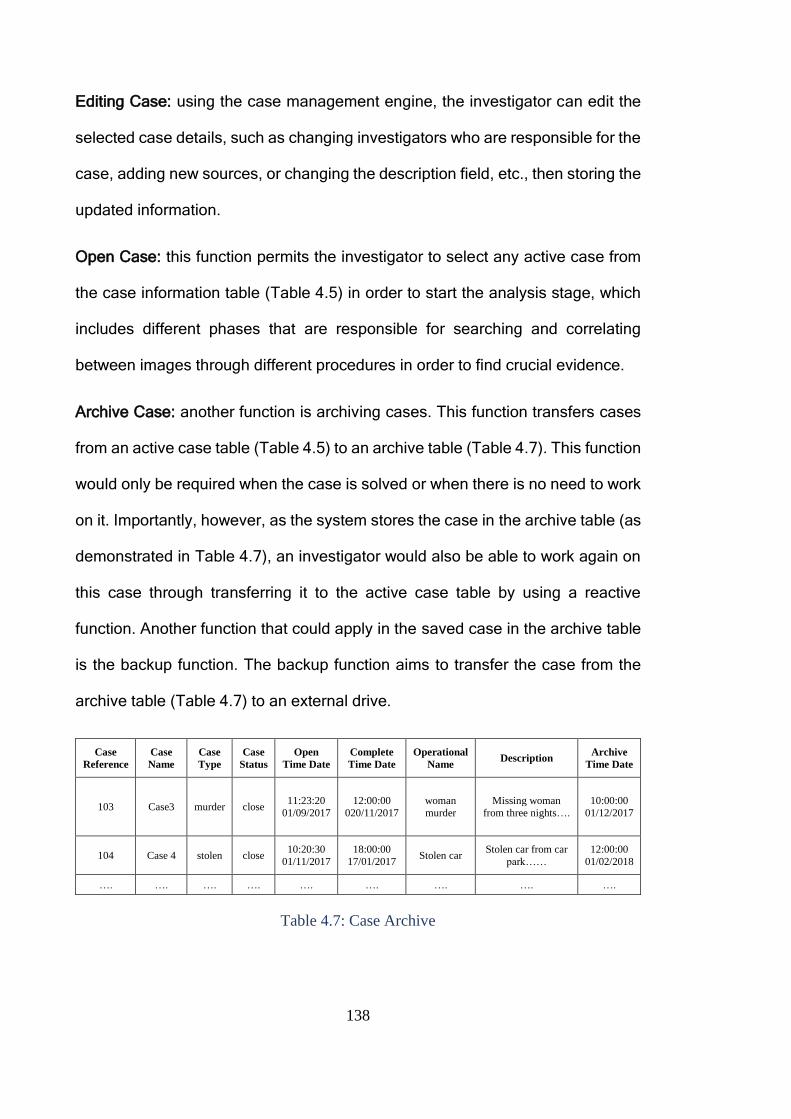
138
Editing Case: using the case management engine, the investigator can edit the
selected case details, such as changing investigators who are responsible for the
case, adding new sources, or changing the description field, etc., then storing the
updated information.
Open Case: this function permits the investigator to select any active case from
the case information table (Table 4.5) in order to start the analysis stage, which
includes different phases that are responsible for searching and correlating
between images through different procedures in order to find crucial evidence.
Archive Case: another function is archiving cases. This function transfers cases
from an active case table (Table 4.5) to an archive table (Table 4.7). This function
would only be required when the case is solved or when there is no need to work
on it. Importantly, however, as the system stores the case in the archive table (as
demonstrated in Table 4.7), an investigator would also be able to work again on
this case through transferring it to the active case table by using a reactive
function. Another function that could apply in the saved case in the archive table
is the backup function. The backup function aims to transfer the case from the
archive table (Table 4.7) to an external drive.
Case
Reference
Case
Name
Case
Type
Case
Status
Open
Time Date
Complete
Time Date
Operational
Name Description
Archive
Time Date
103 Case3 murder close 11:23:20
01/09/2017
12:00:00
020/11/2017
woman
murder
Missing woman
from three nights….
10:00:00
01/12/2017
104 Case 4 stolen close 10:20:30
01/11/2017
18:00:00
17/01/2017 Stolen car
Stolen car from car
park……
12:00:00
01/02/2018
…. …. …. …. …. …. …. …. ….
Table 4.7: Case Archive
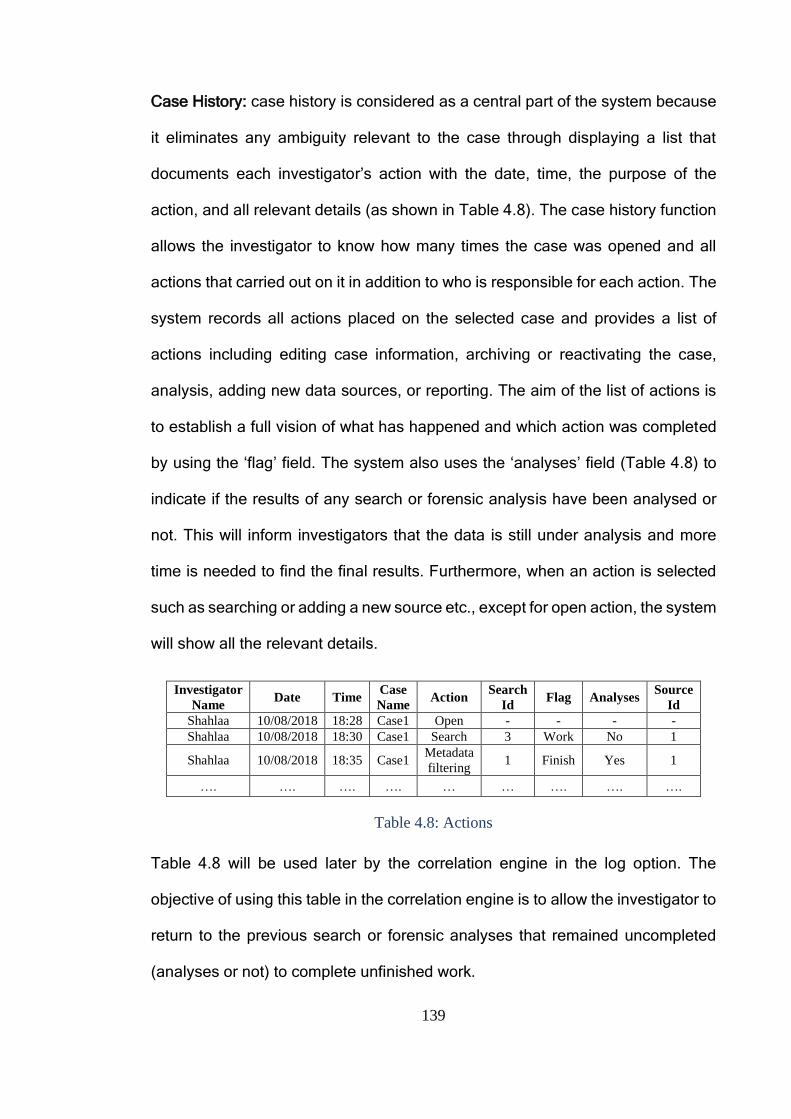
139
Case History: case history is considered as a central part of the system because
it eliminates any ambiguity relevant to the case through displaying a list that
documents each investigator’s action with the date, time, the purpose of the
action, and all relevant details (as shown in Table 4.8). The case history function
allows the investigator to know how many times the case was opened and all
actions that carried out on it in addition to who is responsible for each action. The
system records all actions placed on the selected case and provides a list of
actions including editing case information, archiving or reactivating the case,
analysis, adding new data sources, or reporting. The aim of the list of actions is
to establish a full vision of what has happened and which action was completed
by using the ‘flag’ field. The system also uses the ‘analyses’ field (Table 4.8) to
indicate if the results of any search or forensic analysis have been analysed or
not. This will inform investigators that the data is still under analysis and more
time is needed to find the final results. Furthermore, when an action is selected
such as searching or adding a new source etc., except for open action, the system
will show all the relevant details.
Investigator
Name Date Time
Case
Name Action
Search
Id Flag Analyses
Source
Id
Shahlaa 10/08/2018 18:28 Case1 Open - - - -
Shahlaa 10/08/2018 18:30 Case1 Search 3 Work No 1
Shahlaa 10/08/2018 18:35 Case1 Metadata
filtering 1 Finish Yes 1
…. …. …. …. … … …. …. ….
Table 4.8: Actions
Table 4.8 will be used later by the correlation engine in the log option. The
objective of using this table in the correlation engine is to allow the investigator to
return to the previous search or forensic analyses that remained uncompleted
(analyses or not) to complete unfinished work.
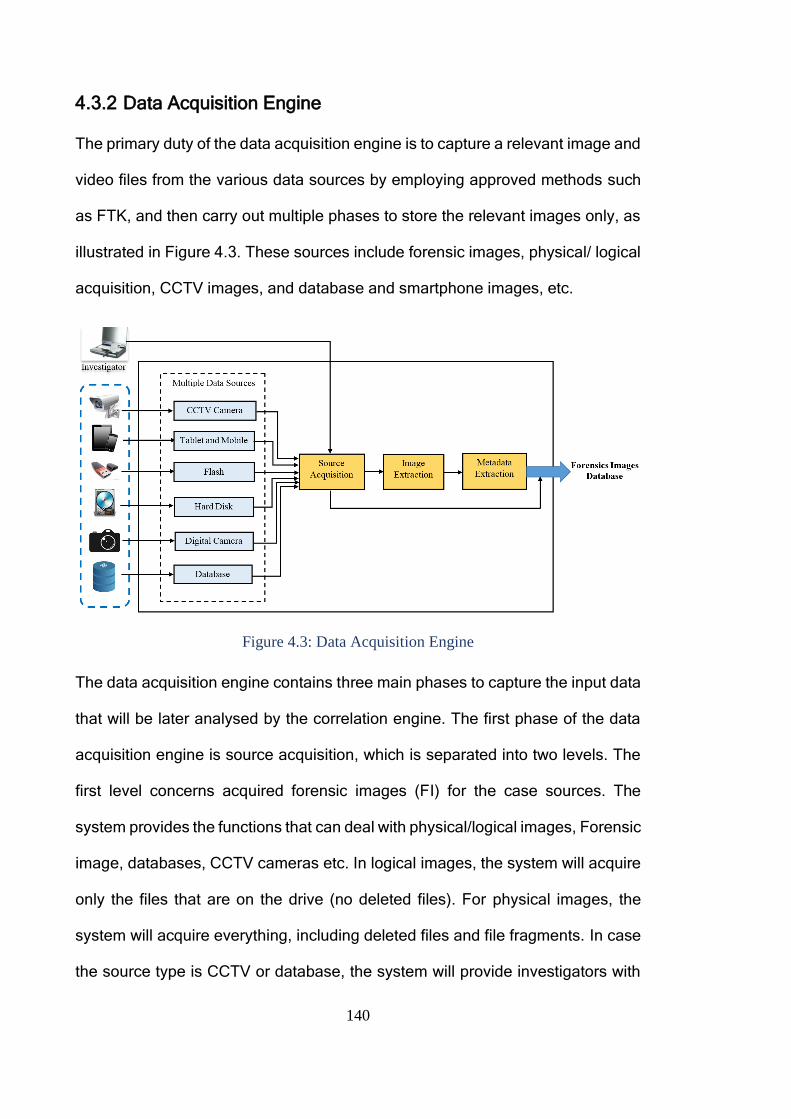
140
4.3.2 Data Acquisition Engine
The primary duty of the data acquisition engine is to capture a relevant image and
video files from the various data sources by employing approved methods such
as FTK, and then carry out multiple phases to store the relevant images only, as
illustrated in Figure 4.3. These sources include forensic images, physical/ logical
acquisition, CCTV images, and database and smartphone images, etc.
Figure 4.3: Data Acquisition Engine
The data acquisition engine contains three main phases to capture the input data
that will be later analysed by the correlation engine. The first phase of the data
acquisition engine is source acquisition, which is separated into two levels. The
first level concerns acquired forensic images (FI) for the case sources. The
system provides the functions that can deal with physical/logical images, Forensic
image, databases, CCTV cameras etc. In logical images, the system will acquire
only the files that are on the drive (no deleted files). For physical images, the
system will acquire everything, including deleted files and file fragments. In case
the source type is CCTV or database, the system will provide investigators with
141
multiple filters before the acquisition process such as the time, date, location, file
format, camera model etc. The aim of these filters is to find interesting files that
should be acquired and investigated from a large number of files (data reduction),
thereby reducing the time and the effort spent on the investigation. Thereafter,
the system will store a copy of the selected data and associated metadata from
different sources, such as CCTV cameras, mobile phone, digital cameras, etc.,
so it can be examined separately without changing the original data collected.
Finally, the system will calculate hash values for each FI to ensure the
preservation of data integrity from any manipulation or change. In addition to
acquired FI, the system will save all relevant information such as FI location,
which shows where the FI will be saved or where the FI comes from (CCVT
location), FI size, date, the acquisition started timestamp, and the finished
timestamp. The FI of files may contain various file types, compressed files, or
unallocated files. In the second level of the source acquisition phase, data filtering
is carried out to find interesting files (image/video files only) that need be
investigated from a large number of captured files. The system will use image file
formats such as JPEG, PNG, or GIF etc. and video files formats MOV, AVI, DIVX,
60D, or MPG etc. and metadata to filter the FI. Some file extensions may be
changed leads to missing these files. Consequently, there is a need for pre-
processing before data filtering and file signature analysis is used to spot
suspicious files. In addition to file signature analysis, other pre-processing should
be carried out including data carving and data compounding. The aim of
employing data carving is to retrieve important data and evidence from damaged
or corrupted data sources (Garfinkel, 2007) whereas expanding compound files
allows for opening email files, compressed files, and system files and collecting
142
all relevant files (Tipa, 2018). The task of pre-processing is dependent on the type
of resource. For instance, in case the source is the image database, there is no
need to perform any of pre-processing. After extracting all images and video files,
the system will calculate hash values for each file. Once the source acquisition
has captured all images/video files, the data acquisition engine will proceed to the
image extraction phase and the system will extract video files only in order to
convert them into images with JPEG format. All videos are converted to images
by choosing one of the following methods depending on the investigator's choice:
(1) extracting an image every number of frames; (2) extracting an image every
number of seconds; (3) taking a total number of frames from the video; finally,
extracting every single frame. The output from the image extraction phase, which
involves existing images and images extracted from video files, will be fed to the
metadata extraction phase, which represents the last phase of the data
acquisition engine to extract metadata for all images. Metadata represents
valuable information about the images because it identifies where and when an
image was taken and the device module that captured the footage. Thereby, it
assists in improving the analysis and decision-making process, which leads to a
successful investigation. Image metadata varies in content and format based on
the image file format, such as JPEG, GIF, PNG or BMP. The exchangeable image
file format (EXIF) metadata for JPEG format involves date taken, dimensions,
camera maker, camera model, timestamp, item type, folder path, GPS
information, and many other important data. The system will choose the part of
image metadata that is useful for the investigation. The GPS information will be
converted to latitude and longitude to use it later in the geo tracking procedure
that uses Google Maps. As long as there is various image evidence that has been
143
captured from different devices, some will have poor quality and will be highly
variable in size and content. Therefore, image quality is an important criterion in
image analysis because the reliability of any inspection task is based on the
quality. Therefore, the image under consideration should be checked first to
determine whether the image quality is sufficient to allow for a meaningful and
reliable analysis. For instance, the images captured by CCTV cameras and other
types of cameras may suffer significantly from noise, poor quality, illumination,
contrast, or other factors. Consequently, once the metadata extraction phase is
completed (add new data source) the system will start employing different image
pre-processing operations on the image to improve the visual appearance of
features in the image including image resizing, image enhancement, image
restoration, and other image processing activities. Therefore, this stage focuses
on steps that enhance image quality and make them more suitable for image
analysis than their original state (if required). Thus, before the pre-processing
stage, a copy of the images must be created to ensure the original images are
always available. Later, the image quality will affect the performance of the AIA
systems used by the AIA engine, thereby improving image retrieval performance
later on. Finally, all images and their metadata are saved in the forensic image
database.
The forensic image database is used to store all acquired images, in addition to
their metadata and the source details relevant to the selected case. The general
structure of the database of the forensic image consists of four tables. Table 4.9
is used to identify all sources related to each case.
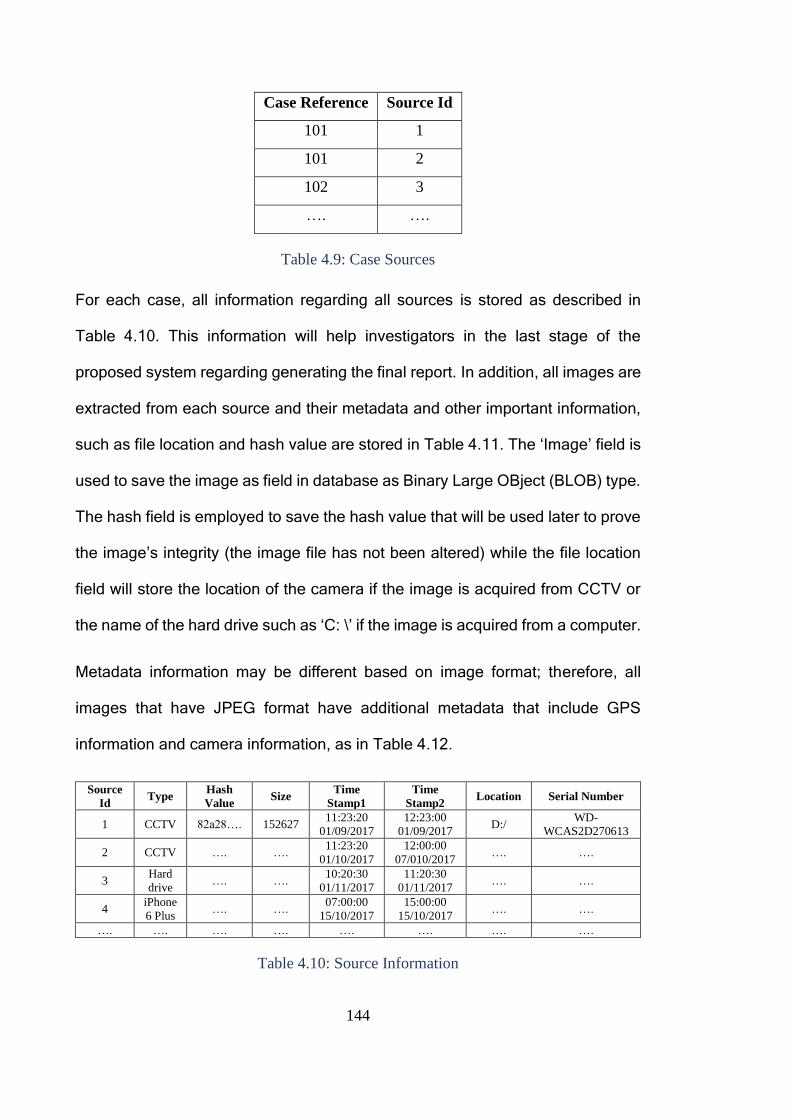
144
Case Reference Source Id
101 1
101 2
102 3
…. ….
Table 4.9: Case Sources
For each case, all information regarding all sources is stored as described in
Table 4.10. This information will help investigators in the last stage of the
proposed system regarding generating the final report. In addition, all images are
extracted from each source and their metadata and other important information,
such as file location and hash value are stored in Table 4.11. The ‘Image’ field is
used to save the image as field in database as Binary Large OBject (BLOB) type.
The hash field is employed to save the hash value that will be used later to prove
the image’s integrity (the image file has not been altered) while the file location
field will store the location of the camera if the image is acquired from CCTV or
the name of the hard drive such as ‘C: \’ if the image is acquired from a computer.
Metadata information may be different based on image format; therefore, all
images that have JPEG format have additional metadata that include GPS
information and camera information, as in Table 4.12.
Source
Id Type
Hash
Value Size
Time
Stamp1
Time
Stamp2 Location Serial Number
1 CCTV 82a28…. 152627 11:23:20
01/09/2017
12:23:00
01/09/2017 D:/
WD-
WCAS2D270613
2 CCTV …. …. 11:23:20
01/10/2017
12:00:00
07/010/2017 …. ….
3 Hard
drive …. ….
10:20:30
01/11/2017
11:20:30
01/11/2017 …. ….
4 iPhone
6 Plus …. ….
07:00:00
15/10/2017
15:00:00
15/10/2017 …. ….
…. …. …. …. …. …. …. ….
Table 4.10: Source Information
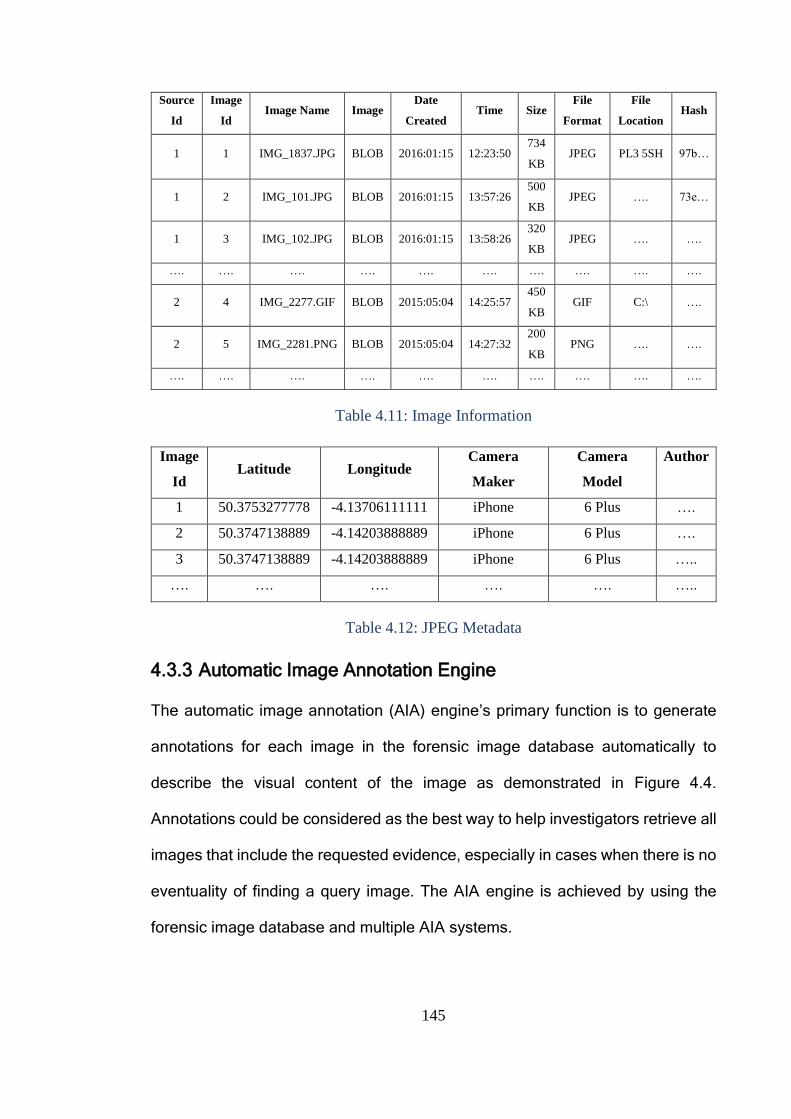
145
Source
Id
Image
Id Image Name Image
Date
Created Time Size
File
Format
File
Location Hash
1 1 IMG_1837.JPG BLOB 2016:01:15 12:23:50 734
KB JPEG PL3 5SH 97b…
1 2 IMG_101.JPG BLOB 2016:01:15 13:57:26 500
KB JPEG …. 73e…
1 3 IMG_102.JPG BLOB 2016:01:15 13:58:26 320
KB JPEG …. ….
…. …. …. …. …. …. …. …. …. ….
2 4 IMG_2277.GIF BLOB 2015:05:04 14:25:57 450
KB GIF C:\ ….
2 5 IMG_2281.PNG BLOB 2015:05:04 14:27:32 200
KB PNG …. ….
…. …. …. …. …. …. …. …. …. ….
Table 4.11: Image Information
Image
Id Latitude Longitude
Camera
Maker
Camera
Model
Author
1 50.3753277778 -4.13706111111 iPhone 6 Plus ….
2 50.3747138889 -4.14203888889 iPhone 6 Plus ….
3 50.3747138889 -4.14203888889 iPhone 6 Plus …..
…. …. …. …. …. …..
Table 4.12: JPEG Metadata
4.3.3 Automatic Image Annotation Engine
The automatic image annotation (AIA) engine’s primary function is to generate
annotations for each image in the forensic image database automatically to
describe the visual content of the image as demonstrated in Figure 4.4.
Annotations could be considered as the best way to help investigators retrieve all
images that include the requested evidence, especially in cases when there is no
eventuality of finding a query image. The AIA engine is achieved by using the
forensic image database and multiple AIA systems.
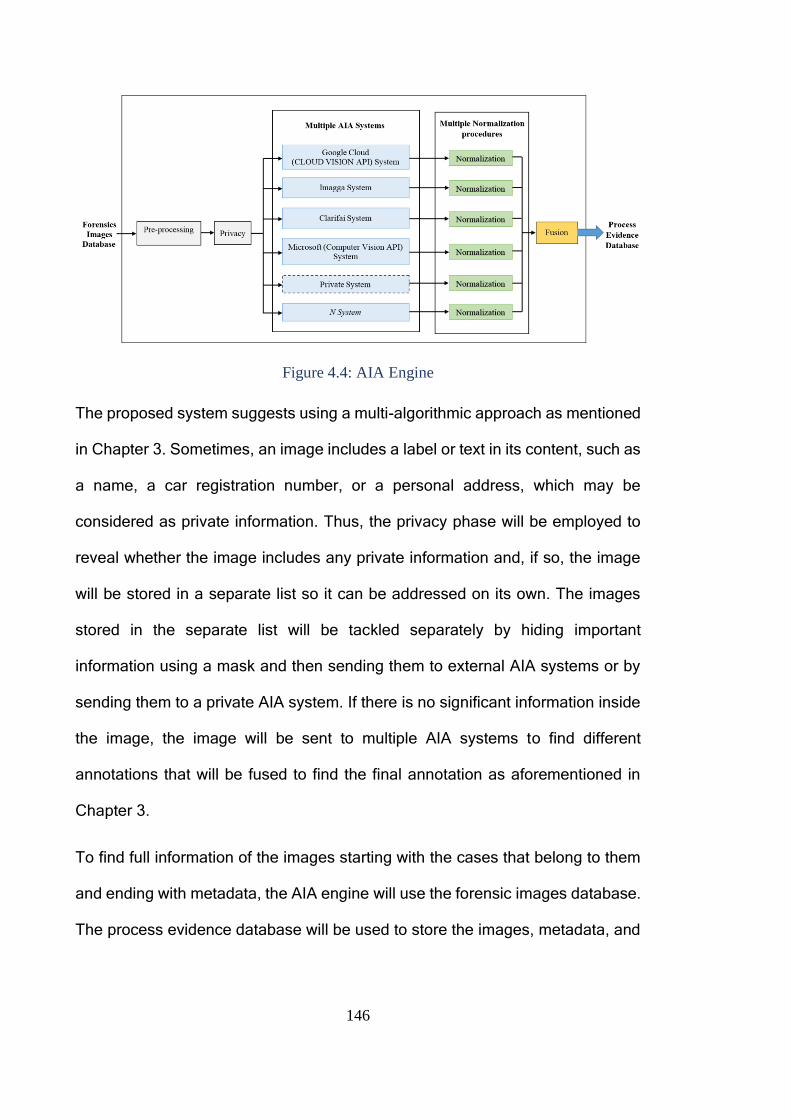
146
Figure 4.4: AIA Engine
The proposed system suggests using a multi-algorithmic approach as mentioned
in Chapter 3. Sometimes, an image includes a label or text in its content, such as
a name, a car registration number, or a personal address, which may be
considered as private information. Thus, the privacy phase will be employed to
reveal whether the image includes any private information and, if so, the image
will be stored in a separate list so it can be addressed on its own. The images
stored in the separate list will be tackled separately by hiding important
information using a mask and then sending them to external AIA systems or by
sending them to a private AIA system. If there is no significant information inside
the image, the image will be sent to multiple AIA systems to find different
annotations that will be fused to find the final annotation as aforementioned in
Chapter 3.
To find full information of the images starting with the cases that belong to them
and ending with metadata, the AIA engine will use the forensic images database.
The process evidence database will be used to store the images, metadata, and
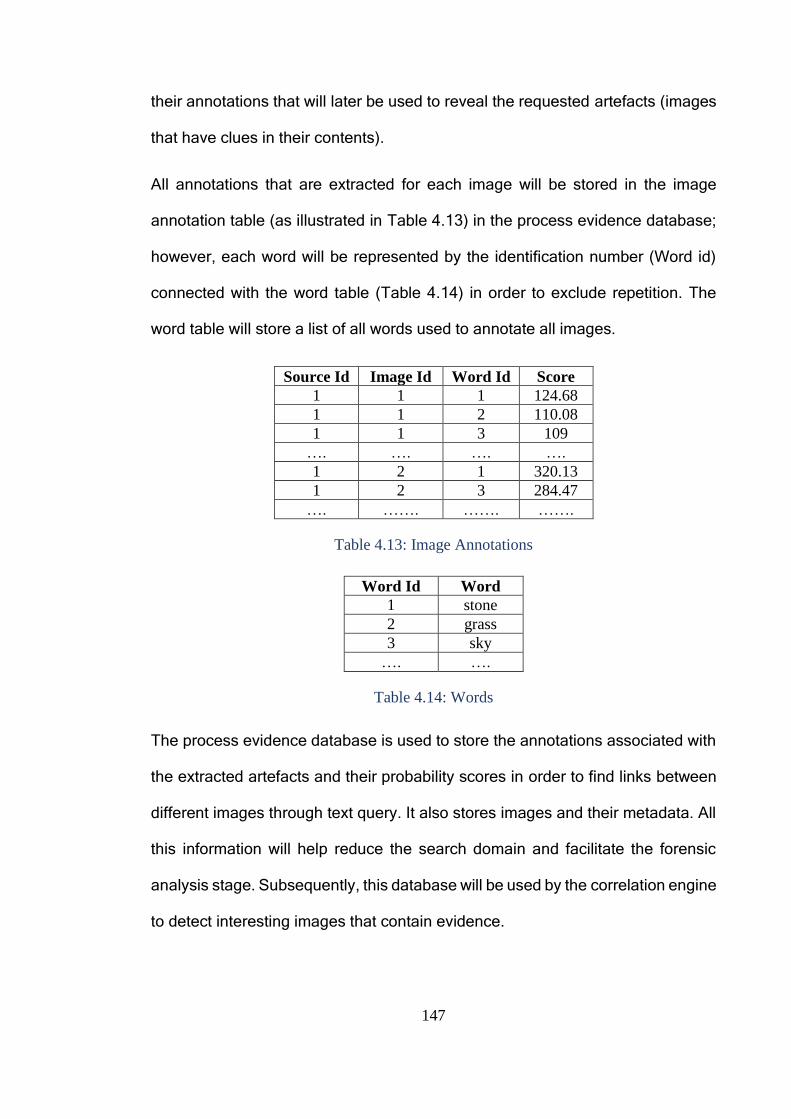
147
their annotations that will later be used to reveal the requested artefacts (images
that have clues in their contents).
All annotations that are extracted for each image will be stored in the image
annotation table (as illustrated in Table 4.13) in the process evidence database;
however, each word will be represented by the identification number (Word id)
connected with the word table (Table 4.14) in order to exclude repetition. The
word table will store a list of all words used to annotate all images.
Source Id Image Id Word Id Score
1 1 1 124.68
1 1 2 110.08
1 1 3 109
…. …. …. ….
1 2 1 320.13
1 2 3 284.47
…. ……. ……. …….
Table 4.13: Image Annotations
Word Id Word
1 stone
2 grass
3 sky
…. ….
Table 4.14: Words
The process evidence database is used to store the annotations associated with
the extracted artefacts and their probability scores in order to find links between
different images through text query. It also stores images and their metadata. All
this information will help reduce the search domain and facilitate the forensic
analysis stage. Subsequently, this database will be used by the correlation engine
to detect interesting images that contain evidence.
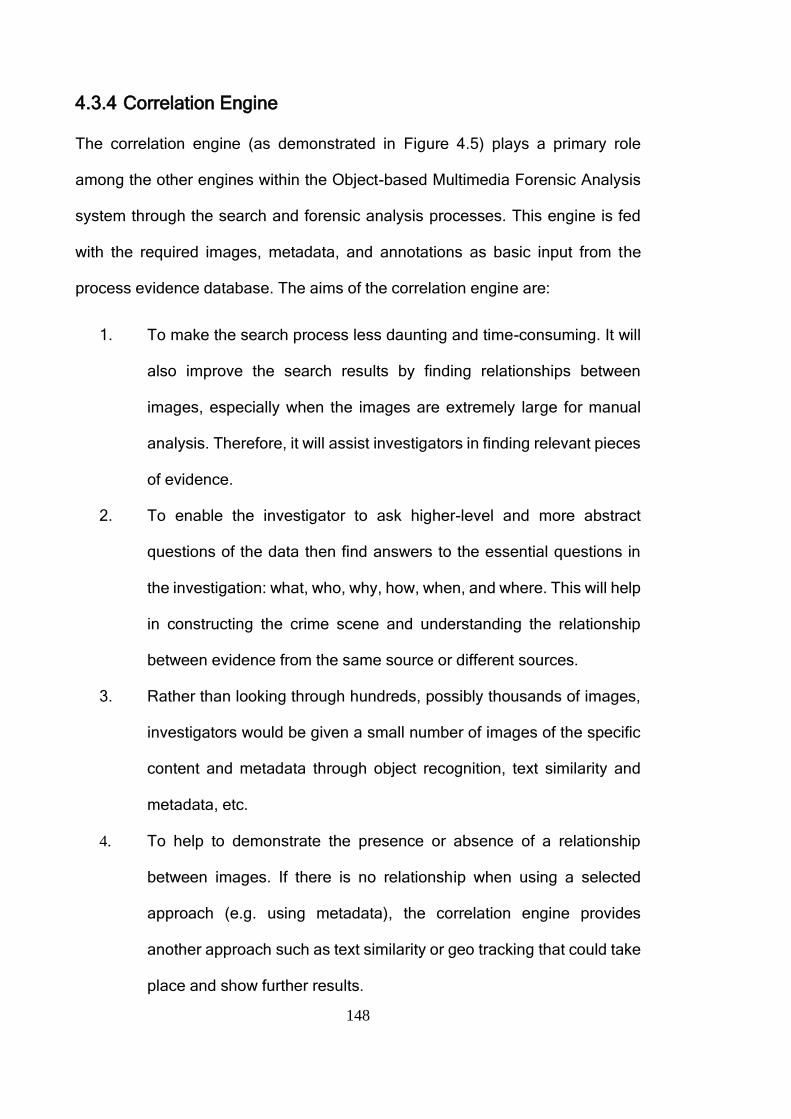
148
4.3.4 Correlation Engine
The correlation engine (as demonstrated in Figure 4.5) plays a primary role
among the other engines within the Object-based Multimedia Forensic Analysis
system through the search and forensic analysis processes. This engine is fed
with the required images, metadata, and annotations as basic input from the
process evidence database. The aims of the correlation engine are:
1. To make the search process less daunting and time-consuming. It will
also improve the search results by finding relationships between
images, especially when the images are extremely large for manual
analysis. Therefore, it will assist investigators in finding relevant pieces
of evidence.
2. To enable the investigator to ask higher-level and more abstract
questions of the data then find answers to the essential questions in
the investigation: what, who, why, how, when, and where. This will help
in constructing the crime scene and understanding the relationship
between evidence from the same source or different sources.
3. Rather than looking through hundreds, possibly thousands of images,
investigators would be given a small number of images of the specific
content and metadata through object recognition, text similarity and
metadata, etc.
4. To help to demonstrate the presence or absence of a relationship
between images. If there is no relationship when using a selected
approach (e.g. using metadata), the correlation engine provides
another approach such as text similarity or geo tracking that could take
place and show further results.
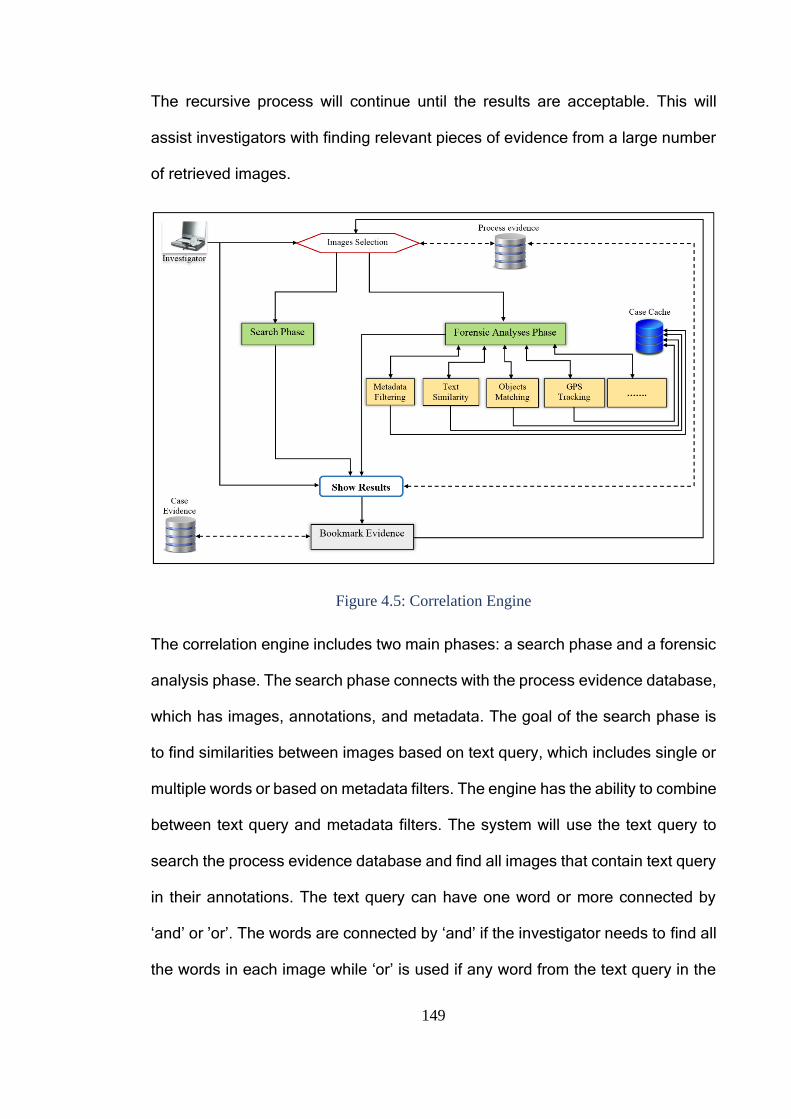
149
The recursive process will continue until the results are acceptable. This will
assist investigators with finding relevant pieces of evidence from a large number
of retrieved images.
Figure 4.5: Correlation Engine
The correlation engine includes two main phases: a search phase and a forensic
analysis phase. The search phase connects with the process evidence database,
which has images, annotations, and metadata. The goal of the search phase is
to find similarities between images based on text query, which includes single or
multiple words or based on metadata filters. The engine has the ability to combine
between text query and metadata filters. The system will use the text query to
search the process evidence database and find all images that contain text query
in their annotations. The text query can have one word or more connected by
‘and’ or ’or’. The words are connected by ‘and’ if the investigator needs to find all
the words in each image while ‘or’ is used if any word from the text query in the
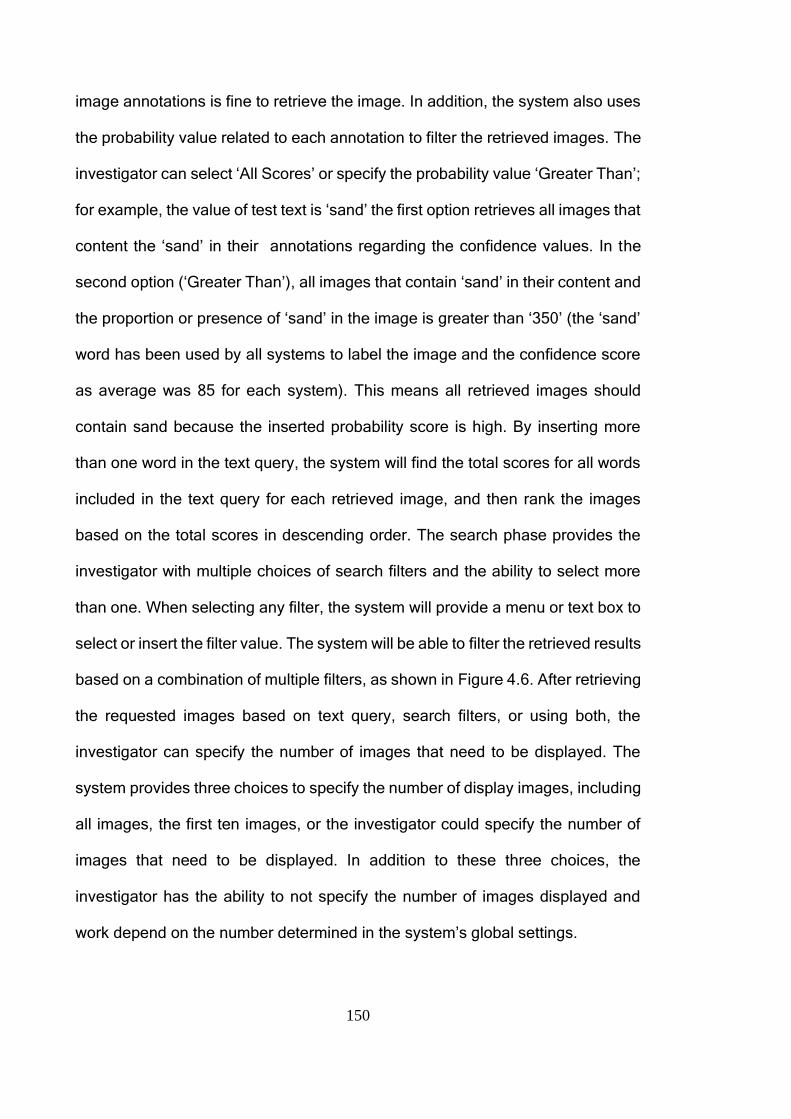
150
image annotations is fine to retrieve the image. In addition, the system also uses
the probability value related to each annotation to filter the retrieved images. The
investigator can select ‘All Scores’ or specify the probability value ‘Greater Than’;
for example, the value of test text is ‘sand’ the first option retrieves all images that
content the ‘sand’ in their annotations regarding the confidence values. In the
second option (‘Greater Than’), all images that contain ‘sand’ in their content and
the proportion or presence of ‘sand’ in the image is greater than ‘350’ (the ‘sand’
word has been used by all systems to label the image and the confidence score
as average was 85 for each system). This means all retrieved images should
contain sand because the inserted probability score is high. By inserting more
than one word in the text query, the system will find the total scores for all words
included in the text query for each retrieved image, and then rank the images
based on the total scores in descending order. The search phase provides the
investigator with multiple choices of search filters and the ability to select more
than one. When selecting any filter, the system will provide a menu or text box to
select or insert the filter value. The system will be able to filter the retrieved results
based on a combination of multiple filters, as shown in Figure 4.6. After retrieving
the requested images based on text query, search filters, or using both, the
investigator can specify the number of images that need to be displayed. The
system provides three choices to specify the number of display images, including
all images, the first ten images, or the investigator could specify the number of
images that need to be displayed. In addition to these three choices, the
investigator has the ability to not specify the number of images displayed and
work depend on the number determined in the system’s global settings.
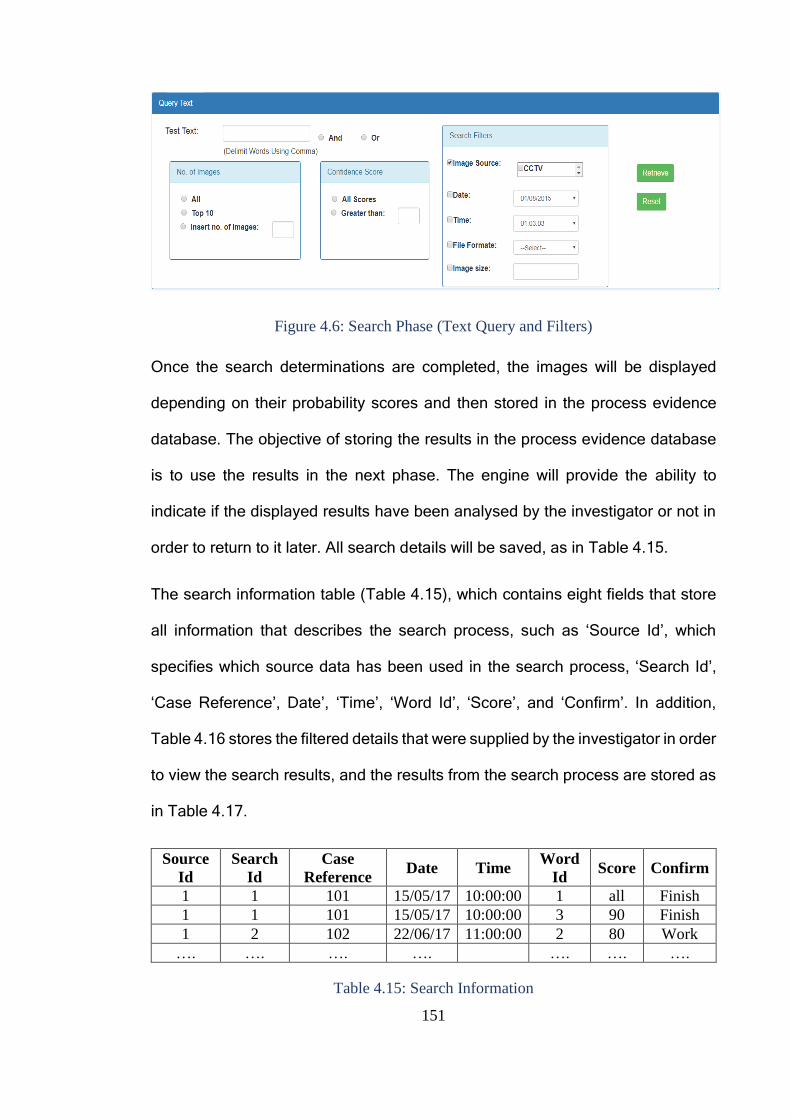
151
Figure 4.6: Search Phase (Text Query and Filters)
Once the search determinations are completed, the images will be displayed
depending on their probability scores and then stored in the process evidence
database. The objective of storing the results in the process evidence database
is to use the results in the next phase. The engine will provide the ability to
indicate if the displayed results have been analysed by the investigator or not in
order to return to it later. All search details will be saved, as in Table 4.15.
The search information table (Table 4.15), which contains eight fields that store
all information that describes the search process, such as ‘Source Id’, which
specifies which source data has been used in the search process, ‘Search Id’,
‘Case Reference’, Date’, ‘Time’, ‘Word Id’, ‘Score’, and ‘Confirm’. In addition,
Table 4.16 stores the filtered details that were supplied by the investigator in order
to view the search results, and the results from the search process are stored as
in Table 4.17.
Source
Id
Search
Id
Case
Reference Date Time
Word
Id Score Confirm
1 1 101 15/05/17 10:00:00 1 all Finish
1 1 101 15/05/17 10:00:00 3 90 Finish
1 2 102 22/06/17 11:00:00 2 80 Work
…. …. …. …. …. …. ….
Table 4.15: Search Information
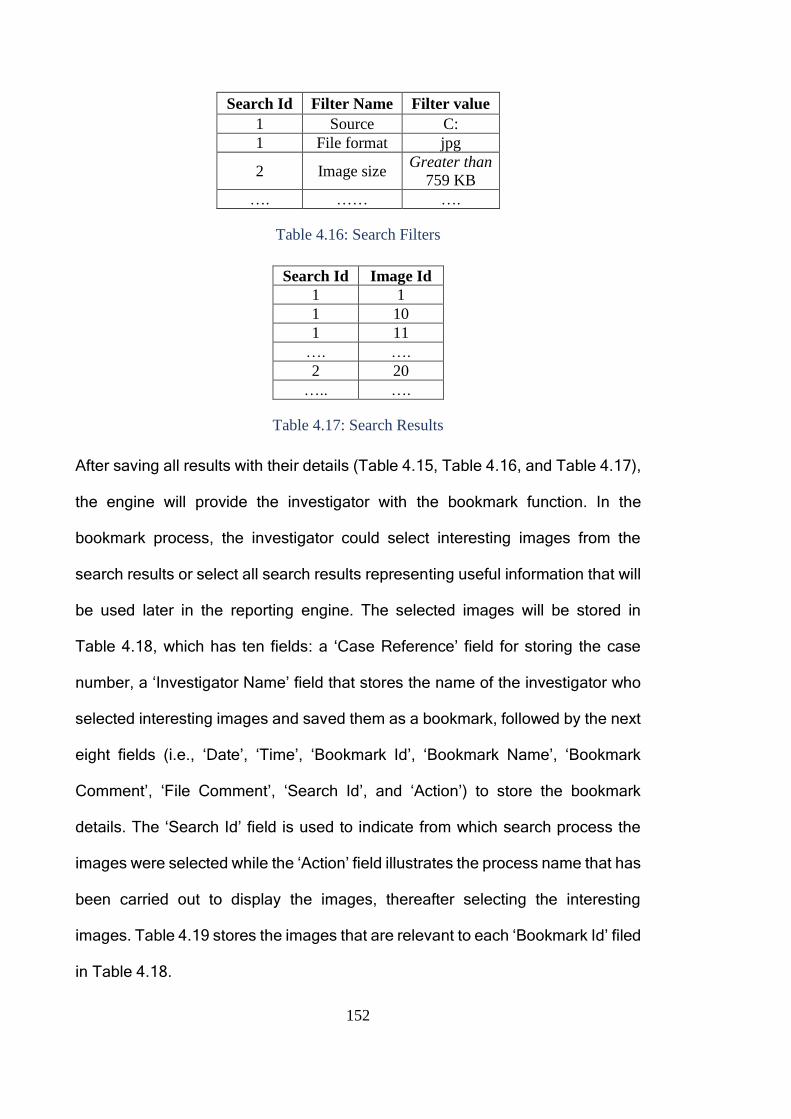
152
Search Id Filter Name Filter value
1 Source C:
1 File format jpg
2 Image size Greater than
759 KB
…. …… ….
Table 4.16: Search Filters
Search Id Image Id
1 1
1 10
1 11
…. ….
2 20
….. ….
Table 4.17: Search Results
After saving all results with their details (Table 4.15, Table 4.16, and Table 4.17),
the engine will provide the investigator with the bookmark function. In the
bookmark process, the investigator could select interesting images from the
search results or select all search results representing useful information that will
be used later in the reporting engine. The selected images will be stored in
Table 4.18, which has ten fields: a ‘Case Reference’ field for storing the case
number, a ‘Investigator Name’ field that stores the name of the investigator who
selected interesting images and saved them as a bookmark, followed by the next
eight fields (i.e., ‘Date’, ‘Time’, ‘Bookmark Id’, ‘Bookmark Name’, ‘Bookmark
Comment’, ‘File Comment’, ‘Search Id’, and ‘Action’) to store the bookmark
details. The ‘Search Id’ field is used to indicate from which search process the
images were selected while the ‘Action’ field illustrates the process name that has
been carried out to display the images, thereafter selecting the interesting
images. Table 4.19 stores the images that are relevant to each ‘Bookmark Id’ filed
in Table 4.18.
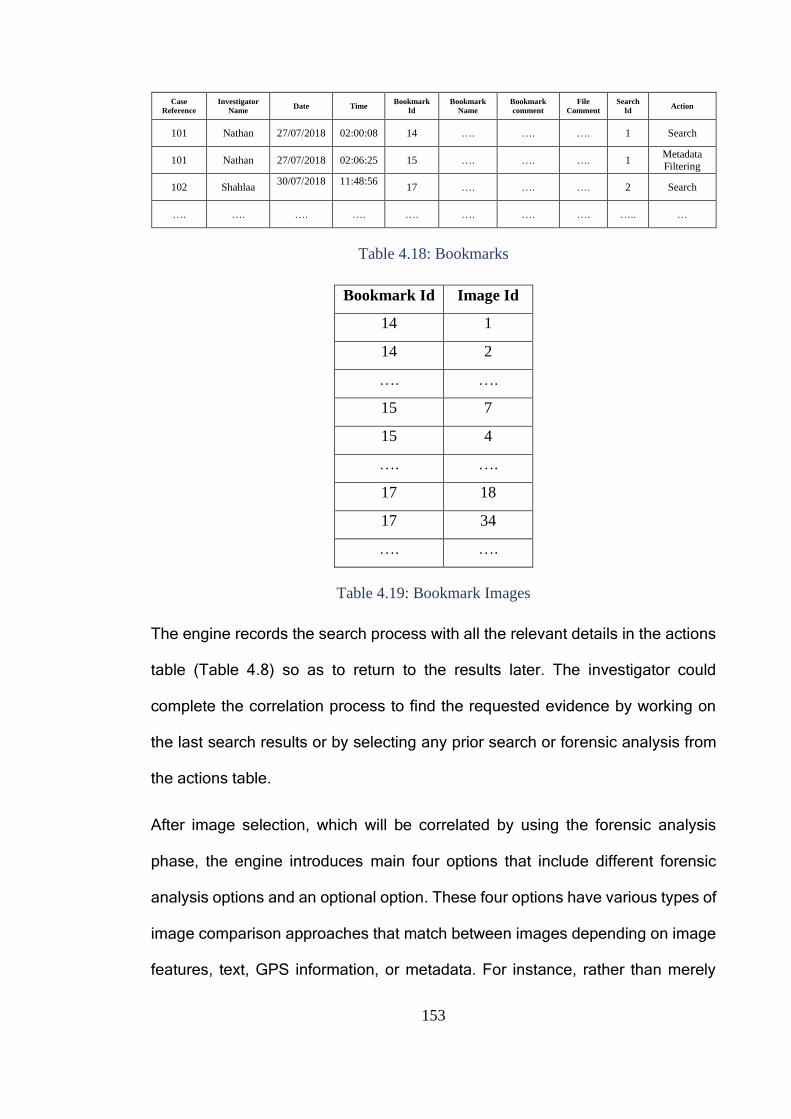
153
Case
Reference
Investigator
Name Date Time
Bookmark
Id
Bookmark
Name
Bookmark
comment
File
Comment
Search
Id Action
101 Nathan 27/07/2018 02:00:08 14 …. …. …. 1 Search
101 Nathan 27/07/2018 02:06:25 15 …. …. …. 1 Metadata Filtering
102 Shahlaa 30/07/2018
11:48:56
17 …. …. …. 2 Search
…. …. …. …. …. …. …. …. ….. …
Table 4.18: Bookmarks
Bookmark Id Image Id
14 1
14 2
…. ….
15 7
15 4
…. ….
17 18
17 34
…. ….
Table 4.19: Bookmark Images
The engine records the search process with all the relevant details in the actions
table (Table 4.8) so as to return to the results later. The investigator could
complete the correlation process to find the requested evidence by working on
the last search results or by selecting any prior search or forensic analysis from
the actions table.
After image selection, which will be correlated by using the forensic analysis
phase, the engine introduces main four options that include different forensic
analysis options and an optional option. These four options have various types of
image comparison approaches that match between images depending on image
features, text, GPS information, or metadata. For instance, rather than merely
154
asking for all images with a car in them, the investigator could ask to track a
specific car, with the underlying image sources, geo-location, and timestamps to
provide a probabilistic set of results.
In the forensic analyses phase, the engine will correlate between the retrieved
images (last search or prior search/forensic analyses) through finding the
relationships that connect between images by using multiple approaches. The
reasons for employing multiple approaches are: (1) the inability to rely on
metadata, such as EXIF data because it can be unavailable in all images, easily
manipulated, or unable to determine the type of device used to capture the
images; (2) the query image may be unavailable in some cases; (3) the query
may not be image but text inside the image or logo etc.; (4) the query may be
shoeprints or tyre marks that need to matching between images pixel by pixel;
finally, finding evidence in some cases may be based on the location where the
image has been captured. Moreover, these approaches will enable the
investigator to correlate between relevant images based on which analysis would
be most appropriate for types of evidence requests. This will help reduce the
search domain, find the requested evidence in a short time, and show the
relationship between images to draw a complete picture of the crime. It can also
be helpful in solving criminal cases such as kidnappings and runaway youths to
drug trafficking and homicides. Different forensic analysis approaches will be
employed to correlate between images, including:
Metadata Filtering: Using metadata provides useful information that can
help investigators to determine the exact location of a photo that was
captured or obtain information about the device holder from the model or
the serial number collected in the photo’s metadata, in addition to using
155
date and time to identify where and when the image was taken. Therefore,
forensic investigators can track down suspects based on metadata. The
correlation engine will refine the retrieved images by excluding all
irrelevant images based on image metadata, as identified by the
investigator, to facilitate the process of selecting the target images.
Object Recognition: The correlation engine uses the object recognition
approach to find, from a query image, identical or similar images in the
chosen data as shown in Figure 4.7. For instance, a comparison between
vehicles depicted in surveillance images with images recovered in an
investigation. The similarity between images depends on object
recognition, shape, or colour. This means it depends on the content of an
image rather than on textual information. The system provides the
investigator with two methods of selecting an image supplied to the system
to return all images that have features similar to those of the supplied
image. The first method is selecting the image from search results while
the second method is choosing the image from any drive on the computer.
The system will first create a descriptor in terms of colour, shape, texture,
and many higher-order visual features of the query image and all selected
images that need to be compared, then store the descriptors in the case
cache database, which includes images with descriptors. The case cache
database represents a temporary database because its contents will be
deleted after finding valuable evidence. In the similarity comparison step,
the object recognition approach will match descriptors of the query image
and other images descriptors from the database to find similar images.
Once the similarity comparison has been done, all related images will be
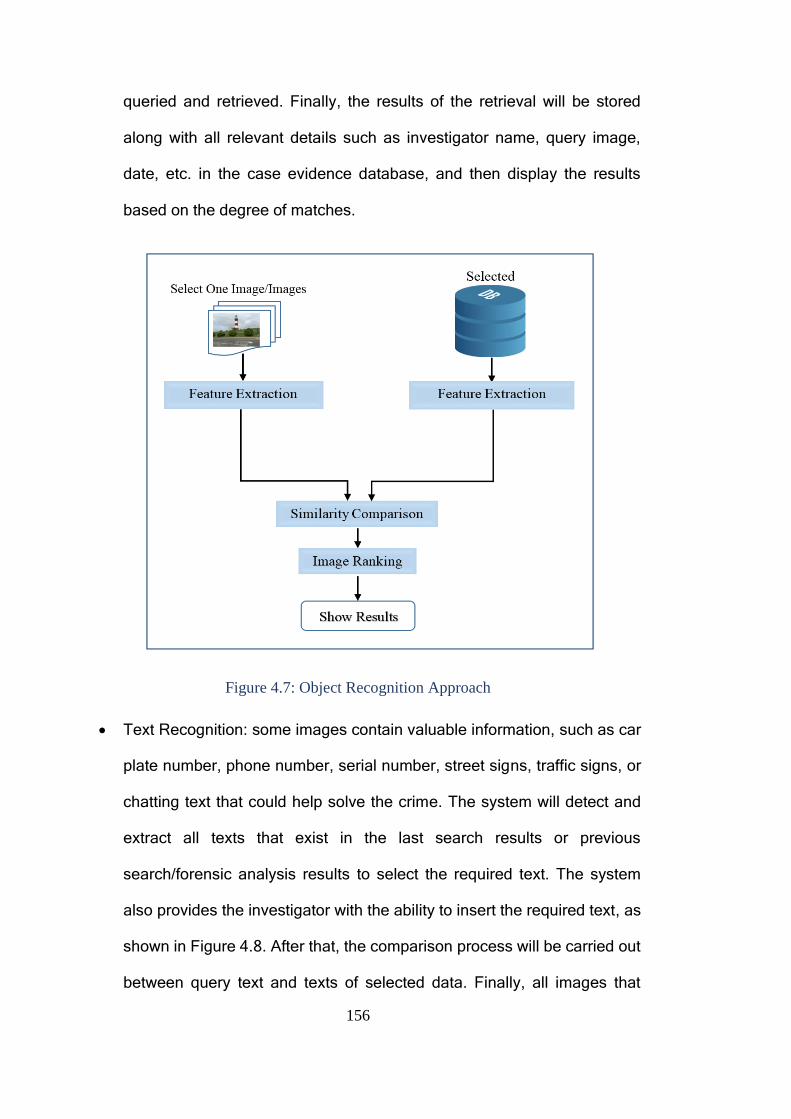
156
queried and retrieved. Finally, the results of the retrieval will be stored
along with all relevant details such as investigator name, query image,
date, etc. in the case evidence database, and then display the results
based on the degree of matches.
Figure 4.7: Object Recognition Approach
Text Recognition: some images contain valuable information, such as car
plate number, phone number, serial number, street signs, traffic signs, or
chatting text that could help solve the crime. The system will detect and
extract all texts that exist in the last search results or previous
search/forensic analysis results to select the required text. The system
also provides the investigator with the ability to insert the required text, as
shown in Figure 4.8. After that, the comparison process will be carried out
between query text and texts of selected data. Finally, all images that
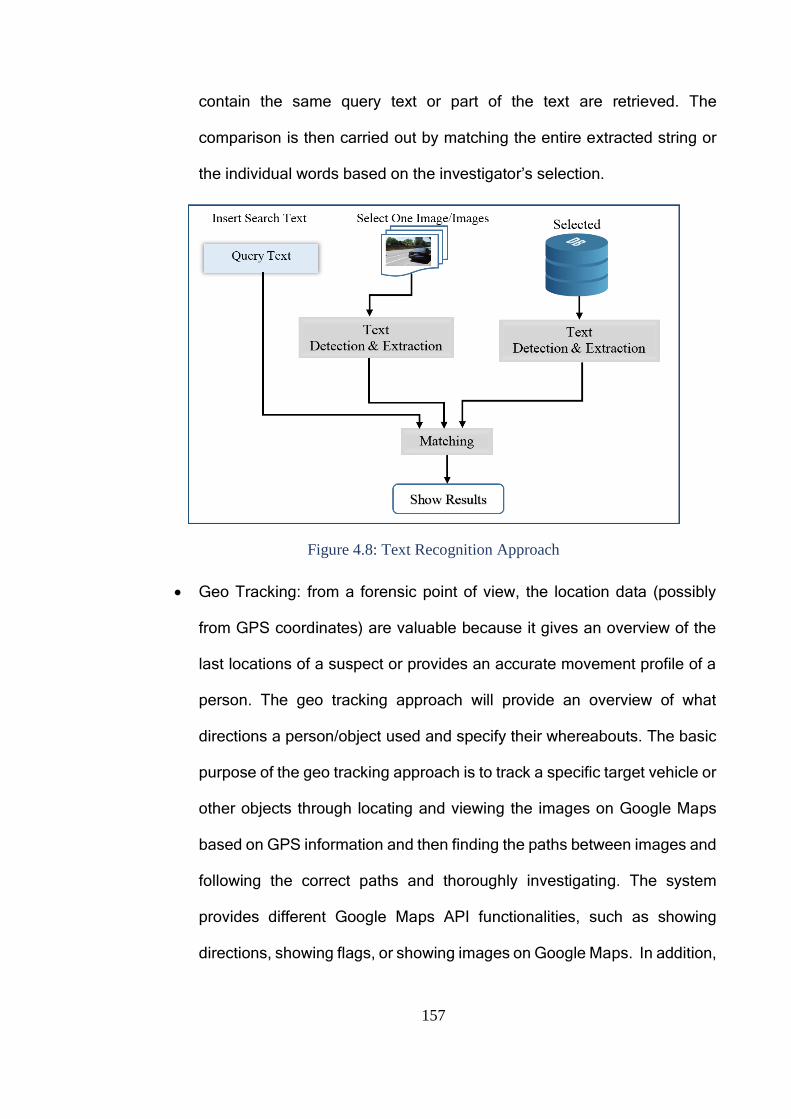
157
contain the same query text or part of the text are retrieved. The
comparison is then carried out by matching the entire extracted string or
the individual words based on the investigator’s selection.
Figure 4.8: Text Recognition Approach
Geo Tracking: from a forensic point of view, the location data (possibly
from GPS coordinates) are valuable because it gives an overview of the
last locations of a suspect or provides an accurate movement profile of a
person. The geo tracking approach will provide an overview of what
directions a person/object used and specify their whereabouts. The basic
purpose of the geo tracking approach is to track a specific target vehicle or
other objects through locating and viewing the images on Google Maps
based on GPS information and then finding the paths between images and
following the correct paths and thoroughly investigating. The system
provides different Google Maps API functionalities, such as showing
directions, showing flags, or showing images on Google Maps. In addition,
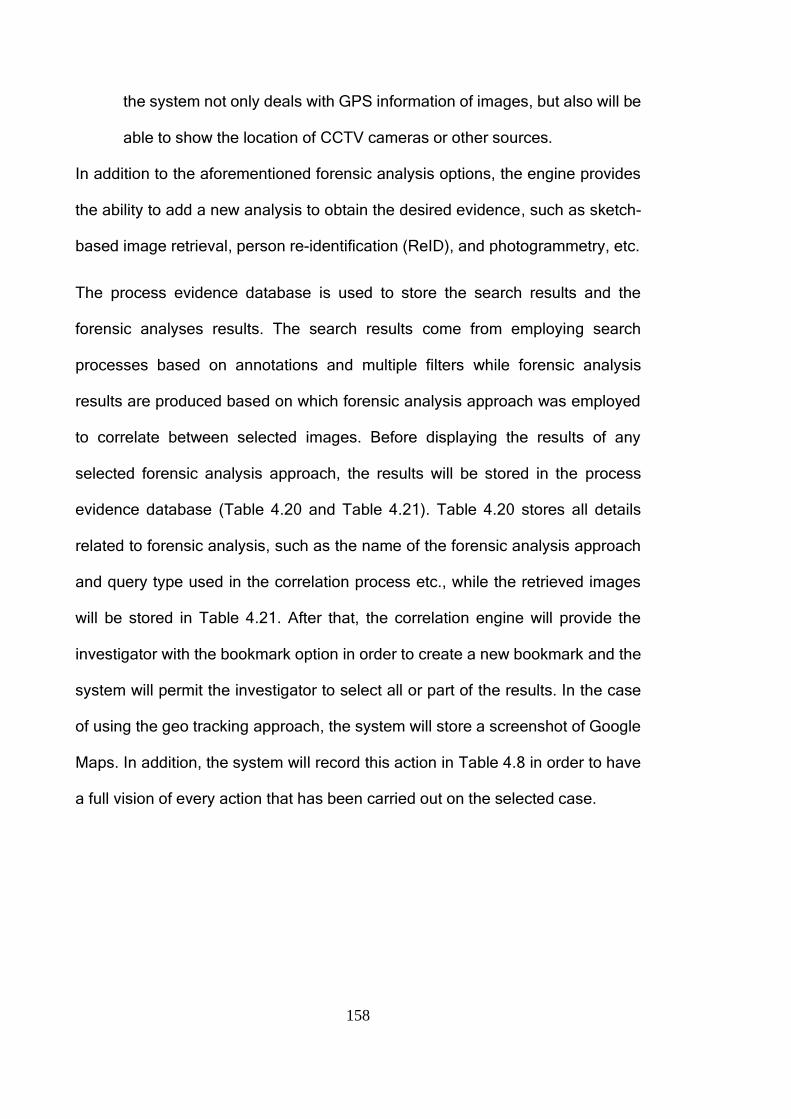
158
the system not only deals with GPS information of images, but also will be
able to show the location of CCTV cameras or other sources.
In addition to the aforementioned forensic analysis options, the engine provides
the ability to add a new analysis to obtain the desired evidence, such as sketch-
based image retrieval, person re-identification (ReID), and photogrammetry, etc.
The process evidence database is used to store the search results and the
forensic analyses results. The search results come from employing search
processes based on annotations and multiple filters while forensic analysis
results are produced based on which forensic analysis approach was employed
to correlate between selected images. Before displaying the results of any
selected forensic analysis approach, the results will be stored in the process
evidence database (Table 4.20 and Table 4.21). Table 4.20 stores all details
related to forensic analysis, such as the name of the forensic analysis approach
and query type used in the correlation process etc., while the retrieved images
will be stored in Table 4.21. After that, the correlation engine will provide the
investigator with the bookmark option in order to create a new bookmark and the
system will permit the investigator to select all or part of the results. In the case
of using the geo tracking approach, the system will store a screenshot of Google
Maps. In addition, the system will record this action in Table 4.8 in order to have
a full vision of every action that has been carried out on the selected case.
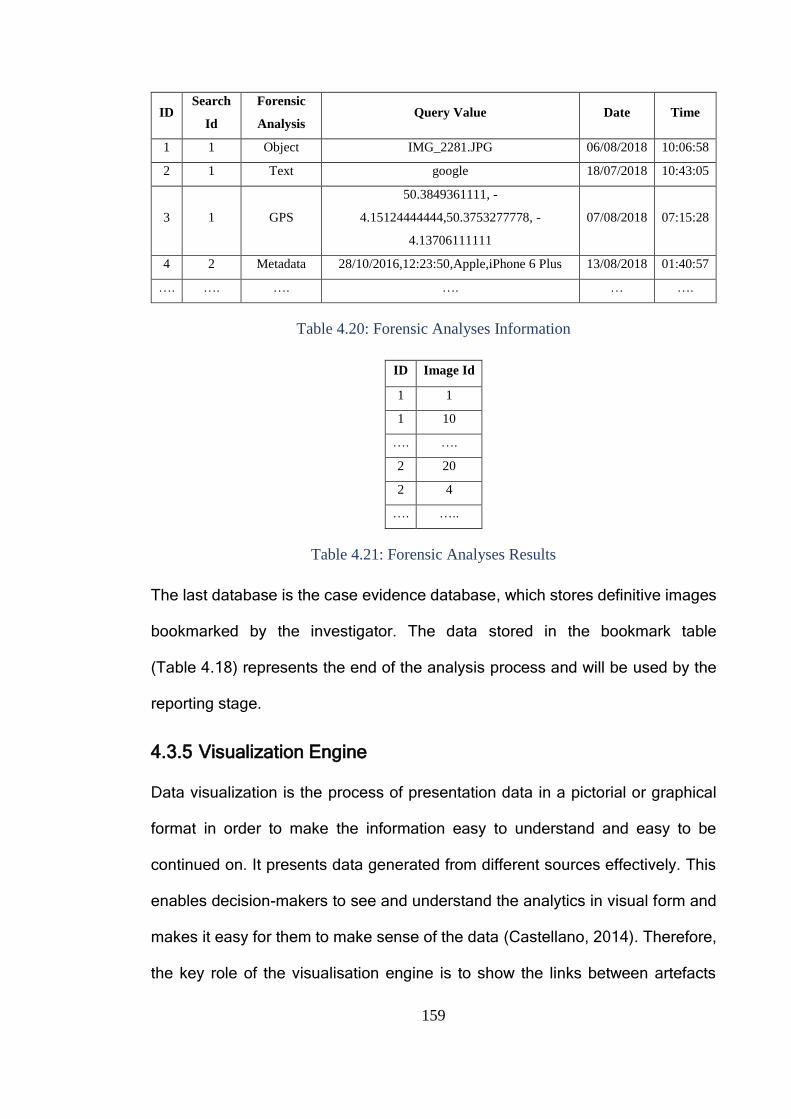
159
ID Search
Id
Forensic
Analysis Query Value Date Time
1 1 Object IMG_2281.JPG 06/08/2018 10:06:58
2 1 Text google 18/07/2018 10:43:05
3 1 GPS
50.3849361111, -
4.15124444444,50.3753277778, -
4.13706111111
07/08/2018 07:15:28
4 2 Metadata 28/10/2016,12:23:50,Apple,iPhone 6 Plus 13/08/2018 01:40:57
…. …. …. …. … ….
Table 4.20: Forensic Analyses Information
ID Image Id
1 1
1 10
…. ….
2 20
2 4
…. …..
Table 4.21: Forensic Analyses Results
The last database is the case evidence database, which stores definitive images
bookmarked by the investigator. The data stored in the bookmark table
(Table 4.18) represents the end of the analysis process and will be used by the
reporting stage.
4.3.5 Visualization Engine
Data visualization is the process of presentation data in a pictorial or graphical
format in order to make the information easy to understand and easy to be
continued on. It presents data generated from different sources effectively. This
enables decision-makers to see and understand the analytics in visual form and
makes it easy for them to make sense of the data (Castellano, 2014). Therefore,
the key role of the visualisation engine is to show the links between artefacts
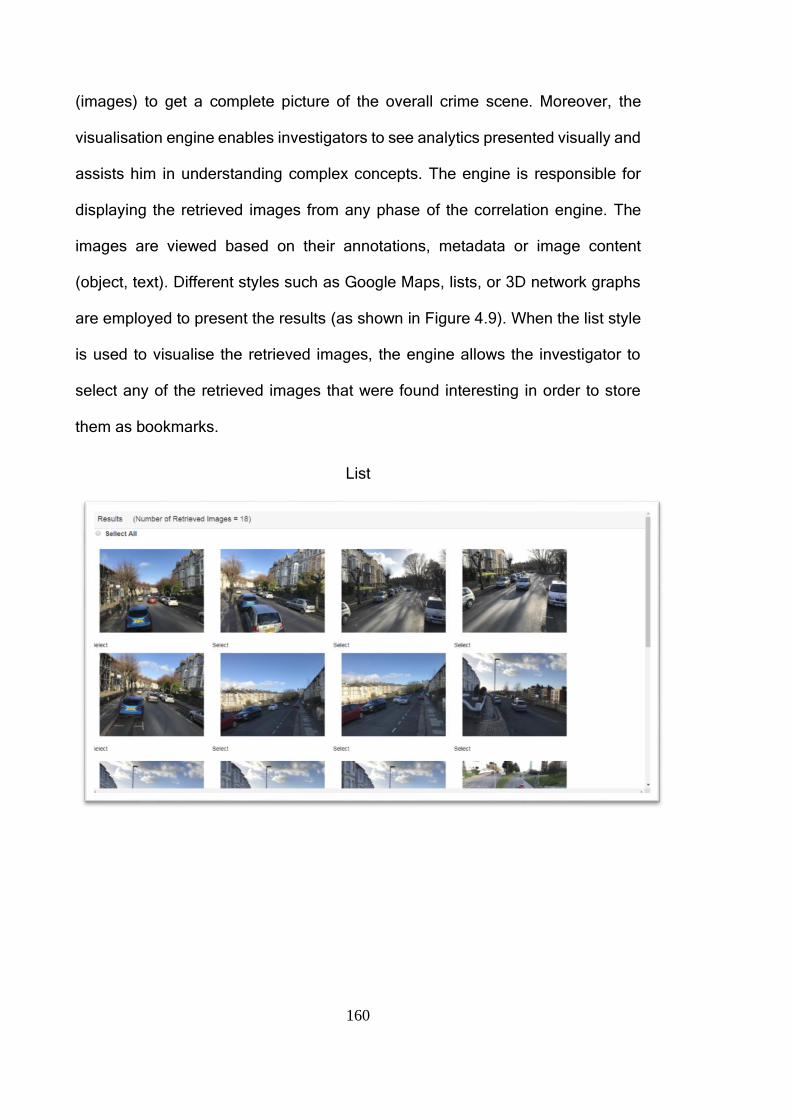
160
(images) to get a complete picture of the overall crime scene. Moreover, the
visualisation engine enables investigators to see analytics presented visually and
assists him in understanding complex concepts. The engine is responsible for
displaying the retrieved images from any phase of the correlation engine. The
images are viewed based on their annotations, metadata or image content
(object, text). Different styles such as Google Maps, lists, or 3D network graphs
are employed to present the results (as shown in Figure 4.9). When the list style
is used to visualise the retrieved images, the engine allows the investigator to
select any of the retrieved images that were found interesting in order to store
them as bookmarks.
List
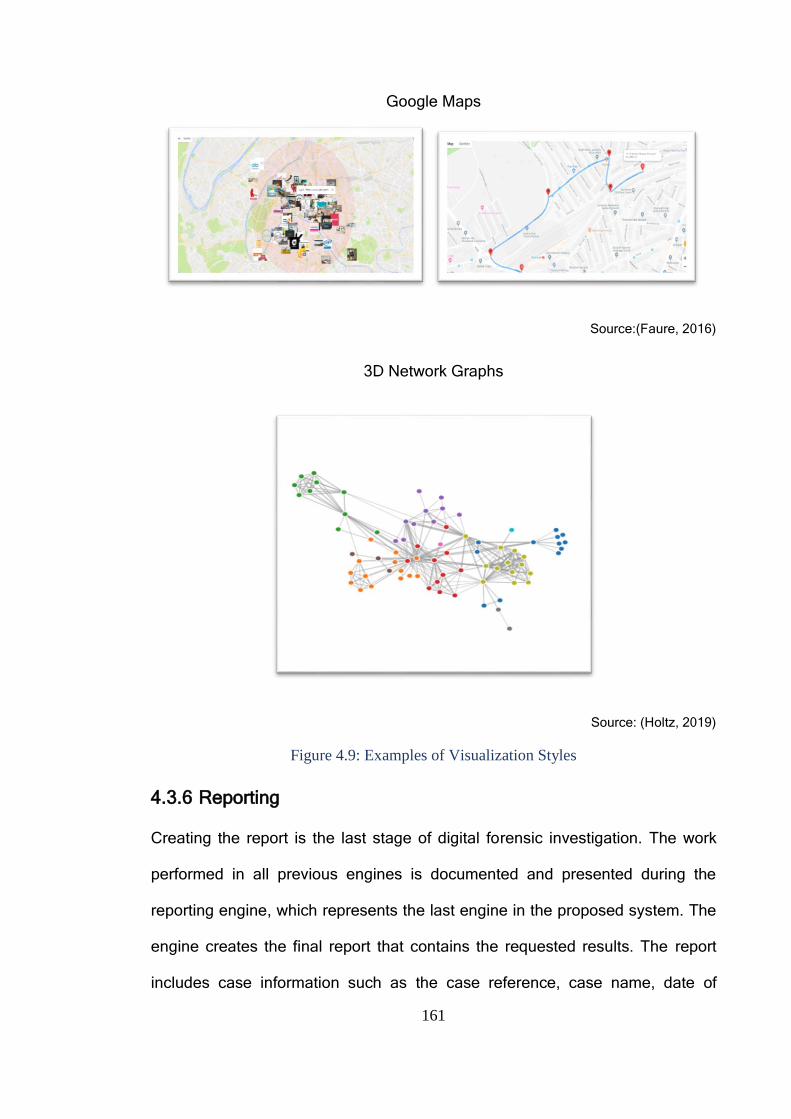
161
Google Maps
Source:(Faure, 2016)
3D Network Graphs
Source: (Holtz, 2019)
Figure 4.9: Examples of Visualization Styles
4.3.6 Reporting
Creating the report is the last stage of digital forensic investigation. The work
performed in all previous engines is documented and presented during the
reporting engine, which represents the last engine in the proposed system. The
engine creates the final report that contains the requested results. The report
includes case information such as the case reference, case name, date of

162
creation, and time etc., as well as information on investigators who are
responsible for the selected case and the evidence list, which may contain a
number of evidence items. Each item of evidence includes a group of images and
the details that explain how these images are extracted (search details or forensic
analyses details). The information of each evidence item will be retrieved from
the bookmark table (Table 4.18) connected to other tables. The investigator will
be able to select which data need to be reported from the case evidence database
(bookmark table).
4.4 Workflow System Design Based on OM-FAT Architecture
Having introduced the main components of the OM-FAT system architecture, the
OM-FAT system workflow is shown in Figure 4.10. All the OM-FAT system
components are connected, providing the ability to navigate between system
processes easily. The work on the system starts when the investigator has logged
in to the system. Once the login is successful, the system will automatically direct
the investigator to the dashboard interface. The dashboard interface represents
the case management engine and consists of seven main processes that include
‘Account Management’, ‘Global Settings’, ‘Add New Case’, ‘Edit Case
Information’, ‘Open Case’, ‘Archive Case’, and ‘Case History’. Each process is
carried out through an interface, and each interface may direct the investigator to
another interface because some processes may include a sequence of actions.
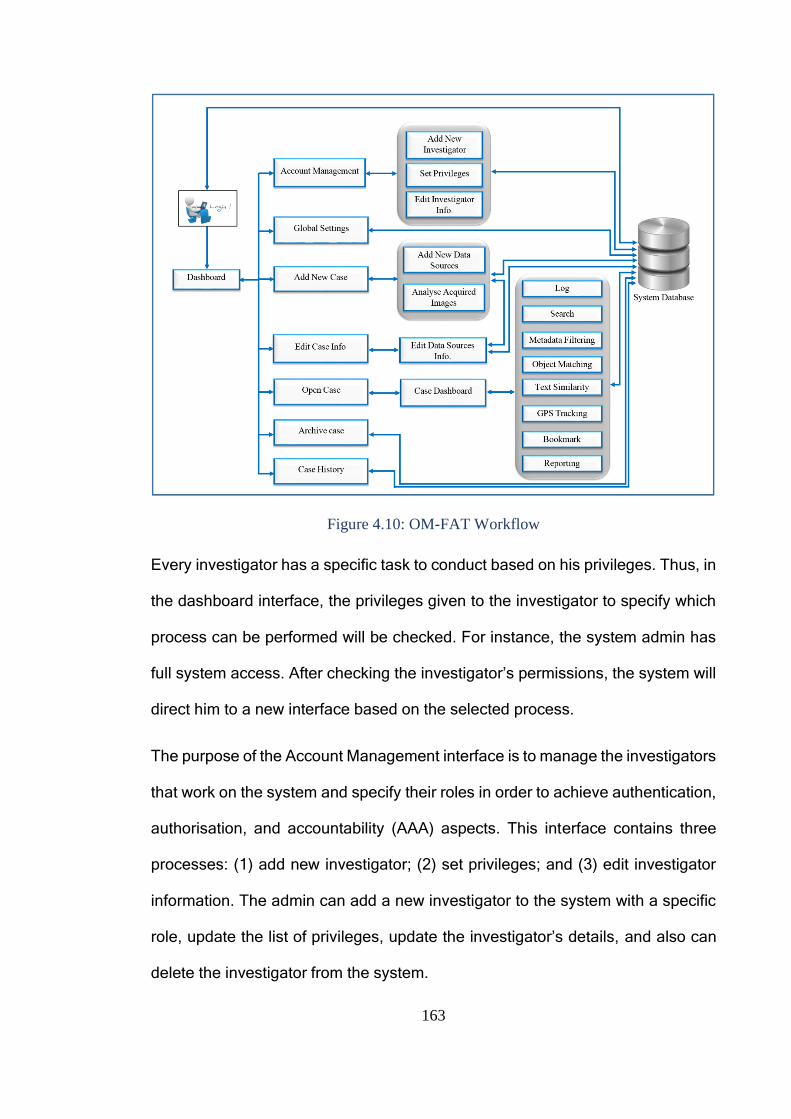
163
Figure 4.10: OM-FAT Workflow
Every investigator has a specific task to conduct based on his privileges. Thus, in
the dashboard interface, the privileges given to the investigator to specify which
process can be performed will be checked. For instance, the system admin has
full system access. After checking the investigator’s permissions, the system will
direct him to a new interface based on the selected process.
The purpose of the Account Management interface is to manage the investigators
that work on the system and specify their roles in order to achieve authentication,
authorisation, and accountability (AAA) aspects. This interface contains three
processes: (1) add new investigator; (2) set privileges; and (3) edit investigator
information. The admin can add a new investigator to the system with a specific
role, update the list of privileges, update the investigator’s details, and also can
delete the investigator from the system.
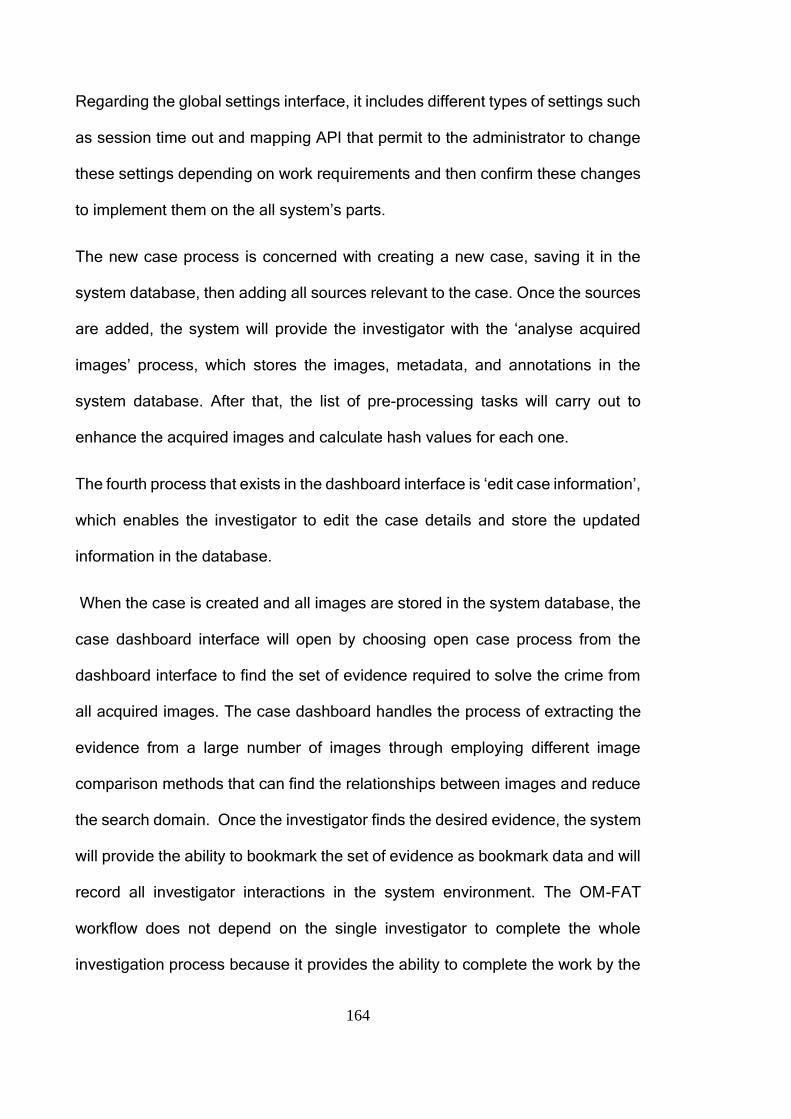
164
Regarding the global settings interface, it includes different types of settings such
as session time out and mapping API that permit to the administrator to change
these settings depending on work requirements and then confirm these changes
to implement them on the all system’s parts.
The new case process is concerned with creating a new case, saving it in the
system database, then adding all sources relevant to the case. Once the sources
are added, the system will provide the investigator with the ‘analyse acquired
images’ process, which stores the images, metadata, and annotations in the
system database. After that, the list of pre-processing tasks will carry out to
enhance the acquired images and calculate hash values for each one.
The fourth process that exists in the dashboard interface is ‘edit case information’,
which enables the investigator to edit the case details and store the updated
information in the database.
When the case is created and all images are stored in the system database, the
case dashboard interface will open by choosing open case process from the
dashboard interface to find the set of evidence required to solve the crime from
all acquired images. The case dashboard handles the process of extracting the
evidence from a large number of images through employing different image
comparison methods that can find the relationships between images and reduce
the search domain. Once the investigator finds the desired evidence, the system
will provide the ability to bookmark the set of evidence as bookmark data and will
record all investigator interactions in the system environment. The OM-FAT
workflow does not depend on the single investigator to complete the whole
investigation process because it provides the ability to complete the work by the

165
same investigator or by another investigator using log information that stores all
actions and their details. The final process in the case dashboard interface is the
reporting process, which is responsible for creating the report including the crucial
evidence with the details explaining how this evidence is extracted and when, in
addition to the investigator responsible for finding the evidence.
In addition, the dashboard uses the archive process to transfer the case to
another place in the system database when there is no need to act on the case.
The case history is the last process in the dashboard interface responsible for
displaying the history of the case, including all actions and their details performed
on the case.
The system will use the system database as shown in Figure 4.11 to illustrate an
overall view of the database tables that explain the above and the relations
between them. The system database schema diagram shows only the major
tables in the system database to facilitate understanding of the diagram.
166
Figure 4.11: System Database Schema Diagram
167
4.5 Conclusion
The proposed novel framework for the Object-based Multimedia Forensic
Analysis Tool (full case management tool) has addressed the requirements of
image analysis in digital forensics. The novel OM-FAT system has been designed
to deal with various image content collected from different sources by using a
combination of image content analysis techniques that permit obtaining more
accurate results. Therefore, this tool is designed to use the multi-algorithmic
approach that collects different annotations for the same image from multiple AIA
systems to increase the accuracy of annotations and allow for using different
words to retrieve the same object. By employing various image analysis
techniques for correlating between images based on the type of evidence, the
retrieving process will be more accurate and efficient. Thereby, the investigator
can select the analysis style for comparing images based on crime requirements.
Further, multiple visual forms are used to view the results in order to show the
relevant images. By using permissions for each investigator, the framework can
control who can access certain areas of the system and the actions they can
perform to maintain the chain of custody. The system architecture enables all
investigative processes to be integrated and managed within one system. Thus,
a complete case can be tracked starting from the acquisition passing through
analysis and ending with the reporting process.
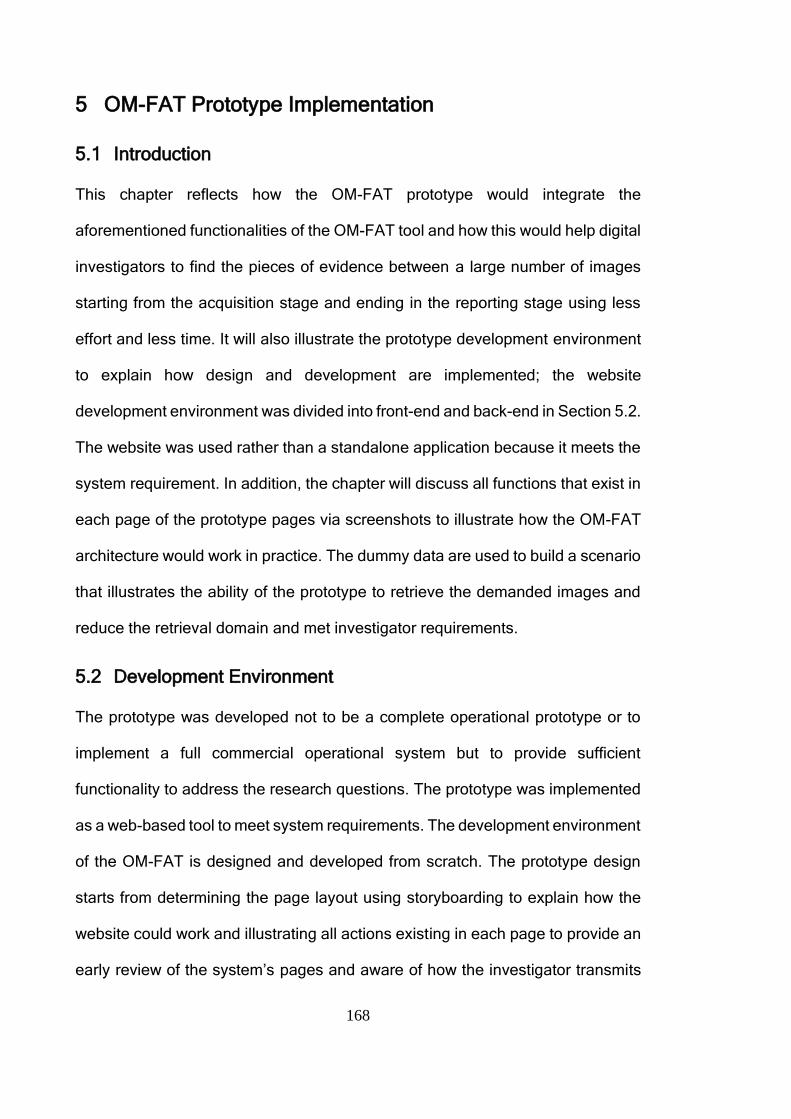
168
5 OM-FAT Prototype Implementation
5.1 Introduction
This chapter reflects how the OM-FAT prototype would integrate the
aforementioned functionalities of the OM-FAT tool and how this would help digital
investigators to find the pieces of evidence between a large number of images
starting from the acquisition stage and ending in the reporting stage using less
effort and less time. It will also illustrate the prototype development environment
to explain how design and development are implemented; the website
development environment was divided into front-end and back-end in Section 5.2.
The website was used rather than a standalone application because it meets the
system requirement. In addition, the chapter will discuss all functions that exist in
each page of the prototype pages via screenshots to illustrate how the OM-FAT
architecture would work in practice. The dummy data are used to build a scenario
that illustrates the ability of the prototype to retrieve the demanded images and
reduce the retrieval domain and met investigator requirements.
5.2 Development Environment
The prototype was developed not to be a complete operational prototype or to
implement a full commercial operational system but to provide sufficient
functionality to address the research questions. The prototype was implemented
as a web-based tool to meet system requirements. The development environment
of the OM-FAT is designed and developed from scratch. The prototype design
starts from determining the page layout using storyboarding to explain how the
website could work and illustrating all actions existing in each page to provide an
early review of the system’s pages and aware of how the investigator transmits
169
between pages. At the first, ASP.Net Web Application had been used for
developing the web site, however, it did not meet the project requirements such
as responsive structures and styles. This process took more than two months
because the author does not has any background in web developing. After that,
the author looking for the new front end framework which is bootstrap is
represented as one of the top front-end frameworks (Patel, 2017). Bootstrap is an
HTML, CSS and JavaScript framework used for developing responsive (12-
column grids, layouts and components) and mobile-first projects on the web.
Another challenge was all the web site pages are connected with the database
that contains multiple tables (front-end and back-end development). In addition
to the front-end website developing, the author should develop the back-end
because the web-based pages connect with the database. The learning of all
these languages has been taken time, especially the connection between
JavaScript in the front-end and the C# in the back-end. All these made the
prototype development taken a large body of work.
The website is implemented by dividing the work into two parts: the front-end and
back-end as illustrated in Figure 5.1.
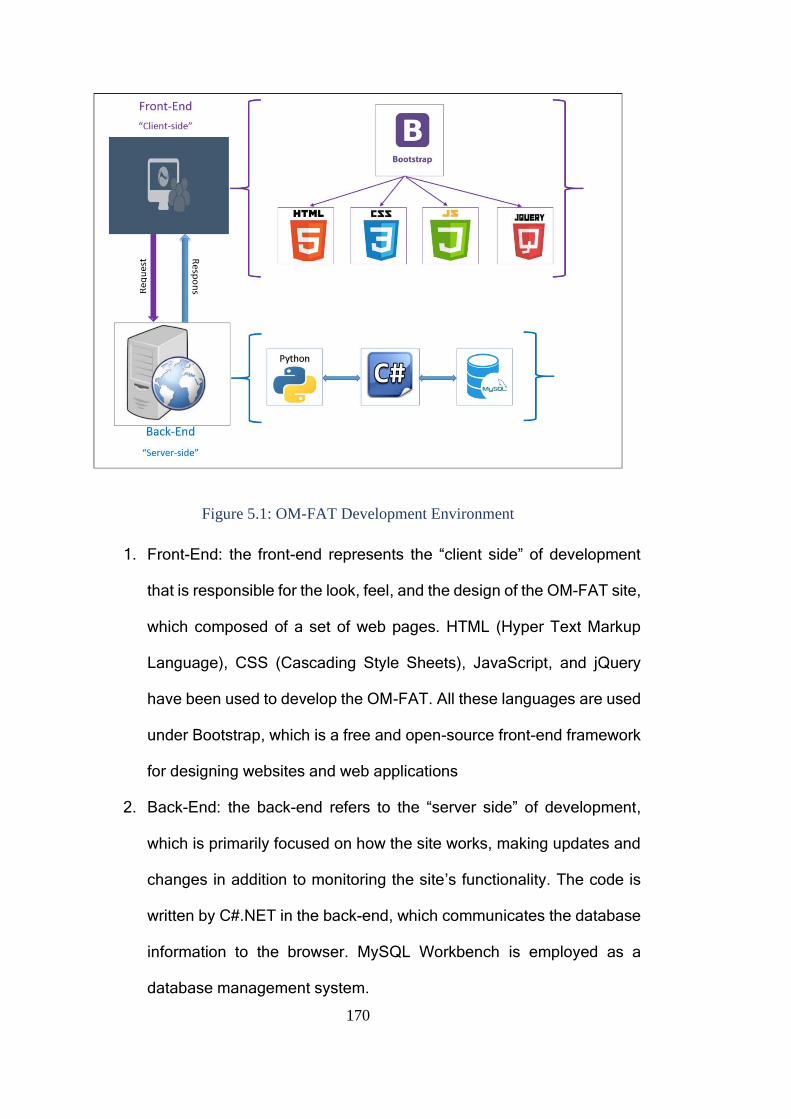
170
Figure 5.1: OM-FAT Development Environment
1. Front-End: the front-end represents the “client side” of development
that is responsible for the look, feel, and the design of the OM-FAT site,
which composed of a set of web pages. HTML (Hyper Text Markup
Language), CSS (Cascading Style Sheets), JavaScript, and jQuery
have been used to develop the OM-FAT. All these languages are used
under Bootstrap, which is a free and open-source front-end framework
for designing websites and web applications
2. Back-End: the back-end refers to the “server side” of development,
which is primarily focused on how the site works, making updates and
changes in addition to monitoring the site’s functionality. The code is
written by C#.NET in the back-end, which communicates the database
information to the browser. MySQL Workbench is employed as a
database management system.
171
5.3 OM-FAT Prototype Implementation
In order to show the capability and usability of the OM-FAT prototype and show
how the investigators will interact with the system in accomplishing key
objectives, the criminal case of child abduction will be examined to show the
viability of the OM-FAT system:
In order to solve the child abduction case, an investigator starts by collecting all
preliminary evidence that may help to find the child as fast as possible, such as
narrowing the time frame of abduction, examining the properties of a car that a
witness believes was involved in the abduction, and determining the location of
the abduction. Then, all CCTV cameras footage from the crime scene and nearby
areas will be collected. Based on the collected information, the investigator
decides to analyse the images existing on CCTV recorded videos, which will
assist in finding any valuable information that could be extracted to find the child
or the suspect. After collecting all preliminary evidence, the investigator starts
using the OM-FAT as follows:
5.4 Login
When the investigator starts using the OM-FAT prototype, the login page, which
represents the primary starting point of the OM-FAT prototype’s user page, is
prompted asking him/her to set a username and password (as shown in
Figure 5.2). At the login page, the investigator must input the username and
password then press the ‘Login’ button to send the details to the database to
check their validity. The login action will be recorded in the system database with
the login details, such as the date and time.
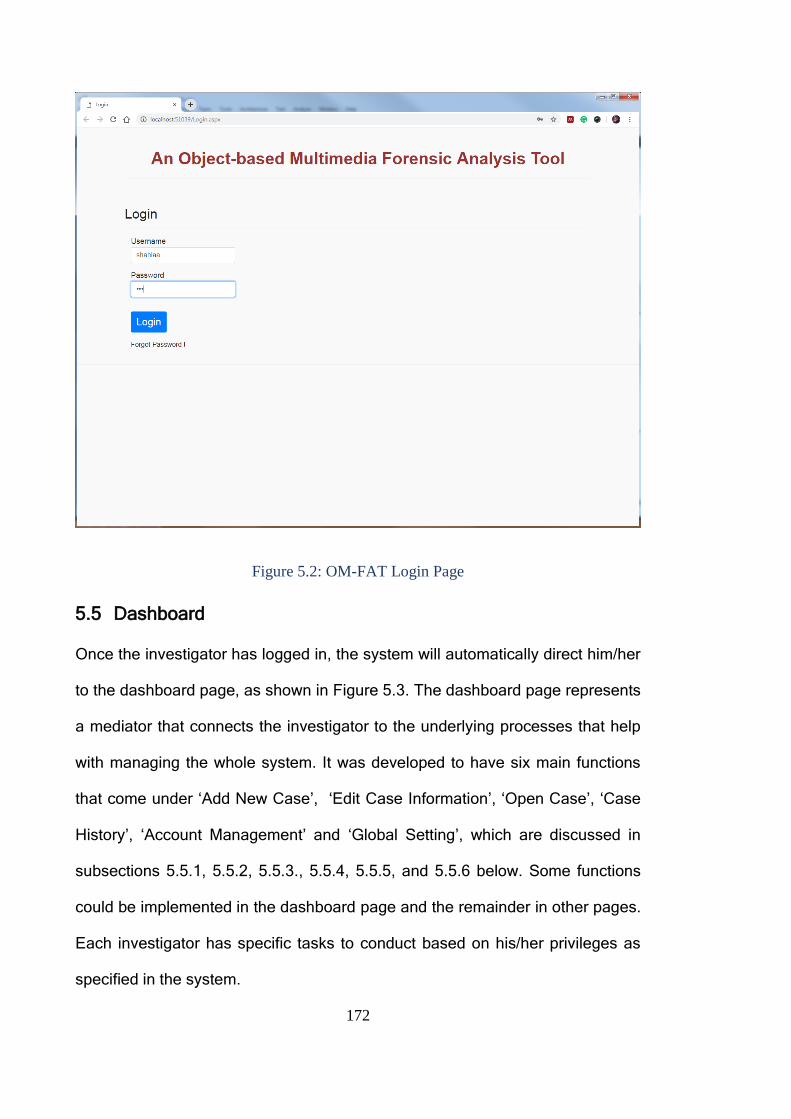
172
Figure 5.2: OM-FAT Login Page
5.5 Dashboard
Once the investigator has logged in, the system will automatically direct him/her
to the dashboard page, as shown in Figure 5.3. The dashboard page represents
a mediator that connects the investigator to the underlying processes that help
with managing the whole system. It was developed to have six main functions
that come under ‘Add New Case’, ‘Edit Case Information’, ‘Open Case’, ‘Case
History’, ‘Account Management’ and ‘Global Setting’, which are discussed in
subsections 5.5.1, 5.5.2, 5.5.3., 5.5.4, 5.5.5, and 5.5.6 below. Some functions
could be implemented in the dashboard page and the remainder in other pages.
Each investigator has specific tasks to conduct based on his/her privileges as
specified in the system.
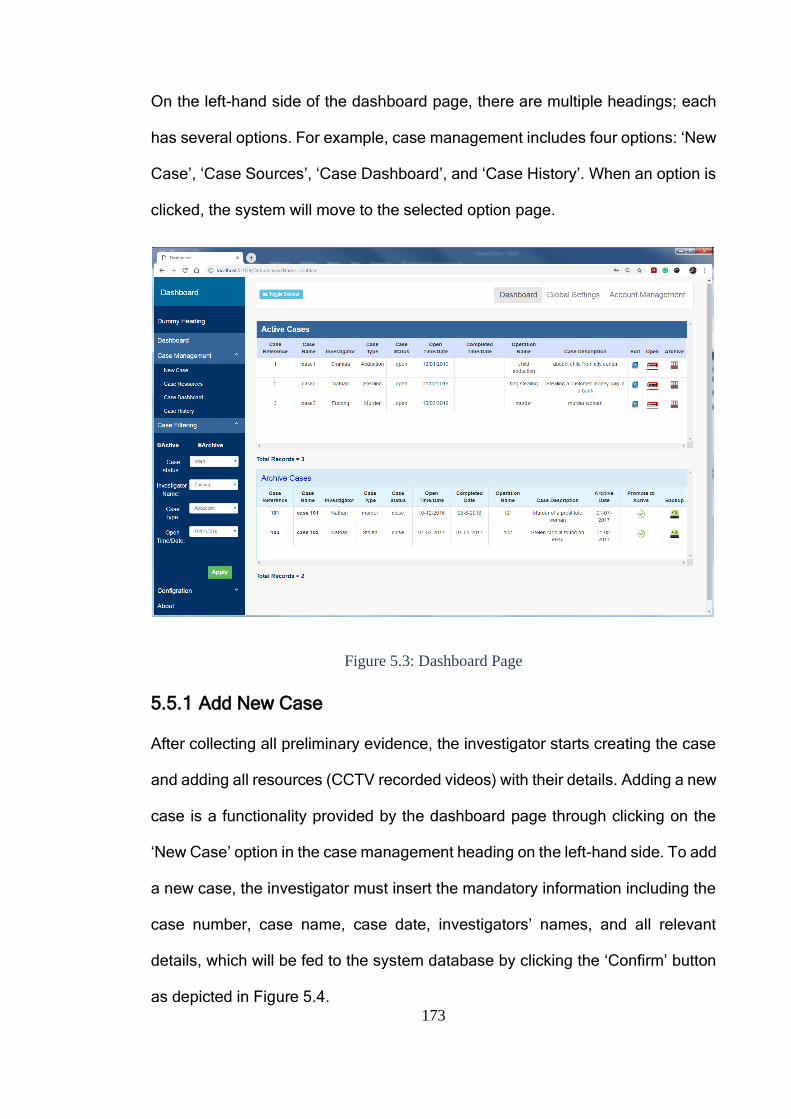
173
On the left-hand side of the dashboard page, there are multiple headings; each
has several options. For example, case management includes four options: ‘New
Case’, ‘Case Sources’, ‘Case Dashboard’, and ‘Case History’. When an option is
clicked, the system will move to the selected option page.
Figure 5.3: Dashboard Page
5.5.1 Add New Case
After collecting all preliminary evidence, the investigator starts creating the case
and adding all resources (CCTV recorded videos) with their details. Adding a new
case is a functionality provided by the dashboard page through clicking on the
‘New Case’ option in the case management heading on the left-hand side. To add
a new case, the investigator must insert the mandatory information including the
case number, case name, case date, investigators’ names, and all relevant
details, which will be fed to the system database by clicking the ‘Confirm’ button
as depicted in Figure 5.4.
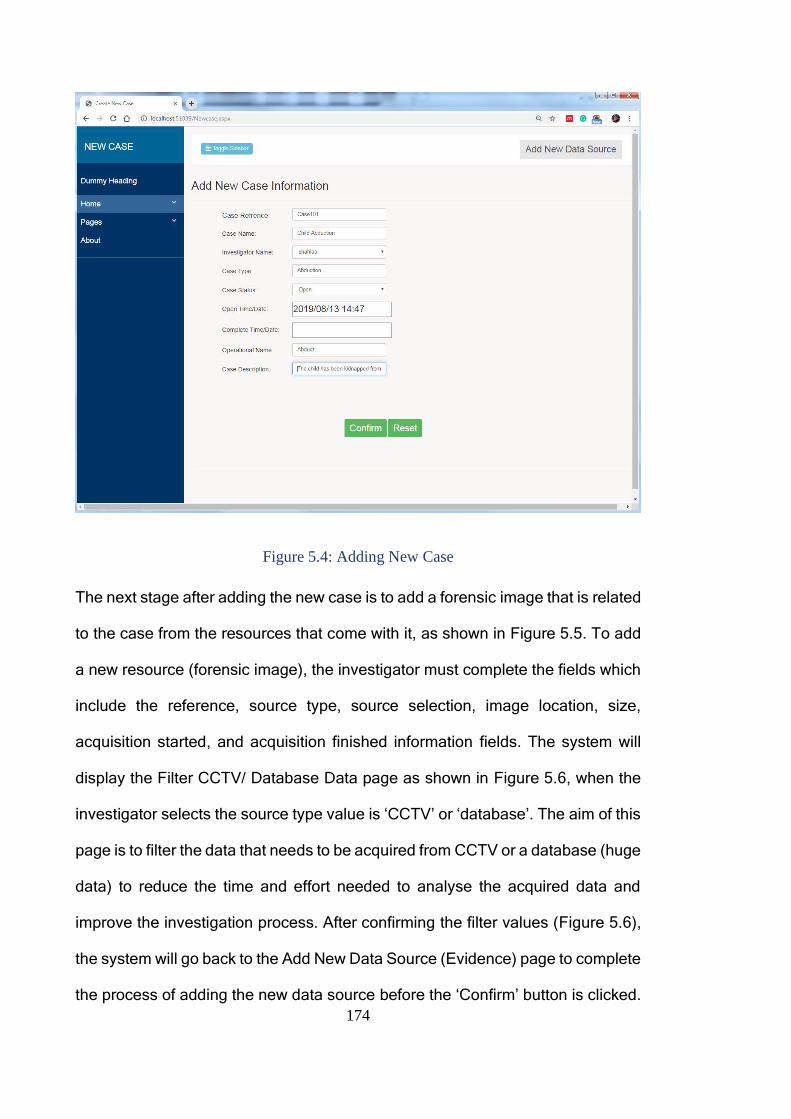
174
Figure 5.4: Adding New Case
The next stage after adding the new case is to add a forensic image that is related
to the case from the resources that come with it, as shown in Figure 5.5. To add
a new resource (forensic image), the investigator must complete the fields which
include the reference, source type, source selection, image location, size,
acquisition started, and acquisition finished information fields. The system will
display the Filter CCTV/ Database Data page as shown in Figure 5.6, when the
investigator selects the source type value is ‘CCTV’ or ‘database’. The aim of this
page is to filter the data that needs to be acquired from CCTV or a database (huge
data) to reduce the time and effort needed to analyse the acquired data and
improve the investigation process. After confirming the filter values (Figure 5.6),
the system will go back to the Add New Data Source (Evidence) page to complete
the process of adding the new data source before the ‘Confirm’ button is clicked.
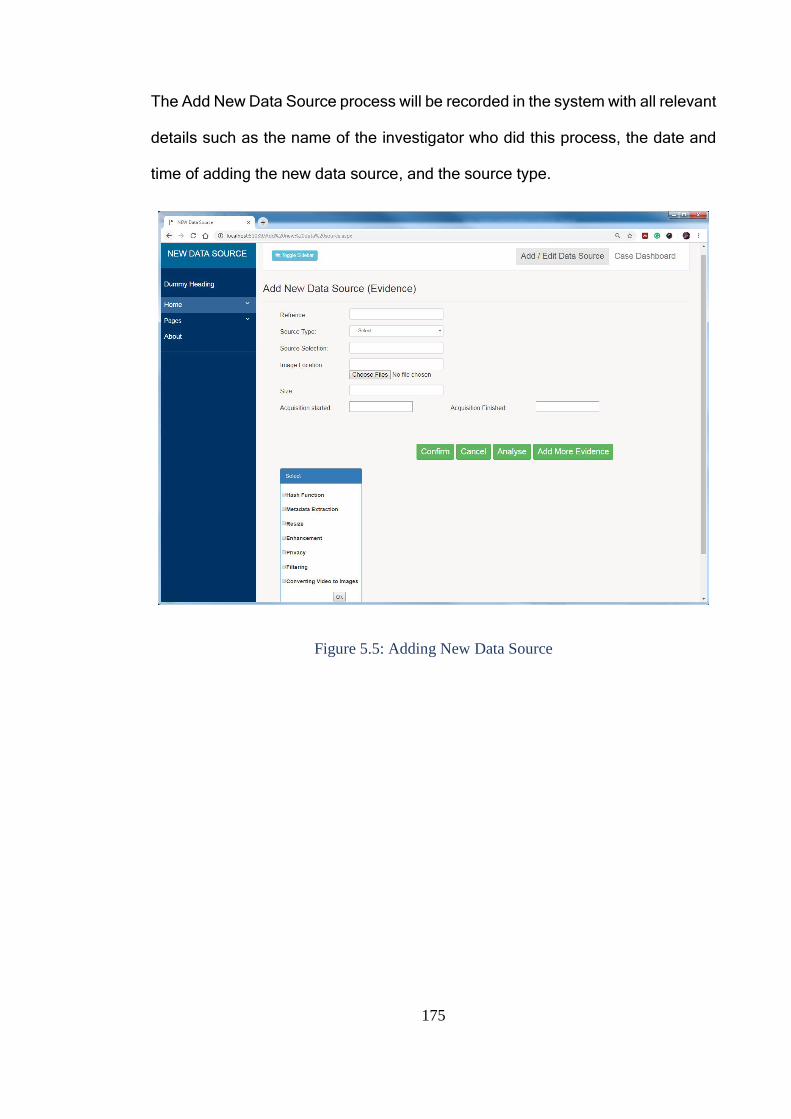
175
The Add New Data Source process will be recorded in the system with all relevant
details such as the name of the investigator who did this process, the date and
time of adding the new data source, and the source type.
Figure 5.5: Adding New Data Source
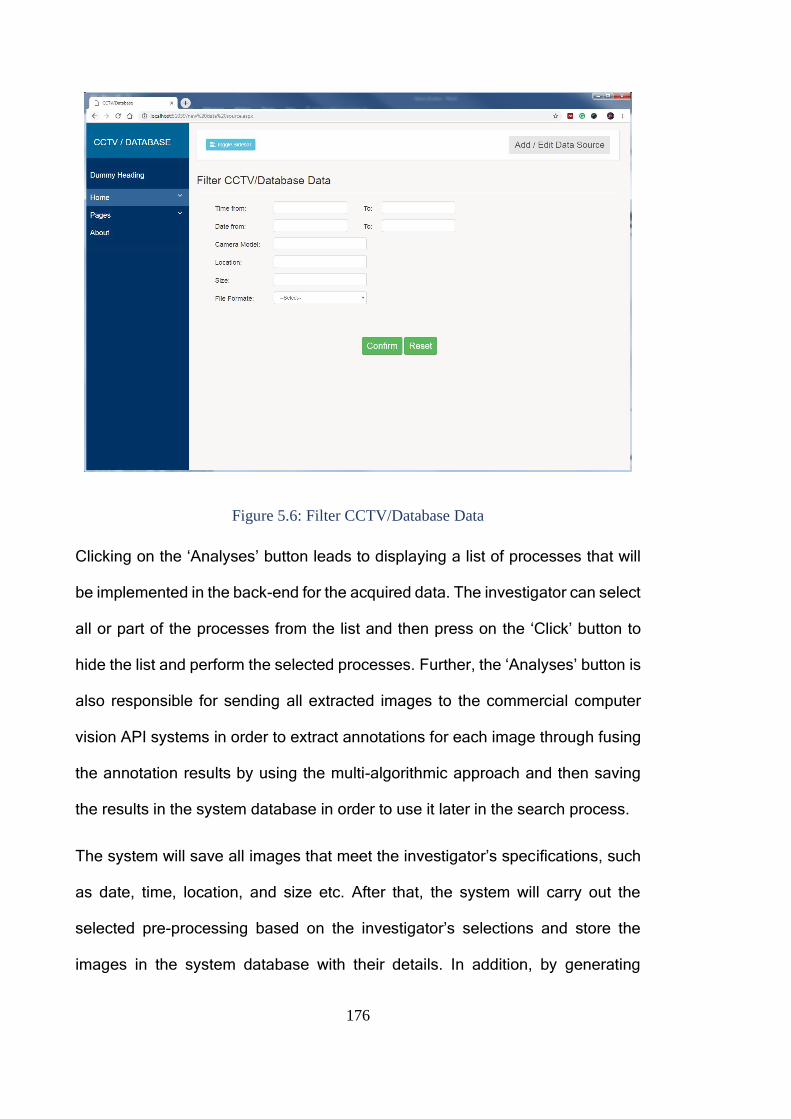
176
Figure 5.6: Filter CCTV/Database Data
Clicking on the ‘Analyses’ button leads to displaying a list of processes that will
be implemented in the back-end for the acquired data. The investigator can select
all or part of the processes from the list and then press on the ‘Click’ button to
hide the list and perform the selected processes. Further, the ‘Analyses’ button is
also responsible for sending all extracted images to the commercial computer
vision API systems in order to extract annotations for each image through fusing
the annotation results by using the multi-algorithmic approach and then saving
the results in the system database in order to use it later in the search process.
The system will save all images that meet the investigator’s specifications, such
as date, time, location, and size etc. After that, the system will carry out the
selected pre-processing based on the investigator’s selections and store the
images in the system database with their details. In addition, by generating
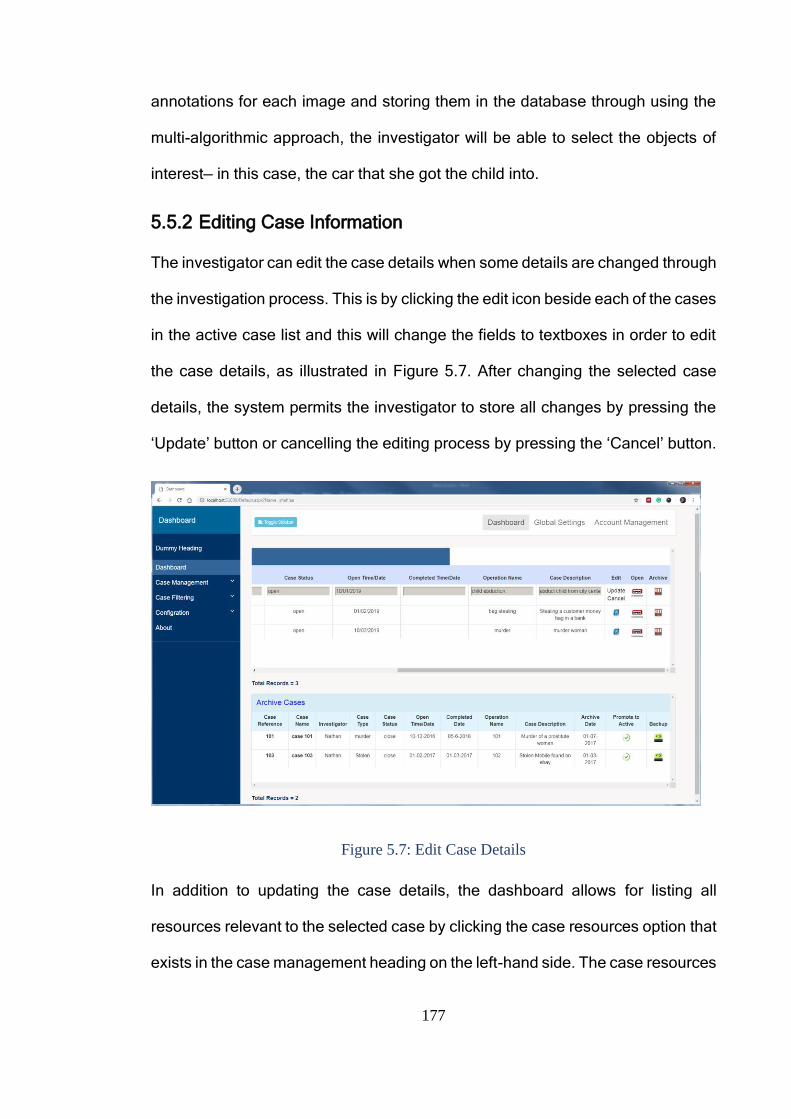
177
annotations for each image and storing them in the database through using the
multi-algorithmic approach, the investigator will be able to select the objects of
interest— in this case, the car that she got the child into.
5.5.2 Editing Case Information
The investigator can edit the case details when some details are changed through
the investigation process. This is by clicking the edit icon beside each of the cases
in the active case list and this will change the fields to textboxes in order to edit
the case details, as illustrated in Figure 5.7. After changing the selected case
details, the system permits the investigator to store all changes by pressing the
‘Update’ button or cancelling the editing process by pressing the ‘Cancel’ button.
Figure 5.7: Edit Case Details
In addition to updating the case details, the dashboard allows for listing all
resources relevant to the selected case by clicking the case resources option that
exists in the case management heading on the left-hand side. The case resources
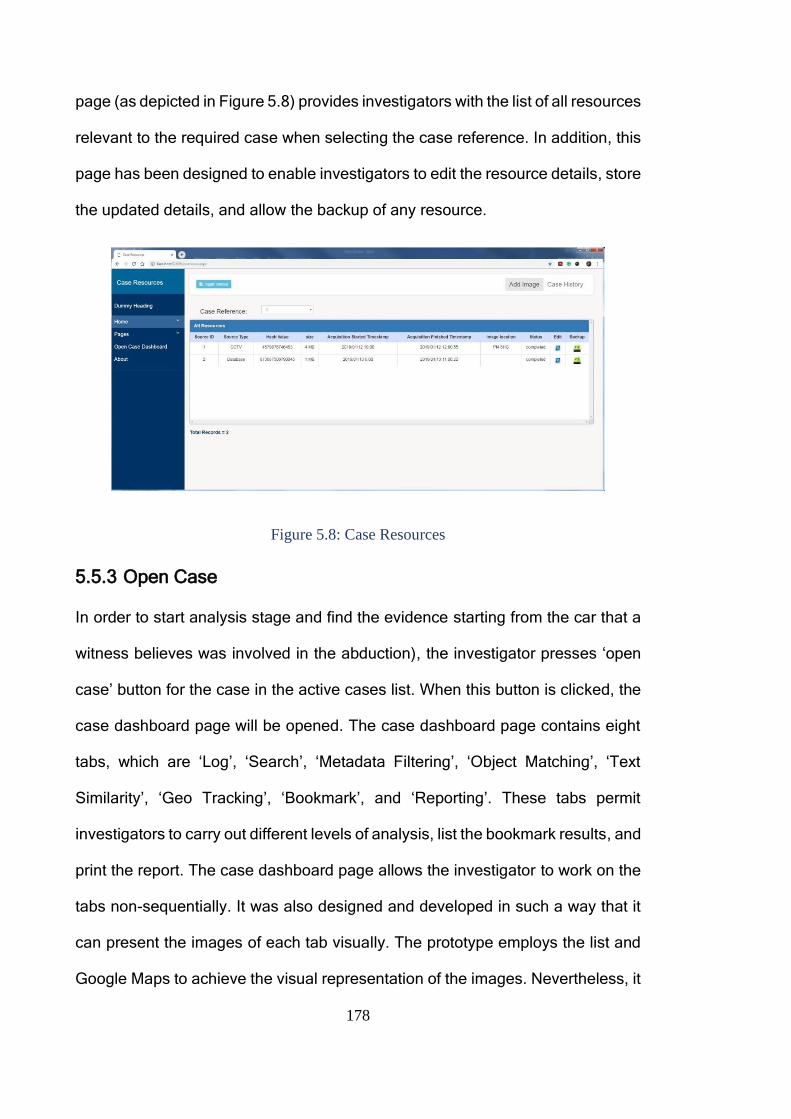
178
page (as depicted in Figure 5.8) provides investigators with the list of all resources
relevant to the required case when selecting the case reference. In addition, this
page has been designed to enable investigators to edit the resource details, store
the updated details, and allow the backup of any resource.
Figure 5.8: Case Resources
5.5.3 Open Case
In order to start analysis stage and find the evidence starting from the car that a
witness believes was involved in the abduction), the investigator presses ‘open
case’ button for the case in the active cases list. When this button is clicked, the
case dashboard page will be opened. The case dashboard page contains eight
tabs, which are ‘Log’, ‘Search’, ‘Metadata Filtering’, ‘Object Matching’, ‘Text
Similarity’, ‘Geo Tracking’, ‘Bookmark’, and ‘Reporting’. These tabs permit
investigators to carry out different levels of analysis, list the bookmark results, and
print the report. The case dashboard page allows the investigator to work on the
tabs non-sequentially. It was also designed and developed in such a way that it
can present the images of each tab visually. The prototype employs the list and
Google Maps to achieve the visual representation of the images. Nevertheless, it

179
must be noted that the name of the investigator who opened the case and the
case name are transferred to the case dashboard page so they can be used in
recording all actions that will be carried out on the case in this page.
5.5.3.1 Search Tab
In the first step of investigation, the investigator uses the search tab that is
considered as the major tab of the case dashboard page (as shown in Figure 5.9)
because it represents the first stage of the analysis process. All tabs will depend
on the results obtained from the search tab before carrying out any forensic
analyses, including metadata filtering, object matching, and text similarity. The
investigator can start a new search without having to pass through the log tab and
work on all images in the database. In addition, he/she could work on a previously
selected search (selected from the log tab as shown in Figure 5.17).
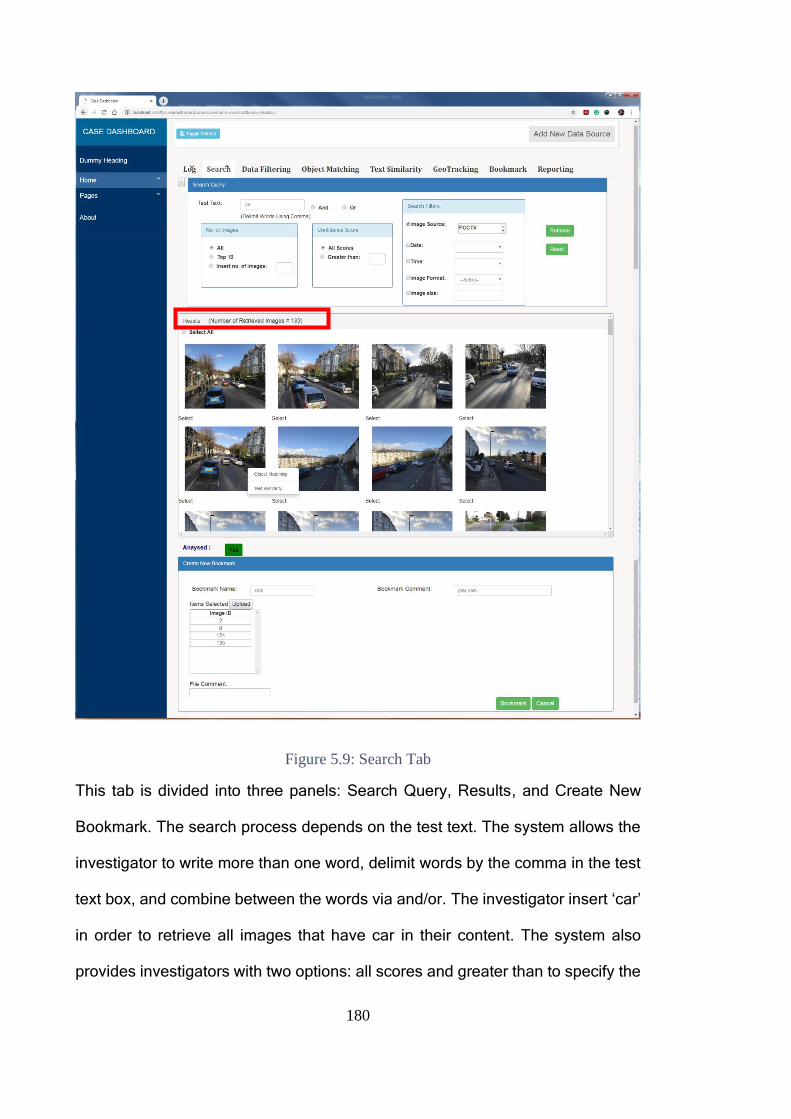
180
Figure 5.9: Search Tab
This tab is divided into three panels: Search Query, Results, and Create New
Bookmark. The search process depends on the test text. The system allows the
investigator to write more than one word, delimit words by the comma in the test
text box, and combine between the words via and/or. The investigator insert ‘car’
in order to retrieve all images that have car in their content. The system also
provides investigators with two options: all scores and greater than to specify the
181
score value in a confidence score panel to refine the search results. In the first
option, the system retrieves all images that have the query text in their
annotations regardless of the confidence score value. In the second option, the
system will retrieve all images that contain query text in their annotations and the
confidence score of each word in the query text is greater than the inserted value.
In addition, the investigator can use one or more search filters to reduce the
search domain and find the requested images precisely. The search filter panel
was designed with five types of filter options in mind: images source, date, time,
file format, and image size. ‘Image Sources’ provides investigators with a list of
all resources that related to the selected case. The ‘date’ and ‘time’ filter options
allow investigators to select the date and time of photos they want to retrieve. The
date and time dropdown lists contain the dates and times of all images (new
search) or selected images (previous search). The investigator can also
determine the format and size of the requested images.
The investigator can specify the number of images listed by using one of the
options in the ‘No. of Images’ panel or using the number of displayed images
specified in the system global settings. After specifying all details of the search
query, the investigator clicks on the ‘Retrieve’ button to retrieve all images that
met all search conditions (133 images). The ‘Reset’ button is used to restore all
search condition values to their original value.
To facilitate reviewing the retrieved images in the results panel, the ‘-‘ button on
the left-hand side of the search query panel is used to hide the search query panel
and place the results panel as a first panel (the button name will be changed from
‘-’ to ‘+’). The investigator can display the search query panel again by clicking on
the ‘+’ button.
182
All retrieved images will be presented in the results panel. Right-clicking on any
image will show a menu that includes two choices; ‘Object Matching’ and ‘Text
Similarity’. When investigators select the first option, ‘Object Matching’, the
system will hide the search tab and show the object matching tab and put the
selected image as a query image. By selecting ‘Text Similarity’, the system will
hide the search tab, show the text similarity tab, extract all text included in the
selected image, and show it in the search text as will be explained later.
All details documenting the search process and the retrieved images will be saved
in the system database. The investigator could indicate if the results (images) are
analysed or not by clicking on the button under the results panel. The default
value of the button is ‘No’. The aim of this button is to clarify if the results are
reviewed in order to return to the results and analyse later.
The third part of the search tab is for creating a new bookmark panel. The
investigator has two options to select the desired images from the results. Either
pressing on ‘Select All’ to select all images or selecting images individually to
save them as a bookmark. After that, the investigator should insert the bookmark
details (bookmark name and bookmark comment) and then click on the ‘Upload’
button to list all selected images in the ‘Item Selected’ list. Finally, they must click
on the ‘Bookmark’ button to save all bookmark details such as case name,
investigator name, bookmark name, date, and time etc. The bookmarked images
will be used later in the report tab.
When the investigator clicks on any image listed in the results panel, the system
will display the images, as shown in Figure 5.10. By pressing on the side arrows
(left/right), the investigator can pursue the previous/next images.
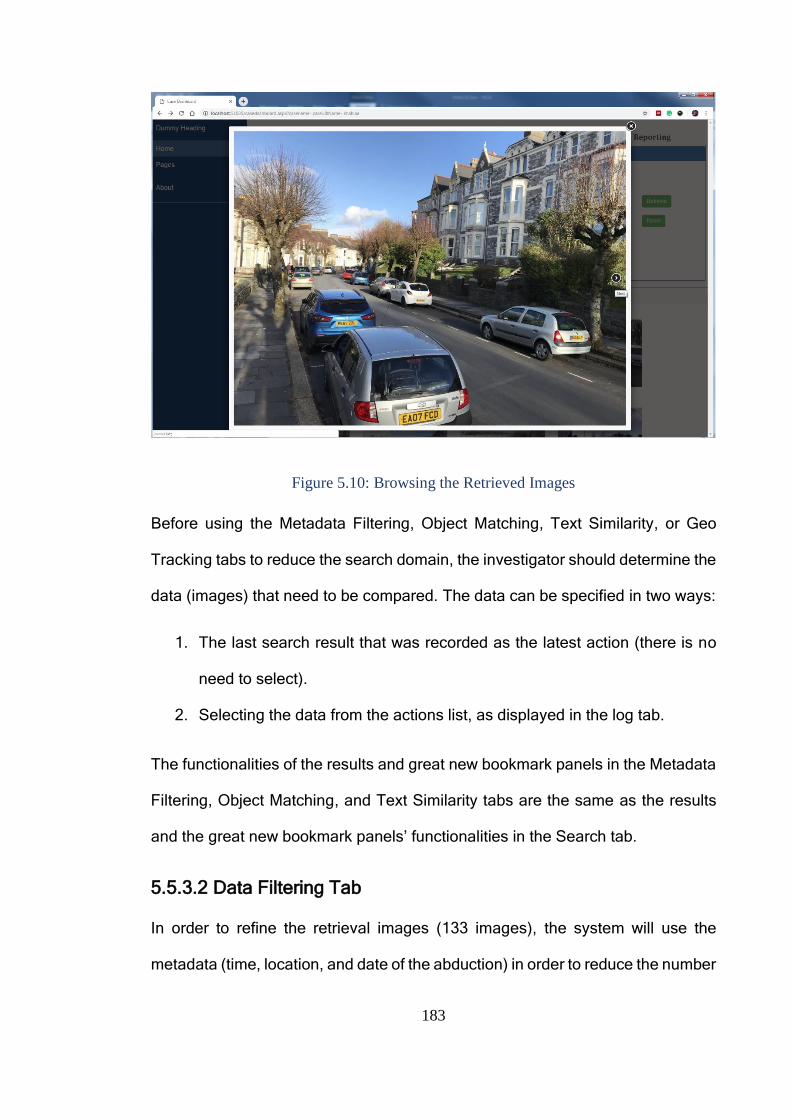
183
Figure 5.10: Browsing the Retrieved Images
Before using the Metadata Filtering, Object Matching, Text Similarity, or Geo
Tracking tabs to reduce the search domain, the investigator should determine the
data (images) that need to be compared. The data can be specified in two ways:
1. The last search result that was recorded as the latest action (there is no
need to select).
2. Selecting the data from the actions list, as displayed in the log tab.
The functionalities of the results and great new bookmark panels in the Metadata
Filtering, Object Matching, and Text Similarity tabs are the same as the results
and the great new bookmark panels’ functionalities in the Search tab.
5.5.3.2 Data Filtering Tab
In order to refine the retrieval images (133 images), the system will use the
metadata (time, location, and date of the abduction) in order to reduce the number
184
of retrieval results. The investigator will be able to target images (the suspect's
car) from the retrieval results, and the system will provide further correlation and
analysis functions that will enable the target car to be tracked across the different
evidence sources.
Before using the metadata filtering tab (Figure 5.11), investigators should specify
which data (images) need to be filtered. The functionality of the metadata filtering
tab is to refine images that have been retrieved by the search tab (the last search)
or by another tab, thereby retrieving relevant images only. This tab consists of
three panels: Metadata Filters, Results, and Create New Bookmark. The top
panel is a metadata filters panel that contains multiple filters: date, time, camera
model, camera maker, latitude and longitude. These filters can be used to refine
the selected data. The system will fill all dropdown lists (Date, Time, Camera
Maker, and Camera Model) based on the selected images’ metadata; for
instance, the date dropdown list will contain all date values that are relevant for
the selected images after arranging them in ascending order. Using the dropdown
list to select requested values of the filter will facilitate the selection process and
exclude inserting a wrong value. The metadata filtering panel has two buttons:
‘Retrieve’ and ‘Reset’. Clicking on the ‘Retrieve’, button the system will search the
database (selected images) and retrieve all images whose metadata values
match the filter values. Clicking on the ‘Reset’ button leads to restoring all filter
values to the original. This tab assists to reduce the number of retrieved images
from 133 to 18 that help the investigator to find the required images in a short time
and less effort.
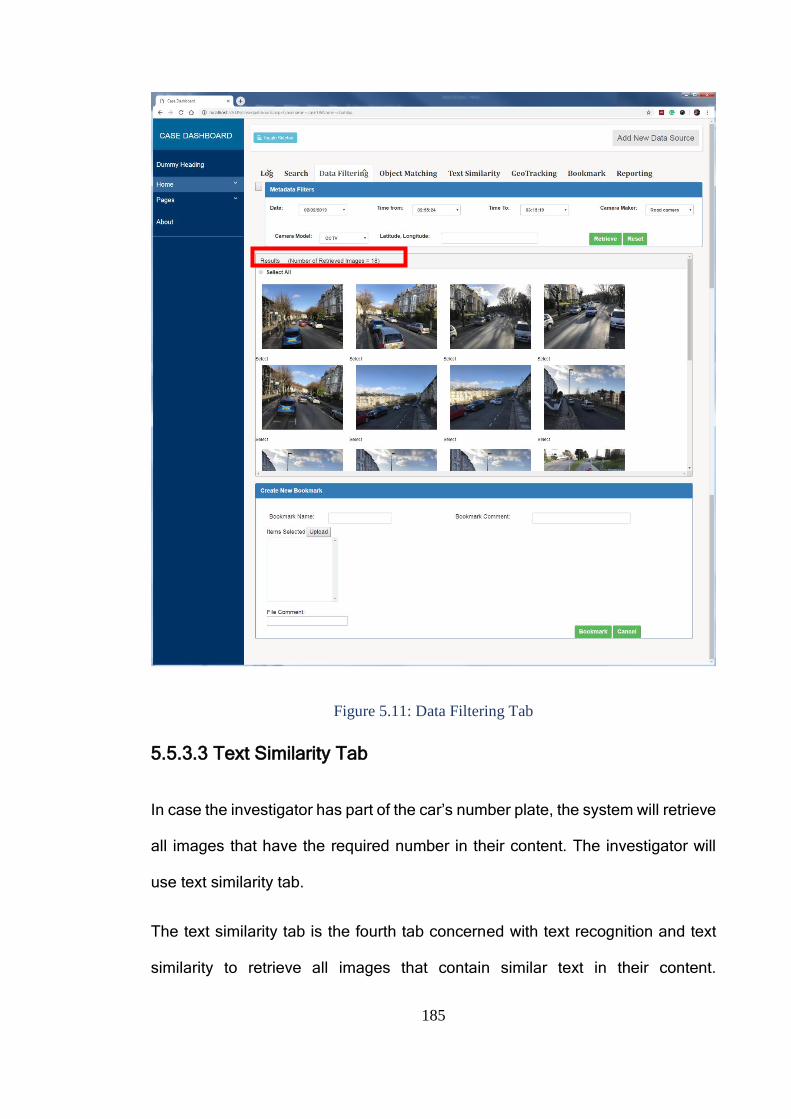
185
Figure 5.11: Data Filtering Tab
5.5.3.3 Text Similarity Tab
In case the investigator has part of the car’s number plate, the system will retrieve
all images that have the required number in their content. The investigator will
use text similarity tab.
The text similarity tab is the fourth tab concerned with text recognition and text
similarity to retrieve all images that contain similar text in their content.
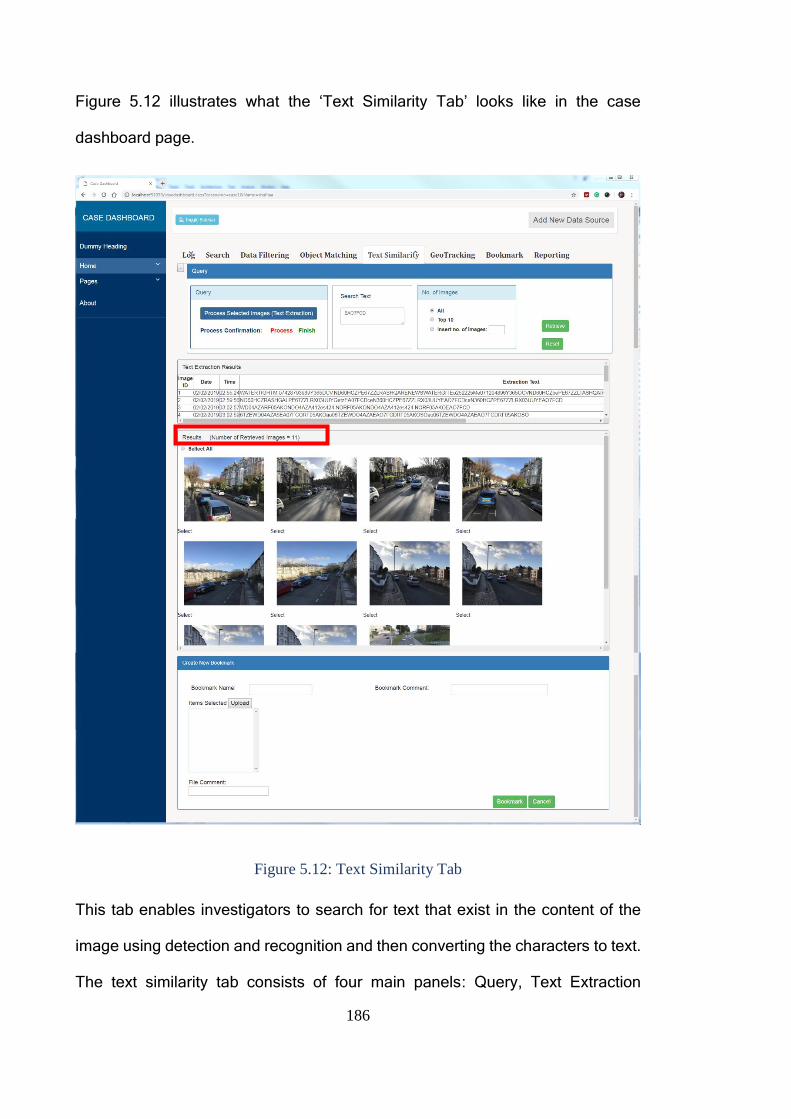
186
Figure 5.12 illustrates what the ‘Text Similarity Tab’ looks like in the case
dashboard page.
Figure 5.12: Text Similarity Tab
This tab enables investigators to search for text that exist in the content of the
image using detection and recognition and then converting the characters to text.
The text similarity tab consists of four main panels: Query, Text Extraction
187
Results, Results, and Create New Bookmark. The query panel includes three sub
panels: Query, Search Text, Number of Images, and ‘Retrieve’ and ‘Reset’
buttons. The investigator has three ways of specifying the query text as illustrated
below:
1. By clicking on the ‘Process Selected Images (Text Similarity)’ button in the
query sub panel to extract all texts from the selected data and show the
results in the ‘Text Extractions’ panel, the investigator can select the
desired text. The panel has two labels ‘Process’ and ‘Finish’ to illustrate
the continuity of the text extraction process or finishing. In the beginning,
the ‘Process’ label is green and the ‘Finish’ label is red during the text
extraction process. Once the text extraction process is finished, the
finished label becomes green.
2. Right click on any image in the results panel of the search tab, then the
system will extract the text and present it in the search text box.
3. Insert the requested text in the search text box.
After specifying a query (relevant words), the investigator will click the ‘Retrieve’
button to find all relevant images. The retrieved images will be gained by
comparing part or all of the query text with the texts of the selected images. This
tab aids in reducing the number of images to 11 images, instead of revising 133
images, the investigator now has only 11 images for reviewing.
5.5.3.4 Geo Tracking Tab
After rretrieving all images that have the same car plate number (target car), the
Geo Tracking tab will be used to track the target car by using GPS information to
find the last appearance of the suspect car. The resulting visualisation will provide
188
the graphical map of the resulting journey alongside the image sources used to
identify the path of the car.
The Geo Tracking Tab (as illustrated in Figure 5.13) employs the Google Maps
API to specify the location of a person/object and shows the direction between
points. Two panels, namely ‘List of Functionalities’ and ‘Google Map’ are included
in the Geo Tracking tab. The ‘List of Functionalities’ panel provides investigators
with a Maps JavaScript API that displays the geographic location of a user,
device, or imagery on Google Maps. This panel has three functions ‘Route’,
‘Show Photos,’ and ‘Show Points’, as well as ‘New Search’ button. When the
investigator chooses the Route function, the system will add two dropdown lists
‘Start’ and ‘End’. Each list will fill with images that are selected previously
(selected data). The images in these two lists are listed based on their captured
time in ascending order. The investigator can select any image from the start list
and another image from the end list, then the system will display the route
between these two images in Google Maps, using driving as a mode of travel.
The investigator can click on the pin to know the address of the image.
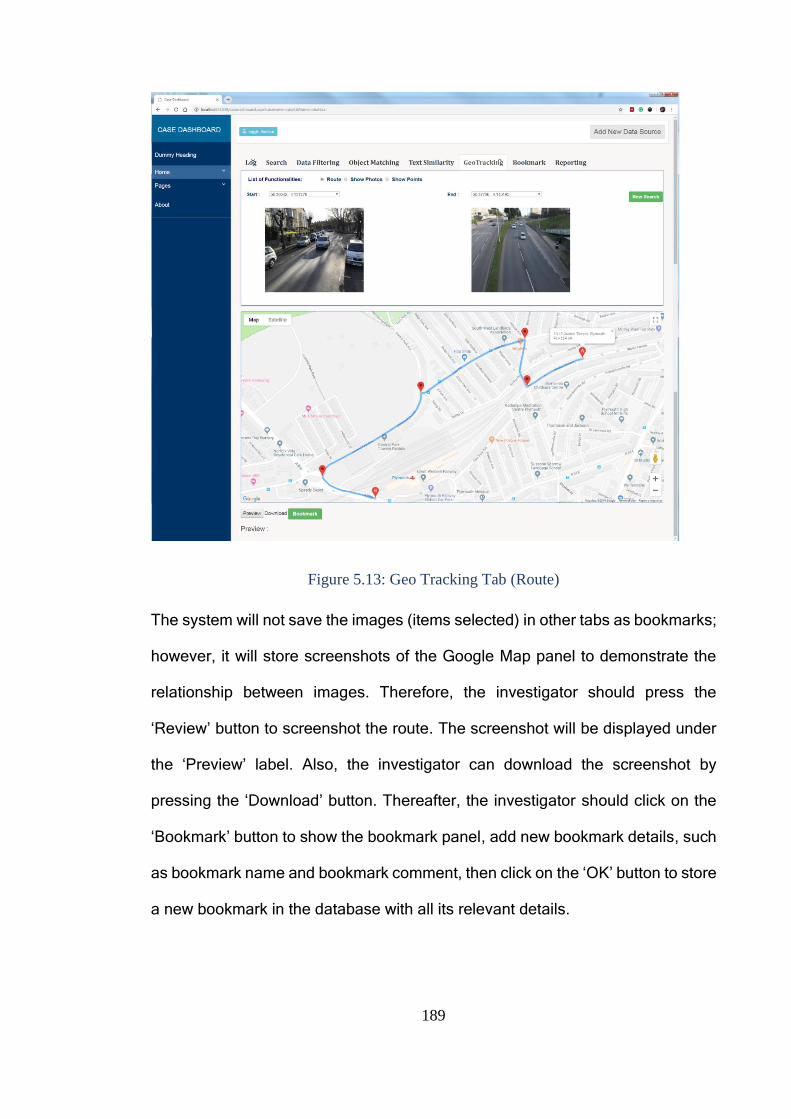
189
Figure 5.13: Geo Tracking Tab (Route)
The system will not save the images (items selected) in other tabs as bookmarks;
however, it will store screenshots of the Google Map panel to demonstrate the
relationship between images. Therefore, the investigator should press the
‘Review’ button to screenshot the route. The screenshot will be displayed under
the ‘Preview’ label. Also, the investigator can download the screenshot by
pressing the ‘Download’ button. Thereafter, the investigator should click on the
‘Bookmark’ button to show the bookmark panel, add new bookmark details, such
as bookmark name and bookmark comment, then click on the ‘OK’ button to store
a new bookmark in the database with all its relevant details.
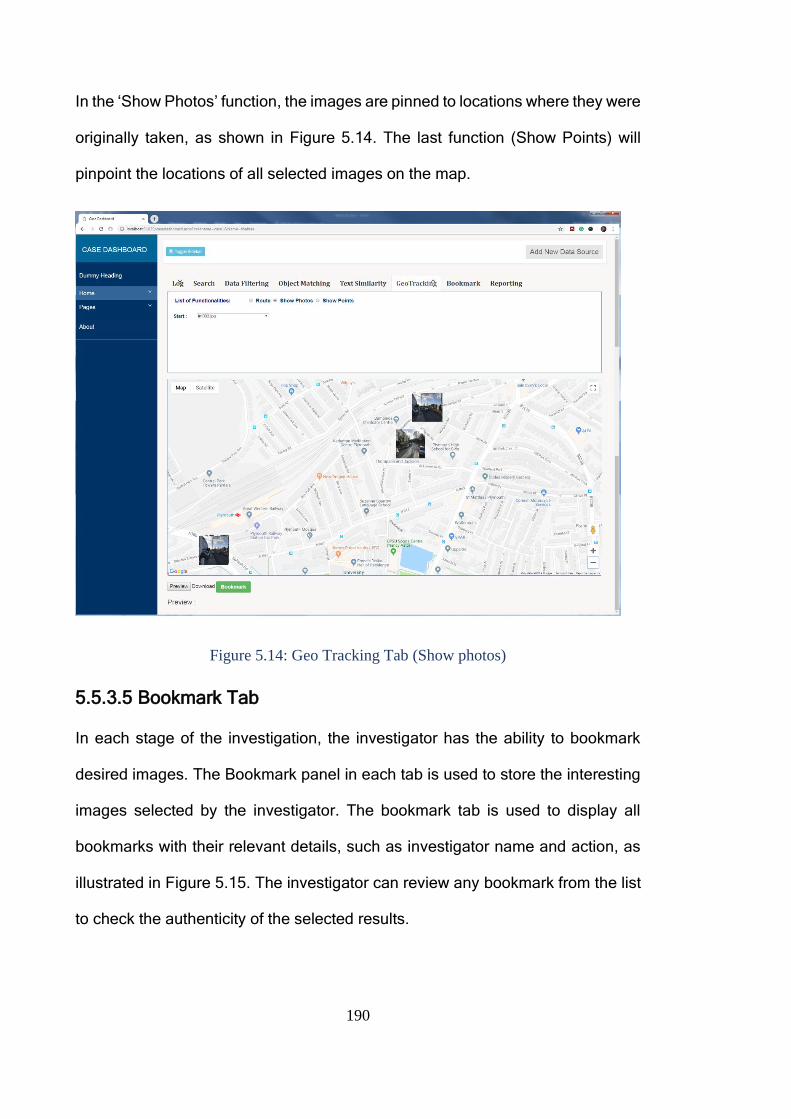
190
In the ‘Show Photos’ function, the images are pinned to locations where they were
originally taken, as shown in Figure 5.14. The last function (Show Points) will
pinpoint the locations of all selected images on the map.
Figure 5.14: Geo Tracking Tab (Show photos)
5.5.3.5 Bookmark Tab
In each stage of the investigation, the investigator has the ability to bookmark
desired images. The Bookmark panel in each tab is used to store the interesting
images selected by the investigator. The bookmark tab is used to display all
bookmarks with their relevant details, such as investigator name and action, as
illustrated in Figure 5.15. The investigator can review any bookmark from the list
to check the authenticity of the selected results.
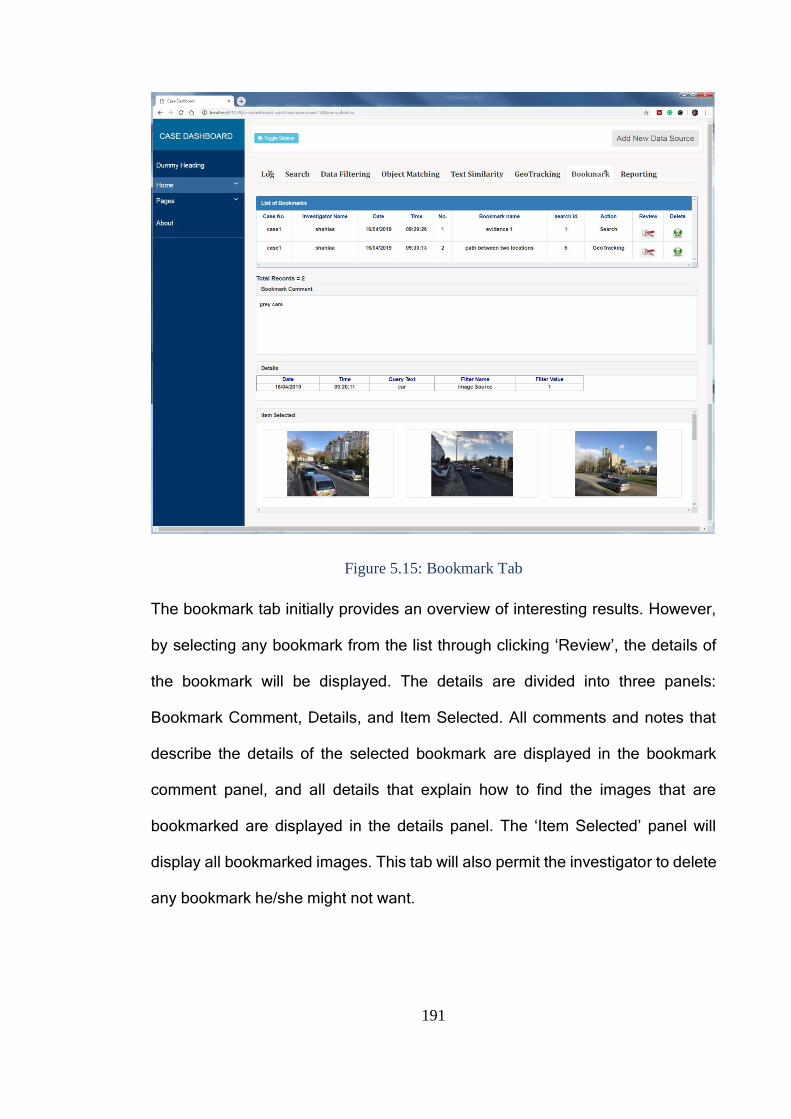
191
Figure 5.15: Bookmark Tab
The bookmark tab initially provides an overview of interesting results. However,
by selecting any bookmark from the list through clicking ‘Review’, the details of
the bookmark will be displayed. The details are divided into three panels:
Bookmark Comment, Details, and Item Selected. All comments and notes that
describe the details of the selected bookmark are displayed in the bookmark
comment panel, and all details that explain how to find the images that are
bookmarked are displayed in the details panel. The ‘Item Selected’ panel will
display all bookmarked images. This tab will also permit the investigator to delete
any bookmark he/she might not want.

192
5.5.3.6 Reporting Tab
Once the case is thoroughly analysed, the final stage of the investigation process
is the output of the report. Figure 5.16 illustrates what the report may look like.
The report details will be displayed when the investigator clicks on the ‘Show
Details’ button.
The reporting tab has three main sections through which the relevant information
will be presented. The top section of the reporting tab displays the case details.
Following the case information, the ‘Investigator Information’ section shows all
investigators who are responsible for the case investigation and their details, such
as their name, role, and email etc. The last section is the evidence list, which is
divided into parts (evidence items) depending on the amount of evidence
extracted to resolve the case. Each evidence item includes two types of
information. The first type is the evidence (images) and the second is the details
that explain how and when the images are retrieved. The ‘Print’ button at the end
of the reporting tab is used to print the report.
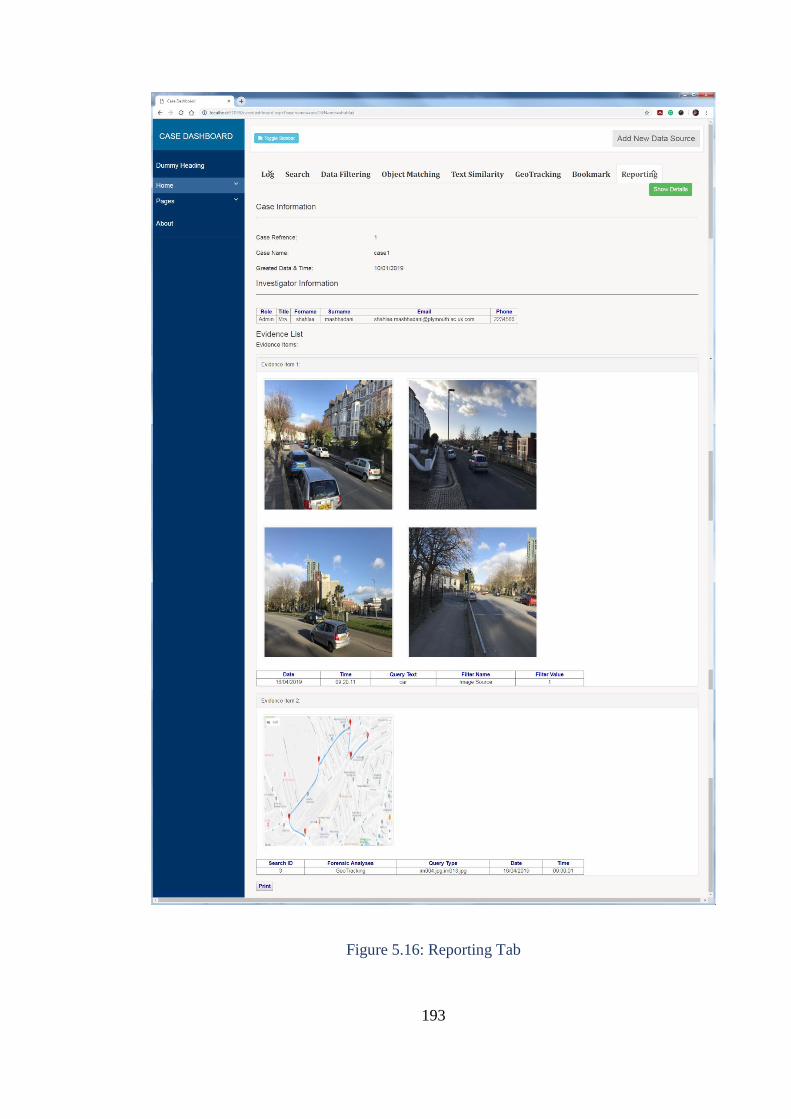
193
Figure 5.16: Reporting Tab

194
5.5.3.7 Log Tab
In case the investigator needs to conduct a new analysis (starting a new search
or working on previous results in order to find new results or complete the
previous work, the log tab will be used.
The log tab is the first active tab on the case dashboard page (as demonstrated
in Figure 5.17) because it provides the investigator with a list of all actions that
were accomplished on the selected case. When the investigator clicks on the
‘Show’ button that is positioned in the first panel, the case creation date and how
many times the case was opened will be displayed in the first panel. In addition,
all actions carried out on the case will be listed in the second panel. The list in the
second panel will inform the investigator of all actions carried out on the case and
identify which action is completed or which is under analysis in order to complete
the investigation process. In addition to the list of actions, the log tab contains the
results panel and the details panel. The investigator can select any action from
the list by clicking on the ‘Select’ button, then the system will show the results
obtained from this action (Search, Metadata Filtering, Object Matching, Text
Similarity or Geo Tracking) in the results panel, and all details that demonstrate
how these results are acquired will be displayed in the details panel. The
identification number (ID) of any selected action will be stored in order to use it
later in the following tabs. This ID will be used to specify the data to be refined.
After selecting the desired data, the investigator can transfer to another tab to
complete the analysis process for the selected data.
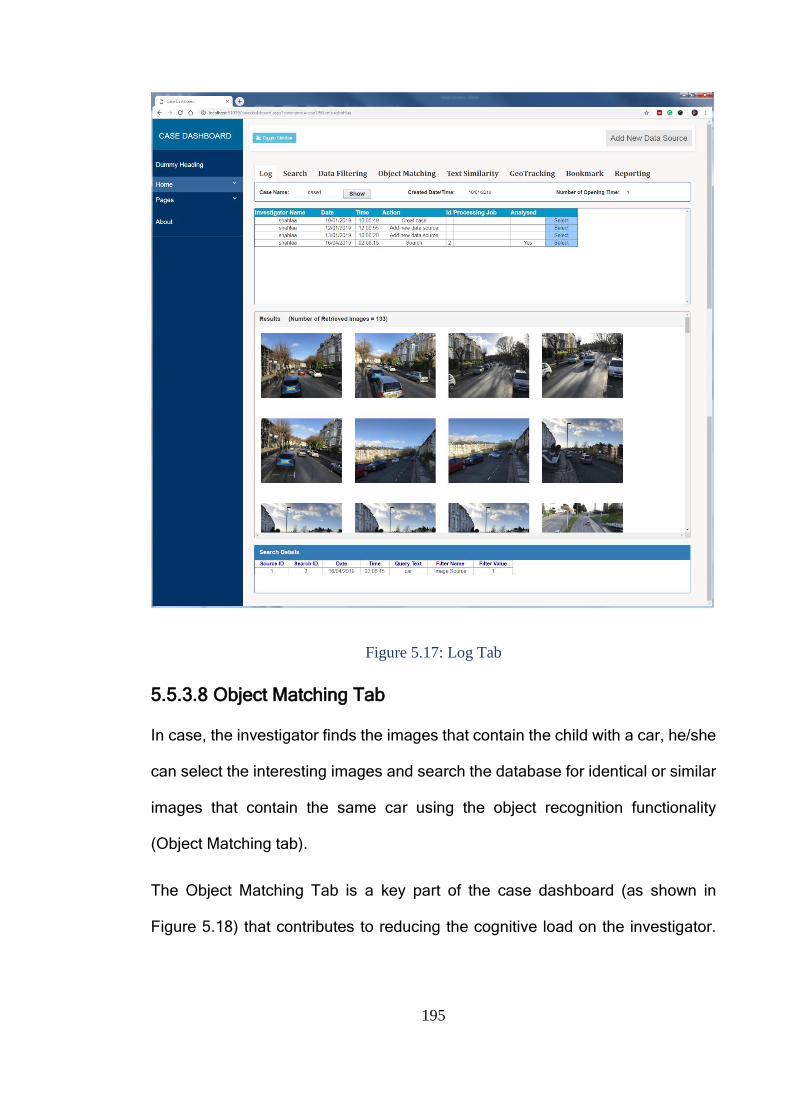
195
Figure 5.17: Log Tab
5.5.3.8 Object Matching Tab
In case, the investigator finds the images that contain the child with a car, he/she
can select the interesting images and search the database for identical or similar
images that contain the same car using the object recognition functionality
(Object Matching tab).
The Object Matching Tab is a key part of the case dashboard (as shown in
Figure 5.18) that contributes to reducing the cognitive load on the investigator.
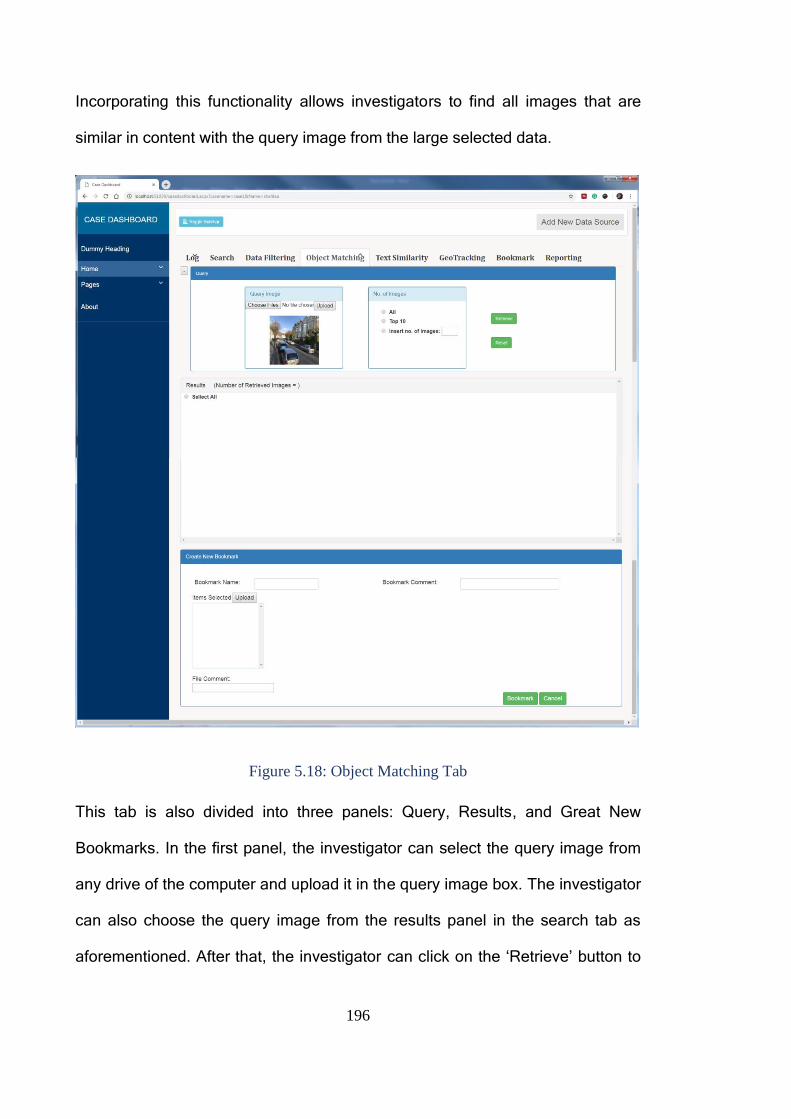
196
Incorporating this functionality allows investigators to find all images that are
similar in content with the query image from the large selected data.
Figure 5.18: Object Matching Tab
This tab is also divided into three panels: Query, Results, and Great New
Bookmarks. In the first panel, the investigator can select the query image from
any drive of the computer and upload it in the query image box. The investigator
can also choose the query image from the results panel in the search tab as
aforementioned. After that, the investigator can click on the ‘Retrieve’ button to
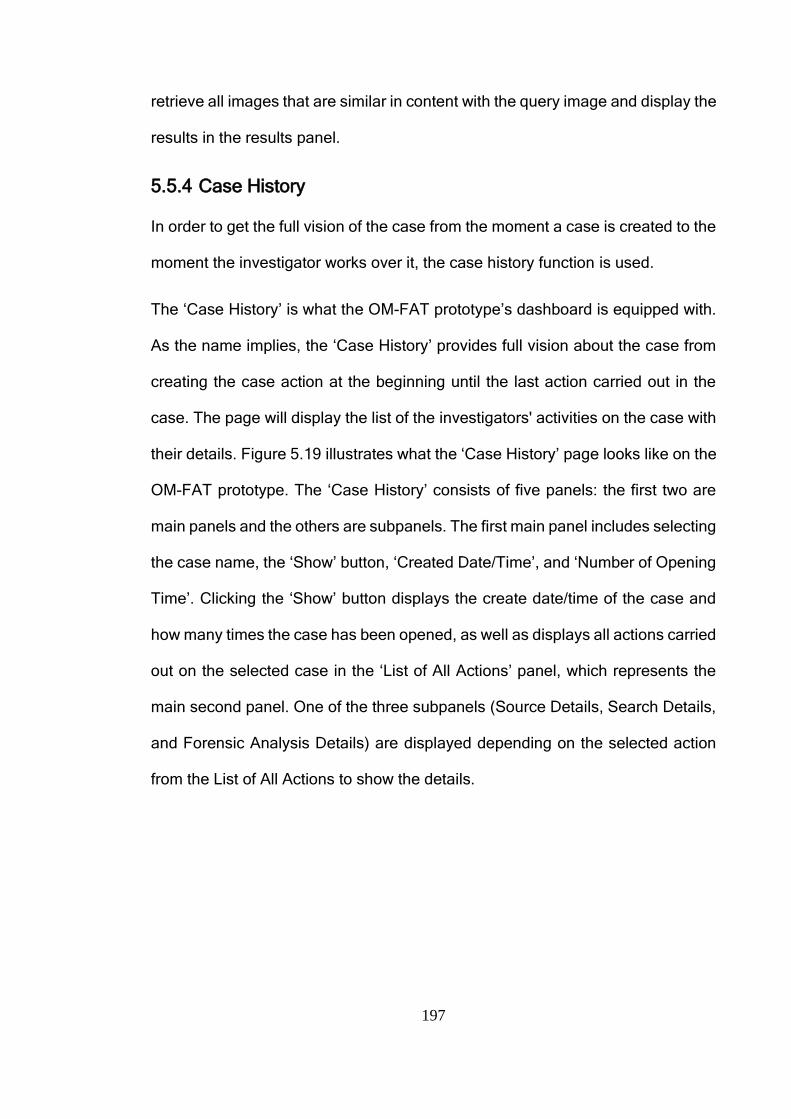
197
retrieve all images that are similar in content with the query image and display the
results in the results panel.
5.5.4 Case History
In order to get the full vision of the case from the moment a case is created to the
moment the investigator works over it, the case history function is used.
The ‘Case History’ is what the OM-FAT prototype’s dashboard is equipped with.
As the name implies, the ‘Case History’ provides full vision about the case from
creating the case action at the beginning until the last action carried out in the
case. The page will display the list of the investigators' activities on the case with
their details. Figure 5.19 illustrates what the ‘Case History’ page looks like on the
OM-FAT prototype. The ‘Case History’ consists of five panels: the first two are
main panels and the others are subpanels. The first main panel includes selecting
the case name, the ‘Show’ button, ‘Created Date/Time’, and ‘Number of Opening
Time’. Clicking the ‘Show’ button displays the create date/time of the case and
how many times the case has been opened, as well as displays all actions carried
out on the selected case in the ‘List of All Actions’ panel, which represents the
main second panel. One of the three subpanels (Source Details, Search Details,
and Forensic Analysis Details) are displayed depending on the selected action
from the List of All Actions to show the details.
198
Figure 5.19: Case History
The case filtering option shown on the left side of the dashboard page helps
investigators find the requested case from the active or archive cases list. The
case filtering option includes four filters: case status, investigator name, case
type, and open time. The investigator can select the value of each filter from the
dropdown menu without the need for inserting any value. The values of each
dropdown menu come from the existing case's details to facilitate the choosing
process. In both choices, for ‘Active’ or ‘Archive’, the system will read all filters’
values from the dashboard page in order to retrieve and list all cases that meet
the filters’ values in their details.
Each action carried out by the investigator leads to opening a new page. The
system will pass two parameters, which include the name of the case and the
investigator, to the new page in order to use them in documenting the actions’
details. Most of the options in the first bar are also available on the left side
dummy headings of each page to meet the good usability requirement.
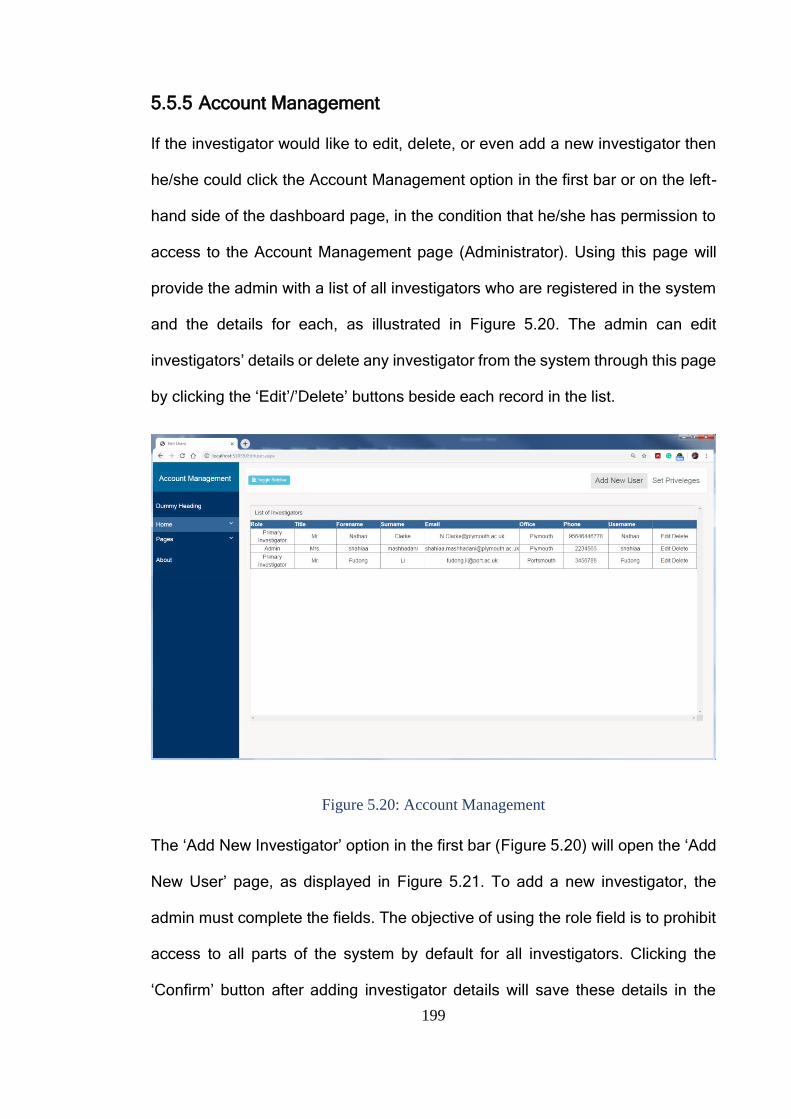
199
5.5.5 Account Management
If the investigator would like to edit, delete, or even add a new investigator then
he/she could click the Account Management option in the first bar or on the left-
hand side of the dashboard page, in the condition that he/she has permission to
access to the Account Management page (Administrator). Using this page will
provide the admin with a list of all investigators who are registered in the system
and the details for each, as illustrated in Figure 5.20. The admin can edit
investigators’ details or delete any investigator from the system through this page
by clicking the ‘Edit’/’Delete’ buttons beside each record in the list.
Figure 5.20: Account Management
The ‘Add New Investigator’ option in the first bar (Figure 5.20) will open the ‘Add
New User’ page, as displayed in Figure 5.21. To add a new investigator, the
admin must complete the fields. The objective of using the role field is to prohibit
access to all parts of the system by default for all investigators. Clicking the
‘Confirm’ button after adding investigator details will save these details in the
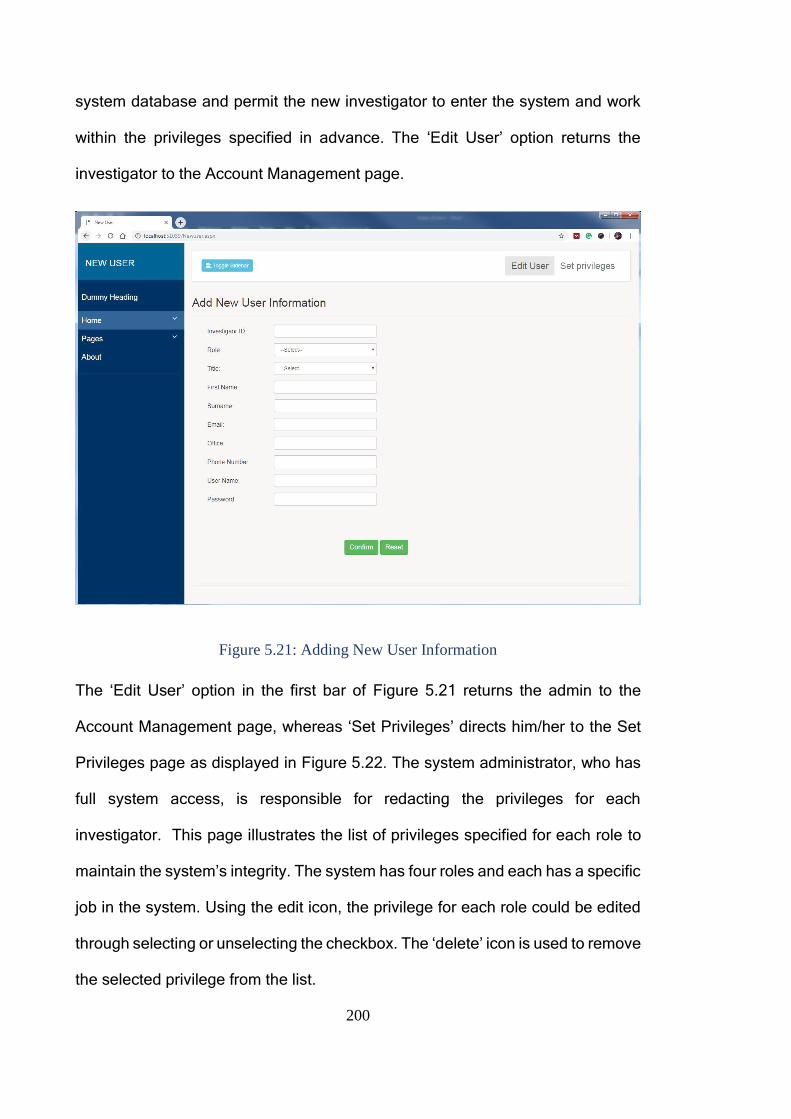
200
system database and permit the new investigator to enter the system and work
within the privileges specified in advance. The ‘Edit User’ option returns the
investigator to the Account Management page.
Figure 5.21: Adding New User Information
The ‘Edit User’ option in the first bar of Figure 5.21 returns the admin to the
Account Management page, whereas ‘Set Privileges’ directs him/her to the Set
Privileges page as displayed in Figure 5.22. The system administrator, who has
full system access, is responsible for redacting the privileges for each
investigator. This page illustrates the list of privileges specified for each role to
maintain the system’s integrity. The system has four roles and each has a specific
job in the system. Using the edit icon, the privilege for each role could be edited
through selecting or unselecting the checkbox. The ‘delete’ icon is used to remove
the selected privilege from the list.
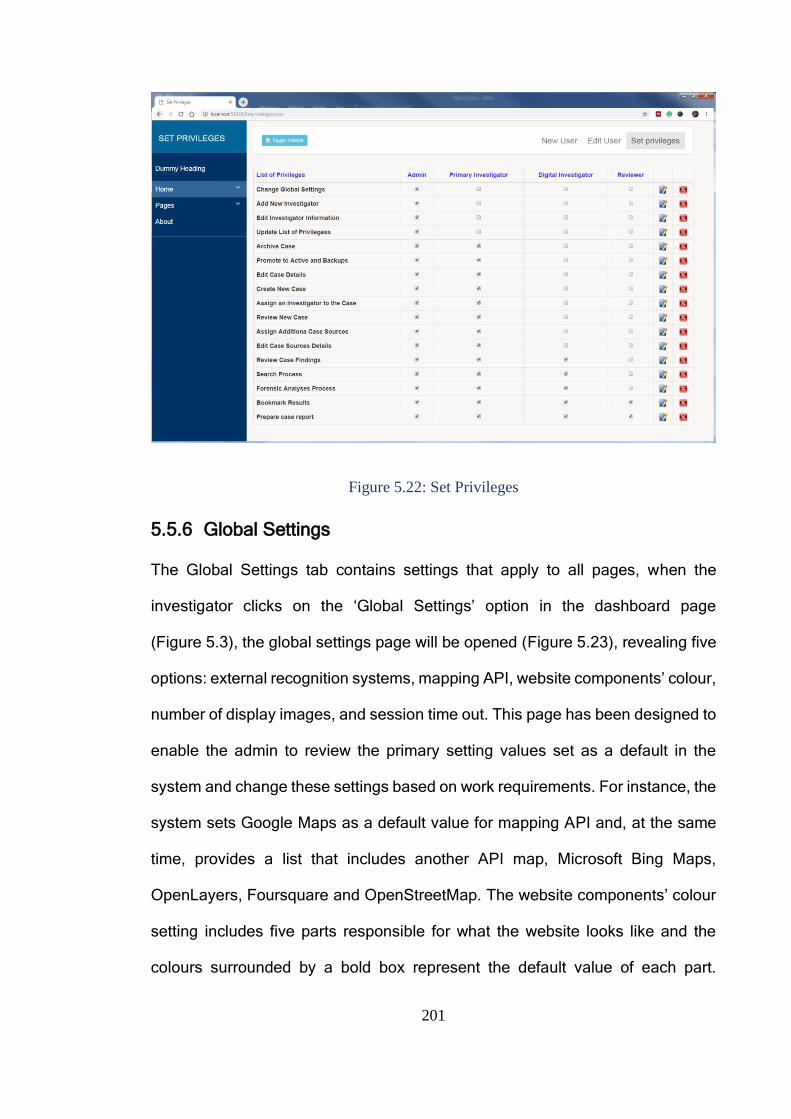
201
Figure 5.22: Set Privileges
5.5.6 Global Settings
The Global Settings tab contains settings that apply to all pages, when the
investigator clicks on the ‘Global Settings’ option in the dashboard page
(Figure 5.3), the global settings page will be opened (Figure 5.23), revealing five
options: external recognition systems, mapping API, website components’ colour,
number of display images, and session time out. This page has been designed to
enable the admin to review the primary setting values set as a default in the
system and change these settings based on work requirements. For instance, the
system sets Google Maps as a default value for mapping API and, at the same
time, provides a list that includes another API map, Microsoft Bing Maps,
OpenLayers, Foursquare and OpenStreetMap. The website components’ colour
setting includes five parts responsible for what the website looks like and the
colours surrounded by a bold box represent the default value of each part.
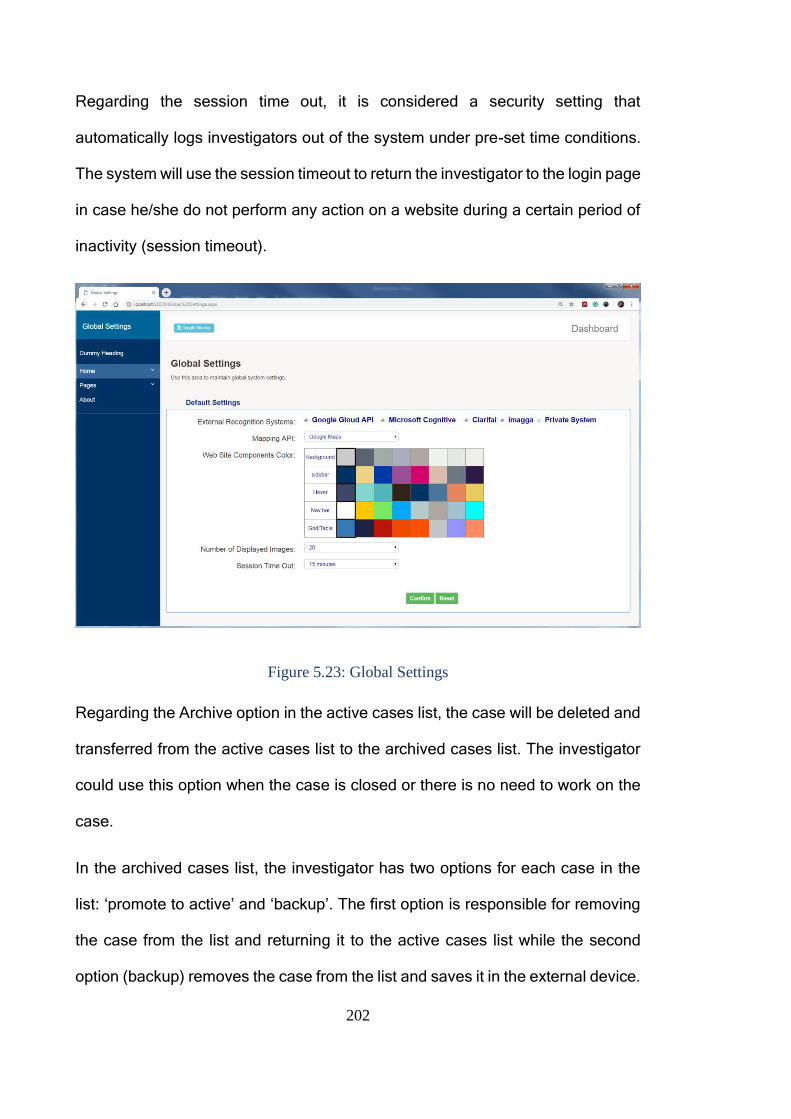
202
Regarding the session time out, it is considered a security setting that
automatically logs investigators out of the system under pre-set time conditions.
The system will use the session timeout to return the investigator to the login page
in case he/she do not perform any action on a website during a certain period of
inactivity (session timeout).
Figure 5.23: Global Settings
Regarding the Archive option in the active cases list, the case will be deleted and
transferred from the active cases list to the archived cases list. The investigator
could use this option when the case is closed or there is no need to work on the
case.
In the archived cases list, the investigator has two options for each case in the
list: ‘promote to active’ and ‘backup’. The first option is responsible for removing
the case from the list and returning it to the active cases list while the second
option (backup) removes the case from the list and saves it in the external device.
203
5.6 Conclusion
In this chapter, a novel OM-FAT prototype that provides a full case management
system for forensic image analyses has been developed and the details of the
prototype’s pages and their functionalities were also described. The OM-FAT
prototype was developed as a web-based to address the requirement of the OM-
FAT architecture. Each case has its own requirements. Therefore, the tool is
developed to deal with different types of evidence and large volumes of images.
The prototype can analyse image content and its metadata and extract all
valuable evidence by using a combination of image analysis techniques to
enhance the power of final recognition and allow for more accurate results to be
obtained. By recording all action that has been carried out on the case and the
role that specified for each investigator, the administrator is capable of controlling
all activities performed by each investigator. Further, the investigator could
complete any uncompleted work performed by another investigator or return to
the last stage of analysis that he/she performed because the system records
details of each action including termination of work or not. Regarding the data
selection before doing any forensic analyses process, this will help in the
correlation between images by using different relationships to minimise the
search domain and get evidence. Using the OM-FAT prototype will assist in the
investigation process by offering functionalities, such as case management,
image annotation, image analysis, displaying the results, and reporting, which
contribute to reducing the investigation time.
204
6 The Evaluation
6.1 Introduction
The main area of research focused on understating the image content in order to
extract the evidence through proposing a multi-algorithmic approach to improve
the image annotation performance (make data searchable), in addition to how
these information will be used in forensic context in order to allow examiner to
ask complex questions of the data and receive the answers to the essential
questions in the investigation in short time and effort through developing the
architecture and prototype that help to pin in demonstrate how the tool will help
the investigator to get timely response of the data. The tool aims to automate the
process of identifying and extracting annotation-based evidence from multimedia
content and perform a variety of forensic analyses to help investigators to
understand the relationship between artefacts to reduce the time consumed and
the burden of the investigation process.
To make judgments about the efficacy of the proposed approach, architecture
and prototype, and also determine their strengths and weaknesses points. With
this intention, the evaluation stage of the research was undertaken, which
involved the assessment of the research done by the academic experts within the
field of digital forensics. The chapter begins with a description of the evaluation
methodology followed by the feedback that comprised of the detailed answers
provided by the experts, followed by a detailed discussion of the experts’
feedback and the conclusion.
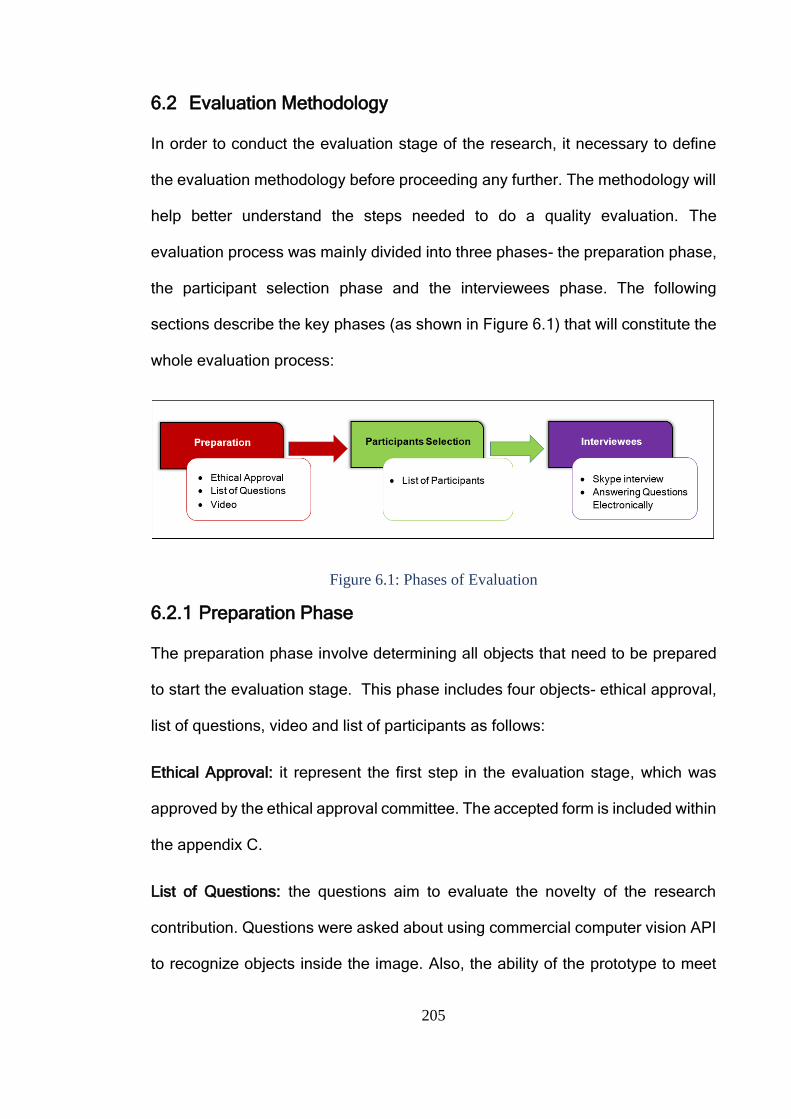
205
6.2 Evaluation Methodology
In order to conduct the evaluation stage of the research, it necessary to define
the evaluation methodology before proceeding any further. The methodology will
help better understand the steps needed to do a quality evaluation. The
evaluation process was mainly divided into three phases- the preparation phase,
the participant selection phase and the interviewees phase. The following
sections describe the key phases (as shown in Figure 6.1) that will constitute the
whole evaluation process:
Figure 6.1: Phases of Evaluation
6.2.1 Preparation Phase
The preparation phase involve determining all objects that need to be prepared
to start the evaluation stage. This phase includes four objects- ethical approval,
list of questions, video and list of participants as follows:
Ethical Approval: it represent the first step in the evaluation stage, which was
approved by the ethical approval committee. The accepted form is included within
the appendix C.
List of Questions: the questions aim to evaluate the novelty of the research
contribution. Questions were asked about using commercial computer vision API
to recognize objects inside the image. Also, the ability of the prototype to meet
206
the system requirements and the system workflow. Similarly, questions were
asked about using different image analysis approaches to reduce the search
domain and find the correlation between images. Then, the strengths and
weaknesses points of the demonstrated tool and the possibility of further features
that can improve retrieval performance are evaluated.
A total of 10 questions were prepared for this evaluation task and the list of these
questions is given as follows:
1. What are your thoughts regarding the research problem?
2. What are your thoughts about the using of commercial computer vision API
systems?
3. What are your thoughts about utilising a multi-algorithmic fusion approach
to improve the annotation performance?
4. With regard the following requirements, is the tool achieves these?
Reducing the investigator’s cognitive load to identify relevant evidence.
Ability to generate annotations for each image automatically to describe
the visual content of the image.
Provide a range of forensic analyses and correlation capability to aid an
investigator in querying the required images in a short time and less effort.
Provide case-based management infrastructure.
Maintain the chain of custody and meet privacy and security requirements
through specifying the role of each investigator that includes a set of
privileges, and also recording all actions accomplished on the case.
5. What are your thoughts about the OM-FAT workflow? Is it logical? Am I
missing anything else?
207
6. What are your thoughts about forensic images analyses that have been
used to compare between images in order to reduce the search domain
Annotations
Metadata
Object matching
Text similarity
Geo tracking
7. Are interfaces of the prototype satisfying, understandable, useful and easy
to use?
8. What are the strengths and weaknesses points of the demonstrated tool?
9. Do you suggest any other feature(s) that the case dashboard could
incorporate to improve the retrieval performance?
10. Is there anything else you would like to add?
Video: A demo of the research work has been presented by using slides in
Microsoft PowerPoint and the audio content (i.e. the narrations) that were
recorded separately. The PowerPoint file was then converted into a high-
definition resolution video and was uploaded to Vimeo (a popular online video
sharing platform). To make sure that the safety of the unpublicised research
information contained in the video, the uploaded video was set to ‘private’ and the
video was password protected. The link and password to watch the video were
given to the experts only prior to the interview.
The video illustrates many points- research problem, use cases, Object-based
Multimedia Forensic Analysis Tool (OM-FAT) requirements, OM-FAT
architecture, multi-algorithmic approach and implementation of the prototype (live
implementation). The main challenges in this step was inability to obtain real

208
crime case to run the prototype and show its effectiveness, therefore the author
collect simulated data and used it in prototype implementation. Another challenge
was to present the entire work in a specific time (approximately 20 minutes).
However, the video contained a live run of most prototype functionalities, multi-
algorithmic approach with its results and other subjects which meant that the
timing, entirety and quality of the video had to be focused on at the same time
which also lead to a lot of effort put in. In the end, the length of the video was a
twenty-two and a half minutes long so that the participants watching it would not
lose their interest and would continue with the process.
6.2.2 Participants Selection
The phase of identifying the ideal group of people that are eligible to participate
in the evaluation includes looking for academics that are doctors and professors
followed by selecting a sample group containing the potential participants. In the
end 23 academics with different backgrounds and experiences were selected to
help cover all dimensions of the offered transdisciplinary research. The invitation
letters were sent to them asking if they would participate in the evaluation.
However only one person accepted to participate in the evaluation leading to the
rest apologizing for not having the time or not answering. The author waited more
than one month to receive a replay and also send reminder, however she received
only one acceptance from one person who was:
• Robert Hegarty, PhD. Robert is a senior lecturer in cyber security and
digital forensics at Manchester Metropolitan University (MMU), UK. Email:
[email protected]. Dr Robert delivers undergraduate, postgraduate
and degree level apprenticeships units at MMU. He is a main research
interests are in the areas of digital forensics in computer security, digital
209
forensics, cloud computing. Dr Robert has published multiple papers in
conferences as well as journals.
Due to the time limitation and the prototype took a large body of work, it was
difficult to look for new participants for the evaluation and the decision was to
close that work package down and introduce how the prototype works within the
uses case (child abduction) that represented early in the thesis to show practice
evaluation of how my tool could be used to fit that circumstance.
6.2.3 Interviewees
Interviewee represents last phase in the evaluation process that could be
conducted by interviewing the academics by skype or answering the questions
electronically. These two ways have been suggested to provide the participant
the chance to select which way is more convenient.
6.3 The Feedback
The questions were designed in a manner that investigates the multi-algorithmic
and the OM-FAT in terms of admissibility, efficiency, reliability and usability. Open
question was raised in the end of the list of questions with the aim of appraising
weaknesses as well as strengths of the proposed approach and tool. Because of
the only participant participated in the evaluation, the following feedback is only
from Dr Robert Hegarty who has answered the questions electronically (italic font
represents his replay):
1. What are your thoughts regarding the research problem? - The research
problem tackles a relevant real world challenge, cognitive and
psychological load are significant challenges in this domain.
2. What are your thoughts about the using of commercial computer vision
API systems? - The approach is appropriate, it saves re-inventing the wheel.
210
3. What are your thoughts about utilising a multi-algorithmic fusion
approach to improve the annotation performance? - This approach
appears to be the main contribution of the work, I would like to see more
details on this. At present the presentation focuses on usability, which is
appropriate given the goals of the project, however it does not highlight
this important feature of your work. I would like to see comparison of the
results from your MA fusion model other fusion models, and existing AIA
systems for a variety of case studies.
4. With regard the following requirements, is the tool achieves these?
Reducing the investigator’s cognitive load to identify relevant
evidence.
To a large extent yes, however the reliance on uploading specific files,
rather than forensic hard drive images introduces an additional
burden.
Ability to generate annotations for each image automatically to
describe the visual content of the image.
The tool appears to achieve this, but further statistical analysis and
experiments are required to demonstrate this.
Provide a range of forensic analyses and correlation capability to aid
an investigator in querying the required images in a short time and
less effort.
Again from the demonstration this appears to be true, however
further experiments and statistical analysis are required.
Provide case-based management infrastructure.
Yes, however I would like to see the focus shifted to analysis of the
efficacy of the MA data fusion model, remember you are producing
scientific research, rather than a product.
Maintain the chain of custody and meet privacy and security
requirements through specifying the role of each investigator that
includes a set of privileges, and also recording all actions
accomplished on the case.
211
Yes, however a more in-depth description of the access control model
and specifications for how the data is protected during transit and at
rest are required.
5. What are your thoughts about the OM-FAT workflow? Is it logical? Am I
missing anything else? The work flow is logical, however I would like to
know more about how the MA data fusion process works, there is little
information on this in your presentation.
6. What are your thoughts about forensic images analyses that have been
used to compare between images in order to reduce the search domain
Annotations
Metadata
Object matching
Text similarity
The above techniques are all appropriate and well implemented,
however it is difficult to discern if they are novel contributions
without more insight into you MA fusion system.
Geo tracking - I particularly like the journey planner functionality, this
could be augmented by pulling in traffic data from the time the
images was taken, to give a realistic reconstruction of the journey.
7. Are interfaces of the prototype satisfying, understandable, useful and
easy to use? - Yes.
8. What are the strengths and weaknesses points of the demonstrated tool?
- The tool is very polished, and easily accessible, however it does not
provide any statistics on the confidence of images being a match for an
annotation etc, this would likely be a requirement for use in a legal setting.
It is also difficult to determine the performance and scalability of the
system based on the limited data presented, some statistics on this would
be beneficial.
9. Do you suggest any other feature(s) that the case dashboard could
incorporate to improve the retrieval performance? Colour coding of

212
evidence flags in the geolocation section, to illustrate which sources the
evidence came from.
10. Is there anything else you would like to add? - Have you considered the
challenges of explaining how the various data vision techniques work to a
non-scientific audience (e.g. a Jury)
6.4 Discussion
In the discussion section, both answers and suggestions expressed by the
experts that participated in the evaluation process are addressed here.
Despite the fact that the majority of Dr Robert opinion was positive on the whole
work via his answers to the asked questions, he had/raised, however, some
concerns and recommendations that can be discussed including:
The opinion of Dr Robert regarding the research problem that the topic of
research was a valid one and tackles a relevant real world challenge, cognitive
and psychological load, which are significant challenges in the field of digital
forensics. The using of commercial systems was also appreciated, and also it
better than developing a new system in terms of performance and time.
Dr Robert focused more on the multi-algorithmic approach and considered it the
main contribution of the work. To some extent that right because the contribution
of the research are two folds-proposing multi-algorithmic approach and the OM-
FAT. The comparison between the results from the multi-algorithmic approach
and other fusion models and existing AIA systems for a variety of case studies
was carried out. However, due to the time-restricted in video creating, only the
main results have been included.
Regarding the strengths and weaknesses points of the OM-FAT, the tool does
not provide any statistics on the confidence of images being a match for an
213
annotation. The proposed approach achieved 80% of annotation precision and
the number of annotations was 20. This means that the confidence of the
proposed approach in describing image content near to be 100% when the
number of labels is 5. In addition, there is difficulty in determining the performance
and scalability of the system because using the limited data, because of the
difficulty to obtain real cases.
During the evaluation session, a suggestion made by Dr Robert was to consider
colour coding of evidence flags in the geolocation section to illustrate which
sources the evidence came from. This suggestion is important in investigating
and solving the crime, it has been mentioned in system architecture.
Finally, Dr Robert points out whether potential challenges have been taken into
account when explaining the work to an unscientific audience (such as a jury),
the academic people have selected for evaluating the work because they are
more rounded in full commentary of the nature system and understand what the
research where going.
6.5 Conclusion
The chapter describes the entire process of the evaluation that aims to extract
relevant information from an independent and unbiased group of academic
experts, who are both eligible and willing to offer a fresh perspective on different
aspects of the research. The evaluation process begins with preparing the list of
questions, video and list of participants, in addition to Ethical approval and end
with illustrating and discuss the feedback. The questions were designed in a
manner that covers the main areas of the research and considerate the level of

214
the potential participants and their academic and professional knowledge and
experience in the field of digital forensics.
Expert assessment of the work is an essential and important stage of research
without which research is incomplete. Unfortunately, only one person, Dr Robert,
participated in the assessment stage of the evaluation process, on the other hand,
the other 22 participants were busy or did not respond to the invitation letter.
However, most of Dr Robert's comments were very positive and helpful to all
questions.
Dr Robert found that it is difficult to judge the performance and scalability of the
system based on the limited data presented. Furthermore, his attention was as
regards the analysis of the efficacy of the multi-algorithmic data fusion model and
request more statistical analysis and experiments to show the efficiency of the
proposed approach. However, due to the difficulties of finding real cases and the
time-restricted of creating the video, the two points were not met completely. In
addition, he suggested adding a color flag on the google map to illustrate which
sources the evidence came from.
215
7 Conclusion and Future Work
The research objective was to design and develop a novel framework for object-
based multimedia forensic analysis that annotates images automatically to allow
for keyword and pattern-based searching and to develop a forensic analysis
process that extracts multiple pieces of evidence from a heterogeneous forensic
image database. This will permit investigators to ask complex high-level queries
of the acquired data. In addition, the OM-FAT tool provides full case management
functionality (from acquisition to reporting), which aids in reducing the
investigator’s cognitive load and the time of the investigation.
This objective was achieved by generating image annotations through
developing the multi-algorithmic approach that generates annotations based on
merging multiple AIA systems’ results and by employing various image analysis
approaches that aid in aggregation and correlation of the images. A path was set
by beginning to learn about forensic image analysis and investigating image
analysis studies in the digital forensics domain in order to define the research
problem. Following the literature review of image-based retrieval methods, a
novel solution to tackle the problem was hypothesised; this solution was tested
for its feasibility. After proving the practicality of the hypothesis, the research went
on to design a novel architecture that can solve crimes where a large number of
images need to be analysed in an efficient and timely manner. In the final stage
of the research, a functional prototype was developed.
7.1 Achievements of the Research
Overall, the research has achieved all objectives listed in Chapter 1 through
conducting a critical review of the literature, developing a novel approach to
216
generate final image annotation, designing a novel architecture, implementing a
prototype, and evaluating the research. The following are the main achievements
of this research:
1. The primary stage of the research was understanding the current
state-of-the-art of forensic image analysis. Building on this, an
exhaustive set of literature surrounding existing research in the
domain of image analysis in digital forensic was addressed to
identify the research problem. In addition, a comprehensive review
of image-based retrieval techniques was also achieved to identify
the best technique that could be employed on forensic images to
retrieve specific evidence from a large number of images
(Chapter 2).
2. A series of experiments that evaluate commercial computer vision
API systems to determine their accuracy and ability to
comprehensively annotate images within a forensic context were
conducted. In addition, the multi-algorithmic approach was
proposed as a new approach that fused image annotation results
from multiple commercial computer vision API systems to improve
the annotation results and make them more reliable and robust. The
annotation results will have an important effect on the overall
system retrieval accuracy in the research’s later stages.
Experimental results refer to the superiority of the proposed
approach (Chapter 3).
3. On proving the hypothesis (i.e., the multi-algorithmic approach), the
next stage of the research was designing a novel architecture for
217
the proposed OM-FAT that can aid the investigation process in
analysing, interpreting, and correlating the multimedia-based
context. This achievement was made in the third stage of the
research (Chapter 4).
4. Developing and implementing the prototype based on the
successful design of the architecture to ensure that the system
works efficiently and can deal with different forensics cases related
to image analysis (Chapter 5).
5. Evaluation of the feasibility of the framework by seeking opinions
and feedback has been collected from academic researchers
(Chapter 6).
7.2 Limitations of Research
Despite the achievement of the research, certain limitations can be identified.
These limitations are summarised below:
1. Few studies are concerned with extracting evidence to solve criminal
cases through forensic image analysis, considering the accuracy and
speed requirements. Consequently, it is difficult to know what approaches
were employed, as well as what were the shortcuts.
2. Lack of availability of the public forensic image datasets containing
heterogeneous and fully annotated images in order to evaluate the
commercial systems and the proposed multi-algorithmic approach. To
assess the performance of commercial systems and the proposed
approach, the researcher had to use general datasets that contained
various images to simulate the forensic images. Regarding evaluating the
218
implemented prototype, the researcher had to collect a new dataset for this
purpose.
3. Although the multi-algorithmic approach achieved a good performance,
which was measured by average precision, average recall and f-measure,
the subjective quality of images is important for improving the annotation
performance of commercial systems, thereby improving the proposed
approach’s performance. Some cases include images that may suffer from
noise, poor contrast, or they may be blurry. In addition, some images come
with small sizes that are unacceptable for some systems. All this
decreases the performance of the multi-algorithmic approach, thereby
decreasing the retrieval performance of evidence and losing some
evidence.
4. The number of digital images increases exponentially, and these image
data have complex content, various formats, and require more developer
effort to analyse them efficiently and effectively. This large volume of
image data needs to be capable of being processed quickly (near real-
time) to meet the growing number requirements (time, burden, cost, etc.).
5. The speedy advancement in image editing software makes modification
and manipulation of digital visual data very easy. This advancement has
reached a level such that image tampering can be done without changing
its quality or leaving obvious traces. Consequently, it has become
essential in the forensic scenario to ascertain the trustworthiness of
images before using them as potential evidence.
219
6. Use of public annotation systems to process private data introduces the
problem of submitting evidence to an external untrusted source for
analysis.
7.3 Future Work
The research identified the challenges that face image analysis in the forensic
domain and succeeded in proposing a novel tool that can analyse images and
extract evidence efficiently (i.e., a novel framework for the Object-based
Multimedia Forensic Analysis Tool) followed by the development and evaluation
of the prototype. Nevertheless, there are several areas in which future work could
be carried out to advance on what has been achieved in this research. These
include:
7.3.1 Evaluation of the Image Quality Criteria and Enhancement
The acquired images that need to be investigated, suggesting that these images
are usually large in number, vary in quality, have unconstrained illumination, and
various orientations, object size, irregular background, and contain multiple
objects. As a result, these images are large and need pre-processing often in
near real-time to maintain the level of accuracy. Therefore, there is a need to
develop an enhancement method to process images so the result will be more
suitable than the original image. Image enhancement methods are based on
subjective image quality criteria. Therefore, the enhancement method will
improve the images’ visual appearance, thereby improving the annotation and
forensic image analysis (regarding the object-matching and text similarity)
performance.
220
7.3.2 Privacy
The use of publicly available annotation systems introduces some operational
limitations. Some of these systems, such as Microsoft Vision API, take a copy of
the image to improve its system performance. Consequently, there is a need to
explore and evaluate a range of pre-processing procedures to introduce the
necessary privacy required. The aim of pre-processing is to detect if the image
contains a person’s face or text that represents valuable details. The privacy pre-
processing is responsible for covering important content automatically by using a
mask. Another solution is by isolating images that contain important details and
then sending these details to private automatic annotation systems to annotate
the images.
7.3.3 Improving the Geo-Tracking System
The geo-tracking approach provides an overview of what directions a person/
object utilized and, thereby, specifies their whereabouts. Because the Google
Map Direction API shows the default route between two points, however, the
suspect may use alternative routes. Therefore, there is a need to find more than
one route between the origin and destination points and then calculate the
distance for each route. After that is developing a method that uses the photo’s
metadata (time created) to select the correct route based on the difference
between the times created of the start and end points and comparing it with the
distance for each route to find the right route. This will improve the tracking
process performance and find the requested person/object easily and precisely.

221
7.3.4 Improving Image-Matching Based on Image Content
There is a need to develop the object-matching algorithm, which operates on the
web, to find visually similar images in a way in which it can deal with different
styles of query image; input image, input painting, and input sketch. In addition,
the investigator should be provided with a bounding box to specify the region of
interest from the query then the results should be retrieved from large amounts of
images in an efficient manner along with different matching approaches (exact
matching, approximate matching, and cross-domain matching).
222
References
AccessData Group (2018) Forensic Toolkit (FTK) User Guide. Available at: https://ad-pdf.s3.amazonaws.com/ftk/7.x/FTK_UG.pdf (Accessed: 11 July 2019).
Aljarf, A. and Amin, S. (2015) ‘Filtering and Reconstruction System for Gray Forensic Images’, 9(1), pp. 20–25.
Allababidi, S. (2018) What is the problem of a CCTV camera? - Quora. Available at: https://www.quora.com/What-is-the-problem-of-a-CCTV-camera (Accessed: 26 April 2019).
Allan, M. (2019) A car is stolen every 5 minutes in the UK - here are the country’s theft hot spots | inews. Available at: https://inews.co.uk/inews-lifestyle/cars/car-stolen-every-5-minutes-uk-theft-hot-spots-500432 (Accessed: 23 November 2019).
Anthony T. S. Ho, S. L. (2015) ‘Handbook of Digital Forensics of Multimedia Data and Devices’, (january), p. 704. Available at: https://books.google.com/books?id=jXk_CgAAQBAJ&pgis=1.
B S Manjunath and W Y Ma (1996) ‘Texture features for browsing and retrieval of large image data’, 18(8), pp. 837–842.
van Baar, R. B., van Beek, H. M. A. and van Eijk, E. J. (2014) ‘Digital Forensics as a Service: A game changer’, Digital Investigation. Elsevier Ltd, 11(SUPPL. 1), pp. S54–S62. doi: 10.1016/j.diin.2014.03.007.
Bahrami, S. and Abadeh, M. S. (2014) ‘Automatic Image Annotation Using an Evolutionary Algorithm ( IAGA )’, 2014 7th International Symposium on Telecommunications (IST’2014), pp. 320–325.
Battiato, S. et al. (2012) ‘Multimedia in Forensics, Security, and Intelligence’, IEEE Multimedia, 19(1), pp. 17–19. doi: 10.1109/MMUL.2012.10.
Van Beek, H. M. A. et al. (2015) ‘Digital forensics as a service: Game on’, Digital Investigation. Elsevier Ltd, 15, pp. 20–38. doi: 10.1016/j.diin.2015.07.004.
Bhargava, A. (2014) ‘An Object Based Image Retrieval Framework Based on Automatic Image Annotation’.
Bileschi, S. M. (2006) ‘Streetscenes: towards scene understanding in still images’, p. 1. Available at: http://portal.acm.org/citation.cfm?id=1269593.
Bobriakov, I. (2018a) Comparison of Top 6 Cloud APIs for Computer Vision. Available at: https://medium.com/activewizards-machine-learning-company/comparison-of-top-6-cloud-apis-for-computer-vision-ebf2d299be73 (Accessed: 28 June 2019).
Bobriakov, I. (2018b) Comparison of Top 6 Cloud APIs for Computer Vision - ActiveWizards: machine learning company - Medium. Available at: https://medium.com/activewizards-machine-learning-company/comparison-of-top-6-cloud-apis-for-computer-vision-ebf2d299be73 (Accessed: 7 November 2019).
223
BREWIS, H. (2019) FBI hunts ‘Pink Lady Bandit’ after string of bank robberies in US | London Evening Standard. Available at: https://www.standard.co.uk/news/world/fbi-hunts-pink-lady-bandit-after-string-of-bank-robberies-in-us-a4200336.html (Accessed: 23 November 2019).
Buckland, M. and Gey, F. (1994) ‘The relationship between Recall and Precision’, Journal of the American Society for Information Science, 45(1), pp. 12–19. doi: 10.1002/(SICI)1097-4571(199401)45:1<12::AID-ASI2>3.0.CO;2-L.
Calrifai (2018) API | Clarifai. Available at: https://www.clarifai.com/api.
Castanedo, F. (2013) ‘A review of data fusion techniques.’, TheScientificWorldJournal. Hindawi, 2013, p. 704504. doi: 10.1155/2013/704504.
Castellano, K. F. (2014) ‘Data visualization’, Educational Measurement: Issues and Practice, 33(2), pp. 3–4. doi: 10.1111/emip.12034.
Cedillo-Hernandez, M. et al. (2015) ‘Mexican archaeological image retrieval based on object matching and a local descriptor’, 2015 International Conference on Computer Communication and Informatics, ICCCI 2015, pp. 8–13. doi: 10.1109/ICCCI.2015.7218071.
Chamasemani, F. F. et al. (2015) ‘Object Detection and Representation Method for Surveillance Video Indexing’, pp. 3–7.
Chathurani, N. W. U. D. et al. (2015) ‘Content-Based Image (object) Retrieval with Rotational Invariant Bag-of-Visual Words representation’, in 2015 IEEE 10th International Conference on Industrial and Information Systems (ICIIS). IEEE, pp. 152–157. doi: 10.1109/ICIINFS.2015.7399002.
Chatzichristofis, S. A. and Boutalis, Y. S. (2008) ‘CEDD: Color and Edge Directivity Descriptor: A Compact Descriptor for Image Indexing and Retrieval’, in Computer Vision Systems. Berlin, Heidelberg: Springer Berlin Heidelberg, pp. 312–322. doi: 10.1007/978-3-540-79547-6_30.
Chen, W.-B., Zhang, C. and Gao, S. (2012) ‘Segmentation Tree Based Multiple Object Image Retrieval’, in 2012 IEEE International Symposium on Multimedia. IEEE, pp. 214–221. doi: 10.1109/ISM.2012.49.
Choraś, R. S. (2013) ‘Texture Based Firearm Striations Analysis for Forensics Image Retrieval’, in Advances in Intelligent Systems and Computing, pp. 25–31. doi: 10.1007/978-3-642-32384-3_4.
CONZER SECURITY MARKETING (2018) Challenging Lighting: Video Surveillance Security Camera Image Quality | Conzer. Available at: http://www.conzer.com/challenges-lighting-video-surveillance-security-systems/ (Accessed: 26 April 2019).
DIJKSTRA, R. (2016) Investigating Potential Tax Fraud: 6 Things Government Tax Authorities Should Look for in a Digital Forensics Tool. Available at: https://accessdata.com/blog/investigating-potential-tax-fraud-6-things-government-tax-authorities-shoul (Accessed: 14 July 2019).
224
Dimitriou, M. et al. (2013) ‘Detection and classification of multiple objects using an RGB-D sensor and linear spatial pyramid matching’, Electronic Letters on Computer Vision and Image Analysis, 12(2), pp. 78–87.
Evans, M. (2018) Nine out of ten car thieves are not caught as the number of vehicles stolen increases. Available at: https://www.telegraph.co.uk/news/2018/09/06/nine-ten-car-thieves-not-caught-number-vehicles-stolen-increases/ (Accessed: 23 November 2019).
Everingham, M. et al. (2014) The Pascal Visual Object Classes Challenge-a Retrospective.
Al Fahdi, M. et al. (2016) ‘A suspect-oriented intelligent and automated computer forensic analysis’, Digital Investigation, 18, pp. 65–76. doi: 10.1016/j.diin.2016.08.001.
Faure, L. (2016) How I (sort of) got around the Google Maps API results limit - By. Available at: https://hackernoon.com/how-i-sort-of-got-around-the-google-maps-api-results-limit-1c673e66ef36 (Accessed: 19 November 2019).
Filestack (2019) Comparing Image Tagging Services: Google Vision, Microsoft Cognitive Services, Amazon Rekognition and Clarifai. Available at: https://blog.filestack.com/thoughts-and-knowledge/comparing-google-vision-microsoft-cognitive-amazon-rekognition-clarifai/ (Accessed: 28 June 2019).
Forensic Video Services (2019) Photogrammetry | FVS. Available at: http://forensicvideo.co.uk/imagery-analysis/photogrammetry/ (Accessed: 28 October 2019).
Forensicsciencesimplified.org (2016) ‘Forensic Audio and Video Analysis: How It’s Done’. Available at: http://www.forensicsciencesimplified.org/av/how.html.
Gadelmawla, E. S. (2004) ‘A vision system for surface roughness characterization using the gray level co-occurrence matrix’, NDT and E International, 37(7), pp. 577–588. doi: 10.1016/j.ndteint.2004.03.004.
Garfinkel, S. L. (2007) ‘Carving contiguous and fragmented files with fast object validation’, Digital Investigation, 4, pp. 2–12. doi: 10.1016/j.diin.2007.06.017.
Gökberk, B. and Akarun, L. (2006) Comparative Analysis of Decision-level Fusion Algorithms for 3D Face Recognition. Available at: http://citeseerx.ist.psu.edu/viewdoc/download?doi=10.1.1.64.7655&rep=rep1&type=pdf (Accessed: 10 July 2019).
Google Cloud Platform (2017) Vision API - Image Content Analysis | Google Cloud Platform. Available at: https://cloud.google.com/vision/ (Accessed: 10 April 2017).
Gu, Y. et al. (2015) ‘The Applications of Decision-Level Data Fusion Techniques in the Field of Multiuser Detection for DS-UWB Systems.’, Sensors (Basel, Switzerland). Multidisciplinary Digital Publishing Institute (MDPI), 15(10), pp. 24771–90. doi: 10.3390/s151024771.
Gubanov, Y. (2012) ‘Retrieving Digital Evidence: Methods, Techniques and Issues’, ForensicFocus.
225
Guidance software (2008) EnCASE® Forensic Features and Functionality. Available at: www.guidancesoftware.com (Accessed: 23 November 2019).
Gulhane, S. A. and Gurjar, A. A. (2015) ‘Content based Image Retrieval from Forensic Image Databases’, 5(3), pp. 66–70.
Gupta, N., Das, S. and Chakraborti, S. (2014) ‘Revealing What to Extract from Where, for Object-Centric Content Based Image Retrieval (CBIR)’, in Proceedings of the 2014 Indian Conference on Computer Vision Graphics and Image Processing - ICVGIP ’14. New York, New York, USA: ACM Press, pp. 1–8. doi: 10.1145/2683483.2683540.
Hamid Amiri, S. and Jamzad, M. (2015) ‘Automatic image annotation using semi-supervised generative modeling’, Pattern Recognition. Elsevier, 48(1), pp. 174–188. doi: 10.1016/j.patcog.2014.07.012.
Hanji, R. B. and Rajpurohit, V. (2013) ‘Forensic Image Analysis - A Frame work’, The International Journal of Forensic Computer Science, 8(1), pp. 13–19. doi: 10.5769/J201301002.
Hannan, M. A. et al. (2016) ‘Content-based image retrieval system for solid waste bin level detection and performance evaluation’, Waste Management. Elsevier Ltd, 50, pp. 10–19. doi: 10.1016/j.wasman.2016.01.046.
Hidajat, M. (2015) ‘Annotation Based Image Retrieval using GMM and Spatial Related Object Approaches’, 8(8), pp. 399–408.
Holtz, Y. (2019) Network Graph | the D3 Graph Gallery. Available at: https://www.d3-graph-gallery.com/network.html (Accessed: 19 November 2019).
Hong Hanh, P. T. and Ly Quoc Ngoc (2012) ‘Multiple objects detection on street using Hmax features and color clue’, in 2012 IEEE International Symposium on Signal Processing and Information Technology (ISSPIT). IEEE, pp. 000090–000094. doi: 10.1109/ISSPIT.2012.6621266.
Hou, A. and Wang, C. (2014) ‘Automatic Semantic Annotation for Image Retrieval Based on Multiple Kernel Learning’, (Lemcs).
HSBC Bournemouth bank robbery CCTV released - BBC News (2016). Available at: https://www.bbc.co.uk/news/uk-england-dorset-36266501?fbclid=IwAR0oFmVMTrwNXeQowktRq97N9sjYNNp-5J7loWVD5agfeLvKmHRfdpxrMME (Accessed: 22 November 2019).
Hsu, C.-Y., Kang, L.-W. and Mark Liao, H.-Y. (2013) ‘Cross-camera vehicle tracking via affine invariant object matching for video forensics applications’, in 2013 IEEE International Conference on Multimedia and Expo (ICME). IEEE, pp. 1–6. doi: 10.1109/ICME.2013.6607446.
http://www.focusmagic.com (no date) Forensics - Recovering the Most Detail from Your Image - Focus Magic. Available at: http://www.focusmagic.com/forensics-tutorial.htm (Accessed: 5 November 2019).
226
Huang, C., Han, Y. and Zhang, Y. (2012) ‘A method for object-based color image retrieval’, Proceedings - 2012 9th International Conference on Fuzzy Systems and Knowledge Discovery, FSKD 2012, (Fskd), pp. 1659–1663. doi: 10.1109/FSKD.2012.6234099.
Huang, C. and Liu, Q. (2006) ‘Color image retrieval using edge and edge-spatial features’, Chinese Optics Letters. Available at: https://www.osapublishing.org/abstract.cfm?uri=col-4-8-457 (Accessed: 18 August 2016).
Huang, Y.-F. and Lu, H.-Y. (2010) ‘Automatic Image Annotation Using Multi-object Identification’, in 2010 Fourth Pacific-Rim Symposium on Image and Video Technology. IEEE, pp. 386–392. doi: 10.1109/PSIVT.2010.71.
Imagga.com (2016) imagga - powerful image recognition APIs for automated categorization & tagging. Available at: https://imagga.com/.
Janus, D. (2016) A Comparison of Automatic Image Tagging Services and APIs. Available at: https://blog.rebased.pl/2016/10/04/computer-vision-1.html (Accessed: 28 June 2019).
Jin, C. and Jin, S.-W. (2015) ‘Automatic image annotation using feature selection based on improving quantum particle swarm optimization’, Signal Processing. Elsevier, 109, pp. 172–181. doi: 10.1016/j.sigpro.2014.10.031.
Kalayeh, M. M., Idrees, H. and Shah, M. (2014) ‘NMF-KNN: Image Annotation Using Weighted Multi-view Non-negative Matrix Factorization’, in 2014 IEEE Conference on Computer Vision and Pattern Recognition. IEEE, pp. 184–191. doi: 10.1109/CVPR.2014.31.
Kamarainen, J. K. (2012) ‘Gabor features in image analysis’, 2012 3rd International Conference on Image Processing Theory, Tools and Applications, IPTA 2012. IEEE, pp. 13–14. doi: 10.1109/IPTA.2012.6469502.
Kavitha, K. and Sudhamani, M. V. (2014) ‘Object based image retrieval from database using combined features’, Proceedings - 2014 5th International Conference on Signal and Image Processing, ICSIP 2014, pp. 161–165. doi: 10.1109/ICSIP.2014.31.
Kee, E., Johnson, M. K. and Farid, H. (2011) ‘Digital Image Authentication From JPEG Headers’, IEEE Transactions on Information Forensics and Security, 6(3), pp. 1066–1075. doi: 10.1109/TIFS.2011.2128309.
Kharkate, S. K. and Janwe, N. J. (2013) Automatic Image Annotation: A Review, The International Journal of Computer Science & Applications (TIJCSA). Available at: http://www.journalofcomputerscience.com/ (Accessed: 24 June 2019).
Kim Medaris (2008) Expert: Digital evidence just as important as DNA in solving crimes. Available at: http://www.purdue.edu/uns/x/2008a/080425T-MislanPhones.html.
Kumar, D. K., Suneera, K. and Kumar, C. (2011) ‘CONTENT BASED IMAGE RETRIEVAL- Extraction By Objects of User INTEREST’, International Journal on Computer Science and Engineering (IJCSE), 3(3), pp. 1068–1074.
227
Lee, J. et al. (2011) ‘Image Retrieval in Forensics: Application to Tattoo Image Database’, IEEE Multimedia.
Li, Zhixin et al. (2012) ‘Combining Generative/Discriminative Learning for Automatic Image Annotation and Retrieval’, International Journal of Intelligence Science, 02(03), pp. 55–62. doi: 10.4236/ijis.2012.23008.
Loughran, J. (2018) Britain’s vast network of CCTV cameras is vulnerable to hacks watchdog warns | E&T Magazine. Available at: https://eandt.theiet.org/content/articles/2018/01/britain-s-vast-network-of-cctv-cameras-is-vulnerable-to-hacks-watchdog-warns/ (Accessed: 26 April 2019).
Lunshao Chai et al. (2011) ‘Multi-feature content-based product image retrieval based on region of main object’, in 2011 8th International Conference on Information, Communications & Signal Processing. IEEE, pp. 1–5. doi: 10.1109/ICICS.2011.6174237.
Magazine, P. (2017) A Photographer’s Guide to Color Histogram - The Coffeelicious - Medium. Available at: https://medium.com/the-coffeelicious/a-photographers-guide-to-color-histogram-e31a5d92efb2 (Accessed: 2 November 2019).
Mair, F. (2015) My stolen bike is for sale on Gumtree but police say there is NOTHING they can do - Mirror Online. Available at: https://www.mirror.co.uk/news/uk-news/stolen-bike-sale-gumtree-police-5062187 (Accessed: 23 November 2019).
Majidpour, J. et al. (2015) ‘Interactive tool to improve the automatic image annotation using MPEG-7 and multi-class SVM’, in 2015 7th Conference on Information and Knowledge Technology (IKT). IEEE, pp. 1–7. doi: 10.1109/IKT.2015.7288777.
Malcom Marshall, A. (2014) A Survey on Image Retrieval Methods. Available at: http://cogprints.org/9815/1/Survey on Image Retrieval Methods.pdf (Accessed: 14 July 2019).
Microsoft Cognitive Services (2017) Microsoft Cognitive Services - Computer Vision API. Available at: https://www.microsoft.com/cognitive-services/en-us/computer-vision-api (Accessed: 10 April 2017).
Mikhail Popkov: Russian ex-cop jailed for 56 more murders - BBC News (2018). Available at: https://www.bbc.co.uk/news/world-europe-46505746 (Accessed: 23 November 2019).
Mochizuki, T. et al. (2013) ‘Visual-Based Image Retrieval by Block Reallocation Considering Object Region’, 2013 2nd IAPR Asian Conference on Pattern Recognition, pp. 371–375. doi: 10.1109/ACPR.2013.106.
Mohammadpour, M. and Mozaffari, S. (2015) ‘A method for Content-Based Image Retrieval using visual attention model’, in 2015 7th Conference on Information and Knowledge Technology (IKT). IEEE, pp. 1–5. doi: 10.1109/IKT.2015.7288764.
228
MORRIS, G. (2017) CCTV appeal: Robbers wearing Halloween masks targeted bank in Hull - Yorkshire Post. Available at: https://www.yorkshirepost.co.uk/news/crime/cctv-appeal-robbers-wearing-halloween-masks-targeted-bank-in-hull-1-8836900 (Accessed: 23 November 2019).
Muralidharan, S. et al. (2015) ‘A novel approach to the extraction of multiple salient objects in an image’, in 2015 IEEE International Conference on Signal Processing, Informatics, Communication and Energy Systems (SPICES). IEEE, pp. 1–5. doi: 10.1109/SPICES.2015.7091452.
Murthy, V. N., Can, E. F. and Manmatha, R. (2014) ‘A Hybrid Model for Automatic Image Annotation’, in Proceedings of International Conference on Multimedia Retrieval - ICMR ’14. New York, New York, USA: ACM Press, pp. 369–376. doi: 10.1145/2578726.2578774.
Murthy, V. N., Majji, S. and Manmatha, R. (2015) ‘Automatic Image Annotation Using Convex Deep Learning Models’, in Proceedings of the International Conference on Pattern Recognition Applications and Methods. SCITEPRESS - Science and and Technology Publications, pp. 92–99. doi: 10.5220/0005216700920099.
National Institute of Justice (2014) ‘Research and Development in Forensic Science for Criminal Justice Purposes’, (1121).
NFSTC (2007) ‘A Simplified Guide To Digital Evidence’. Available at: http://www.forensicsciencesimplified.org/digital/DigitalEvidence.pdf.
NIST (2018) Digital Forensics | NIST. Available at: https://www.nist.gov/programs-projects/digital-forensics (Accessed: 25 April 2019).
Office for National Statistics (UK) (2019) • UK households: ownership of mobile telephones 1996-2018 | Survey. Available at: https://www.statista.com/statistics/289167/mobile-phone-penetration-in-the-uk/ (Accessed: 25 April 2019).
Ojala, T., Pietikäinen, M. and Harwood, D. (1996) ‘A comparative study of texture measures with classification based on featured distributions’, Pattern Recognition, 29(1), pp. 51–59. doi: 10.1016/0031-3203(95)00067-4.
Ojala, T., Pietikainen, M. and Maenpaa, T. (2002) ‘Multiresolution gray-scale and rotation invariant texture classification with local binary patterns’, IEEE Transactions on Pattern Analysis and Machine Intelligence, 24(7), pp. 971–987. doi: 10.1109/TPAMI.2002.1017623.
Oujaoura, M., Minaoui, B. and Fakir, M. (2014) ‘Combined descriptors and classifiers for automatic image annotation’.
Palmer, G. (2001) ‘the first Digital Forensic Research Workshop’, the First Digital Forensic Research Workshop (DFRWS), (1), pp. 15–18. doi: 10.1111/j.1365-2656.2005.01025.x.
229
Patel, N. (2017) What are The Pros & Cons of Foundation and Bootstrap? Available at: https://webbymonks.com/blog/what-are-the-pros-cons-of-foundation-and-bootstrap/ (Accessed: 30 October 2019).
Patil, P. S. and Kapse, P. A. S. (2015) ‘Survey on Different Phases of Digital Forensics Investigation Models’, pp. 1529–1534.
Perret, E. (2017) Here’s How Many Digital Photos Will Be Taken in 2017 - True Stories. Available at: https://mylio.com/true-stories/tech-today/heres-how-many-digital-photos-will-be-taken-in-2017-repost-oct (Accessed: 25 April 2019).
Poisel, R. and Tjoa, S. (2011) ‘Forensics Investigations of Multimedia Data: A Review of the State-of-the-Art’, in 2011 Sixth International Conference on IT Security Incident Management and IT Forensics. IEEE, pp. 48–61. doi: 10.1109/IMF.2011.14.
Police issue CCTV footage of Kirkcaldy armed bank robbery - BBC News (2016). Available at: https://www.bbc.co.uk/news/uk-scotland-edinburgh-east-fife-36516989?fbclid=IwAR0k_lKdQymN7vJm0XdGLGLaJzQgYkamWdbqU1mAYY6SqXXIwryL6gGBBqw (Accessed: 22 November 2019).
Pourian, N. and Manjunath, B. S. (2015) ‘Retrieval of Images with Objects of Specific Size, Location, and Spatial Configuration’, 2015 IEEE Winter Conference on Applications of Computer Vision, pp. 960–967. doi: 10.1109/WACV.2015.133.
Qi, H. et al. (2012) ‘Object-based image retrieval with kernel on adjacency matrix and local combined features’, ACM Transactions on Multimedia Computing, Communications, and Applications, 8(4), pp. 1–18. doi: 10.1145/2379790.2379796.
Redi, J. A., Taktak, W. and Dugelay, J.-L. (2011) ‘Digital image forensics: a booklet for beginners’, Multimedia Tools and Applications, 51(1), pp. 133–162. doi: 10.1007/s11042-010-0620-1.
Richter, F. (2017) • Chart: Smartphones Cause Photography Boom | Statista. Available at: https://www.statista.com/chart/10913/number-of-photos-taken-worldwide/ (Accessed: 25 April 2019).
Rida, I. et al. (2019) ‘Forensic shoe-print identification: a brief survey’, pp. 1–7. Available at: http://arxiv.org/abs/1901.01431.
Rosebrock, A. (2014) Clever Girl: A Guide to Utilizing Color Histograms for Computer Vision and Image Search Engines - PyImageSearch. Available at: https://www.pyimagesearch.com/2014/01/22/clever-girl-a-guide-to-utilizing-color-histograms-for-computer-vision-and-image-search-engines/ (Accessed: 2 November 2019).
Sardana, N. (2017) Object Detection.
Scott Domes (2017) We compared the 3 best image analysis API’s — here’s what we learned. Available at: https://engineering.musefind.com/we-compared-the-3-best-image-analysis-apis-here-s-what-we-learned-2d54cff5ae62 (Accessed: 6 November 2018).
230
Sebastian, B., Unnikrishnan, A. and Balakrishnan, K. (2012) ‘GREY LEVEL CO-OCCURRENCE MATRICES: GENERALISATION AND SOME NEW FEATURES’, International Journal of Computer Science, Engineering and Information Technology (IJCSEIT), 2(2). doi: 10.5121/ijcseit.2012.2213.
Sephton, C. (2017) Madeleine McCann’s disappearance: A timeline | UK News | Sky News. Available at: https://news.sky.com/story/madeleine-mccanns-disappearance-a-timeline-10803372 (Accessed: 9 July 2019).
Shahbahrami, A., Borodin, D. and Juurlink, B. (2008) Comparison Between Color and Texture Features for Image Retrieval. Available at: http://citeseerx.ist.psu.edu/viewdoc/download;jsessionid=A38430FD8C92D41EB062213D1205CE86?doi=10.1.1.158.4642&rep=rep1&type=pdf (Accessed: 26 June 2019).
Shamsujjoha, M. et al. (2014) ‘Semantic modelling of unshaped object: An efficient approach in content based image retrieval’, in 2014 17th International Conference on Computer and Information Technology (ICCIT). IEEE, pp. 30–34. doi: 10.1109/ICCITechn.2014.7073070.
Shinde, S. et al. (2014) ‘Content and Tag Based Image Retrieval System using Automatic Image Annotation’, International Journal of Computer Science Trends and Technology, 2. Available at: www.ijcstjournal.org (Accessed: 11 July 2019).
Shivakumar, S. et al. (2013) ‘Semantic image retrieval system based on object relationships’, in 2013 IEEE Second International Conference on Image Information Processing (ICIIP-2013). IEEE, pp. 276–281. doi: 10.1109/ICIIP.2013.6707598.
Shriram, K. V, Priyadarsini, P. L. K. and Baskar, A. (2015) ‘An intelligent system of content-based image retrieval for crime investigation’, International Journal of Advanced Intelligence Paradigms, 7, pp. 264–279.
Singh, A. (2015) ‘Exploring Forensic Video And Image Analysis’. Available at: https://www.linkedin.com/pulse/exploring-forensic-video-image-analysis-ashish-singh.
Singh, N., Singh, K. and Sinha, A. K. (2012) ‘A Novel Approach for Content Based Image Retrieval’, Procedia Technology, 4, pp. 245–250. doi: 10.1016/j.protcy.2012.05.037.
Slama, C. C., Theurer, C. and Henriksen, S. W. (1980) Manual of photogrammetry. 4th ed. Falls Church, Va: American Society of Photogrammetry.
Sobhani, F. and Straccia, U. (2019) Towards a Forensic Event Ontology to Assist Video Surveillance-based Vandalism Detection. Available at: https://arxiv.org/pdf/1903.09012.pdf (Accessed: 10 May 2019).
SREEDHANYA, S. and CHHAYA, S. P. (2017) ‘Automatic Image Annotation Using Modified Multi-label Dictionary Learning’, International Journal of Engineering and Techniques, 3(5). Available at: http://www.ijetjournal.org (Accessed: 9 March 2018).
231
Sumathi, T. and Hemalatha, M. (2011) ‘A combined hierarchical model for automatic image annotation and retrieval’, in 2011 Third International Conference on Advanced Computing. IEEE, pp. 135–139. doi: 10.1109/ICoAC.2011.6165162.
SWGIT, S. W. G. on I. T. (2007) ‘Best Practices for Forensic Image Analysis’, United States of America and Journal, 2(January), pp. 1–12.
Tariq, A. and Foroosh, H. (2014) ‘SCENE-BASED AUTOMATIC IMAGE ANNOTATION’, pp. 3047–3051.
Tian, D. (2014) ‘Semi-supervised Learning for Automatic Image Annotation Based on Bayesian Framework’, 7(6), pp. 213–222.
Tian, D. (2015) ‘Support Vector Machine for Automatic Image Annotation’, 8(11), pp. 435–446.
Tipa, M. (2018) Forensic Toolkit (FTK) User Guide. Available at: https://ad-pdf.s3.amazonaws.com/ftk/6.4.x/FTK_UG.pdf (Accessed: 2 July 2019).
Uricchio, T. et al. (2017) Automatic Image Annotation via Label Transfer in the Semantic Space. Available at: https://arxiv.org/pdf/1605.04770.pdf (Accessed: 10 May 2019).
Wang, H. et al. (2011) ‘An image retrieval method based on texture features of object region’, Proceedings of 2011 International Conference on Electronics and Optoelectronics, 4(Iceoe), pp. V4-83-V4-86. doi: 10.1109/ICEOE.2011.6013431.
Wang, H., Mohamad, D. and Ismail, N. (2014) ‘An Efficient Parameters Selection for Object Recognition Based Colour Features in Traffic Image Retrieval’, 11(3), pp. 308–314.
Wen, C., Geng, G. and Zhu, X. (2011) ‘An algorithm of object-based image retrieval using multiple instance learning’, The Fourth International Workshop on Advanced Computational Intelligence, pp. 399–402. doi: 10.1109/IWACI.2011.6160040.
Wen, C., Ph, D. and Yu, C. (2005) ‘Image Retrieval of Digital Crime Scene Images’, pp. 37–45.
Wu, J., Wang, X. and Xing, H. (2011) ‘Regional objects based image retrieval’, in 2011 Chinese Control and Decision Conference (CCDC). IEEE, pp. 1273–1277. doi: 10.1109/CCDC.2011.5968385.
Xia, Y., Wu, Y. and Feng, J. (2015) ‘Cross-Media Retrieval using Probabilistic Model of Automatic Image Annotation’, 8(4), pp. 145–154.
Xiao, J., Li, S. and Xu, Q. (2019) ‘Video-based Evidence Analysis and Extraction in Digital Forensic Investigation’, IEEE Access. IEEE, 7, pp. 1–1. doi: 10.1109/ACCESS.2019.2913648.
Xie, L. et al. (2013) ‘A Two-Phase Generation Model for Automatic Image Annotation’, in 2013 IEEE International Symposium on Multimedia. IEEE, pp. 155–162. doi: 10.1109/ISM.2013.33.
Yao, M. (2017) Chihuahua OR Muffin? Searching For The Best Computer Vision API. Available at: https://www.topbots.com/chihuahua-muffin-searching-best-
232
computer-vision-api/ (Accessed: 27 June 2019).
Yuan-Yuan, C. et al. (2014) ‘A hybrid hierarchical framework for automatic image annotation’, in 2014 International Conference on Machine Learning and Cybernetics. IEEE, pp. 30–36. doi: 10.1109/ICMLC.2014.7009087.
Yuan, H. and Ying, L. (2014) ‘Study on forensic image retrieval’, in 2014 9th IEEE Conference on Industrial Electronics and Applications. IEEE, pp. 89–94. doi: 10.1109/ICIEA.2014.6931137.
Zhang, D., Monirul Islam, M. and Lu, G. (2013) ‘Structural image retrieval using automatic image annotation and region based inverted file’, Journal of Visual Communication and Image Representation. Elsevier Inc., 24(7), pp. 1087–1098. doi: 10.1016/j.jvcir.2013.07.004.
Zhang, N. (2014a) ‘A Novel Method of Automatic Image Annotation’, Computer Science & Education (ICCSE), 2014 9th …, (Iccse), pp. 1089–1093. Available at: http://ieeexplore.ieee.org/xpls/abs_all.jsp?arnumber=6926631.
Zhang, N. (2014b) ‘Linear regression for Automatic Image Annotation’, Computer Science & Education (ICCSE), 2014 9th …, (Iccse), pp. 682–686. Available at: http://ieeexplore.ieee.org/xpls/abs_all.jsp?arnumber=6926548.

233
Appendices
Appendix A: Centric and Non-Centric Single Object-Based Image
Retrieval
Appendix B: Multiple Objects-Based Image Retrieval
Appendix C: Approval Forms and Ethical Approval Notifications
Appendix D: Publications
234
Appendix A: Centric and Non-Centric Single Object-Based
Image Retrieval
Wang et al. (2011) presented an image retrieval method based on texture
features of the object region. The system started by converting a colour image
from RGB colour to grey space. Thereafter, the Otsu algorithm, which is one of
the most common methods of automatic threshold selection, was used to
segment the grey image into the object region and the background region.
Afterwards, texture features of the object region were extracted by using a Local
Binary Pattern (LBP) algorithm. Finally, the Euclidean distance was calculated to
find the similarity between extracted texture features for a query image and
images from an image database. In order to verify the proposed method, the
precision and recall were used to validate the retrieval performance of the
proposed system. The proposed method was tested on the SIMPLIcity dataset,
which consists of 1,000 images selected from the Corel image database in ten
categories, with each category containing 100 images. Five images per category
were randomly chosen from four categories (buildings, buses, flowers, and
dragons) to use as query images. The experimental results showed that the
proposed method achieved an average precision and average recall of 84.0%
and 16.8%, respectively. The recall was very low because the images contained
only one central object and the method succeeded to retrieve the images that
contain the query object. The proposed system achieved good performance
because it removed the image background, which in turn improved the retrieval
accuracy.
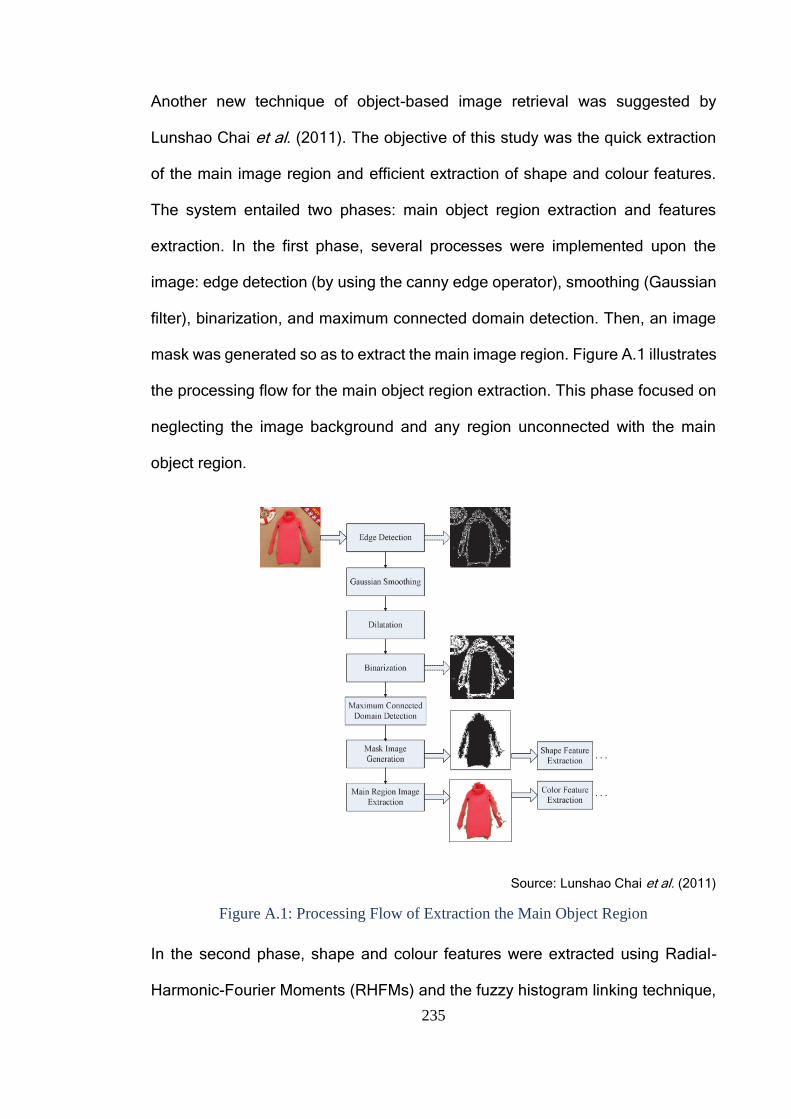
235
Another new technique of object-based image retrieval was suggested by
Lunshao Chai et al. (2011). The objective of this study was the quick extraction
of the main image region and efficient extraction of shape and colour features.
The system entailed two phases: main object region extraction and features
extraction. In the first phase, several processes were implemented upon the
image: edge detection (by using the canny edge operator), smoothing (Gaussian
filter), binarization, and maximum connected domain detection. Then, an image
mask was generated so as to extract the main image region. Figure A.1 illustrates
the processing flow for the main object region extraction. This phase focused on
neglecting the image background and any region unconnected with the main
object region.
Source: Lunshao Chai et al. (2011)
Figure A.1: Processing Flow of Extraction the Main Object Region
In the second phase, shape and colour features were extracted using Radial-
Harmonic-Fourier Moments (RHFMs) and the fuzzy histogram linking technique,
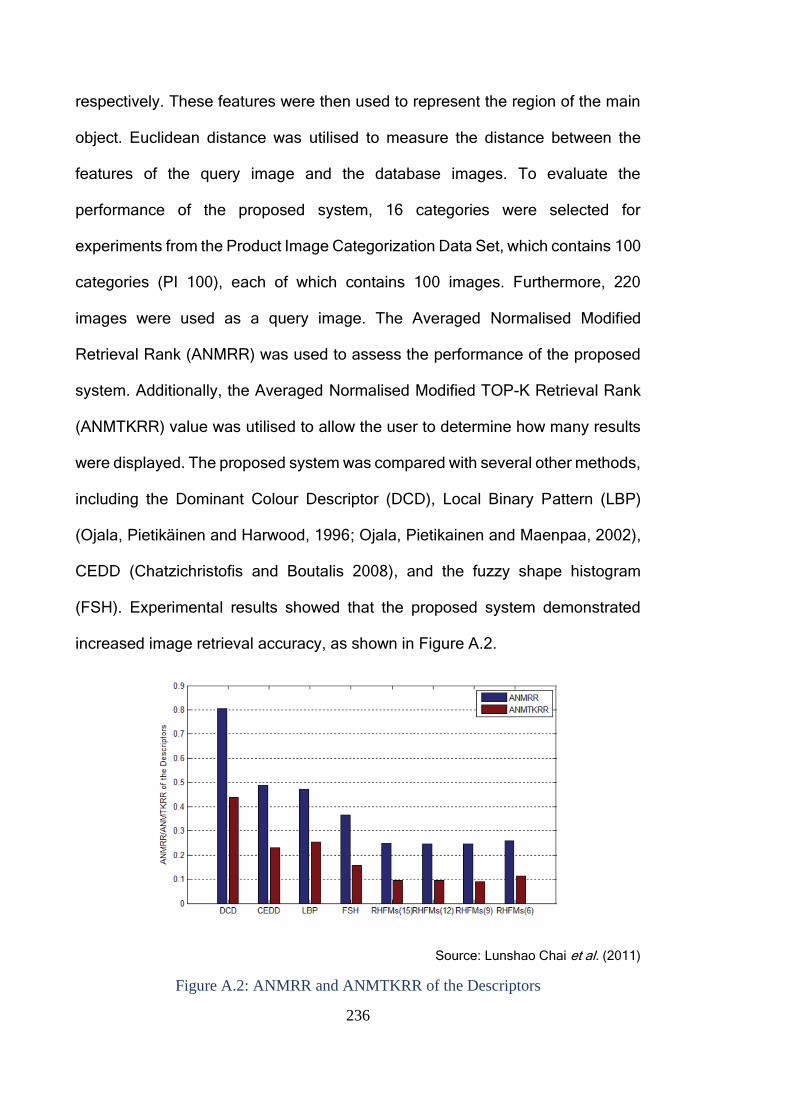
236
respectively. These features were then used to represent the region of the main
object. Euclidean distance was utilised to measure the distance between the
features of the query image and the database images. To evaluate the
performance of the proposed system, 16 categories were selected for
experiments from the Product Image Categorization Data Set, which contains 100
categories (PI 100), each of which contains 100 images. Furthermore, 220
images were used as a query image. The Averaged Normalised Modified
Retrieval Rank (ANMRR) was used to assess the performance of the proposed
system. Additionally, the Averaged Normalised Modified TOP-K Retrieval Rank
(ANMTKRR) value was utilised to allow the user to determine how many results
were displayed. The proposed system was compared with several other methods,
including the Dominant Colour Descriptor (DCD), Local Binary Pattern (LBP)
(Ojala, Pietikäinen and Harwood, 1996; Ojala, Pietikainen and Maenpaa, 2002),
CEDD (Chatzichristofis and Boutalis 2008), and the fuzzy shape histogram
(FSH). Experimental results showed that the proposed system demonstrated
increased image retrieval accuracy, as shown in Figure A.2.
Source: Lunshao Chai et al. (2011)
Figure A.2: ANMRR and ANMTKRR of the Descriptors
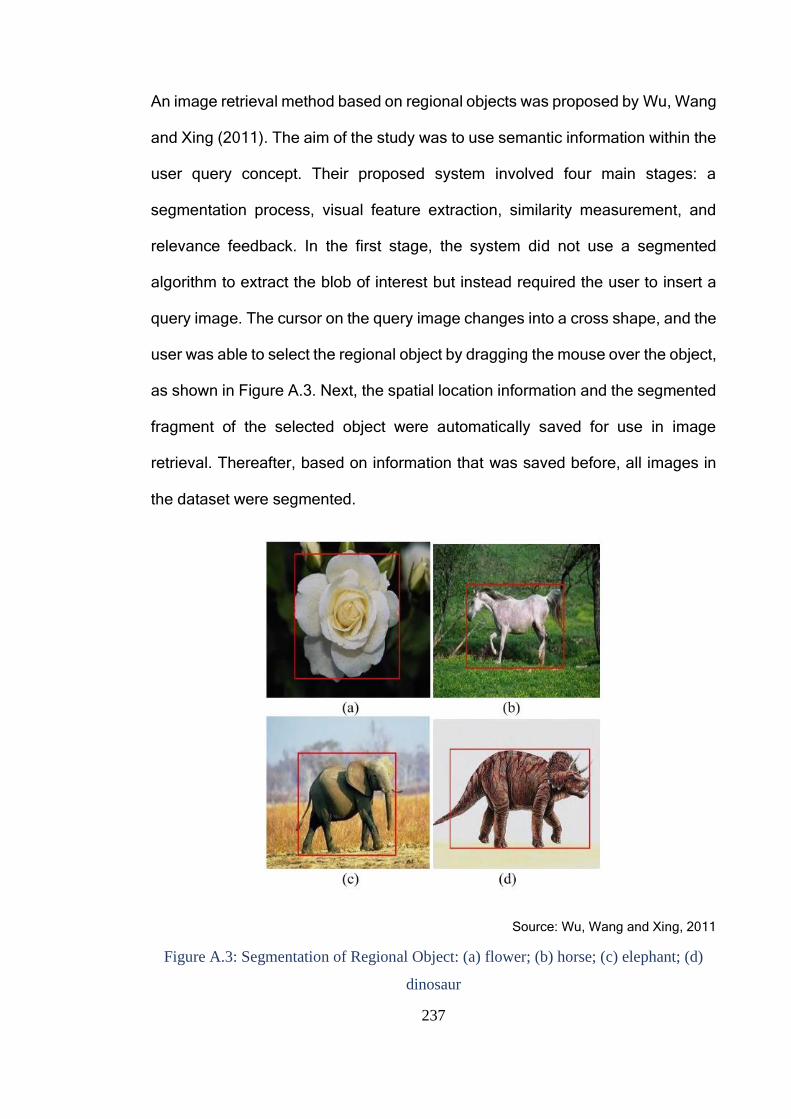
237
An image retrieval method based on regional objects was proposed by Wu, Wang
and Xing (2011). The aim of the study was to use semantic information within the
user query concept. Their proposed system involved four main stages: a
segmentation process, visual feature extraction, similarity measurement, and
relevance feedback. In the first stage, the system did not use a segmented
algorithm to extract the blob of interest but instead required the user to insert a
query image. The cursor on the query image changes into a cross shape, and the
user was able to select the regional object by dragging the mouse over the object,
as shown in Figure A.3. Next, the spatial location information and the segmented
fragment of the selected object were automatically saved for use in image
retrieval. Thereafter, based on information that was saved before, all images in
the dataset were segmented.
Source: Wu, Wang and Xing, 2011
Figure A.3: Segmentation of Regional Object: (a) flower; (b) horse; (c) elephant; (d)
dinosaur
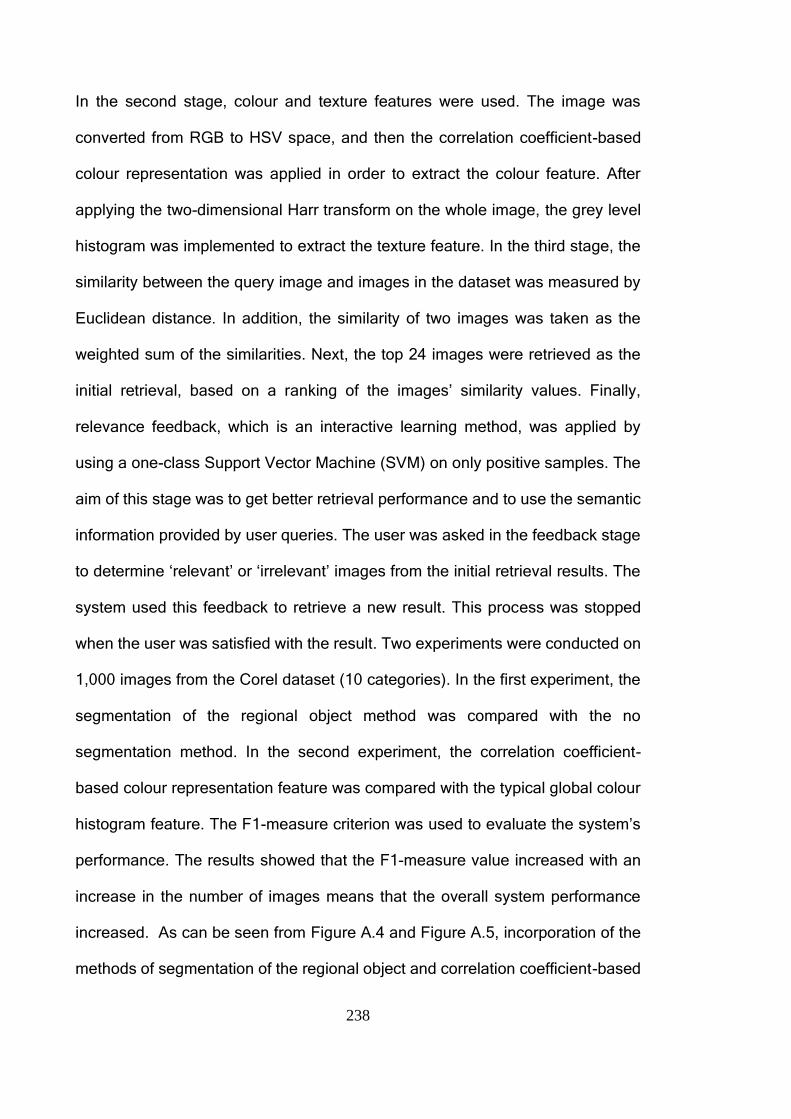
238
In the second stage, colour and texture features were used. The image was
converted from RGB to HSV space, and then the correlation coefficient-based
colour representation was applied in order to extract the colour feature. After
applying the two-dimensional Harr transform on the whole image, the grey level
histogram was implemented to extract the texture feature. In the third stage, the
similarity between the query image and images in the dataset was measured by
Euclidean distance. In addition, the similarity of two images was taken as the
weighted sum of the similarities. Next, the top 24 images were retrieved as the
initial retrieval, based on a ranking of the images’ similarity values. Finally,
relevance feedback, which is an interactive learning method, was applied by
using a one-class Support Vector Machine (SVM) on only positive samples. The
aim of this stage was to get better retrieval performance and to use the semantic
information provided by user queries. The user was asked in the feedback stage
to determine ‘relevant’ or ‘irrelevant’ images from the initial retrieval results. The
system used this feedback to retrieve a new result. This process was stopped
when the user was satisfied with the result. Two experiments were conducted on
1,000 images from the Corel dataset (10 categories). In the first experiment, the
segmentation of the regional object method was compared with the no
segmentation method. In the second experiment, the correlation coefficient-
based colour representation feature was compared with the typical global colour
histogram feature. The F1-measure criterion was used to evaluate the system’s
performance. The results showed that the F1-measure value increased with an
increase in the number of images means that the overall system performance
increased. As can be seen from Figure A.4 and Figure A.5, incorporation of the
methods of segmentation of the regional object and correlation coefficient-based
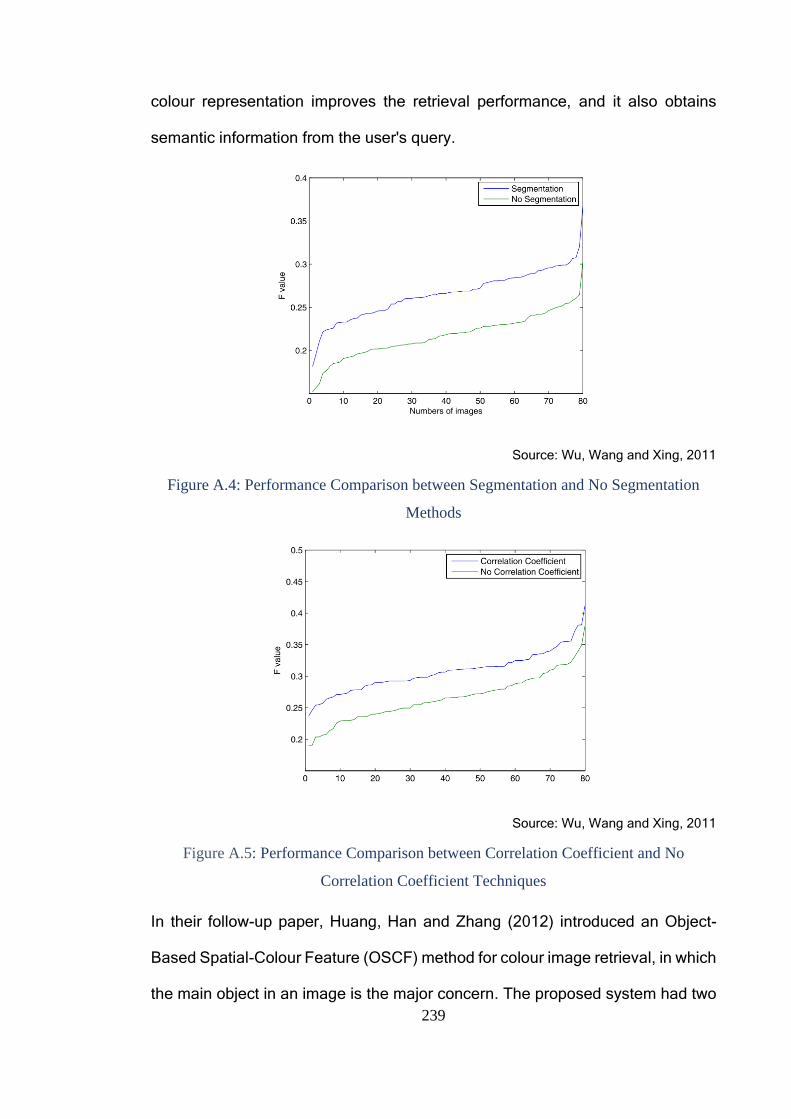
239
colour representation improves the retrieval performance, and it also obtains
semantic information from the user's query.
Source: Wu, Wang and Xing, 2011
Figure A.4: Performance Comparison between Segmentation and No Segmentation
Methods
Source: Wu, Wang and Xing, 2011
Figure A.5: Performance Comparison between Correlation Coefficient and No
Correlation Coefficient Techniques
In their follow-up paper, Huang, Han and Zhang (2012) introduced an Object-
Based Spatial-Colour Feature (OSCF) method for colour image retrieval, in which
the main object in an image is the major concern. The proposed system had two
240
phases: object extraction and feature extraction. In the first phase, an RGB colour
image was converted to HSV colour space. Then, an E-image, which is a
greyscale image, was extracted from the HSV colour image using a criterion of
homogeneity based on both the global and the local information for the HSV
colour image. A threshold value was determined using both the global and local
information, and all pixels in the E-image that were less than the threshold value
were considered as a candidate seeded point (CSP). In so doing, a candidate
object seed points set was achieved. In the second phase, the normalised
quantized colour histogram and spatial-colour features were extracted from the
objects region in order to represent objects. A distance metric was used to find
the similarity between a query image and images in a dataset. In order to evaluate
the system, 800 images (10 categories, each category contained 80 images)
were selected from general-purpose image database including about 200,000
images that include scenes (flowers, horses, fungi, elephants, etc.). Only five
categories were used in the experiments. The accuracy of the retrieval results
was measured by both precision and recall. The performance of the proposed
system was then compared with the Colour histogram method combined with the
Gabor wavelet texture descriptor (CGabor) (Manjunath and Ma 1996) and the
integrating Edge and Edge-Spatial Feature of the image (EESF) technique
(Huang and Liu 2006). The results showed that the proposed method achieved
better retrieval results when used on an image with one central object. The best
reported results using the average precision-recall for OSCF, CGabor, and EESF
were 70%, 62%, and 60% when using image category “flower”, respectively. This
approach fails, however, if implemented on complicated images in which the
241
objects are non-central or if there is more than one central object. Furthermore, it
regards all central objects as one object.
Another contribution to the study of centric object-based retrieval was published
by Kavitha and Sudhamani (2014). The objective of this research was to suggest
a CBIR system based on the combination of local and global features. The system
included two phases: an offline phase and a real-time phase. The features were
extracted by using the Bidirectional Empirical Mode Decomposition (BEMD)
technique and the Harris Corner detector, which were considered as local
features, while the HSV colour histogram feature was used as the global feature
for all images in the database (offline phase). Query image processing served as
the real-time phase. To retrieve relevant images, the three individual features of
the query image were compared with the corresponding features of the database
images. For experimental purposes, the Columbia Object Image Library (COIL-
100) dataset, which includes 7,200 colour images of 100 objects, was used.
Figure A.6 shows ten samples of the COIL-100 dataset that were used in the
experiments. The study showed that the combination of the HC, HSV colour
histogram, and BEMD techniques resulted in substantially improved retrieval
results of 83.23% and 69.36% for average precision and average recall,
respectively.
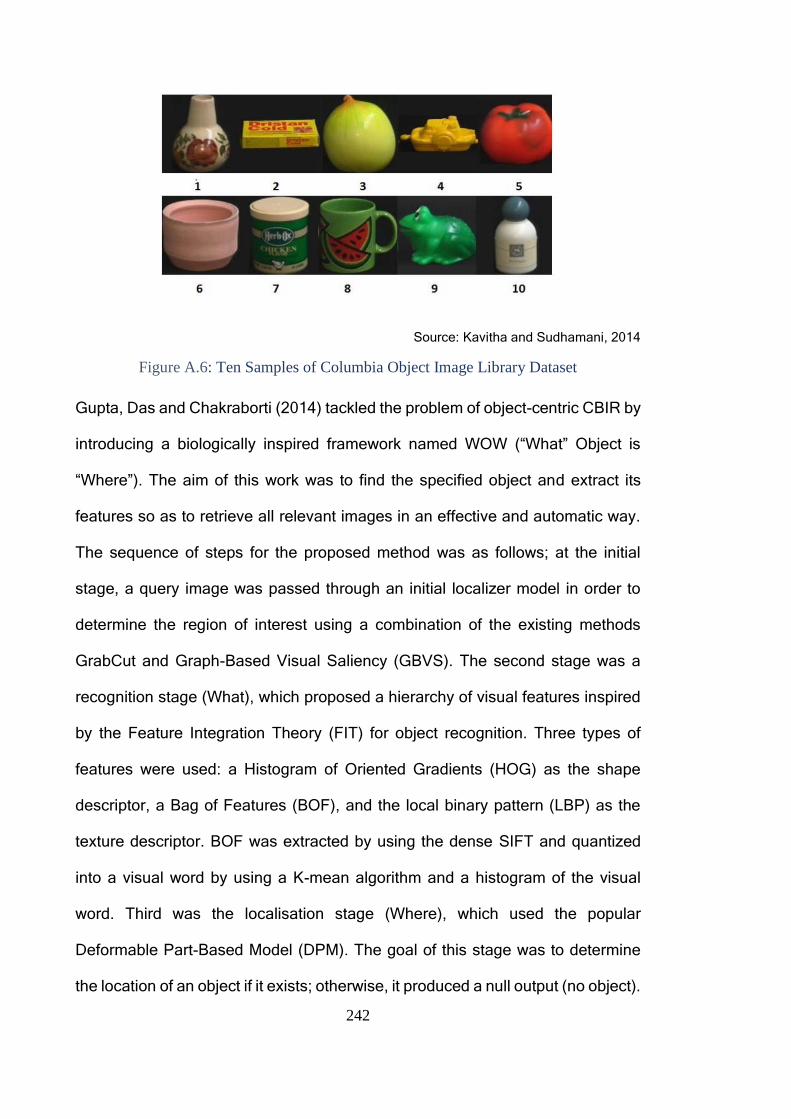
242
Source: Kavitha and Sudhamani, 2014
Figure A.6: Ten Samples of Columbia Object Image Library Dataset
Gupta, Das and Chakraborti (2014) tackled the problem of object-centric CBIR by
introducing a biologically inspired framework named WOW (“What” Object is
“Where”). The aim of this work was to find the specified object and extract its
features so as to retrieve all relevant images in an effective and automatic way.
The sequence of steps for the proposed method was as follows; at the initial
stage, a query image was passed through an initial localizer model in order to
determine the region of interest using a combination of the existing methods
GrabCut and Graph-Based Visual Saliency (GBVS). The second stage was a
recognition stage (What), which proposed a hierarchy of visual features inspired
by the Feature Integration Theory (FIT) for object recognition. Three types of
features were used: a Histogram of Oriented Gradients (HOG) as the shape
descriptor, a Bag of Features (BOF), and the local binary pattern (LBP) as the
texture descriptor. BOF was extracted by using the dense SIFT and quantized
into a visual word by using a K-mean algorithm and a histogram of the visual
word. Third was the localisation stage (Where), which used the popular
Deformable Part-Based Model (DPM). The goal of this stage was to determine
the location of an object if it exists; otherwise, it produced a null output (no object).
243
Fourth was the iterative feedback stage, which helped in exchange of mutual
information (iteratively) between the ‘What’ and ‘Where’ modules. In addition, this
stage introduced termination criteria for the exchange of mutual information,
which means that the iterative feedback mechanism stopped when the output of
the identification stage was the same as that of the previous step. The final stage,
the similarity stage, computed similarity based on the HOG features and rank-
ordered the images retrieved from a database. The performance of the proposed
method was analysed by using a combination of three different datasets: the
PASCAL dataset (9,963 images differing in pose, scale, and occlusion), the
MSRC-v1 dataset (240 images), and a SLAR CBIR dataset containing six
classes. The experimental results demonstrated that WOW improved results by
filtering erroneous contents from the outputs of individual modules and showed
superior performance when implemented on a complex database. The precision-
recall metric value of the proposed method for the PASCAL and MSRC-v1 and
SLAR CBIR datasets were 34% and 46%, respectively. And also, the precision-
recall curve was above the other curves that refer to better performance level.
The research study reported in Mohammadpour and Mozaffari (2015) was also
concerned with the centric object. The authors introduced a method that
determined the Region Of Interest (ROI) and extracted features from those
regions for the retrieval process. The proposed system started with a detection
saliency map from an image using methods from visual attention models such as
the Itti-Koch model and Graph-Based Visual Saliency (GBVS). In some cases,
two images may have the same saliency map, though the images are different;
therefore, it is difficult to discriminate between them. To overcome this problem,
a Histogram of Orientation Gradient (HOG), a texture histogram (Gabor filter),
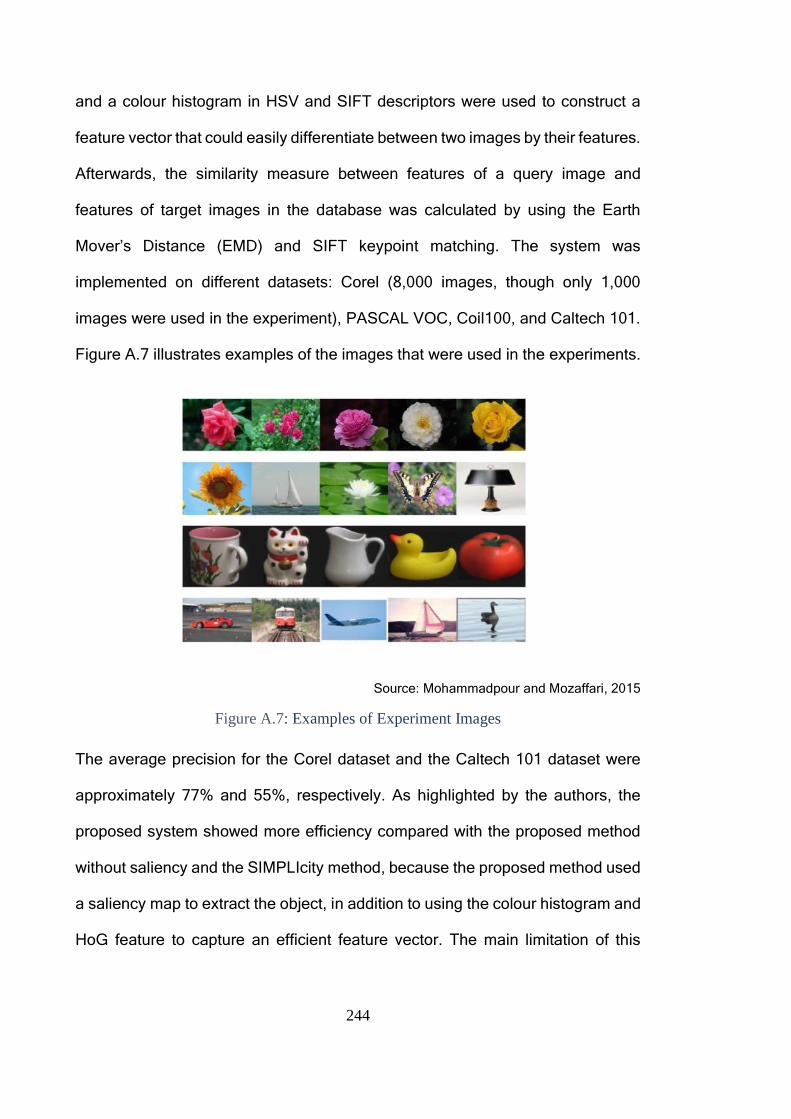
244
and a colour histogram in HSV and SIFT descriptors were used to construct a
feature vector that could easily differentiate between two images by their features.
Afterwards, the similarity measure between features of a query image and
features of target images in the database was calculated by using the Earth
Mover’s Distance (EMD) and SIFT keypoint matching. The system was
implemented on different datasets: Corel (8,000 images, though only 1,000
images were used in the experiment), PASCAL VOC, Coil100, and Caltech 101.
Figure A.7 illustrates examples of the images that were used in the experiments.
Source: Mohammadpour and Mozaffari, 2015
Figure A.7: Examples of Experiment Images
The average precision for the Corel dataset and the Caltech 101 dataset were
approximately 77% and 55%, respectively. As highlighted by the authors, the
proposed system showed more efficiency compared with the proposed method
without saliency and the SIMPLIcity method, because the proposed method used
a saliency map to extract the object, in addition to using the colour histogram and
HoG feature to capture an efficient feature vector. The main limitation of this
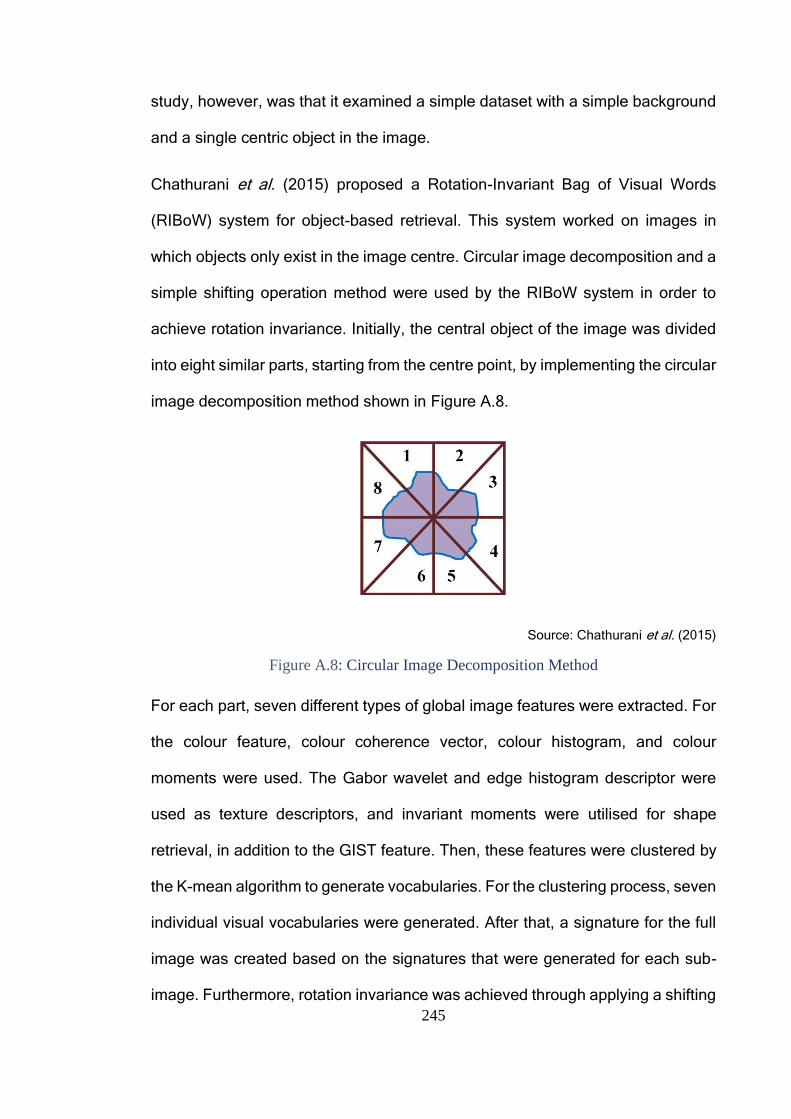
245
study, however, was that it examined a simple dataset with a simple background
and a single centric object in the image.
Chathurani et al. (2015) proposed a Rotation-Invariant Bag of Visual Words
(RIBoW) system for object-based retrieval. This system worked on images in
which objects only exist in the image centre. Circular image decomposition and a
simple shifting operation method were used by the RIBoW system in order to
achieve rotation invariance. Initially, the central object of the image was divided
into eight similar parts, starting from the centre point, by implementing the circular
image decomposition method shown in Figure A.8.
Source: Chathurani et al. (2015)
Figure A.8: Circular Image Decomposition Method
For each part, seven different types of global image features were extracted. For
the colour feature, colour coherence vector, colour histogram, and colour
moments were used. The Gabor wavelet and edge histogram descriptor were
used as texture descriptors, and invariant moments were utilised for shape
retrieval, in addition to the GIST feature. Then, these features were clustered by
the K-mean algorithm to generate vocabularies. For the clustering process, seven
individual visual vocabularies were generated. After that, a signature for the full
image was created based on the signatures that were generated for each sub-
image. Furthermore, rotation invariance was achieved through applying a shifting
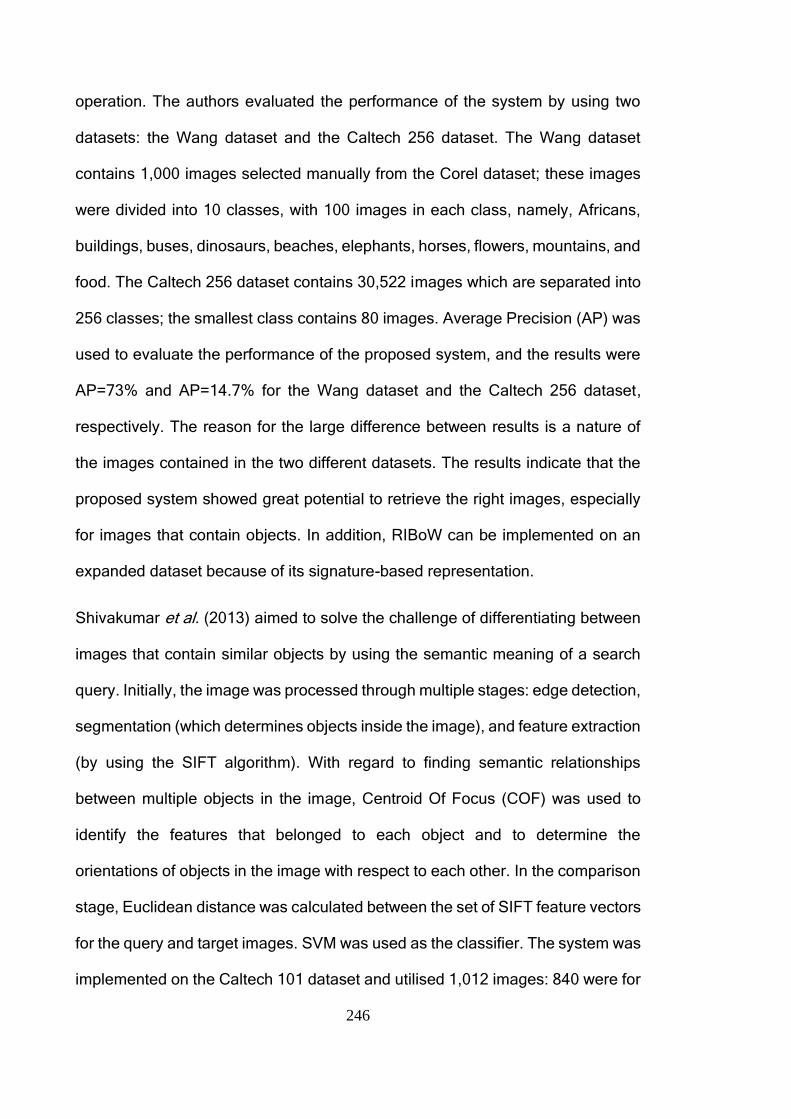
246
operation. The authors evaluated the performance of the system by using two
datasets: the Wang dataset and the Caltech 256 dataset. The Wang dataset
contains 1,000 images selected manually from the Corel dataset; these images
were divided into 10 classes, with 100 images in each class, namely, Africans,
buildings, buses, dinosaurs, beaches, elephants, horses, flowers, mountains, and
food. The Caltech 256 dataset contains 30,522 images which are separated into
256 classes; the smallest class contains 80 images. Average Precision (AP) was
used to evaluate the performance of the proposed system, and the results were
AP=73% and AP=14.7% for the Wang dataset and the Caltech 256 dataset,
respectively. The reason for the large difference between results is a nature of
the images contained in the two different datasets. The results indicate that the
proposed system showed great potential to retrieve the right images, especially
for images that contain objects. In addition, RIBoW can be implemented on an
expanded dataset because of its signature-based representation.
Shivakumar et al. (2013) aimed to solve the challenge of differentiating between
images that contain similar objects by using the semantic meaning of a search
query. Initially, the image was processed through multiple stages: edge detection,
segmentation (which determines objects inside the image), and feature extraction
(by using the SIFT algorithm). With regard to finding semantic relationships
between multiple objects in the image, Centroid Of Focus (COF) was used to
identify the features that belonged to each object and to determine the
orientations of objects in the image with respect to each other. In the comparison
stage, Euclidean distance was calculated between the set of SIFT feature vectors
for the query and target images. SVM was used as the classifier. The system was
implemented on the Caltech 101 dataset and utilised 1,012 images: 840 were for
247
training and 172 were for testing. Images with person/car, person/motorcycle, and
person/bicycle were used as tested samples. The results showed that the
average precision and recall values for the proposed system were 83% and 75%,
respectively. In addition, a comparison between the proposed semantic retrieval
system and low-level retrieval (comparison of purely SIFT features without
considering object positions), as shown in Figure A.9, revealed that the semantic
system outperformed the other method, because the proposed method extracted
features for each object in the image, while low-level retrieval (SIFT features)
extracted features from the whole image.
Source: Shivakumar et al., 2013
Figure A.9: Accuracy Comparison of Retrieval Methods
Mochizuki et al. (2013) suggested a new ‘visual-based and object-conscious’
technique. Their method was divided into two phases: calculating of image
features and the retrieval process. The first phase determined the object region
in the input image by dividing the input image into 4x4 blocks, which were split
into the object region (OB-blocks) and the background region (BG-blocks), as
shown in Figure A.10. OB-blocks were defined as blocks that were completely
included in the ‘centre region’. The rest of the blocks were BG-blocs. Then, a
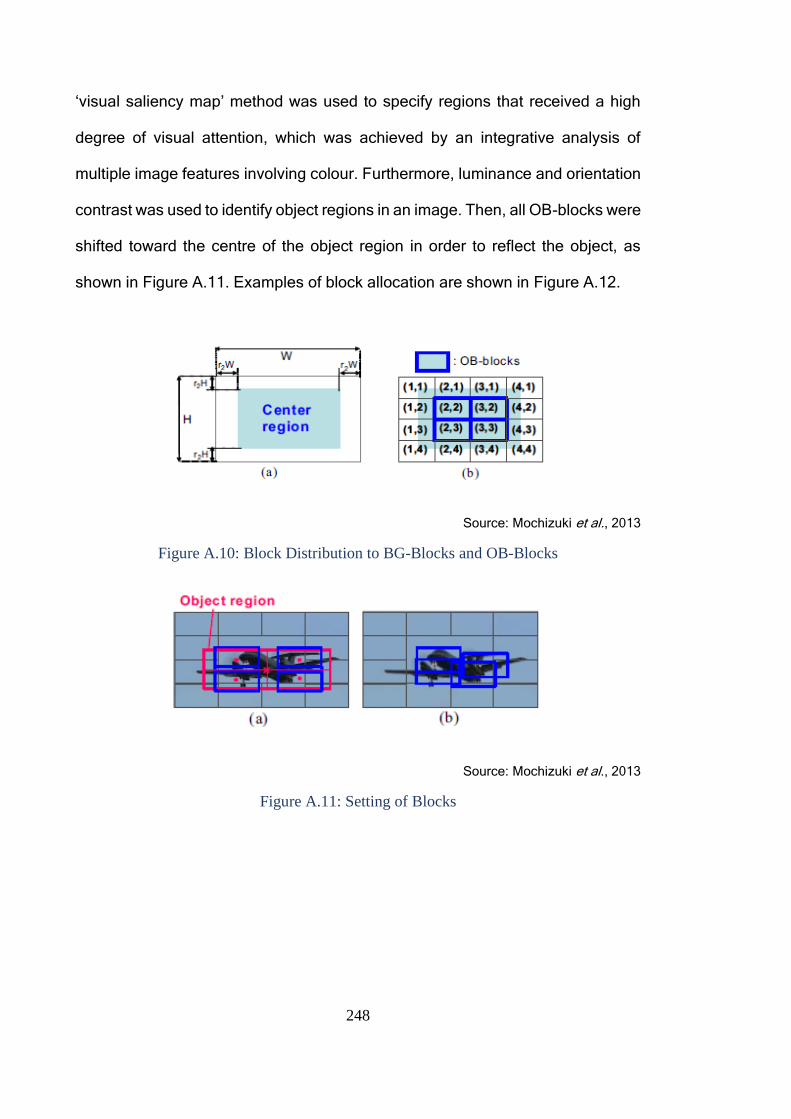
248
‘visual saliency map’ method was used to specify regions that received a high
degree of visual attention, which was achieved by an integrative analysis of
multiple image features involving colour. Furthermore, luminance and orientation
contrast was used to identify object regions in an image. Then, all OB-blocks were
shifted toward the centre of the object region in order to reflect the object, as
shown in Figure A.11. Examples of block allocation are shown in Figure A.12.
Source: Mochizuki et al., 2013
Figure A.10: Block Distribution to BG-Blocks and OB-Blocks
Source: Mochizuki et al., 2013
Figure A.11: Setting of Blocks
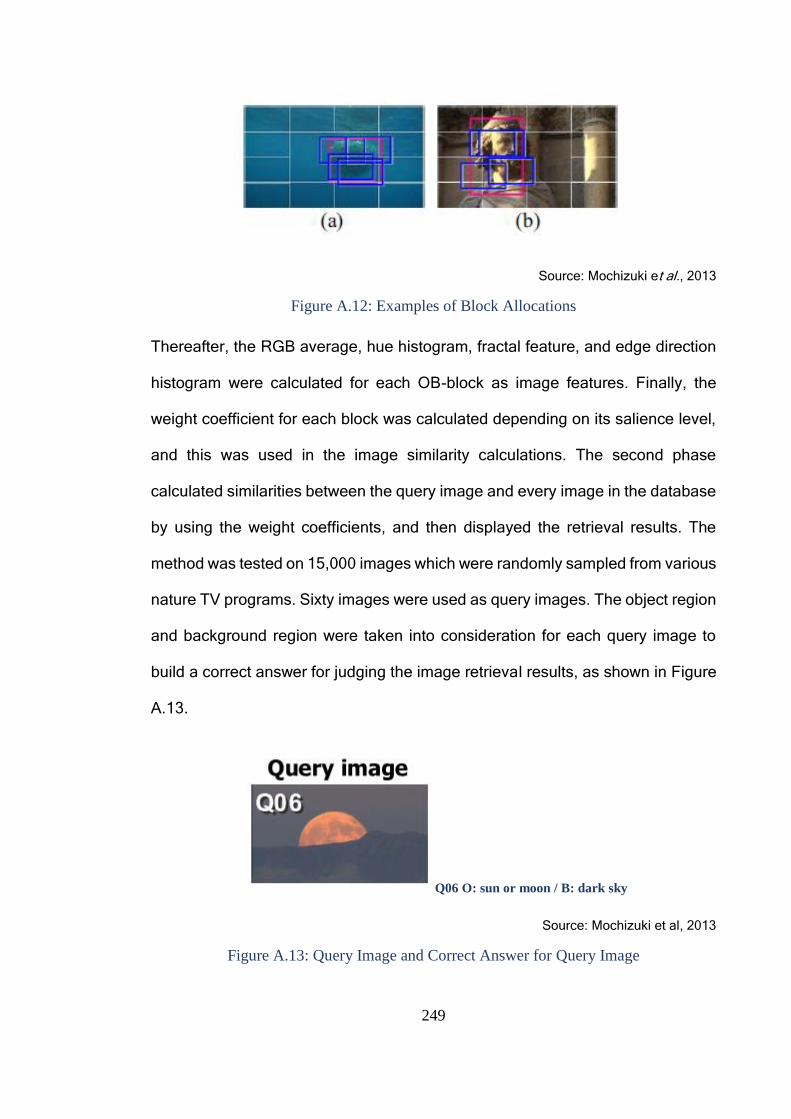
249
Source: Mochizuki et al., 2013
Figure A.12: Examples of Block Allocations
Thereafter, the RGB average, hue histogram, fractal feature, and edge direction
histogram were calculated for each OB-block as image features. Finally, the
weight coefficient for each block was calculated depending on its salience level,
and this was used in the image similarity calculations. The second phase
calculated similarities between the query image and every image in the database
by using the weight coefficients, and then displayed the retrieval results. The
method was tested on 15,000 images which were randomly sampled from various
nature TV programs. Sixty images were used as query images. The object region
and background region were taken into consideration for each query image to
build a correct answer for judging the image retrieval results, as shown in Figure
A.13.
Q06 O: sun or moon / B: dark sky
Source: Mochizuki et al, 2013
Figure A.13: Query Image and Correct Answer for Query Image
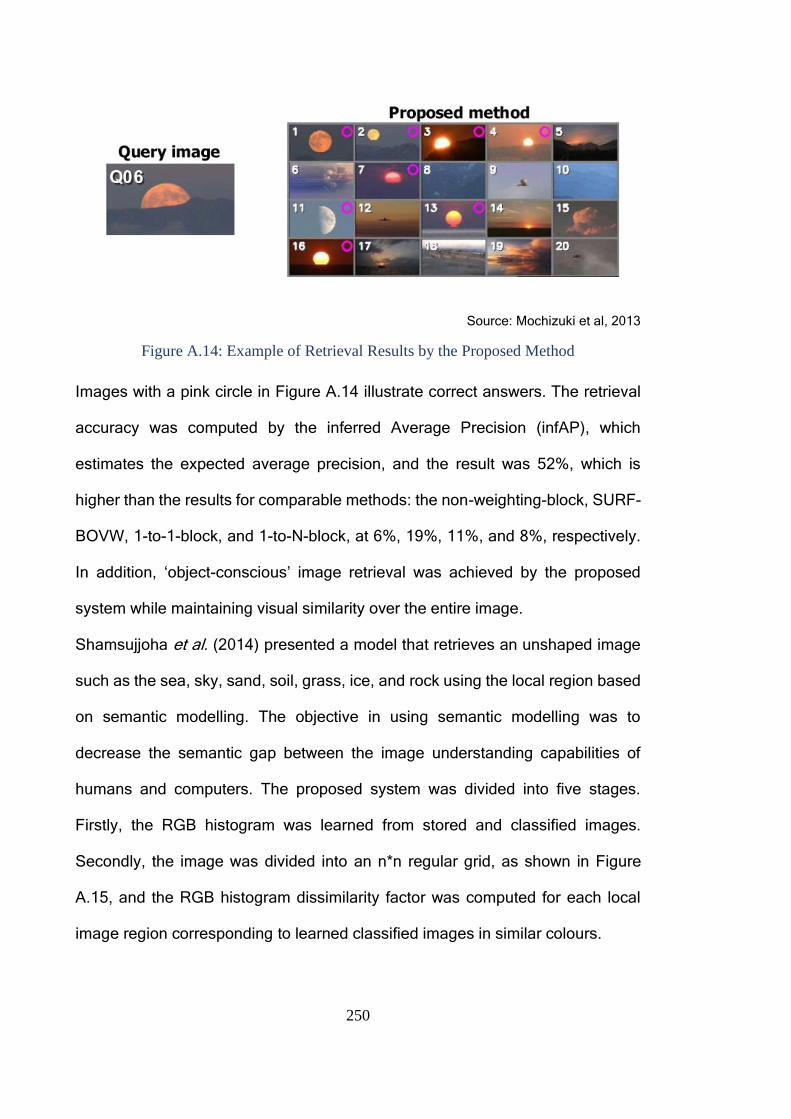
250
Source: Mochizuki et al, 2013
Figure A.14: Example of Retrieval Results by the Proposed Method
Images with a pink circle in Figure A.14 illustrate correct answers. The retrieval
accuracy was computed by the inferred Average Precision (infAP), which
estimates the expected average precision, and the result was 52%, which is
higher than the results for comparable methods: the non-weighting-block, SURF-
BOVW, 1-to-1-block, and 1-to-N-block, at 6%, 19%, 11%, and 8%, respectively.
In addition, ‘object-conscious’ image retrieval was achieved by the proposed
system while maintaining visual similarity over the entire image.
Shamsujjoha et al. (2014) presented a model that retrieves an unshaped image
such as the sea, sky, sand, soil, grass, ice, and rock using the local region based
on semantic modelling. The objective in using semantic modelling was to
decrease the semantic gap between the image understanding capabilities of
humans and computers. The proposed system was divided into five stages.
Firstly, the RGB histogram was learned from stored and classified images.
Secondly, the image was divided into an n*n regular grid, as shown in Figure
A.15, and the RGB histogram dissimilarity factor was computed for each local
image region corresponding to learned classified images in similar colours.
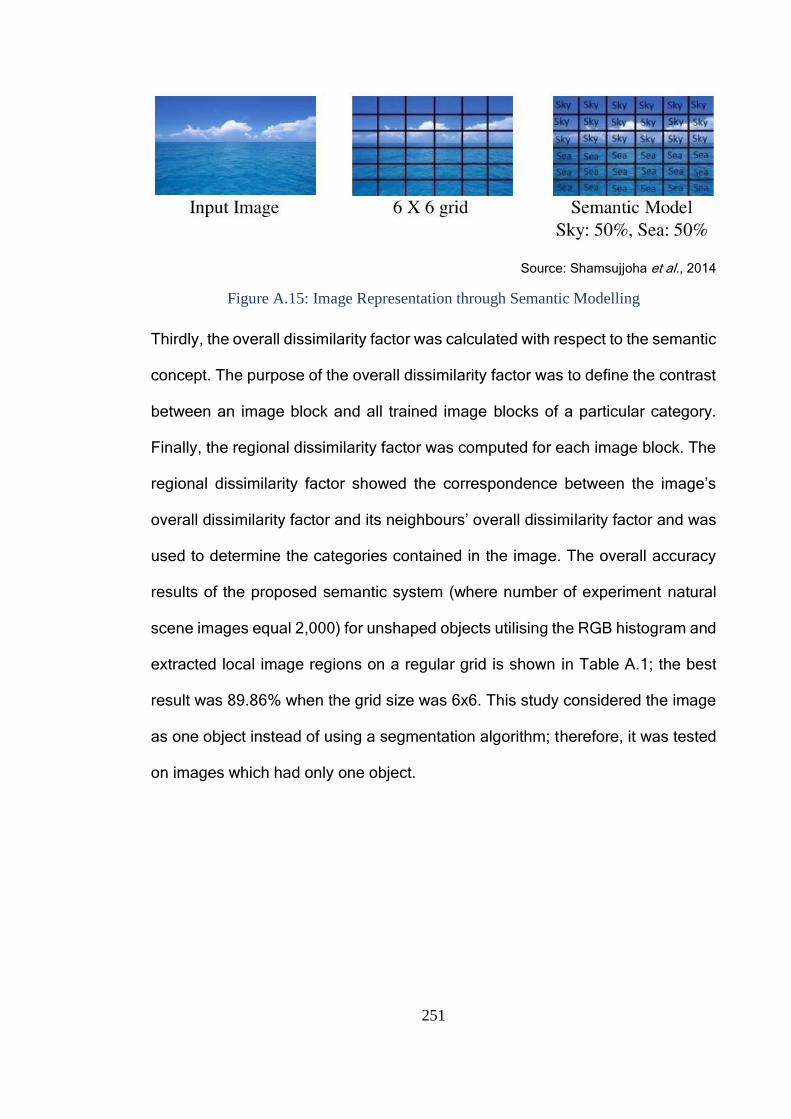
251
Source: Shamsujjoha et al., 2014
Figure A.15: Image Representation through Semantic Modelling
Thirdly, the overall dissimilarity factor was calculated with respect to the semantic
concept. The purpose of the overall dissimilarity factor was to define the contrast
between an image block and all trained image blocks of a particular category.
Finally, the regional dissimilarity factor was computed for each image block. The
regional dissimilarity factor showed the correspondence between the image’s
overall dissimilarity factor and its neighbours’ overall dissimilarity factor and was
used to determine the categories contained in the image. The overall accuracy
results of the proposed semantic system (where number of experiment natural
scene images equal 2,000) for unshaped objects utilising the RGB histogram and
extracted local image regions on a regular grid is shown in Table A.1; the best
result was 89.86% when the grid size was 6x6. This study considered the image
as one object instead of using a segmentation algorithm; therefore, it was tested
on images which had only one object.
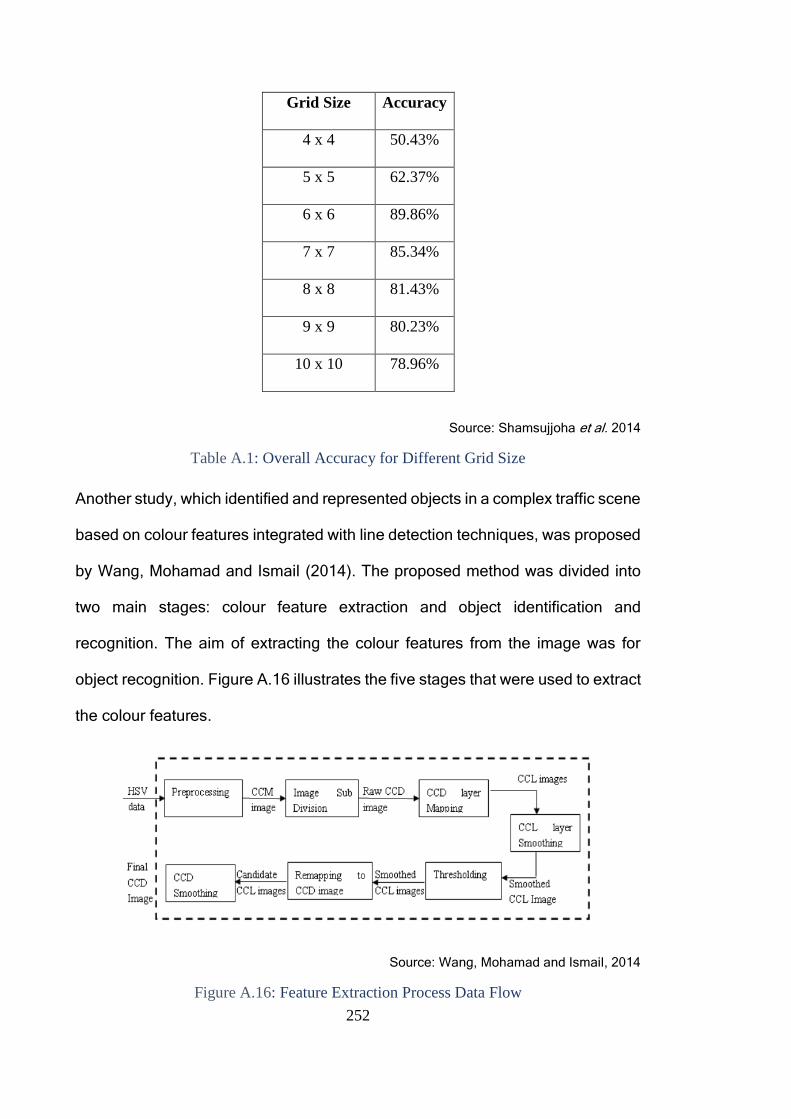
252
Grid Size Accuracy
4 x 4 50.43%
5 x 5 62.37%
6 x 6 89.86%
7 x 7 85.34%
8 x 8 81.43%
9 x 9 80.23%
10 x 10 78.96%
Source: Shamsujjoha et al. 2014
Table A.1: Overall Accuracy for Different Grid Size
Another study, which identified and represented objects in a complex traffic scene
based on colour features integrated with line detection techniques, was proposed
by Wang, Mohamad and Ismail (2014). The proposed method was divided into
two main stages: colour feature extraction and object identification and
recognition. The aim of extracting the colour features from the image was for
object recognition. Figure A.16 illustrates the five stages that were used to extract
the colour features.
Source: Wang, Mohamad and Ismail, 2014
Figure A.16: Feature Extraction Process Data Flow
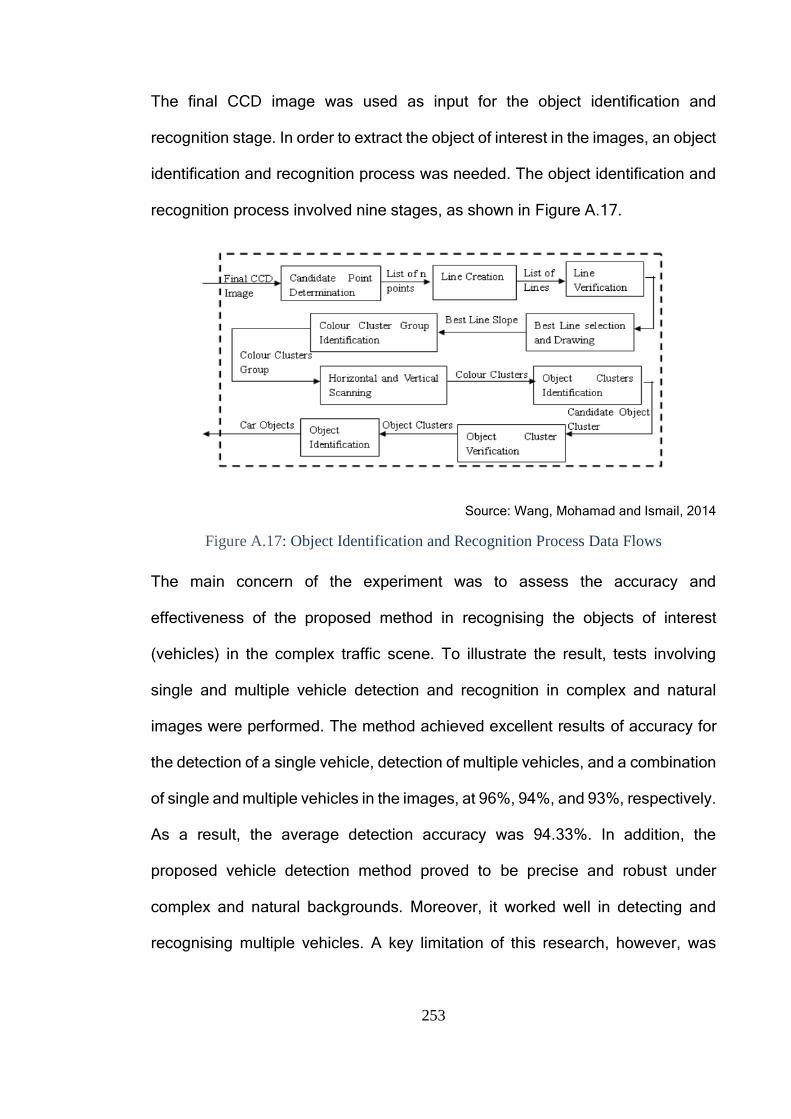
253
The final CCD image was used as input for the object identification and
recognition stage. In order to extract the object of interest in the images, an object
identification and recognition process was needed. The object identification and
recognition process involved nine stages, as shown in Figure A.17.
Source: Wang, Mohamad and Ismail, 2014
Figure A.17: Object Identification and Recognition Process Data Flows
The main concern of the experiment was to assess the accuracy and
effectiveness of the proposed method in recognising the objects of interest
(vehicles) in the complex traffic scene. To illustrate the result, tests involving
single and multiple vehicle detection and recognition in complex and natural
images were performed. The method achieved excellent results of accuracy for
the detection of a single vehicle, detection of multiple vehicles, and a combination
of single and multiple vehicles in the images, at 96%, 94%, and 93%, respectively.
As a result, the average detection accuracy was 94.33%. In addition, the
proposed vehicle detection method proved to be precise and robust under
complex and natural backgrounds. Moreover, it worked well in detecting and
recognising multiple vehicles. A key limitation of this research, however, was
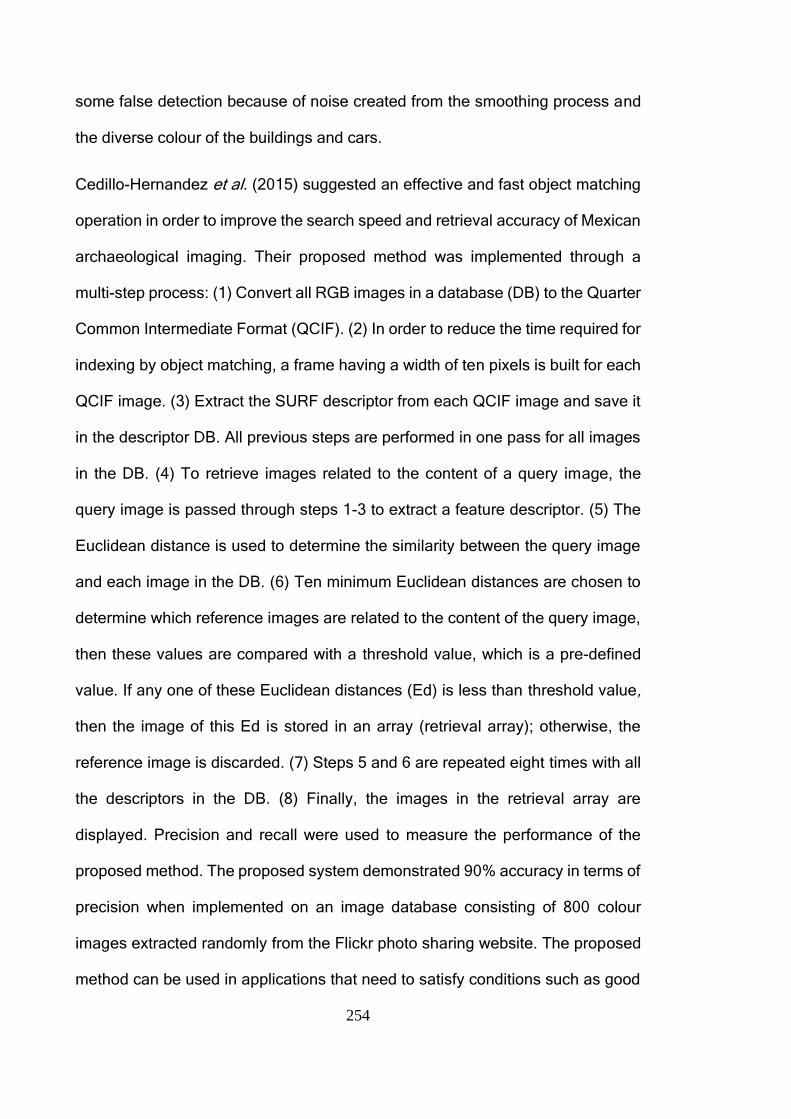
254
some false detection because of noise created from the smoothing process and
the diverse colour of the buildings and cars.
Cedillo-Hernandez et al. (2015) suggested an effective and fast object matching
operation in order to improve the search speed and retrieval accuracy of Mexican
archaeological imaging. Their proposed method was implemented through a
multi-step process: (1) Convert all RGB images in a database (DB) to the Quarter
Common Intermediate Format (QCIF). (2) In order to reduce the time required for
indexing by object matching, a frame having a width of ten pixels is built for each
QCIF image. (3) Extract the SURF descriptor from each QCIF image and save it
in the descriptor DB. All previous steps are performed in one pass for all images
in the DB. (4) To retrieve images related to the content of a query image, the
query image is passed through steps 1-3 to extract a feature descriptor. (5) The
Euclidean distance is used to determine the similarity between the query image
and each image in the DB. (6) Ten minimum Euclidean distances are chosen to
determine which reference images are related to the content of the query image,
then these values are compared with a threshold value, which is a pre-defined
value. If any one of these Euclidean distances (Ed) is less than threshold value,
then the image of this Ed is stored in an array (retrieval array); otherwise, the
reference image is discarded. (7) Steps 5 and 6 are repeated eight times with all
the descriptors in the DB. (8) Finally, the images in the retrieval array are
displayed. Precision and recall were used to measure the performance of the
proposed method. The proposed system demonstrated 90% accuracy in terms of
precision when implemented on an image database consisting of 800 colour
images extracted randomly from the Flickr photo sharing website. The proposed
method can be used in applications that need to satisfy conditions such as good

255
precision, compact design, low computational complexity, and the use of images
captured by different digital cameras with distinct geometric and photometric
operations as well as varied environmental conditions.
256
Appendix B: Multiple Objects-Based Image Retrieval
Among these studies, Kumar, Suneera and Kumar (2011) presented a new
method of content-based image retrieval depending on objects of user interest.
The initial step in their method was object selection, in which the user was
provided with various tools, such as a rectangle, circle, and polygonal tool, to
select an Object of User’s Interest (OUI). Two steps were then used to retrieve
images from a database related to the query image. In the first step, integrated
global colour and texture feature vectors were extracted by calculating the colour
moments and sub-band statistics of the wavelet multiscale decomposition,
respectively. Colour and texture were used in order to overcome the influence of
irrelevant image areas (such as background areas). The second step for image
retrieval was a combined shape feature using mathematical morphology
operators with the colour and texture features of the OUI. Then, to fill any holes
in the results, dilation and erosion operations were applied to find larger and
smaller objects, respectively. The proposed method was implemented on
different colour spaces, including RGB, HSV, and YCbCr. A variety of queries
involving different feature combinations (colour, colour and texture, and colour,
texture, and shape) were performed in the experiments. The performance was
evaluated by calculating the average precision of the retrieval results for three
different combinations. The proposed method was compared with traditional
methods in different ways, as listed in Table B.1. The highest value was achieved
in combining colour, texture, and shape features together in different numbers of
images and colour spaces.
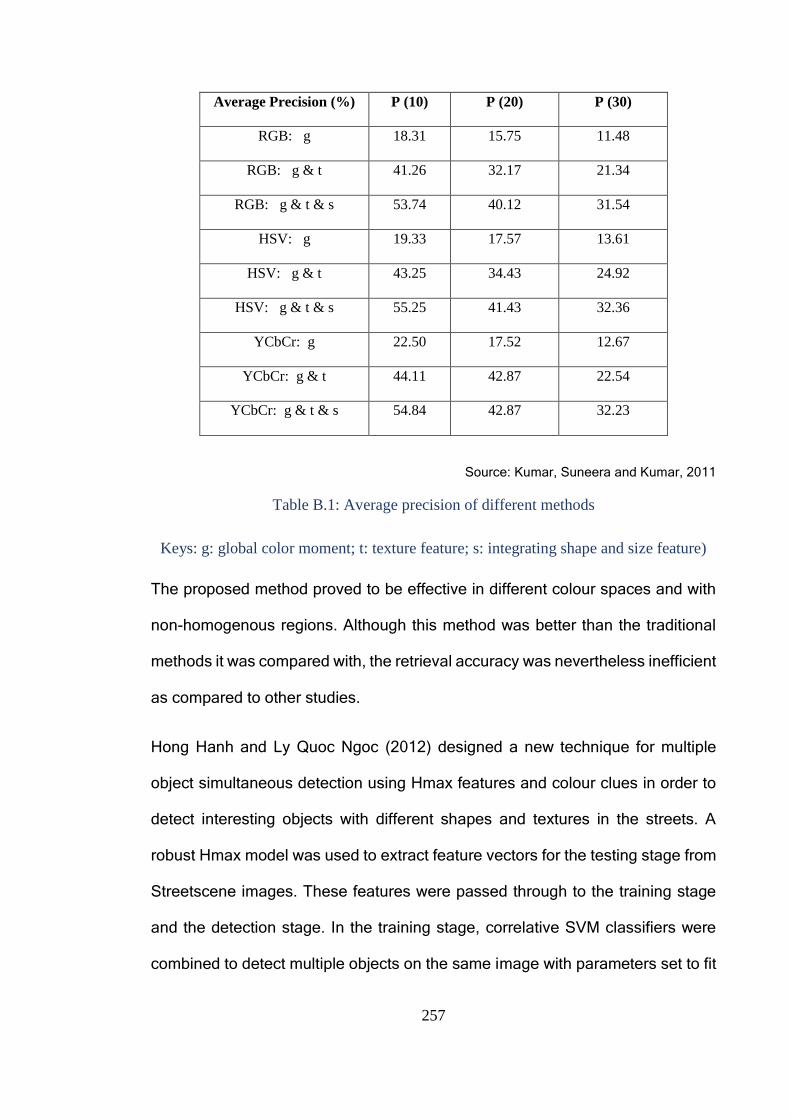
257
Average Precision (%) P (10) P (20) P (30)
RGB: g 18.31 15.75 11.48
RGB: g & t 41.26 32.17 21.34
RGB: g & t & s 53.74 40.12 31.54
HSV: g 19.33 17.57 13.61
HSV: g & t 43.25 34.43 24.92
HSV: g & t & s 55.25 41.43 32.36
YCbCr: g 22.50 17.52 12.67
YCbCr: g & t 44.11 42.87 22.54
YCbCr: g & t & s 54.84 42.87 32.23
Source: Kumar, Suneera and Kumar, 2011
Table B.1: Average precision of different methods
Keys: g: global color moment; t: texture feature; s: integrating shape and size feature)
The proposed method proved to be effective in different colour spaces and with
non-homogenous regions. Although this method was better than the traditional
methods it was compared with, the retrieval accuracy was nevertheless inefficient
as compared to other studies.
Hong Hanh and Ly Quoc Ngoc (2012) designed a new technique for multiple
object simultaneous detection using Hmax features and colour clues in order to
detect interesting objects with different shapes and textures in the streets. A
robust Hmax model was used to extract feature vectors for the testing stage from
Streetscene images. These features were passed through to the training stage
and the detection stage. In the training stage, correlative SVM classifiers were
combined to detect multiple objects on the same image with parameters set to fit
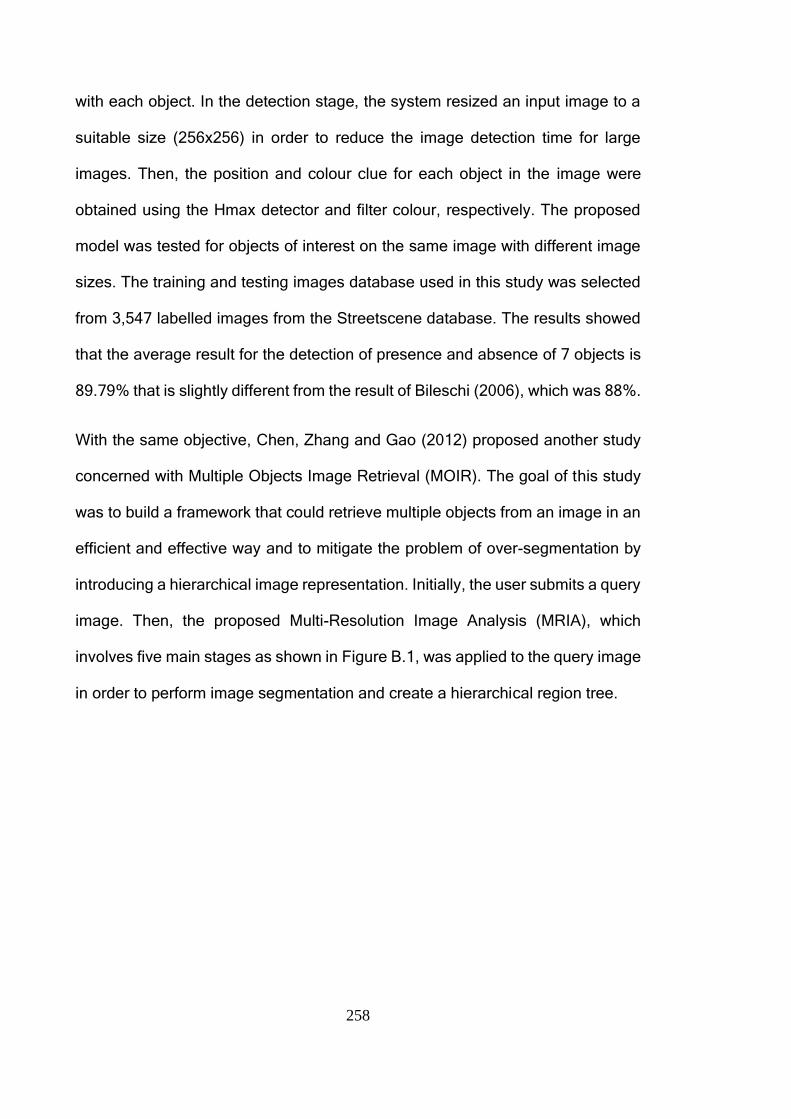
258
with each object. In the detection stage, the system resized an input image to a
suitable size (256x256) in order to reduce the image detection time for large
images. Then, the position and colour clue for each object in the image were
obtained using the Hmax detector and filter colour, respectively. The proposed
model was tested for objects of interest on the same image with different image
sizes. The training and testing images database used in this study was selected
from 3,547 labelled images from the Streetscene database. The results showed
that the average result for the detection of presence and absence of 7 objects is
89.79% that is slightly different from the result of Bileschi (2006), which was 88%.
With the same objective, Chen, Zhang and Gao (2012) proposed another study
concerned with Multiple Objects Image Retrieval (MOIR). The goal of this study
was to build a framework that could retrieve multiple objects from an image in an
efficient and effective way and to mitigate the problem of over-segmentation by
introducing a hierarchical image representation. Initially, the user submits a query
image. Then, the proposed Multi-Resolution Image Analysis (MRIA), which
involves five main stages as shown in Figure B.1, was applied to the query image
in order to perform image segmentation and create a hierarchical region tree.
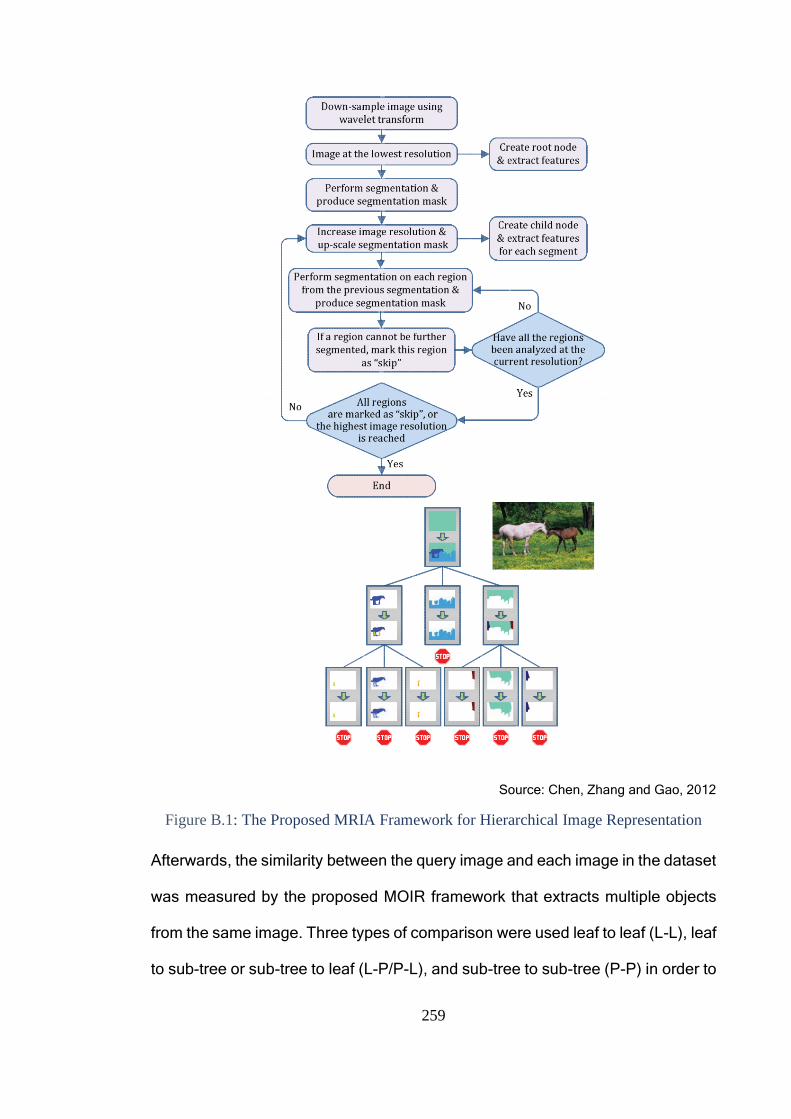
259
Source: Chen, Zhang and Gao, 2012
Figure B.1: The Proposed MRIA Framework for Hierarchical Image Representation
Afterwards, the similarity between the query image and each image in the dataset
was measured by the proposed MOIR framework that extracts multiple objects
from the same image. Three types of comparison were used leaf to leaf (L-L), leaf
to sub-tree or sub-tree to leaf (L-P/P-L), and sub-tree to sub-tree (P-P) in order to
260
compare the query image with the target image in the database (the tree of a
query image with the tree of the target image), as shown in Figure B.2.
Source: Chen, Zhang and Gao, 2012
Figure B.2: Matching Two Hierarchical Region Trees
Then, the target images (the top 20 images) were listed in descending order
depending on their similarity to the query image. The user provided relevance
feedback by giving either a positive or a negative label to the result. The goal of
this process was to determine which objects were of interest to the user and to
avoid additional comparisons during the feedback iteration. The proposed system
was implemented on a Corel image database that contained 10,000 images, from
which 50 objects were defined and manually annotated, such as blue sky, red
car, and roadway, instead of using the Corel category label. Two experiments
were carried out in order to evaluate the MRIA algorithm: an efficiency analysis
and an efficacy analysis. The average segmentation efficiency was 98.26% and
the segmentation quality was 73%. In addition, average precision (AP) and mean
average precision (mAP) were utilised to assess the performance of the MOIR in
both single object and multiple object retrieval. In single object retrieval (560
query images from 11 categories), the mAP value was 15.52%, which was higher
than the IRM+SVM, FIRM, and DRM methods by 1%, 3.17%, and 6.1%,
respectively. The MOIR method achieved a value of 17.58% for multiple object
261
retrieval (201 query images with different object combinations), which also was
higher than the IRM+SVM, FIRM, and DRM methods, by 3.25%, 6.02%, and
8.09%, respectively. The authors claimed that the results proved the superiority
of the proposed method over the other methods.
Dimitriou et al. (2013) aimed to build a complete system for multiple object
detection and classification in three dimensions that could see and understand
the objects in the same manner that humans do. To achieve this goal, they
proposed a model using an RGB-D sensor such as the Microsoft Kinect sensor,
which used a combination of an IR light projector and a simple camera to generate
an RGB plus a depth image pair. The system then used the depth information of
a scene (RGB plus depth image pair) to detect objects. Edge detection algorithms
were used directly on the depth image to reveal sharp changes in depth instead
of sharp changes in luminosity. Consequently, different objects were detected in
a scene, and the RGB image was segmented into several isolated object images.
Next, the Linear Spatial Pyramid Matching (LSPM) classification algorithm was
used to classify the object images more efficiently. In order to run the system
properly, various thresholds were used in the detection and the classification
algorithms. The proposed method was tested on a dataset that consisted of 100
images from 10 different categories: spray cleaner, book, bottle, hard disk, box,
can, pot, mug, shampoo, and shoe. It was found that the time required for
detection was 0.3 seconds for each scene and the time for classification of each
object was 5ms. The authors claimed that the system offered a fast, precise, and
preferable classification of multiple objects from just one scene and had many
advantages over traditional object detection methods. Though the mean
classification percentage was 84.33%, there were no examples given of object
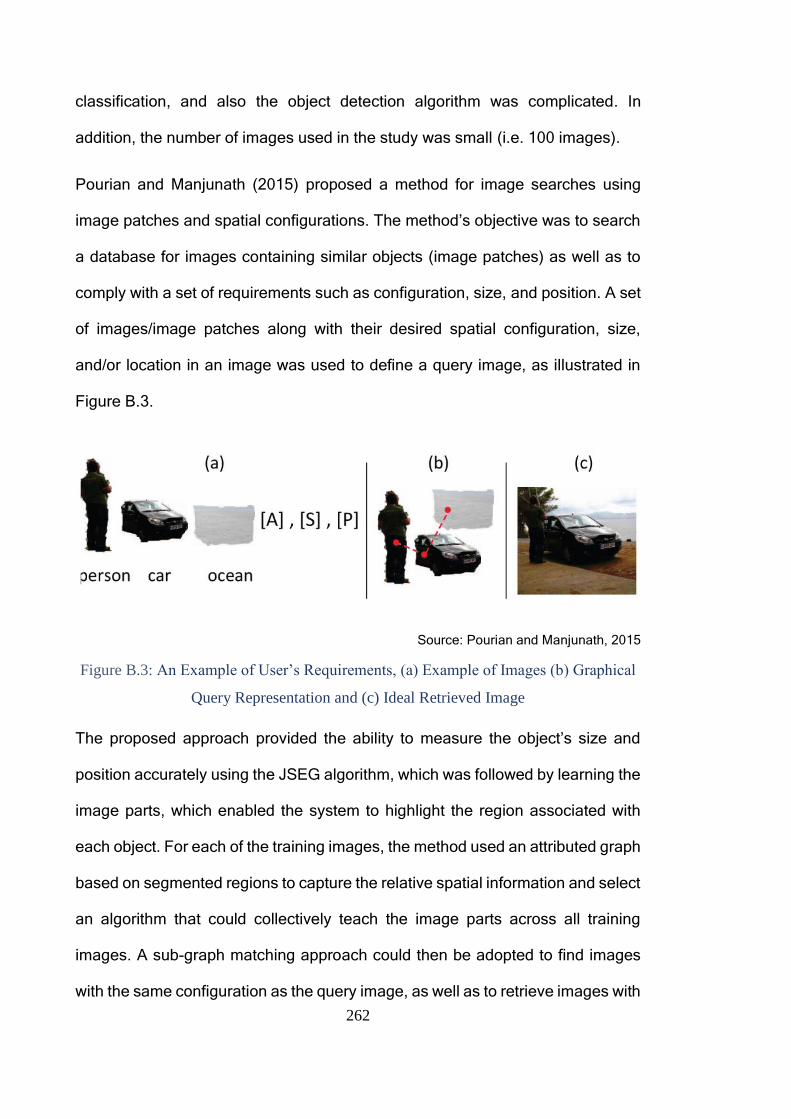
262
classification, and also the object detection algorithm was complicated. In
addition, the number of images used in the study was small (i.e. 100 images).
Pourian and Manjunath (2015) proposed a method for image searches using
image patches and spatial configurations. The method’s objective was to search
a database for images containing similar objects (image patches) as well as to
comply with a set of requirements such as configuration, size, and position. A set
of images/image patches along with their desired spatial configuration, size,
and/or location in an image was used to define a query image, as illustrated in
Figure B.3.
Source: Pourian and Manjunath, 2015
Figure B.3: An Example of User’s Requirements, (a) Example of Images (b) Graphical
Query Representation and (c) Ideal Retrieved Image
The proposed approach provided the ability to measure the object’s size and
position accurately using the JSEG algorithm, which was followed by learning the
image parts, which enabled the system to highlight the region associated with
each object. For each of the training images, the method used an attributed graph
based on segmented regions to capture the relative spatial information and select
an algorithm that could collectively teach the image parts across all training
images. A sub-graph matching approach could then be adopted to find images
with the same configuration as the query image, as well as to retrieve images with
263
the highest matching score. Three challenging datasets, PASCAL VOC2007,
ImageNet ILSVRC2010, and TREC, were used to carry out the experiments.
These datasets have been released each year since 2006 through conducting an
annual competition and workshop. There are two main challenges: classification—
“does the image contain any instances of a particular object class?” (where the
object classes include cars, people, dogs, etc.), and detection— “where are the
instances of a particular object class in the image (if any)?”. In addition, there are
two subset challenges (“tasters”) on pixel-level segmentation—assign each pixel
a class label, and “person layout”—localise the head, hands and feet of people in
the image. Challenges are issued each year on deadlines, then the year result
and methods are compared and discussed in the workshop held each year. The
datasets and associated annotation and software are subsequently published
and available for use at any time (Everingham et al., 2014). In order to evaluate
the scalability of the method, a publicly available dataset containing 9,963 images
and 20 object classes from PASCAL VOC2007, as well as a subset of almost one
million images from ImageNet ILSVRC2010, were adopted. The retrieval
accuracy was calculated by using the mAP, and the results were 65% and 59%.
These results proved that the proposed approach achieved higher retrieval
accuracy than other methods by 11% and 15% for the VOC07 and TREC
datasets, respectively. In addition, the retrieval of each query required
approximately 0.1 seconds. The drawback of this method is that it lacks
concentration on the effects of object size and position in the retrieval results.
Another study focused on the extraction of multiple objects from a given image of
a natural scene. Two different approaches for object extraction were used by
Muralidharan et al. (2015). In the first approach, context-aware saliency detection
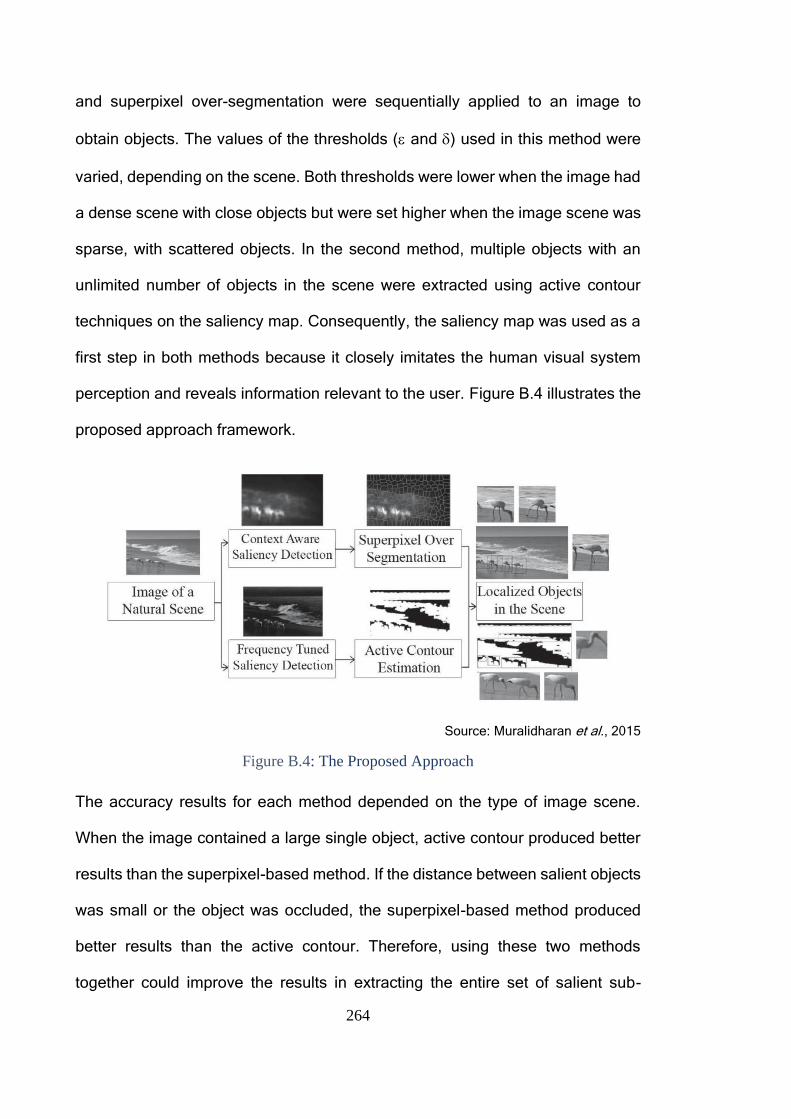
264
and superpixel over-segmentation were sequentially applied to an image to
obtain objects. The values of the thresholds ( and ) used in this method were
varied, depending on the scene. Both thresholds were lower when the image had
a dense scene with close objects but were set higher when the image scene was
sparse, with scattered objects. In the second method, multiple objects with an
unlimited number of objects in the scene were extracted using active contour
techniques on the saliency map. Consequently, the saliency map was used as a
first step in both methods because it closely imitates the human visual system
perception and reveals information relevant to the user. Figure B.4 illustrates the
proposed approach framework.
Source: Muralidharan et al., 2015
Figure B.4: The Proposed Approach
The accuracy results for each method depended on the type of image scene.
When the image contained a large single object, active contour produced better
results than the superpixel-based method. If the distance between salient objects
was small or the object was occluded, the superpixel-based method produced
better results than the active contour. Therefore, using these two methods
together could improve the results in extracting the entire set of salient sub-
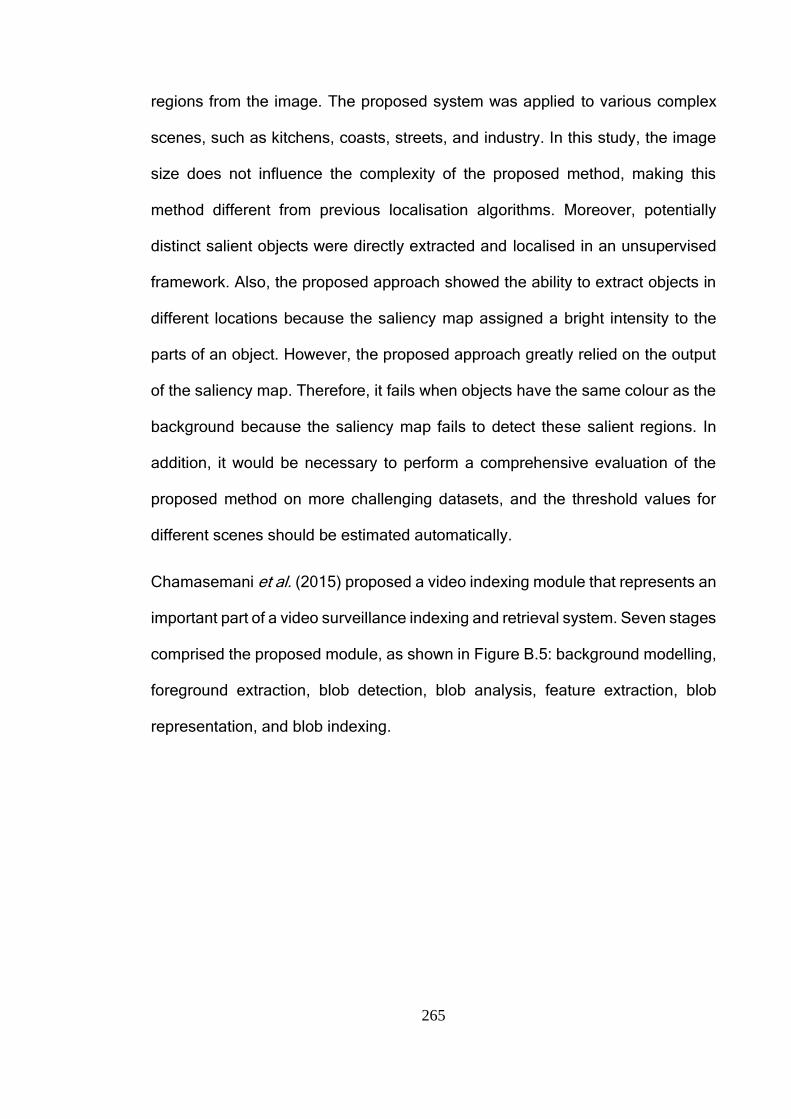
265
regions from the image. The proposed system was applied to various complex
scenes, such as kitchens, coasts, streets, and industry. In this study, the image
size does not influence the complexity of the proposed method, making this
method different from previous localisation algorithms. Moreover, potentially
distinct salient objects were directly extracted and localised in an unsupervised
framework. Also, the proposed approach showed the ability to extract objects in
different locations because the saliency map assigned a bright intensity to the
parts of an object. However, the proposed approach greatly relied on the output
of the saliency map. Therefore, it fails when objects have the same colour as the
background because the saliency map fails to detect these salient regions. In
addition, it would be necessary to perform a comprehensive evaluation of the
proposed method on more challenging datasets, and the threshold values for
different scenes should be estimated automatically.
Chamasemani et al. (2015) proposed a video indexing module that represents an
important part of a video surveillance indexing and retrieval system. Seven stages
comprised the proposed module, as shown in Figure B.5: background modelling,
foreground extraction, blob detection, blob analysis, feature extraction, blob
representation, and blob indexing.
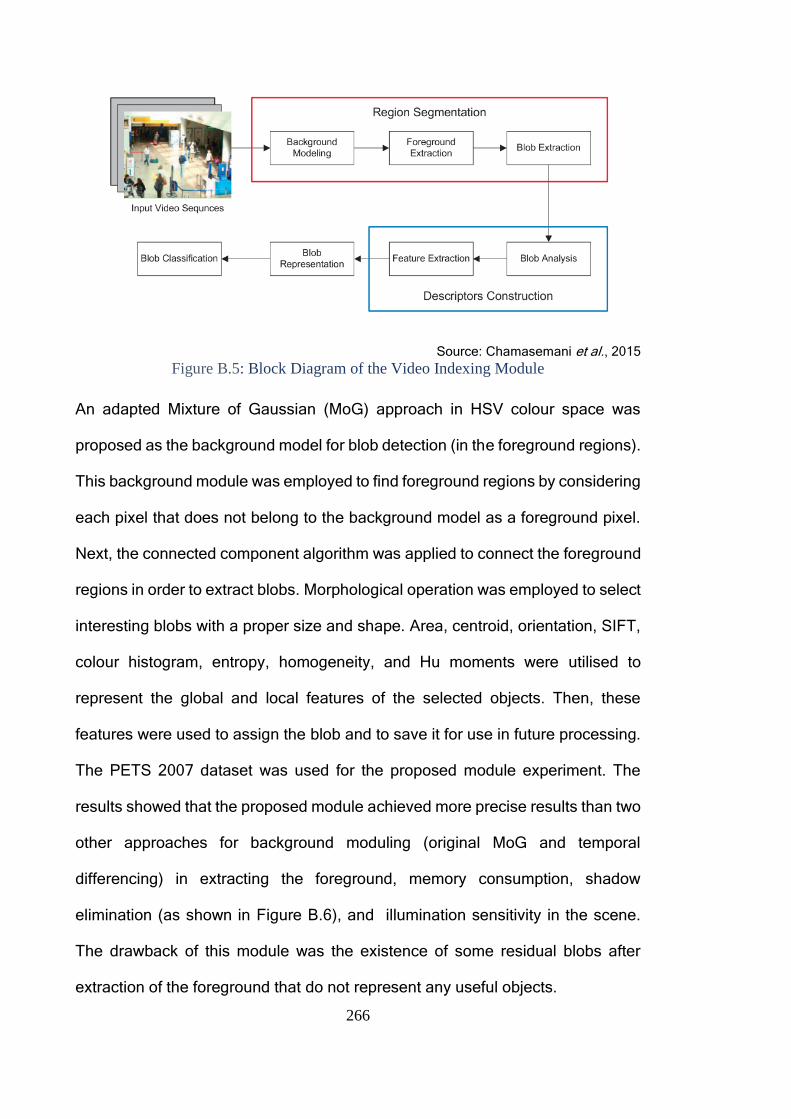
266
Source: Chamasemani et al., 2015
Figure B.5: Block Diagram of the Video Indexing Module
An adapted Mixture of Gaussian (MoG) approach in HSV colour space was
proposed as the background model for blob detection (in the foreground regions).
This background module was employed to find foreground regions by considering
each pixel that does not belong to the background model as a foreground pixel.
Next, the connected component algorithm was applied to connect the foreground
regions in order to extract blobs. Morphological operation was employed to select
interesting blobs with a proper size and shape. Area, centroid, orientation, SIFT,
colour histogram, entropy, homogeneity, and Hu moments were utilised to
represent the global and local features of the selected objects. Then, these
features were used to assign the blob and to save it for use in future processing.
The PETS 2007 dataset was used for the proposed module experiment. The
results showed that the proposed module achieved more precise results than two
other approaches for background moduling (original MoG and temporal
differencing) in extracting the foreground, memory consumption, shadow
elimination (as shown in Figure B.6), and illumination sensitivity in the scene.
The drawback of this module was the existence of some residual blobs after
extraction of the foreground that do not represent any useful objects.
267
(a) (b)
Source: Chamasemani et al., 2015
Figure B.6: Results Comparison on Foreground Extraction by Using: (a) the Original
and (b) the Proposed Mog In HSV Color Space

268
Appendix C: Approval Forms and Ethical Approval
Notifications

Mrs Jayne Brenen, Head of Faculty Operations, Faculty of Science and Engineering, University of Plymouth, Drake Circus, Plymouth, Devon PL4 8AA T +44 (0)1752 584584 F +44 (0)1752 584540 W www.plymouth.ac.uk
07 May 2019 CONFIDENTIAL
School of Computing, Electronics and Mathematics
Dear Shahlaa Ethical Approval Application Thank you for submitting the ethical approval form and details concerning your project:
An Object-based Multimedia Forensic Analysis Tool
I am pleased to inform you that this has been approved. Kind regards
pp Steven Neal Secretary to Faculty Research Ethics Committee
Cc: Prof Nathan Clarke
Dr Fudong Li

Faculty of Science and Engineering Ethical Application Form PS 2015/16 Final
1
PLYMOUTH UNIVERSITY FACULTY OF SCIENCE AND ENGINEERING
Research Ethics Committee
APPLICATION FOR ETHICAL APPROVAL OF RESEARCH INVOLVING
HUMAN PARTICIPANTS
All applicants should read the guidelines which are available via the following link: https://staff.plymouth.ac.uk//scienv/humanethics/intranet.htm
This is a WORD document. Please complete in WORD and extend space where necessary.
All applications must be word processed. Handwritten applications will be returned. Please submit with interview schedules and/or questionnaires appropriately.
Postgraduate and Staff must submit a signed copy to [email protected] Undergraduate students should contact their School Representative of the Science and Engineering Research Ethics Committee or dissertation advisor prior to completing this form to confirm the process within their School. School of Computing, Electronics and Mathematics undergraduate students – please submit to [email protected] with your project supervisor copied in. ______________________________________________________________________________
1. TYPE OF PROJECT 1.1 What is the type of project? (Put an X next to one only) STAFF should put an X next to one of the three options below: Specific project X Thematic programme of research Practical / Laboratory Class . 1.2 Put an X next to one only POSTGRADUATE STUDENTS should put an X next to one of the options below: Taught Masters Project M.Phil / PhD by research X UNDERGRADUATE STUDENTS should put an X next to one of the options below: Student research project Practical / Laboratory class where you are acting as the experimenter
2. APPLICATION
2.1 TITLE of Research project
An Object-based Multimedia Forensic Analysis Tool
2.2 General summary of the proposed research for which ethical clearance is sought, briefly outlining the aims and objectives and providing details of interventions/procedures involving participants (no jargon)

Faculty of Science and Engineering Ethical Application Form PS 2015/16 Final
2
The objective of the proposed system is to automate the identification and extraction of annotation-based evidence from multimedia content. In addition to making multimedia data searchable, the Object-based Multimedia Forensic Analysis Tool (OM-FAT) system will enable investigators to perform a variety of forensic analyses (Search Using Annotations, Metadata, Object Matching, Text Similarity and Geo Tracking) to help investigators to understand the relationship between artefacts and thus reduce the time taken to perform an investigation and the cognitive load of the investigator. It enables the investigator to ask higher-level and more abstract questions of the data, then finding answers to the essential questions in the investigation: what, who, why, how, when, and where. The purpose of the ethical approval is to permit an expert-based evaluation of the proposed system. The purpose of this evaluation is to validate the novelty of the research undertaken, review different aspects of the developed tool and identify its strengths, weaknesses and limitations using the experts’ knowledge and experience. Experts will be invited formally via e-mail on an individual basis and once the invitation is accepted (with a time-slot of their choice), the consent form will be sent to them to be read and signed. During the interview, experts will be requested to watch a video podcast that will brief them on how the system works and will include screenshots of interfaces of the developed prototype. Following this, a set of prepared interview questions will be asked to collect the feedback. All interview sessions will be recorded with the interviewees’ prior permission for later analysis.
2.3 Physical site(s) where research will be carried out
The experts will be interviewed over the Internet (via Skype, most likely).
2.4 External Institutions involved in the research (e.g. other university, hospital, prison etc.)
None.
2.5 Name, telephone number, e-mail address and position of lead person for this project (plus full details of Project Supervisor if applicable)
Mrs Shahlaa Mashhadani(Research student) – [email protected], +447438750742 Prof Nathan Clarke (Director of studies) - [email protected], +441752586218 Dr Fudong Li (Second supervisor) - [email protected],
2.6 Start and end date for research for which ethical clearance is sought (NB maximum period is 3 years)
Start date: 1 April 2019 End date: 30 September 2019
2.7 Has this same project received ethical approval from another Ethics Committee?
Delete as applicable: No
2.8 If yes, do you want Chairman’s action?
Delete as applicable: No Yes If yes, please include other application and approval letter and STOP HERE. If no, please continue
3. PROCEDURE
3.1 Describe procedures that participants will engage in, Please do not use jargon
At least 12 experts who have experience and qualifications related to the research project will be identified. Ideally this will include a mixture of practitioners and academics.
All identified experts will be formally invited via e-mail.
Once the invitation is accepted, consent form will be sent for their approval.
During the interview, the interviewee will first be requested to watch a video podcast (15 or 20 minutes long) that will provide brief how the system works.
Following the podcast, a set of questions will be asked to collect the experts’ feedback.
All interview sessions will be conducted in English and will be recorded (with prior permission) for later analysis.
The data from the interviews will be kept securely for 10 years.

Faculty of Science and Engineering Ethical Application Form PS 2015/16 Final
3
Finally, a copy of the transcribed interviews will be sent to the experts to confirm that they have been represented fairly and nothing critical has been missed out in terms of context. The document containing the transcribed interviews will be encrypted and password protected to maintain data confidentiality. Secure e-mail system will be used for the document transmission.
3.2 How long will the procedures take? Give details
The total amount of time needed for each expert participant will be around 30 minutes depending on the responses and resulting discussion.
3.3 Does your research involve deception?
Delete as applicable: No 3.4 If yes, please explain why the following conditions apply to your research:
a) Deception is completely unavoidable if the purpose of the research is to be met
b) The research objective has strong scientific merit
c) Any potential harm arising from the proposed deception can be effectively neutralised or reversed by the proposed debriefing procedures (see section below)
3.5 Describe how you will debrief your participants
The interview will begin by asking the interviewee to watch the video podcast which will explain how the system works and demonstrate the developed prototype. This will give the experts a better understanding of the research. Latter part of the interview will involve collecting their feedback by asking a set of questions about the research and the prototype. All sessions will be recorded with permission and a copy of the transcribed interviews will be sent to the experts to confirm that they have been represented fairly and nothing critical has been missed out in terms of context.
3.6 Are there any ethical issues (e.g. sensitive material)?
Delete as applicable: No 3.7 If yes, please explain. You may be asked to provide ethically sensitive material. See also section 11

Faculty of Science and Engineering Ethical Application Form PS 2015/16 Final
4
4. BREAKDOWN OF PARTICIPANTS
4.1 Summary of participants
Type of participant Number of participants
Non-vulnerable Adults
At least 12
Minors (< 16 years)
N/A
Minors (16-18 years)
N/A
Vulnerable Participants
(other than by virtue of being a minor)
N/A
Other (please specify)
N/A
TOTAL
12 (at least)
4.2 How were the sample sizes determined?
A minimum of 12 experts in the field of digital forensics are considered to be a sufficient baseline to provide a solid base for evaluation.
4.3 How will subjects be recruited?
The experts - predominantly people with experience and knowledge in the field of digital forensics - will be recruited from outside University of Plymouth. They will be formally invited via e-mail. Professional contacts via the supervision team will provide a basis for the invitations.
4.4 Will subjects be financially rewarded? If yes, please give details.
No.
5. NON-VULNERABLE ADULTS
5.1 Are some or all of the participants non-vulnerable adults?
Delete as applicable: Yes 5.2 Inclusion / exclusion criteria
Participants must: - Be 18 years old or above - Agree and understand the procedure
5.3 How will participants give informed consent?
Participants will be given the consent form at the beginning of the evaluation ensuring that they understand that they can withdraw from the evaluation at any time, if they wish to do so.
5.4 Consent form(s) attached
Delete as applicable: Yes If no, why not?
5.5 Information sheet(s) attached

Faculty of Science and Engineering Ethical Application Form PS 2015/16 Final
5
Delete as applicable: Yes If no, why not?
5.6 How will participants be made aware of their right to withdraw at any time?
Participant’s right to withdraw from the evaluation process at any point is stated in the consent form.
5.7 How will confidentiality be maintained, including archiving / destruction of primary data where appropriate, and how will the security of the data be maintained?
Recorded interview sessions will be stored in an external storage device to ensure security and confidentiality. On successful transcription of the results, the primary data (recordings) will be permanently deleted. Recording of interview sessions will not contain any identifying information. Also, none of the transcribed results of the evaluation will include any information that can identify any of the participants.
6. MINORS <16 YEARS
6.1 Are some or all of the participants under the age of 16?
Delete as applicable: No If yes, please consult special guidelines for working with minors. If no, please continue.
6.2 Age range(s) of minors
N/A
6.3 Inclusion / exclusion criteria
N/A
6.4 How will minors give informed consent? Please tick appropriate box and explain (See guidelines)
Delete as applicable: N/A
6.5 Consent form(s) for minor attached
Delete as applicable: N/A
If no, why not?
N/A
6.6 Information sheet(s) for minor attached
Delete as applicable: N/A
If no, why not?
N/A
6.7 Consent form(s) for parent / legal guardian attached
Delete as applicable: N/A
If no, why not?
N/A
6.8 Information sheet(s) for parent / legal guardian attached
Delete as applicable: N/A
If no, why not?
N/A
6.9 How will minors be made aware of their right to withdraw at any time?
N/A

Faculty of Science and Engineering Ethical Application Form PS 2015/16 Final
6
6.10 How will confidentiality be maintained, including archiving / destruction of primary data where appropriate, and how will the security of the data be maintained?
N/A
7. MINORS 16-18 YEARS OLD
7.1 Are some or all of the participants between the ages of 16 and 18?
Delete as applicable: No If yes, please consult special guidelines for working with minors. If no, please continue.
7.2 Inclusion / exclusion criteria
N/A
7.3 How will minors give informed consent? (See guidelines)
N/A
7.4 Consent form(s) for minor attached
Delete as applicable: N/A
If no, why not?
N/A
7.5 Information sheet(s) for minor attached
Delete as applicable: N/A
If no, why not?
N/A
7.6 Consent form(s) for parent / legal guardian attached
Delete as applicable: N/A
If no, why not?
N/A
7.7 Information sheet(s) for parent / legal guardian attached
Delete as applicable: N/A
If no, why not?
N/A
7.8 How will minors be made aware of their right to withdraw at any time?
N/A
7.9 How will confidentiality be maintained, including archiving / destruction of primary data where appropriate, and how will the security of the data be maintained?
N/A
8. VULNERABLE GROUPS
8.1 Are some or all of the participants vulnerable? (See guidelines)
Delete as applicable: No If yes, please consult special guidelines for working with vulnerable groups. If no, please continue.
8.2 Describe vulnerability (apart from possibly being a minor)
N/A

Faculty of Science and Engineering Ethical Application Form PS 2015/16 Final
7
8.3 Inclusion / exclusion criteria
N/A
8.4 How will participants give informed consent?
N/A
8.5 Consent form(s) for vulnerable person attached
Delete as applicable: N/A
If no, why not?
N/A
8.6 Information sheet(s) for vulnerable person attached
Delete as applicable: N/A
If no, why not?
N/A
8.7 Consent form(s) for parent / legal guardian attached
Delete as applicable: N/A
If no, why not?
N/A
8.8 Information sheet(s) for parent / legal guardian attached
Delete as applicable: N/A
If no, why not?
N/A
8.9 How will participants be made aware of their right to withdraw at any time?
N/A
8.10 How will confidentiality be maintained, including archiving / destruction of primary data where appropriate, and how will the security of the data be maintained?
N/A
9. EXTERNAL CLEARANCES Investigators working with children and vulnerable adults legally require clearance from the Disclosure and Barring Service (DBS)
9.1 Do ALL experimenters in contact with children and vulnerable adults have current DBS clearance? Please include photocopies.
Delete as applicable: N/A If no, explain
N/A
9.2 If your research involves external institutions (school, social service, prison, hospital etc) please provide cover letter(s) from institutional heads permitting you to carry out research on their clients, and where applicable, on their site(s). Are these included?
Delete as applicable: N/A If not, why not?
N/A
10. PHYSICAL RISK ASSESSMENT

Faculty of Science and Engineering Ethical Application Form PS 2015/16 Final
8
10.1 Will participants be at risk of physical harm (e.g. from electrodes, other equipment)? (See guidelines)
Delete as applicable: No 10.2 If yes, please describe
N/A
10.3 What measures have been taken to minimise risk? Include risk assessment proformas which has been signed by the Head of Department
N/A
10.4 How will you handle participants who appear to have been harmed?
N/A
11. PSYCHOLOGICAL RISK ASSESSMENT
11.1 Will participants be at risk of psychological harm (e.g. viewing explicit or emotionally sensitive material, being stressed, recounting traumatic events)? (See guidelines)
Delete as applicable: No 11.2 If yes, please describe
N/A
11.3 What measures have been taken to minimise risk?
N/A
11.4 How will you handle participants who appear to have been harmed?
N/A
12. RESEARCH OVER THE INTERNET
12.1 Will research be carried out over the internet?
Delete as applicable: Yes 12.2 If yes, please explain protocol in detail, explaining how informed consent will be given, right to withdraw maintained, and confidentiality maintained. Give details of how you will guard against abuse by participants or others (see guidelines)
Participants will be provided with the consent form in the beginning, by signing which, they can agree to participate in the evaluation. It also gives them the right to withdraw from the process at any time. Also, all participants will be asked to confirm their age (18 years or above). Recording of interview sessions will not contain any identifying information. Also, none of the transcribed results of the evaluation will include any information that can identify any of the participants.
13. CONFLICTS OF INTEREST & THIRD PARTY INTERESTS
13.1 Do any of the experimenters have a conflict of interest? (See guidelines)
Delete as applicable: No 13.2 If yes, please describe
N/A
13.3 Are there any third parties involved? (See guidelines)
Delete as applicable: No 13.4 If yes, please describe

Faculty of Science and Engineering Ethical Application Form PS 2015/16 Final
9
N/A
13.5 Do any of the third parties have a conflict of interest?
Delete as applicable: N/A
13.6 If yes, please describe
N/A
14. ADDITIONAL INFORMATION
14.1 [Optional] Give details of any professional bodies whose ethical policies apply to this research
N/A
14.2 [Optional] Please give any additional information that you wish to be considered in this application
N/A
15. ETHICAL PROTOCOL & DECLARATION
To the best of our knowledge and belief, this research conforms to the ethical principles laid down by the University of Plymouth and by any professional body specified in section 14 above. This research conforms to the University’s Ethical Principles for Research Involving Human Participants with regard to openness and honesty, protection from harm, right to withdraw, debriefing, confidentiality, and informed consent Sign below where appropriate: STAFF / RESEARCH POSTGRADUATES Print Name Signature Date Principal Investigator: Shahlaa Mashhadani Shahlaa Mashhadani __________ Prof. Nathan Clarke ______________________ __________ Fudong Li. ______________________ __________ Staff and Research Postgraduates should email the completed and signed copy of this form to Paula Simson. UG Students Print Name Signature Date Student: ______________________ _____________ Supervisor / Advisor: ______________________ _____________ ______________________ _____________ ______________________ _____________ Undergraduate students should pass on the completed and signed copy of this form to their School Representative on the Science and Engineering Human Ethics Committee. Signature Date

Faculty of Science and Engineering Ethical Application Form PS 2015/16 Final
10
School Representative on Science and Engineering Faculty Human Ethics Committee ______________________ _____________
Faculty of Science and Engineering Research Ethics Committee List of School Representatives School of Geography, Earth and Environmental Sciences Dr Sanzidur Rahman Dr Kim Ward School of Biological Sciences Dr Victor Kuri School of Biomedical and Healthcare Sciences Dr David J Price School of Marine Science & Engineering Dr Gillian Glegg (Chair) Dr Liz Hodgkinson School of Computing, Electronics & Mathematics Dr Mark Dixon Dr Yinghui Wei External Representative Prof Linda La Velle Lay Member Rev. David Evans
Committee Secretary: Mrs Paula Simson
email: [email protected]
tel: 01752 584503
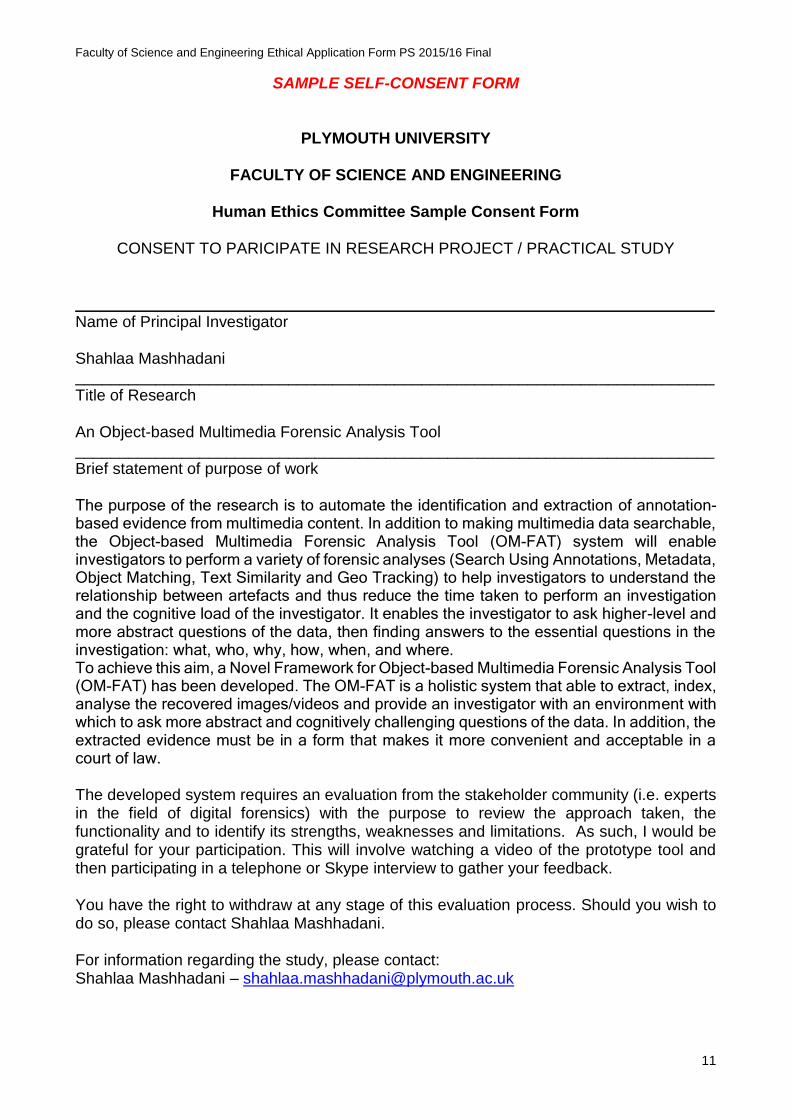
Faculty of Science and Engineering Ethical Application Form PS 2015/16 Final
11
SAMPLE SELF-CONSENT FORM
PLYMOUTH UNIVERSITY
FACULTY OF SCIENCE AND ENGINEERING
Human Ethics Committee Sample Consent Form
CONSENT TO PARICIPATE IN RESEARCH PROJECT / PRACTICAL STUDY
________________________________________________________________________ Name of Principal Investigator Shahlaa Mashhadani ________________________________________________________________________ Title of Research An Object-based Multimedia Forensic Analysis Tool ________________________________________________________________________ Brief statement of purpose of work The purpose of the research is to automate the identification and extraction of annotation-based evidence from multimedia content. In addition to making multimedia data searchable, the Object-based Multimedia Forensic Analysis Tool (OM-FAT) system will enable investigators to perform a variety of forensic analyses (Search Using Annotations, Metadata, Object Matching, Text Similarity and Geo Tracking) to help investigators to understand the relationship between artefacts and thus reduce the time taken to perform an investigation and the cognitive load of the investigator. It enables the investigator to ask higher-level and more abstract questions of the data, then finding answers to the essential questions in the investigation: what, who, why, how, when, and where. To achieve this aim, a Novel Framework for Object-based Multimedia Forensic Analysis Tool (OM-FAT) has been developed. The OM-FAT is a holistic system that able to extract, index, analyse the recovered images/videos and provide an investigator with an environment with which to ask more abstract and cognitively challenging questions of the data. In addition, the extracted evidence must be in a form that makes it more convenient and acceptable in a court of law. The developed system requires an evaluation from the stakeholder community (i.e. experts in the field of digital forensics) with the purpose to review the approach taken, the functionality and to identify its strengths, weaknesses and limitations. As such, I would be grateful for your participation. This will involve watching a video of the prototype tool and then participating in a telephone or Skype interview to gather your feedback. You have the right to withdraw at any stage of this evaluation process. Should you wish to do so, please contact Shahlaa Mashhadani. For information regarding the study, please contact: Shahlaa Mashhadani – [email protected]

Faculty of Science and Engineering Ethical Application Form PS 2015/16 Final
12
For any questions concerning the ethical status of this study, please contact the secretary
of the Human Ethics Committee – [email protected]
________________________________________________________________________ The objectives of this research have been explained to me. I understand that I am free to withdraw from the research at any stage, and ask for my data to be destroyed if I wish. I understand that my anonymity is guaranteed, unless I expressly state otherwise. I understand that the Principal Investigator of this work will have attempted, as far as possible, to avoid any risks, and that safety and health risks will have been separately assessed by appropriate authorities (e.g. under COSHH regulations) Under these circumstances, I agree to participate in the research. Name: ………………………………………. Signature: .....................................…………….. Date: ................…………..
Faculty of Science and Engineering Ethical Application Form PS 2015/16 Final
13
SAMPLE INFORMATION SHEET FOR ADULT / CHILD
PLYMOUTH UNIVERSITY
FACULTY OF SCIENCE AND ENGINEERING
RESEARCH INFORMATION SHEET
________________________________________________________________________ Name of Principal Investigator Shahlaa Mashhadani ________________________________________________________________________ Title of Research An Object-based Multimedia Forensic Analysis Tool _______________________________________________________________________ Aim of research The aim of the research is to automate the identification and extraction of annotation-based evidence from multimedia content. In addition to making multimedia data searchable, the Object-based Multimedia Forensic Analysis Tool (OM-FAT) system will enable investigators to perform a variety of forensic analyses (Search Using Annotations, Metadata, Object Matching, Text Similarity and Geo Tracking) to help investigators to understand the relationship between artefacts and thus reduce the time taken to perform an investigation and the cognitive load of the investigator. It enables the investigator to ask higher-level and more abstract questions of the data, then finding answers to the essential questions in the investigation: what, who, why, how, when, and where. To achieve this aim, a Novel Framework for Object-based Multimedia Forensic Analysis Tool (OM-FAT) has been developed. The OM-FAT is a holistic system that able to extract, index, analyse the recovered images/videos and provide an investigator with an environment with which to ask more abstract and cognitively challenging questions of the data. In addition, the extracted evidence must be in a form that makes it more convenient and acceptable in a court of law. Description of procedure During the interview, the experts will be requested to watch a video podcast that will brief them on how the system works and will include screenshots of interfaces of the developed prototype. Following this, prepared interview questions will be asked to collect the feedback. All interview sessions will be conducted over the Internet (preferably using Skype) and the medium of communication will be English. Total amount of time needed for each session will vary between 30 and 40 minutes depending on the questions and discussion. All sessions will be recorded with the interviewee’s prior permission for later analysis. Records will be deleted once the feedback is transcribed. Description of risks

Faculty of Science and Engineering Ethical Application Form PS 2015/16 Final
14
All of the information will be treated confidentially and data will be anonymous during the collection, storage and publication of research material. Benefits of proposed research The objective of this research is to automate the identification and extraction of annotation-based evidence from multimedia content. In addition to making multimedia data searchable, the Object-based Multimedia Forensic Analysis Tool (OM-FAT) system will enable investigators to perform a variety of forensic analyses (Search Using Annotations, Metadata, Object Matching, Text Similarity and Geo Tracking) to help investigators to understand the relationship between artefacts and thus reduce the time taken to perform an investigation and the cognitive load of the investigator. It enables the investigator to ask higher-level and more abstract questions of the data, then finding answers to the essential questions in the investigation: what, who, why, how, when, and where. Right to withdraw You have the right to withdraw at any time during the interview session. If you are dissatisfied with the way the research is conducted, please contact the principal investigator in the first instance: telephone number [07438750742]. If you feel the problem has not been resolved please contact the secretary to the Faculty of Science and Engineering Human Ethics Committee: Mrs Paula Simson 01752 584503.

Faculty of Science and Engineering Ethical Application Form PS 2015/16 Final
15
SAMPLE CONSENT FORM FOR PARENT/LEGAL GUARDIAN
PLYMOUTH UNIVERSITY
FACULTY OF SCIENCE AND ENGINEERING
Human Ethics Committee Sample Consent Form
CONSENT TO PARTICIPATE IN RESEARCH PROJECT / PRACTICAL STUDY
________________________________________________________________________ Name of Principal Investigator ________________________________________________________________________ Title of Research ________________________________________________________________________ Brief statement of purpose of work ________________________________________________________________________ I am the *parent /legal guardian of ________________________________________ The objectives of this research have been explained to me. I understand that *she/he is free to withdraw from the research at any stage, and ask for *his/her data to be destroyed if I wish. I understand that *his/her anonymity is guaranteed, unless I expressly state otherwise. I understand that the Principal Investigator of this work will have attempted, as far as possible, to avoid any risks, and that safety and health risks will have been separately assessed by appropriate authorities (e.g. under COSSH regulations) Under these circumstances, I agree for him/her to participate in the research. * delete as appropriate Name: ………………………………………. Signature: .....................................…………….. Date: ................………….