BELIEF SYSTEMS AND DURABLE INEQUALITIES
An Experimental Investigation of Indian Caste
Karla Hoff Priyanka Pandey*
World Bank Pennsylvania State University June 2004
Abstract
If discrimination against an historically oppressed social group is dismantled, will the group forge ahead? Based on two experiments, we present evidence that a history of discrimination may have persistent effects on a group’s earnings through its impact on individuals’ expectations. In the first experiment, 321 high-caste and 321 low-caste junior high school male student volunteers in rural India performed the task of solving mazes under economic incentives. There were no caste differences in performance when caste was not publicly revealed, but making caste salient created a large and robust caste gap. When a nonhuman factor influencing rewards (a random draw) was introduced, the caste gap disappeared. To test whether the low caste’s anticipation of prejudicial treatment caused the caste gap, we conducted a second experiment that manipulated the scope for discretion in rewarding performance. When the link between performance and payoffs was purely mechanical, making caste salient did not affect behavior. Instead, it was in the case where there was scope for discretion and judgment in rewarding performance that making caste salient had an effect.
The results suggest that when caste identity is salient, low-caste subjects expect that others will judge them prejudicially. Mistrust undermines motivation. The experimental design enables us to exclude as explanations of the caste gap in performance socioeconomic differences and a lack of self-confidence by low-caste participants.
_ ___
*Corresponding author: Hoff (email: [email protected]). We gratefully thank Muriel Niederle for advice at an early stage of this work. We owe a special debt to Anaka Narayanan and Ram Pratap for their assistance with data collection. We thank members of the MacArthur Foundation Network on the Effects of Inequality, Chris Barrett, Sam Bowles, Jeffrey Carpenter, Jean Drèze, Ernst Fehr, Vijayendra Rao, Michael Walton and, especially, Ken Sokoloff for very helpful comments and discussions. We also thank seminar participants at Boston University, Brookings, Cornell, LSE, the Harvard-MIT development seminar, and the World Bank This work was made possible by a grant from the World Bank-Netherlands Partnership Program, with additional support from the MacArthur Research Network on Inequality and Economic Performance.

2
Outline I. A short background on the caste system II. Experiment 1: Caste and performance
A. Experimental design B. The irrelevance of caste when caste is not announced C. The caste-differentiated impact of the announcement of caste D. Why does the announcement of caste affect behavior?
1. Expectations of bias 2. Self-confidence 3. More evidence on low-caste expectations 4. More evidence on high-caste expectations
E. Overview of the effects of social context on the caste gap F. Is caste just class?
III. Experiment 2: Manipulating the scope for Experimenter discretion IV. Conclusion Appendix. Instructions for the experiment

The economic effects of social inequality linger. Recent dramatic evidence of this fact
has been established in a research program that exploits as a natural experiment variations among
the regions colonized by Europe in the level of inequality at the outset of colonization.1 This
research finds that among the former European colonies, high population density or factor
endowments that made it profitable to import slaves are strong predictors that these countries
(a) were characterized by extreme inequality in past centuries,2 (b) continue to be characterized
by high inequality, and (c) diverged in per capita income from the currently rich former colonies
during the Industrial Revolution. Banerjee and Iyer (2003) argue that in formerly British India,
the establishment by Britain in some areas, but not others, of a land tenure regime that
concentrated power and wealth in a landlord/tax collector class is a causal factor in
underdevelopment today, 150 years later. In explaining the long shadow cast by the past,
economists have emphasized that the past shapes opportunities—for example, the security of
property rights, the level of literacy, and the distribution of wealth—which shape the economy.
In this paper, we propose and test an additional explanation: the past shapes belief
systems that shape individuals’ response to opportunities. Long after the legal barriers to
economic and social advancement by oppressed groups have been abolished—or the conditions
that gave rise to those barriers have changed—the expectations that historical conditions created
may remain and give rise to behaviors that reproduce the effects of those historical barriers.
Similar arguments can be found in Loury (2002) and in the anthropological literature. In
The Anatomy of Racial Inequality, Loury argues that the ideological legacy of slavery in the
United States stigmatizes Blacks and that stigma is a major factor in the persistence of Black-
1 Contributions to this rapidly growing literature include Engerman and Sokoloff (1997, 2002) and Sokoloff and Engerman (2000) on the New World economies, Acemoglu, Johnson and Robinson (2002) on all former European colonies, and Banerjee and Iyer (2003), and Pandey (2004) on India. A survey is Hoff (2003). 2 The basic hypothesis is that factor endowments, broadly defined, imposed constraints on the ability of the colonial powers to set up a highly exploitative form of social organization: if the land-labor ratio was such that almost any settler could make a good living by farming on his own and if, in addition, slavery was unprofitable, then highly inegalitarian institutions could not take root (Engerman and Sokoloff 1997).
2
White inequality. Rao and Walton (2004) review the work of anthropologists who emphasize
that culture may perpetuate inequality within a society as individuals internalize their statistical
chances of success or failure and transform them into aspirations and expectations. However,
there has been no direct experimental test of this claim.3
In this paper, we experimentally test the hypothesis that belief systems that are the legacy
of historical conditions of extreme inequality give rise to expectations of prejudicial treatment
and hence to behaviors that tend to reproduce the inequality. We conduct this test in the context
of a specific example—the Indian caste system. The caste system in India can be described as a
highly stratified social hierarchy in which largely endogamous groups of individuals are invested
with different social status and social meaning. A representative statement is Gupta (2000, p. 19):
“Though there is no way by which those in a caste society can actually distinguish unfailing natural markers of difference, yet they justify caste stratification on the ground that different castes are built of different natural substances” (emphasis added).
This belief system underpins and rationalizes the exploitation of the castes ranked lowest in the
hierarchy. The caste system is one of many examples where, historically, social practices that
created extreme inequality were attributed not to society but to nature or divinity.4
To test the hypothesis that belief systems shape the response to opportunities, we run
controlled experiments. They allow us to measure performance precisely and to exclude any
differences in opportunities among the subjects. We have groups of six male junior high school
students perform the task of solving mazes. Three experimental conditions provide a contrast in
the salience of caste. In the first condition, caste is not publicly revealed. In the second
3 A related experimental literature in psychology (reviewed in Steele, Spencer, and Aronson 2002) documents the tendency of individuals’ behavior to conform to stereotypes; we discuss this work below. A related test and relevant literature review are in Ball et al. (2001), who find that even an overtly arbitrary classification of individuals into groups and hierarchizing of those groups affects earnings because people prefer to trade with individuals with high status. 4Two examples from the 19th century US are illustrative. In holding that Negroes made free under the laws of a state nonetheless did not have the rights of US citizenship, the US Supreme Court argued that the framers of the Constitution considered Negroes an “an inferior class of beings” [Dred Scott v. Sandford, 60 US 393 (1857)]. In excluding women from the legal profession, the Supreme Court held that “divine ordinance, as well as the nature of things” bars women from pursuing careers independent of their husbands: “This is the law of the Creator. And the rules of civil society must be adapted to the general constitution of things.” [83 US 130 (1873), cited in Sunstein, 1995, p. 336, emphasis added].
3
condition, the Experimenter publicly announces the caste of each subject. In the third condition,
groups consist of only high-caste individuals or only low-caste (“Untouchable”) individuals and,
as in the preceding case, the Experimenter publicly announces caste. We find no statistically
significant caste difference in performance when caste is not publicly revealed. However, when
caste is publicly announced, we find a large, statistically significant caste gap in performance,
which is robust to controlling for individuals’ family backgrounds. Making caste salient lowers
the performance of low-caste participants in all treatments in which rewards depend solely on
absolute or relative performance. The effects are large: the announcement of subjects’ caste by
the Experimenter reduces the average number of mazes solved by low-caste subjects by 23
percent.5 Segregation—which implicitly evokes the meaning of outcaste for the low-caste
groups—only deepens the decline in low-caste performance and widens the caste gap.
We interpret these findings as evidence that when caste identities are salient, low-caste
individuals anticipate that they will be judged prejudicially. Mistrust undermines motivation. We
conduct several additional experimental treatments that permit us to reject alternative explanations.
First, we introduce a nonhuman factor (a random draw) to the determination of rewards. If the
explanation of the decline in the low caste’s performance is that making caste salient lowers their
self-confidence, then the introduction of a non-human factor in assigning rewards should not affect
their performance. However, if a belief in Experimenter bias causes the decline, then introducing a
nonhuman factor should attenuate this effect. We find that the effect is not only attenuated but fully
offset.
Second, we use an experimental treatment in which individuals, having become familiar
with one level of difficulty of mazes, are given the opportunity to choose a higher or lower level,
at correspondingly higher or lower piece rates. The psychological literature finds a link between
self-confidence and the difficulty of task that individuals choose (Dweck and Leggett 1988). We
5 Based on 396 subjects in four treatments: Piece Rate, Piece Rate with Caste Announced, Mixed Tournament, and Mixed Tournament with Caste Announced.
4
find that low-caste participants show no less self-confidence than high-caste participants. These
results, and others described below, do not support the hypothesis that the caste gap in
performance can be explained by a caste gap in self-confidence.
The final step in making the case that when caste identity is salient, low-caste individuals
anticipate that their effort will be poorly rewarded, is to consider a setting where the link between
a subject’s reward for performance and others’ actions is severed. We therefore undertake an
additional experiment that manipulates the scope for discretion in rewarding performance. When
asked to accept or refuse a gamble in which the link between performance and reward is purely
mechanical, we find that making caste salient does not affect behavior. Instead, it is in the case
where there is scope for discretion in rewarding performance that caste appears to have an effect.
This suggests that one of the reasons individuals fall so easily into caste roles is that they expect
others to treat them according to these roles.
As we wish to better understand how the caste system affects the behavior of individuals
and how the system has persisted over time, we begin with a brief discussion of the caste system
before turning to the experimental design and the results.
I. A Short Background on the Caste System
The Indian term for caste, jati, specifies a group of people having a specific social rank, claiming
a common origin, and linked to one or more traditional occupations. The caste system is made up
of four distinct social classes (varnas) arranged in hierarchical order:6,7 Brahmins (priests),
Kshatriyas or Thakurs (rulers and warriors), Vaishyas (traders), and Shudras (servile laborers). A
fifth group, the Untouchables, were in the classical Hindu social order too lowly to be counted
within the class system. This group, which is found throughout India, was traditionally relegated
6 There are hundreds of jatis or endogamous groups in each linguistic area of India, which can be character-ized as belonging to one of these four or five groups (also referred to in English by the word “caste”). 7 The earliest expressions of caste can be found in India’s ancient religious scriptures known as the Vedas, which are thought to have been compiled between 1500 BC and 1000 BC. The first of the four Vedas contains a hymn about the first man created, Purusa, who is sacrificed in order to give rise to the four varnas (castes): “The Brahmin was his mouth, his two arms were made the ruler [Kshatriya or Thakur, king and warrior], his two thighs the Vaishya, from his feet the Shudra [servant class] was born.”
5
to occupations associated with “organic waste, filth, ritual pollution, death, evil spirits, or various
menial tasks”(Deliege 1999, p. 25). In the Brahminical deontology of the caste system, the
oppression of the untouchables was justified because castes were ranked by “spiritual merit
accumulated in past existences” (Galanter, 1984, p. 11; see Gupta, pp. 1-7 for the perspective of
the low castes).
Up through the period of British colonialism, the caste system denied Untouchables the
right to own land; to use temples, courts, high-caste wells, and most schools; to work in any but
menial occupations; and to live anywhere except on the outskirts of a village (Galanter, p. 15).
Available evidence suggests a remarkable continuity of these disabilities over millennia. A
Brahmin text dated to the 3rd century AD,8 the Manu Smriti, states that “dwellings of the
Untouchables shall be outside the village; And dogs and donkeys should be their wealth.”9
With independence, India adopted a constitution (in 1950) that abolished the caste system
and established reservations in government and universities for the so-called Scheduled Castes—
castes characterized by “extreme social, education and economic backwardness arising out of the
traditional practice of untouchability.”10 However, the social and economic hierarchy of the caste
system and discrimination against low-caste individuals remain a visible part of the society,
especially in rural India.11 Even in the most egalitarian state of India (Kerala), intercaste disparity
continues to underlie overall disparity in consumption levels (Deshpande 2002). In rural North
India, the setting of our study, it is common to find the Untouchable castes living in a separate
quarter on the outskirts of the village. In a household survey near the site of our experiment, 56
8 MacDonnell, 1962. 9 Manu Smriti, Ch. X, verse 51 Translations in The Laws of Manu (1991) and Ambedkar (1946, p. 39). Many later reports confirm the persistence of untouchability over the centuries. 10 Department of Social Justice and Empowerment, Government of India. Scheduled Caste is the official and perhaps neutral term for the castes traditionally considered untouchable. More socially and politically accepted terms are dalit and harijan (used since the middle of the 20th century). 11 We give two examples of economic discrimination against Scheduled Castes from our household survey near the site of the experiment. Scheduled Caste households were only 37 percent as likely as high-caste households to report that they received the rations to which their ration card entitled them; and a Scheduled Caste child enrolled in a government primary school was only 53 percent as likely as a high-caste child to receive his monthly ration of grain. Formally, both ration programs are universal. See also the survey in Thorat (2002).

6
percent of Scheduled Caste men report that they sit on the ground or remain standing when
visiting a high-caste household. Likewise, 58 percent of high-caste men say that when a
Scheduled Caste person visits their houses, he sits on the ground or remains standing.
II. Experiment 1: Caste and Performance
The objective of the experiment is to determine whether increasing the salience of caste changes the
ability or propensity of low-caste subjects to respond to economic incentives. Gneezy, Niederle, and
Rustichini (2003) showed that mazes are an appropriate task to use to study responses to changes in
incentive schemes. Our experimental design builds on their work.
A Experimental design
The Task. Participants in the experiment were asked to solve mazes in two 15-minute
rounds. The only skill required was the ability to look forward to detect dead ends. In each of the
two rounds, the subject received a packet of 15 mazes to solve.12 The number of mazes solved in
each round is the primary dependent variable. The advantage of having subjects participate in
two rounds is that in addition to across-subject comparisons, we can make within-subject
comparisons of effort levels that have more statistical power and provide a better measure of
effort because we observe the effect of learning over the two rounds. The potential for learning is
large, as 87 percent of the subjects had never before seen mazes, as reported in post-play
interviews.
The Methods. The site of the experiment was a junior high school in a village in central
Uttar Pradesh, India. We recruited from cities in Uttar Pradesh a staff to run the experiments.
Being educated Indian women, the Experimenters were recognizably high caste.
Running an experiment in a village of a poor country presents certain challenges that
influenced the experimental design. Because literacy rates are low even among students, the
12 The mazes can be found at http://games.yahoo.com/games/maze.html. We used mazes of level 2, where 1 = easy and 5 = difficult. The mazes were enlarged to fit A-4 paper.

7
Experimenters gave instructions verbally.13 Because classrooms have no furniture, subjects
solved mazes on paper copies pinned to clipboards. The experiment was almost double-blind—
the Experimenters (except Pandey) did not know the hypotheses of the study, and the graders of
the mazes did not know the castes of the subjects.
Another challenge was to find representative subjects who would feel comfortable in a
classroom setting. Ambady et al. (2001) provide experimental evidence that children internalize
cultural beliefs at an early age. We chose as subjects 6th and 7th-graders. In a household survey
conducted near the site of the experiment, we found that 95 percent of children of the lowest caste
(Chamar) age 11-12 were in school, whereas the fraction of rural children attending high school in
Uttar Pradesh according to the National Sample survey (1995-96) is only 59 percent.14
It was easier to recruit subjects than it would have been in a developed country.15 We
recruited boys from the lowest caste, Chamar,16 and the three highest castes: Thakur, Brahmin, and
Vaishya, which respectively constituted 70, 24, and 6 percent of the high-caste subjects.
At the beginning of an experimental session, the Experimenter gave participants the
show-up fee of 10 rupees (a significant amount compared to the 6 rupee unskilled adult hourly
wage) to drive home the fact that the children were playing for money. (The instructions are in
the Appendix.) She illustrated how to solve a maze by first solving a trivially easy maze on a
large wall poster with an erasable surface, and then solving on another large wall poster a maze of
13 In a post-play literacy test, 40 percent of the low-caste subjects and 28 percent of high-caste obtained a zero out of a possible score of three on a test of the ability to recognize very simple words. 14 The fraction of low-caste children attending high school in Uttar Pradesh would be lower than 59 percent. On the other hand, we are not aware of any selection factors that make the children who were drawn from the 6th and 7th grades unrepresentative of all 11-12 year olds. In particular, in the schools we visited, children appeared to be automatically promoted to the next grade level each year. 15 Throughout most of the period of the experiment, schools were closed. To recruit children, we visited homes each evening to ask parents’ permission to pick up their children the next day to drive them to the nearby junior high school that served as the site of the experiment. We told the parents that participants would be paid for showing up and additional rewards depending on performance. We stated that our purpose was to study children in India. In only a few instances, parents refused to let their children participate, and the reason was that their neighbor was angry that we had not paid him money for driving his child to the junior high school instead of letting us transport the child. 16Chamars are the principal caste of dalits (Untouchables) in the survey area. Current censuses of India distinguish only very broad caste groups, not jatis. In 1971, in Uttar Pradesh Chamars numbered 10.1 million or 55 percent of dalits, and dalits represented 21 percent of the total population.
8
the same difficulty as the ones used in the experiment. The Experimenter allowed participants
five minutes to solve one practice maze. She explained the reward system just before Round 1
and again before Round 2. As a check, she asked each of the six children in an experimental
session a question about the reward system using a hypothetical example of scores. She did not
proceed until the child had answered a question correctly. As soon as Round 1 was over, the
Experimenter collected the packets from the children and explained the reward system in Round
2. Children had no opportunity to communicate verbally with each other between rounds.
The performance and earnings of each participant were revealed only to him. As soon as
the mazes from an experimental session were graded (normally within two hours), the earnings
were distributed in sealed envelopes to the participants, who were asked not to open them until
they returned home. To promote trust, participants received a piece of fruit on entering the room
of the experiment, a “consolation prize” of two rupees if they solved no mazes, and full awards to
all winners who tied in a tournament.17 The rewards for solving mazes were “real money”: Not
counting the show-up fee, the top performers earned 2.2 times a day’s unskilled wages in a
session that lasted about one hour. Average earnings were slightly less than one-half a day’s
wages. Each subject participated in only one session.
The experimental treatments. The focus of the experiment is the way individuals
adapt when they know that the Experimenter knows, and is concerned with, their caste
membership. An aspect of caste that the experiment exploits is that a child’s caste cannot
generally be discerned from his appearance.18 In one condition, the Experimenter read out,
for each subject in turn, the subject’s name, village name, father’s name, grandfather’s name, and
caste. (Last name can indicate caste, but not reliably so.) In the control condition, the
17 Our assistants maintained a peaceful atmosphere in the school courtyard where children waited to participate in the experiment or to be paid. Parents of the children were free to wait there, too. Our assistants distributed box lunches at midday. 18At the site of the experiment, we believe that the appearance of 11- and 12- year old boys does not reveal caste except in particular cases where a child’s clothing and grooming (either very poor or very good) may reveal it.

9
Experimenter did not announce any information about the subjects, and subjects were likely not
to know the caste identity of the other subjects in their group. In forming each group of six
children, to the extent possible we drew one child from each of six different village clusters. In
post-play interviews, low- and high-caste subjects, respectively, reported knowing on average
1.40 and 1.47 of the other five in the group.
Table 1 describes the treatments. Besides varying whether or not we announced caste,
we also varied the incentive systems across treatments. In the first round, all but one of the
treatments used a piece rate incentive of one rupee (2 US cents) per maze. In the second round,
the incentive scheme varied across treatments. Names of the treatments generally refer to the
Round 2 incentive scheme.19 When subjects played Round 1, they did not know that the reward
condition might change in Round 2.
The third independent variable in the experiment was the caste composition of the group.
In all treatments, the groups consisted of six boys. A group consisted of three high-caste and
three low-caste boys in every treatment except Single Caste, in which a group was drawn
exclusively from the low caste or from the high castes.
We conducted the experiment in January and March 2003, using the same staff and site. We
replicated each treatment conducted in January 10 times with different participants;20 in March we
replicated each treatment at least six times.21 On each day, children were randomly assigned to
treatments.22 Overall, we report 107 sessions with 642 participants.
19 The exceptions are treatments 5 and 8. 20 Except Single Caste, where we inadvertently conducted one extra session. 21 The weather was much colder in January and classrooms are unheated. To check for bias arising from differences in experimental conditions between months, we use the p-value of the Mann-Whitney test for rounds in January and March with identical reward and information conditions (i.e., Round 1 of Piece Rate with Caste Announced, Random Winner, Choice, and Mixed Tournament with Caste Announced. The p value is .95, and so we report the pooled results. Using the same method, we also find no significant Experimenter bias. 22 On each day children were recruited from a different but overlapping set of villages. In the working paper version of our paper (Hoff and Pandey 2004, Appendix table 4), we report a robustness check for differences in samples across days. Our results are robust.

10
B. The Irrelevance of Caste When Caste Is Not Announced The treatments in which the Experimenter does not announce caste are a point of comparison for
many of the treatments and so merit our attention first. We consider first a treatment that uses a
piece rate incentive in both rounds. Then we consider a treatment that uses a piece rate incentive
in Round 1 and a tournament incentive in Round 2. We describe these two treatments below.
Piece Rate Treatment. Participants play two identical rounds. At the beginning of the first round, and again at the beginning of the second round, participants are told that their reward is one rupee for every maze they solve. Mixed Tournament. In the first round, participants are told that their reward is one rupee for every maze they solve. In the second round, participants are told that only the participant who solves the most mazes will be paid 6 rupees for every maze he solves. The other participants in the group will not receive any payment for their performance in the second round.
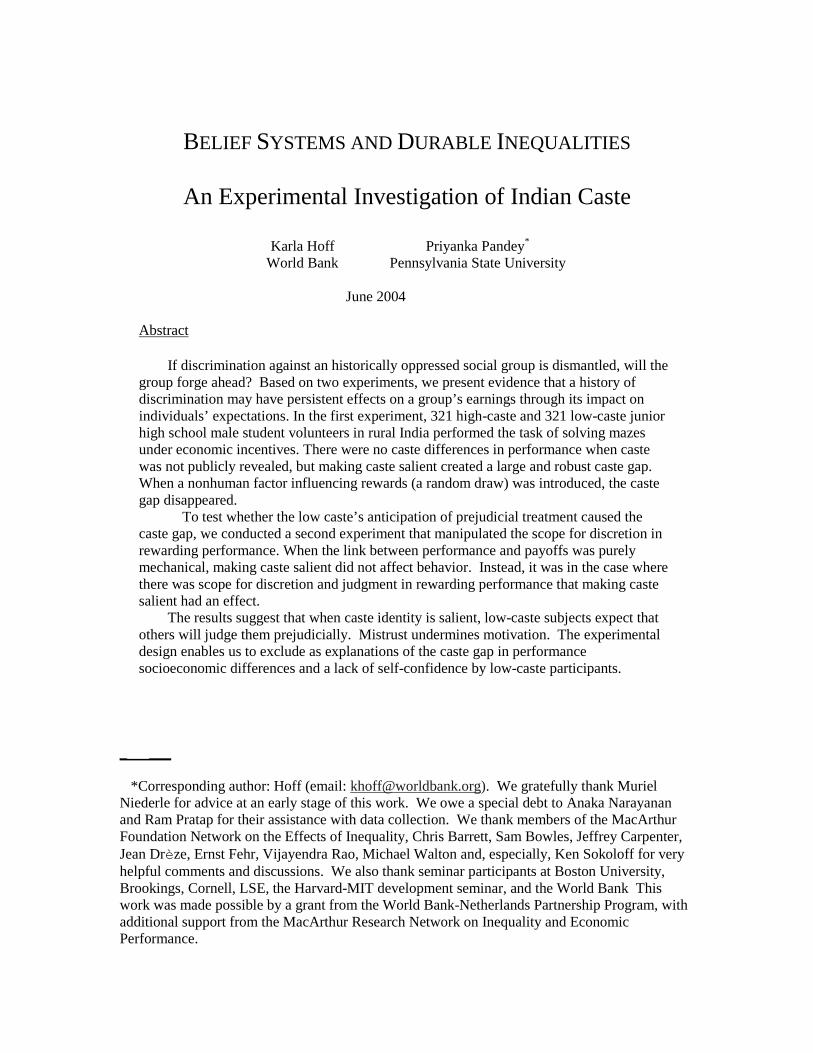
Figure 1 and Table 2 show that caste is irrelevant to performance when caste is not
announced. Under each set of conditions—Round 1 piece rate, Round 2 piece rate, and Round 2
tournament—the cumulative distribution functions for low and high caste track each other. The
distributions for low- and high-caste scores are not significantly different using the two-sided
Mann-Whitney U-test.23 In the Piece Rate treatment, the p-values are .45, .86, and .33,
respectively, for Rounds 1 and 2 and for individual improvement across rounds, denoted by ∆ =
Round 2 - Round 1 score. In Mixed Tournament, the comparable p-values each exceed .50.
As Figure 1 shows, scores improve between rounds. The average improvement in the
Piece Rate treatment is more than one standard deviation of the Round 1 score: the proportionate
increase is 89 percent for low caste and 74 percent for high caste. Since few (13 percent) of
subjects had seen mazes before, it is not surprising that the learning effect is large.
23 Except where otherwise indicated, throughout the paper we compare distributions using the p-value of the two-sided Mann-WhitneyU-test.

11
Figure 1. The effect of learning and competition on performance by low caste and high caste
A comparison of the cumulative distributions of scores under the piece rate and
tournament incentives shows the effect of competition. If we assume that subjects believe they
are ex ante equally likely to win, then the tournament provides the same expected return per maze
as the piece rate incentive, but a higher marginal return to effort because effort now determines
the probability of winning. For the low caste, the improvement in mean performance between
Round 2 piece rate and Round 2 tournament was 23 percent (p-values of the one-sided Mann-
Whitney test are .09 for Round 2 and .15 for ∆). For the high caste, the improvement in mean
performance was 19 percent (p-value is .11 for Round 2 and .05 for ∆). These results
demonstrate that the subjects were motivated by the incentives to solve mazes. 24
The irrelevance of caste to performance when caste is not announced suggests factors that do
not create the caste gap. Low- and high-caste subjects have different backgrounds. Only 14 percent
of low-caste subjects have a mother with at least primary schooling, whereas 42 percent of high-
castes subjects do. Only 50 percent of the low-caste subjects have a father with at least primary
24 We discuss in footnote 30 an additional treatment, Reverse Order, that supports the conclusion that subjects do not solve mazes just for fun, but rather they respond to economic incentives. Ceteris paribus, subjects solve more mazes when marginal returns to effort increase.
0
20
40
60
80
100
Number of mazes solved
Cu
mu
lati
ve p
erce
nt
Low caste, Round 1, piecerate incentive (pooledtreatments)High caste, Round 1, piecerate incentive (pooledtreatments)Low caste, Round 2, PieceRate
High caste, Round 2, PieceRate Low caste, Round 2, MixedTournamentHigh caste, Round 2, MixedTournament
0 1 2 3 4 5 6 7 8 9 10 11 12 13 14 15
12
schooling, whereas 80 percent of the high-castes subjects do. But the difference in parents’
education is not reflected in a caste gap in performance.25 In general, developmental disadvantage
leads to patterns of capacities and dispositions that perpetuate inequalities, but the maze game
appears to be unrelated to caste differences in familial or group-based educational experience.
C. The Caste-Differentiated Impact of the Announcement of Caste
To investigate whether announcing social identity (caste) affects performance, we ran two treatments
in which everything was the same as in the Piece Rate and Mixed Tournament treatments except that
personal information about the six participants in a group was announced in the presence of the other
group members. At the beginning of the session, the Experimenter turned to each participant and
stated his name, village, father’s and grandfather’s names, and caste and asked him to nod if the
information was correct. The Experimenter used the traditional name, Chamar, for the low caste. This
name is still in widespread use in the area where we conducted the experiment.26 The name Chamar is
recorded in the schools’ enrollment books. Villagers, including children, commonly refer to a village
person by the traditional name for his caste: a Chamar caste person is referred to as Chamar and a
Thakur caste person as Thakur.
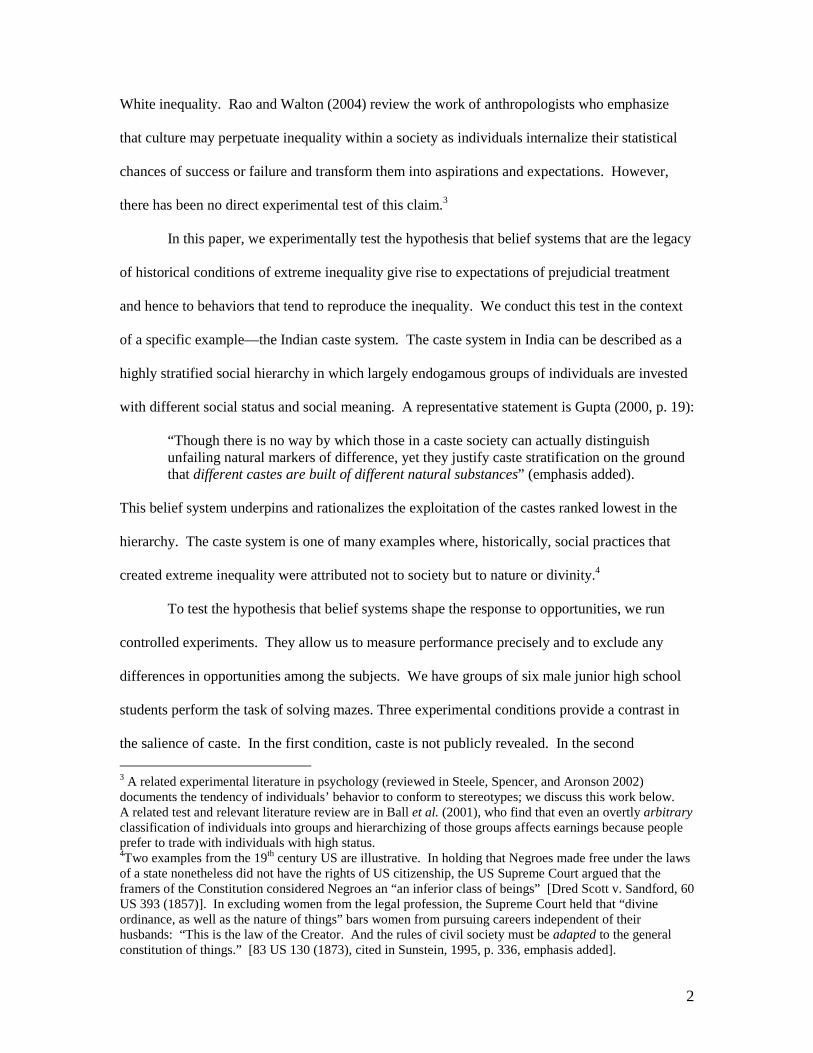
Piece Rate. Figure 2 shows that for the low caste, the announcement of caste is debilitating.
The treatment effect increases the fraction of low-caste individuals who solve at most one maze in
Round 2 from 10.4 percent to 25 percent. Average scores for the low caste fall by 14 percent, 25
percent, and 39 percent in Rounds 1 and 2 and ∆ (p-values .29, .04 , and .01; Table 3).
25This result tallies with our finding in regressions that parents’ education levels are not significant predictors of performance in the maze game, controlling for individual variables (see our working paper, Tables A-5 – A-9). 26 In the 1998-99 Indian National Family Health Survey, households had to self-name their caste (jati) in one of the questions. Among the Scheduled Caste households, while most respondents (including those in Uttar Pradesh) gave their actual caste name (Chamar caste households gave their jati as Chamar), only some used the more generic names harijan or Scheduled Caste, and not one respondent chose th/e term dalit (see Marriott 2003). We believe that our usage of the term Chamar for children of this caste is justified given that it is the commonly used term for this caste in the area. Use of another term like Scheduled Caste or harijan was not feasible for the experiment since these would be inclusive of a number of low castes and moreover, not all 11-12 year olds would have understood what these meant.

13
Figure 2. The effect of the announcement of caste in piece rate treatments, Round 2
In contrast, for the high caste, the announcement improves performance, but not
significantly (p = .83, .44, and. 44, respectively, for Rounds 1, 2, and ∆; Table 3).
The difference between the way low and high castes adapt to the announcement of caste
creates a significant caste gap in Piece Rate with Caste Announced (p = .04, .006, and .03 for
Rounds 1 and 2 and ∆, respectively).27 The caste gap in average performance in Round 2 is 1.83
mazes (average performance is 4.28 mazes for the low caste and 6.11 mazes for the high caste),
compared to -0.18 mazes when caste is not announced (average performance of 5.72 mazes for
the low caste and 5.54 mazes for the high caste). Underlying the caste gap when caste is
announced is the marked effect of the announcement of caste on the low caste’s learning scores
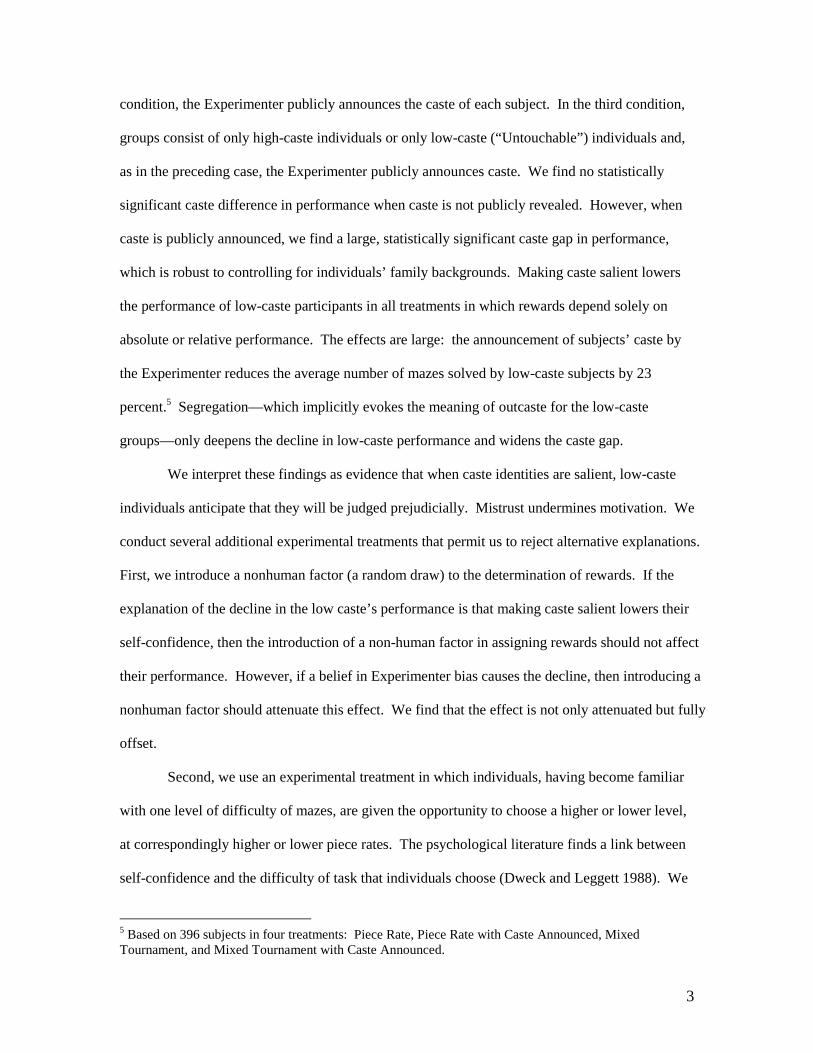
(∆). Figure 3 shows the fraction of low-caste subjects among all participants whose performance
27 Because the first round of six of our experimental treatments use piece rate incentives and mixed-caste groups, we can pool those results to obtain another check on the effect of the announcement of caste under the piece rate scheme. As shown in last four columns of Table 3, the p-value of the test that compares performance by caste in piece rate (no announcement of caste) is .34, and in Piece Rate with Caste Announced is .15. Thus the same basic pattern emerges in the pooled data and the unpooled data, but the caste gap is not significant for the pooled data of Piece Rate with Caste Announced. This is not surprising since the treatment effect on low-caste performance of moving from Piece Rate to Piece Rate with Caste Announced is not significant in Round 1.
0
20
40
60
80
100
0 1 2 3 4 5 6 7 8 9 10 11 12 13 14 15
Number of mazes solved in Round 2
Cum
ulat
ive
perc
ent Low caste, Piece
Rate with CasteAnnouncedLow caste, PieceRate
High caste, PieceRate
High caste, PieceRate with CasteAnnounced

14
improved or worsened by a given amount between rounds. Among subjects whose scores
worsened (∆ ≤ -1), the fraction of the low caste was 30 percent in the control condition, but 60
percent when caste was announced. Among subjects whose scores improved by 5 mazes or more,
the fraction of low-caste subjects was 65 percent in the control condition, but 27 percent when
caste was announced. Thus, the announcement of caste shifted weight in the top tail of the
distribution of learning scores from low- to high-caste subjects, and in the bottom tail from high-
to low-caste subjects. (The relative frequency of ∆ is shown on the right-hand side vertical axis of
the figure.)
Figure 3. Proportion of low caste in each score range of ∆ in piece rate treatments
The experimental results show that social groups with demonstrably similar ability to
perform under piece rate incentives nonetheless perform very differently if social identity is
announced. The debilitating effect on the low caste of the announcement of caste is not due to a
momentary shock, since the effect is statistically significant in Round 2 and not in Round 1. The
0.2
0.3
0.4
0.5
0.6
0.7
≤ -1 0 1-2 3-4 ≥ 5
Change in number of mazes solved between rounds (∆)
Pro
port
ion
of lo
w c
aste
in e
ach
scor
e ra
nge
0
0.2
0.4
0.6
0.8
1
1.2
1.4
1.6
1.8
2
Rel
ativ
e fr
equ
ency
Distribution of ∆ : Piece Rate Piece Rate with Caste Announced
Caste Announced
Caste Not Announced
15
larger effect in Round 2 might be accounted for by two factors. First, because the mazes are
difficult, all the scores in Round 1 are low. The low-caste subjects could be affected, but the
scores are so low that there is not enough variation in Round 1 relative to noise to detect the
effects of the experimental treatment. 28 Second, higher effort should lead to greater learning
about how to solve a maze, and the payoff to learning would tend to be concentrated in Round 2.
Both factors suggest that systematic behavioral differences across caste will be more apparent in
Round 2. Given this and the fact that the experimental conditions in most treatments vary only
across Round 2, for many of the comparisons we make we use of the data for Round 2 and ∆.
Tournaments. We next consider the effect of the announcement of caste when the
incentive scheme is a winner-take-all tournament. For the low caste, the announcement of caste
lowers average performance by 30 percent and 46 percent, respectively, in Round 2 and ∆
(p=.009 and .007; see Table 4). The treatment effect is greater than in the piece rate incentive (25
percent and 39 percent in Round 2 and ∆, respectively). As a result, we do not find that
competition significantly improves low-caste performance compared to piece rate incentives: the
p-value of the one-sided Mann-Whitney test is .23 and .33, respectively, for Round 2 and ∆.
For the high caste, the announcement of caste under the tournament incentive also lowers
performance. Average high-caste performance is reduced by 20 percent and 36 percent,
respectively, in Round 2 and ∆ (p = .04 and .03; Table 4).29 The decrement to performance from
28 The 11- to 12-year-old subjects in our experiment were asked to solve the same level of mazes as the 23-year old engineering students in Israel who were the subjects in the experiment of Gneezy et al. (2003). In the five-minute practice period of each experimental treatment, few subjects succeeded in solving the practice maze. An implication of the argument in the text is that in a treatment in which the salience of caste is particularly strong, the treatment effect should be detectable amid the noise of random error. As we discuss below, this implication is borne out under the condition of caste segregation, where the treatment effect is highly significant in both rounds. 29 In contrast, under the piece rate incentive scheme, the announcement of caste has no significant effect on high-caste performance. This is true not only when we compare each round of Piece Rate with and without the announcement of caste, as shown in Table 3, but also when we compare Round 1 of Mixed Tournament (no announcement), which uses piece rates, with Round 1 of Mixed Tournament with Caste Announced (p-value .49), or, pooling all treatments that use the piece rate incentive in Round 1 (p-value .47 –see Table 3, column 7). All the average performances in Round 2 and ∆ are shown in Figures 4 and 6, and the average performances in Round 1 are shown in our working paper, Table A-3.
16
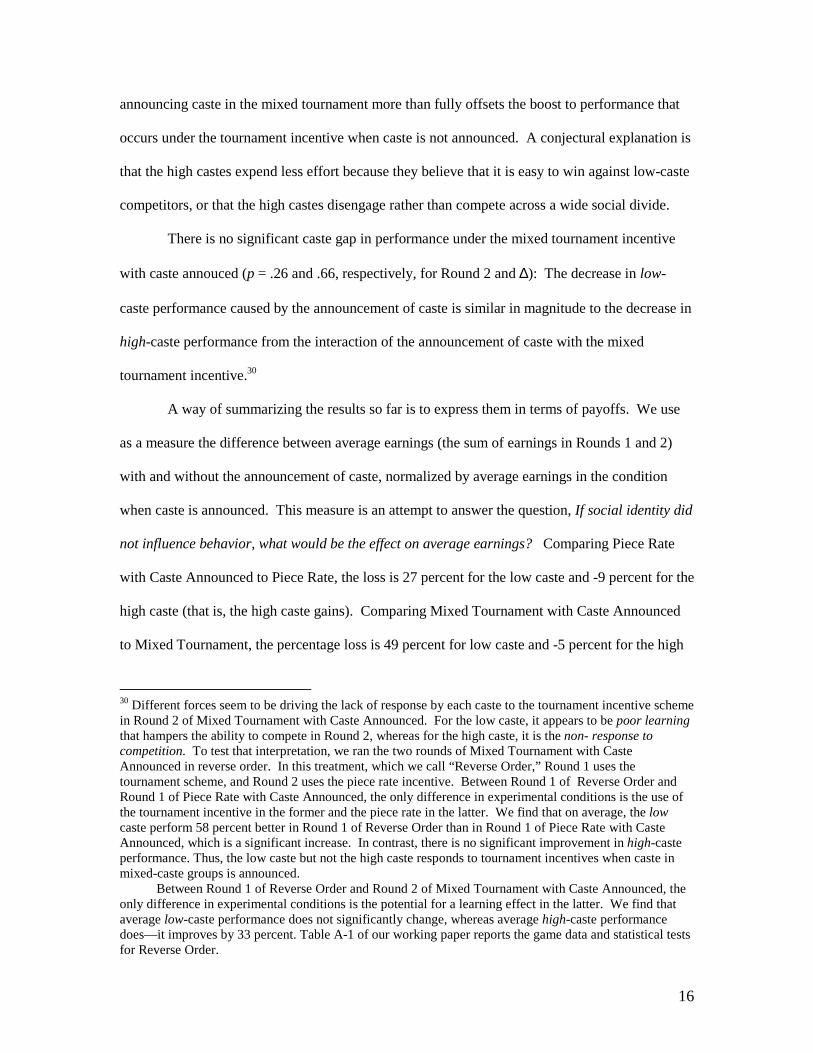
announcing caste in the mixed tournament more than fully offsets the boost to performance that
occurs under the tournament incentive when caste is not announced. A conjectural explanation is
that the high castes expend less effort because they believe that it is easy to win against low-caste
competitors, or that the high castes disengage rather than compete across a wide social divide.
There is no significant caste gap in performance under the mixed tournament incentive
with caste annouced (p = .26 and .66, respectively, for Round 2 and ∆): The decrease in low-
caste performance caused by the announcement of caste is similar in magnitude to the decrease in
high-caste performance from the interaction of the announcement of caste with the mixed
tournament incentive.30
A way of summarizing the results so far is to express them in terms of payoffs. We use
as a measure the difference between average earnings (the sum of earnings in Rounds 1 and 2)
with and without the announcement of caste, normalized by average earnings in the condition
when caste is announced. This measure is an attempt to answer the question, If social identity did
not influence behavior, what would be the effect on average earnings? Comparing Piece Rate
with Caste Announced to Piece Rate, the loss is 27 percent for the low caste and -9 percent for the
high caste (that is, the high caste gains). Comparing Mixed Tournament with Caste Announced
to Mixed Tournament, the percentage loss is 49 percent for low caste and -5 percent for the high
30 Different forces seem to be driving the lack of response by each caste to the tournament incentive scheme in Round 2 of Mixed Tournament with Caste Announced. For the low caste, it appears to be poor learning that hampers the ability to compete in Round 2, whereas for the high caste, it is the non- response to competition. To test that interpretation, we ran the two rounds of Mixed Tournament with Caste Announced in reverse order. In this treatment, which we call “Reverse Order,” Round 1 uses the tournament scheme, and Round 2 uses the piece rate incentive. Between Round 1 of Reverse Order and Round 1 of Piece Rate with Caste Announced, the only difference in experimental conditions is the use of the tournament incentive in the former and the piece rate in the latter. We find that on average, the low caste perform 58 percent better in Round 1 of Reverse Order than in Round 1 of Piece Rate with Caste Announced, which is a significant increase. In contrast, there is no significant improvement in high-caste performance. Thus, the low caste but not the high caste responds to tournament incentives when caste in mixed-caste groups is announced. Between Round 1 of Reverse Order and Round 2 of Mixed Tournament with Caste Announced, the only difference in experimental conditions is the potential for a learning effect in the latter. We find that average low-caste performance does not significantly change, whereas average high-caste performance does—it improves by 33 percent. Table A-1 of our working paper reports the game data and statistical tests for Reverse Order.

17
caste.31 Combining these four treatments, the announcement of caste reduces low-caste earnings
by 42 percent, and increases high-caste earnings by 6.5 percent.
We next investigate why low and high castes adapt differently to the announcement of caste.
D. Why Does the Announcement of Caste Affect Behavior?
The announcement of caste could change the behavior of low-caste individuals through at least
three channels: loss of trust that effort will be rewarded, loss of self-confidence, and the effect on
individuals’ intrinsic valuation of performing well. We will try to disentangle these effects.
1. Expectations of bias
One possible explanation for the decline in low-caste performance when caste is announced is
that knowing that the Experimenter knows and is concerned with their caste, the low-caste
subjects may expect that the promised incentive payments will not be fairly awarded. If they
believe—based on the lessons of history, personal experience, and the ongoing reality of village
life—that the reward system is biased against them, the announcement of caste could be a cue
that causes them to project onto this new situation those existing attitudes. The announcement—
which may have a stronger effect because it is made before five of one’s peers—may call into
play the social training of a low-caste individual, who has learned to expect discriminatory
treatment because he is low caste. Mistrust undermines motivation.
This hypothesis predicts that a change in the reward scheme that introduces a
demonstrably objective factor into the assignment of payoffs and leaves the unbiased expected
payoffs unchanged, will improve the performance of the low caste but not of the high caste. To
test this, we consider a treatment in which, in Round 2, a randomly chosen subject in the group is
paid at the rate of 6 rupees per maze; the others receive nothing.
Random Winner. At the beginning of the session, the Experimenter announces the name, village, father’s and grandfather’s names, and caste of each participant. In the first round, participants are told that their rewards are 1 rupee for every maze they solve. In the second round, participants are told that only one of them (though they do not know
31 In the Mixed Tournament, the Round 2 average payoff for each caste is computed conditioning on the probability of a low- or high-caste person winning the tournament.
18
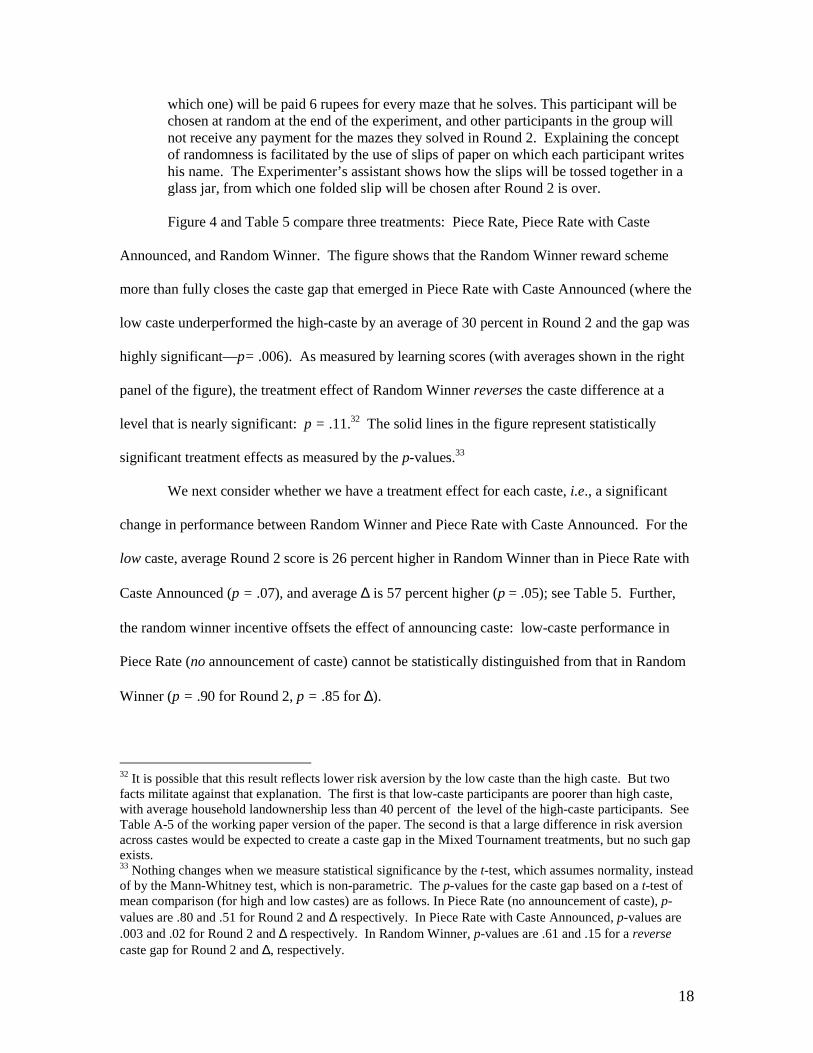
which one) will be paid 6 rupees for every maze that he solves. This participant will be chosen at random at the end of the experiment, and other participants in the group will not receive any payment for the mazes they solved in Round 2. Explaining the concept of randomness is facilitated by the use of slips of paper on which each participant writes his name. The Experimenter’s assistant shows how the slips will be tossed together in a glass jar, from which one folded slip will be chosen after Round 2 is over. Figure 4 and Table 5 compare three treatments: Piece Rate, Piece Rate with Caste
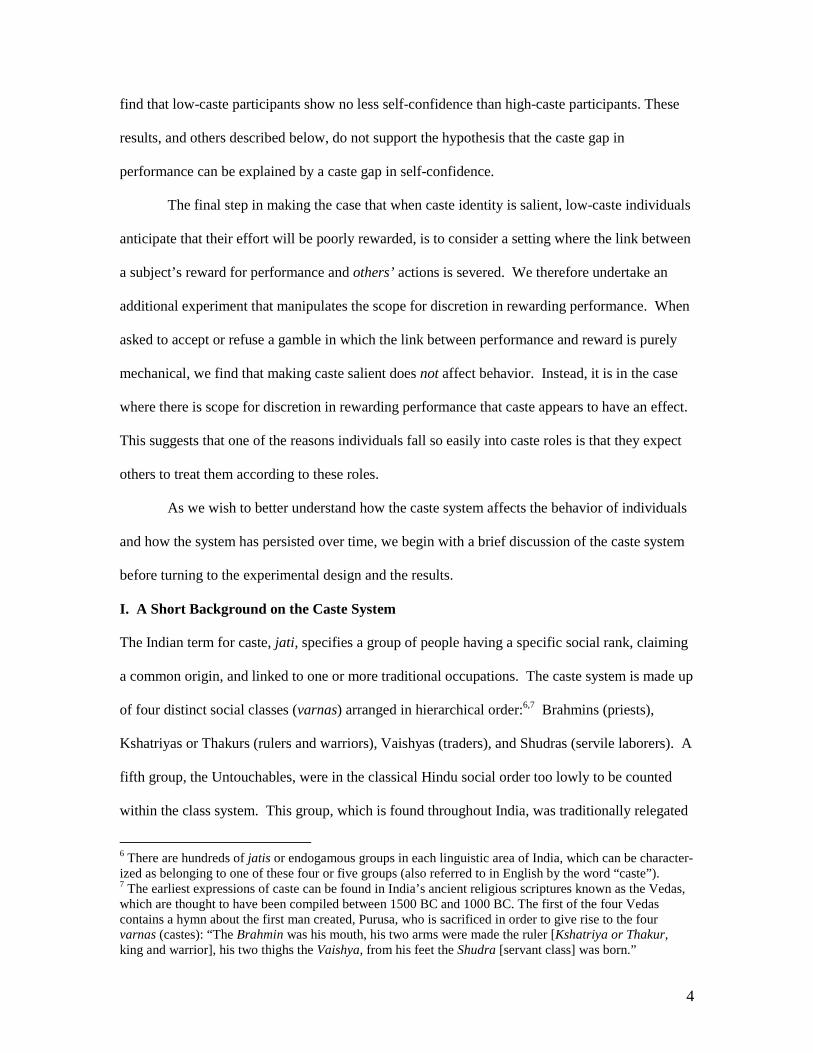
Announced, and Random Winner. The figure shows that the Random Winner reward scheme
more than fully closes the caste gap that emerged in Piece Rate with Caste Announced (where the
low caste underperformed the high-caste by an average of 30 percent in Round 2 and the gap was
highly significant—p= .006). As measured by learning scores (with averages shown in the right
panel of the figure), the treatment effect of Random Winner reverses the caste difference at a
level that is nearly significant: p = .11.32 The solid lines in the figure represent statistically
significant treatment effects as measured by the p-values.33
We next consider whether we have a treatment effect for each caste, i.e., a significant
change in performance between Random Winner and Piece Rate with Caste Announced. For the
low caste, average Round 2 score is 26 percent higher in Random Winner than in Piece Rate with
Caste Announced (p = .07), and average ∆ is 57 percent higher (p = .05); see Table 5. Further,
the random winner incentive offsets the effect of announcing caste: low-caste performance in
Piece Rate (no announcement of caste) cannot be statistically distinguished from that in Random
Winner (p = .90 for Round 2, p = .85 for ∆).
32 It is possible that this result reflects lower risk aversion by the low caste than the high caste. But two facts militate against that explanation. The first is that low-caste participants are poorer than high caste, with average household landownership less than 40 percent of the level of the high-caste participants. See Table A-5 of the working paper version of the paper. The second is that a large difference in risk aversion across castes would be expected to create a caste gap in the Mixed Tournament treatments, but no such gap exists. 33 Nothing changes when we measure statistical significance by the t-test, which assumes normality, instead of by the Mann-Whitney test, which is non-parametric. The p-values for the caste gap based on a t-test of mean comparison (for high and low castes) are as follows. In Piece Rate (no announcement of caste), p-values are .80 and .51 for Round 2 and ∆ respectively. In Piece Rate with Caste Announced, p-values are .003 and .02 for Round 2 and ∆ respectively. In Random Winner, p-values are .61 and .15 for a reverse caste gap for Round 2 and ∆, respectively.

19
Figure 4. Average performance by low caste and high caste in Piece Rate and Random Winner treatments
The high caste adapts very differently to the Random Winner treatment: No significant
differences exist in their performance among the three treatments—Piece Rate, Piece Rate with
Caste Announced, and Random Winner, and average performance is lowest in Random Winner.34
A possible explanation for these results is that individuals adapt according to how they
expect to be perceived and treated, which is to say that they adapt differently depending on their
caste. It is useful to distinguish three impacts of the announcement of caste: (a) It makes caste
identity common knowledge, (b) it shows that the Experimenter is concerned with caste, and (c) it
makes caste very salient because the announcement occurs in the presence of five peers.35 The
34 Comparing the performance of high-caste subjects in Random Winner and in Piece Rate with Caste Announced, the p-value is .25 for Round 2, and .15 for ∆. 35 An important distinction, emphasized in Cohen and Steele (2002), is between mistrust in oneself when social identity is salient, and mistrust in the procedural fairness of others when social identity is public. Given that the low caste is considered in the traditional Hindu caste system as unworthy of rights, this experiment cannot distinguish between these two kinds of mistrust. We cannot reject the view that the Random Winner treatment, compared to Piece Rate with Caste Announced, improves low-caste performance because the even-handed way that the names of low- and high-caste subjects are tossed into the jar from which the winner’s name is to be chosen, changes the self-image of a low-caste participant from that of an unworthy person to that of a worthy person. One would like to undertake this experiment
Average change in number of mazes solved between rounds
0
1
2
3
4
5
6
7
Piece Rate Piece Ratewith CasteAnnounced
RandomWinner
Average number of mazes solved, Round 2
0
1
2
3
4
5
6
7
Piece Rate Piece Ratewith CasteAnnounced
RandomWinner
High caste
Low caste
20
Random Winner treatment preserves the first impact (common knowledge), but mitigates the
second and third. It mitigates Experimenter concern by suggesting that she eschews using caste
as a basis for assigning rewards. She conveys this by bringing into play an overtly unbiased
mechanism for assigning rewards.36 The treatment also mitigates the salience of caste and
perhaps the perception of the social distance between castes because all subjects’ names are
tossed together in a pot from which one name will be chosen.37
2. Self-confidence
Another possible explanation for the decline in low-caste performance when caste is announced is
that increasing the salience of social identity lowers the self-confidence of the low-caste relative to
the high-caste subjects. A reliable result in the psychology literature is that priming an individual for
an aspect of his social identity (race, gender, ethnicity, etc.) associated with a negative stereotype
hurts self-confidence and performance in the domain of the stereotype (Steele, Spencer, and Aronson
2002), while activating a social identity associated with a positive stereotype improves performance
(Shih, Pittinsky, and Ambady, 1999, Ambady et al. 2001). Thus, the joint hypothesis of “stereotype
susceptibility” and the correspondence between caste hierarchy and stereotyped ability ranking
predicts that the announcement of caste would significantly raise high-caste performance. But this
did not happen. Under the piece rate incentive, the effect of announcing caste was not significant for
the high caste (p ≥.40 for Rounds 1 and 2 and ∆; see Table 3). Under the mixed tournament
incentive, the treatment effect on the high caste was significant and negative (p =.04; Table 4).
This joint hypothesis would also predict that the announcement of caste depresses the
self-confidence of the low caste relative to that of the high caste. In the treatment we next
among Hindus living in a community without a recent history or current experience of discrimination against Untouchables and to use Experimenters who were themselves Untouchables. In that setting, if the announcement of caste had no effect on performance, that would provide evidence that distrust of authority figures, not an internalized social identity of unworthiness in the eyes of authority figures, caused the performance differential that we observed in our setting when caste was announced. But this distinction relates to mental processes that are beyond the scope of the present study, in which we tested whether the announcement of caste causes low-caste subjects to anticipate that their efforts will not be fairly rewarded. 37 Bohnet and Frey (1999) show in a different context that even minor changes in social distance affect behavior.
21
describe, we try to measure whether the high and low castes feel differentially competent in
solving mazes. We measure whether low- and high-caste subjects make different decisions when
they are given the choice of the difficulty level at which they will perform the task.
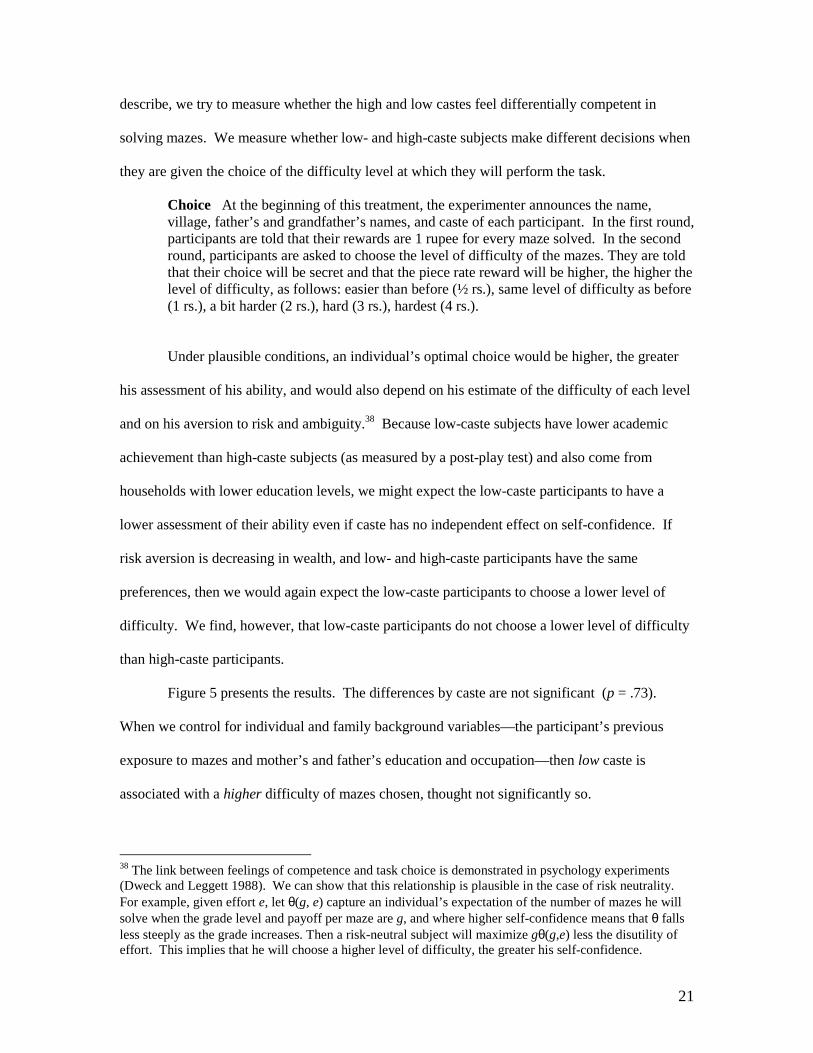
Choice At the beginning of this treatment, the experimenter announces the name, village, father’s and grandfather’s names, and caste of each participant. In the first round, participants are told that their rewards are 1 rupee for every maze solved. In the second round, participants are asked to choose the level of difficulty of the mazes. They are told that their choice will be secret and that the piece rate reward will be higher, the higher the level of difficulty, as follows: easier than before (½ rs.), same level of difficulty as before (1 rs.), a bit harder (2 rs.), hard (3 rs.), hardest (4 rs.).
Under plausible conditions, an individual’s optimal choice would be higher, the greater
his assessment of his ability, and would also depend on his estimate of the difficulty of each level
and on his aversion to risk and ambiguity.38 Because low-caste subjects have lower academic
achievement than high-caste subjects (as measured by a post-play test) and also come from
households with lower education levels, we might expect the low-caste participants to have a
lower assessment of their ability even if caste has no independent effect on self-confidence. If
risk aversion is decreasing in wealth, and low- and high-caste participants have the same
preferences, then we would again expect the low-caste participants to choose a lower level of
difficulty. We find, however, that low-caste participants do not choose a lower level of difficulty
than high-caste participants.
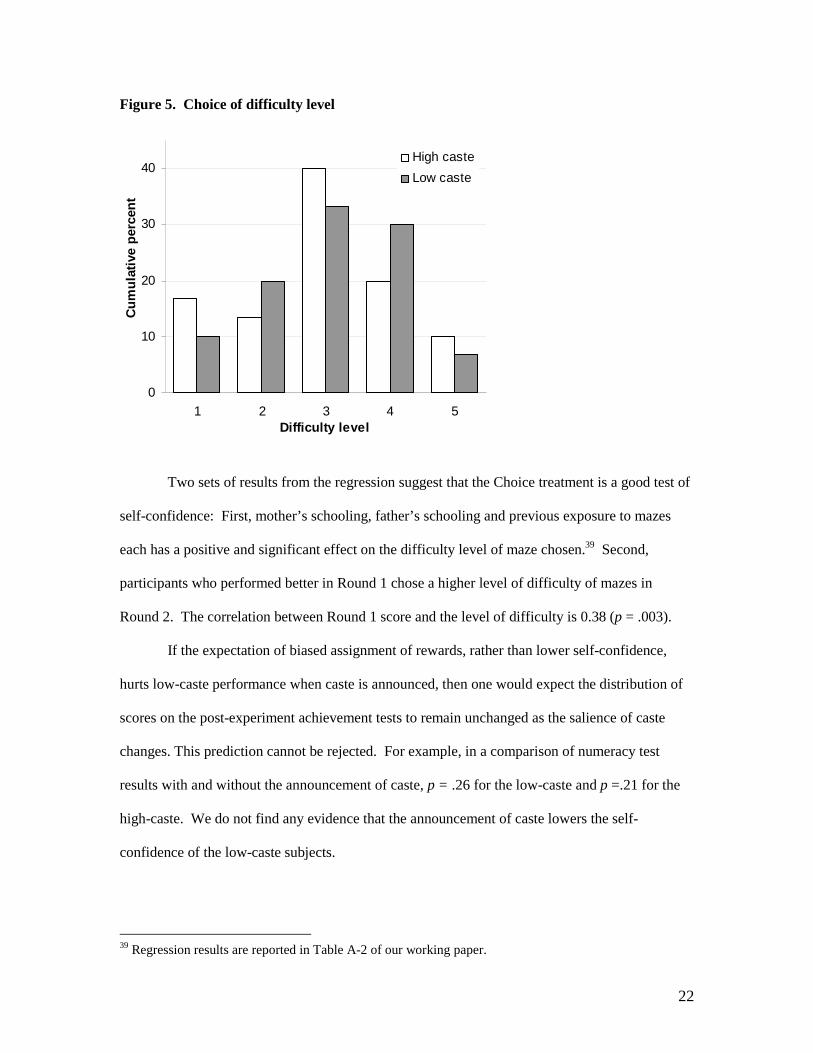
Figure 5 presents the results. The differences by caste are not significant (p = .73).
When we control for individual and family background variables—the participant’s previous
exposure to mazes and mother’s and father’s education and occupation—then low caste is
associated with a higher difficulty of mazes chosen, thought not significantly so.
38 The link between feelings of competence and task choice is demonstrated in psychology experiments (Dweck and Leggett 1988). We can show that this relationship is plausible in the case of risk neutrality. For example, given effort e, let θ(g, e) capture an individual’s expectation of the number of mazes he will solve when the grade level and payoff per maze are g, and where higher self-confidence means that θ falls less steeply as the grade increases. Then a risk-neutral subject will maximize gθ(g,e) less the disutility of effort. This implies that he will choose a higher level of difficulty, the greater his self-confidence.
22
Figure 5. Choice of difficulty level
Two sets of results from the regression suggest that the Choice treatment is a good test of
self-confidence: First, mother’s schooling, father’s schooling and previous exposure to mazes
each has a positive and significant effect on the difficulty level of maze chosen.39 Second,
participants who performed better in Round 1 chose a higher level of difficulty of mazes in
Round 2. The correlation between Round 1 score and the level of difficulty is 0.38 (p = .003).
If the expectation of biased assignment of rewards, rather than lower self-confidence,
hurts low-caste performance when caste is announced, then one would expect the distribution of
scores on the post-experiment achievement tests to remain unchanged as the salience of caste
changes. This prediction cannot be rejected. For example, in a comparison of numeracy test
results with and without the announcement of caste, p = .26 for the low-caste and p =.21 for the
high-caste. We do not find any evidence that the announcement of caste lowers the self-
confidence of the low-caste subjects.
39 Regression results are reported in Table A-2 of our working paper.
0
10
20
30
40
1 2 3 4 5Difficulty level
Cu
mu
lati
ve p
erce
nt
High caste
Low caste

23
3. More evidence on low-caste expectations
The announcement of caste does not raise the issue of the symbolic meaning of caste. If the
announcement of caste lowers the performance of the low caste because they expected to be
treated prejudicially, then we might expect that evoking the historical meaning of caste would
heighten that expectation and exacerbate the decline. We consider a final treatment that implicitly
raises the stigma of untouchability by the way it groups subjects. The Single Caste treatment
replicates the experimental conditions of Mixed Tournament with Caste Announced, except now
groups are composed of either six high-caste or six-low caste individuals. The probability of a
combination of six low-caste (respectively, high-caste) children from a random draw of six
subjects from all boys enrolled in grades six and seven in schools around the site of the study is
.0013 (.00003). Thus the participants in the Single Caste treatment would almost certainly have
known that the caste grouping was deliberate. Given that, the Single Caste treatment would
implicitly evoke the meaning of outcaste for the low-caste groups.
Table 6 shows that segregation deepens the decline in low-caste performance and widens
the caste gap. For the first time, the treatment is strong enough that the effect is significant in
Round 1 as well as Round 2. In Round 1 (piece rate), the average number of mazes solved by the
low caste falls from 3.17 in the pooled trials when caste is not announced (see Table 2), to 2.87 in
the pooled trials when caste is announced, to 2.05 under the segregated condition. In Round 2
(tournament), the average number of mazes solved falls from 6.8 when caste is not announced, to
4.75 mazes when caste is announced, to 3.05 mazes in the segregated condition. Comparing the
segregated and the no-announcement treatments, p < .001 for Rounds 1, 2 and ∆. Comparing the
segregated and the announcement treatments, p ≤ .06 for Rounds 1, 2 and ∆.
Figure 6 shows the caste gap in average performance in tournaments in the maze game.
When caste is not announced, there is no caste gap (p= .72). When caste is announced, the caste
gap opens slightly but is not significant (p = .26). When castes are segregated and caste is

24
announced, the gap widens and becomes highly significant (p= .02).40 We conjecture that the
separation of high and low castes influences expectations because expectations depend on the
social meanings that the context conveys (Tversky and Kahneman 1986).
Figure 6. Average performance by low caste and high caste in tournaments
4. More evidence on high-caste expectations
So far our results suggest that the expectation of bias is important. This raises the question to
what extent a theory of bias can account for all the patterns observed in the experiment. If
individuals believe that the high caste is rewarded more for effort than the low caste, then the
prediction would be that increasing the salience of caste, ceteris paribus, would tend to increase,
and would never lower, the performance of high-caste subjects. But an irony uncovered by this 40 The statistical significance (or lack of significance) of the caste gap is robust using the t-test, which assumes normality, instead of the non-parametric Mann-Whitney tests. The p-values for the caste gap based on a t-test of mean comparison (for high and low castes) are as follows. In Mixed Tournament (no announcement of caste), p-values are .97 and .79 for Round 2 and ∆ respectively. In Single Caste, p-values are .01 and .005 for Round 2 and ∆ respectively. In Mixed Tournament with Caste Announced, p-values are .24 and .59 for Round 2 and ∆, respectively.
Average number of mazes solved, Round 2
0
1
2
3
4
5
6
7
8
MixedTournament
MixedTournamentwith CasteAnnounced
SingleCaste
High caste
Low caste
Average change in number of mazes solved between rounds (∆)
0
1
2
3
4
5
6
7
8
MixedTournament
MixedTournamentwith CasteAnnounced
Single Caste
25
experiment is that increasing the salience of caste can actually lower high-caste performance. In
both rounds under the Segregated condition, high-caste performance declines significantly
compared to the condition when caste is not announced (p = .01 for Round 1 and p= .02 for
Round 2; see Table 6).41 A conjectural explanation is that segregation, by increasing the salience
of caste, changes the extent to which individuals expect reward to be contingent on what they do
(effort) rather than on the social status they have (caste).42
E. Overview of the effects of social context on the caste gap
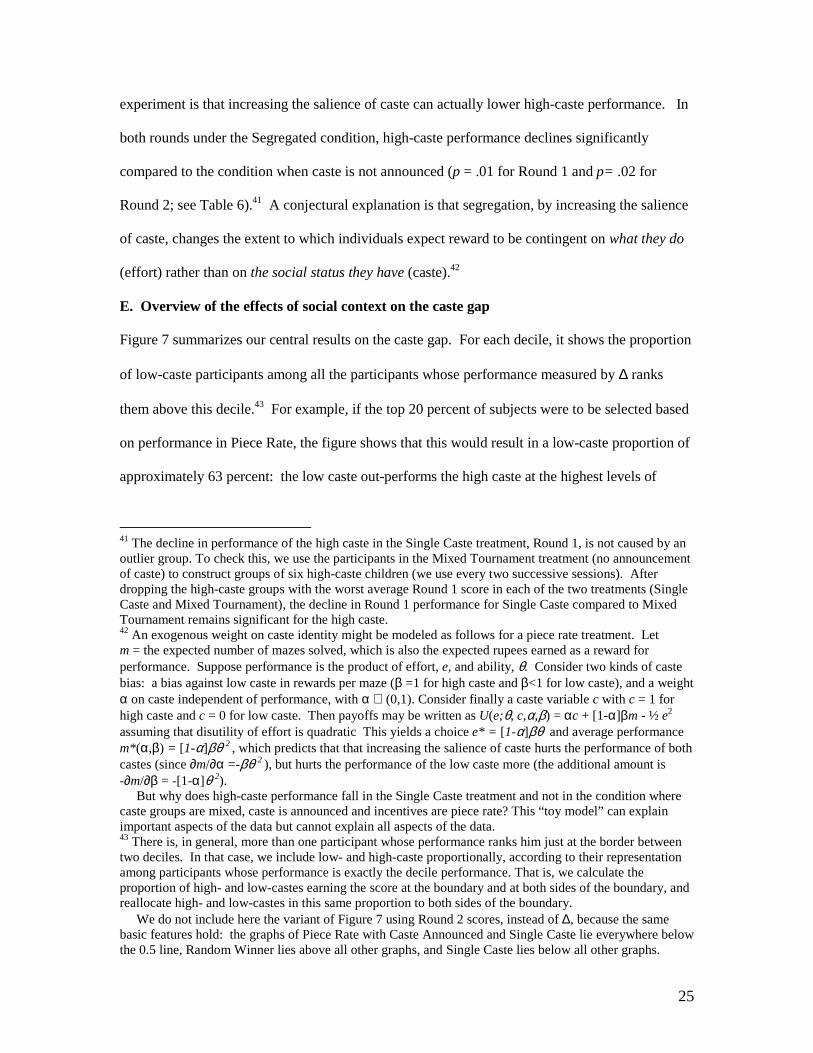
Figure 7 summarizes our central results on the caste gap. For each decile, it shows the proportion
of low-caste participants among all the participants whose performance measured by ∆ ranks
them above this decile.43 For example, if the top 20 percent of subjects were to be selected based
on performance in Piece Rate, the figure shows that this would result in a low-caste proportion of
approximately 63 percent: the low caste out-performs the high caste at the highest levels of
41 The decline in performance of the high caste in the Single Caste treatment, Round 1, is not caused by an outlier group. To check this, we use the participants in the Mixed Tournament treatment (no announcement of caste) to construct groups of six high-caste children (we use every two successive sessions). After dropping the high-caste groups with the worst average Round 1 score in each of the two treatments (Single Caste and Mixed Tournament), the decline in Round 1 performance for Single Caste compared to Mixed Tournament remains significant for the high caste. 42 An exogenous weight on caste identity might be modeled as follows for a piece rate treatment. Let m = the expected number of mazes solved, which is also the expected rupees earned as a reward for performance. Suppose performance is the product of effort, e, and ability, θ. Consider two kinds of caste bias: a bias against low caste in rewards per maze (β =1 for high caste and β<1 for low caste), and a weight α on caste independent of performance, with α ∈ (0,1). Consider finally a caste variable c with c = 1 for high caste and c = 0 for low caste. Then payoffs may be written as U(e;θ, c,α,β) = αc + [1-α]βm - ½ e2 assuming that disutility of effort is quadratic This yields a choice e* = [1-α]βθ and average performance m*(α,β) = [1-α]βθ 2 , which predicts that that increasing the salience of caste hurts the performance of both castes (since ∂m/∂α =-βθ 2 ), but hurts the performance of the low caste more (the additional amount is -∂m/∂β = -[1-α]θ 2). But why does high-caste performance fall in the Single Caste treatment and not in the condition where caste groups are mixed, caste is announced and incentives are piece rate? This “toy model” can explain important aspects of the data but cannot explain all aspects of the data. 43 There is, in general, more than one participant whose performance ranks him just at the border between two deciles. In that case, we include low- and high-caste proportionally, according to their representation among participants whose performance is exactly the decile performance. That is, we calculate the proportion of high- and low-castes earning the score at the boundary and at both sides of the boundary, and reallocate high- and low-castes in this same proportion to both sides of the boundary. We do not include here the variant of Figure 7 using Round 2 scores, instead of ∆, because the same basic features hold: the graphs of Piece Rate with Caste Announced and Single Caste lie everywhere below the 0.5 line, Random Winner lies above all other graphs, and Single Caste lies below all other graphs.
26
performance. But the comparable figure for Piece Rate with Caste Announced is 37 percent; in
that social context, the low caste is starkly underrepresented at the highest levels of performance.
If there were no caste differences in performance, all graphs would be at the 50 percent line in
Figure 7. The graphs of the two treatments where caste is not announced are at or near the 50 percent
line except for the top performers, where the graphs are above the line for the top-scoring deciles,
indicating that the low caste is overrepresented among the best performers. The 50 percent line
Figure 7. Cumulative proportion of low caste in each decile in Round 2-Round 1 scores
divides the six graphs in Figure 7 fairly cleanly into two groups: the treatments where caste is not
announced, together with Random Winner, are in the top half; the treatments where caste is
announced, except for Random Winner, are in the lower half. These results are highly robust.44
44 We use information obtained in post-experiment questionnaires to check whether differences in the subjects assigned to different treatments could account for our results. A possible source of such differences is that on any given day, we undertook at most three treatments, and we drew the sample of children on each day from a different but overlapping set of villages. Pooling all treatments together except
0
0.1
0.2
0.3
0.4
0.5
0.6
0.7
1 2 3 4 5 6 7 8 9 10Decile (1=top decile)
Cu
mu
lati
ve p
rop
ort
ion
of
low
cas
te
Random WinnerPiece Rate Mixed Tournament Mixed Tournament with Caste Announced Piece Rate with Caste AnnouncedSingle Caste
27
Single Caste gives the low caste the lowest representation among all performance deciles,
whereas randomness in the determination of the winner gives the low caste the highest
representation. If the top 30 percent of subjects were to be selected based on performance in
Single Caste, this would result in a low-caste representation of .33; the comparable figure for
Random Winner is .66. As social context and incentive schemes change, subjects adapt
dramatically differently depending on their caste.
F. Is Caste Just Class?
Compared to the high caste, low-caste subjects are less likely to have educated parents, and their
parents own only 39 percent as much land on average.45 A low-caste individual’s behavior might
change as the education and wealth of his family rise if such an individual is viewed differently
by others and is freed from rural subordination. We use a multivariate regression to try to
distinguish caste from class (see Tables A-6 – A-9 of our working paper). Within each treatment,
performance in Round 1, Round 2 and ∆ is regressed on caste, controlling for the education and
occupation of the father and mother, the subject’s previous exposure to mazes, and the number of
other subjects he knows in the group. If the caste gap diminishes, then some of the “caste effect”
Choice, we create a dummy for each treatment. We regress performance on treatment dummies, ti, interacted with high and low caste respectively, controlling for child characteristics in vector Zij , where treatment is denoted by i and child by j. The variable highij is a dummy equal to 1 if child j in treatment i is high caste and 0 otherwise. The variable lowij is a dummy equal to 1 if child j in treatment i is low caste and 0 otherwise. Thus the coefficients, bhi and bli , on the dummy for each treatment i are allowed to differ by caste. Zij includes parents’ education, parents’ occupation, the child’s prior exposure to mazes, and the number of children known to each subject in his group.
Under the assumption of normality, we estimate OLS regressions of the following equation for each of the dependent variables—Round 1 and 2 scores and ∆:
Maze scoreij = a + bhi ti*highij + bli ti*lowij + c*Zij + errorij
If caste, rather than other observable differences, statistically accounts for a caste gap in performance, then the coefficients on the particular treatment dummy, ti, interacted with high (bhi) and low caste (bli) will be significantly different from each other.
We find that all of the caste gaps reported above are significant and, in addition, a significant caste gap emerges in Mixed Tournament with Caste Announced, Round 2. Thus, in every treatment where caste is announced except Random Winner, high caste significantly outperforms low caste. Regression results are reported in our working paper, Table A-4. 45 However, the standard deviation of landholdings is larger for the high caste—2.29 compared to 1.10 for low caste. The correlation between land ownership and caste is .43.

28
should be interpreted as a “class effect.” There is no systematic decrease in the size of the caste
gap when one controls for individuals’ backgrounds. In Piece Rate with Caste Announced, the
caste gap estimated in the regression is 1.91 (Round 2) and .97 (∆), compared to a raw caste gap
of 1.83 (Round 2) and 1.02 (∆). For Single Caste, the estimated gap is 2.07 (Round 2) and 1.34
(∆), compared to a raw caste gap of 1.78 (Round 2) and 1.43 (∆). These regression coefficients
are all significant.46
Because of the difficulty of obtaining information on land ownership, the sample size is
much smaller when we control for land. Yet the caste gap remains significant in Round 2 of all
treatments with the announcement of caste, and is also significant in Round 1 of Single Caste.47
We obtain for the first time a significant caste gap in Mixed Tournament with Caste Announced.
Further, the reverse caste gap in Round 2 of Piece Rate (no announcement of caste) becomes
larger and significant. The evidence suggests that the effect of caste is not an artifact of class
differences between low and high castes.
III. Experiment 2: Manipulating the scope for Experimenter discretion
Given that our main conjecture revolves around expectations, we conducted a follow-up
experiment that manipulated the scope for discretion in rewarding performance. We returned to
the site of the experiment in March 2004 and ran another set of treatments using 6th and 7th grade
boys who had not participated in the earlier experiment.
The task is to solve a puzzle based on the game Rush Hour-Traffic Jam. On a 12-inch by
12-inch wooden board, a player solves the puzzle by moving wooden cars and trucks in such as
46 Regression analysis of Rounds 1 and 2 are pooled and standard errors are adjusted for clustering by subjects. It is possible that parents’ education is measured with error, so that the effect of parents’ education is underestimated. Parents’ occupations are less likely to be measured with error since 11-12 year-olds will know what their parents do. The measurement error in land is unlikely to be correlated with caste or to be large, as we collected the land data independently and checked questionable entries with the Land Records administrator. 47 Controlling for land ownership and other individual and household characteristics, it is estimated that high caste boosts Round 1 performance by 1.63 mazes in Round 1 and 3.05 mazes in Round 2, compared to a raw caste gap of .35 mazes in Round 1 and 1.78 in Round 2.

29
way that he clears path to the exit for his own car. The construction of the board and the cars and
trucks makes it impossible to lift them up and off the board; they can only be moved forward and
backward along a set of tracks. In the first experimental condition, we eliminated the scope for
Experimenter discretion in rewarding subjects by making the link between performance and
reward purely mechanical. In the second condition, we restored the scope for judgment and hence
bias. We describe these two treatments below.
No scope for bias (game board with frame). The success payoff is tucked into the underside of the player’s car and is visible through the dashboard. A frame on the game board prevents vehicles from moving off the track except at the designated exit. A player who solves the puzzle—by creating a path for his car to the exit—obtains his success payoff by taking it from the underside of the car. Scope for bias (game board without frame). The success payoff is not in the player’s car and the game board has no frame, so that nothing prevents the player from sliding vehicles off the tracks and trivially clearing a path to the exit for his car. The subject is told the following:
All around the roads are wheat fields. To solve the puzzle, you have to get the red car out of the jam by moving cars in such a way that no car comes off the road. Otherwise the fields will be damaged…The person in the room who will give you the puzzle will watch you. If he thinks you have solved the puzzle the right way, he will give you 20 rupees. If he thinks you have not solved the puzzle the right way, he will give you 1 rupee.
Following the methodology in the maze game experiment, we used three experimental
conditions to provide a contrast in the salience of caste: In the first condition, a session included
three low caste and three high caste boys, but caste was not publicly announced. The second
condition was the same as the first except that the Experimenter publicly announced the caste of
each of the six subjects at the beginning of the session. The third condition was the same as the
second except that the group was drawn from only the low caste or only the high castes.
We replicated each treatment 10 times. Thus, 60 individuals (30 low caste and 30 high
caste) participated in each treatment. We formed the six-person groups by taking one subject
from each of the six randomly selected villages where we had recruited subjects for a given day’s
trials. In post-play interviews, we found that none of the subjects knew any of the other
participants in his session. Each day of the experiment we recruited subjects from a different set

30
of villages.
A session lasted approximately 25 minutes. One of us (Pandey) was the sole experimenter.
She showed the subjects how to solve a puzzle and allowed subjects eight minutes to practice.
Then she explained that they would be asked whether they wished to accept the following
gamble: to try to solve a new puzzle for a success payoff of 20 rupees and a failure payoff of 1
rupee. If they refused the gamble, they would receive 10 rupees. To check the subjects’
understanding, she asked each subject a question about the reward system using a hypothetical
example of accepting the gamble and winning, accepting it and losing, or rejecting it. She did not
proceed until the subject had answered a question correctly. Then the subjects were asked to
form a line and each individually entered a separate area in which he privately conveyed his
decision to the Experimenter. If he accepted the gamble, then later he was escorted to a room
where he played the Traffic Jam game.
The data from the experiment are each subject’s decision to accept or reject the gamble.
Although a subject’s movements after he conveyed his decision would reveal to the other
children in a session his choice, the subjects did not know it at the time they made their decision.
(Before participating in the experiment, all subjects stayed in a separate classroom where a
monitor entertained them.)
Results. Figure 8 shows the proportion of subjects, by caste, who refused the gamble. The
left-hand panel shows that when the link between performance and rewards is mechanical, no
significant caste gap exists regardless of the salience of caste. The p-values in a two-sample test
of proportion for low caste compared to high caste are .74, .16, and .64, respectively, for Caste
Not Announced, Caste Announced, and Caste Announced and Segregated.

31
Figure 8. Proportion who refuse the gamble in the Traffic Jam game
The right-hand panel reports results for the “game board without frame.” Removing the
frame changes the game in two ways. It makes the game more difficult because a player could
easily inadvertently push the vehicles off the board as he moved them around; in that case, he
would lose the game. Second, removing the frame creates scope for discretion in awarding
payoffs. We find that removing the frame consistently raises the proportion of both castes who
refuse the gamble, but the effect is greater for the low caste. When caste is very salient (Caste
Announced and Segregated), removing the frame raises the proportion of the low caste that
rejects the game from 10 percent to 67 percent. For the high caste, the proportion rises from 7
percent to only 30 percent. The p-value of the rejection proportion of the low caste compared to
the high caste is .004. In the other treatments using the game board without a frame, caste is less
salient and the caste gap is not significant (p- value .20 for Caste Not Announced and .79 for
Caste Announced).
To recapitulate the results, when the link between performance and payoffs is
mechanical, making caste salient does not affect behavior. Instead, it is in the case where there is
No scope for bias
(game board with frame)
0
0.2
0.4
0.6
0.8
Caste notannounced
Casteannounced
Caste announced and segregated
High casteLow casteLow caste
Frac
tion
that
ref
uses
the
gam
ble
0.2
0.4
0.6
0.8
Scope for bias
(game board without frame)
0Caste not
announcedCaste
announcedCaste announced
and segregated
0.2
0.4
0.6
0.8
Scope for bias
(game board without frame)
0Caste not
announcedCaste
announcedCaste announced
and segregated
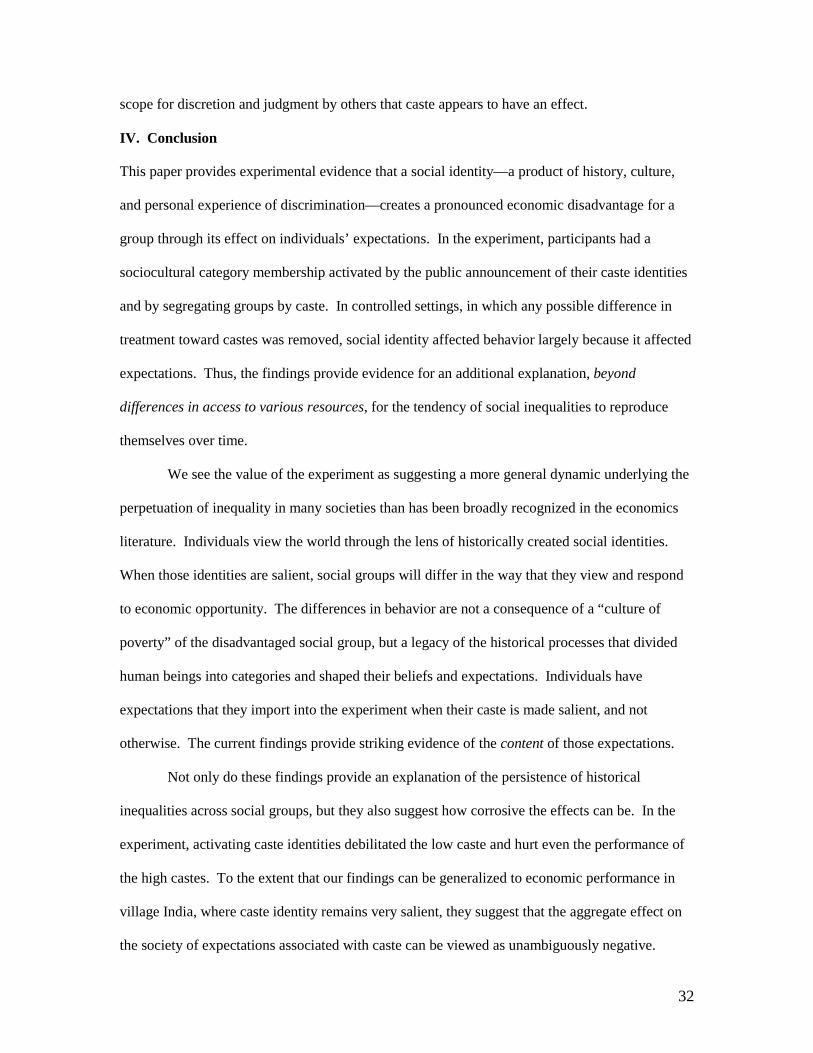
32
scope for discretion and judgment by others that caste appears to have an effect.
IV. Conclusion
This paper provides experimental evidence that a social identity—a product of history, culture,
and personal experience of discrimination—creates a pronounced economic disadvantage for a
group through its effect on individuals’ expectations. In the experiment, participants had a
sociocultural category membership activated by the public announcement of their caste identities
and by segregating groups by caste. In controlled settings, in which any possible difference in
treatment toward castes was removed, social identity affected behavior largely because it affected
expectations. Thus, the findings provide evidence for an additional explanation, beyond
differences in access to various resources, for the tendency of social inequalities to reproduce
themselves over time.
We see the value of the experiment as suggesting a more general dynamic underlying the
perpetuation of inequality in many societies than has been broadly recognized in the economics
literature. Individuals view the world through the lens of historically created social identities.
When those identities are salient, social groups will differ in the way that they view and respond
to economic opportunity. The differences in behavior are not a consequence of a “culture of
poverty” of the disadvantaged social group, but a legacy of the historical processes that divided
human beings into categories and shaped their beliefs and expectations. Individuals have
expectations that they import into the experiment when their caste is made salient, and not
otherwise. The current findings provide striking evidence of the content of those expectations.
Not only do these findings provide an explanation of the persistence of historical
inequalities across social groups, but they also suggest how corrosive the effects can be. In the
experiment, activating caste identities debilitated the low caste and hurt even the performance of
the high castes. To the extent that our findings can be generalized to economic performance in
village India, where caste identity remains very salient, they suggest that the aggregate effect on
the society of expectations associated with caste can be viewed as unambiguously negative.
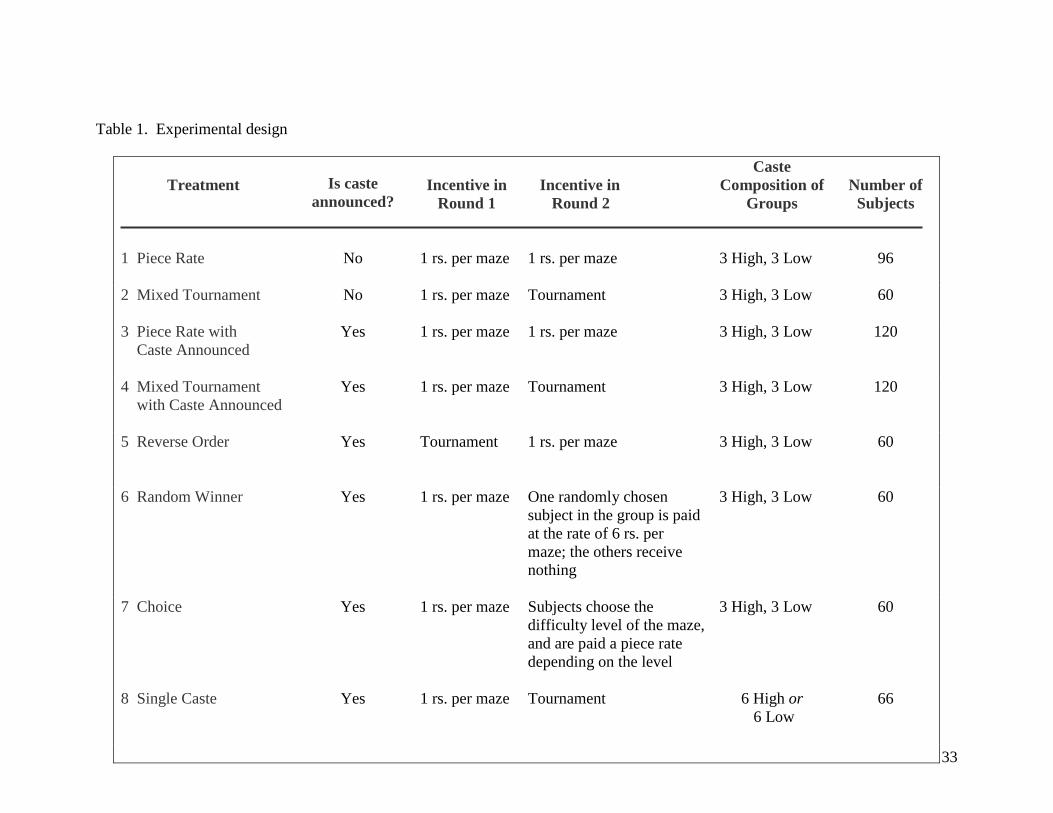
33
Table 1. Experimental design
Treatment
Is caste
announced?
Incentive in
Round 1
Incentive in Round 2
Caste Composition of
Groups
Number of
Subjects
1 Piece Rate
No 1 rs. per maze 1 rs. per maze 3 High, 3 Low 96
2 Mixed Tournament
No 1 rs. per maze Tournament 3 High, 3 Low 60
3 Piece Rate with Caste Announced
Yes 1 rs. per maze 1 rs. per maze 3 High, 3 Low 120
4 Mixed Tournament with Caste Announced
Yes 1 rs. per maze Tournament 3 High, 3 Low 120
5 Reverse Order
Yes Tournament 1 rs. per maze 3 High, 3 Low 60
6 Random Winner Yes 1 rs. per maze One randomly chosen
subject in the group is paid at the rate of 6 rs. per maze; the others receive nothing
3 High, 3 Low 60
7 Choice Yes 1 rs. per maze Subjects choose the difficulty level of the maze, and are paid a piece rate depending on the level
3 High, 3 Low 60
8 Single Caste
Yes 1 rs. per maze Tournament 6 High or 6 Low
66
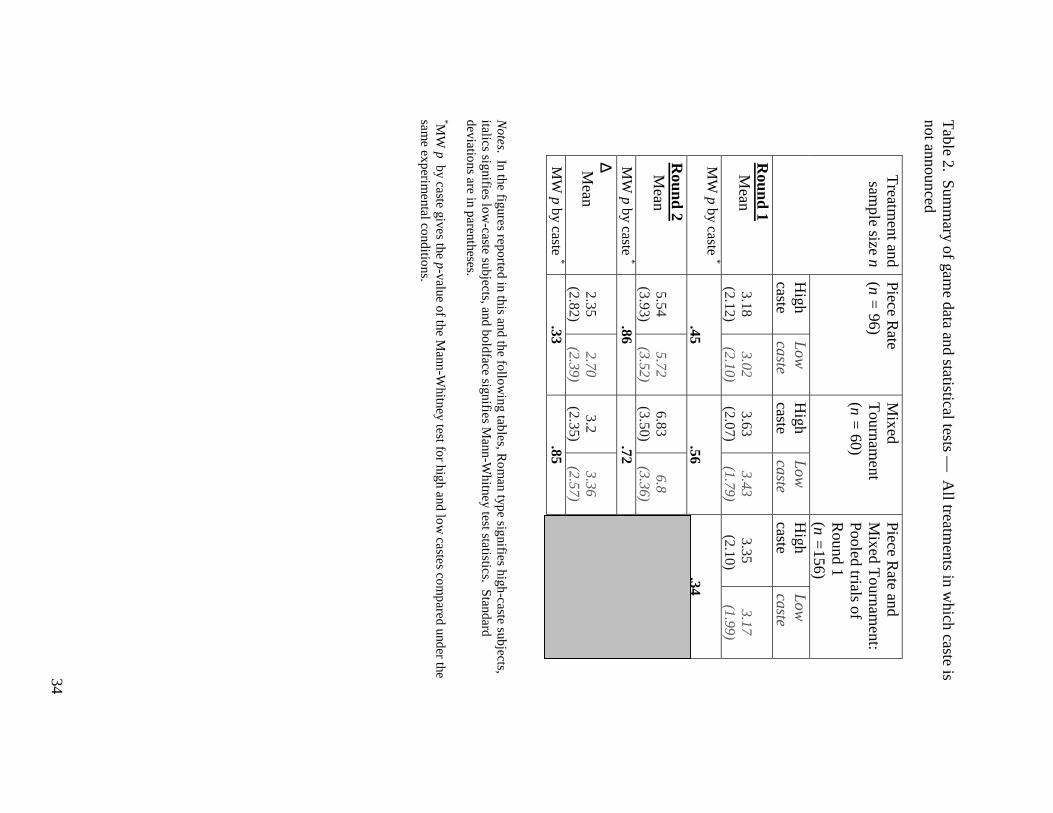
34
Table 2. Sum
mary of gam
e data and statistical tests — A
ll treatments in w
hich caste is not announced
Piece R
ate (n =
96) M
ixed T
ournament
(n = 60)
Piece R
ate and M
ixed Tournam
ent: Pooled trials of R
ound 1 (n =
156)
Treatm
ent and sam
ple size n
High
caste L
ow
caste H
igh caste
Low
caste
High
caste L
ow
caste R
ound 1 M
ean
3.18 (2.12)
3.02
(2.10)
3.63
(2.07)
3.43
(1.79)
3.35
(2.10)
3.17
(1.99) M
W p by caste *
.45
.56
.34
Round 2
Mean
5.54
(3.93)
5.72
(3.52)
6.83
(3.50)
6.8
(3.36)
MW
p by caste * .86
.72
∆
M
ean
2.35 (2.82)
2.70
(2.39)
3.2
(2.35)
3.36
(2.57)
MW
p by caste * .33
.85
N
otes. In the figures reported in this and the following tables, R
oman type signifies high-caste subjects,
italics signifies low-caste subjects, and boldface signifies M
ann-Whitney test statistics. Standard
deviations are in parentheses. *M
W p by caste gives the p-value of the M
ann-Whitney test for high and low
castes compared under the
same experim
ental conditions.

35
Table 3. S
umm
ary of game data and statistical tests—
Piece rate incentives
P
iece Rate
(n = 96)
Piece R
ate with
Caste A
nnounced (n =
120)
Pooled trials of R
ound 1, no announcem
ent of caste * (n =
156)
Pooled trials of R
ound 1 with
caste announced ** (n =
360)
Treatm
ent and sample
size n
High
caste L
ow
caste H
igh caste
Low
caste
High
caste L
ow
caste H
igh caste
Low
caste
Round 1
Mean
3.18
(2.12)
3.02
(2.10)
3.43
(2.16)
2.61
(1.99)
3.35
(2.10)
3.17
(1.99)
3.22
(2.04)
2.87
(1.84) M
W p, w
ith and without
the announcement of
caste ***
.83
.29
.47
.30
MW
p by caste
.45
.04
.34
.15
Round 2
Mean
5.54
(3.93)
5.72
(3.52)
6.11
(3.42)
4.28
(3.20)
MW
p, with and w
ithout the announcem
ent of caste ***
.44
.04
MW
p by caste .86
.006
∆
Mean
2.35
(2.82)
2.70
(2.39)
2.68
(2.58)
1.66
(1.98)
MW
p, with and w
ithout caste announcem
ent ***
.44
.01
MW
p by caste
.33
.03
*Includes Piece R
ate and Mixed T
ournament treatm
ents. **Includes P
iece Rate w
ith Caste A
nnounced, Mixed T
ournament w
ith Caste A
nnounced, Choice, and
Random
Winner treatm
ents. ***G
ives the p-value of the Mann-W
hitney test with and w
ithout the announcement of caste, holding
constant the incentive scheme.
36
Table 4. Sum
mary of gam
e data and statistical tests—M
ixed Tournam
ents
M
ixed Tournam
ent (n =
60) M
ixed Tournam
ent with
Caste A
nnounced (n =
120)
High caste
Low
caste H
igh caste L
ow caste
Round 2
Mean
6.83
(3.50)
6.8
(3.36)
5.46
(3.27)
4.75
(3.36) M
W p by caste
.72 .26
MW
p, with and w
ithout the announcem
ent of caste
.04
.009
∆
Mean
3.2
(2.35)
3.36
(2.57)
2.05
(2.60)
1.81
(2.12) M
W p by caste
.85 .66
MW
p, with and w
ithout the announcem
ent of caste
.03
.007
T
able 5. Summ
ary of game data and statistical tests—
Random
Winner, Piece R
ate with
Caste A
nnounced, and Piece R
ate
Random
W
inner (n = 60)
Piece R
ate with C
aste A
nnounced (n = 120)
Piece R
ate (n =
96) T
reatment and sam
ple size n
High
caste L
ow
caste H
igh caste L
ow
caste H
igh caste
Low
caste
Round 2
Mean
5.03
(2.91)
5.4
(2.62)
6.11
(3.42)
4.28
(3.20)
5.54
(3.93)
5.72
(3.52) M
W p by caste
.61
.006 .86
MW
p (Piece R
ate) * .55
.90 .44
.04
M
W p (P
iece Rate w
ith C
aste Announced) **
.25
.07
∆
Mean
1.83
(1.85)
2.6
(2.23)
2.68
(2.58)
1.66
(1.98)
2.35
(2.82)
2.70
(2.39) M
W p by caste
.11
.03 .33
MW
p (Piece R
ate) *
.54 .85
.44 .01
MW
p (Piece R
ate with
Caste A
nnounced) **
.15
.05
*MW
p (Piece R
ate) gives the p-value of the Mann-W
hitney test for Piece R
ate compared against each of
the other treatments.
**MW
p (Piece R
ate with C
aste Announced) gives the p-value of the M
ann-Whitney test for P
iece Rate
with C
aste Announced com
pared against each of the other treatments.

37
Table 6. Sum
mary of gam
e data and statistical tests—Single C
aste and other treatments
M
ixed Tournam
ent Treatm
ents
Single C
aste (n =
66) N
o announcement of
caste (n =
60)
Caste A
nnounced (n =
120)
Pooled trials under
piece rate incentive, caste announced *
(n = 360)
High
caste
Low
caste
High
caste
Low
caste
High
caste
Low
caste
High
caste
Low
caste
Mean
2.4
(1.99)
2.05
(1.30)
3.63
(2.07)
3.43
(1.79)
3.41
(1.93)
2.93
(1.74)
3.22
(2.04)
2.87
(1.84) M
W p by caste
.63 .56
.26
.15
Round 1,
Piece rate
incentive
MW
p (Single C
aste) **
.01
.0009
.02
.01
.04
.01
M
ean
4.83 (3.14)
3.05
(2.32)
6.83
(3.50)
6.8
(3.36)
5.46
(3.27)
4.75
(3.36)
MW
p by caste .02
.72
.26
Round 2,
Tournam
ent Incentive
MW
p (Single C
aste) **
.02
.0000
.41
.02
Mean
2.43
(2.19)
1 (1.82)
3.2
(2.35)
3.36
(2.57)
2.05
(2.60)
1.81
(2.12)
MW
p by caste .008
.85
.66
∆
MW
p (Single C
aste) **
.14
.0002
.53
.06
* Includes Round 1 of P
iece Rate w
ith Caste A
nnounced, Mixed T
ournament w
ith Caste A
nnounced, C
hoice, and Random
Winner.
**MW
p (Single Caste) gives the p-value of the M
ann-Whitney test for the Single C
aste treatment
compared against each of the other treatm
ents.

38
References
Acem
oglu, Daron, Sim
on Johnson, and James A
. Robinson. 2002. “R
eversal of Fortune: G
eography and Institutions in the Making of the M
odern World Incom
e Distribution,”
Quarterly Journal of E
conomics 117 (4): 1231–94.
Am
bady, Nalini, M
argaret Shih, A. K
im, and T
odd L. Pittinsky, 2001. “Stereotype Susceptibility
in Children: E
ffects of Identity Activation on Q
uantitative Performance,” P
sychological Science 12: 385-90.
Am
bedkar, B. R
. 1946. Who W
ere the Shudras? How
They C
ame to B
e the Fourth V
arna in the Indo-A
ryan Society. Bom
bay, India: Thacker and C
ompany.
Ball, Sheryl, C
atherine Eckel, Philip G
rossman, and W
illiam Z
ame, “Status in M
arkets.” Q
uarterly Journal of Econom
ics 116 (1): 161-188. B
anerjee, Abhijit, and L
akshmi Iyer. 2002. “H
istory, Institutions and Econom
ic Performance:
The L
egacy of Colonial L
and Tenure System
s in India,” Massachusetts Institute of
Technology, D
epartment of E
conomics.
Bohnet, Iris and B
runo S. Frey. 1999. “Social Distance and O
ther-Regarding B
ehavior in D
ictator Gam
es: Com
ment.” A
merican E
conomic R
eview 89 (1): 335-339.
Cohen, G
eoffrey L. and C
laude M. Steele. 2002. “A
Barrier of M
istrust: How
Negative
Stereotypes Affect C
ross-Race M
entoring.” In Joshua Aronson, ed., Im
proving A
cademic A
chievement. A
msterdam
: Elsevier Science Publishers.
Deshpande, A
shwini. 2002. “D
oes Caste Still D
efine Disparity? A
Look at Inequality in K
erala, India.” A
merican E
conomic R
eview, 20 (2), 322-325.
Deliege, R
obert (1999). The U
ntouchables of India (translated from the French by N
ora Scott) O
xford, UK
: Berg Publishers.
Dw
eck, Carol S. and E
llen L. L
eggett. 1988. “A Social-C
ognitive Approach to M
otivation and Personality,” P
sychological Review
, 45, 256-273. E
ngerman, Stanley L
., and Kenneth L
. Sokoloff. 1997. “Factor Endow
ments, Institutions, and
Differential Paths of G
rowth am
ong New
World E
conomies: A
View
from E
conomic
Historians of the U
nited States.” In Stephen Haber, ed., H
ow L
atin Am
erica Fell B
ehind: E
ssays on the Econom
ic Histories of B
razil and Mexico, 1800–1914. Stanford, C
alif.: Stanford U
niversity Press. ________________. 2002. “Factor E
ndowm
ents, Inequality, and Paths of Developm
ent among
New
World E
conomies,” E
conomia 3 (1): 41–109.
Galanter, M
arc. 1984. Com
peting Equalities: L
aw and the B
ackward C
lasses in India. B
erkeley, CA
: University of C
alifornia Press. G
neezy, Uri, M
uriel Niederle, and A
ldo Rustichini. 2002. “Perform
ance in Com
petitive Environm
ents: G
ender Differences,” Q
uarterly Journal of Econom
ics, 118, 1049-1074.

39
Gupta, D
ipankar. 2000. Interrogating Caste: U
nderstanding Hierarchy and D
ifference in Indian Society. N
ew D
elhi: Penguin Books.
Hoff, K
arla and Priyanka Pandey. 2004. “Belief System
s and Durable Inequalities: A
n E
xperimental Investigation of Indian C
aste.” World B
ank Policy Research W
orking Paper 0-2875.
Hoff, K
arla. 2003. “Paths of Institutional Developm
ent: A V
iew from
Econom
ic History, W
orld B
ank Research O
bserver 18(2), 2205-226. T
he Law
s of Manu, translated by W
endy Doniger and B
rian K. Sm
ith. 1991. New
Delhi:
Penguin Books. [ISB
N 0-14-044540-4]
Loury, G
lenn C. 2002. T
he Anatom
y of Racial Inequality. C
ambridge, M
A: H
arvard U. Press.
MacD
onnell, Arthur A
. 1962. A H
istory of Sanskrit Literature, N
ew D
elhi: Motilal B
anarsidas. M
arriott, Alan. “D
alit or Harijan? Self-nam
ing by Scheduled Caste Interview
ees.” Econom
ic and P
olitical Weekly, Septem
ber 6-12, 2003, 3751-54. Pandey,
Priyanka 2004.
“How
M
alleable are
Institutions? E
ffects of
History,
Mandated
Representation and D
emocratization on Perform
ance of Public Schools in rural North
India,” w
orking paper,
Pennsylvania State
University
and Indian
Institute of
Managem
ent, Lucknow
.
Rao, V
ijayendra and Michael W
alton. 2004. “Culture and Public A
ction: An Introduction.” In
Culture and P
ublic Action, Stanford U
niversity Press, V. R
ao and M. W
alton, eds. Shih, M
argaret, Todd Pittinsky, and N
alini Am
bady. 1999. “Stereotype Susceptibility: Identity Salience and Shifts in Q
uantitative Performance,” P
sychological Science 10 (1): 80-83. Sokoloff, K
enneth L, and Stanley L
. Engerm
an (2000). “History L
essons: Institutions, Factor E
ndownm
ents, and Paths of Developm
ent in the New
World,” Journal of E
conomic
Perspectives, 14, 3, pp. 217-232.
Steele, Claude M
., Steven J. Spencer, and Joshua Aronson. 2002. “C
ontending with G
roup Im
age: The Psychology of Stereotype and Social Identity T
hreat,” Advances in
Experim
ental Social Psychology 34: 379-441.
Sunstein, Cass R
. 1995. “Gender, C
aste and Law
.” In: Martha N
ussbaum and Jonathan G
lover, eds. W
omen, C
ulture and Developm
ent, Oxford, U
K: C
larendon Press, 332-59. T
horat, Sukhadeo. 2002. “Oppression and D
enial: Dalit D
iscrimination in the 1990s.” E
conomic
and Political W
eekly, February 9-15, 2002, pp. 572-578. T
versky, Am
os and Kahnem
an, Daniel. “R
ational Choice and the Fram
ing of Decisions,” in
Robin M
. Hogarth and M
elvin W. R
eder, eds, Rational C
hoice: The C
ontrast Betw
een E
conomics and P
sychology, Chicago: U
niversity of Chicago Press, 1986, 67-94.
40
Appendix: Instructions
(translated from H
indi) T
he setting is a classroom w
ith three erasable wall posters—
one shows a trivially easy m
aze, another show
s a maze of the sam
e level used in the experiment, and the third is blank. P
laces on the floor m
at are set for six children. At each place is a piece of fruit, a clipboard w
ith a practice m
aze, and a pencil. I. P
iece Rate
1. You are about to participate in a gam
e of puzzles. You w
ill take part in two gam
es. In both gam
es you will have to solve puzzles. T
he games w
ill take about half an hour. 2. T
o participate in these games every child w
ill receive 10 rupees. Experim
enter distributes a 10-rupee note to each child. In addition you m
ight get more rew
ards in the game. T
his money w
ill be given to every child in an envelope after the gam
es are over. 3. N
ow I w
ill show you how
to solve a puzzle. Experim
enter illustrates each of her statements by
drawing on the poster w
ith the trivially easy maze, w
hich she solves. In this puzzle there is one child. T
he child has to go to the ball. The solution is a path that takes the child to the ball. T
he black lines are w
alls. The child cannot cross a w
all. So the path that you draw cannot cross a line.
If it crosses a line, then it will considered incorrect. Y
ou can erase or cross out mistakes. T
here is an eraser on top of your pencil. A
nd you can also draw a path back if you m
eet a dead-end. You
can solve a maze forw
ards or backwards.
4. Now
I will show
you how to solve a puzzle like the one you w
ill have to do. Experim
enter illustrates each of her statem
ents by drawing on the poster w
ith the Level 2 m
aze, which she
solves. The solution is the path that takes the child to the ball. If you draw
an incorrect line, you can erase it or cross it out, and you can also draw
a path back if you meet a dead-end.
5. Now
I will ask you to solve a puzzle as practice. It w
ill take you about five minutes to do this.
If you don’t understand something or your pencil breaks, raise your hand, and I w
ill come to you.
Experim
enter allows five m
inutes for the children to work on the practice m
aze. 6. I am
passing out a booklet of puzzles [the booklets for Round 1]. T
his booklet contains 15 pages. E
very page has a puzzle on it. To solve these, you w
ill have 15 minutes. If you are not able to do
one puzzle, you can proceed to the puzzle on the next page. During the gam
e you should not to talk to each other. If you talk to each other, then you w
ill not get any reward in the gam
e. 7. In this gam
e, you will get 1 rupee for each puzzle that you solve. So if you solve 1 puzzle,
then you will be get 1 rupee. If you solve 2 puzzles, then you w
ill get 2 rupees. If you solve 3 puzzles,…
Experim
enter illustrates the rules by writing the follow
ing table on the blank poster:
1 puzzle 1 rupee
2 puzzles
2 rupees
3 puzzles 3 rupees
…
10 puzzles 10 rupees
…
15 puzzles 15 rupees

41
Experim
enter checks that each child understands the payment system
by asking a question to each child in turn, as follow
s: Suppose you solve * puzzles. How
many rupees w
ill you be given? F
or *, the experimenter uses, in turn, 4, 7, 9, 12, 14, 5.
E
ach child will get his rew
ard in an envelope at the end of the game.
8. N
ow w
e will begin the gam
e. After 10 m
inutes, Experim
enter tells the children that 5 minutes
of the game rem
ain. When the tim
er rings, she collects the packets. 9. W
e are going to play the game one m
ore time. E
xperimenter passes out the booklets for R
ound 2. 10-P
. The second gam
e is just like the first game. I w
ant to review the rew
ards again. E
xperimenter repeats steps 7 and 8. F
or *, she uses in turn, 5, 14, 12, 9, 7, 4. 11. W
e will begin the gam
e. After 10 m
inutes, Experim
enter tells the children that 5 minutes of
the game rem
ain. When the tim
er rings, she collects the packets. 2. M
ixed Tournam
ent T
he same as Piece R
ate except that Step 10-T replaces 10-P
: 10-T
. In this game, only one child w
ill get a reward. T
he child who gets the rew
ard is the one w
ho solves the greatest number of puzzles. H
is reward w
ill be 6 rupees for each solved maze. So
if he solves 1 puzzle, he gets 6 rupees; if he solves 2 puzzles, he… E
xperimenter com
pletes the follow
ing table:
1 puzzle 6 rupee
2 puzzles
12 rupees
6 puzzles 36 rupees
10 puzzles 60 rupees
15 puzzles 90 rupees
To illustrate the gam
e, suppose the six children listed here (Experim
enter points to the names she
has written on the blank poster) w
ere playing the game and suppose they solved the num
ber of puzzles show
n here.
N
umber of puzzles solved
Rew
ard Seeta
4
0 rupees
Reeta
3
0
Geeta
6
36 rupees
K
avita
2
0 Sunita
5
0
Radha
1
0
The w
inner would be G
eeta. She solved the largest number of puzzles. A
nd she would get 36
rupees. No other child w
ould get any money in this gam
e. Experim
enter checks that each child understands the rew
ard system by changing one or tw
o numbers in the table and then asking him
w
hat the rewards w
ould be. 3. P
iece Rate w
ith Caste A
nnounced T
he same as Piece R
ate except that Step 0 is added.

42
0. Experim
enter reads out, for each child in turn, the child’s name, village nam
e, father’s name,
grandfather’s name if available, and caste.
4 and 8. Mixed T
ournament w
ith Caste A
nnounced, and Single Caste
The sam
e as Mixed T
ournament except that Step 0 above is added.
5. Reverse O
rder T
he order of steps is 0 through 6, 10-T, 9, 7, and 8.
6. Random
Winner
The sam
e as Piece Rate w
ith Caste A
nnounced except that Step 10-R replaces 10-P
: 10-R
. In this game, only one child w
ill get a reward. T
he child who gets the rew
ard will be the one
whose nam
e we choose from
a jar. Each child should w
rite his name on the card and then fold it in
half. Experim
enter passes out a yellow card to each child, and then collects the cards after the
children have written their nam
es on them. E
xperimenter puts all the cards into a glass jar.
At the end the gam
e, my assistant w
ill choose the winner’s nam
e from the jar. I w
ill illustrate this: T
he assistant shakes the jar and picks out a name, and the experim
enter writes the m
oney prizes on the blank poster.
1 puzzle 6 rupee
2 puzzles
12 rupees ..
6 puzzles
36 rupees .. 10 puzzles
60 rupees .. 15 puzzles
90 rupees O
nly one child’s name w
ill be picked. The other children w
ill not get any money in this gam
e. At
the end of the game, m
y assistant will go to another room
and in privacy she will pick out the
winner’s nam
e. E
xperimenter checks that each child understands the rew
ard system by asking each child, using
the actual names of the children in the group and hypothetical scores that she w
rites on the blank poster, a question that follow
s the model: “
If Sandeep got 10 puzzles right and Pradeep got 5
puzzles right, and Pradeep’s nam
e is picked, who w
ould win? H
ow m
uch money w
ould the * get?”
Then she modifies the scores and the hypothetical w
inner of the random draw
, and asks the next child a question follow
ing the same m
odel. 7. C
hoice T
he same as Piece R
ate with C
aste Announced except that Step 10-C
replaces 0-P.

43
10-C. T
his game w
ill be just the same as the first one, except that I w
ill ask each of you to choose the level of difficulty of the puzzles. T
he payment that you w
ill receive for solving a puzzle depends on its difficultly level.
Easy
½ rupee per m
aze Sam
e as before 1 rupee per m
aze A
bit harder
2 rupees per maze
Hard
3 rupees per maze
Hardest
4 rupees per m
aze S
o the harder the puzzle, the more difficult it is to solve m
any puzzles, but the greater the paym
ent for each solution. E
xperimenter presents exam
ples and checks each child’s understanding in turn.
Sanjay solves 4 m
azes of the same level of difficulty as before. W
hat does he earn? Sanjay solves 4 m
azes that are a bit harder. What does he earn?
Sanjay solves 4 mazes that are the hardest. W
hat does he earn? N
ow I am
going to ask you to go one-by-one to my assistant and tell her the level you w
ish to choose. Y
our choice is a secret. No other child w
ill know the choice you m
ake.