An Evolutionary Model-Based Algorithm for AccuratePhylogenetic Breakpoint Mapping and SubtypePrediction in HIV-1Sergei L. Kosakovsky Pond1*, David Posada2, Eric Stawiski3, Colombe Chappey3, Art F.Y. Poon4, Gareth
Hughes5, Esther Fearnhill6, Mike B. Gravenor7, Andrew J. Leigh Brown8, Simon D.W. Frost4,9
1 Department of Medicine, University of California San Diego, La Jolla, California, United States of America, 2 Department of Biochemistry, Genetics and Immunology,
University of Vigo, Vigo, Spain, 3 Monogram Biosciences, South San Francisco, California, United States of America, 4 Department of Pathology, University of California San
Diego, La Jolla, California, United States of America, 5 Health Protection Agency East of England Regional Epidemiology Unit, Cambridge, United Kingdom, 6 Medical
Research Council Clinical Trials Unit, London, United Kingdom, 7 School of Medicine, University of Swansea, Swansea, United Kingdom, 8 Institute of Evolutionary Biology,
University of Edinburgh, Edinburgh, United Kingdom, 9 Department of Veterinary Medicine, University of Cambridge, Cambridge, United Kingdom
Abstract
Genetically diverse pathogens (such as Human Immunodeficiency virus type 1, HIV-1) are frequently stratified intophylogenetically or immunologically defined subtypes for classification purposes. Computational identification of suchsubtypes is helpful in surveillance, epidemiological analysis and detection of novel variants, e.g., circulating recombinantforms in HIV-1. A number of conceptually and technically different techniques have been proposed for determining thesubtype of a query sequence, but there is not a universally optimal approach. We present a model-based phylogeneticmethod for automatically subtyping an HIV-1 (or other viral or bacterial) sequence, mapping the location of breakpoints andassigning parental sequences in recombinant strains as well as computing confidence levels for the inferred quantities. OurSubtype Classification Using Evolutionary ALgorithms (SCUEAL) procedure is shown to perform very well in a variety ofsimulation scenarios, runs in parallel when multiple sequences are being screened, and matches or exceeds theperformance of existing approaches on typical empirical cases. We applied SCUEAL to all available polymerase (pol)sequences from two large databases, the Stanford Drug Resistance database and the UK HIV Drug Resistance Database.Comparing with subtypes which had previously been assigned revealed that a minor but substantial (<5%) fraction of puresubtype sequences may in fact be within- or inter-subtype recombinants. A free implementation of SCUEAL is provided as amodule for the HyPhy package and the Datamonkey web server. Our method is especially useful when an accurateautomatic classification of an unknown strain is desired, and is positioned to complement and extend faster but lessaccurate methods. Given the increasingly frequent use of HIV subtype information in studies focusing on the effect ofsubtype on treatment, clinical outcome, pathogenicity and vaccine design, the importance of accurate, robust andextensible subtyping procedures is clear.
Citation: Kosakovsky Pond SL, Posada D, Stawiski E, Chappey C, Poon AFY, et al. (2009) An Evolutionary Model-Based Algorithm for Accurate PhylogeneticBreakpoint Mapping and Subtype Prediction in HIV-1. PLoS Comput Biol 5(11): e1000581. doi:10.1371/journal.pcbi.1000581
Editor: Christophe Fraser, Imperial College London, United Kingdom
Received February 10, 2009; Accepted October 28, 2009; Published November 26, 2009
Copyright: � 2009 Kosakovsky Pond et al. This is an open-access article distributed under the terms of the Creative Commons Attribution License, which permitsunrestricted use, distribution, and reproduction in any medium, provided the original author and source are credited.
Funding: This research was supported by the Joint DMS/NIGMS Mathematical Biology Initiative through Grant NSF-0714991, the National Institutes of Health(AI43638, AI47745, and AI57167), the University of California Universitywide AIDS Research Program (grant number IS02-SD-701), a University of California, SanDiego Center for AIDS Research/NIAID Developmental Award to SDWF and SLKP (AI36214), and grant BIO2007-61411 (Spanish Ministry of Science) to DP. SDWF issupported in part by a Royal Society Wolfson Research Merit Award. This work was facilitated by IBM Deep Computing. GH was supported by the MedicalResearch Council. EF and the UK HIV Drug Resistance Database are partly funded by the UK Department of Health. Additional support is provided by BoehringerIngelheim, Bristol-Myers Squibb, Gilead, Tibotec (a division of Janssen-Cilag Ltd) and Roche. The funders had no role in study design, data collection and analysis,decision to publish, or preparation of the manuscript.
Competing Interests: The authors have declared that no competing interests exist.
* E-mail: [email protected]
Introduction
Many RNA viruses have evolutionary rates that hover near the
mutational speed limit [1] permitting them to generate incredible
sequence variability among circulating strains in a relatively short
time [2]. Bottleneck events, such as viral introduction to new
populations or species of hosts, followed by diversification in the
new environments, create easily discernible substructures within
individual viral species. For HIV-1, this substructure consists of 3
groups (M, N and O), 9 ‘‘pure’’ subtypes (A–D, F, G, H, J and K)
of group M, and sub-subtypes (e.g. A1, A2, F1 and F2), defined
entirely on the basis of phylogenetic clustering and monophyly of
sequences from a given subtype in relation to all other subtypes [3].
The geographic distribution of HIV-1 subtypes is decidedly non-
random [4]; for example w98% of HIV-1 circulating in North
America is classified as subtype B, whereas the same subtype
accounts for only 0:2% of infections in Southern Africa. This
observation immediately suggests that reliable determination of viral
subtypes is highly informative for epidemiological surveillance.
HIV-1 diversity is sufficiently high to permit further stratification
of subtypes by the geographic region of origin, yielding further clues
to epidemiological history of modern epidemics [5]. However,
because several established subtypes often circulate concurrently in
one host population [6], and because HIV has exceptionally high
PLoS Computational Biology | www.ploscompbiol.org 1 November 2009 | Volume 5 | Issue 11 | e1000581
recombination rates [7], novel recombinant forms are frequently
generated. If at least three epidemiologically unrelated viral isolates
show an identical novel recombination structure in terms of the pure
subtype reference strains, a new circulating recombinant form
(CRF) is added to the compendium maintained by the Los Alamos
National Laboratory (http://www.hiv.lanl.gov/content/sequence/
HIV/CRFs/CRFs.html). There are currently 43 described CRFs,
differing widely in their prevalence, range and the complexity of the
recombinant structure. However, the relationship between CRFs
and their parental strains is not always clear cut; for example
CRF02, originally thought to have been the product of recombi-
nation between subtype A and subtype G strains could in fact be
ancestral to subtype G strains [8].
A number of computational approaches have been proposed to
classify viral strains into subtypes or to describe recombinant
strains as mosaics of subtypes. Unlike with methods geared
towards a more general problem of detecting recombination from
sequence alignments [9,10], there are no comprehensive compar-
ative benchmarking studies for subtyping methods in the literature.
The methods can be conceptually categorized by whether or not
they explicitly use a phylogeny to assign subtypes, whether or not
they require a multiple sequence alignment and by the degree of
automation that they afford: full, partial or none. The de facto
standard for accurately describing novel recombinant forms has
changed little since its introduction in [11]. It consists of an initial
sliding-window phylogenetic bootstrap (bootscanning) analysis of
the query sequence aligned against the set reference strain used to
generate the set of apparent breakpoints which are then confirmed
by detailed phylogenetic analysis of putative non-recombinant
fragments. This is a powerful and intuitively attractive, but
laborious method–the entire process frequently lacks automation
(e.g. [12,13], but see [14]), has many user-adjustable parameters,
such as the alignment procedure, reference sequences, sliding
window size and stride, precise location of breakpoints, phyloge-
netic bootstrap values that are selected subjectively, and can lead
to ambiguous or not fully resolved results (e.g. [15] vs [16], [17]).
Perhaps the single greatest criticism of the bootscan/phylogeny
approach may be that two alternative characterizations of the
same query sequence are not assigned a statistically meaningful
goodness-of-fit score, and hence cannot be objectively compared.
On the other end of the spectrum are fully automated techniques,
including a sophisticated phylogeny and alignment based REGA
v2.0 tool [18], henceforth referred to as REGA, and several
phylogeny and/or alignment free tools: a classification method
based on subtype-specific distributions of short nucleotide strings
[19]; a sliding window analysis based on BLAST scores of the query
and each of the subtype reference sequences [20]; a phylogeny free
position/subtype specific amino-acid subtype analyzer (STAR)
which assigns each residue in a multiple sequence alignment a
subtype discriminating score [21]; and a probabilistic jumping
alignment approach jpHMM [22] that uses a hidden Markov model
to align the query to the locally most similar reference sequence.
Alignment and/or phylogeny free techniques are fundamentally
approximate in nature, because the definition of a subtype is rooted
in the concept of a clade and hence is intrinsically phylogenetic in
nature. Approximate approaches have been developed to address
the very practical issues of automation, speed and the fact that a
phylogenetic definition of a subtype becomes complicated when
reference strains are permitted to have recombined themselves.
On the other hand, these methods often produce conflicting or
indeterminate results, may be unable to classify novel or rare
mosaics, and frequently disagree with manually performed
phylogenetic analyses, causing considerable consternation among
practitioners and clinicians (e.g. [23–25]). A recent comparative
study of three automated subtyping tools on 10537 partial
polymerase sequences from the UK [26] found that methods
agreed poorly (v50%) for subtypes other than B,C and H, failed
to classify 5{10% of sequences and returned discordant results in
&12% cases of divergent sequences, which were revealed to be
unusual recombinant forms by a laborious follow-up analysis.
Hence, we are convinced that it is necessary to adopt a
phylogeny-based method for accurate subtyping. Statistical evi-
dence of phylogenetic incongruence, i.e. instances when different
regions of an alignment support discordant phylogenies, is a
hallmark of recombination [27]. A statistically robust phylogenetic
approach to detecting phylogenetic incongruence in a multiple
sequence alignment has been proposed in the Bayesian framework
by [28] and in the information theory framework by [29]. These
methods are powerful but too slow to be practical for large reference
phylogenies needed to describe extant HIV diversity–for example
our HIV-1 polymerase reference alignment contains nearly 300
sequences. Because subtyping is a particular case of more general
recombination analyses, we devised an algorithm whose run time is
effectively constant in the size of the reference alignment.
Importantly, this is achieved without collapsing the alignment into
a collection of attributes, such as substring frequencies or position-
specific alignment scoring matrices, as is frequently done by
phylogeny-free methods.
Our design objectives for SCUEAL included: (i) a completely
automatic method, which returns a predicted subtype, existing
CRF or a recombinant form mapped in terms of the former; (ii)
every estimated quantity including the recombinant structure, the
location of each breakpoint and the assignment of a parental/sister
lineage should be estimated with statistical confidence/support
values to allow an objective evaluation of how robust the estimates
are; (iii) the algorithm runs sufficiently quickly (2–3 CPU minutes
to screen a simple sequence, and up to a CPU hour for highly
complex mosaics) to permit the screening of thousands of
sequences on a computer cluster. We implemented an easy-to-
use web interface to SCUEAL running on the datamonkey.org
[30] platform); (iv) accepts large reference sequence alignments
Author Summary
There are nine different subtypes of the main group ofHIV-1, each originating as a distinct subepidemic of HIV-1.The distribution of subtypes is often unique to a givengeographic region of the world and constitutes a usefulepidemiological and surveillance resource. The effects ofviral subtype on disease progression, treatment outcomeand vaccine design are being actively researched, and theimportance of accurate subtyping procedures is clear. InHIV-1, subtype assignment is complicated by frequentrecombination among co-circulating strains, creating newgenetic mosaics or recombinant forms: 43 have beencharacterized to date, and many more likely exist. Wepresent an automated phylogenetic method (SCUEAL) toaccurately characterize both simple and complex HIV-1mosaics. Using computer simulations and biological datawe demonstrate that SCUEAL performs very well undervarious conditions, especially when some of the existingclassification procedures fail. Furthermore, we show that asmall, but noticeable proportion of subtype characteriza-tion stored in public databases may be incomplete orincorrect. The computational technique introduced hereshould provide a much more accurate characterization ofHIV-1 strains, especially novel recombinants, and lead tonew insights into molecular history, epidemiology andgeographical distribution of the virus.
Evolutionary Algorithm for HIV Subtype Prediction
PLoS Computational Biology | www.ploscompbiol.org 2 November 2009 | Volume 5 | Issue 11 | e1000581

which can be easily updated when new references (e.g. CRF)
become available. SCUEAL is conceptually based on the more
general method (GARD) for detecting recombination in multiple
sequence alignments presented in [29], but is an entirely new
algorithm and software implementation. Whereas GARD is
primarily concerned with detecting the number and location of
breakpoints in an alignment, and not in identifying recombinant
lineages and clades (which is critically important for subtyping),
SCUEAL explicitly searches for both using a significantly modified
and improved genetic algorithm. Also, by screening a single
sequence against a fixed reference alignment, SCUEAL gains
significant power and an order of magnitude speed-up over
GARD, which assumes that any sequence can be a recombinant.
We assessed various performance metrics of SCUEAL using an
extensive set of simulations and biological data; to our knowledge
no other method has been subjected to a comparably exhaustive
benchmarking study.
Methods
Consider an alignment of N reference sequences on L bases,
each labeled with its subtype. We require that none of the
reference sequences have undergone detectable recombination,
hence their evolutionary history can be accurately described with a
single phylogenetic tree, T ; note that this framework can be used
to handle recombinant reference sequences represented as
multiple partial sequences (see below). In this manuscript, the
evolution of extant sequences from their most recent common
ancestor along the phylogenetic tree is described by the general
time reversible model of nucleotide substitution [31] and site-to-
site rate variation is accommodated via a 3-bin general discrete
distribution (e.g. [32]). Substitution models for codon and protein
evolution can be easily accommodated by the testing framework;
however because they incur considerable additional computational
expense they are not considered here.
Phylogenetic mosaicsThe objective of our methodology is to enable automatic
identification of the number (B) and location of any recombina-
tion breakpoints in a query sequence, that is assumed to be
homologous and alignable to the reference sequences, together
with the identities of sister lineages in each non-recombinant
fragment. An example of such an assignment can be found in
Figure 0: the query sequence (labeled Q) has two recombination
breakpoints, at nucleotide positions 750 and 1250. Over the first
750 nucleotides, the query sequence shares a common ancestor
with reference sequence 1, over the next 500 nucleotides - with
reference sequence 7, and over the last 750 nucleotides - with
sequence 1 again. Such an arrangement might arise if the query is
the result of a recombination event between the ancestors of
sequences 1 and 7.
The term ‘mosaic’ has come to encompass the combination of
breakpoint placements and lineage assignments in HIV-1
subtyping literature. The number of possible mosaics with Bbreakpoints is proportional to NLð ÞB, hence it is not practical to
undertake an exhaustive search of all possible mosaics, unless B is
small (i.e. B = 1 or B = 2).
Model fitting and fitness evaluationIn order to select credible mosaics from the set of all possible
models we must be able to compute a goodness-of-fit value for
each proposed mosaic.
We begin by computing the maximum likelihood based score
for each model. First, we fit the reference tree to the reference
alignment using standard phylogenetic maximum likelihood.
Assuming unrooted bifurcating trees, 2N{5 branch length
estimates and K substitution model estimates, such as relative
nucleotide substitution rates, base frequencies and site-to-site rate
variation parameters will be obtained. These baseline parameters
are estimated once for a reference alignment, and can be reused if
multiple query sequences are run against the same reference.
For computational efficiency we fix all substitution model
parameters at their baseline values instead of re-estimating them
for each mosaic. If the reference alignment is sufficiently large, the
effect of one additional sequence on substitution model parameters
will be insignificant. Furthermore, we posit that grafting the query
sequence onto a branch in the reference tree will only affect three
branch lengths for each non-recombinant fragment. For instance,
for the mosaic shown in Figure 1 the algorithm will estimate three
branch lengths for the first segment (those leading to 1 and Q as
well as the branch leading to their MRCA), three branch lengths
of the second segment (Q,7 and the MRCA of Q and 7) and three
branch lengths for the third segment (1,Q and the MRCA of 1
and Q). All other branch lengths are maintained at the values
derived from the reference tree. Similar approximations are
routinely made in phylogenetic inference (e.g. [33,34]). The fitness
of mosaic i is evaluated using Schwartz’s Bayesian Information
Criterion (BIC, [35]), with the number of model parameters for a
mosaic with B breakpoints given by p~Kz2N{5z3B:
f ið Þ~{2 log l hh� �
zp log Lð Þ, ð1Þ
where l hh� �
is the likelihood of the data under the mosaic model
maximized over p parameters and L is the number of sites in the
alignment, used to approximate the number of independent
observations. A lower BIC score indicates a better fit to the data.
BIC was selected because it had the best power/accuracy
performance in our initial simulation studies, comparing AIC
[36], AIC-c [37] and BIC (results not shown).
The immediate benefit of allowing only three branch lengths to
vary per segment is that the computational cost for fitting
individual mosaics no longer depends on the size of the reference
alignment, at least when time-reversible models of substitutions are
used. This observation has been exploited in many phylogenetic
applications and is discussed in detail for example in [38]. Briefly,
as a part of standard phylogenetic likelihood evaluation [39], each
node n (both tips and internal nodes) of the phylogenetic tree is
populated with a vector of partial probabilities Ln cð Þ that containts
the probability of observing the subtree rooted at n if the character
(i.e. a nucleotide in our case) at n is c. To evaluate the likelihood of
the entire tree (for a single site), the following expression is
computed at the root:
Xc[ A,C,G,Tf g
p cð ÞPn
Xd[ A,C,G,Tf g
Tn c?dð ÞLn dð Þ,
where n iterates over the children of the root node, p cð Þ gives the
stationary frequency of nucleotide c (estimated by counts from the
data) and Tn c?dð Þ denotes the probability of substituting
nucleotide c with nucleotide d along the branch that ends in n.
The critical observation to be made here is that if nothing but the
lengths of branch emanating from the root node change during
optimization (i.e. only Tn changes), then Ln dð Þ do not have to be
recomputed, reducing the complexity optimization problem to
that on a star tree with N( = 3 for standard phylogenetic
applications) tips.
Evolutionary Algorithm for HIV Subtype Prediction
PLoS Computational Biology | www.ploscompbiol.org 3 November 2009 | Volume 5 | Issue 11 | e1000581

For time-reversible models, the root can be arbitrarily placed on
any branch of the phylogenetic tree. Hence, we can reroot the tree
at the point where the query sequence is grafted and reduce the
computational complexity as explained above. To do this, in
addition to Ln cð Þ, we also precompute (for every node except the
root and only once per analysis) the collection of vectors Mn cð Þ,that contain conditional probabilities of the parent node of n, when
n is considered as the root node. For every non-root node n the
likelihood of the bifurcating reference tree can be equivalently
expressed as:
Xc[ A,C,G,Tf g
p cð ÞLn cð ÞX
d[ A,C,G,Tf gTn c?dð ÞMn dð Þ:
The last expression is simply the likelihood of the tree rerooted
exactly at node n. Grafting the query sequence q onto the branch
leading to node n will create three branches: the branch leading to
q, the branch leading to n and the branch leading from the
ancestor of n and q (nq) to the parent of p nð Þ For the first partition
in Figure 1, for example, the single branch of the reference tree
leading to tip 1, was transformed into three branches by grafting
Q–the branch leading to tip 1, the branch leading to query Q and
the branch leading to the parent of 1 and Q. Consequently, the
likelihood of the tree with the query sequence q grafted onto the
branch leading to n can be computed as:
Pa[ A,C,G,Tf g
p að ÞP
b[ A,C,G,Tf gTn a?bð ÞLn bð Þ
" #
Pc[ A,C,G,Tf g
Tq a?cð ÞLq cð Þ" # P
d[ A,C,G,Tf gTp nð Þ a?dð ÞMn dð Þ
" #:
This expression is the likelihood of a three-taxon star tree with the
root at node nq (sum over a) and three children: n (sum over b), q(sum over c) and the parent of n, p nð Þ (sum over d). Note that
because q is always a tip, the conditional probabilities in Lq nð Þ are
trivial to compute, and it follows that the cost of evaluating the
likelihood of the reference tree with a grafted tip (given
precomputed quantities, M and L–done only once for the
reference alignment, independent of the query sequence) is
equivalent to the three-taxon case.
Mosaic selection using a genetic algorithmWe use an aggressive genetic algorithm (GA) with elitist
selection that is based on the CHC procedure [40] to rapidly
search a combinatorially large space of possible mosaics for a fixed
number of breakpoints. The algorithm operates on a population of
I binary strings (individuals), each representing an encoded mosaic
with B breakpoints. 2Bz1 fragments (‘genes’) are needed to
encode the mosaic - B for the location of breakpoints, and Bz1for lineage assignments on each non-recombinant fragment (see
Figure 1). We restrict breakpoints to only occur at variable
alignment sites as was done previously in our GARD method [29].
In addition, the breakpoints must be a minimum distance (denoted
as a tunable parameter w) away from each other or from the ends
of the sequence; this simply reflects the fact that a minimum
number of sites is necessary to resolve the phylogenetic placement
of a sequence.
The placement of the query sequence in the reference tree is
represented by the binary-encoded position of the branch in post-
order traversal (cf. Figure 1). Breakpoint positions are represented
using Gray binary coding, to ensure any two consecutive locations
differ by a single bit, and hence can be reached by a single
mutation [41]. For example, to change the position of a breakpoint
from 7 (traditional binary 0111, Gray code 0100) to 8 (1000; 1100)
it would be necessary to mutate all four bits in the traditional
binary code, but only one bit in the Gray code. Breakpoints are
always maintained in left-to-right ordering and any operations that
disrupt this order are followed by resorting of breakpoints left to
right (equivalent to gene order rearrangement).
Starting with the initial population of I mosaics, the algorithm
proceeds as follows (refer to Figures 2 and 3 for a graphical
description of the procedure). First, fitness of each mosaic f ið Þ(Eq. 1) is computed and the mosiac is assigned a mating
probability inversely proportional to its fitness rank ri. The most
fit mosaic reproduces becomes a parent for an offspring with
p1~C{1, while the least fit mosaic–with probability pI~ CIð Þ{1,
Figure 1. An example to illustrate the concepts of a mosaic andits binary encoding upon which the genetic algorithmoperates. Panel A: a phylogenetic breakpoint/lineage model which‘‘threads’’ a query sequence (labeled ‘Q’) onto the reference tree with 7sequences. Panel B: the example individual model (mosaic) 1750712501 isencoded by a 36-bit binary vector on 5 fragments (genes)–2 for placingthe breakpoints (Gray-binary encoded) and 3 for identifying sisterlineages, binary encoded using the post-order traversal scheme shownin the reference tree of Panel A.doi:10.1371/journal.pcbi.1000581.g001
Evolutionary Algorithm for HIV Subtype Prediction
PLoS Computational Biology | www.ploscompbiol.org 4 November 2009 | Volume 5 | Issue 11 | e1000581

Figure 2. Algorithmic flowchart of SCUEAL. Algorithmic logic underlying SCUEAL; see Figure 3 for a description of the genetic algorithm itself.Refer to the text for more detailed descriptions of individual procedures and parameter definitions.doi:10.1371/journal.pcbi.1000581.g002
Evolutionary Algorithm for HIV Subtype Prediction
PLoS Computational Biology | www.ploscompbiol.org 5 November 2009 | Volume 5 | Issue 11 | e1000581

Figure 3. Algorithmic flowchart of the genetic algorithm in SCUEAL. A flowchart description of the genetic algorithm applied to a givenstarting population and controlled by input parameter values. Refer to the text and Figure 2 for further description of individual steps and parameterdefinitions.doi:10.1371/journal.pcbi.1000581.g003
Evolutionary Algorithm for HIV Subtype Prediction
PLoS Computational Biology | www.ploscompbiol.org 6 November 2009 | Volume 5 | Issue 11 | e1000581

where C~PN
k~1 k{1. The algorithm maintains a global lookup
table (implemented as an AVL tree keyed on the bit string of the
mosaic) to ensure that the maximum likelihood fitting of any given
mosaic is carried out only once. Second, I pairs of parents are
selected based on their mating probabilities to generate I offspring.
The mating operator uses free recombination, where every bit of
the child has a 50% probability of coming from either parent; this
ensures rapid mixing of mosaic features. With probability r the
algorithm also induces genomic rearrangement in the offspring
mosaic, by swapping adjacent fragments around a randomly
selected breakpoint. Third, the existing population is augmented
with the offspring, resulting in 2I mosaics, ranked according to
BIC and filtered to include I top-scoring mosaics in the next
generation; this induces a strong selective pressure to remove
mosaics with low fitness scores.
Mutational processes are available to re-introduce genetic
variability into inbred populations. First, hypermutation is triggered
if the diversity of the population, measured as the relative difference
between in BIC between the best and worst fitting mosaic (i.e.
max BIC=min BIC{1), drops below a fixed threshold, l. All
mosaics in the population, except the best fitting one, have their bits
toggled with fixed probability m. Second, if no generation-to-
generation BIC improvement was observed for d consecutive
generations, local mutation is carried out. The bottom two thirds of
the population are replaced by mutated versions of the best fitting
mosaic, generated by selecting a fragment to mutate at random and
providing local coverage for that fragment. Local coverage is
introduced by first drawing a random branch if the gene encodes a
lineage, or a random position within 0:05{0:35½ �L bp of the
current position for a breakpoint location gene, and then generating
2=3I consecutive values for the gene. For example, if the new
random position for the breakpoint is drawn as 690, then mosaics
with the breakpoint at 690,691, . . . 690z2=3I{1 will be placed in
the population.
The algorithm terminates if no BIC improvement has been
obtained for t consecutive generations. The number of breakpoints
is increased from 1 until no BIC improvement has been found for
two consecutive values of B. The case of B~0 is solved exhaustively;
the initial population for B~1 is generated randomly; the initial
population for Bw1 is seeded by the best mosaic from the B{1run, with a randomly placed additional breakpoint and lineage
assignment. For B§2, we also add a step down procedure to
confirm that the improvement in score obtained by incrementing Bwas due to a genuine additional breakpoint and not due to
premature termination at the previous step (B{1); to do so, we
generate I mosaics by randomly removing a breakpoint from the
best-fitting mosaic with B breakpoints (randomly assigning the
query sequence to one of the two parental lineages, and introducing
mutations at rate m=10) and run an iteration of the GA with B{1points using the I mosaics as a starting population. If the follow-up
GA with B{1 breakpoints matches or improves upon the score
with B breakpoints, then the next phase of the GA is run on Bbreakpoints, otherwise, the next phase operates on Bz1 break-
points. To further enhance algorithm robustness, we evolve three
independent populations (from completely random starting mosaics)
to convergence, compose the mixed population by taking the top-
scoring third of each population and evolve the combined
population until convergence.
While it is possible to use the GA to also search for B directly
(e.g. by duplicating or removing fragments), we found that the
incremental search for B with the step-down verification stage has
better convergence properties and runs considerably faster.
Algorithm parameter values selected for the analyses in this
paper are as follows: I~56z8B, t~45z5B, d~0:45t, m~0:20,
l~0:0025, r~0:05, w~100. parameter values were selected
based on our previous experience with GARD [29], and further
adjusted based on how well the algorithm performed on simulated
data and run time.
Result processingAfter a GA run, BIC scores and mosaics from a large (typically
2000{30000) number (M) of fitted mosaics is available for
processing. Instead of basing inference on the single best fitting
mosaic, we adopt a multi-model inference procedure, whereby the
contribution of each fitted mosaic is weighted based on its
goodness-of-fit. Given the BIC score (fitness) of the best mosaic
from the run, w0, for every mosaic Mi, we compute its Akaike
weight, wi defined in terms of its BIC score wi as
wi~exp w0{wið Þ=2½ �
C:
The constant C is chosen so thatP
i wi~1. wi can be interpreted
as the probability that the i-th mosaic provides the best fit to the
data [42].
We report the following quantities for each GA mosaic screen
1. The structure of the best fitting mosaic, represented as the
location of inferred breakpoints and lineage assignments, e.g.
A200B400A.
2. The model averaged support for the mosaic structure of the
best model. This is defined as the sum of Akaike weights of all
those models which agree with the best fitting model in
everything except the coordinates of the breakpoints. E.g.
A190B405A is consistent with A200B400A, but A200C400A is not.
High values (e.g. w0:9) of the model averaged support indicate
that there are no other discordant mosaic structures that
explain the evolutionary history of the query sequence.
3. Model-averaged support for the locations of the breakpoints,
that is computed by tabulating the model-averaged probability
of observing a breakpoint at a given site over all sites in the
alignment, based on the normalized Akaike weights of the
models whose mosaics are consistent with the best fitting
model. For instance the model A188B398A will contribute its
Akaike weight to sites 188 and 398. To determine 95%confidence intervals for each breakpoint from the best fitting
model, we build symmetric intervals around each breakpoint
that contain at least 0:95 the support. Note that confidence
intervals are not uniquely defined in this setting (for example,
we could extend the interval in the direction where the site
immediately outside the current interval has greater model
averaged support of a breakpoint), and we adopt symmetric
intervals for simplicity.
Automated sequence alignmentThe genetic algorithm requires the alignment of reference
sequences with the query sequence as input that can be generated
by any of the multiple sequence alignment programs. However
because the reference alignment does not depend on the query
sequence, it does not need to be re-aligned every time a new
sequence is queried against it and the following simple heuristic
can be employed. We preprocess the reference alignment by fitting
an evolutionary model (nucleotide or codon for coding alignments)
using the reference tree and inferring the root sequence for the
reference tree using the joint maximum likelihood of [43]. Gaps in
the alignment are treated as missing data from the purposes of root
sequence reconstruction. In particular, the root sequence will not
Evolutionary Algorithm for HIV Subtype Prediction
PLoS Computational Biology | www.ploscompbiol.org 7 November 2009 | Volume 5 | Issue 11 | e1000581
contain any gaps when reconstructed under standard nucleotide
evolutionary models, because no sites in the reference alignment
consist solely of gaps. This inferred root sequence can then be
directly aligned with the query sequence using the Needleman-
Wunsch dynamic programming algorithm [44], with affine gap
costs and zero prefix and suffix gap costs on nucleotide or
translated amino-acid data, and then up-converted into a multiple
sequence alignment with all reference sequences consistent with
the reference alignment. When aligning HIV or other viral
sequences, organism specific scoring matrices [45] can be used to
improve alignment quality. In addition to being very fast, this
alignment heuristic is unlikely to introduce difficult-to-quantify
biases common in progressive alignment approaches (e.g. [46]).
Reference alignment generationWe adopted a step-wise procedure of HIV-1 reference alignment
construction. Beginning with a seed alignment of three sequences (e.g.
one each from A, B and C for HIV-1), screened by GARD to ensure
that the seed sequences are not recombinant, we augment the seed
alignment from a collection of potential subtype reference sequences
downloaded from the LANL HIV database. If a database sequence is
labelled as pure subtype in LANL, is at least 6% distant (Tamura-Nei
93 [47] genetic distance) from every sequence in the seed alignment,
and is reported as being non-recombinant by SCUEAL, then it is
added to the reference alignment. The process repeats until the
collection of potential reference sequences has been exhausted.
Reference sequences for circulating recombinant forms (CRFs)
are processed in a similar way, except that if the CRF sequence
has N breakpoints in the region for which the reference alignment
is being built (e.g. the pol gene), then it is represented by up to
Nz1 sequences in the final alignment. For instance, a 1000 bp
sequence with the mosaic structure A200B700A, will be represented
by a sequence that clusters with the A clade and contains bases
from 1–199 and 700–1000 and gaps between positions 200 and
699, and a complementary sequence (bases between 200 and 699,
gaps elsewhere) that clusters with clade B. This is necessary to
correctly place a recombinant sequence on the single reference
tree. The GA disallows mosaic structures in which a query
sequence would cluster with artificially introduced gaps in CRF
component sequences. SCUEAL will correctly interpret clustering
with the constituent sequences as clustering with the single CRF
for the purposes of subsequent inference.
The resulting full length HIV-1 reference polymerase alignment
comprised 167 sequences encompassing the ‘‘pure’’ subtypes
(including AE, N and O clades), SIVcpz and a reference strain
from each of the CRFs (except CRF26,CRF38 and CRF41–43)
for which no full length pol reference sequences were present
in the database) listed in the Los Alamos HIV CRF compendi-
um (http://www.hiv.lanl.gov/content/sequence/HIV/CRFs/CRFs.
html accessed December 17th, 2008). We note that this procedure is
not guaranteed to avoid mislabeling recombinant sequences as pure
subtypes. Indeed if the recombinant strain is added to the reference
before the parental strains, the latter will be incorrectly described as
recombinants. For example, the original classification of subtype G
sequences as a ‘‘pure’’ subtype is likely an artifact of the order in
which A,G and CRF02 sequences were added to public databases
[8]. Nonetheless, our procedure is undoubtedly an improvement
over simply taking a collection of database sequences as a reference
and assuming that they can be adequately described by a single tree;
this practice should be avoided.
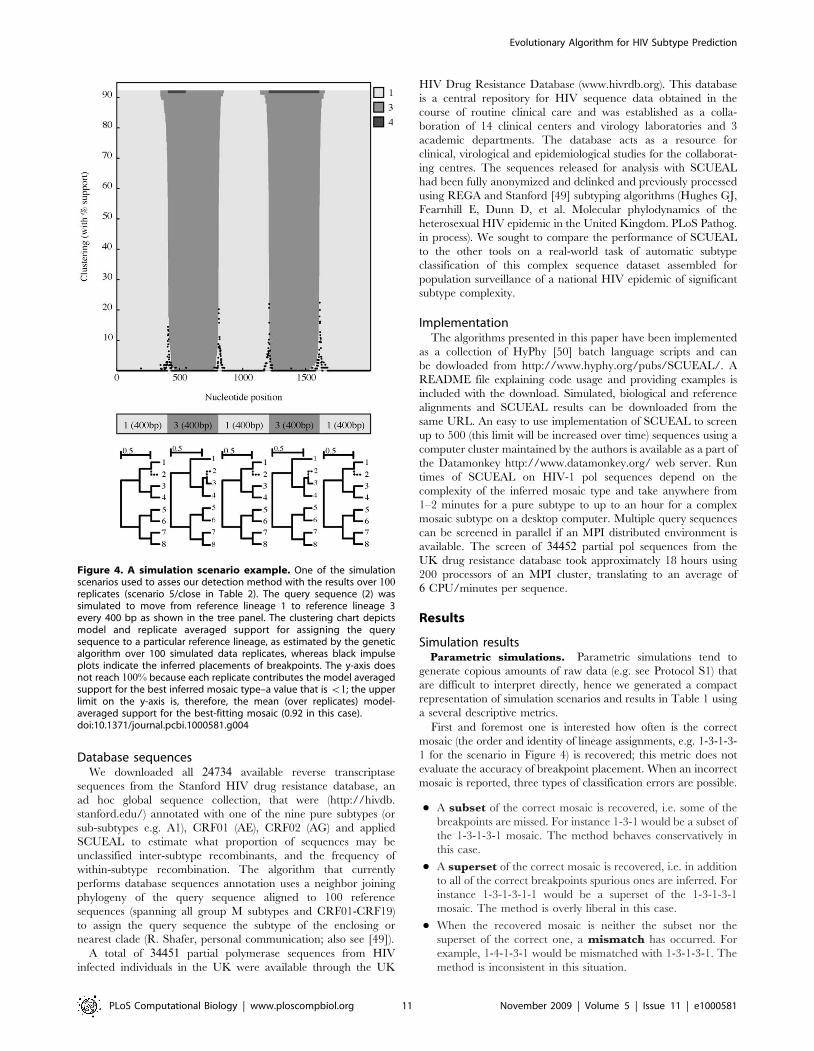
Simulated dataEach of the simulation scenarios summarized in Table 1
comprised 100 parametrically generated alignments, using the
general time reversible model of nucleotide substitution [31],
equilibrium base frequencies of pA~0:4, pC~0:2, pG~0:1 and
pT~0:3, substitution rate parameters of hAC~2:0, hAG~4:0,hAT~0:8, hGC~0:9, hCT~5:0, hGT~1:0, and site-to-site rate
heterogeneity modeled a G+I distribution with 20% of invariant
sites and the shape parameter of a~0:8; all these parameters were
selected to resemble values found in biological alignments of
HIV-1. Recombination was introduced by generating alignments
of fixed lengths along different tree topologies and then
concatenating them; the spacing between breakpoints, tree
topologies used and recombinant lineages are shown in the
middle pane of each each figure; simulated data are available at
http://www.hyphy.org/pubs/SCUEAL/. The trees were con-
strained to conform to the assumptions of the model–only one
sequence (the query) was permitted to migrate from lineage to
lineage. The correct tree and reference sequences were used for
screening. The evolutionary scenarios used for simulation were
designed to cover a range of recombination patterns with respect
to the distribution of breakpoints, the level of sequence divergence
and how far in the tree the recombinant sequence moved (close,
medium or divergent). A subset of scenarios dealt with ‘ancient’
recombination events, i.e. lineage assignments to internal tree
branches (for HIV-1 this would be equivalent to the recombina-
tion event predating the proliferation of the subtype). Several
examples were specifically selected to mimic different divergence
levels of HIV-1. An example of one recombination scenario is
given in Figure 4 and the number and location of breakpoints can
be found in Table 1. The collection of analogous figures for every
simulation scenario can be found in Protocol S1.
Because mosaic analyses are frequently used in HIV-1
research, we also generated 10000 sequences by concatenating
fragments from 863 sequences of partial HIV-1 polymerase
genes, spanning all of protease up to 1320 nucleotides of reverse
transcriptase obtained from the Los Alamos HIV sequence
database (http://hiv.lanl.gov). Each sequence was pre-screened
using SCUEAL to ensure that only pure subtypes formed the
base of this simulation. The number of fragments for each simu-
lated sequence was drawn from a +1-shifted Poisson distribution
with the mean of 1:5 breakpoints/alignment; this guaranteed at
least one breakpoint per alignment. The length of each fragment
as a proportion of the total alignment length of 1617bp was
determined using the stick-breaking process with beta distribution
parameters p~q~3. A 0,1½ � value was drawn from the beta
distribution and the longest remaining fragment was split in that
proportion to introduce each consecutive breakpoint into a
sequence; if the shorter of the two resulting fragments was not at
least 100bp long, the proportion was rejected and the process was
repeated with a new beta-distributed proportion. Simulated
sequences were screened against an alignment of 167 pure
subtype reference sequences culled from our pol reference set (no
CRFs were included in the reference). Note that because
reference sequences were not identical to those used to generate
the mosaics, this scenario simulated both recombination and
mutational divergence found in HIV-1.
A Surveillance StudyA bread-and-butter application of HIV subtyping algorithms is
to characterize the subtype distribution in a cohort of patients or a
geographic region and make inferences about the history and
dynamics of HIV infection. We selected one of such recently
published studies [48] that subtyped 81 partial pol sequences from
Bulgaria using REGA and found a diverse composition of
subtypes, including three unassigned sequences.
Evolutionary Algorithm for HIV Subtype Prediction
PLoS Computational Biology | www.ploscompbiol.org 8 November 2009 | Volume 5 | Issue 11 | e1000581

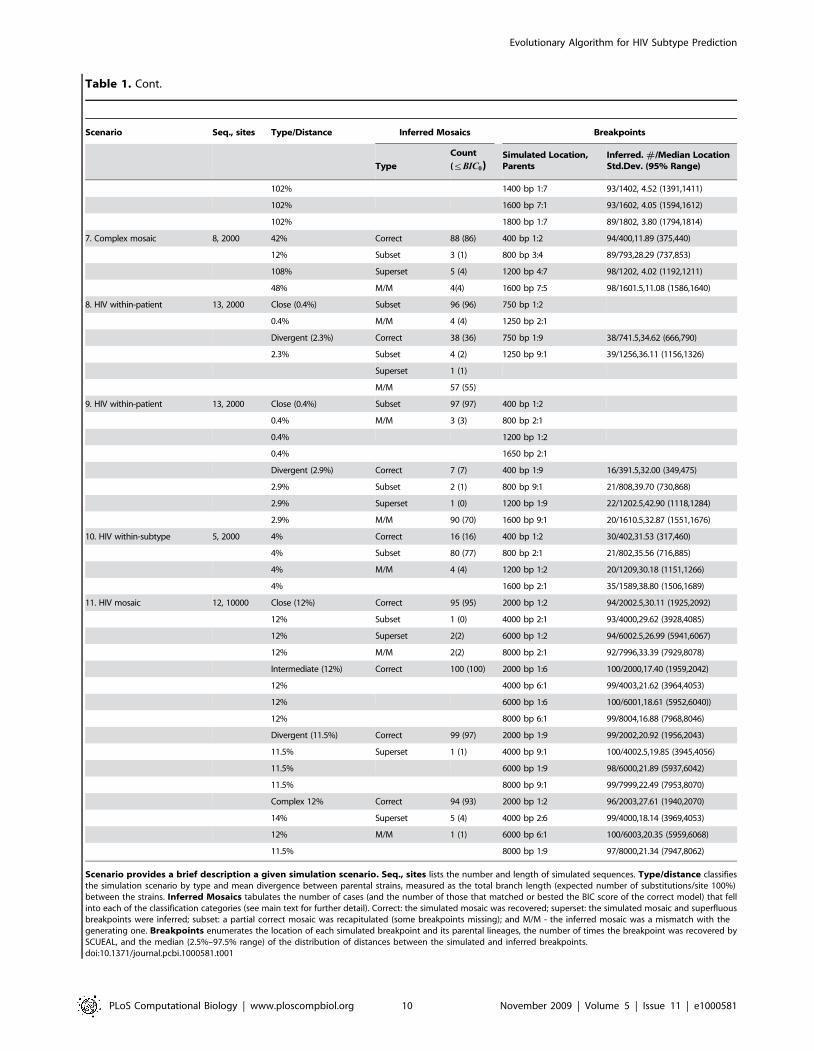
Table 1. SCUEAL performance on simulated data.
Scenario Seq., sites Type/Distance Inferred Mosaics Breakpoints
Type
Count
(ƒBIC0)Simulated Location,Parents
Inferred. #/Median LocationStd.Dev. (95% Range)
1. No recombination 8,2000 N/A Correct 100 (100) None
2. An evident breakpoint 8,2000 Close (42%) Correct 100 (88) 1000 bp 1:3 100/990,18.99 (931,1015)
Divergent (102%) Correct 100 (75) 1000 bp 1:7 100/1000, 5.04 (987,1007)
Ancient (69%) Correct 92 (86) 1000 bp 1/2:5/6 96/992,16.62 (947,1017)
Superset 7 (6)
M/M 1 (1)
3. Two evident breakpoints 8,2000 Close (42%) Correct 98 (96) 750 bp 1:3 99/749,10.23 (720,769)
42% Superset 1 (1) 1250 bp 7:1 99/1251,15.26 (1201,1273)
M/M 1 (1)
102%ð Þ Divergent Correct 95 (89) 750 bp 1:7 98/751, 5.61 (735,762)
102% Superset 5 (5) 1250 bp 7:1 100/1251, 5.92 (1237,1265)
Ancient (69%) Correct 91 (90) 750 bp 1/2:5/6 96/749,22.37 (697,824)
69% Superset 5 (4) 1250 bp 5/6:1/2 96/1250,20.09 (1192,1283)
M/M 4 (4)
4. Two close breakpoints 8, 2000 Close (42%) Correct 22 (21) 950 bp 1:3 22/948,15.35 (888,960)
42% Subset 77 (76) 1050 bp 3:1 22/1050, 7.77 (1031,1066)
M/M 1 (1)
Divergent (102%) Correct 73 (69) 950 bp 1:7 73/951, 6.40 (932,960)
102% Subset 11 (0) 1050 bp 7:1 73/1051, 5.79 (1038,1068)
M/M 16 (15)
5. Four breakpoints 8, 2000 Close (42%) Correct 96 (96) 400 bp 1:3 98/399,16.86 (342,428)
42% Superset 3 (2) 800 bp 3:1 97/803, 9.63 (784,837)
42% M/M 1 (1) 1200 bp 1:3 98/1200,11.34 (1161,1220)
42% 1600 bp 3:1 99/1602,12.24 (1570,1634)
Divergent (102%) Correct 96 (96) 400 bp 1:7 98/401, 5.08 (389,413)
102% Superset 2 (2) 800 bp 7:1 99/802, 5.00 (785,809)
102% M/M 2 (2) 1200 bp 1:7 99/1201, 5.73 (1188,1211)
102% 1600 bp 7:1 99/1602, 4.19 (1594,1613)
Ancient (69%) Correct 54 (54) 400 bp 1/2:5/6 65/402,14.88 (357,434)
69% Subset 22 (3) 800 bp 5/6:1/2 67/802,15.74 (745,826)
69% M/M 20 (19) 1200 bp 1/2:5/6 69/1201,19.67 (1169,1270)
69% Superset 4 (4) 1600 bp 5/6:1/2 69/1602,18.04 (1550,1627)
6. Nine breakpoints 8,2000 Close (42%) Correct 30 (30) 200 bp 1:3 68/201,11.72 (176,235)
42% Subset 13 (2) 400 bp 3:1 62/403, 8.18 (391,420))
42% Superset 9 (7) 600 bp 1:3 68/601,14.69 (561,634)
42% 48 (25) 800 bp 3:1 71/803,10.72 (783,838)
42% 1000 bp 1:3 71/1001,10.95 (974,1021)
42% 1200 bp 3:1 72/1203,13.14 (1177,1253)
42% 1400 bp 1:3 75/1401,11.45 (1364,1414)
42% 1600 bp 3:1 73/1602, 8.52 (1582,1626)
42% 1800 bp 1:3 77/1801,13.40 (1746,1816)
Divergent (102%) Correct 64 (64) 200 bp 1:7 96/202, 4.87 (188,212)
102% Superset 9(7) 400 bp 7:1 94/402, 7.98 (386,415)
102% M/M 27 (25) 600 bp 1:7 93/601, 5.95 (591,625)
102% 800 bp 7:1 93/802, 5.37 (790,815)
102% 1000 bp 1:7 92/1002, 5.35 (985,1015)
102% 1200 bp 7:1 93/1202, 6.17 (1191,1228)
Evolutionary Algorithm for HIV Subtype Prediction
PLoS Computational Biology | www.ploscompbiol.org 9 November 2009 | Volume 5 | Issue 11 | e1000581
Scenario Seq., sites Type/Distance Inferred Mosaics Breakpoints
Type
Count
(ƒBIC0)Simulated Location,Parents
Inferred. #/Median LocationStd.Dev. (95% Range)
102% 1400 bp 1:7 93/1402, 4.52 (1391,1411)
102% 1600 bp 7:1 93/1602, 4.05 (1594,1612)
102% 1800 bp 1:7 89/1802, 3.80 (1794,1814)
7. Complex mosaic 8, 2000 42% Correct 88 (86) 400 bp 1:2 94/400,11.89 (375,440)
12% Subset 3 (1) 800 bp 3:4 89/793,28.29 (737,853)
108% Superset 5 (4) 1200 bp 4:7 98/1202, 4.02 (1192,1211)
48% M/M 4(4) 1600 bp 7:5 98/1601.5,11.08 (1586,1640)
8. HIV within-patient 13, 2000 Close (0.4%) Subset 96 (96) 750 bp 1:2
0.4% M/M 4 (4) 1250 bp 2:1
Divergent (2.3%) Correct 38 (36) 750 bp 1:9 38/741.5,34.62 (666,790)
2.3% Subset 4 (2) 1250 bp 9:1 39/1256,36.11 (1156,1326)
Superset 1 (1)
M/M 57 (55)
9. HIV within-patient 13, 2000 Close (0.4%) Subset 97 (97) 400 bp 1:2
0.4% M/M 3 (3) 800 bp 2:1
0.4% 1200 bp 1:2
0.4% 1650 bp 2:1
Divergent (2.9%) Correct 7 (7) 400 bp 1:9 16/391.5,32.00 (349,475)
2.9% Subset 2 (1) 800 bp 9:1 21/808,39.70 (730,868)
2.9% Superset 1 (0) 1200 bp 1:9 22/1202.5,42.90 (1118,1284)
2.9% M/M 90 (70) 1600 bp 9:1 20/1610.5,32.87 (1551,1676)
10. HIV within-subtype 5, 2000 4% Correct 16 (16) 400 bp 1:2 30/402,31.53 (317,460)
4% Subset 80 (77) 800 bp 2:1 21/802,35.56 (716,885)
4% M/M 4 (4) 1200 bp 1:2 20/1209,30.18 (1151,1266)
4% 1600 bp 2:1 35/1589,38.80 (1506,1689)
11. HIV mosaic 12, 10000 Close (12%) Correct 95 (95) 2000 bp 1:2 94/2002.5,30.11 (1925,2092)
12% Subset 1 (0) 4000 bp 2:1 93/4000,29.62 (3928,4085)
12% Superset 2(2) 6000 bp 1:2 94/6002.5,26.99 (5941,6067)
12% M/M 2(2) 8000 bp 2:1 92/7996,33.39 (7929,8078)
Intermediate (12%) Correct 100 (100) 2000 bp 1:6 100/2000,17.40 (1959,2042)
12% 4000 bp 6:1 99/4003,21.62 (3964,4053)
12% 6000 bp 1:6 100/6001,18.61 (5952,6040))
12% 8000 bp 6:1 99/8004,16.88 (7968,8046)
Divergent (11.5%) Correct 99 (97) 2000 bp 1:9 99/2002,20.92 (1956,2043)
11.5% Superset 1 (1) 4000 bp 9:1 100/4002.5,19.85 (3945,4056)
11.5% 6000 bp 1:9 98/6000,21.89 (5937,6042)
11.5% 8000 bp 9:1 99/7999,22.49 (7953,8070)
Complex 12% Correct 94 (93) 2000 bp 1:2 96/2003,27.61 (1940,2070)
14% Superset 5 (4) 4000 bp 2:6 99/4000,18.14 (3969,4053)
12% M/M 1 (1) 6000 bp 6:1 100/6003,20.35 (5959,6068)
11.5% 8000 bp 1:9 97/8000,21.34 (7947,8062)
Scenario provides a brief description a given simulation scenario. Seq., sites lists the number and length of simulated sequences. Type/distance classifiesthe simulation scenario by type and mean divergence between parental strains, measured as the total branch length (expected number of substitutions/site 100%)between the strains. Inferred Mosaics tabulates the number of cases (and the number of those that matched or bested the BIC score of the correct model) that fellinto each of the classification categories (see main text for further detail). Correct: the simulated mosaic was recovered; superset: the simulated mosaic and superfluousbreakpoints were inferred; subset: a partial correct mosaic was recapitulated (some breakpoints missing); and M/M - the inferred mosaic was a mismatch with thegenerating one. Breakpoints enumerates the location of each simulated breakpoint and its parental lineages, the number of times the breakpoint was recovered bySCUEAL, and the median (2.5%–97.5% range) of the distribution of distances between the simulated and inferred breakpoints.doi:10.1371/journal.pcbi.1000581.t001
Table 1. Cont.
Evolutionary Algorithm for HIV Subtype Prediction
PLoS Computational Biology | www.ploscompbiol.org 10 November 2009 | Volume 5 | Issue 11 | e1000581
Database sequencesWe downloaded all 24734 available reverse transcriptase
sequences from the Stanford HIV drug resistance database, an
ad hoc global sequence collection, that were (http://hivdb.
stanford.edu/) annotated with one of the nine pure subtypes (or
sub-subtypes e.g. A1), CRF01 (AE), CRF02 (AG) and applied
SCUEAL to estimate what proportion of sequences may be
unclassified inter-subtype recombinants, and the frequency of
within-subtype recombination. The algorithm that currently
performs database sequences annotation uses a neighbor joining
phylogeny of the query sequence aligned to 100 reference
sequences (spanning all group M subtypes and CRF01-CRF19)
to assign the query sequence the subtype of the enclosing or
nearest clade (R. Shafer, personal communication; also see [49]).
A total of 34451 partial polymerase sequences from HIV
infected individuals in the UK were available through the UK
HIV Drug Resistance Database (www.hivrdb.org). This database
is a central repository for HIV sequence data obtained in the
course of routine clinical care and was established as a colla-
boration of 14 clinical centers and virology laboratories and 3
academic departments. The database acts as a resource for
clinical, virological and epidemiological studies for the collaborat-
ing centres. The sequences released for analysis with SCUEAL
had been fully anonymized and delinked and previously processed
using REGA and Stanford [49] subtyping algorithms (Hughes GJ,
Fearnhill E, Dunn D, et al. Molecular phylodynamics of the
heterosexual HIV epidemic in the United Kingdom. PLoS Pathog.
in process). We sought to compare the performance of SCUEAL
to the other tools on a real-world task of automatic subtype
classification of this complex sequence dataset assembled for
population surveillance of a national HIV epidemic of significant
subtype complexity.
ImplementationThe algorithms presented in this paper have been implemented
as a collection of HyPhy [50] batch language scripts and can
be dowloaded from http://www.hyphy.org/pubs/SCUEAL/. A
README file explaining code usage and providing examples is
included with the download. Simulated, biological and reference
alignments and SCUEAL results can be downloaded from the
same URL. An easy to use implementation of SCUEAL to screen
up to 500 (this limit will be increased over time) sequences using a
computer cluster maintained by the authors is available as a part of
the Datamonkey http://www.datamonkey.org/ web server. Run
times of SCUEAL on HIV-1 pol sequences depend on the
complexity of the inferred mosaic type and take anywhere from
1–2 minutes for a pure subtype to up to an hour for a complex
mosaic subtype on a desktop computer. Multiple query sequences
can be screened in parallel if an MPI distributed environment is
available. The screen of 34452 partial pol sequences from the
UK drug resistance database took approximately 18 hours using
200 processors of an MPI cluster, translating to an average of
6 CPU/minutes per sequence.
Results
Simulation resultsParametric simulations. Parametric simulations tend to
generate copious amounts of raw data (e.g. see Protocol S1) that
are difficult to interpret directly, hence we generated a compact
representation of simulation scenarios and results in Table 1 using
a several descriptive metrics.
First and foremost one is interested how often is the correct
mosaic (the order and identity of lineage assignments, e.g. 1-3-1-3-
1 for the scenario in Figure 4) is recovered; this metric does not
evaluate the accuracy of breakpoint placement. When an incorrect
mosaic is reported, three types of classification errors are possible.
N A subset of the correct mosaic is recovered, i.e. some of the
breakpoints are missed. For instance 1-3-1 would be a subset of
the 1-3-1-3-1 mosaic. The method behaves conservatively in
this case.
N A superset of the correct mosaic is recovered, i.e. in addition
to all of the correct breakpoints spurious ones are inferred. For
instance 1-3-1-3-1-1 would be a superset of the 1-3-1-3-1
mosaic. The method is overly liberal in this case.
N When the recovered mosaic is neither the subset nor the
superset of the correct one, a mismatch has occurred. For
example, 1-4-1-3-1 would be mismatched with 1-3-1-3-1. The
method is inconsistent in this situation.
Figure 4. A simulation scenario example. One of the simulationscenarios used to asses our detection method with the results over 100replicates (scenario 5/close in Table 2). The query sequence (2) wassimulated to move from reference lineage 1 to reference lineage 3every 400 bp as shown in the tree panel. The clustering chart depictsmodel and replicate averaged support for assigning the querysequence to a particular reference lineage, as estimated by the geneticalgorithm over 100 simulated data replicates, whereas black impulseplots indicate the inferred placements of breakpoints. The y-axis doesnot reach 100% because each replicate contributes the model averagedsupport for the best inferred mosaic type–a value that is v1; the upperlimit on the y-axis is, therefore, the mean (over replicates) model-averaged support for the best-fitting mosaic (0.92 in this case).doi:10.1371/journal.pcbi.1000581.g004
Evolutionary Algorithm for HIV Subtype Prediction
PLoS Computational Biology | www.ploscompbiol.org 11 November 2009 | Volume 5 | Issue 11 | e1000581
When a classification error occurs, it can either be because the
GA failed to find the optimal solution, or because there is
insufficient signal (due to small fragment length, low divergence
etc) to infer the correct mosaic using the BIC criterion. The error
due to the GA is an undesirable outcome, and we categorize each
of the misclassified replicates into those which had worse fitness
than the correct model (GA error) and those which had better
fitness that the correct models (insufficient signal).
Second, we tabulated how often each of the correct breakpoints
was recovered, and collected descriptive statistics about where the
inferred locations were placed. A breakpoint was inferred
‘recovered’ if SCUEAL inferred at least one breakpoint, and the
nearest inferred breakpoint to the simulated position involved
correct parental lineages. For instance, a simulated A to B
breakpoint at nucleotide 1000 would be counted as recovered in
the inferred mosaic A900B1200C1400A, but not in A800B1100C1500A.
The method has a very low rate of false positives correctly
classifying 100/100 cases in Scenario 1 (no recombination).
SCUEAL shows excellent operating characteristics when sequence
divergence between parental strains and/or non-recombinant
fragment length is sufficiently high; these two parameters
approximate information content in the sequence. In scenarios
2,3,5 (except ancient recombination), 7 and notably, 11 (designed
to simulate a typical HIV-1 CRF situation), SCUEAL assigned
88% or more of replicates to the correct mosaic type; each of the
breakpoints was also mapped very accurately with the standard
deviation on the order of 10 bp. A very short non-recombinant
fragment in scenario 4 (100 bp) made it difficult to detect
recombination reliably; increasing the distance between parental
strains dramatically increased the power, however from 22% for
close parents to 73% for distant parents.
Ancestral recombination involving interior branches in the tree
(e.g. see Protocol S1) also complicated mosaic classification
because of weaker phylogenetic signal. In all three scenarios with
the ancient option (2,3 and 5), the proportion of correctly
identified mosaics was lower than for extant parental lineage
situation, but in most missed (42=63) cases the assigned mosaic had
a better BIC score - suggesting lack of phylogenetic signal as the
main source of error. Overall, the ability of SCUEAL to accurately
describe over 50% of mosaics due to ancient recombination is
encouraging as many HIV-1 CRFs appear to be the result of
ancient recombination, i.e. they fail to unambiguously cluster with
any of the reference ‘‘pure’’ subtypes.
The complex pattern in scenario 6, where 10 non-recombinant
fragments of length 200 bp each, made concurrent detection of all 9
breakpoints difficult (30% for close parents and 64% for divergent
strains). However, this was mostly due to one or two missed
breakpoints–the average accuracy of mapping each individual
breakpoint was high (&70%=close, &90%=divergent), with no
single breakpoint (e.g. in the middle of the alignment vs close to one
of the ends) missed at an abnormally high frequency. Scenario
6/close, is the only scenario (many short fragments with relatively
close parental strains) where the majority 36=70 of classification
errors were due to premature GA termination; this could be
improved by adjusting GA parameters at the expense of longer run
times.
SCUEAL could not detect recombination in sequences with
very low (0:4%) parental strain divergence (scenarios 8/close and
9/close), and had low (&20%) power in breakpoint detection for
2{4% divergent strains in scenarios 8/divergent, 9/divergent and
10, overwhelmingly due to lack of phylogenetic signal and not to
premature GA convergence.
Each individual detected breakpoint was on average very close
(standard deviations in the range of 5–20 bp) to a true breakpoint,
confirming that SCUEAL produces a high-resolution breakpoint
map.
HIV pol simulations. Using the classification defined in the
previous section, SCUEAL performance on 10000 simulated data
sets can be summarized thus: 46:57% correct sequence mosaics (i.e.
each breakpoint and correct lineage) were recovered, 27:99%recovered mosaics were supersets (extra breakpoints) of the correct
type, 22:22% - subsets (missed breakpoints) of the correct type, and
3:19% - mismatched. Overall, 86:24% of the replicates were
correctly identified as recombinant strains. Of 15042 simulated
breakpoints, 11912 79:2%ð Þ were recovered correctly, with a median
distance between the simulated and the inferred breakpoint of 9 bp(0{242 bp for the 2:5%{97:5% range). Median level of model
averaged support for the inferred mosaic was estimated at 0:92.
However, these numbers alone do not present the complete
picture of how the method performed - the power to detect
recombination is significantly dependant upon the length of
recombinant strains (e.g. a 500 bp fragment is easier to detect than
a 100 bp one on average), and the relative level of divergence
between parental strains (e.g. inter-subtype recombination is easier
to detect than within-subtype). To capture these dependancies, we
binned all breakpoints in simulated strains by the length of the
shorter of the flanking fragments and the pairwise genetic distances
between parental strains over that fragment. For example the
breakpoint in a mosaic of type A–B with the 500 bp coming from
subtype A and 200 bp coming from subtype B, would contribute
to the bin with 200 bp length and the genetic distance between
strain A and strain B over the last 200 bp of the sequences. We
next plotted detection power, i.e. the proportion of times a correct-
type breakpoint (e.g. A–B for the previous example) was inferred
within 100 bp of the simulated breakpoint (see Fig. 5). The power
of the method to detect a breakpoint grows with the length of the
flanking recombinant fragments and the genetic distance of the
two parental strains. For example, 88:3% of all breakpoints
generated from sequences more than 5% divergent and involving
fragments of at least 200 bp on either side were correctly
identified. The fraction increased to 95:7% for 7% or greater
divergence and at least 400 bp-long fragments–values encountered
with commonly annotated inter-subtype recombinant mosaics
in HIV.
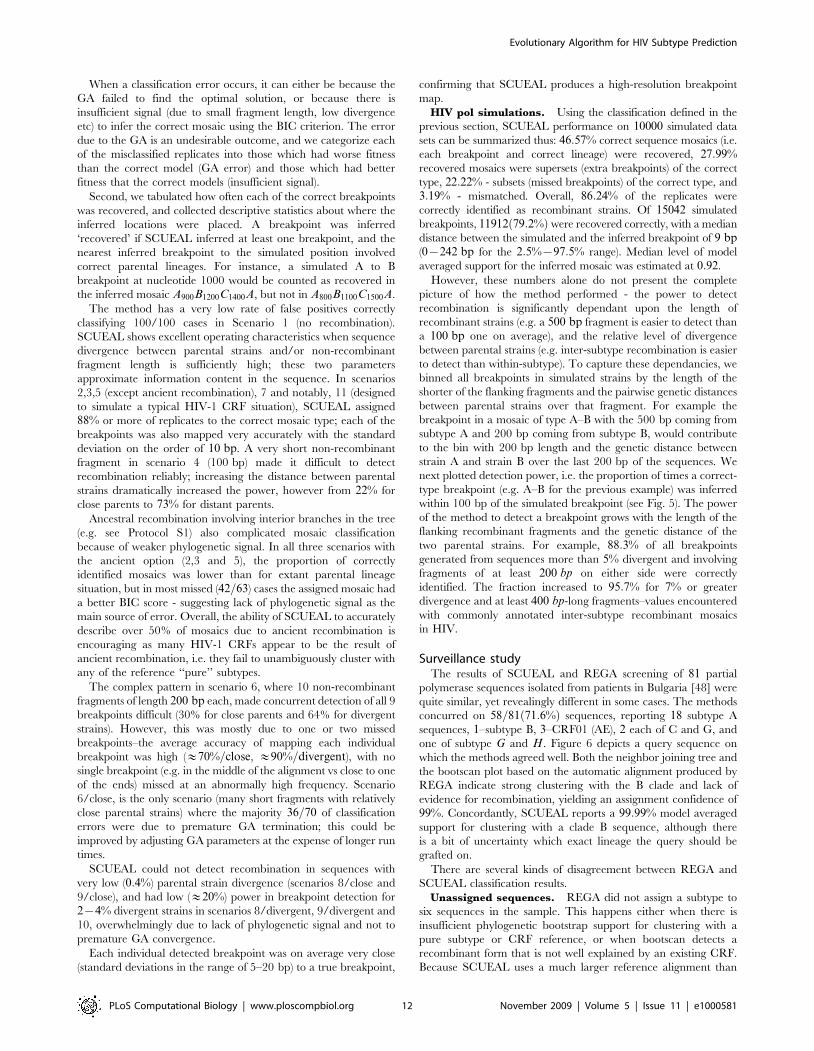
Surveillance studyThe results of SCUEAL and REGA screening of 81 partial
polymerase sequences isolated from patients in Bulgaria [48] were
quite similar, yet revealingly different in some cases. The methods
concurred on 58=81 71:6%ð Þ sequences, reporting 18 subtype A
sequences, 1–subtype B, 3–CRF01 (AE), 2 each of C and G, and
one of subtype G and H. Figure 6 depicts a query sequence on
which the methods agreed well. Both the neighbor joining tree and
the bootscan plot based on the automatic alignment produced by
REGA indicate strong clustering with the B clade and lack of
evidence for recombination, yielding an assignment confidence of
99%. Concordantly, SCUEAL reports a 99:99% model averaged
support for clustering with a clade B sequence, although there
is a bit of uncertainty which exact lineage the query should be
grafted on.
There are several kinds of disagreement between REGA and
SCUEAL classification results.
Unassigned sequences. REGA did not assign a subtype to
six sequences in the sample. This happens either when there is
insufficient phylogenetic bootstrap support for clustering with a
pure subtype or CRF reference, or when bootscan detects a
recombinant form that is not well explained by an existing CRF.
Because SCUEAL uses a much larger reference alignment than
Evolutionary Algorithm for HIV Subtype Prediction
PLoS Computational Biology | www.ploscompbiol.org 12 November 2009 | Volume 5 | Issue 11 | e1000581

REGA (e.g. there are 59 sequences in the greater B clade, including
a number of CRF fragments that cover parts of the pol gene, vs 2 in
the default REGA) alignment, it was able to assign 4 of the 6sequences to subtype B with high (w80%) confidence. Interestingly,
these sequences were grafted onto interior branches of the B
clade, highlighting the intrinsic power of SCUEAL of being able
to make full use of the fixed reference topology. The remaining
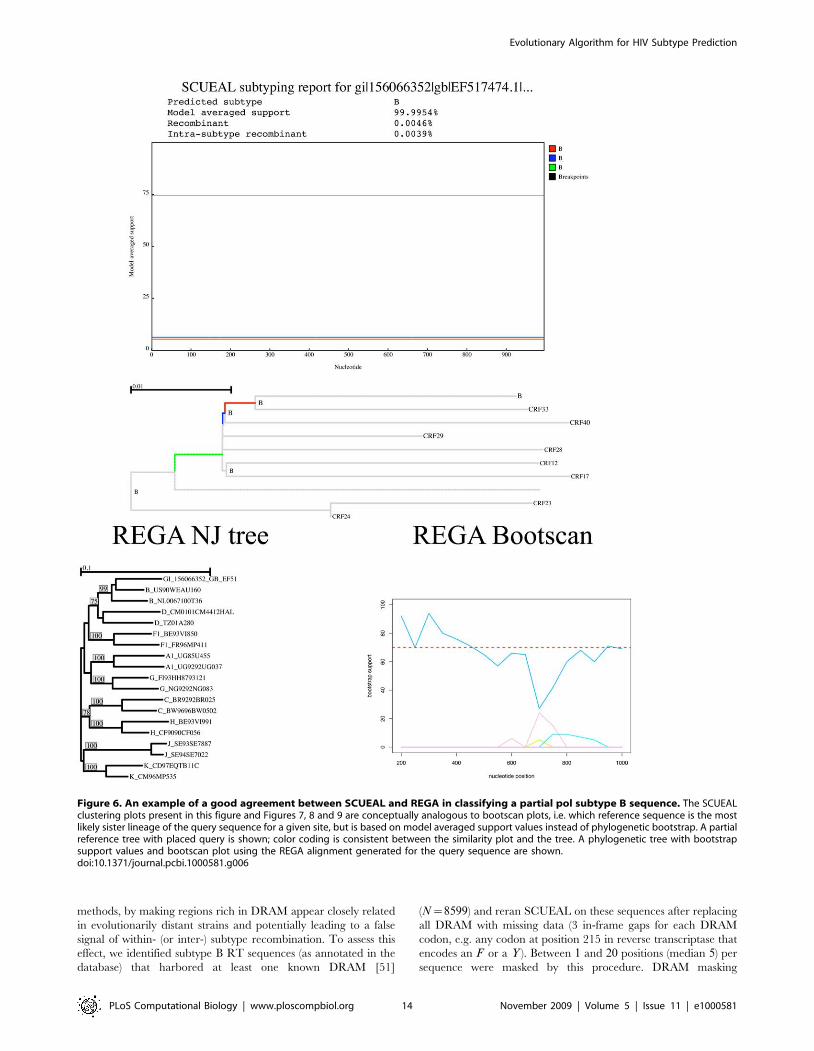
two sequences were classified as novel recombinant forms, in
congruence with the bootscan profile. For example, in Figure 7, a
novel A–J recombinant is reported by both methods, but REGA’s
conservative assignment scheme would still report this case as
unassigned. SCUEAL proposes several A–J type recombinant
forms, with A-A1-J-A2 being the best supported one; overall there
is 100% model-averaged support for presence of recombination in
this sequence. Due to a much larger set of subtype A reference
sequences, our approach is capable of a more precise character-
ization of the mosaic, whose breakpoints are mapped very
accurately (to +1 base pair). The sliding window nature of
phylogenetic bootscanning (REGA uses a 400 bp window with a
50 bp stride by default) does not naturally permit precise breakpoint
mapping. Splitting the sequence along the A–J boundary and
building traditional neighbor joining trees using the REGA
reference alignment, confirms the structure predicted by SCUEAL.
Within-subtype recombination. Seven of the discordant
results occurred when a sequence classified as pure subtype by
REGA was identified as within-subtype recombinant by SCUEAL.
An example of this is shown in Figure 8, where the putative parental
strains are approximately 3:5% divergent on the tree.
Missed recombinants. The remaining 10 mismatches arose
when a pure subtype sequence (according to REGA) was instead
reported as an inter-subtype recombinants with very strong (w95%)
model-averaged support for recombination. The obvious expla-
nation for why REGA may be missing these recombinants is that
the size of the sliding window used for bootscanning (400 bp) limits
how short individual mosaic fragments can be. This limitation
becomes relevant for single gene recombination analysis, when the
total length of the sequence is on the order of 500–1000 bp. The
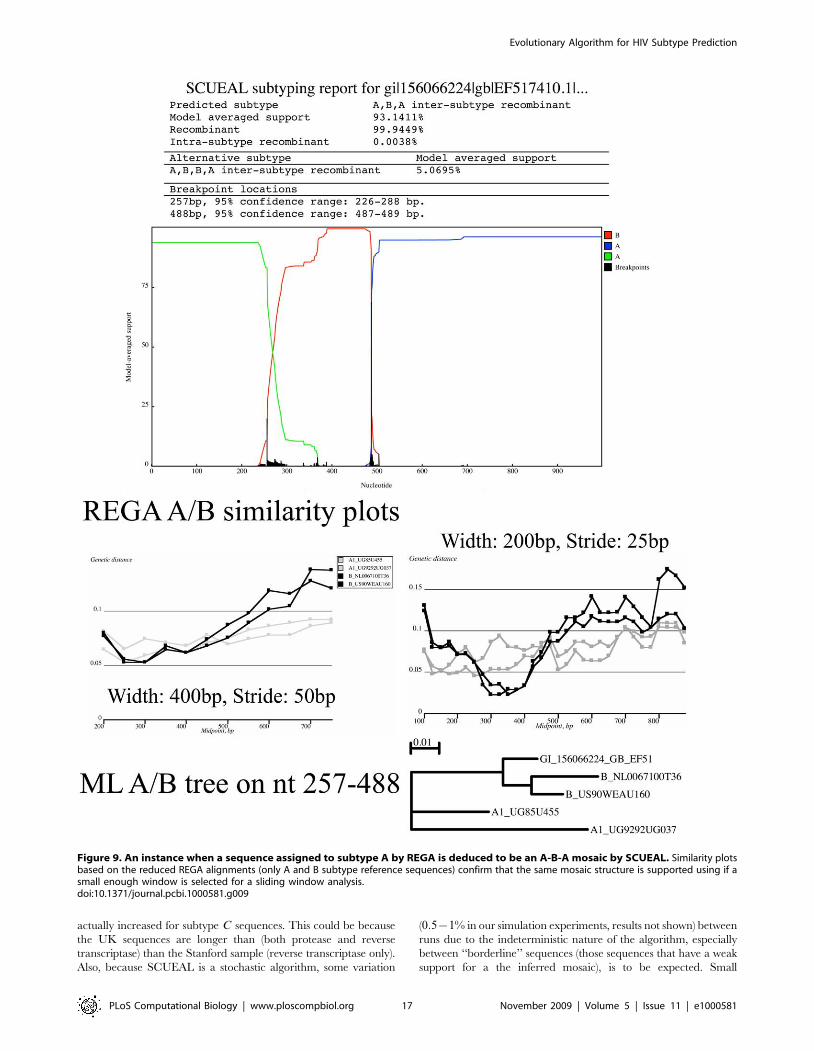
A-B-A mosaic example in Figure 9 was classified as subtype A by
REGA. However, adjusting the sliding window parameters from to
use window size of 200 bp instead of 400 bp and stride 25 bp
instead of 50 bp revealed that subtype B sequences from the REGA
reference alignment were genetically closer to the query than
subtype A sequences over the segment predicted by SCUEAL to
cluster with subtype B. Furthermore, a maximum likelihood tree
(exhaustive search) on that segment supports the same clustering.
Stanford database sequencesSCUEAL analyses indicate that while a majority of sequences
annotated as pure subtype in the Stanford drug resistance data-
base are assigned to a correct subtype, a substantial propor-
tion (0{13:7% depending on subtype) are better explained as
circulating or unique recombinant forms (CRF/URF) and a
similar proportion appear to be within-subtype recombinants
(Table 2). Importantly, there are only a few cases when SCUEAL
infers a pure subtype sequence which is annotated with a different
pure subtype in the database. For instance, out of 16116 subtype B
sequences there were 5 subtype D sequences, two–subtype J and
two–subtype A, hence the vast majority of potentially misclassified
subtypes in the database are due to recently characterized CRFs
and URFs which are partially derived from the database subtype.
When SCUEAL infers recombination, model averaged support for
at least one breakpoint is very strong (median 99:99%, mean
93:39%, 53:58%{100% for the 2:5{97:5%½ � range), but the
inference of the exact mosaic type is less certain on average
(median 72:77%, mean 71:33%, 36:65%{98:73% for the
2:5{97:5%½ � range), which is not surprising given that many of
the sequences are quite short.
Agreement for subtypes H and K is unusually poor, however
there are only a few sequences assigned to this subtype, and a small
number of existing reference samples to base inference upon. In
particular, many sequences annotated as subtype K appear to
have been partly derived from CRF30 and CRF32 strains. Over
10% of sequences annotated as subtype F are classed as B,F (or
partial CRFs) recombinants by SCUEAL, but this can be expected
as there are at least seven known CRFs (17, 28, 29, 38–40, 42) that
are comprised of B and F mosaics with one or more breakpoints in
the pol gene. For CRF02-annotated samples, 43% 285ð Þ of the
sequences that were classified differently by SCUEAL as A,G
recombinants appear to support breakpoints that are different
from those included in the reference CRF02 strains. This could
indicate that a larger sample of CRF02-like reference strains may
be necessary to accurately capture the diversity of these viral
strains.
HIV evolution in the era of Highly Active Antiretroviral
Therapy (HAART), especially in the developed world, is
significantly influenced by selective forces that favor viral strains
with mutations that confer drug resistance in the presence of a
corresponding drug. This is especially true of subtype B viruses,
circulating in North America and Western Europe, where
HAART has been exerting well-characterized selective pressure
on the virus for over a decade [51], leading to increasing
prevalence of HIV strains that harbor drug resistant associated
mutations (DRAM, e.g. [52,53]). Convergent evolution to acquire
DRAM can have a confounding effect on phylogenetic subtyping
Figure 5. Power and accuracy in the sequence shufflingsimulation. Power of SCUEAL to detect breakpoints in the HIV-1 polsequence shuffling scenario as a function of recombinant fragmentlength (x-axis) and divergence between parental strains (y-axis). Gridcells are colored according to the proportion of correctly detectedbreakpoints (different cells may summarize different numbers ofsimulations). White squares are plotted when there were no simulatedbreakpoints within a corresponding length-divergence range of values.doi:10.1371/journal.pcbi.1000581.g005
Evolutionary Algorithm for HIV Subtype Prediction
PLoS Computational Biology | www.ploscompbiol.org 13 November 2009 | Volume 5 | Issue 11 | e1000581
methods, by making regions rich in DRAM appear closely related
in evolutionarily distant strains and potentially leading to a false
signal of within- (or inter-) subtype recombination. To assess this
effect, we identified subtype B RT sequences (as annotated in the
database) that harbored at least one known DRAM [51]
(N~8599) and reran SCUEAL on these sequences after replacing
all DRAM with missing data (3 in-frame gaps for each DRAM
codon, e.g. any codon at position 215 in reverse transcriptase that
encodes an F or a Y ). Between 1 and 20 positions (median 5) per
sequence were masked by this procedure. DRAM masking
Figure 6. An example of a good agreement between SCUEAL and REGA in classifying a partial pol subtype B sequence. The SCUEALclustering plots present in this figure and Figures 7, 8 and 9 are conceptually analogous to bootscan plots, i.e. which reference sequence is the mostlikely sister lineage of the query sequence for a given site, but is based on model averaged support values instead of phylogenetic bootstrap. A partialreference tree with placed query is shown; color coding is consistent between the similarity plot and the tree. A phylogenetic tree with bootstrapsupport values and bootscan plot using the REGA alignment generated for the query sequence are shown.doi:10.1371/journal.pcbi.1000581.g006
Evolutionary Algorithm for HIV Subtype Prediction
PLoS Computational Biology | www.ploscompbiol.org 14 November 2009 | Volume 5 | Issue 11 | e1000581
substantially reduced the number of sequences that were classified
as within-subtype recombinants, taking the number down from
1331 15:48%ð Þ to 517 6:01%ð Þ. For other subtypes, where the
frequency is of DRAMs is lower than in subtype B sequences, the
effect of masking DRAMs on the proportion of inferred intra-
subtype recombinants (and other recombinant forms) is much
more muted (Table 2). Consequently, convergent evolution to
acquire drug resistant mutations appears to be a significant factor
contributing to the within-subtype recombination signal, although
the reduction in phylogenetic signal due to fewer informative sites
in masked sequences is also a possible cause of this effect.
Large scale subtype classification in a surveillance andepidemiological linkage study
The comparison between SCUEAL and REGA on this data set
(see Table 3), is similar to what was observed for the Stanford
dataset. For well sampled subtypes (A,B,C,D,F,G,AE) the agree-
ment between the methods was good to excellent (84:82{99:05%),
with a noticeable proportion (0:47{12:01%) of within-subtype
recombinants. Note that the proportion of within-subtype recom-
binants was not as significantly affected by masking out DRAMs as
discussed in the previous section; for example the proportion was
reduced from 12:01% to 9:95% for subtype B sequences, and
Figure 7. An instance when a sequence unclassified by REGA is inferred to be a novel recombinant form by SCUEAL; the A–J mosaicstructure is also confirmed by trees and bootscan plots based on the REGA reference alignment.doi:10.1371/journal.pcbi.1000581.g007
Evolutionary Algorithm for HIV Subtype Prediction
PLoS Computational Biology | www.ploscompbiol.org 15 November 2009 | Volume 5 | Issue 11 | e1000581

Figure 8. An example of within-subtype (B) recombination detected by SCUEAL, but not by REGA. A partial reference tree withplaced query is shown; color coding is consistent between the similarity plot and the tree.doi:10.1371/journal.pcbi.1000581.g008
Evolutionary Algorithm for HIV Subtype Prediction
PLoS Computational Biology | www.ploscompbiol.org 16 November 2009 | Volume 5 | Issue 11 | e1000581
actually increased for subtype C sequences. This could be because
the UK sequences are longer than (both protease and reverse
transcriptase) than the Stanford sample (reverse transcriptase only).
Also, because SCUEAL is a stochastic algorithm, some variation
(0:5{1% in our simulation experiments, results not shown) between
runs due to the indeterministic nature of the algorithm, especially
between ‘‘borderline’’ sequences (those sequences that have a weak
support for a the inferred mosaic), is to be expected. Small
Figure 9. An instance when a sequence assigned to subtype A by REGA is deduced to be an A-B-A mosaic by SCUEAL. Similarity plotsbased on the reduced REGA alignments (only A and B subtype reference sequences) confirm that the same mosaic structure is supported using if asmall enough window is selected for a sliding window analysis.doi:10.1371/journal.pcbi.1000581.g009
Evolutionary Algorithm for HIV Subtype Prediction
PLoS Computational Biology | www.ploscompbiol.org 17 November 2009 | Volume 5 | Issue 11 | e1000581

proportions of inter-subtype recombinants called by SCUEAL were
not not identified by REGA. For CRF02 and CRF06, the agreement
was quite poor, however the discord is easy to explain. For CRF02
SCUEAL identified many A,G recombinants but with breakpoints
differing from those mapped for CRF02 (note that it is likely that G is
the recombinant strain, but we refer to CRF02 as the recombinant to
maintain compatibility with the current nomenclature); other CRF
strains that include CRF02 - like fragments in pol (CRF30, CRF36)
account for most of the other discrepancies. For sequences typed as
CRF06 by REGA, the majority of SCUEAL classification involve
CRFs derived from CRF06 (e.g. CRF30, CRF32).
Of 34452 sequences, a non-trivial proportion 1934 5:61%ð Þ were
not classified by REGA, with 87 of those also not classified by the
HIVdb subtyping algorithm. According to SCUEAL 1238 64%ð Þwere URFs, and the remainder–pure subtypes of CRFs. Among
34452 sequences, SCUEAL identified 934 complex recombinant
forms (more than 3 constituent sub- or subsubtypes) and 10 URFs
with at least 50 sequences each, including:
1. 357 G,A and 136 G,CRF02 recombinants. Given the degree of
uncertainty about mapping the breakpoints in CRF02 (the
nomenclature here is confusing, because recent evidence
suggests that G was derived as a recombinant of A and
CRF02 sequences) reference sequences, these sequences can be
thought of as a A,G, CRF02 recombinants sequences. The
finding also indicates that the diversity of this clade is quite
Table 2. SCUEAL screening results on partial HIV-1 reverse transcriptase sequences from the Stanford Drug Resistance database.
Subtype Sequences Agree within-subtype Diff. pure subtype Diff. recombinant Top 3 CRFs and URFs
A 1740 84:83% 7:82% 5:57%ð Þ 0:00% 7:36% 7:59%ð Þ CRF33/34 (31); A1,D (14); AE, B (7)
B 16116 83:64% 13:71% 6:94%ð Þ 0:06% 2:59% 1:63%ð Þ CRF28/29 (273); CRF42 (54); CRF20/23/24 (30)
C 3133 95:13% 9:48% 7:53%ð Þ 0:00% 5:39% 5:01%ð Þ B,C,CRF31 (56); B,C (36); C/CRF07 (8)
D 624 91:03% 1:12% 1:12%ð Þ 0:64% 7:21% 7:21%ð Þ A1,D (16); B, CRF19 (4); B, D (3)
F 464 86:42% 0:43% 0:43%ð Þ 0:43% 12:72% 10:78%ð Þ B,F1 (27); CRF29, F1 (5); B, CRF40, F1 (4)
G 757 91:28% 1:85% 0:66%ð Þ 0:26% 6:61% 6:74%ð Þ B, CRF14 (4); B, G(3); G,J (3)
H 28 64:29% 0% 0%ð Þ 0% 35:71% 35:71%ð Þ G,H (2); A, H (1); A, B, K (1)
J 22 95:45% 0% 0%ð Þ 0% 4:55% 4:55%ð Þ C,J (1)
K 166 12:05% 7:83% 7:83%ð Þ 1:20% 78:92% 72:83%ð Þ CRF32, G (22); CRF30, CRF32 (7); C, CRF32 (5)
CRF01 (AE) 1552 96:78% 0:32% 0:52%ð Þ 1:16% 1:74% 1:48%ð Þ CRF22 (5), AE,B (4); B, CRF33 (4)
CRF02 (AG) 1352 49:78% 0:00% 0:00%ð Þ 1:26% 48:96% 46:75%ð Þ A,G (285), A,CRF36,G (41), A,CRF02,G (34)
Subtype lists the sequence subtype as annotated in the database. Sequences provides the number of sequences downloaded from the database. Agree gives thepercentage of sequences for which SCUEAL returned the same subtype as that stored in the database. within-subtype–SCUEAL inferred within-subtyperecombination within the same subtype as the one stored in the database; figures in parentheses show the proportion of within-subtype recombinants identified whenDRAM positions were masked. Diff. pure subtype–the proportion of cases where SCUEAL inferred a pure subtype different from the annotated one. Diff.recombinant–the proportion of cases where SCUEAL inferred a recombinant mosaic with at least one fragment different from the annotated subtype; figures inparentheses show the proportion of within-subtype recombinants identified when DRAM positions were masked. Top 3 CRFs and URFs–three most frequent mosaicsinferred by SCUEAL.doi:10.1371/journal.pcbi.1000581.t002
Table 3. SCUEAL screening results on partial HIV-1 polymerase sequences from the UK.
Subtype Sequences Agree within-subtype Diff. pure subtype Diff. recombinant Top 3 CRFs and URFs
A 2119 84:62% 9:86% 10:2%ð Þ 1:23% 4:29% 4:38%ð Þ CRF22 (24); A1, D (12); A1, C (4)
B 19871 85:96% 12:01% 9:95%ð Þ 0:02% 2:01% 1:86%ð Þ B, D (120); B, CRF03 (40); B, F1 (38)
C 7381 87:51% 10:99% 12:77%ð Þ 0:08% 1:42% 1:40%ð Þ B, C (11); C, D (11); C, J (10)
D 614 96:25% 1:63% 1:80%ð Þ 0:00% 2:12% 1:47%ð Þ B, D (3); D, K (2); A, D (2)
F 110 93:64% 2:73% 6:36%ð Þ 0:00% 3:64% 5:45%ð Þ B,F (2); F, G (1); F, H (1)
G 673 85:44% 2:67% 2:99%ð Þ 0:00% 11:89% 6:13%ð Þ F1, G (25); CRF30, G (10); A, G (10)
H 35 100:00% 0:00% 0:00%ð Þ 0:00% 0:00% 0:00%ð ÞJ 35 71:43% 0:00% 0:00%ð Þ 0:00% 28:57% 25:71%ð Þ B, J (3); CRF09, J (3); G, J (2)
CRF01 (AE) 419 99:05% 0:47% 0:71%ð Þ 0:00% 0:47% 0:95%ð Þ AE, B (2)
CRF02 (AG) 1014 26:82% 13:71% 12:19%ð Þ 0:00% 59:47% 61:25%ð Þ A, G (278); A, CRF30, G (72); A, CRF30, CRF36 (56)
CRF06 147 0:00% 0:00% 0:00%ð Þ 1:36% 98:64% 97:96%ð Þ CRF32, K (34); CRF32, G (23); CRF30, CRF32 (14)
Subtype lists the sequence subtype as annotated in the database. Sequences provides the number of sequences downloaded from the database. Agree gives thepercentage of sequences for which SCUEAL returned the same subtype as the one inferred by REGA. within-subtype–SCUEAL inferred within-subtype recombinationwithin the same subtype as the one inferred by REGA; figures in parentheses show the proportion of within-subtype recombinants identified when DRAM positionswere masked. Diff. pure subtype–the proportion of cases where SCUEAL inferred a pure subtype different from the REGA assignment. Diff. recombinant–theproportion of cases where SCUEAL inferred a recombinant mosaic with at least one fragment different from the annotated subtype; figures in parentheses show theproportion of within-subtype recombinants identified when DRAM positions were masked. Top 3 CRFs and URFs–three most frequent mosaics inferred by SCUEAL.doi:10.1371/journal.pcbi.1000581.t003
Evolutionary Algorithm for HIV Subtype Prediction
PLoS Computational Biology | www.ploscompbiol.org 18 November 2009 | Volume 5 | Issue 11 | e1000581
significant, and reference data sets may need to be enriched for
A, G and CRF02 sequences to enable more accurate subtype
assignment. REGA assigned 406 82:76%ð Þ of these sequences to
subtype CRF02, 3 to subtype A(A1), 4 to G, one to subtype Band did not classify 77 sequences.
2. 180 A1,D recombinants. 166 92:22%ð Þ of those were not
definitively classified by REGA, with the remainder assigned
to A1 (12), D (1) and CRF10_CD (1). There are several
precedents for this type of mosaic structure, including CRF16,
CRF19 and CRF35 which all have a mosaic AD structure
in pol.
3. 161 B,CRF39 recombinants. Because most of pol sequence in
CRF39, which is found circulating in Brazil, is mapped to
subtype B [54], this form can be reported as a B intra-subtype
recombinant. This finding also illustrates the capacity of
SCUEAL to map within-subtype diversity with high resolution.
Almost all (158 98:14%ð Þ) of those are identified as subtype B
sequences by REGA, which is correct if within-subtype
recombination is discounted.
4. 128 B,D recombinants, 120 93:75%ð Þ of which were classified
as subtype B by REGA. Because B and D subtypes are closely
related (compared to other between-subtypes comparisons),
this mosaic type is difficult to detect.
Discussion
We present a new phylogenetic method (SCUEAL) to
automatically determine a subtype and map the recombinant
structure in HIV-1 sequences. Our method uses a statistically
robust maximum likelihood multi-model inference approach to
examine tens of thousands of potential mosaic structures in a single
run guided by an evolutionary algorithm, identify those well
supported by the data and quantify the reliability of all estimated
quantities. SCUEAL is designed to handle the inclusion of
recombinant strains in reference alignments, operate on large
reference alignments with minimal loss of speed and permit easy
expansion of existing reference alignments as new subtypes or
circulating recombinant forms.
Using an extensive collection of simulated sequence alignments,
covering a wide range of evolutionary parameters and including
biological HIV-1 sequences, we determined that the method was
capable of accurate detection of the number and location of
recombination breakpoints as well as appropriate parental
lineages, given sufficient sequence divergence. For non-paramet-
rically generated HIV-1 pol mosaics, the recovery rate of
breakpoints was 88:3% for 5% or greater divergence between
parental strains and 200 bp or longer sequence fragments. On
average, individual breakpoints were inferred within 10 bp of the
simulated locations. SCUEAL had a v1% rate of false positives
on parametrically simulated data.
A comparison with a popular phylogeny based rapid subtyping
tool REGA [18] on an HIV-1 pol surveillance dataset [48]
illustrated that SCUEAL was able to automatically detect
recombinant sequences with short mosaic fragments, classify and
map unknown mosaic types and resolve cases that confounded
REGA. A large scale screen of 23050 database sequences revealed
that approximately 5% of pure subtype reverse transcriptase
sequences show evidence of within-subtype recombination and a
further 5% are likely novel or known circulating recombinant
forms, highlighting the need for more precise determination of
subtype information for public databases. Because up to 10% of
HIV-1 infections occur with Unique Recombination Forms
(URFs) when superinfection with divergent strains is relatively
common (e.g. [55,56]), the ability of SCUEAL to automatically
annotate such forms is of critical importance. Furthermore, many
evolutionary analyses, such as dating and selection screens, can be
biased by the inclusion of recombinant sequences without
necessary corrections [57,58]. Studies that seek to identify clinical
and evolutionary differences between different HIV subtypes (e.g.
[59,60]) also rely on the accurate classification of subtypes for all
input sequences. To our knowledge, none of the existing subtype
classifiers are designed to detect within-subtype recombination,
which is in all likelihood much more frequent than inter-subtype
recombination because sufficiently divergent strains of the same
subtype routinely co-circulate in host populations (e.g. [61]) and
within-host sequences often present phylogenetic evidence of
extensive recombination [62]. We note that convergent evolution
to acquire drug resistance associated mutations appears to have a
strong confounding effect on detecting within-subtype recombi-
nation and should be accounted for if the focus of the analysis is to
identify within-subtype recombination in regions of HIV that
include many such mutations.
SCUEAL provides an automatically determined mosaic struc-
ture for any input sequence, including the cases when existing
methods fail to derive such a structure. While this feature is a
qualitative advance over existing approaches, it may also invite
over-interpretation of computational results, and we emphasize
that this should be avoided. Consider for example, the strain
presented in Figure 7. SCUEAL results allow us to deduce that the
strain is an inter-subtype recombinant with a high degree of
confidence (&100%). The analysis also strongly implies that A and
J strains or their ancestors contributed segments of the pol gene to
the query sequencer, but also reports several credible mosaic forms
that could be assigned to the strain, counter-indicating a definitive
(e.g. A-A1-J-A2) mosaic determination. We would like to stress
that SCUEAL determination of a novel recombinant form should
not lead the users to automatically declare the sequence as such,
but rather as an invitation to perform further examination of the
data, perhaps with a specialized reference alignment, enriched for
the subtypes detected by SCUEAL. Continuing with the example,
the combination of A and J subtypes in one sequence is not
uncommon (e.g. CRF06, CRF11, CRF13, CRF27) and extensive
mosaicism in the pol gene has also been reported previously [63].
Moreover, the ‘‘J’’ clade in the SCUEAL reference alignment also
contains J-like segments from several CRFs that circulate more
widely that pure subtype J strains confined primarily to Central
and West Africa [4]. Whether or not the segment assigned to clade
J may instead belong to an unsampled clade of HIV-1 cannot
ultimately be determined with the currently available estimate of
HIV-1 diversity. Subtype classification is extensively used as a tool
in molecular epidemiology and in surveillance studies of HIV
because of their association with different populations. Multiple
subtypes were detected in the UK in 1995 [64] and by 2007, non-
B subtypes comprised the majority of new diagnoses in the UK
[65,66]. In addition, subtype classification is important for clinical
reasons in HIV because of biological differences that have been
observed with respect to rate of progression to disease [67], and
patterns of drug resistance mutations [68,69]. For that reason,
sequences in the UK HIV Drug Resistance Database are routinely
subtyped before analysis. The rapid increase in scale of the task
(the current database release contains over 50,000 sequences) and
the range of diversity of the subtypes and recombinants now
present in the UK epidemic highlights an urgent need for an
automated, informative, reliable and rapid method for classifica-
tion on the sequence data collected that will scale to hundreds of
thousands of sequences on commodity distributed computing
platforms.
Evolutionary Algorithm for HIV Subtype Prediction
PLoS Computational Biology | www.ploscompbiol.org 19 November 2009 | Volume 5 | Issue 11 | e1000581

Empirical datasets in this study were limited to the partial
polymerase gene of HIV, partly because this genetic region
routinely sequenced for surveillance and diagnostic purposes, has
few easily aligned indels–thus avoiding potential biases due to
unreliable automatic multiple sequence alignment (e.g. [46]), and
contains many of the breakpoints mapped for known CRFs.
However, SCUEAL can use any reference alignment, including
full length HIV-1, Hepatitis C virus, Influenza A virus genomes
and non-viral sequences, and we plan to implement this
functionality in future versions of SCUEAL.
Finally, we would be remiss to overlook some of the limitations
of our approach. SCUEAL is a fairly computationally demanding
method, and consequently is considerably slower that some other
screening tools. Parallel execution on a computer cluster can
mitigate this issue and permit one to process thousands of
sequences per hour. As any method that is based on a reference
alignment, SCUEAL is susceptible to biased inference if the
reference alignment is inaccurate or if reference sequences are
themselves misclassified. We took a number of precautions to
ensure that the reference alignment was accurate by focusing on
an easily alignable genomic region, a conservative automatic
alignment procedure for the query sequence and an incremental
algorithm for adding and accurately labeling reference sequences.
SCUEAL uses a nucleotide evolutionary model to fit phylogenetic
likelihood models for the sake of computational efficiency and this
could lead to difficult to quantify biases in mosaic structure
mapping; more realistic models (e.g. codon models) can be
‘‘plugged-in’’ without any alteration to the methodological
framework if desired.
Supporting Information
Protocol S1 Settings and results for each of the parametric
simulation scenarios
Found at: doi:10.1371/journal.pcbi.1000581.s001 (4.08 MB PDF)
Acknowledgments
We thank the editors and three anonymous reviewers and the associate
editor (Dr Christophe Fraser) for their comments on a previous version of
this manuscript.
The views expressed in the publication are those of the authors and not
necessarily those of the Department of Health.
Author Contributions
Conceived and designed the experiments: SLKP DP AJLB SDWF.
Performed the experiments: SLKP. Analyzed the data: SLKP DP ES GH.
Contributed reagents/materials/analysis tools: SLKP DP ES CC AFYP
GH EF MBG SDWF. Wrote the paper: SLKP DP AFYP SDWF.
References
1. Zeldovich KB, Chen P, Shakhnovich EI (2007) Protein stability imposes limits
on organism complexity and speed of molecular evolution. Proc Natl Acad
Sci U S A 104: 16152–16157.
2. Gaschen B, Taylor J, Yusim K, Foley B, Gao F, et al. (2002) Diversity
considerations in HIV-1 vaccine selection. Science 296: 2354–2360.
3. Robertson DL, Anderson JP, Bradac JA, Carr JK, Foley B, et al. (2000) HIV-1
nomenclature proposal. Science 288: 55–56.
4. Hemelaar J, Gouws E, Ghys PD, Osmanov S (2006) Global and regional
distribution of HIV-1 genetic subtypes and recombinants in 2004. AIDS 20:
W13–23.
5. Gifford RJ, de Oliveira T, Rambaut A, Pybus OG, Dunn D, et al. (2007)
Phylogenetic surveillance of viral genetic diversity and the evolving molecular
epidemiology of human immunodeficiency virus type 1. J Virol 81:
13050–13056.
6. Papathanasopoulos MA, Hunt GM, Tiemessen CT (2003) Evolution and
diversity of HIV-1 in africa–a review. Virus Genes 26: 151–163.
7. Rhodes T, Wargo H, Hu WS (2003) High rates of human immunodeficiency
virus type 1 recombination: near-random segregation of markers one kilobase
apart in one round of viral replication. J Virol 77: 11193–11200.
8. Abecasis AB, Lemey P, Vidal N, de Oliveira T, Peeters M, et al. (2007)
Recombination confounds the early evolutionary history of human immunode-
ficiency virus type 1: subtype G is a circulating recombinant form. J Virol 81:
8543–8551.
9. Posada D, Crandall KA (2001) Evaluation of methods for detecting
recombination from DNA sequences: Computer simulations. Proc Natl Acad
Sci U S A 98: 13757–13762.
10. Posada D (2002) Evaluation of methods for detecting recombination from dna
sequences: empirical data. Mol Biol Evol 19: 708–717.
11. Salminen M, Carr J, Burke D, McCutchan F (1995) Identification of breakpoints
in intergenotypic recombinants of HIV type 1 by bootscanning. AIDS Res Hum
Retroviruses 11: 1423–1425.
12. Triques K, Bourgeois A, Vidal N, Mpoudi-Ngole E, Mulanga-Kabeya C, et al.
(2000) Near-full-length genome sequencing of divergent African HIV type 1
subtype F viruses leads to the identification of a new HIV type 1 subtype
designated K. AIDS Res Hum Retroviruses 16: 139–151.
13. Gomez-Carrillo M, Quarleri JF, Rubio AE, Carobene MG, Dilernia D, et al.
(2004) Drug resistance testing provides evidence of the globalization of HIV type
1: a new circulating recombinant form. AIDS Res Hum Retroviruses 20:
885–888.
14. Martin DP, Posada D, Crandall KA, Williamson C (2005) A modified bootscan
algorithm for automated identification of recombinant sequences and recom-
bination breakpoints. AIDS Res Hum Retroviruses 21: 98–102.
15. Gao F, Robertson DL, Carruthers CD, Li Y, Bailes E, et al. (1998) An isolate of
human immunodeficiency virus type 1 originally classified as subtype I
represents a complex mosaic comprising three different group M subtypes
(A, G, and I). J Virol 72: 10234–10241.
16. Paraskevis D, Magiorkinis M, Vandamme AM, Kostrikis LG, Hatzakis A (2001)
Re-analysis of human immunodeficiency virus type 1 isolates from Cyprus and
Greece, initially designated ‘subtype I’, reveals a unique complex A/G/H/K/?
mosaic pattern. J Gen Virol 82: 575–580.
17. Casado G, Thomson MM, Sierra M, Najera R (2005) Identification of a novel
HIV-1 circulating ADG intersubtype recombinant form (CRF19_cpx) in Cuba.
J Acquir Immune Defic Syndr 40: 532–537.
18. de Oliveira T, Deforche K, Cassol S, Salminen M, Paraskevis D, et al. (2005) An
automated genotyping system for analysis of HIV-1 and other microbial
sequences. Bioinformatics 21: 3797–3800.
19. Wu X, Cai Z, Wan XF, Hoang T, Goebel R, et al. (2007) Nucleotide
composition string selection in HIV-1 subtyping using whole genomes.
Bioinformatics 23: 1744–1752.
20. Rozanov M, Plikat U, Chappey C, Kochergin A, Tatusova T (2004) A web-
based genotyping resource for viral sequences. Nucleic Acids Res 32: W654–9.
21. Myers RE, Gale CV, Harrison A, Takeuchi Y, Kellam P (2005) A statistical
model for HIV-1 sequence classification using the subtype analyser (STAR).
Bioinformatics 21: 3535–3540.
22. Schultz AK, Zhang M, Leitner T, Kuiken C, Korber B, et al. (2006) A jumping
profile Hidden Markov Model and applications to recombination sites in HIV
and HCV genomes. BMC Bioinformatics 7: 265.
23. Loveday C, MacRae E (2006) Limitations in using online tools to determine
HIV-1 subtype in clinical patients: A comparison of 5 tools. In: 15th
International HIV Drug Resistance Workshop.
24. Ntemgwa M, Gill MJ, Brenner BG, Moisi D, Wainberg MA (2008)
Discrepancies in assignment of subtype/recombinant forms by genotyping
programs for HIV type 1 drug resistance testing may falsely predict
superinfection. AIDS Res Hum Retroviruses 24: 995–1002.
25. Holguin A, Lopez M, Soriano V (2008) Reliability of rapid subtyping tools
compared to that of phylogenetic analysis for characterization of human
immunodeficiency virus type 1 non-B subtypes and recombinant forms. J Clin
Microbiol 46: 3896–3899.
26. Gifford R, de Oliveira T, Rambaut A, Myers RE, Gale CV, et al. (2006)
Assessment of automated genotyping protocols as tools for surveillance of HIV-1
genetic diversity. AIDS 20: 1521–1529.
27. Posada D, Crandall KA (2002) The effect of recombination on the accuracy of
phylogeny estimation. J Mol Evol 54: 396–402.
28. Minin VN, Dorman KS, Fang F, Suchard MA (2005) Dual multiple change-
point model leads to more accurate recombination detection. Bioinformatics 21:
3034–3042.
29. Kosakovsky Pond SL, Posada D, Gravenor MB, Woelk CH, Frost SD (2006)
Automated phylogenetic detection of recombination using a genetic algorithm.
Mol Biol Evol 23: 1891–1901.
30. Kosakovsky Pond SL, Frost SDW (2005) Datamonkey: rapid detection of
selective pressure on individual sites of codon alignments. Bioinformatics 21:
2531–2533.
31. Tavare S (1986) Some probabilistic and statistical problems in the analysis of
DNA sequences. Lectures on Mathematics in the Life Sciences 17: 57–86.
32. Kosakovsky Pond S, Frost S (2005) A simple hierarchical approach to modeling
distributions of substitution rates. Mol Biol Evol 22: 223–234.
Evolutionary Algorithm for HIV Subtype Prediction
PLoS Computational Biology | www.ploscompbiol.org 20 November 2009 | Volume 5 | Issue 11 | e1000581
33. Guindon S, Gascuel O (2003) A simple, fast, and accurate algorithm to estimate
large phylogenies by maximum likelihood. Syst Biol 52: 696–704.
34. Stamatakis A, Ludwig T, Meier H (2005) RAxML-III: a fast program formaximum likelihood-based inference of large phylogenetic trees. Bioinformatics
21: 456–463.
35. Schwarz G (1978) Estimating the dimension of a model. Ann Stat 6: 461–464.
36. Akaike H (1974) A new look at the statistical model identification. IEEE TranAutomatic Control 119: 716–723.
37. Sugiura N (1978) Further analysis of the data by Akaike’s information criterion
and the finite corrections. Communications In Statistics-Theory And Methods
A7: 13–26.
38. Yang ZH (2000) Maximum likelihood estimation on large phylogenies and
analysis of adaptive evolution in human influenza virus A. J Mol Evol 51:
423–432.
39. Felsenstein J (1981) Evolutionary trees from DNA sequences: a maximum
likelihood approach. J Mol Evol 17: 368–376.
40. Eshelman L (1991) FOGA-1, Los Atlos, CA: Morgan Kaufmann, chapter The
CHC adaptive search algorithm. How to have safe search when engaging in
nontraditional genetic recombination. pp 265-283.
41. Goldberg DE (1989) Genetic algorithms in search, optimization, and machine
learning. Reading, Mass.: Addison-Wesley Pub. Co.
42. Burnham K, Anderson D (2003) Model Selection and Multimodel Inference.New York: Springer, 2nd ed. edition.
43. Pupko T, Pe’er I, Shamir R, Graur D (2000) A fast algorithm for joint
reconstruction of ancestral amino acid sequences. Mol Biol Evol 17: 890–896.
44. Needleman SB, Wunsch CD (1970) A general method applicable to the search
for similarities in the amino acid sequence of two proteins. J Mol Biol 48:
443–453.
45. Nickle DC, Heath L, Jensen MA, Gilbert PB, Mullins JI, et al. (2007) HIV-specific probabilistic models of protein evolution. PLoS ONE 2: e503.
46. Wong KM, Suchard MA, Huelsenbeck JP (2008) Alignment uncertainty and
genomic analysis. Science 319: 473–476.
47. Tamura K, Nei M (1993) Estimation of the number of nucleotide substitutions inthe control region of mitochondrial-DNA in humans and chimpanzees. Mol Biol
Evol 10: 512–526.
48. Salemi M, Goodenow MM, Montieri S, de Oliveira T, Santoro MM, et al.
(2008) The HIV type 1 epidemic in Bulgaria involves multiple subtypes and issustained by continuous viral inflow from West and East European countries.
AIDS Res Hum Retroviruses 24: 771–779.
49. Bennett DE, Camacho RJ, Otelea D, Kuritzkes DR, Fleury H, et al. (2009) Drug
resistance mutations for surveillance of transmitted HIV-1 drug-resistance: 2009update. PLoS One 4: e4724.
50. Kosakovsky Pond SL, Frost SDW, Muse SV (2005) HyPhy: hypothesis testing
using phylogenies. Bioinformatics 21: 676–9.
51. Johnson VA, Brun-Vezinet F, Clotet B, Gunthard HF, Kuritzkes DR, et al.(2008) Update of the drug resistance mutations in HIV-1. Top HIV Med 16:
138–145.
52. Little SJ, Holte S, Routy JP, Daar ES, Markowitz M, et al. (2002) Antiretroviral-
drug resistance among patients recently infected with HIV. N Eng J Med 347:385–394.
53. Shet A, Berry L, Mohri H, Mehandru S, Chung C, et al. (2006) Tracking the
prevalence of transmitted antiretroviral drug-resistant HIV-1: a decade ofexperience. J Acquir Immune Defic Syndr 41: 439–446.
54. Guimaraes ML, Eyer-Silva WA, Couto-Fernandez JC, Morgado MG (2008)
Identification of two new CRF_BF in Rio de Janeiro State, Brazil. AIDS 22:433–435.
55. Harris ME, Serwadda D, Sewankambo N, Kim B, Kigozi G, et al. (2002)Among 46 near full length HIV type 1 genome sequences from Rakai District,
Uganda, subtype D and AD recombinants predominate. AIDS Res Hum
Retroviruses 18: 1281–1290.56. McCutchan FE, Hoelscher M, Tovanabutra S, Piyasirisilp S, Sanders-Buell E, et
al. (2005) In-depth analysis of a heterosexually acquired human immunodefi-ciency virus type 1 superinfection: evolution, temporal fluctuation, and
intercompartment dynamics from the seronegative window period through 30months postinfection. J Virol 79: 11693–11704.
57. Posada D (2001) Unveiling the molecular clock in the presence of
recombination. Mol Biol Evol 18: 1976–1978.58. Scheffler K, Martin DP, Seoighe C (2006) Robust inference of positive selection
from recombining coding sequences. Bioinformatics 22: 2493–2499.59. Baker CAR, McEvers K, Byaruhanga R, Mulindwa R, Atwine D, et al. (2008)
HIV subtypes induce distinct profiles of HIV-specific CD8(+) T cell responses.
AIDS Res Hum Retroviruses 24: 283–287.60. Penn O, Stern A, Rubinstein ND, Dutheil J, Bacharach E, et al. (2008)
Evolutionary modeling of rate shifts reveals specificity determinants in HIV-1subtypes. PLoS Comput Biol 4: e1000214.
61. Rousseau CM, Learn GH, Bhattacharya T, Nickle DC, Heckerman D, et al.(2007) Extensive intrasubtype recombination in South African human
immunodeficiency virus type 1 subtype C infections. J Virol 81: 4492–4500.
62. Salemi M, Gray RR, Goodenow MM (2008) An exploratory algorithm toidentify intra-host recombinant viral sequences. Mol Phylogenet Evol 49:
618–628.63. Novitsky VA, Gaolekwe S, McLane MF, Ndung’u TP, Foley BT, et al. (2000)
HIV type 1 A/J recombinant with a pronounced pol gene mosaicism. AIDS Res
Hum Retroviruses 16: 1015–1020.64. Arnold C, Barlow KL, Parry JV, Clewley JP (1995) At least five HIV-1 sequence
subtypes (A, B, C, D, A/E) occur in England. AIDS Res Hum Retroviruses 11:427–429.
65. HIV and AIDS in the United Kingdom. Health Protection Report 2007. http://www.hpa.org.uk/hpr/archives/2007/hpr1707.pdf.
66. Hue S, Pillay D, Clewley JP, Pybus OG (2005) Genetic analysis reveals the
complex structure of HIV-1 transmission within defined risk groups. Proc NatlAcad Sci U S A 102: 4425–4429.
67. Kiwanuka N, Laeyendecker O, Robb M, Kigozi G, Arroyo M, et al. (2008)Effect of human immunodeficiency virus Type 1 (HIV-1) subtype on disease
progression in persons from Rakai, Uganda, with incident HIV-1 infection.
J Infect Dis 197: 707–713.68. Geretti AM (2006) HIV-1 subtypes: epidemiology and significance for HIV
management. Curr Opin Infect Dis 19: 1–7.69. Geretti AM, Harrison L, Green H, Sabin C, Hill T, et al. (2009) Effect of HIV-1
subtype on virologic and immunologic response to starting highly activeantiretroviral therapy. Clin Infect Dis 48: 1296–1305.
Evolutionary Algorithm for HIV Subtype Prediction
PLoS Computational Biology | www.ploscompbiol.org 21 November 2009 | Volume 5 | Issue 11 | e1000581