www.elsevier.com/locate/ynimg
NeuroImage 26 (2005) 114Y122
An electroencephalographic fingerprint of human sleep
Luigi De Gennaro,a,T Michele Ferrara,a,b Fabrizio Vecchio,c,d
Giuseppe Curcio,a and Mario Bertinia
aDepartment of Psychology, University of Rome BLa Sapienza[, Via dei Marsi 78, Roma, 00185 ItalybDepartment of Internal Medicine and Public Health, University of BL’Aquila[, ItalycDepartment of Human Physiology and Pharmacology, High Resolution Section, University of Rome BLa Sapienza[, ItalydAFaR.-Department of Neuroscience, S. Giovanni Calibita, Fatebenefratelli Isola Tiberina, Rome, Italy
Received 29 July 2004; revised 21 December 2004; accepted 13 January 2005
Available online 3 March 2005
Abstract
Homeostatic and circadian processes are basic mechanisms of human
sleep which challenge the common knowledge of large individual
variations in sleep need or differences in circadian types. However,
since sleep research has mostly focused on group measures, an
approach which emphasizes the similarities between subjects, the
biological foundations of the individual differences in normal sleep are
still poorly understood. In the present work, we assessed individual
differences in a range of EEG frequencies including sigma activity
during non-REM sleep (8.0Y15.5 Hz range) in a group of 10 subjects
who had participated in a slow-wave sleep (SWS) deprivation study.
We showed that, like a Bfingerprint[, a particular topographic
distribution of the electroencephalogram (EEG) power along the
antero-posterior cortical axis distinguishes each individual during
non-REM sleep. This individual EEG-trait is substantially invariant
across six consecutive nights characterized by large experimentally
induced changes of sleep architecture. One possible hypothesis is that
these EEG invariances can be related to individual differences in
genetically determined functional brain anatomy, rather than to sleep-
dependent mechanisms.
D 2005 Elsevier Inc. All rights reserved.
Keywords: Sleep spindles; Sigma EEG activity; EEG topography;
Individual differences
Introduction
Notwithstanding the increasing use of neuroimaging techni-
ques, electroencephalography is still the most universally
employed technique in human sleep research. Quantitative
analyses of sleep EEG by spectral analysis have led to the
development of the 2-process model of sleep regulation (Borbely,
1982). According to this model, the timing of sleep and wakeful-
1053-8119/$ - see front matter D 2005 Elsevier Inc. All rights reserved.
doi:10.1016/j.neuroimage.2005.01.020
T Corresponding author. Fax: +39 06 4451667.
E-mail address: [email protected] (L. De Gennaro).
Available online on ScienceDirect (www.sciencedirect.com).
ness is regulated by the interaction of a homeostatic, sleepYwake-dependent Process S and a circadian, sleepYwake-independentProcess C (Borbely, 1982). Well-established evidence on the
homeostatic facet of sleep regulation suggests that slow-wave
activity (EEG power in the 0.75Y4.5 Hz range) depends on the
duration of previous sleep and wakefulness, representing a marker
of non-REM sleep intensity (Borbely and Achermann, 2000). This
feature of sleep has been consistently shown in a broad range of
species, including humans, cats, mice, rats, and squirrels (Tobler,
1995). Manipulations of sleep intensity by means, for example, of
sleep deprivation, lead to clear homeostatic recovery processes
(Borbely and Achermann, 2000) which do not involve the whole
cerebral cortex in the same manner. Indeed, these recovery
processes are local in nature, as shown in dolphins (Oleksenko et
al., 1992), birds (Rattenborg et al., 1999), mice (Huber et al.,
2000), rats (Vyazovskiy et al., 2002), and humans (Ferrara et al.,
2002; Finelli et al., 2001a). The most striking regional phenom-
enon of the human sleep EEG is the hyperfrontality of low-
frequency EEG activity during baseline and post deprivation non-
REM sleep, probably due to a high Brecovery need[ of the frontal
heteromodal association areas of the cortex (Cajochen et al., 1999;
Ferrara et al., 2002; Finelli et al., 2001a).
Homeostatic, circadian and regional EEG changes are basic
mechanisms of human sleep that seem to challenge the common
notion of large individual variations in sleep need or differences in
circadian types. These differences are often ignored or considered
as experimental noise, to be actively suppressed through the use of
statistical methods that emphasize group rather than individual
results. Nevertheless, the recent extensive use of blood flow
imaging techniques in the neurosciences made it clear that, for
example, a large variability in the detected hemodynamic responses
across sessions of the same subject and across subjects is actually
present (Aguirre et al., 1998; Handwerker et al., 2004; Wei et al.,
2004). The importance of taking such individual differences into
account has recently been pointed out also in the sleep research
field, at least as regards individual variability in the susceptibility
to sleep deprivation (Bell-McGinty et al., 2004; Leproult et al.,
L. De Gennaro et al. / NeuroImage 26 (2005) 114Y122 115
2003; Van Dongen et al., 2004). However, although inter-
individual differences in neurobehavioral deficits from sleep loss
constitute a differential vulnerability trait, its neurobiological
correlates have yet to be discovered. The elucidation of some
biological mechanisms for the behavioral trait of morning-
nessYeveningness (Duffy et al., 2001), for individual differences
in the circadian pacemaker program (i.e., long and short sleepers)
(Aeschbach et al., 1996, 2001, 2003) and for the variability of
sleep duration in the general population (Aeschbach et al., 2003),
also encourages a neurophysiological approach to individual
differences in sleep characteristics.
Sleep spindles seem to be a natural candidate for this analysis:
they are one of the hallmarks of non-REM sleep, one of the few
transient EEG events which are unique to sleep, and it has been
reported that their incidence shows great inter-individual differ-
ences in humans (Werth et al., 1997). As far as their electro-
physiological mechanisms are concerned, sleep spindles depend on
variations in membrane potentials of thalamocortical neurons that
oscillate in the frequency range of spindles at an intermediate level
of hyperpolarization (Steriade, 1999). At the macroscopic EEG
level, spindle frequency in humans encompasses the 12Y14 Hz
range (sigma activity1), although many studies bulk these standard
bounds of sigma band (Rechtschaffen and Kales, 1968), including
frequency bins traditionally considered to be part of the alpha band
(for a review, De Gennaro and Ferrara, 2003). Furthermore, large
genotype differences between the relative contribution of power in
the sigma range have been found in the non-REM sleep of inbred
mice (Franken et al., 1998).
Given the large individual differences in spindle frequency
activity in human subjects (Werth et al., 1997) and since it has been
suggested that such differences are invariant within individuals and
could be related to the individual traits of functional anatomy rather
than to sleep-dependent mechanisms (Finelli et al., 2001b), in the
present work, we decided to specifically analyze both group and
individual differences in a range of EEG frequencies including
sigma activity during non-REM sleep [8.0Y15.5 Hz range (0.25-Hz
resolution)] in a group of 10 subjects who had previously
participated in a slow-wave sleep (SWS) deprivation study (Ferrara
et al., 1999). The six consecutive nights of the experimental
paradigm were characterized by profound differences in quantita-
tive EEG measures, as assessed by spectral analysis of the EEG
(Ferrara et al., 2002). Whether or not spindle frequency activity is
an individual EEG-trait, we hypothesize that its invariance within
individuals will be maintained also during nights with a largely
different sleep architecture.
Materials and methods
Subjects
The current study was carried out on sleep recordings of
normal males who had participated in a SWS deprivation study
(Ferrara et al., 2002). Ten normal male subjects [mean age = 23.4
1 Although there are some intrinsic limitations of Fast Fourier Transform
(FFT) analysis in distinguishing phasic activity from background EEG
activity, it has nevertheless been shown that spectral power reflects sleep
spindle activity by comparing visual scoring of spindles, automatic
detection of spindles, and the FFT analysis of sigma activity (Dijk et al.,
1993).
years (SEM = 0.87)] were selected as paid volunteers from a
university student population. They reported drinking less than
three caffeinated beverages per day, usually sleeping 7Y8 h per
night with sleep onset between 11:00 p.m. and 12:00 midnight,
not taking naps during the day, with no excessive daytime
sleepiness, and no other sleep, medical, or psychiatric disorder, as
assessed by a 1-week sleep log, by actigraphic recordings and by a
clinical interview.
All subjects signed an informed consent before participating in
the study, and the study protocol was approved by the local
Institutional Review Board and was conducted in accordance with
the Declaration of Helsinki.
Procedure
The participants were recorded for 6 consecutive nights in a
sound-proof, temperature controlled room: (1) adaptation; (2)
undisturbed baseline (BSL); (3) baseline with awakenings (BLA);
(4) SWS deprivation-1 (DEP1); (5) SWS deprivation-2 (DEP2); (6)
recovery (REC). Adaptation is the first recording night, usually
disregarded for any data analysis in sleep research since it is
characterized by increased duration of stage 1 and intra-sleep wake,
lowered sleep efficiency, and increased latency to both slow-wave
(SWS) and rapid eye movement (REM) sleep. The second and third
nights were considered as baseline sleep, the only difference
between them being that in the third night the subjects were
awakened twice, and a psychophysiological test battery, lasting
about 13 min, was administered (Ferrara et al., 2000). The first
night-time awakening was scheduled after 2 h and the second after
5 h of accrued sleep. Similar experimental awakenings were present
also during nights 4Y6. During the two selective SWS deprivation
nights, two experimenters continuously monitored the EEG chart
and delivered a tone (frequency: 1000 Hz; intensity: 40Y110 dB) bypressing a button whenever at least 2 delta waves (e4 Hz; N75 AV),determined by visual inspection, appeared in a 15-s recording
interval. The intensity of acoustic stimuli began from the lowest
intensity, and it was increased in steps of 5 dB if no response
occurred (sleep stage shift, K complex, EEG desynchronization,
alpha burst, muscle tone increase, and slow eye movements). In this
manner, we prevented the subject from fully entering stage 3 by
lightening his sleep and carefully avoiding full awakenings.
Finally, during the sixth night, the subjects were allowed a recovery
sleep, undisturbed except for the two abovementioned awakenings.
Every night, subjects arrived in the laboratory at about 9:00
p.m. for electrode hook-up. Lights were turned off and poly-
graphic sleep recordings always started at 11:30 p.m. (T30 min)
and ended after 7.5 h of accumulated sleep. Wrist actigraphic
recordings (AMI motion logger 16 K) monitored the participants
to avoid any napping and strenuous physical exercise throughout
the experiment.
Sleep recording
An Esaote Biomedica VEGA 24 polygraph set at a paper speed
of 10 mm/s was used for polygraphic recordings. EEG signals were
high pass filtered with a time constant of 0.3 s and low pass filtered
at 30 Hz (30 dB/octave); unipolar EEGs were recorded according
to the international 10Y20 system: Fz-A1, Cz-A1, Pz-A1, Oz-A1,
and C3-A2. The submental electromyogram (EMG) was recorded
with a time constant of 0.03 s, and bipolar horizontal and vertical
eye movements were recorded with a time constant of 1 s.
L. De Gennaro et al. / NeuroImage 26 (2005) 114Y122116
Electrode impedance was kept below 5 KV. Left central EEG (C3-
A2), EMG, and horizontal and vertical EOG were used to visually
score sleep stages in 20 s epochs.
Quantitative analysis of signals
The polygraphic signals were analog to digital converted on-
line with a sampling rate of 128 Hz and stored on the disk of a
personal computer. Artifacts were excluded off-line on a 4-s
basis by visual inspection. The EEG power spectra of the antero-
posterior derivations (Fz-A1, Cz-A1, Pz-A1, and Oz-A1) were
calculated by a Fast Fourier Transform routine for consecutive 4
s epochs of non-REM sleep (stage 2 + 3 + 4), across the
8.0Y15.5 Hz range in a 0.25-Hz resolution. Total sleep time in
the six nights ranged from 451 to 478 min, and non-REM
duration (stage 2 + 3 + 4) from 302 to 319 min. In both cases,
differences were not significant. Sleep onset was determined
according to standard criteria (Rechtschaffen and Kales, 1968).
Absolute individual power values were z-transformed based on
the distributions of individual values for each derivation and night
to stabilize intra-individual variance and to remove the influence of
individual mean power in the considered frequency range.
Statistics
The preliminary analyses of EEG topography were carried out
on group measures. For this purpose, one-way analyses of variance
(ANOVAs) compared the four EEG derivations for each frequency
bin. Further ANOVAs on group data compared the six sleep
recordings for each frequency bin. These ANOVAs were not aimed
to elucidate the specific differences between derivations and nights
(and their interactions), since they had previously been demon-
strated in a detailed analysis at a 1-Hz resolution on raw (not z-
transformed) data (Ferrara et al., 2002). The aim of these ANOVAs
was only to point out the range of between-derivation and between-
night differences in group analyses, substantially confirming what
showed at a 1-Hz resolution.
With specific regard to individual case analysis, to evaluate the
correlation between different nights, we implemented a matrix
correlation (Ramsay et al., 1984), which is an extension of the
usual productYmoment correlations for two variables. The usual
correlation coefficient is obtained from the two vectors x (N � 1)
and y (N � 1) which represent N observations for variables X and
Y, respectively. Therefore, the usual correlation coefficient may be
called a Bvector correlation[. When we have p variables X1I Xp
instead of the single variable X, and p variables Y1IYp instead of
the single variable Y, then we have the data matrix X (N � p) and
the data matrix Y (N � p). The matrix correlation is the index
representing the relationships between the two matrices X and Y.
Each row � column element of the two matrices X and Y has been
correlated to the corresponding element of the other matrix; in such
way, both rows and columns have been correlated giving a unique
value indicating the strength of the association between two
bidimensional measures.
In the present study, any night was seen like a matrix. Each
element of the matrix represents the spectral value of a specific
derivation at a given frequency. In each night, we considered the
four different scalp locations, so that each element of a matrix
was correlated with the same element of any other matrix. More
specifically, Xi ,j represents the EEG power for the i derivations
and j frequency bins in one night, while Yi ,j represents the same
variables in a different night. For each night-subject, the thus-
defined matrix was correlated with the corresponding matrices of
the other five nights, yielding 15 matrix-correlation coefficients
for each subject. The correlation coefficient denotes the strength
of the linear association between the different matrices (nights).
The correlation coefficient changes as a function of the
association between the values of the corresponding variable in
two different matrices (scalp location � EEG frequency),
indicating to what extent the antero-posterior EEG topography
across the 8.00Y15.50 Hz range of one specific night is associated
to that of another night. Hence, the matrix correlation values
measure similarities in topographical distribution of EEG power
values, since they correlate the i values (at any frequency bin) of
a specific scalp location of a night and the i values of the
corresponding scalp location of any other matrix. This is
intrinsically linked to the aim of the current study, that is, the
assessment of individual differences in antero-posterior EEG
topography.
The averaged values of these coefficients were then compared
against the overall correlation between the matrices that was
obtained by estimating the mean correlation coefficient between all
possible combinations of different nights (1350 comparisons),
excluding the different nights of the same subject and the same
night of different subjects. A further overall correlation between
the matrices was also obtained by estimating the mean correlation
coefficient between all possible combinations of different nights
(1620 comparisons), excluding only the different nights of the
same subject. These two overall correlations, calculated with or
without the same night of different subjects, reflect different
estimates of the between-subject similarity, that is, either taking or
not taking into account the similarity due to the experimental
condition (i.e., the specific experimental night).
Both the averaging of within-subject correlations and of
between-subject correlations were performed after a Fisher z-
transformation of the coefficients, and then the average values were
back-transformed. The comparison between the mean within-
subject correlation and the two overall correlations of all the other
different nights were not strictly aimed to assess the significance of
that difference (which is, in fact, very likely), but, above all, to
provide an estimate of the exceeding percentage of variance
explained by within-subject similarity as compared to the between-
subject one.
To assess the significance of the abovementioned comparisons
between correlations coefficients, given the null hypothesis that
both samples of pairs show the same correlation strength, i.e., R1 =
R2, each correlation coefficient was transformed with the Fisher z-
transform: Zf = 1/2 * ln [(1 + R) / (1 j R)]. Fisher’s z-
transformation was used for the variance stabilization of the r
values. All the obtained values were averaged in Zf1 (within-
subjects) and Zf2 (between-subjects). The difference, where N is
the sample size: z = (Zf1 j Zf2) / SQRT [1 / (N1 j 3) + 1 / (N2 j
3)], is approximately normally distributed (Haegert et al., 1999).
The z values have been used to assess statistical significance at the
a level of e0.05. Like the correlation coefficients calculated
between unidimensional variables, the z-transformation is used in
testing the significance of the difference between two matrix
correlation coefficients obtained from two independent samples of
N1 and N2 size, under the null hypothesis of a difference between
the two population correlations equal to 0. Hence, the z-trans-
formation was used to compare the distributions of within-subject
correlations with those of between-subject correlations.
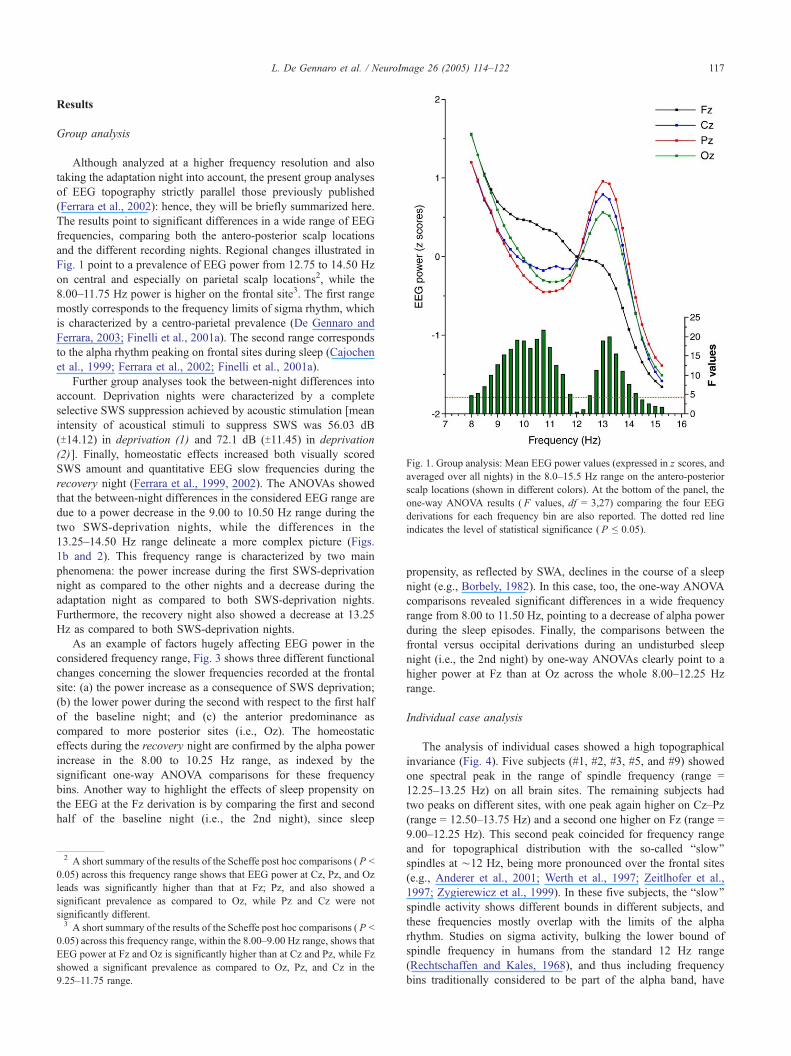
Fig. 1. Group analysis: Mean EEG power values (expressed in z scores, and
averaged over all nights) in the 8.0Y15.5 Hz range on the antero-posterior
scalp locations (shown in different colors). At the bottom of the panel, the
one-way ANOVA results ( F values, df = 3,27) comparing the four EEG
derivations for each frequency bin are also reported. The dotted red line
indicates the level of statistical significance ( P e 0.05).
L. De Gennaro et al. / NeuroImage 26 (2005) 114Y122 117
Results
Group analysis
Although analyzed at a higher frequency resolution and also
taking the adaptation night into account, the present group analyses
of EEG topography strictly parallel those previously published
(Ferrara et al., 2002): hence, they will be briefly summarized here.
The results point to significant differences in a wide range of EEG
frequencies, comparing both the antero-posterior scalp locations
and the different recording nights. Regional changes illustrated in
Fig. 1 point to a prevalence of EEG power from 12.75 to 14.50 Hz
on central and especially on parietal scalp locations2, while the
8.00Y11.75 Hz power is higher on the frontal site3. The first range
mostly corresponds to the frequency limits of sigma rhythm, which
is characterized by a centro-parietal prevalence (De Gennaro and
Ferrara, 2003; Finelli et al., 2001a). The second range corresponds
to the alpha rhythm peaking on frontal sites during sleep (Cajochen
et al., 1999; Ferrara et al., 2002; Finelli et al., 2001a).
Further group analyses took the between-night differences into
account. Deprivation nights were characterized by a complete
selective SWS suppression achieved by acoustic stimulation [mean
intensity of acoustical stimuli to suppress SWS was 56.03 dB
(T14.12) in deprivation (1) and 72.1 dB (T11.45) in deprivation
(2)]. Finally, homeostatic effects increased both visually scored
SWS amount and quantitative EEG slow frequencies during the
recovery night (Ferrara et al., 1999, 2002). The ANOVAs showed
that the between-night differences in the considered EEG range are
due to a power decrease in the 9.00 to 10.50 Hz range during the
two SWS-deprivation nights, while the differences in the
13.25Y14.50 Hz range delineate a more complex picture (Figs.
1b and 2). This frequency range is characterized by two main
phenomena: the power increase during the first SWS-deprivation
night as compared to the other nights and a decrease during the
adaptation night as compared to both SWS-deprivation nights.
Furthermore, the recovery night also showed a decrease at 13.25
Hz as compared to both SWS-deprivation nights.
As an example of factors hugely affecting EEG power in the
considered frequency range, Fig. 3 shows three different functional
changes concerning the slower frequencies recorded at the frontal
site: (a) the power increase as a consequence of SWS deprivation;
(b) the lower power during the second with respect to the first half
of the baseline night; and (c) the anterior predominance as
compared to more posterior sites (i.e., Oz). The homeostatic
effects during the recovery night are confirmed by the alpha power
increase in the 8.00 to 10.25 Hz range, as indexed by the
significant one-way ANOVA comparisons for these frequency
bins. Another way to highlight the effects of sleep propensity on
the EEG at the Fz derivation is by comparing the first and second
half of the baseline night (i.e., the 2nd night), since sleep
3 A short summary of the results of the Scheffe post hoc comparisons ( P G0.05) across this frequency range, within the 8.00Y9.00 Hz range, shows thatEEG power at Fz and Oz is significantly higher than at Cz and Pz, while Fz
showed a significant prevalence as compared to Oz, Pz, and Cz in the
9.25Y11.75 range.
2 A short summary of the results of the Scheffe post hoc comparisons ( P G
0.05) across this frequency range shows that EEG power at Cz, Pz, and Oz
leads was significantly higher than that at Fz; Pz, and also showed a
significant prevalence as compared to Oz, while Pz and Cz were not
significantly different.
propensity, as reflected by SWA, declines in the course of a sleep
night (e.g., Borbely, 1982). In this case, too, the one-way ANOVA
comparisons revealed significant differences in a wide frequency
range from 8.00 to 11.50 Hz, pointing to a decrease of alpha power
during the sleep episodes. Finally, the comparisons between the
frontal versus occipital derivations during an undisturbed sleep
night (i.e., the 2nd night) by one-way ANOVAs clearly point to a
higher power at Fz than at Oz across the whole 8.00Y12.25 Hz
range.
Individual case analysis
The analysis of individual cases showed a high topographical
invariance (Fig. 4). Five subjects (#1, #2, #3, #5, and #9) showed
one spectral peak in the range of spindle frequency (range =
12.25Y13.25 Hz) on all brain sites. The remaining subjects had
two peaks on different sites, with one peak again higher on CzYPz(range = 12.50Y13.75 Hz) and a second one higher on Fz (range =
9.00Y12.25 Hz). This second peak coincided for frequency range
and for topographical distribution with the so-called Bslow[spindles at ¨12 Hz, being more pronounced over the frontal sites
(e.g., Anderer et al., 2001; Werth et al., 1997; Zeitlhofer et al.,
1997; Zygierewicz et al., 1999). In these five subjects, the Bslow[spindle activity shows different bounds in different subjects, and
these frequencies mostly overlap with the limits of the alpha
rhythm. Studies on sigma activity, bulking the lower bound of
spindle frequency in humans from the standard 12 Hz range
(Rechtschaffen and Kales, 1968), and thus including frequency
bins traditionally considered to be part of the alpha band, have
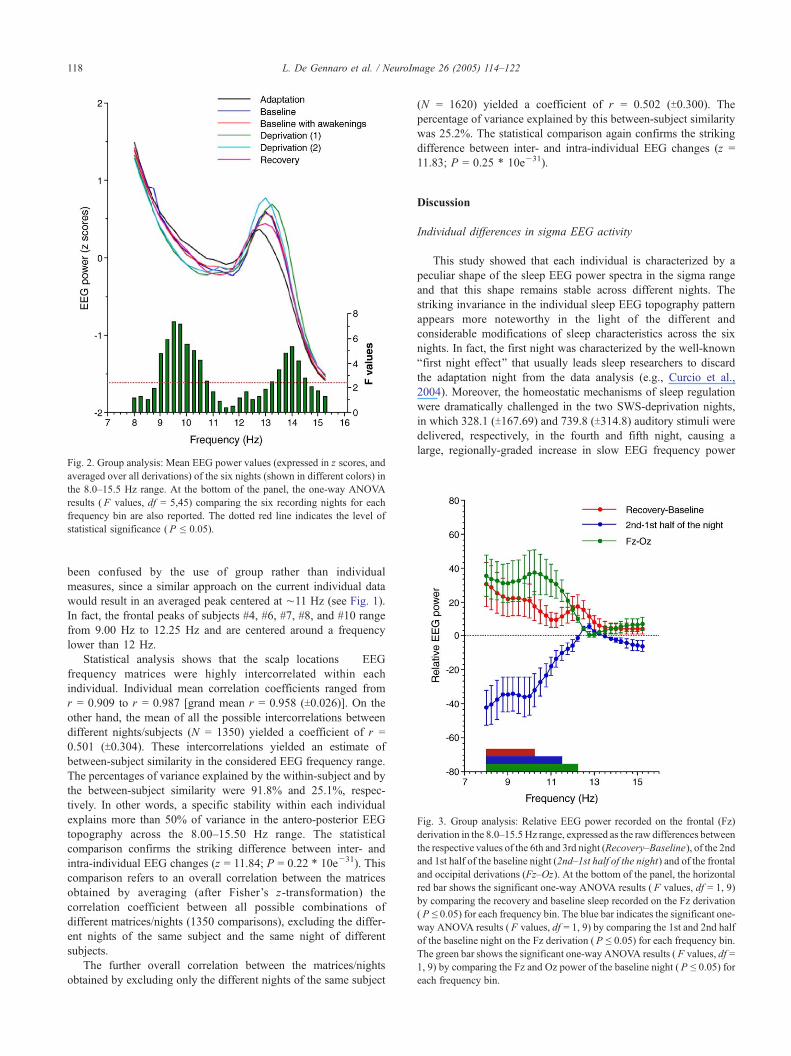
Fig. 2. Group analysis: Mean EEG power values (expressed in z scores, and
averaged over all derivations) of the six nights (shown in different colors) in
the 8.0Y15.5 Hz range. At the bottom of the panel, the one-way ANOVA
results ( F values, df = 5,45) comparing the six recording nights for each
frequency bin are also reported. The dotted red line indicates the level of
statistical significance ( P e 0.05).
Fig. 3. Group analysis: Relative EEG power recorded on the frontal (Fz)
derivation in the 8.0Y15.5Hz range, expressed as the raw differences between
the respective values of the 6th and 3rd night (RecoveryYBaseline), of the 2ndand 1st half of the baseline night (2ndY1st half of the night) and of the frontaland occipital derivations (FzYOz). At the bottom of the panel, the horizontal
red bar shows the significant one-way ANOVA results ( F values, df = 1, 9)
by comparing the recovery and baseline sleep recorded on the Fz derivation
( P e 0.05) for each frequency bin. The blue bar indicates the significant one-
way ANOVA results ( F values, df = 1, 9) by comparing the 1st and 2nd half
of the baseline night on the Fz derivation ( P e 0.05) for each frequency bin.
The green bar shows the significant one-way ANOVA results ( F values, df =
1, 9) by comparing the Fz and Oz power of the baseline night ( P e 0.05) for
each frequency bin.
L. De Gennaro et al. / NeuroImage 26 (2005) 114Y122118
been confused by the use of group rather than individual
measures, since a similar approach on the current individual data
would result in an averaged peak centered at ¨11 Hz (see Fig. 1).
In fact, the frontal peaks of subjects #4, #6, #7, #8, and #10 range
from 9.00 Hz to 12.25 Hz and are centered around a frequency
lower than 12 Hz.
Statistical analysis shows that the scalp locations � EEG
frequency matrices were highly intercorrelated within each
individual. Individual mean correlation coefficients ranged from
r = 0.909 to r = 0.987 [grand mean r = 0.958 (T0.026)]. On the
other hand, the mean of all the possible intercorrelations between
different nights/subjects (N = 1350) yielded a coefficient of r =
0.501 (T0.304). These intercorrelations yielded an estimate of
between-subject similarity in the considered EEG frequency range.
The percentages of variance explained by the within-subject and by
the between-subject similarity were 91.8% and 25.1%, respec-
tively. In other words, a specific stability within each individual
explains more than 50% of variance in the antero-posterior EEG
topography across the 8.00Y15.50 Hz range. The statistical
comparison confirms the striking difference between inter- and
intra-individual EEG changes (z = 11.84; P = 0.22 * 10ej31). This
comparison refers to an overall correlation between the matrices
obtained by averaging (after Fisher’s z-transformation) the
correlation coefficient between all possible combinations of
different matrices/nights (1350 comparisons), excluding the differ-
ent nights of the same subject and the same night of different
subjects.
The further overall correlation between the matrices/nights
obtained by excluding only the different nights of the same subject
(N = 1620) yielded a coefficient of r = 0.502 (T0.300). The
percentage of variance explained by this between-subject similarity
was 25.2%. The statistical comparison again confirms the striking
difference between inter- and intra-individual EEG changes (z =
11.83; P = 0.25 * 10ej31).
Discussion
Individual differences in sigma EEG activity
This study showed that each individual is characterized by a
peculiar shape of the sleep EEG power spectra in the sigma range
and that this shape remains stable across different nights. The
striking invariance in the individual sleep EEG topography pattern
appears more noteworthy in the light of the different and
considerable modifications of sleep characteristics across the six
nights. In fact, the first night was characterized by the well-known
Bfirst night effect[ that usually leads sleep researchers to discard
the adaptation night from the data analysis (e.g., Curcio et al.,
2004). Moreover, the homeostatic mechanisms of sleep regulation
were dramatically challenged in the two SWS-deprivation nights,
in which 328.1 (T167.69) and 739.8 (T314.8) auditory stimuli were
delivered, respectively, in the fourth and fifth night, causing a
large, regionally-graded increase in slow EEG frequency power
L. De Gennaro et al. / NeuroImage 26 (2005) 114Y122 119
during the non-REM sleep of the recovery night (Ferrara et al.,
2002)4.
Therefore, a stable, frequency-specific pattern of EEG power
topography along the antero-posterior cortical axis during non-
REM sleep distinguishes each individual like a Bfingerprint[. Asimilar invariance of EEG power distribution during human non-
REM sleep has also been suggested by a full-scalp recording
(Finelli et al., 2001b). Furthermore, the differences between the
long and the short sleepers in the homeostatic response to sleep
loss, with the short sleepers living under a higher sleep pressure
(Aeschbach et al., 1996), also seem consistent with the hypothesis
of individual invariance of EEG power during human non-REM
sleep. Generally speaking, quantitative non-REM sleep EEG
measures are characterized by a high within-subject stability. As
an example, period and amplitude measures of several EEG bands
including sigma activity were shown to be highly consistent across
nights (Feinberg et al., 1980). This consistency was attributed to:
(a) the fact that subjects were studied in the same biological state,
avoiding the variations in mood, arousal, or attention which can
affect EEG measures during waking; (b) the lengthy period of
observation (5Y6 h per subject) that is typical of sleep studies. The
strong trait-like characteristics of the quantitative EEG sleep
variables were later confirmed in different age groups of subjects
(Tan et al., 2000, 2001). Furthermore, the findings by Palagini et al.
(2000) go in the same direction, demonstrating that individual
differences in spectral measures of baseline sleep were signifi-
cantly retained on the third night of temazepam administration,
although the drug altered the EEG in the delta, sigma, and beta
bands. The particularly high inter-night correlation in the sigma
band (r = 0.977) reported by Tan et al. (2000) was attributed to the
marked and stable individual differences in organized spindle
activity (Gaillard and Blois, 1981; Silverstein and Levy, 1976).
Moreover, the particular waveform of spindles more closely
approximate the Fourier assumptions of sinusoidal shape and
stationarity, a factor that may contribute to the high reliability of
the spindle frequency activity (Tan et al., 2000).
Our findings clearly showed that this Bspectral signature[remains substantially invariant during different nights character-
ized by massive changes of sleep structure. Moreover, this
invariance is also topographically specific (at least, on the
antero-posterior axis). Therefore, it can be hypothesized that it
may be related to individual differences in genetically determined
functional brain anatomy rather than to sleep-dependent mecha-
nisms, since it has been already demonstrated that many features of
the normal waking EEG are among the most heritable traits in
humans (Van Beijsterveldt and Boomsma, 1994). In fact, the
monozygotic cotwin covariance for EEG power is greater than
expected for additive gene actions, as compared with dizygotic
cotwin covariance (Lykken, 1982; Stassen et al., 1988). This
pattern of twin covariances could be due to gene interactions, but
also to greater monozygotic than dizygotic environmental cova-
riance (Christian et al., 1996). In any case, it has been concluded
4 Although independent of the homeostatic changes after SWS depriva-
tion, the invariance in the individual EEG topography pattern could
nevertheless be theoretically dependent on circadian factors, since sleep
occurred at only one circadian phase, and the separation of the two
mechanisms is allowed only by forced desynchrony protocols (e.g., Dijk,
1999; Dijk et al., 1995, 1997, 1999). Only specific studies using these
protocols can directly assess this hypothesis.
from the available data that the waking EEG is among the most
heritable human traits (Van Baal et al., 1996). Moreover, as far as
sleep EEG is concerned, a strong genetic control for delta and
sigma oscillations during non-REM sleep, and for theta oscillations
during REM sleep, has been found in inbred mice (Franken et al.,
1998; Tafti et al., 2003).
Individual differences or different spindles?
The present results also provide a definitive contribution to the
Bslow-fast spindle[ issue. On the basis of regional differences in
cortical topography of sleep spindles, two distinct sleep spindle
types have been hypothesized: Bslow[ spindles at ¨12 Hz, more
pronounced over the frontal sites, and Bfast[ spindles at ¨14 Hz,
more evident over parietal and central sites (Jobert et al., 1992;
Werth et al., 1997; Zeitlhofer et al., 1997; Zygierewicz et al.,
1999). While lower sigma frequencies and slow spindles decrease
over consecutive non-REM sleep episodes, higher sigma frequen-
cies and fast spindles progressively rise (Jobert et al., 1992; Werth
et al., 1997). Moreover, other functional dissociations have been
reported as a function of age and maturation (Landolt et al., 1996;
Shinomiya et al., 1999), homeostatic and circadian factors
(Aeschbach and Borbely, 1993; Aeschbach et al., 1997; Dijk and
Czeisler, 1995; Dijk et al., 1997; Wei et al., 1999), menstrual cycle
phase (Driver et al., 1996), pregnancy (Brunner et al., 1994), and
pharmacological agents (Aeschbach et al., 1994; Dijk et al., 1995;
Jobert et al., 1992). These results have been interpreted according
to at least two functionally separate spindle generators. Some
support for this hypothesis has been provided by a study using low-
resolution brain electromagnetic tomography (LORETA), showing
a source in the prefrontal cortex (Brodmann areas 9 and 10) for
slow spindles and in the precuneus (Brodmann area 7) for fast
spindles (Anderer et al., 2001).
On the other hand, electrophysiological studies have attributed
the whole frequency range of sleep spindles to a single mechanism,
namely, the duration of the hyperpolarization-rebound sequence in
thalamocortical neurons: long hyperpolarizations yield slower EEG
frequencies, short hyperpolarizations yield faster EEG frequencies
(e.g., Steriade and Amzica, 1998). Cortical areas on which Bslow[spindles have been detected are related to those thalamic nuclei in
which relay cells display long hyperpolarizations (Steriade,
personal communication).
In our opinion, the present results clearly point to a single
mechanism. In line with the traditional sigma band limits
(12.00Y14.00 Hz), the data show that all subjects have only one
kind of sleep spindle, ranging within the 12.25Y13.75 Hz
frequency, while in some subjects there is a peak of EEG activity
on more anterior brain sites within the 9.00Y12.25 Hz range.
Although, on the basis of a FFT approach, one cannot ultimately
say whether this is linked to spindle activity or not, two main
arguments militate in favor of an interpretation in terms of alpha
activity: (1) In the current individual data, spindle activity, as a
general mechanism discernible in any sleep recordings, should
correspond to the peak within the 12.25Y13.75 Hz frequency
observed in all subjects; (2) A second peak, clearly discernible in
half of the subjects (#4, #6, #7, #8, and #10), ranges from 9.00 Hz
to 12.25 Hz with different bounds in different subjects, and these
frequencies mostly overlap with the limits of the alpha rhythm.
Hence, the main dissociation between slow and fast spindles, that
is, their inverse time course across consecutive sleep episodes
(Jobert et al., 1992; Werth et al., 1997), can be explained by the
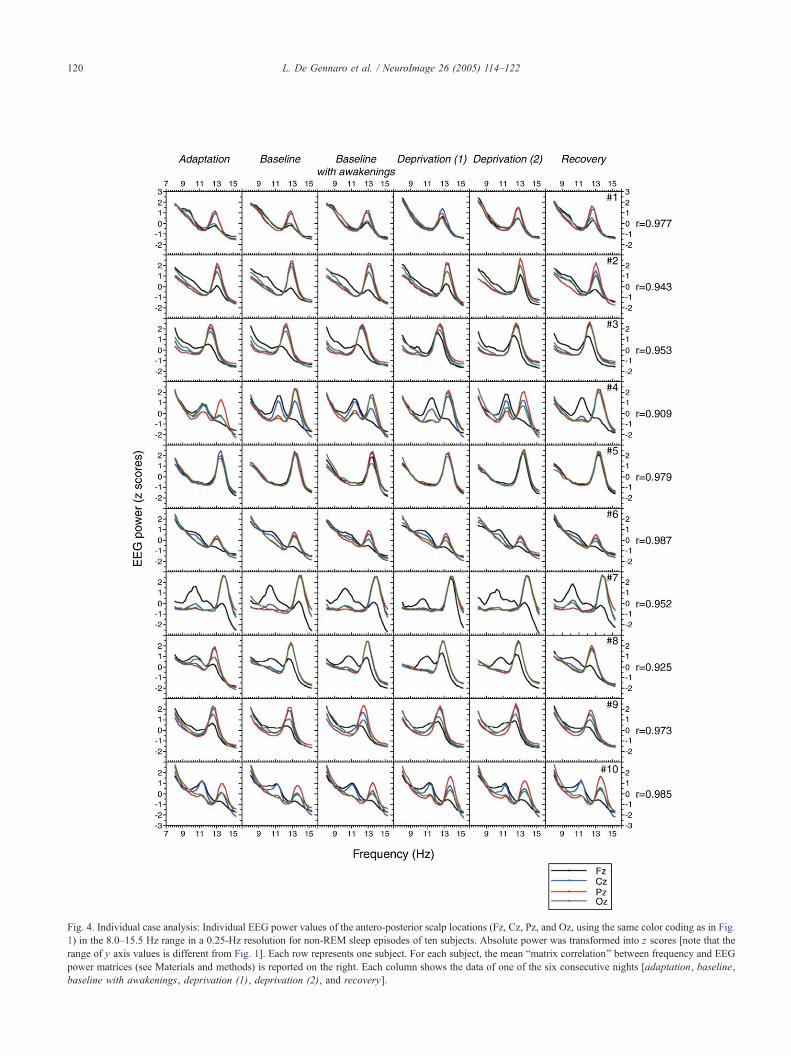
Fig. 4. Individual case analysis: Individual EEG power values of the antero-posterior scalp locations (Fz, Cz, Pz, and Oz, using the same color coding as in Fig.
1) in the 8.0Y15.5 Hz range in a 0.25-Hz resolution for non-REM sleep episodes of ten subjects. Absolute power was transformed into z scores [note that the
range of y axis values is different from Fig. 1]. Each row represents one subject. For each subject, the mean Bmatrix correlation[ between frequency and EEG
power matrices (see Materials and methods) is reported on the right. Each column shows the data of one of the six consecutive nights [adaptation, baseline,
baseline with awakenings, deprivation (1), deprivation (2), and recovery].
L. De Gennaro et al. / NeuroImage 26 (2005) 114Y122120
L. De Gennaro et al. / NeuroImage 26 (2005) 114Y122 121
decrease of alpha power from the first to the second half of the
night (Finelli et al., 2001a). Even the increase of the so-called slow
spindles after sleep deprivation is explained by the increase of
alpha power after total (Cajochen et al., 1999; Finelli et al., 2001a)
or selective sleep deprivation (Ferrara et al., 2002).
The results in Fig. 3 strengthen this interpretation. In fact, the
analyses confirm the anterior prevalence of EEG activity corre-
sponding to the slow spindle frequency range, and they clearly
indicate that these frequencies actually show a power decrease
from the first to the second half of the night and a power increase
after SWS deprivation. However, what is similarly clear is that
these regional, intra-night and recuperative changes affect the so-
called slow spindle frequency like parallel identical changes affect
a broader range starting from 8.00 Hz.
Finally, it should be mentioned that also the dissociation as a
function of circadian factors has recently been explained by the cir-
cadian rhythm of spindle frequency (Knoblauch et al., 2003), instead
of by the different circadian oscillation for different sleep spindles.
As a general principle of parsimony, the electrophysiological
evidence of a single thalamocortical mechanism (namely, the
duration of the hyperpolarization-rebound sequence), the observa-
tion of individual differences, the complete overlap between some
functional changes in the alpha range and those at ¨12 Hz, all
converge to highlight that there is only one kind of EEG activity
corresponding to sleep spindles and that the ¨12 Hz EEG changes
(in fact, at frequencies less than 12 Hz) are components of alpha
activity.
Conclusions
Average group measures, which emphasize the similarities
between subjects, are only one, albeit the most used, of the possible
approaches in the study of the neurophysiological correlates of
human sleep. However, this approach does not account for the
repertoire of individual patterns that can be important for under-
standing the variety of ways in which human brain organization
underlies behavior. Our results support the view of a genetic
control of sleep-related oscillations also in humans, and they
provide an important basis for future neurophysiological and
genetic studies, such as comparing the sleep EEG topography of
dizygotic and monozygotic twins.
Acknowledgment
This work was supported by the MIUR grant Finanziamento
per le Ricerche di Ateneo 2003.
References
Aeschbach, D., Borbely, A.A., 1993. All-night dynamics of the human
sleep EEG. J. Sleep Res. 2, 70–81.
Aeschbach, D., Dijk, D.J., Trachsel, L., Brunner, D.P., Borbely, A.A., 1994.
Dynamics of slow-wave activity and spindle frequency activity in the
human sleep EEG: effect of midazolam and zopiclone. Neuropsycho-
pharmacology 11, 237–244.
Aeschbach, D., Cajochen, C., Landolt, H., Borbely, A.A., 1996. Homeo-
static sleep regulation in habitual short sleepers and long sleepers. Am.
J. Physiol. 270, R41–R53.
Aeschbach, D., Dijk, D.J., Borbely, A.A., 1997. Dynamics of EEG spindle
frequency activity during extended sleep in humans: relationship to
slow-wave activity and time of day. Brain Res. 748, 131–136.
Aeschbach, D., Postolache, T.T., Sher, L., Matthews, J.R., Jackson, M.A.,
Wehr, T.A., 2001. Evidence from the waking electroencephalogram that
short sleepers live under higher homeostatic sleep pressure than long
sleepers. Neuroscience 102, 493–502.
Aeschbach, D., Sher, L., Postolache, T.T., Matthews, J.R., Jackson, M.A.,
Wehr, T.A., 2003. A longer biological night in long sleepers than in
short sleepers. J. Clin. Endocrinol. Metab. 88, 26–30.
Aguirre, G.K., Zarahn, E., D’esposito, M., 1998. The variability of human.
BOLD hemodynamic responses. NeuroImage 8, 360–369.
Anderer, P., Klosch, G., Gruber, G., Trenker, E., Pascual-Marqui, R.D.,
Zeitlhofer, J., Barbanoj, M.J., Rappelsberger, P., Saletu, B., 2001. Low-
resolution brain electromagnetic tomography revealed simultaneously
active frontal and parietal sleep spindle sources in the human cortex.
Neuroscience 103, 581–592.
Bell-McGinty, S., Habeck, C., Hilton, H.J., Rakitin, B., Scarmeas, N.,
Zarahn, E., Flynn, J., DeLaPaz, R., Basner, R., Stern, Y., 2004.
Identification and differential vulnerability of a neural network in sleep
deprivation. Cereb. Cortex 14, 496–502.
Borbely, A.A., 1982. A two process model of sleep regulation. Hum.
Neurobiol. 1, 195–204.
Borbely, A.A., Achermann, P., 2000. Sleep homeostasis and models of sleep
regulation. In: Kryger, M.H., Roth, T., Dement, W.C. (Eds.), Principles
and Practice of Sleep Medicine. Saunders, Philadelphia, pp. 377–390.
Brunner, D.P., Munch, M., Biedermann, K., Huch, R., Huch, A., Borbely,
A.A., 1994. Changes in sleep and sleep electroencephalogram during
pregnancy. Sleep 17, 576–582.
Cajochen, C., Foy, R., Dijk, D.J., 1999. Frontal predominance of a relative
increase in sleep delta and theta EEG activity after sleep loss in humans.
Sleep Res. Online 2, 65–69.
Christian, J.C., Morzorati, S., Norton Jr., J.A., Williams, C.J., O’Connor, S.,
Li, T.K., 1996. Genetic analysis of the resting electroencephalographic
power spectrum in human twins. Psychophysiology 33, 584–591.
Curcio, G., Ferrara, M., Piergianni, A., Fratello, F., De Gennaro, L., 2004.
Paradoxes of the first-night effect: a quantitative analysis of antero-
posterior EEG topography. Clin. Neurophysiol. 115, 1178–1188.
De Gennaro, L., Ferrara, M., 2003. Sleep spindles: an overview. Sleep Med.
Rev. 7, 423–440.
Dijk, D.J., 1999. Circadian variation of EEG power spectra in NREM and
REM sleep in humans: dissociation from body temperature. J. Sleep
Res. 8, 189–195.
Dijk, D.J., Czeisler, C.A., 1995. Contribution of the circadian pacemaker
and the sleep homeostat to sleep propensity, sleep structure, electro-
encephalographic slow waves, and sleep spindle activity in humans.
J. Neurosci. 15, 3526–3538.
Dijk, D.J., Hayes, B., Czeisler, C.A., 1993. Dynamics of electroencephalo-
graphic sleep spindles and slow wave activity in men: effect of sleep
deprivation. Brain Res. 626, 190–199.
Dijk, D.J., Roth, C., Landolt, H.P., Werth, E., Aeppli, M., Achermann, P.,
Borbely, A.A., 1995. Melatonin effect on daytime sleep in men:
suppression of EEG slow-frequency activity and enhancement of
spindle frequency. Neurosci. Lett. 201, 13–16.
Dijk, D.-J., Shanahan, T.L., DuVy, J.F., Ronda, J.M., Czeisler, C.A., 1997.
Variation of electroencephalographic activity during NREM and REM
sleep with phase of circadian melatonin rhythm in humans. J. Physiol.
(London) 505, 851–858.
Dijk, D.J., Duffy, J.F., Riel, E., Shanahan, T.L., Czeisler, C.A., 1999.
Ageing and the circadian and homeostatic regulation of human sleep
during forced desynchrony of rest, melatonin and temperature rhythms.
J. Physiol. 516 (Pt 2), 611–627.
Driver, H.S., Dijk, D.J., Werth, E., Biedermann, K., Borbely, A.A., 1996.
Sleep and the sleep electroencephalogram across the menstrual cycle in
young healthy women. J. Clin. Endocrinol. Metab. 81, 728–735.
Duffy, J.F., Rimmer, D.W., Czeisler, C.A., 2001. Association of intrinsic
circadian period with morningnessYeveningness, usual wake time, and
circadian phase. Behav. Neurosci. 115, 895–899.
L. De Gennaro et al. / NeuroImage 26 (2005) 114Y122122
Feinberg, I., Fein, G., Floyd, T.C., 1980. Period and amplitude analysis of
NREM EEG in sleep: repeatability of results in young adults.
Electroencephalogr. Clin. Neurophysiol. 48, 212–221.
Ferrara, M., De Gennaro, L., Bertini, M., 1999. Selective slow-wave sleep
(SWS) deprivation and SWS rebound: do we need a fixed SWS amount
per night? Sleep Res. Online 2, 15–19.
Ferrara, M., De Gennaro, L., Casagrande, M., Bertini, M., 2000. Selective
slow-wave sleep deprivation and time-of-night effects on cognitive
performance upon awakening. Psychophysiology 37, 440–446.
Ferrara, M., De Gennaro, L., Curcio, G., Cristiani, R., Corvasce, C., Bertini,
M., 2002. Regional differences of the human sleep electroencephalo-
gram in response to selective slow-wave sleep deprivation. Cereb.
Cortex 12, 737–748.
Finelli, L.A., Borbely, A.A., Achermann, P., 2001a. Functional topography
of the human nonREM sleep electroencephalogram. Eur. J. Neurosci.
13, 2282–2290.
Finelli, L.A., Achermann, P., Borbely, A.A., 2001b. Individual Ffingerprints_
in human sleep EEG topography. Neuropsychopharmacology 25,
S57–S62.
Franken, P., Malafosse, A., Tafti, M., 1998. Genetic variation in EEG activity
during sleep in inbred mice. Am. J. Physiol. 275, R1127–R1137.
Gaillard, J.M., Blois, R., 1981. Spindle density in sleep of normal subjects.
Sleep 4, 385–391.
Haegert, D.G., Cowan, T., Murray, T.J., Gadag, V., O’Connor, P., 1999.
Does a shift in the T-cell receptor repertoire precede the onset of MS?
Neurology 11, 485–490.
Handwerker, D.A., Ollinger, J.M., D’Esposito, M., 2004. Variation of
BOLD hemodynamic responses across subjects and brain regions and
their effects on statistical analyses. NeuroImage 21, 1639–1651.
Huber, R., Deboer, T., Tobler, I., 2000. Topography of EEG dynamics after
sleep deprivation in mice. J. Neurophysiol. 84, 1888–1893.
Jobert, M., Poiseau, E., Jahnig, P., Schulz, H., Kubicki, S., 1992.
Topographical analysis of sleep spindle activity. Neuropsychobiology
26, 210–217.
Knoblauch, V., Martens, W., Wirz-Justice, A., Krauchi, K., Cajochen, C.,
2003. Regional differences in the circadian modulation of human sleep
spindle characteristics. Eur. J. Neurosci. 18, 155–163.
Landolt, H.P., Dijk, D.J., Achermann, P., Borbely, A.A., 1996. Effect
of age on the sleep EEG: slow-wave activity and spindle
frequency activity in young and middle-aged men. Brain Res. 738,
205–212.
Leproult, R., Colecchia, E.F., Berardi, A.M., Stickgold, R., Kosslyn, S.M.,
Van Cauter, E., 2003. Individual differences in subjective and objective
alertness during sleep deprivation are stable and unrelated. Am. J.
Physiol.: Regul., Integr. Comp. Physiol. 284, R280–R290.
Lykken, D.T., 1982. Presidential address, 1981. Research with twins: the
concept of emergenesis. Psychophysiology 19, 361–373.
Oleksenko, A.I., Mukhametov, L.M., Polyakova, I.G., Supin, A.Y.,
Kovalzon, V.M., 1992. Unihemispheric sleep deprivation in bottlenose
dolphins. J. Sleep Res. 1, 40–44.
Palagini, L., Campbell, I.G., Tan, X., Guazzelli, M., Feinberg, I., 2000.
Independence of sleep EEG responses to GABAergic hypnotics:
biological implications. J. Psychiatr. Res. 34, 293–300.
Ramsay, J., Ten Berge, J., Styan, G.P., 1984. Matrix correlation.
Psychometrika 49, 403–423.
Rattenborg, N.C., Lima, S.L., Amlaner, C.J., 1999. Half-awake to the risk
of predation. Nature 397, 397–398.
Rechtschaffen, A., Kales, A., 1968. A Manual of Standardized Terminol-
ogy, Techniques and Scoring System for Sleep Stages of Human
Subjects. Brain Information Service/Brain Research Institute, Univer-
sity of California, Los Angeles.
Shinomiya, S., Nagata, K., Takahashi, K., Masumura, T., 1999. Develop-
ment of sleep spindles in young children and adolescents. Clin.
Electroencephalogr. 30, 39–43.
Silverstein, L.D., Levy, C.M., 1976. The stability of the sigma sleep
spindle. Electroencephalogr. Clin. Neurophysiol. 40, 666–670.
Stassen, H.H., Lykken, D.T., Bomben, G., 1988. The within-pair EEG
similarity of twins reared apart. Eur. Arch. Psychiatr. Neurol. Sci. 237,
244–252.
Steriade, M., 1999. Coherent oscillations and short-term plasticity in
corticothalamic networks. Trends Neurosci. 22, 337–345.
Steriade, M., Amzica, F., 1998. Coalescence of sleep rhythms and their
chronology in corticothalamic networks. Sleep Res. Online 1, 1–10.
Tafti, M., Petit, B., Chollet, D., Neidhart, E., de Bilbao, F., Kiss, J.Z.,
Wood, P.A., Franken, P., 2003. Deficiency in short-chain fatty acid
beta-oxidation affects theta oscillations during sleep. Nat. Genet. 34,
320–325.
Tan, X., Campbell, I.G., Palagini, L., Feinberg, I., 2000. High internight
reliability of computer-measured NREM delta, sigma, and beta:
biological implications. Biol. Psychiatry 48, 1010–1019.
Tan, X., Campbell, I.G., Feinberg, I., 2001. Internight reliability and
benchmark values for computer analyses of non-rapid eye movement
(NREM) and REM EEG in normal young adult and elderly subjects.
Clin. Neurophysiol. 112, 1540–1552.
Tobler, I., 1995. Is sleep fundamentally different between mammalian
species? Behav. Brain Res. 69, 35–41.
Van Baal, G.C., De Geus, E.J., Boomsma, D.I., 1996. Genetic architecture
of EEG power spectra in early life. Electroencephalogr. Clin. Neuro-
physiol. 98, 502–514.
Van Beijsterveldt, C.E., Boomsma, D.I., 1994. Genetics of the human
electroencephalogram (EEG) and event-related brain potentials (ERPs):
a review. Hum. Genet. 94, 319–330.
Van Dongen, H.P., Baynard, M.D., Maislin, G., Dinges, D.F., 2004.
Systematic interindividual differences in neurobehavioral impairment
from sleep loss: evidence of trait-like differential vulnerability. Sleep
27, 423–433.
Vyazovskiy, V.V., Borbely, A.A., Tobler, I., 2002. Interhemispheric
sleep EEG asymmetry in the rat is enhanced by sleep deprivation.
J. Neurophysiol. 88, 2280–2286.
Wei, H.G., Riel, E., Czeisler, C.A., Dijk, D.J., 1999. Attenuated amplitude
of circadian and sleep-dependent modulation of electroencephalo-
graphic sleep spindle characteristics in elderly human subjects. Neuro-
sci. Lett. 260, 29–32.
Wei, X., Yoo, S.S., Dickey, C.C., Zou, K.H., Guttmann, C.R., Panych, L.P.,
2004. Functional MRI of auditory verbal working memory: long-term
reproducibility analysis. NeuroImage 21, 1000–1008.
Werth, E., Achermann, P., Dijk, D.J., Borbely, A.A., 1997. Spindle
frequency activity in the sleep EEG: individual differences and
topographic distribution. Electroencephalogr. Clin. Neurophysiol. 103,
535–542.
Zeitlhofer, J., Gruber, G., Anderer, P., Asenbaum, S., Scimicek, P., Saletu,
B., 1997. Topographic distribution of sleep spindles in young healthy
subjects. J. Sleep Res. 6, 149–155.
Zygierewicz, J., Blinowska, K.J., Durka, P.J., Szelenberger, W., Niemce-
wicz, S., Androsiuk, W., 1999. High resolution study of sleep spindles.
Electroencephalogr. Clin. Neurophysiol. 110, 2136–2147.