An assessment of entrepreneurial intentions of secondary school learners
in selected areas
JM Barnard
12670693
Mini-dissertation submitted for the degree Masters in Business Administration at the Potchefstroom Campus of the North-
West University
Promoter: Prof SP van der Merwe
November 2012
i
ABSTRACT
This study highlights the need for a youth entrepreneurship education program of
value in South African secondary schools. It examines the enterprising tendencies of
grade 12 learners in 10 secondary schools in the Lejweleputswa District of the Free
State province, South Africa, using the General Enterprising Tendency (GET) test.
An investigation into the current status of entrepreneurship in South Africa revealed
that there is a lack of entrepreneurs and not enough people who have the orientation
and skills to create new businesses. This leads to a situation where the South African
economy performs poorly and the recent financial crisis exuberated South Africa’s
challenges in terms of poverty, unemployment and income inequality. In addition,
youth unemployment has worsened as a result of the recession, because the youth
lack the needed qualifications, experience and skills to compete for the few job
opportunities in the labour market. Entrepreneurship and innovation are widely seen
as key sources of renewed economic growth, creating jobs and advancing human
welfare.
This study shows that the South African youth has a positive enterprising tendency.
The ‘General Enterprising Tendency Questionnaire’, completed by 530 grade 12
learners was evaluated and learners scored within the average score, although at the
lower end of the suggested average. When the questionnaire’s constructs are
evaluated, learners scored below the suggested average score on ‘need for
achievement’, ‘need for autonomy’, ‘creative tendency’ and ‘moderate/calculated
risks’, but above the suggested average for ‘drive and determination’, but it can be
conclude that learners shows a tendency to be entrepreneurial.
However, the study suggests that grade 12 learners in the Lejweleputswa sample
have overrated expectations on the ‘drive and determination construct’. It appears
that they do not have the propensity to be creative and have a low drive to be
autonomous. The study also reveals that there are no practical significant differences
between the mean values for the demographic variables school, age, gender, home
language and ethnic group regarding the measured constructs.

ii
Major shortfalls in the current education system are highlighted, including teachers
with no previous knowledge of commercial subjects that are forced to teach
entrepreneurship, most schools do not implement Economic and Management
Science (EMS) as learning area and as from 2013, EMS will only be introduced to the
curriculum in the Senior phase (grade 7 to 9). In addition, learners are not motivated
to be creators of jobs, but to rather seek employment.
The study concludes that public schools in South Africa do not have the capacity to
implement a successful program of youth entrepreneurship education. The
involvement of Government, Department of Education, schools, teachers, parents,
learners, entrepreneurs and organised business is needed to promote youth
entrepreneurship in South Africa. The study expands on recommendations and
presents a national strategy to enhance youth entrepreneurship in South African
schools, but concludes that future research is needed.
Keywords: Entrepreneurship, Entrepreneurship education, Entrepreneurship
development, Youth, Unemployment.

iii
ACKNOWLEDGEMENTS
To my LORD GOD and SAVIOUR, who gave me the will, ability and
determination to bring this work to reality.
To my parents, Koos and Biebie Barnard. Thank you for all the sacrifices you
made to give me the opportunity to achieve my goals.
To Prof Stephan van der Merwe, my study leader, thank you for all the advice,
guidance and professional manner you handled this task.
To Marlene, thank you for your friendship, support and hospitality.
To my friends, Anneli, Lecia and Marlette, who were there for me, supported
me and believed in me.
To all the lecturers of the Potchefstroom Business School of the North-West
University, thank you for all the valuable tuition, knowledge and
professionalism throughout the three years.
To my group “In Vino Veritas”: Danie, Elsabé and Schalk. Thank you for the
teamwork, trust and support throughout the three years.
To Christine Bronkhorst at the Ferdinand Postma Library (North-West
University, Potchefstroom campus) for assistance with the research.
To the Secondary schools and grade 12 learners in the Lejweleputswa District
for their participation in the empirical study.

iv
TABLE OF CONTENTS
ABSTRACT ................................................................................................................. i
ACKNOWLEDGEMENTS ......................................................................................... iii
TABLE OF CONTENTS ............................................................................................ iv
LIST OF TABLES ...................................................................................................... xi
LIST OF FIGURES ................................................................................................... xii
CHAPTER 1: NATURE AND SCOPE OF THE STUDY
1.1 INTRODUCTION ........................................................................................ 1
1.2 DEFINING MAJOR CONCEPTS ............................................................... 2
1.2.1 Entrepreneurship ........................................................................................ 2
1.2.2 Youth .......................................................................................................... 3
1.2.3 Entrepreneurship education ........................................................................ 3
1.3 BACKGROUND TO THE STUDY .............................................................. 3
1.4 PROBLEM STATEMENT .......................................................................... 4
1.5 RESEARCH OBJECTIVES........................................................................ 5
1.5.1 Primary objective ........................................................................................ 5
1.5.2 Secondary objectives ................................................................................. 5
1.6 SCOPE OF THE STUDY ........................................................................... 6
1.6.1 Field of the study ........................................................................................ 6
1.6.2 Geographical demarcation .......................................................................... 6
1.7 RESEARCH METHODOLOGY .................................................................. 7
1.7.1 Literature study ........................................................................................... 7
1.7.2 Empirical study ........................................................................................... 8
1.7.2.1 Questionnaire ............................................................................................. 8
1.7.2.2 Study population and sampling method ...................................................... 8
1.7.2.3 Data collection ............................................................................................ 8
v
1.7.2.4 Data analysis .............................................................................................. 9
1.8 LIMITATIONS OF THE STUDY ................................................................. 9
1.9 LAYOUT OF THE STUDY ....................................................................... 10
CHAPTER 2: THE NATURE OF ENTREPRENEURSHIP
2.1 INTRODUCTION ...................................................................................... 13
2.2 OVERVIEW OF ENTREPRENEURSHIP ................................................. 14
2.2.1 Introduction ............................................................................................... 14
2.2.2 Historical views on entrepreneurship ........................................................ 14
2.3 ENTREPRENEURSHIP DEFINED ........................................................... 16
2.4 THE ENTREPRENEUR ........................................................................... 17
2.4.1 Introduction ............................................................................................... 17
2.4.2 Why becoming an entrepreneur? ............................................................. 18
2.4.3 Entrepreneurial attributes and behaviours ................................................ 19
2.4.3.1 Need for self-achievement ........................................................................ 19
2.4.3.2 Creativity, initiative and innovation ........................................................... 20
2.4.3.3 Propensity for risk-taking .......................................................................... 20
2.4.3.4 Self-confidence ......................................................................................... 21
2.4.3.5 Locus of control ........................................................................................ 21
2.4.3.6 Desire for independence and autonomy ................................................... 21
2.4.3.7 Motivation, energy and commitment ......................................................... 22
2.4.3.9 Tolerance for ambiguity ............................................................................ 22
2.5 BENEFITS OF ENTREPRENEURSHIP ................................................... 23
2.6 CURRENT STATE OF ENTREPRENEURSHIP IN SOUTH AFRICA ...... 25
2.7 ENTREPRENEURSHIP EDUCATION DEFINED .................................... 28
2.8 ORIGIN OF ENTREPRENEURSHIP EDUCATION ................................. 28
2.9 ENTREPRENEURSHIP EDUCATION IN SOUTH AFRICA .................... 30
2.10 SUCCESSFUL ENTREPRENEURSHIP EDUCATION ............................ 34

vi
2.11 ENTREPRENEURSHIP INTENSION/TENDENCIES ............................... 36
2.12 THE GENERAL ENTERPRISING TENDENCY (GET) TEST .................. 37
2.12.1 Need for achievement (12 items) ............................................................ 38
2.12.2 Need for autonomy (6 items) .................................................................. 40
2.12.3 Creative tendency (12 items) .................................................................. 40
2.12.4 Risk-taking (12 items) ............................................................................. 41
2.12.5 Drive and determination (12 items) ......................................................... 42
2.13 SUMMARY ............................................................................................... 43
CHAPTER 3: THE NATURE OF YOUTH UNEMPLOYMENT
3.1 INTRODUCTION ...................................................................................... 47
3.2 DEFINITION OF CONCEPTS .................................................................. 48
3.2.1 Youth ........................................................................................................ 48
3.2.2 Unemployment ......................................................................................... 48
3.3 UNEMPLOYMENT OVERVIEW ............................................................... 48
3.3.1 Unemployment worldwide ......................................................................... 49
3.3.2 Unemployment in South Africa ................................................................. 49
3.4 WHO ARE UNEMPLOYED IN SOUTH AFRICA? ................................... 51
3.4.1 Province .................................................................................................... 51
3.4.2 Gender...................................................................................................... 52
3.4.3 Population group ...................................................................................... 52
3.4.4 Education levels ....................................................................................... 53
3.4.5 Age group ................................................................................................. 54
3.5 REASONS FOR UNEMPLOYMENT ........................................................ 55
3.5.1 Weak economic growth rate ..................................................................... 55
3.5.2 High population growth rate ...................................................................... 57
3.5.3 Change in participation rate of women, legal and illegal migrants ............ 58
3.5.4 Role of the unions and labour market legislation ...................................... 58

vii
3.5.5 Minimum wages and labour standards ..................................................... 59
3.5.6 Education system ..................................................................................... 59
3.5.7 Structural changes .................................................................................... 60
3.6 OVERVIEW OF YOUTH UNEMPLOYMENT ........................................... 61
3.6.1 Youth unemployment worldwide ............................................................... 61
3.6.2 Youth unemployment in South Africa ....................................................... 62
3.7 REASONS FOR YOUTH UNEMPLOYMENT .......................................... 62
3.7.1 Youth poverty ........................................................................................... 62
3.7.2 School dropout rate .................................................................................. 63
3.7.3 Resource constraints ................................................................................ 64
3.7.4 Struggle to gain work experience ............................................................. 64
3.7.5 Sectoral minimum wage ........................................................................... 64
3.8 EFFECT OF UNEMPLOYMENT .............................................................. 65
3.8.1 Physical and psychological effect ............................................................. 65
3.8.2 Economic perspective............................................................................... 65
3.8.3 Scarring effects ......................................................................................... 66
3.8.4 Social problems ........................................................................................ 66
3.9 YOUTH DEVELOPMENT, POLICIES AND SUPPORT STRUCTURES . 66
3.9.1 Formal education ...................................................................................... 67
3.9.1.1 Schooling system ..................................................................................... 67
3.9.1.2 Vocational training .................................................................................... 68
3.9.1.3 Higher education ...................................................................................... 68
3.9.2 Public employment and development programmes .................................. 69
3.9.2.1 Expanded public works programme ......................................................... 69
3.9.2.2 Community Works Programmes ............................................................... 70
3.9.2.3 Youth Economic Participation programme................................................ 71
3.9.2.4 Learnerships ............................................................................................. 71
3.9.2.5 National Rural Youth Service Corps programme ...................................... 71
viii
3.9.3 Services available to the youth ................................................................. 72
3.9.3.1 National Youth Service ............................................................................. 72
3.9.3.2 National Youth Development Agency ....................................................... 72
3.9.4 Entrepreneurship interventions ................................................................. 73
3.10 PRIVATE SECTOR INITIATIVES ............................................................ 74
3.10.1 South African Graduates Development Association ................................. 74
3.10.2 Youth Entrepreneurship Program ............................................................. 74
3.10.3 Junior Achievement SA............................................................................. 74
3.10.4 Entrepreneurship competitions ................................................................. 75
3.11 SUMMARY ............................................................................................... 76
CHAPTER 4: GATHERING OF DATA, RESULTS AND DISCUSSION
4.1 INTRODUCTION ...................................................................................... 78
4.2 GATHERING OF DATA ........................................................................... 79
4.2.1 The ‘General Enterprising Tendency’ questionnaire ................................. 79
4.2.2 Method of data gathering .......................................................................... 79
4.2.3 Sample size .............................................................................................. 79
4.2.4 Statistical analysis of data ........................................................................ 79
4.3 RESULTS OF THE DEMOGRAFIC PROFILE......................................... 80
4.3.1 School distribution of respondents ............................................................ 80
4.3.2 Age distribution of respondents ................................................................ 81
4.3.3 Gender distribution of respondents ........................................................... 82
4.3.4 Home language distribution of respondents ............................................. 83
4.3.5 Ethnic group distribution of respondents................................................... 84
4.4 RESULTS OF THE GET TEST ................................................................ 84
4.4.1 Need for achievement............................................................................... 85
4.4.2 Need for autonomy/independence ............................................................ 86
4.4.3 Creative tendency ..................................................................................... 87

ix
4.4.4 Moderate/calculated risk taking ................................................................ 89
4.4.5 Drive and determination............................................................................ 91
4.5 GET TEST CONSTRUCT ANALYSIS ACCORDING TO DEMOGRAPHIC
PROFILE ................................................................................................................. 92
4.5.1 Total GET test scores ............................................................................... 92
4.5.2 School distribution .................................................................................... 93
4.5.3 Age distribution ......................................................................................... 96
4.5.4 Gender distribution ................................................................................... 97
4.5.5 Home language distribution ...................................................................... 98
4.5.6 Ethnic group distribution ........................................................................... 99
4.6 SUMMARY ............................................................................................. 100
CHAPTER 5: CONCLUSIONS AND RECOMMENDATIONS
5.1 INTRODUCTION .................................................................................... 101
5.2 GAP-ANALYSIS .................................................................................... 101
5.2.1 Current state ........................................................................................... 101
5.2.2 Desired state .......................................................................................... 102
5.3 CONCLUSIONS ON THE LITERATURE STUDY .................................. 102
5.4 CONCLUSIONS ON THE EMPERICAL STUDY ................................... 104
5.4.1 Demographical information results ......................................................... 104
5.4.2 Conclusions on the GET test results ...................................................... 104
5.4.2.1 Total on the GET test ............................................................................. 104
5.4.2.2 Need for achievement............................................................................. 104
5.4.2.3 Need for autonomy ................................................................................. 105
5.4.2.4 Creative tendency ................................................................................... 105
5.4.2.5 Moderate/calculated risk-taking .............................................................. 105
5.4.2.6 Drive and determination.......................................................................... 106
5.4.3 General conclusions on the GET test results .......................................... 106
x
5.4.4 General conclusions on the empirical results ......................................... 108
5.5 RECOMMENDATIONS .......................................................................... 108
5.5.1 Government ............................................................................................ 109
5.5.2 The Department of Education (DoE) ...................................................... 109
5.5.3 Schools ................................................................................................... 110
5.5.4 Teachers ................................................................................................. 111
5.5.5 Parents and guardians............................................................................ 112
5.5.6 Learners ................................................................................................. 113
5.5.7 Entrepreneurs and organised business .................................................. 114
5.6 AN ENHANCED ENTREPRENEURSHIP EDUCATION STRATEGY AT
SCHOOL LEVEL IN SOUTH AFRICA ................................................................... 114
5.6.1 National level .......................................................................................... 115
5.6.2 Provincial level ........................................................................................ 115
5.6.3 Local level ............................................................................................... 116
5.6.4 Right attitude and mind-set ..................................................................... 118
5.7 CRITICAL EVALUATION OF THE STUDY ........................................... 118
5.7.1 Primary objective re-visited ..................................................................... 118
5.7.2 Secondary objectives re-visited .............................................................. 118
5.8 SUGGESTIONS FOR FURTHER RESEARCH ..................................... 120
5.9 SUMMARY ............................................................................................. 121
BIBLIOGRAPHY .................................................................................................... 122
APPENDIX A: Invitation letter to participate in the study ................................ 147
APPENDIX B: General Enterprising Tendency (GET) Test .............................. 149
APPENDIX C: Demographical information ........................................................ 159

xi
LIST OF TABLES
Table 2.1: Summary of knowledge and skills required in GET phase ....................... 32
Table 2.2: Main topics in the EMS Curriculum Grade 7 to 9 ..................................... 34
Table 4.1: School distribution of respondents ........................................................... 80
Table 4.2: Age distribution of respondents ............................................................... 81
Table 4.3: Gender distribution of respondents .......................................................... 82
Table 4.4: Home language distribution of respondents............................................. 83
Table 4.5: Ethnic group distribution of respondents .................................................. 84
Table 4.6: Results of the Need for achievement construct ....................................... 85
Table 4.7: Results of the Need for autonomy construct ............................................ 87
Table 4.8: Results of the Creative tendency construct.............................................. 88
Table 4.9: Results of the Risk-taking construct ......................................................... 90
Table 4.10: Results of the Drive and determination construct .................................. 91
Table 4.11: Respondents’ actual scores on GET test ............................................... 93
Table 4.12: GET test scores according to participants’ schools distribution ............. 93
Table 4.13: GET scores according to participants' age distribution .......................... 96
Table 4.14: GET scores according to participants' gender distribution ..................... 98
Table 4.15: GET scores according to participants' home language distribution........ 98
Table 4.16: GET scores according to participants' ethnic group distribution ............ 99
xii
LIST OF FIGURES
Figure 1.1: Geographical map of Lejweleputswa ........................................................ 6
Figure 1.2: Research process flow chart .................................................................. 10
Figure 3.1: Total unemployment in South Africa from 2008 to 2012 ......................... 50
Figure 3.2: Unemployment rate by province ............................................................. 51
Figure 3.3: Unemployment rate by sex ..................................................................... 52
Figure 3.4: Unemployment rate by population group ................................................ 53
Figure 3.5: Unemployment rate by education level ................................................... 53
Figure 3.6: Year-on-year change in employment from 2008 to 2012 ........................ 56
Figure 3.7: South Africa GDP growth rate from 2008 to 2012 .................................. 56
Figure 3.8: South Africa population pyramid (June 2011) ......................................... 57
Figure 3.9: Absorption rate according to training level from 2008 to 2011 ................ 63
Figure 5.1: Stakeholder involvement hierarchy ....................................................... 115

1
CHAPTER 1
NATURE AND SCOPE OF THE STUDY
1.1 INTRODUCTION
“Youth are not lost – they are pushed” Anonymous
Since the democratic election in 1994, the South African society made positive
progress, but still faces many challenges like large-scale poverty, high levels of
inequality and unemployment (McGrath & Akoojee, 2012:422; Muofhe & Du Toit,
2011:1; Faulkner & Loewald, 2008:5). Unemployment is perceived to be directly
responsible for the high levels of socio-economic problems such as crime, violence
and poverty (Beeka & Rimmington, 2011:146; Barker, 2003:3). Continued failure to
create employment at the scale required is likely to heighten social tension (Philip,
2012:180).
South Africa’s unemployment rate is currently 24.9% (Stats SA, 2012) and according
to a survey of The Organisation for Economic Cooperation and Development
(OECD), South Africa had the worst rate of unemployment for youth between the age
of 15 and 24 among 36 countries in 2008 (Smith, 2011:4). South Africa’s high youth
unemployment rate are partly due to the fact of the 10.1 million individuals in the 15
to 24 age cohort, 32.7% (3.3 million youth) are neither employed nor attending an
educational institution (Stats SA, 2011; Paton, 2010:32). Most have dropped out of
school and only 28% of them have a matric certificate (Paton, 2010:32).
To significantly reduce the country's high unemployment rate an economic growth
rate of 6% to 7% is required (Business Unity South Africa, 2011; Altman & Marock,
2008:6). The South African economy grew by an estimated 3.1% in 2011 and is
expected to slow to 2.7% in 2012 before accelerating to 3.6% in 2013 (National
Treasury, 2011:13, Gordhan, 2012:6). South Africa’s current economic climate
therefore does not favour employment and when jobs are scarce young people are
more likely to be unemployed because of their lack of appropriate skills, work related
capabilities and experience (De Lange, Gesthuizen & Wolbers, 2012:530; McGrath &
Akoojee, 2012:423; Altman & Marock, 2008:11).

2
Entrepreneurship is considered to be an important mechanism for economic
development through job creation and innovation (Luiz & Mariotti, 2011:47; Mahadea,
Ramroop & Zewotir, 2011:68; Nieuwenhuizen & Groenewald, 2008:128; Khawar,
2008:3; Burger, Mahadea & O’Neill, 2004:187). The development of entrepreneurial
skills and knowledge is a priority for governments that want to encourage an
innovative and enterprising society (Muofhe & Du Toit, 2011:2). The development of
an entrepreneurial spirit among the youth is thus vital to alleviate poverty and to
address the socio-economic problems facing South Africa (Mahadea et al., 2011:67).
Hence, this study is aimed at assessing entrepreneurial tendencies and perceptions
of entrepreneurship as a career option of grade 12 school learners in the
Lejweleputswa District (Free State province).
Entrepreneurship, youth and entrepreneurship education as major concepts will be
defined followed by the background to the study, the problem statement, research
objectives, scope of the study and research methodology. This chapter concludes
with the limitations and layout of the study.
1.2 DEFINING MAJOR CONCEPTS
1.2.1 Entrepreneurship
Gibb (2007:3) defined entrepreneurship as “… behaviours, skills and attributes
applied individually and/or collectively to help individuals and organisations of all
kinds to create, cope with and enjoy change and innovation involving higher levels of
uncertainty and complexity as a means of achieving personal fulfilment.”
According to Timmons and Spinelli (2009:47), the term entrepreneurship is used to
denote a way of thinking, reasoning and acting that is opportunity oriented. It is much
more than starting a new business. It is the process whereby individuals become
aware of the self-employment career option, develop ideas, take and manage risks,
learn the process and take the initiative in developing and owning a business
(International Labour Organisation, 2005). Other definitions of entrepreneurship are
reviewed in chapter 2.
3
1.2.2 Youth
The United Nations (UN) defines youth as “young people from 15 to 24 years of age”,
however the South Africa National Youth Commission Act of 1996 and the National
Youth Policy of 2009 to 2014 (NYP, 2009:12) defined youth as people between the
age of 15 and 34.
1.2.3 Entrepreneurship education
Entrepreneurship education can be defined as the purposeful intervention by an
educator in the life of the learner to impart entrepreneurial qualities and skills to
enable the learner to survive in the world of business (Isaacs, Visser, Friedrich &
Brijlal, 2007:614).
1.3 BACKGROUND TO THE STUDY
South Africa’s current situation of unemployment, poverty and the insufficient
absorption rate of scholars into the South African labour market necessitate this
study. Research on entrepreneurial attitudes of school learners and the formulation of
recommendations to improve the youth’s employability and inclination towards self-
employment will contribute towards the existing pool of knowledge.
Similar studies was conducted by Burger et al. (2004) and Burger, Mahadea and
O’Neill (2005) in the Stellenbosch area of the Western Cape province that focused on
grade 12 learners perceptions of entrepreneurship as a career option, as well as the
impact of previous knowledge and experience on the entrepreneurial attitudes of
grade 12 learners. Mahadea et al. (2011) also assessed entrepreneurship
perceptions of High School learners in Pietermaritzburg, KwaZulu-Natal.
Steenekamp (2009), Steenekamp, Van der Merwe and Athayde (2011a, 2011b)
examined the entrepreneurial attitudes of grade 10 learners in the Sedibeng District
of the Gauteng province. This study aims to build on the outcomes of these studies.
4
1.4 PROBLEM STATEMENT
South Africa has a large youth population (Smith, 2011:1; Altman & Marock, 2008:11;
Horn, 2006:115) that can actively contribute to the economy, however South Africa’s
current economic climate does not favour employment and when jobs are scarce
young people are more likely to be unemployed because of their lack of appropriate
skills, work related capabilities and experience (De Lange et al., 2012:530; McGrath
& Akoojee, 2012:423; Altman & Marock, 2008:12).
Herrington, Kew and Kew (2010:15) indicated that a culture of entrepreneurship can
unleash the economic potential of all South Africans, particular the youth. For young
South African’s to be accommodated in the economy they will have to be trained and
educated in the field of entrepreneurship. Young people need to be able to think of
self-employment as a route to self-empowerment rather than seeking wage
employment (Mahadea et al., 2011:67; Nieuwenhuizen & Groenewald, 2008:128).
Unfortunately it appears that starting a small business or becoming an entrepreneur
is not a career choice among South Africans, especially Black South Africans
(Herrington et al., 2010:15; Altman & Marock, 2008:14; Du Toit, 2003:4).
According to a report of the Umsobomvu Youth Fund (2010), the Free State province
shows the highest rate of youth unemployment for 15 to 24 year olds. This study is
aimed at assessing the entrepreneurial intentions of grade 12 school learners in the
Lejweleputswa District in the Free State province. The following research questions
can be asked:
What are the youth’s entrepreneurial tendencies to pursue entrepreneurship
as a career option?
What are their prospects of becoming self-employed business owners and job
creators?
Why don’t more young people consider entrepreneurship as a career option?
Are the South African government and the private sector doing enough to
promote youth entrepreneurship?
5
It is important to address this issue because South Africa needs more youth
entrepreneurs to provide a long-term route out of poverty for many unemployed
young people. The result of the survey can be beneficial in solving other concerns
about youth unemployment and entrepreneurship education.
1.5 RESEARCH OBJECTIVES
The purpose of this study is defined under a primary objective and secondary
objectives.
1.5.1 Primary objective
The primary objective of this study is to assess the entrepreneurial intentions of
grade 12 school learners in the Lejweleputswa District (Free State province)
registered with the Department of Education (DoE) and to make recommendations
for enhanced entrepreneurial learning for school learners in South Africa.
1.5.2 Secondary objectives
The secondary objectives in support of the main objective of this research are:
To define entrepreneurship.
To examine the entrepreneur and benefits of entrepreneurship.
To examine the current state of entrepreneurship and entrepreneurship
education in South Africa to highlight shortfalls.
To examine successful entrepreneurship education programmes for the
compilation of recommendations.
To examine entrepreneurship tendencies and how to measure it with an
appropriate measure instrument.
To examine unemployment in South Africa, especially youth unemployment,
reasons for youth unemployment and current youth development initiatives.
To measure the current entrepreneurial tendencies of grade 12 school
learners in the Lejweleputswa District with the use of a questionnaire.
6
To compare the enterprising tendencies of the respondents according to their
demographic profile.
To make practical recommendations to enhance entrepreneurship education
at school level in South Africa.
1.6 SCOPE OF THE STUDY
The scope of this study is limited in both the field of study and the geographical
demarcation.
1.6.1 Field of the study
The field of research is limited to entrepreneurship and in particular, entrepreneurial
intentions of grade 12 learners in 2012.
1.6.2 Geographical demarcation
The study is limited to the Lejweleputswa District of the Free State province, South
Africa. Lejweleputswa is situated in the north western region of the Free State.
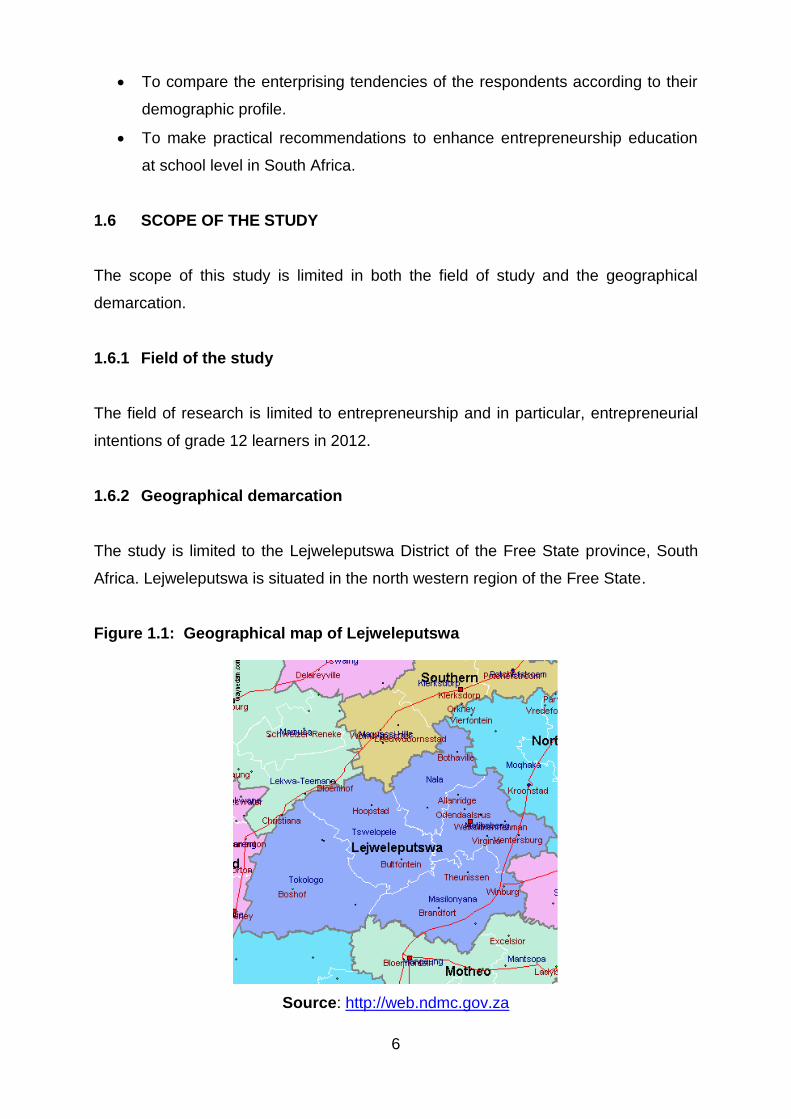
Figure 1.1: Geographical map of Lejweleputswa
Source: http://web.ndmc.gov.za
7
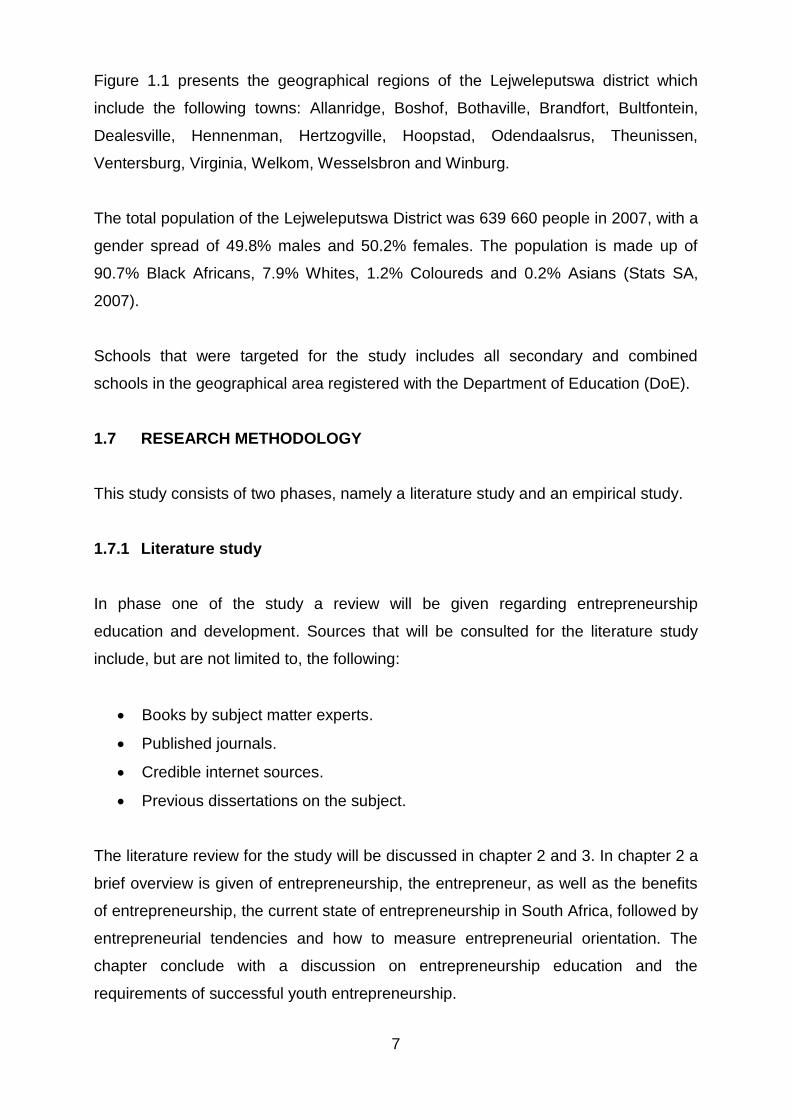
Figure 1.1 presents the geographical regions of the Lejweleputswa district which
include the following towns: Allanridge, Boshof, Bothaville, Brandfort, Bultfontein,
Dealesville, Hennenman, Hertzogville, Hoopstad, Odendaalsrus, Theunissen,
Ventersburg, Virginia, Welkom, Wesselsbron and Winburg.
The total population of the Lejweleputswa District was 639 660 people in 2007, with a
gender spread of 49.8% males and 50.2% females. The population is made up of
90.7% Black Africans, 7.9% Whites, 1.2% Coloureds and 0.2% Asians (Stats SA,
2007).
Schools that were targeted for the study includes all secondary and combined
schools in the geographical area registered with the Department of Education (DoE).
1.7 RESEARCH METHODOLOGY
This study consists of two phases, namely a literature study and an empirical study.
1.7.1 Literature study
In phase one of the study a review will be given regarding entrepreneurship
education and development. Sources that will be consulted for the literature study
include, but are not limited to, the following:
Books by subject matter experts.
Published journals.
Credible internet sources.
Previous dissertations on the subject.
The literature review for the study will be discussed in chapter 2 and 3. In chapter 2 a
brief overview is given of entrepreneurship, the entrepreneur, as well as the benefits
of entrepreneurship, the current state of entrepreneurship in South Africa, followed by
entrepreneurial tendencies and how to measure entrepreneurial orientation. The
chapter conclude with a discussion on entrepreneurship education and the
requirements of successful youth entrepreneurship.
8
In chapter 3 an overview of youth unemployment in South Africa is given, starting
with the definition of youth, unemployment and structural unemployment, the current
state of unemployment in South Africa and youth unemployment, followed by
possible reasons for youth unemployment. The chapter ends with initiatives that the
South African government and the private sector have taken to address and promote
youth entrepreneurship.
1.7.2 Empirical study
The empirical study consists of the research design, the questionnaire used in this
study, the study population, gathering of the data and statistical analysis.
1.7.2.1 Questionnaire
An empirical study will be done by means of the ‘General Enterprising Tendency
Test’ (GET test) developed by Caird (1991). The GET test is an assessment tool
used to evaluate the enterprising tendency of prospective or existing entrepreneurs.
1.7.2.2 Study population and sampling method
The study population is limited to the 2012 intake of grade 12 learners in all
secondary and combined schools in the Lejweleputswa District of the Free State
province, registered with the Department of Education (DoE). The entire population
was targeted due to the expectation of a poor response rate. A total of 66 secondary
and combined schools with approximately 5022 grade 12 learners were identified in
the research area (Free State Department of Education, 2012).
An invitation to participate in the study was sent to the Principal of schools. The
invitation made provision for the schools’ details, the appointment of a responsible
person, an option whether or not to participate in the study and the expected number
of grade 12 learners for 2012 (see Appendix A). The response rate however was
weak and appointments were made by telephone with the schools.
1.7.2.3 Data collection
The gathering of the data was initiated by a telephonic discussion with each of the
responsible teachers whereby the purpose of the study was explained and an

9
appointment was made to visit the schools’ grade 12 learners to complete the
questionnaire.
1.7.2.4 Data analysis
The statistical analysis of the data was carried out by the Statistical Consultation
Services of the North-West University, Potchefstroom Campus. Descriptive statistics
were used to examine the composition and characteristics of the sample.
1.8 LIMITATIONS OF THE STUDY
The limitations of the study are the following:
The study will only focus on learners in a specific geographical area and
findings of the study can therefore not be considered to be representative of all
learners in South Africa nor of all learners in the Lejweleputswa District.
The sample size maybe influence by the lack of response from participating
schools and it can be argued that the study is limited to a particular group of
learners in the demarcated area.
The schools were contacted to determine whether they were willing to
participate in the survey. Those that were not willing to participate were then
not considered which limits the study to selected schools and participants only.
It is only deemed to assess enterprising tendencies of grade 12 learners.
The questionnaire only addressed selected determinants as compiled by the
author.
Respondents might treat the survey simply as another exercise, thus not
completing the survey honestly; therefore, negatively impacting the research.
Respondents may interpret questions in different contexts as initially intended.
Any recommendations made as a result of the findings were very subjective to
the population group and geographical area sampled, being very small so
therefore the results cannot be seen in the general context for the rest of the
grade 12 learners in South Africa, but can be used as a basis for further
research and studies on enterprising intentions.
10
The lack of valid data on the enterprising tendencies of the South African
youth made it impossible to reach a conclusion as to whether the youth are
more or less inclined to entrepreneurial behaviour than in the past.
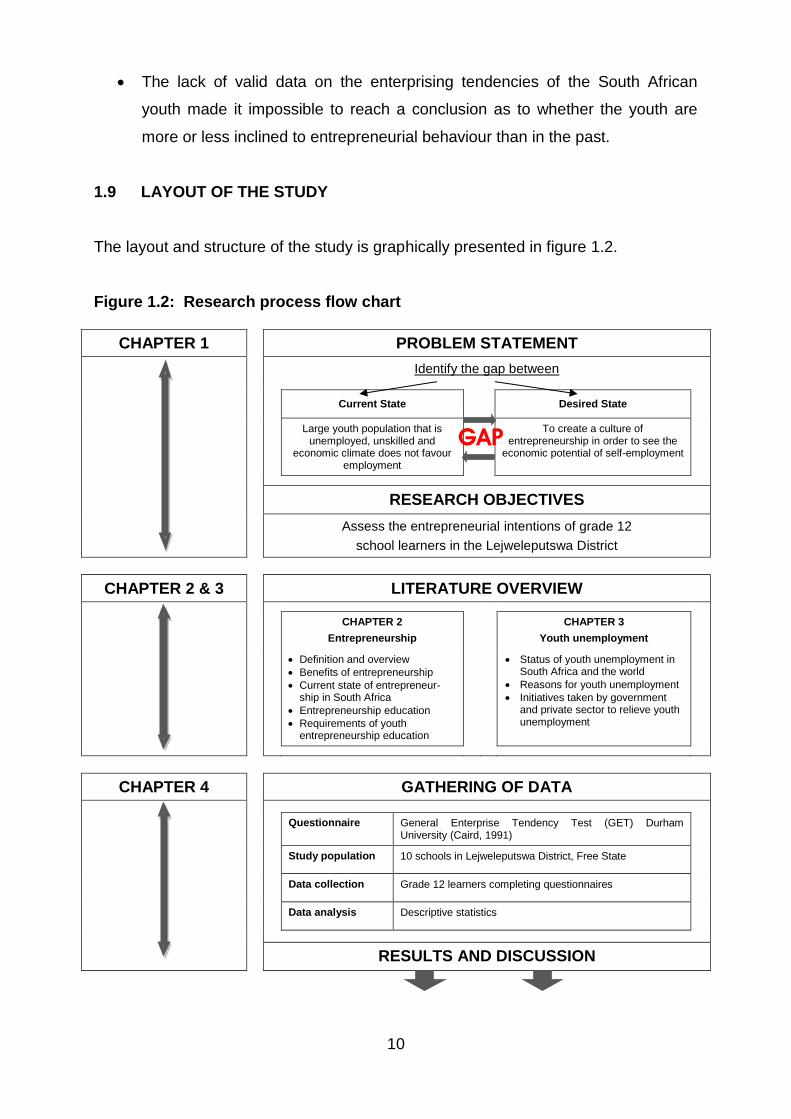
1.9 LAYOUT OF THE STUDY
The layout and structure of the study is graphically presented in figure 1.2.
Figure 1.2: Research process flow chart
CHAPTER 1 PROBLEM STATEMENT
Identify the gap between
Current State Desired State
Large youth population that is unemployed, unskilled and
economic climate does not favour employment
To create a culture of entrepreneurship in order to see the
economic potential of self-employment
RESEARCH OBJECTIVES
Assess the entrepreneurial intentions of grade 12
school learners in the Lejweleputswa District
CHAPTER 2 & 3 LITERATURE OVERVIEW
CHAPTER 2
Entrepreneurship
CHAPTER 3
Youth unemployment
Definition and overview
Benefits of entrepreneurship
Current state of entrepreneur-ship in South Africa
Entrepreneurship education
Requirements of youth entrepreneurship education
Status of youth unemployment in South Africa and the world
Reasons for youth unemployment
Initiatives taken by government and private sector to relieve youth unemployment
CHAPTER 4 GATHERING OF DATA
Questionnaire General Enterprise Tendency Test (GET) Durham University (Caird, 1991)
Study population 10 schools in Lejweleputswa District, Free State
Data collection Grade 12 learners completing questionnaires
Data analysis Descriptive statistics
RESULTS AND DISCUSSION
GAP

11
CHAPTER 5 CONCLUSIONS AND RECOMMENDATIONS
South Africa lacks entrepreneurs and people with an entrepreneurial orientation and skills to create businesses.
A positive attitude toward entrepreneurial behaviour will motivate learners towards owning and managing their own businesses.
The South African school system fails to educate the youth to think and act entrepreneurial.
A new cooperative approach involving all stakeholders with the right attitude and mind-set is needed, to enhance entrepreneurial learning at school level in South Africa.
Chapter 1 has defined the nature and scope of this study. The remaining chapters
are presented in the following layout:
Chapter 2 – Overview of entrepreneurship
This chapter examines entrepreneurship to provide a theoretical base and
understanding for the construct of entrepreneurship and entrepreneurship education.
A brief overview is given of entrepreneurship, the entrepreneur, as well as the
benefits of entrepreneurship, the current state of entrepreneurship in South Africa,
followed by entrepreneurial tendencies and how to measure entrepreneurial
orientation. The chapter conclude with a discussion on entrepreneurship education
and the requirements of successful youth entrepreneurship.
Chapter 3 – Unemployment
The aim of this chapter is to provide an overview of youth unemployment in South
Africa starting with the definition of youth, unemployment and structural
unemployment. A brief overview of the current state of unemployment in South Africa
and youth unemployment are discussed, followed by possible reasons for youth
unemployment. The chapter ends with initiatives that the South African government
and the private sector have taken to address and promote youth entrepreneurship.
Chapter 4 – Gathering of data, results and discussion
This chapter contains an explanation of the research methodology that was followed
to complete the empirical study. The data gathering process, statistical methods
used to analysis the data and the interpretation of the results are discussed. The

12
main purpose of this chapter is to identify the current entrepreneurial perceptions of
learners in the demographic area.
Chapter 5 – Conclusion and recommendations
In the final chapter the gap between the desired and the current state of
entrepreneurial learning in the Lejweleputswa District are examined through a gap-
analysis. Conclusions are reached from the literature study, the demographical
information and empirical study and based on the findings of the empirical study
practical recommendations are made to enhance entrepreneurial learning for school
learners in South Africa. The chapter concludes with a critical evaluation of the study
in terms of achieving the primary and secondary objectives followed by suggestions
for further research.

13
CHAPTER 2
THE NATURE OF ENTREPRENEURSHIP
2.1 INTRODUCTION
Entrepreneurship and innovation are widely seen as key sources of renewed
economic growth, creating jobs and advancing human welfare (Luiz & Mariotti,
2011:47; Mahadea et al., 2011:68; Nieuwenhuizen & Groenewald, 2008:128;
Khawar, 2008:3; Burger et al., 2004:187). Without an entrepreneurial attitude
societies can stagnate, which can hinder the long-term growth and prosperity of a
region (Organisjana & Matlay, 2012:207; Sowmya, Majumdar & Gallant, 2010:628;
Mueller & Thomas, 2000:52).
South Africa’s greatest limitation to economic development and growth is its lack of
entrepreneurs (Fatoki & Patswawairi, 2012:133; Luiz & Mariotti, 2011:47; Isaacs et
al., 2007:613). Although the South African government has implemented various
strategies to create an environment that encourage entrepreneurs and small
businesses, the ratio of entrepreneurs to other workers in South Africa is
approximately 1:52. In most developed countries the ratio is approximately 1:10
(Isaacs et al., 2007:613). It is therefore evident that there are not enough people in
South Africa who have the orientation and skills to create new businesses (Horn,
2006:120; Kroon & Meyer, 2001:47).
Herrington et al. (2010:15) indicated that a culture of entrepreneurship can unleash
the economic potential of all South Africans, particular the youth. The school, apart
from the home, are regarded as the place where the most profound impact can be
brought about in the development of the youth (Isaacs et al., 2007:613). There is an
assumption that entrepreneurship characteristics and skills can be developed through
transferring of knowledge and skills development to improve the self-efficacy and
effectiveness of potential entrepreneurs (Gorman, Hanlon & King, 1997:63).
Given South Africa’s high poverty and unemployment rates, skewed income
distribution (as discussed in chapter 3) and potential high contribution that effective

14
entrepreneurship can make towards employment and economic growth, it is vital to
determine how entrepreneurship can be effectively encouraged.
Hence this chapter examines entrepreneurship to provide a theoretical base and
understanding for the construct of entrepreneurship and entrepreneurship education.
A brief overview is given of entrepreneurship, the entrepreneur, as well as the
benefits of entrepreneurship and the current state of entrepreneurship in South
Africa, followed by entrepreneurial tendencies and how to measure entrepreneurial
orientation. The chapter conclude with a discussion on entrepreneurship education
and the requirements of successful youth entrepreneurship.
2.2 OVERVIEW OF ENTREPRENEURSHIP
2.2.1 Introduction
Entrepreneurship is regarded as one of the best economic development strategies to
develop a country’s economic growth and sustain the country’s competitiveness in
facing the increasing trends of globalisation (Beeka & Rimmington, 2011:147; Keat,
Selvarajah & Meyer, 2011:206; Mahadea et al., 2011:68; Gerry, Marques &
Nogueira, 2008:45; Nieuwenhuizen & Groenewald, 2008:128). Given the importance
of entrepreneurship in economic practice today, the question readily arises: what is
entrepreneurship’s role in economic theory and how did it develop?
2.2.2 Historical views on entrepreneurship
The term entrepreneurship stems from a French verb entreprendre and the German
unternehmen, both of which mean ‘to undertake or to embark on’ (Anderson, 2002:2).
Richard Cantillon, a pre-classical economist, introduced the term entrepreneur and
was the first to acknowledge an entrepreneurial function within the economy (Van
Praag, 1999:313). Cantillon recognised three classes of economic agents:
landowners, entrepreneurs and employees with the entrepreneur as the central
economic actor (Van Praag, 1999:313; Wennekers & Thurik, 1999:31). Cantillon
focused on the function of the entrepreneur and viewed the entrepreneur as a risk

15
taker (Arthur & Hisrich, 2011:3) who exercises business engagements in the face of
uncertainty (Hebert & Link, 1989:42). The entrepreneur therefore has a central role in
the economic system because “he is responsible for all the exchange and circulation
in the economy” (Van Praag, 1999:313).
The taxonomy of entrepreneurial theories can be condensed into three major
intellectual traditions, each tracing its origin to Richard Cantillon (Wennekers &
Thurik, 1999:31). The first is the German tradition of Von Thünen, Schumpeter and
Baumol, secondly the neo-classical tradition of Marchall, Knight and Schultz and
thirdly the Austrian tradition of Menger, Von Mises and Kirzner. Wennekers and
Thurik (1999:31) indicated that these traditions share a heritage and common
language, but they point out a different aspect of the function of the entrepreneur.
The neo-classicals stressed the role of the entrepreneur in leading markets to
equilibrium. The Austrian tradition emphasised the alertness for profit opportunities
and the importance of competition and the German or Schumpeterian tradition saw
the entrepreneur as the innovator in economic life (Arthur & Hisrich, 2011:3; Lewis,
2011:431; Wennekers & Thurik, 1999:31).
Schumpeter (1951:261) emphasised that an entrepreneur is the person who gets
new things done, and not necessarily the person who invents new things. In addition,
Schumpeter (1951:263) theorised that reference to the entrepreneur means more a
particular function than a physical person. Gartner (1989:64) supported Schumpeter's
theory by stating that "the entrepreneur is not a fixed state of existence; rather
entrepreneurship is a role that individuals undertake to create organisations".
Lewis (2011:432) highlighted the work of Kirzner (1973:75), a modern economist,
who viewed the entrepreneur as a person who possesses greater perception and
alertness to profit opportunities than others and act as an equilibrium force in the
market process (Van Praag, 1999:325). Kirzner’s work was supported by Casson
(1982), who asserted that the entrepreneurial function relates to the individual who
possess self-awareness and self-belief. Casson (1982) also emphasized that
imagination is a key entrepreneurial quality and although other qualities and abilities
cannot be acquired, they can be enhanced with training (Lewis, 2011:342).

16
2.3 ENTREPRENEURSHIP DEFINED
There is no consensus on the definition of entrepreneurship or what an entrepreneur
does (Arthur & Hisrich, 2011:2).
Many researchers defined entrepreneurship as a way of thinking, reasoning and
acting that is opportunity-oriented, holistic in approach and leadership balanced
(Makgosa & Ongori, 2012:249; Timmons & Spinelli, 2009:101). Entrepreneurs can
also be defined as behaviours, skills and attributes that are individually and/or
collectively applied and encompass a dynamic process of vision, change and
creation (Organisjana & Matlay, 2012:211; Gibb, 2007:3; Mueller 2004:200).
Entrepreneurship is the process of creating something new with value and includes
the following: the vision to recognise an opportunity (Ali, Topping & Tariq, 2011:13;
Kuratko, 2009:5; Kuratko & Hodgetts, 2007:30; Thompson, 2006:14), taking
responsibility and making judgmental decisions (Hébert & Link, 1989:47), have
total commitment to their cause and a utilitarian view of what is right (Mitton,
1989), the willingness to take calculated risks in terms of time (Hisrich, Peters &
Shepherd, 2010), equity or career (Timmons & Spinelli, 2009:101; Drucker, 1985),
the creative skill to marshal needed resources (Thompson, 2006:14; Cornwall &
Naughton, 2003:62; Hisrich, 1990:209) and to adopt a broad financial strategy
(Chell, Haworth & Brearley, 1991:8).
Van Aardt, Van Aardt, Bezuidenhout and Mumba (2008:5) defined entrepreneurship
in terms of initiating, building and expanding a venture with the intention of staying in
the market place for an extended period. Therefore an entrepreneur is an individual
who establishes and manage a business for the principal purpose of profit, growth
and wealth creation and is characterised by innovative behaviour (Thompson,
2006:14) and receiving the resulting rewards of monetary and personal satisfaction
and independence (Hisrich, Peters & Shepherd, 2010).
On the other hand entrepreneurship is much more than starting a new business. It is
the process whereby individuals become aware of the self-employment career option,

17
develop ideas, take and manage risks, learn the process and take the initiative in
developing and owning a business (International Labour Organisation, 2005).
It is evident that in almost all of the definitions of entrepreneurship there is agreement
that entrepreneurship is a kind of behaviour that include: (1) recognising an
opportunity and taking initiative, (2) the willingness to take calculated risks, and (3)
organising and reorganising of social and economic mechanisms to turn resources
and situations to practical account (Arthur & Hisrich, 2011:5).
According to Pihie (2009: 341), entrepreneurs can be divided into two groups: actual
entrepreneurs (that is, people that have actually started a business) and latent
entrepreneurs or entrepreneurial intention (that is, people that intend to start a
business in the near future) (Mueller 2004:200). This study focused on latent
entrepreneurship.
For the purpose of this paper, entrepreneurship is therefore defined as “an
individual’s ability to turn ideas into action. It includes creativity, innovation and taking
calculated risk, as well as the ability to plan and manage projects in order to achieve
objectives” (European Commission, 2008).
2.4 THE ENTREPRENEUR
2.4.1 Introduction
The word ‘entrepreneur’ is compiled from two French words: ‘entre’, meaning
between, and ‘prendre’, meaning to take or seize (Lewis, 2011:431). Arthur and
Hisrich (2011:2) stated that ‘entrepreneur’ literally translated, means ‘between-taker’
or ‘go-between’. French economists, however referred to an “entrepreneur” as a
person who purchased goods at a specific price not knowing what the selling price
would be (De Lange, 2000:17).
Therefore the entrepreneur can be described as an undertaker, who demonstrates
initiative and creative thinking, is able to organise social and economic mechanisms
to turn resources and situations to practical account and accepts risk and failure
18
(Hisrich, 1990). As a consequence, the entrepreneur disturbs the status quo and may
thus be regarded as a change agent. In such a capacity, the entrepreneur does not
just work for him/herself in a small firm, but may be employed in a large organisation
(Kirby, 2005:174).
An entrepreneur is also perceived as an engine for economic development through
the ability to create new job opportunities, exploitation of opportunities, generation of
new technologies, and introduction of new products and efficient utilisation of
resources (Makgosa & Organi, 2012:251; Gurol & Atsan, 2006).
2.4.2 Why becoming an entrepreneur?
Entrepreneurship as a career option is a lifetime goal and not a decision taken in
isolation, although certain factors can affect the decision to become an entrepreneur
(Beeka & Rimmington, 2011:149). Reynolds and Curtain (2008) pointed out that
entrepreneurship is also a socio-economic choice and not always an individual in a
bad situation. Entrepreneurship can be a career choice, particularly in situations of
high unemployment. Thurik, Carree, Van Stel and Audretsch (2008:684) indicated
that although unemployment increases self-employment, self-employment reduces
unemployment.
It is important to understand the triggers or motivators of entrepreneurship and can
be categorised as either push/pull situational factors or personal characteristics
(Fatoki & Patswawairi, 2012:135; Benzing, Chu & Kara, 2009: Segal, Borgia &
Schoenfeld, 2005:44). Trigger factors may have consequences for the way in which a
business is managed and how the business performs (Fatoki & Patswawairi,
2012:134).
‘Push’ forces are negative external forces that drive individuals to pursue
entrepreneurial activities such as difficulty in finding employment, recession and
frustration with the previous employment. Frustrations with the previous employment
include job dissatisfaction, insufficient salary, inflexible work schedule, redundancy
and blocked promotion (Fatoki & Patswawairi, 2012:135; Makgosa & Ongori,
2012:251).

19
‘Pull’ factors are identified as the desire to become one’s own boss, increase wealth,
changing lifestyle or need to use one’s own experience and knowledge (Benzing et
al., 2009:62; Moreland, 2006:6). Research has shown that the pull factors are more
instrumental than push factors as drivers of entrepreneurial behaviour (Orhan &
Scott, 2001:232).
Burger et al. (2004:190) also commented that people became entrepreneurs for two
reasons, because they have found an appropriate niche in the market
(Nieuwenhuizen; 2004:33) or mere necessity. However, most necessity
entrepreneurs do not have the essential business experience, skill or resources to
start an informal sector venture and end up with an income below the poverty level
(Bhorat & Leibrandt, 1998:28).
2.4.3 Entrepreneurial attributes and behaviours
Although there is little consensus on what an entrepreneur is and what an
entrepreneur does (Koh, 1996:13), the psychological characteristics of an
entrepreneur, in addition to push and pull factors, also plays a role in new venture
initiation (Mueller & Thomas, 2000:54). Gartner (1989:48) postulated the trait
approach to explain entrepreneurship, since the entrepreneur ‘causes’
entrepreneurship.
Several psychological characteristics have been suggested as being good predictors
of entrepreneurial behavior (Timmons & Spinelli, 2009:46-54; Gerry et al., 2008:45;
Demirer & Kara, 2007:51).
2.4.3.1 Need for self-achievement
The need for achievement is the desire to achieve something that is outstanding and
thus something to be proud of by setting challenging, but attainable goals (Demirer &
Kara, 2007:51; Herron, 1994:21). McClelland (1961) asserted that qualities
associated with a high need for achievement, namely preferences for challenges,
acceptance of personal responsibility for outcomes and innovativeness are defining
characteristics of successful initiators of new businesses (Mueller & Thomas,
2000:54; Koh, 1996:14).

20
Demirer and Kara (2007:49) highlighted that the profile of an entrepreneur may be
described as high in need for achievement and low in need for power, while good
managers have high power and low need for achievement.
2.4.3.2 Creativity, initiative and innovation
Schumpeter (1934, 1951) was the first to emphasise the role of innovation in the
entrepreneurial process. Creativity and innovation refer to an individual’s
resourcefulness to create, experiment and investigate new ideas (De Lange,
2000:42; Koh, 1996:16). Creativity therefore gives rise to technological, artistic and
cultural production.
Innovation is the “. . . process that turns an invention . . . into a marketable product”
(Gabor, 1970) and according to Demirer and Kara (2007:51), innovativeness is the
ability and desire to discover new methods of managing a business, original ways of
marketing a product or creative ways of improving it (Koh, 1996:51). Innovation is
therefore more than invention; it also involves the commercialisation of ideas,
implementation, and the modification of existing products, systems and resources
(Mueller & Thomas, 2000:57).
2.4.3.3 Propensity for risk-taking
Risk-taking propensity can be defined as the orientation towards taking chances in
uncertain decision-making contexts (Koh, 1996:15). The entrepreneur faces four
critical risk areas, namely: (1) financial risk, (2) career risk, (3) family and social risk
and (4) emotional risk (Lee & Peterson, 2000:406). It is however evident that the
entrepreneur prefers to take moderate risks in situations where they have some
degree of control or skill in realising a profit (Demirer & Kara, 2007:51; Cromie, 2000,
200:19; Koh, 1996:15). They therefore calculate the risk carefully and thoroughly and
do everything possible to get the odds in their favour (Timmons & Spinelli, 2009:52).
Although Bjerke (2007:82) and Nieman, Hough and Niewenhuizen (2003:29) noted
that entrepreneurial ventures are significantly riskier than conservative firms, the
entrepreneur cannot be perceived as a gambler (Timmons & Spinelli, 2009:52;
Kuratko & Hodgetts, 2001:100). To foster a strong entrepreneurial orientation, a
21
society needs to support ambiguity and uncertainty and commit resources for risky
venture formation (Lee & Peterson, 2000:406).
2.4.3.4 Self-confidence
Successful entrepreneurs believe in themselves (Timmons & Spinelli, 2009:53; Koh,
1996:15) and to be a successful entrepreneur, self-confidence is needed to develop
working relationships with a variety of people (Demirer & Kara, 2007:52).
Entrepreneurs are therefore individuals with a positive self-image, are aware of their
strong and weak points, confident and are able to do without continuous approval
and recognition (Herron, 1994:18-29). Self-confidence and independence are
reciprocally related (Demirer & Kara, 2007:52).
2.4.3.5 Locus of control
The concept of locus of control was first introduced by Rotter (1954, 1966).
Perceived internal locus of control is defined as the personal belief that one has
influence over outcomes through ability, effort or skills; whereas external locus of
control is the belief that external forces control outcomes (Demirer & Kara, 2007:51;
Koh, 1996:14; Kaufmann, Walsh & Bushmarin, 1995:43). An internal locus of control
has been one of the psychological characteristics most often used as predictive of
entrepreneurship (Demirer & Kara, 2007:51; Kaufmann et al., 1995:43).
Research done by Gilad (1982), found that persons who have internal locus of
control (internals) have greater amounts of perceptual alertness. Gilad also noted
that internals are alert, discover opportunities and scrutinise their environment to find
information needed to formulate the optimal approach to developing those
opportunities (Bygrave, 1993). Successful entrepreneurs do not believe that fate, luck
or other powerful, external forces will govern the success or failure of their ventures;
they believe that they personally can affect the outcome (Timmons & Spinelli,
2009:54).
2.4.3.6 Desire for independence and autonomy
Autonomy is a quality of independent, single-minded people with a free spirit who are
self-directed in their pursuit of a new idea and have the ability to carry their idea
22
through to completion (Lumpkin & Dess, 1996:140). Autonomy is also associated
with high internal locus of control (Le Roux, 2003:5).
A desire for independence and autonomy indicates a definite preference for
independence, to be economically self-reliant and autonomous. Entrepreneurs may
also find it difficult to function in restrictive environments as they need to be in control
(Cromie, 2000:21), therefore running their own business are a solution (De Lange,
2000:43; Durham University Business School, 1994:6-7).
2.4.3.7 Motivation, energy and commitment
Successful entrepreneurs are motivated to excel (Timmons & Spinelli, 2009:53).
Entrepreneurs are self-starters, who appear driven internally by a strong desire to
compete against their own self-imposed standards and to pursue and attain
challenging goals (Timmons & Spinelli, 2009:53). The aspiring entrepreneur must
have a certain degree of persistence, to complete what they have started, even in the
face of numerous failures (Timmons & Spinelli, 2009:52; Nieman et al., 2003:29).
2.4.3.8 Pro-activeness
According to Thompson (2006:21), pro-activeness is concerned with the
implementation and creation of events. Pro-active behaviour aims at identification
and exploitation of opportunities and in taking pre-emptory action against problems
and threats.
Pro-active individuals are therefore seen as creators of change and are often
initiators of activities that shape the environment by influencing trends and creating a
demand. Pro-activeness is crucial to entrepreneurial orientation, because it suggests
a forward-looking perspective on a new venture, especially with the implementation
stage of entrepreneurship (Lee & Peterson, 2000:406).
2.4.3.9 Tolerance for ambiguity
Tolerance for ambiguity indicates the ability to deal with uncertainty that surrounds
the creation of a new business (Herron, 1994:22; Koh, 1996:15). A person who has a
high tolerance of ambiguity finds ambiguous situations challenging and strives to

23
overcome unstable and unpredictable situations in order to perform well (Koh,
1996:15).
According to Mitton (1989), entrepreneurs eagerly undertake the unknown and
willingly seek out and manage uncertainty. Therefore an entrepreneur requires a high
degree of self-confidence, know his own personal qualities and have a disposition to
act on his own opinion, venturesomeness and foresight, to deal with uncertainty (De
Lange, 2000:45). According to Drucker (1985), the entrepreneur always searches for
change, responds to it and exploits it as an opportunity (Beeka & Rimmington,
2011:147; Timmons & Spinelli, 2009:53).
Potential entrepreneurs need to be encouraged to identify opportunities, to grasp
those opportunities that may arise and to be fully aware of their own entrepreneurial
strengths and weaknesses. The decision to go into business for oneself must be
made in an objective, deliberate and comprehensive manner. It is necessary to
evaluate the pros en cons of a particular business venture and to take a realistic
assessment of personal market resources capabilities (De Lange, 2000:107). A well-
thought-out decision process, coupled with a heightened awareness of one’s own
personality traits is believed to enhance greatly the probability of entrepreneurial
success.
2.5 BENEFITS OF ENTREPRENEURSHIP
“Entrepreneurs serve as founders, coordinators and finishers” (Brush, 2008:23)
Entrepreneurship’s importance to a country, society as well as individual
development is widely emphasised at seminars, conferences and workshops all over
the world (Keat et al., 2011:206). Through the annual GEM reports more insight are
given on the impact of entrepreneurial activity on a country’s economy.
All over the world entrepreneurship contributes substantially to the social and
economic development of a country and helps to address issues such as
unemployment and poverty alleviation (Massey, 1988:6). Therefore policy makers
have realised the effect of entrepreneurship on economic growth and have reacted
24
by making it a focus of social and political activity (Mashiapata, 2006:12). The
economic and social influence of entrepreneurship has by far the largest impact on
job creation, innovation and economic renewal compared to the formal sectors
wordwide (Mahadea et al., 2011:68; Mashiapata, 2006:12; Chigunta, Schnurr,
James-Wilson & Torres, 2005:15).
Kalitany and Visser (2011:378) postulated that entrepreneurship plays a major role in
reforming and revitalising economies, because it establishes new businesses and
helps existing ones to grow (Ahmad, 2010:203; Timmons & Spinelli, 2009:27). Driver,
Wood, Segal and Herrington (2001:49) support this argument and stated that the
impact of entrepreneurial activity on economic growth is largely via those firms that
survive to become new firms and continue to grow thereafter (Von Broembsen, Wood
& Herrington, 2005:15; Foxcroft, Wood, Kew, Herrington & Segal, 2002:10). In less
developed countries, new businesses can also be used to empower excluded people
and as a result of increased entrepreneurial activity, economic growth can be
expected (Beeka & Rimmington, 2011:145).
New start-up ventures provide valuable goods and services to society and in the
process the local community is revitalised (Chigunta et al., 2005:13). New small firms
also tend to raise the degree of competition in the product market with the consumer
gaining from it. Ali et al. (2011:15) highlighted that the development of entrepreneurial
talent is also important in sustaining a competitive advantage in a global economy.
When new business ventures create jobs, unemployment is reduced and when new
entrepreneurs innovate, they bring about new products, improve production
processes, increased productivity, more competition and better consumer choices
(Beeka & Rimmington, 2011:147; Thompson, 2006:14; Van Stel, Carree & Thurik,
2005:311; Wong, He & Autio, 2005:337). Entrepreneurship consists of the
competitive behaviour that drives the market process therefore any introduction of
new economic activity can be attributed to entrepreneurship (Wong et al., 2005:336).
Without innovation new products, new services and unique ways of doing business
would not exist. Innovation can be seen as the key driver of competitive advantage,
growth and profitability (Drucker, 1985). According to Bird (as quoted by Mueller &
25
Thomas, 2000:57), innovation is more than just invention. Entrepreneurship is
therefore especially important for firms facing rapid changes in industry and market
structures, customer’s needs, technology, and societal values (Van Stel et al.,
2005:311).
Entrepreneurship also has the potential to contribute to long-term economic
empowerment, particularly disadvantage people that can improve their financial
situation when starting and expanding small businesses (Burger et al., 2004:189).
Through entrepreneurship, people develop new skills and experience that can be
applied to many other challenges in life (Chigunta et al., 2005:14), entrepreneurship
increases competitiveness and innovativeness among citizens and help individuals to
develop the personal capacities needed to cope with risks and uncertainty
(Korhonen, Komulainen & Räty, 2011:3).
Although entrepreneurship has a number of potential benefits, Chigunta et al.
(2005:13) noted that caution should be exercised so that entrepreneurship is not
seen as a ‘mass’ or wide-ranging solution which can cure all society’s social ills.
2.6 CURRENT STATE OF ENTREPRENEURSHIP IN SOUTH AFRICA
In South Africa, as is true for most developing countries, there is a lack of
entrepreneurs (Luiz & Mariotti, 2011:47; Isaacs et al., 2007:613; Gouws, 2002:42).
The lack of entrepreneurial activity or alertness is directly connected to low rates of
innovation, unused profit opportunities and to risk-averse attitudes (Carree & Thurik,
2005:5). In South Africa there is not enough people who have the orientation and
skills to create new businesses (Kroon & Meyer, 2001:47). This leads to a situation
where the South African economy performs poorly because only a limited number of
people succeed as entrepreneurs (Van Aardt et al., 2008:4).
The rate of success of prospective entrepreneurs is slowed down by various factors
that are inherent to a developing country like South Africa. The Global
Entrepreneurship Monitor (GEM) report highlights some of these factors.

26
South Africa has participated in the Global Entrepreneurship Monitor (GEM) survey
since 2001. Although South Africa’s Total Early-stage Entrepreneurial Activity (TEA)
rate improved from 5.9% in 2009 to 8.9% in 2010 and to 9.1% in 2011 (Simrie,
Herrington, Kew & Turton, 2011:17), it is still below the average for all efficiency-
driven economies (14.1%), as well as significantly below the average for all middle-
to low-income countries (15.6%) (Mahadea et al., 2011:68; Simrie et al., 2011:20).
A country at South Africa’s stage of economic development would be expected to
have a TEA rate in the order of 15%, more than 60% than the actual rate of 9.1%.
South Africans aged between 25 and 44 are the most entrepreneurially active,
accounting for between 50% and 60% of all early-stage activity, with whites and
Asians being more likely to start a business than coloured and black Africans
(Mahadea et al., 2011:68).
Niewenhuizen and Groenewald (2008:129) stated that South Africa’s TEA rate is in
line with countries like Poland, Hungary and Croatia that were also suppressed by
legal and political systems rendering it illegal in socialist countries, as it was for
blacks under the apartheid system. The lower TEA rates can be explained by the
long term effect of these systems on the attitudes, skills and economic structures of
these countries. Orford, Wood, Fisher, Herrington and Segal (2003:13) stated that
the low survival rate of start-ups also contributes to the low TEA rate, because they
do not actually contribute to economic development. Start-ups employ on average
not more than one person as opposed to new firms that employ on average 2.5
people per firm.
The GEM reports highlighted that entrepreneurship was not well-supported in the
South African community and that business failure was perceived negatively and
carried a social stigma (Burger et al., 2004:189). In addition most Black South
Africans would prefer the security of a full-time job rather than the uncertainty of
generating an income from running their own business (Isaacs et al., 2007:619).
Past GEM reports also consistently highlighted the level of education and how this
influences the formation of entrepreneurial ventures (Simrie et al., 2011:15). The
level of education can have a positive impact on youth entrepreneurship. If one can
27
improve on education levels it is assumed that more people will get involved in
sustainable entrepreneurial ventures. There is a wide spread idea that
entrepreneurship education would generate more and better entrepreneurs than
there have been in the past and that education would increase the chance of
obtaining entrepreneurial success (Alberti, Sciasca & Poli, 2004 as quoted by Keat et
al., 2011:207).
The GEM report of 2005 indicated that the number of young people in South Africa
who believe they have the skills to start a new business is significantly lower than that
of other developing countries. People who believe they have the ability to start a
business are five times more likely than others to attempt starting one (Von
Broembsen et al., 2005:34).
Herrington et al. (2010:15) noted that a culture of entrepreneurship can unleash the
economic potential of all people in South Africa, particular the youth. The South
African youth needs to be provided with options that allow them to contribute towards
the economy. Mahadea et al. (2011:67) stated that young people need to be able to
think of self-employment as a route to self-empowerment rather than seeking wage
employment, therefore the youth should be exposed more to the basics of micro
business entrepreneurship at school level.
Education has been playing a major role in the shaping of an individuals’ career and
personality. Learners can develop a positive perception about entrepreneurship
through early educational preparations (Kourilsky, 1995). Thus one’s perception of an
entrepreneurial career influences one’s intentions to embark on such a career path
(Farrington, Gray & Sharp, 2011:2). Children should learn from an early age to be
knowledgeable consumers, develop the right attitude towards work and develop the
skills needed to identify viable business opportunities and eventually start their own
business undertakings (North, 2002:24).
Entrepreneurship education will therefore contribute to the ideal of empowering as
many people as possible in order to unleash the previously stifled human potential of
all South Africans (Hanekom as quoted by North, 2006:24). The development of an

28
entrepreneurial spirit among the youth is thus vital to alleviate poverty and to address
the socio-economic problems facing South Africa (Mahadea et al., 2011:67).
2.7 ENTREPRENEURSHIP EDUCATION DEFINED
Van den Aardweg and Van den Aardweg (1993:76) define education as a
“purposeful, conscious, intervention by an adult in the life of a non-adult with the
specific purpose of bringing the non-adult successfully to adulthood. Education
includes, not only teaching of subject matter but through teaching the imparting of
qualities such as leadership, perseverance, patience, morals, values, decision-
making and so on”.
The impact of formal education in the shaping of the personality is undoubtedly
profound and besides the inputs in various fields of knowledge, formal education is
also responsible for development of skills, shaping of the character and stabilising the
value system (Jyothi, 2009:39).
Entrepreneurship education, according to Binks (as quoted by Keat et al., 2011:207),
refers “to the pedagogical process involved in the encouragement of entrepreneurial
activities behaviours and mind-sets”.
Therefore entrepreneurship education can be defined as the purposeful intervention
by an educator in the life of the learner to impart entrepreneurial qualities and skills to
enable the learner to survive in the world of business (Isaacs et al., 2007:614;
Gouws, 2002:43). Thus, the challenge is to develop future entrepreneurs capable of
launching and maintaining successful businesses, irrespective of their academic
background (Gibson, Harris, Mick & Burkhalter, 2011:13; WEF, 2009:12).
2.8 ORIGIN OF ENTREPRENEURSHIP EDUCATION
“Most of what you hear about entrepreneurship is all wrong. It’s not magic; it’s not
mysterious; and it has nothing to do with genes. It’s a discipline and like any
discipline, it can be learned.” (Drucker, 1985:143)
29
Governments globally recognised the importance of entrepreneurial education
(knowledge & skills) in schools, colleges and universities to encourage an innovative
and enterprising society (Kirby & Ibrahim, 2012:98; Brijlal, 2011:818).
Although Shigeru Fijii was the first teaching pioneer to initiate entrepreneurship
education at Kobe University, Japan in 1938 (Alberti et al., 2004 as quoted by Keat et
al., 2011:207), most entrepreneurship courses and programmes were pioneered and
introduced in American universities since the late 1940s. The Harvard Business
School taught the first recorded course, with the UK and Western Europe followed
much later in the early 1980s (Kirby & Ibrahim, 2012:98). The Unites States of
America has experience excess growth as compared to European countries, due to
the fact that the country has been much quicker to absorb the virtues of
entrepreneurship (Makgosa & Ongori, 2012:248).
All human beings are inherently entrepreneurial and surveys in many cultures
indicated that youth specifically harbour strong, if latent entrepreneurial tendencies
(WEF, 2009:25; Ibrahim & Soufani, 2002:247; Brockhaus, Hills, Klandt & Welsh,
2001:137), but the structure and delivery of mass education often thwart or throttle
the natural entrepreneurial impulse in youth. However when learners are oriented into
entrepreneurship from an early age, it becomes easier when they have their own
entrepreneurial ventures (Niewenhuizen & Groenewald, 2004:1).
Entrepreneurship education’s main role is to build an entrepreneurial culture among
young people (Deakins, Glancey, Menter & Wyper, 2005). An interest as well as
entrepreneurship awareness needs to be created to really understand
entrepreneurship. The result will be a change in thinking and behaviour, and
consequently the decision to form a new business, create job opportunities and to
choose entrepreneurship as a viable career option (Gorman et al., 1997:63).
In order to achieve functional entrepreneurship education, curriculum design needs to
be creative, innovative and imaginative, combining theoretical knowledge with
practical application (Robinson & Haynes 1991:51). Education systems around the
world are changing in varying degrees to promote the entrepreneurial culture of
promoting enterprises and creating new ventures (Kirby, 2005:173).

30
Entrepreneurship education has been recognised as one of the vital determinants
that could influence students’ career decisions (Sowmya et al., 2010:627). Research
conducted by Ibrahim and Soufani (2002:422) have shown that entrepreneurs who
attended entrepreneurship courses have a high tendency to start their own business
compared with those attending other business courses or not attending courses
(Nieuwenhuizen & Groenewald, 2004:1).
Due to this influence, there is a need to examine how entrepreneurship education
could influence students’ propensity to entrepreneurship (Keat et al., 2011:207).
2.9 ENTREPRENEURSHIP EDUCATION IN SOUTH AFRICA
Although education is considered as one of the main sources of distributing
entrepreneurial knowledge (Orford et al., 2003:52), the South African Institute for
Entrepreneurship (SAIE) (2006) noted the failure of South Africa to adequately
educate its citizens, especially those from poor or modest backgrounds. The GEM
report attributed this to the failure of schools to provide the vast majority of learners
with the basic knowledge and skills required to start an opportunity motivated
business venture (Von Broembsen et al., 2005).
In addition Isaacs et al. (2007:619) commended that learners in a South African
context were hardly motivated to be creators of jobs. Instead, they are taught to
rather seek employment, as it would ensure a stable income for the family (Farrington
et al., 2011:3).
North (2002:25) highlighted that entrepreneurship education in South Africa started in
the early 1990’s when a committee comprising of education and curriculum experts
where formed to investigate the feasibility of the inclusion of entrepreneurship as a
possible future school subject. Entrepreneurship education was formally introduced in
2000, with the implementation of the Curriculum 2005 programme (C2005) as part of
the learning area, Economic and Management Science (EMS) (Horn, 2006:120; De
Waal, 2004:4; North, 2002:26).

31
Entrepreneurship was also introduced into the curriculum in 2005 for grades 10, 11
and 12 as part of the subject, Business Studies (which is an optional subject) (Horn,
2006:121). Learning outcomes for Business Studies include the ability for learners to
develop business plans and transform these into action plans, critically reflect on
business ventures, apply creative thinking to address business problems, and
discuss the principles of professionalism and ethics (DoE, 2003:12).
The Curriculum 2005 programme was based on the notion of outcomes-based
education (OBE) and one of the aims of the Curriculum 2005 programme was to
develop an internationally competitive country (De Waal, 2004:3). Emphasis was
placed to move away from rote learning to a pupil-centred learning environment that
will lead to creativity and innovation. Economic and Management Science (EMS) aim
is to prepare learners for the world of work and how to engage in entrepreneurial
activity from Grade 3 to Grade 9 (DoE, 1997:6).
The Curriculum 2005 programme was also developed to produce citizens with a high
level of skills, a high level of knowledge, and the attitudes and values needed to
rebuild our country. The teachers who previously taught on the basis of subjects’
disciplines were now required to develop competence to teach learning areas and to
become facilitators of learning rather than the sole repository of knowledge (De Waal,
2004:42).
Driver et al. (2001:52) highlighted that teaching entrepreneurship skills are outside
the capabilities of most teachers. Without business training, first-hand experience of
business or commercial subjects, teachers encounter it for the first time when they
have to teach EMS. Mashiapata (2006:22) highlighted that the EMS teacher requires
a lot of business knowledge, as indicated by Table 2.1.
Unfortunately most schools do not implement EMS as a learning area despite the fact
that it is policy and is one of the eight learning areas that are compulsory in the
General Education and Training (GET) phase (Mashiapata, 2006:24; Horn, 2006:121;
Shay & Wood, 2004:34). Teacher who are not qualified or have no interest in EMS
are forced to teach the learning area, therefore learners do not acquire the right
attitude or mind-set towards entrepreneurship.

32
Table 2.1: Summary of knowledge and skills required in GET phase
LEARNING OUTCOME 1
The economic cycle
The role players in the economy - their
roles, rights and responsibilities and how
the economy functions.
LEARNING OUTCOME 2
Sustainable growth and development
Economic growth and development and
how to sustain it.
Productivity knowledge, values and
attitude and its effect on economic
prosperity, growth and living standards.
LEARNING OUTCOME 3
Management, consumer and financial
knowledge and skills
Leadership and management issues
include: basic aspects of leadership,
such as planning and directing,
negotiation, motivation, delegation and
conflict management, basic aspects of
management such as administration,
finance and production, marketing,
purchasing, public relations and human
resource development and rights and
responsibilities of management and
workers.
Financial and consumer knowledge
includes: accounting, personal finance,
consumer knowledge and skill, the
importance of savings and investments.
LEARNING OUTCOME 4
Entrepreneurial knowledge and skills
Entrepreneurial skills, knowledge and
attitudes include: taking initiative, risk
taking within the context of the process of
conceptualizing a business, financing a
business and running a business.
Responsibilities of entrepreneurs within
communities and business environments
(to act as adviser, counsellor, mentor and
role model to learners).
Attitudes or mind-sets that learners acquire at school are probably more important
than curriculum content, in terms of developing their entrepreneurial content. Driver
et al. (2001:52) noted that schools where teachers are unmotivated, poorly trained
and show now initiative, are unlikely to produce inspired, entrepreneurial thinkers
(Korhonen et al., 2011:2; Mashiapata, 2006:31). The schooling system therefore fails
to educate young minds to think and act entrepreneurial (Von Broembsen et al.,
2005:39).

33
Since the introduction of OBE and the implementation of the Curriculum 2005
programme in 2000, many reviews or changes were made to the South African
school curriculum:
Revised National Curriculum Statement Grades R-9, Government Gazette
No. 23406 of 31 May 2002.
National Curriculum Statement Grades 10-12 Government Gazettes, No.
25545 of 6 October 2003 and No. 27594 of 17 May 2005.
In 2012 The National Curriculum Statement Grades R-12 replaced the above policy
documents. The Curriculum and Assessment Policy Statements (CAPS) are now
used for all approved subjects and promotion guidelines (DoE, 2011:3). CAPS were
implemented in the Foundation Phase (Grade 1 to 3) and Grade 10 in 2012, with the
Intermediate (Grade 4 to 6), Senior Phase (Grade 7 to 9) and Grade 11 in 2013 and
Grade 12 in 2014. One major change of CAPS is that EMS is only introduced in the
Senior Phase (DoE, 2011:3).
Horn (2006:120) stressed that effective schooling should develop awareness and
skills in areas more specifically related to business, such as entrepreneurship,
economics and accounting. Interesting to note is that these three areas are the main
topics of the EMS curriculum for grade 7 to 9 (DoE, 2011:3), as indicated in Table
2.2.
However, only two hour teaching time per week is allocated for EMS, of which one
hour per week must be used to develop grade 8 and 9 learners’ accounting skills
(Topic 2) and with Business Studies as an optional subject from grade 10, the
question remains whether enough emphasise is placed on entrepreneurship
education in South Africa.
South African schools are doing far less than schools in other developing countries to
develop the skills required for entrepreneurship (SAIE, 2006). Isaacs et al.
(2007:622) support this argument and stated that entrepreneurship education at
school level does not receive a high priority in the South African context and that
entrepreneurship education offered by schools differs from school to school.

34
Table 2.2: Main topics in the EMS Curriculum Grade 7 to 9
The economy
(weighting of 30%)
Financial literacy
(weighting of 40%)
Entrepreneurship
(weighting of 30%)
1. History of money
2. Need and wants
3. Goods and services
4. Inequality and poverty
5. The production process
6. Government
7. The National Budget
8. Standard of living
9. Markets
10. Economic systems
11. The circular flow
12. Price theory
13.Trade unions
1. Savings
2. Budgets
3. Income and expenditure
4. Accounting concepts
5. Accounting cycle
6. Source documents
7. Financial management
and keeping of records
1. Entrepreneurial skills
and knowledge
2. Businesses
3. Factors of production
4. Forms of ownership
5. Sectors of the economy
6. Levels and functions of
management
7. Functions of a business
8. Business plan
2.10 SUCCESSFUL ENTREPRENEURSHIP EDUCATION
No country has succeeded without educating its people (Mashiapata, 2006:18). An
educational system reflects a society and the absence of an entrepreneurial
orientation is symptomatic of a society that does not recognise entrepreneurial
activity sufficiently (Le Roux, 2003:11). Therefore an understanding of the role of
entrepreneurship in the economic process is critical for an understanding of the
dynamics of society and its future well-being (Gouws, 2002:46).
Entrepreneurship is a mind-set that cannot be taught, but can be stimulated. A
combination of a rounded education and exposure to entrepreneurship, from an early
age, can help by encouraging children and young adults to think and behave more
entrepreneurial and ultimately to consider ownership as a career option (Ibrahim &
Soufani, 2002:427).
If learners are to achieve a mind-set change from wage-employment to self-
employment and starting their independent ventures, they need the necessary
35
exposure, knowledge and skills provided by skilled teachers in order to develop their
entrepreneurial orientation (Le Roux, 2003:2). Therefore entrepreneurship education
should convince students to become actively involved in entrepreneurship, help them
to understand the dynamics of the world of entrepreneurship and should slow down
reality by means of formal and informal tuition (Timmons & Spinelli, 2009:6).
Solid learning will increase knowledge management and promote psychological
attributes (entrepreneurial characteristics). Lee, Chang and Lim (2006) emphasised
the school and education’s role in predicting and developing entrepreneurial traits
(Korhonen et al., 2011:2; Mashiapata, 2006:31; Gouws, 1997:147). A favourable
entrepreneurial environment at an early stage will encourage positive and self-
enabling perceptions of potential entrepreneurs (Krueger & Brazeal, 1994:91).
A successful entrepreneurial culture can be established through education (Kroon,
2002:215), involving the government, teachers, parents and learners themselves
(Gouws, 2002:41). Some factors contributing towards an entrepreneurial culture are:
perceptions towards entrepreneurship, business role models, negative mind-sets in
terms of confidence, initiative and creativity and negative perception towards
entrepreneurship as a career choice (Brijlal, 2011:819).
Entrepreneurial education should focus on developing perceptions of desirability and
feasibility of entrepreneurial actions (Orford et al., 2003:34; Krueger, 1993) and
awareness and skills in areas more specifically related to business, such as
entrepreneurship, economics and accounting (Horn, 2006:120). Schools also can
play an important role in shaping learner attitudes in more subtle ways, for example
in the areas of work ethic, career goals and expectations, and their outlook toward
tertiary education (Orford et al., 2003:34).
Orford et al. (2003:4) stress the fact that effective entrepreneurship education should
improve the human capital base for entrepreneurship and have a significant positive
influence on particularly four areas crucial to entrepreneurship:
Learners’ self-confidence about the ability to start a business.
Learners’ understanding of financial and business issues.
36
Learners’ desire to start their own business.
Learners’ desire to undertake higher education.
According to Chigunta et al. (2005:14), the Centre for Youth Entrepreneurship
Education highlighted that: “Effective youth entrepreneurship education prepares
young people to be responsible, enterprising individuals who become entrepreneurs
or entrepreneurial thinkers and contribute to economic development and sustainable
communities”. Ultimately effective entrepreneurship education should therefore focus
on developing enterprising skills (Pittaway, Hannon, Gibb & Thompson, 2009:71;
Ijeoma & Ndedi, 2008:4) and creative thinking (Lourenco & Jayawarna, 2011:225;
Gibb, 2002:135).
2.11 ENTREPRENEURSHIP INTENSION/TENDENCIES
Athayde (2009:481) noted that as young people increasingly become the target of
entrepreneurial and enterprise policy initiatives and enterprise education in schools
increases, so does the need to effectively measure the impact these programs have.
Mazzarol (2007:4) noted that several entrepreneurial intention models have emerged
over the years and are accepted to explain entrepreneurial intentions (Drennan &
Saleh, 2008:2). These models suggest that one’s entrepreneurial intention is
influenced by firstly, the perception of the extent to which it is desirable to become an
entrepreneur. Secondly, entrepreneurial intention is influenced by perceptions of
feasibility, which focus on one’s ability to adopt entrepreneurial behaviour, given the
prevailing entrepreneurship environmental conditions (Ali et al., 2011:13).
Entrepreneurship development is also influenced by political-, legal- and economic
conditions and infrastructure development. Finally, social and cultural norms about
entrepreneurship are considered to influence one’s decision to become an
entrepreneur and these are largely influenced by one’s family and friends. One’s
perceptions of desirability and feasibility are associated with the intention to engage
in entrepreneurial activity (Ali et al., 2011:13; Linan & Chen, 2006:4).
37
2.12 THE GENERAL ENTERPRISING TENDENCY (GET) TEST
One measure of entrepreneurial orientation is the General Entrepreneurial
Tendencies (GET) test developed by Caird (1991). The GET test is an assessment
tool used to evaluate the enterprising tendencies of the prospective or existing
entrepreneur (Athayde, 2009:482).
Mazzarol (2007:5) highlighted that the GET test is developed from a range of existing
psychometric tests including:
The Thematic Apperception Test (TAT) as a measure of achievement,
The Edwards Personal Preference Schedule (EPPS) as a measure of
autonomy,
The Honey and Mumford’s Measure of Learning Styles (Mumford, 1993;
Mumford & Honey, 1992) and the Jackson’s Personality Inventory (Jackson,
1976), which is a measure of risk-taking.
The GET test also incorporates elements from the Myers-Briggs Type
Indicator (MBTI) (Briggs-Myers & McCaulley, 1985) which measures on four
dimensions:
o introversion-extroversion;
o intuition-sensation;
o thinking-feeling and
o judging perception
The GET test measures five relevant entrepreneurial traits: (1) need for achievement,
(2) need for autonomy, (3) creative tendencies, (4) moderated/calculated risks and
(5) drive and determination (Caird, 1991; 1992). These dimensions have been
thought to be predictive of an entrepreneurial personality (Stormer, Kline &
Goldenburg, 1999:47). The assessment consists of 54 statements with which the
aspiring entrepreneur has to either agree or disagree. Each of the subscales is
scored, either from 0-6 or 0-12 depending on the subscale. A total score ranging from
0-54 can also be derived from the test (Stormer et al., 1999:49; Caird, 1991). There
is no time limit, although it takes about 10 minutes to complete the questionnaire. A
38
maximum score on the test is 54 while the average is 36. The test has to be scored
by a psychometrist.
Mazzarol (2007:4) highlighted that key factors likely to influence the propensity for
entrepreneurship are the need for achievement, a tolerance for ambiguity, the
propensity to taking calculated risks, internal locus of control and the desire for
personal control. The individual’s previous work or career history may also trigger
entrepreneurial behaviour as well as a person’s gender, education level, family
background and ethnicity.
The nascent or novice entrepreneur is likely to be influenced by their environment
which serves to trigger their creativity and stimulate their desire for achievement
leading to the formation of an entrepreneurial venture (Mazzarol, 2007:5).
2.12.1 Need for achievement (12 items)
The need for achievement – nAch – has been associated with entrepreneurial
behaviour since McClelland introduced the concept in 1961 (Cromie, 2000:16).
McClelland defined the need for achievement as “an arousal when there is
competition with a standard of excellence on situations where performance may be
assessed for success or failure” (as quoted by Caird, 1991:180). Therefore nAch
denotes a person’s need, to strive hard to attain success and is regarded as a life
rather than a simple drive (Cromie, 2000:16).
Self-awareness, planning, decision-making, initiative, problem-solving, responsibility,
calculated risk-taking skills, innovation, seeking feedback, energy, determination,
motivation and superego strength are all associated with a high need for
achievement (Cromie, 2000:17; Caird, 1991:180).
It is believed that individuals with a high nAch have a strong desire to be successful
and are consequently more likely to behave entrepreneurially (Koh, 1996:14).
McClelland (1961) suggested that entrepreneurs have a high need for achievement
and achievers will choose situations that are characterised by individual
39
responsibility, moderate risk-taking, knowledge of results of decisions, novel
instrumental activity and anticipation of future possibilities (Kirby, 2005:178).
Entrepreneurs are dedicated to success, have high energy levels (Lewis, 2011:435;
Kuratko & Hodgetts, 2001), are committed, determined, motivated to excess and
wants to make things happen. Bolton and Thompson (2004) call it an ‘activator talent
theme’. Several studies highlight perseverance and determination as entrepreneurial
characteristics (Drennan, Kennedy & Renfrow, 2005:232). However Cromie
(2000:17) highlighted that individuals create business ventures for many reasons and
many people with a strong achievement drive are also attracted to other jobs such as
management.
Bygrave (1993:258) highlighted that nAch formed the basis of training programmes
because achievement motivation could be taught, studied and to some extend
developed (Organisjana & Matlay, 2012:209) and is aimed at stimulating
entrepreneurship in underdeveloped regions of the world. The need for achievement
is also used to evaluate would-be entrepreneurs. However training for achievement
motivation was unsuccessful when the participants’ opportunities to act were limited
by unfavourable business environments (Organisjana & Matlay, 2012:209).
Some examples of test items include:
Question 1: I would not mind routine unchallenging work if the pay was good
(negatively assessed).
Question 10: I like challenges that really stretch my abilities rather than things I can
do easily (positively assessed).
Question 42: When I am faced with a challenge I think more about the results of
succeeding than the effects of failing (positively assessed).
High score interpretations suggest a future orientation and task orientation, strong
work ethic, a tendency to set challenging goals and a planning orientation for
achievement. Low score interpretations suggest a placid nature, a lack of ambition,
an easy-going nature, a tendency either to give success a low priority or to disbelieve
that success is an attainable goal for themselves (Caird, 1991:181).
40
2.12.2 Need for autonomy (6 items)
Kirby (2005:176) points out that entrepreneurs wants to be in control therefore, have
a higher need for autonomy and a greater fear of external control than many other
occupational groups (Cromie & O'Donoghue, 1992; Caird, 1991). They value
individualism and freedom more than do either the general public or managers and
they have a dislike of rules, procedures and social norms. As a consequence they
have difficulty functioning in constraining environments that stifle creativity and can
experience difficulty relating to others (Cromie, 2000:21). Douglas and Shepherd
(2002:81) also found that entrepreneurs have a preference for independence as it
was significantly related to become self-employed.
The need for autonomy relates to attributes of determination, self-reliance, inner
control, calculated risk-taking, innovation and decision-making (Caird, 1991:181).
Some examples of test items include:
Question 3: I do not like to do things that are novel or unconventional (negatively
assessed).
Question 12: I like to do things in my own way without worrying about what other
people think (positively assessed).
Question 21: When I am in a group I am happy to let someone else take the lead
(negatively assessed).
High score interpretations suggest: independence, poor employee potential in jobs
which lack autonomy, the need to do things in an independent way, a stubborn and
determined nature and unconventionality. Low score interpretations suggest: a
facilitating nature, flexibility with decision-making, a preference for working with or for
others rather than managing others (Caird, 1991:181)
2.12.3 Creative tendency (12 items)
Kuratko and Hodgetts (2007) noted that creativity is not an exclusively inherited trait
and suggest that creativity can be learnt. Successful entrepreneurs are creative, self-
reliant and adaptable by being open-minded, flexible, quick learners and always
uncomfortable with the status quo. Cromie (2000:20) highlighted that enterprising

41
individuals are responsible for the development of new ideas, spotting of market
opportunities or for the combination of existing ideas and resources in different ways
to create additional value. Our ability to think creatively and imaginatively is important
enterprising skills to support decisions in uncertain business situations.
Some examples of test items include:
Question 8: Sometimes people find my ideas unusual (positively assessed).
Question 14: I like to find out about things even if it means handling some problems
whilst doing so (positively assessed).
Question 53: It is harder for me to adapt to change than keep to routine (negatively
assessed).
High score interpretations suggest: an imaginative and innovative orientation,
versatility, a preference for novelty, intuition, a tendency to have ideas and sensitivity
to opportunity. Low score interpretations suggest: a preference for stability, a
practical orientation which is not given to flights of fancy and a preference for
implementing others’ ideas (Caird, 1991:180).
2.12.4 Risk-taking (12 items)
The role of risk-taking in the entrepreneurship process is keenly disputed by
researchers. Some argue that entrepreneurship begins with risk-taking (Organisjana
& Matlay, 2012:209; Lewis, 2011:435). Others, however, point out that entrepreneurs
can minimize risks to such an extent that they hardly incur any threats (Timmons &
Spinelli, 2009:52).
Therefore, Kuratko and Hodgetts (2001:100) argue that the entrepreneur is not a
gambler and rather show risk calculation behavior that includes getting others to
share inherent financial and business risk with them. It is believed that entrepreneurs
prefer to take moderate risks in situations where they have some degree of control or
skill in realising a profit (Organisjana & Matlay, 2012:209; Koh, 1996:15).

42
Some examples of test items include:
Question 2: When I have to set my own targets, I set difficult rather than easy ones
(positively assessed).
Question 11: I would prefer to have a reasonable income in a job that I was sure of
keeping rather than in a job that I might lose if I did not perform well
(negatively assessed).
Question 29: Before I make a decision I like to have all the facts no matter how long it
takes (negatively assessed).
High score interpretations suggest: the ability to judge that a risk is worth taking when
the consequences of failure do not outweigh the incentive value of success, the
ability to make decisions in uncertain conditions and the tendency to make decisions
without exhaustively gathering information. Low score interpretations suggest: a
cautious nature, a painstaking approach to decision-making and a preference for
working with certainty (Caird, 1991:179).
2.12.5 Drive and determination (12 items)
The perception of self-efficacy, rather than objective ability, motivates individuals to
demonstrate entrepreneurial behavior (Markman, Balkin & Baron, 2002:152). Unlike
other personality traits of entrepreneurship which are relatively static, self-efficacy is
affected by contextual factors such as education and past experiences (Hollenbeck &
Hall, 2004; Pihie 2009:338).
Although much research has been done in an attempt to identify the characteristics of
a successful entrepreneur, not one study has been able to come up with the exact
personality traits that will predict whether or not a person will be successful as an
entrepreneur (De Lange, 2000:36).
Some examples of test items include:
Question 7: You are either naturally good at something or you are not, effort makes
no difference (negatively assessed).
43
Question 25: I will get what I want from life if I please the people with control over me
(negatively assessed).
Question 34: Being successful is the result of working hard, luck has nothing to do
with it (positively assessed).
High score interpretations suggest: proactivity, self-reliance, self-determination, self-
confidence, and belief that achievement is due to ability and effort and tendency to
believe that ‘failures’ are lazy or stupid. Low score interpretations suggest: the view
that life is not controlled by self but by external factors, dependence, belief that
success depends on fate, luck, others or being in the right place at the right time and
consideration of others’ ‘misfortunes’ (Caird, 1991:181).
Although the GET test appears to have criterion and convergent validity and good
internal consistency, Cromie (2000) believed it requires further work to verify the
psychometric properties of the test (Kirby & Ibrahim, 2012:104). Cromie and
O’Donoghue (1992) also validated the criteria upon which the GET test was based.
They found that the GET subscales were positively correlated with another and all
subscales strongly correlated with the overall GET score. The GET scale was very
useful measure for distinguishing between entrepreneurial traits of entrepreneurs and
other groups of individuals (Lyng, 2008:40).
Problems were however encountered as far as reliability and validity are concerned
with the use of the General Enterprising Tendency test (GET) developed at Durham
University Business School (Johnson & Ma as quoted by De Lange, 2000:118).
Although the GET test cannot determine whether or not a person is going to be an
entrepreneur, it is a tool that has some potential in assessing enterprise tendencies
en therefore entrepreneurial orientation (Mazzarol, 2007:6).
2.13 SUMMARY
Entrepreneurship and innovation are widely seen as key sources of renewed
economic growth, creating jobs and advancing human welfare and without an
entrepreneurial attitude societies can stagnate, which can hinder the long-term
growth and prosperity of a region. On the other hand is entrepreneurship linked to

44
employment generation, innovation and economic growth and is worldwide been
accepted as an important way of integrating more young people into the economic
environment.
Although the South African government has implemented various strategies to create
an environment that encourage entrepreneurs and small business ventures, South
Africa still lacks entrepreneurs who have the orientation and skills to create new
businesses. Therefore entrepreneurship must be promoted as a powerful vehicle for
reducing poverty and high unemployment.
Entrepreneurship can be defined as an individual’s ability to turn ideas into action,
and it includes creativity, innovation and taking calculated risk, as well as the ability to
plan and manage projects in order to achieve objectives. An entrepreneur have the
ability to be aware of the self-employment career options, develop ideas, take and
manage risks, learn the process and take the initiative in developing and owning a
business.
The need for self-achievement, creativity, initiative and innovation, propensity for risk-
taking, self-confidence, locus of control, desire for independence and autonomy,
motivation, energy and commitment, pro-activeness and tolerance for ambiguity were
identified as good predictors of entrepreneurial behavior.
Although entrepreneurship is widely regarded as one of the best economic
development strategies to develop a country’s economic growth, entrepreneurship is
not well-supported in the South African community and most South African’s would
rather prefer the security of a full-time job rather than the uncertainty of generating an
income from running their own business.
A culture of entrepreneurship is needed to unleash the economic potential of all
people in South Africa, particular the youth. They need to be able to think of self-
employment as a route to self-empowerment rather than seeking wage employment.
Entrepreneurship education will contribute to the ideal of empowering as many
people as possible. Therefore the youth should be exposed more to the basics of
micro business entrepreneurship at school level.
45
The South African government realised the importance of entrepreneurship education
with the implementation of Economic and Management Science (EMS) from Grade 3
to Grade 9 and Business Studies (an optional subject) for grade 10, 11 and 12. The
aim of EMS is to prepare learners for the world of work and how to engage in
entrepreneurial activity.
Although education is considered as one of the main sources of distributing
entrepreneurial knowledge, South African schools have failed to provide the vast
majority of learners with the basic knowledge and skills required to start an
opportunity motivated business venture. Learners are not motivated to be creators of
jobs, instead they are taught to rather seek employment, as it would ensure a stable
income for the family.
Teacher who are not qualified or have no interest in EMS are forced to teach the
learning area, therefore learners do not acquire the right attitude or mind-set towards
entrepreneurship, while at some schools EMS is not implement as a learning area
despite the fact that it is policy. Attitudes or mind-sets that learners acquire at school
are probably more important than curriculum content, in terms of developing their
entrepreneurial content. The schooling system therefore fails to educate young minds
to think and act entrepreneurial
Another major change in the school curriculum (Curriculum and Assessment Policy
Statements, CAPS) will come into effect from 2013, with EMS only introduced in the
curriculum in the Senior Phase (from grade 7 to grade 9). Disturbing to note is that
only two hour teaching time per week is allocated for EMS. Entrepreneurship
education will therefore be limited to only three years, because Business Studies is
an optional subject from grade 10 to 12.
The absence of an entrepreneurial orientation is symptomatic of a society that does
not recognise entrepreneurial activity sufficiently. It is therefore evident that
entrepreneurship education at school level does not receive a high priority in the
South African context. If learners are to achieve a mind-set change from wage-
employment to self-employment and starting their independent ventures, they need
46
the necessary exposure, knowledge and skills provided by skilled teachers in order to
develop their entrepreneurial orientation.
Although entrepreneurship education is implemented in South African schools, the
impact of these programmes still needs to be effectively measured. One measure of
entrepreneurial orientation is the General Entrepreneurial Tendencies (GET) test
developed by Caird (1991). The GET test is an assessment tool used to evaluate the
enterprising tendencies of the prospective or existing entrepreneur.
The GET test measures five relevant entrepreneurial traits: (1) need for achievement,
(2) need for autonomy, (3) creative tendencies, (4) moderated/calculated risks and
(5) drive and determination (Caird, 1991; 1992). These dimensions have been
thought to be predictive of an entrepreneurial personality. The assessment consists
of 54 statements with which the aspiring entrepreneur has to either agree or
disagree.
The GET scale is a very useful measure for distinguishing between entrepreneurial
traits of entrepreneurs and other groups of individuals and although the GET test
cannot determine whether or not a person is going to be an entrepreneur, it is a tool
that has some potential in assessing enterprise tendencies en therefore
entrepreneurial orientation.

47
CHAPTER 3
THE NATURE OF YOUTH UNEMPLOYMENT
3.1 INTRODUCTION
Unemployment in South Africa is structural in nature and not transient and has grown
out of economic structure changes since 1970 (Lam, Leibbrandt & Mlatsheni,
2008:2). Pike and Sharp (2010:26) noted that South Africa’s unemployment rate
increased from about 7% in the mid-1970s, to 13% in the mid-1990s and 25% in the
late 2000s, making South Africa’s unemployment rate one of the highest in the world
(Klasen & Woolard, 2009:2; Ozler, 2007:487).
Part of the explanation for high unemployment in South Africa is that economic
growth has not been high enough over the last 30 years to generate sufficient
employment (McGrath & Akoojee, 2012:423; Banerjee, Galiani, Levinsohn, McLaren
& Woolard, 2008:2) as well as the lack of job creation in the unskilled and semi-
skilled labour category (Klasen & Woolard, 2009:12; Lewis, 2001:10).
Despite the structural nature of unemployment in South Africa there are just not
enough job opportunities (Banerjee et al., 2008:1). School leavers and new entrants
to the job market needs to be aware of the realities of the changing market conditions
in South Africa and should consider enhancing their employment prospects by taking
the entrepreneurial path as job-creators rather than job-seekers (Mahadea et al.,
2011:67; Nieuwenhuizen & Groenewald, 2008:128) with the right entrepreneurial
attitude (Naong, 2011:184).
The aim of this chapter is to provide an overview of youth unemployment in South
Africa starting with the definition of youth, unemployment and structural
unemployment. A brief overview of the current state of unemployment in South Africa
and youth unemployment are discussed, followed by possible reasons for youth
unemployment. The chapter ends with initiatives that the South African government
and the private sector have taken to address and promote youth entrepreneurship.
48
3.2 DEFINITION OF CONCEPTS
3.2.1 Youth
The United Nations (UN) and The International Labour Organisation (ILO) defined
youth as “young people from 15 to 24 years of age”, however the South Africa
National Youth Commission Act of 1996 and the National Youth Policy of 2009 to
2014 (NYP, 2009:12) defined youth as people between the age of 15 and 34.
According to Altman and Marock (2008:10), the reason South Africa uses this cohort
is because African youth tend to enter the schooling system late and exit late due to
slower throughput rates. The youth group is further categorised as teenagers (15 to
19), young adults (20 to 24), and prime adults (25 to 34) (Du Toit, 2003:7). For the
purpose of this study the South African definition will be used (age 15 to 34).
3.2.2 Unemployment
Two definitions are employed to define unemployment in South Africa – the official or
strict definition and the expanded definition (Altman & Marock, 2008:2; Du Toit,
2003:7). Both definitions include people age 15 or older who are not employed but
are available for work.
The strict or narrow definition requires that an individual must have taken steps
to find employment for four weeks prior to a given point. (Stats SA, 2012).
The expanded or broad definition include those who are discourage or despair
and did not search for work in a 4-week reference period but report being
available for work and would accept a suitable job offer (Stats SA, 2012).
3.3 UNEMPLOYMENT OVERVIEW
Unemployment imposes significant costs on the individual, society and a country. Not
only are unemployed individuals not acquiring important skills and experience
needed to provide for themselves and their families, the economy are robbed from
useful talent and economic growth that are needed to elevate the on-going poverty
and societal problems (Grosso & Smith, 2011:79).
49
3.3.1 Unemployment worldwide
The financial crisis (2007-2008) that led to the global recession (2008-2009) had
widespread consequences on the economic performance, labour productivity and
employment in all countries around the world (Stewart, 2012:84; Choudhry, Marelli &
Signorelli, 2010:2), especially in advanced economies, which were hit harder and are
recovering more slowly than emerging market and developing economies (Morsy
2012:15; Stewart, 2012:84).
Global unemployment increased fast during the crisis in the global labour market with
a rate of around 6% at the end of 2011 (International Labour Organisation, 2012:31).
The increases in unemployment levels have been most severe in the United States,
New Zealand, Spain and Taiwan (Wanberg, 2012:370). The International Labour
Organisation estimates that, out of a workforce of 3.3 billion, around 200 million
people will be unemployed in 2012 (International Labour Organisation, 2012:31).
3.3.2 Unemployment in South Africa
South Africa is a developing country with an estimated population of over 50.6 million
people (Stats SA, 2011). According to the Quarterly Labour Force Survey, in the
second quarter of 2012 there were an estimated 32.9 million people aged between
15 and 64 (Stats SA, 2012). Among these people 13.45 million were economically
active and nearly a quarter (24.9%: 4.47 million) were unemployed, according to the
official definition (see Figure 3.1).
It is evident from Figure 3.1 that the level of unemployment climbed rapidly during the
financial and economic crisis and peaked in June 2010 with approximately 4.4 million
people unemployed. The rate stabilised for the rest of the year but climbed again to
reach 4.5 million unemployed people in the second quarter of June 2011. Interesting
to note is that unemployment declined each year in the fourth quarter but rose again
in the first quarter of the next year (Stats SA, 2012:32).
The South African labour market has been characterised by a poor employment
creation performance in the past decade (Pauw, Oosthuizen & Van der Westhuizen,

50
2008:46) therefore the high rate of unemployment is one of the major stumbling
blocks in the social and economic growth of South Africa (Bezuidenhout, Schultz &
Du Plooy, 2012:39; Altman & Marock, 2008:10; Vakalisa, 2005:41). South Africa
currently suffers from higher unemployment levels than most developing countries in
Africa, Latin America or Asia, and significantly higher unemployment rates than those
of the middle- or high-income countries (Klasen & Woolard, 2009:2; Ozler, 2007:487;
McCord & Bhorat, 2003:125).
Figure 3.1: Total unemployment in South Africa from 2008 to 2012
Source: LFS Quarter 2 (Stats SA, 2012)
Unemployment or the lack of labour market flexibility in South Africa is structural in
nature and not transient and has grown out of economic structural changes since
1970 (Lam et al., 2008:2). The South African economy has been undergoing a
structural transformation into a new so-called ‘service-economy’ and businesses
were forced to adapt to these changes as well as to foreign competition to compete in
the changing domestic and international markets (Banerjee et al., 2008:9; Horn,
2006:118).
These changes include technological development, declining of the agricultural
sector, financial liberalisation and globalization (Banerjee et al., 2008:9-10; Eatwell,
2000:346-351). Consequently the main focus in the workplace has shifted away from
activities based in the primary sector of agriculture and mining towards the more
knowledge-based secondary and tertiary sectors, and subsequently these displaced

51
workers were unable to relocate to other regions where jobs might be available
(Banerjee et al., 2008:9-10; Horn, 2006:118).
For South Africa to prosper as a country and for its people to grow and develop, it is
essential that unemployment be addressed (Bezuidenhout et al., 2012:39).
3.4 WHO ARE UNEMPLOYED IN SOUTH AFRICA?
Unemployment is particularly concentrated among historically disadvantaged groups
and is higher among rural, female, uneducated and young segments of the
population (Arora & Ricci, 2005:23).
Unemployment will be discussed by province, gender, sex, population group,
education level and age:
3.4.1 Province
Figure 3.2 indicates that the Free State province (32.9%) recorded the highest
unemployment rate in the second quarter of 2012, followed by the Northern Cape
(29.8%), Mpumalanga (28.9%) and the Eastern Cape (28.6%) (Stats SA, 2012).
Figure 3.2: Unemployment rate by province
Source: LFS Quarter 2 (Stats SA, 2012)

52
3.4.2 Gender
Employment opportunities for young women are generally more limited than those for
young men, therefore unemployment rates for young women are slightly higher than
for men (Banerjee et al., 2008:5; Du Toit, 2003:4). Although the female labour force
participation rates have risen in most countries, the majority of working women are
paid less than their male counterparts and they are also concentrated in jobs that are
undervalued, such as domestic work (Ortiz & Cummins, 2012:4).
The difference in gender unemployment in South Africa is illustrated in Figure 3.3.
Women unemployment was at 27.5% in the second quarter of 2012 with unemployed
men at 22.8% (Stats SA, 2012). Although the unemployment rate for women
remained higher than the national average between 2008 and 2012, the gap
narrowed by 4.6%. The overall decline in the unemployment rate can be attributed to
improvements in the labour market environment.
Figure 3.3: Unemployment rate by sex
Source: LFS Quarter 2 (Stats SA, 2012)
3.4.3 Population group
Figure 3.4 indicates the year-on-year unemployment comparisons rate by population
group and shows a slight decrease in the unemployment rate of black Africans (from
30% to 28.7%) and amongst the Indian/Asian population group (from 10.8% to 9.5%).
Unemployment however increased amongst the coloured (from 23.1% to 24%) and

53
white population (from 5.0% to 5.7%). Although unemployment for black Africans
decreased there is such a substantial pre-existing pool of unemployed persons and
new entrants to the labour market each year that unemployment is still very high
(Altman & Marock, 2008:14).
Figure 3.4: Unemployment rate by population group
Source: LFS Quarter 2 (Stats SA, 2012)
3.4.4 Education levels
The population are classified into four education groups: Lower than matric, matric,
tertiary education completed and other. Pauw et al. (2008:47) stated that higher
education is correlated with better employment outcomes and greater labour market
participation as is evident in Figure 3.5. Only those with a university degree have
reasonably low unemployment rates (Banerjee et al., 2008:5).
Figure 3.5: Unemployment rate by education level
Source: LFS Quarter 2 (Stats SA, 2012)
54
Figure 3.5 indicates that approximately 59.3% of the unemployed in 2012 did not
have matric and only 6.3% has tertiary qualifications (Stats SA, 2012). However the
number of learners passing matric increased from 30% at the beginning of 2008 to
33.5% in 2012. According to the General Household Survey (2011), approximately
652 869 students were enrolled at higher educational institutions during 2011. Almost
two thirds (65.4%) of these students were black African. However, proportionally this
group is still underrepresented. Only 3.5% of Africans aged 18 to 29 years were
studying as opposed to 14.9% of Indian/Asian individuals and 20.0% of the white
population in this age group. Only 3.8% of the coloured population was studying
during 2011.
Although the labour force has become better educated over time (Pauw et al.,
2008:47), Moleke (as quoted by Du Toit, 2003:4) found that youth unemployment is
also high among the better educated. Pauw et al. (2008:46) support Moleke’s
findings and highlighted that although the graduate unemployment rate is low in
comparison to the overall unemployment rate, it has been growing the fastest of all
the education cohorts since 1995. Arora and Ricci (2005:24) indicated that the
inability of highly educated people to find a job may be an indication of labour market
rigidities.
3.4.5 Age group
Altman and Marock (2008:6) highlighted that youth unemployment is extremely high
in South Africa and approximately double the national unemployment rate. Youth
unemployment differs by race with unemployment rates that are highest among
African youth (50%–60%) and lowest among White youth (10%–20%) (Schoër,
Rankin & Roberts, 2012:24; Altman & Marock, 2008:10). South Africa’s
unemployment crisis is therefore seen as a youth unemployment crisis in particular.
It is therefore evident from the above that Africans, rural people, uneducated people,
young women and youth under the age of 24 years are most likely to be unemployed
in South Africa (NYP, 2009:13).

55
3.5 REASONS FOR UNEMPLOYMENT
Unemployment inhibits the economic growth of a nation and contributes to the
problem of on-going poverty, which cannot be lessened without that growth (Altman
& Marock, 2008:6). Unemployment is also accompanied by costs to the unemployed
and society. These costs include financial ruin and significant mental and physical
health problems to the individuals affected as well as societal problems, including
increased poverty, crime, debt, and political instability (Grosso & Smith, 2011:79).
Therefore the causes of unemployment need to be identified in order to rectify it.
Several causes of unemployment are cited in the extensive literature on South
Africa’s labour market. Banerjee et al. (2008), Kingdon and Knight (2007), Bhorat and
Oosthuizen (2005), Bhorat and Leibbrant (1998) provide a good overview. In
summary, these causes include:
3.5.1 Weak economic growth rate
The South African economy averaged about 3% growth a year since 2009 and with
the slowdown in the global economy, real GDP growth is likely to fall to about 2.7% in
2012 (Gordhan, 2012:6). A recovery of 3.6% and a 4.2% growth rate is expected in
2013 and 2014. The present growth trajectory of about 3% per annum fails to reverse
the unemployment crisis in the labour market, because a growth rate of 6% or 7% per
annum is required to significantly reduced unemployment (Altman & Marock, 2008:6).
The pace of job creation (from a low base) is closely linked to the general growth rate
in the economy and in employment (Horn, 2006:116). If employment expanded more
rapidly, it is probable that the labour force would also grow more rapidly – people
would move to urban areas in search of work and people who are currently
discouraged would start looking (Altman & Marock, 2008:13). High unemployment
can therefore be contributed to weak economic growth.
Altman and Marock (2008:12) also noted that the rate of employment growth relative
to economic growth has been surprisingly high in the 2000s. This growth is evident in
Figure 3.6 and Figure 3.7. For every 1% in GDP growth, the SA economy generates
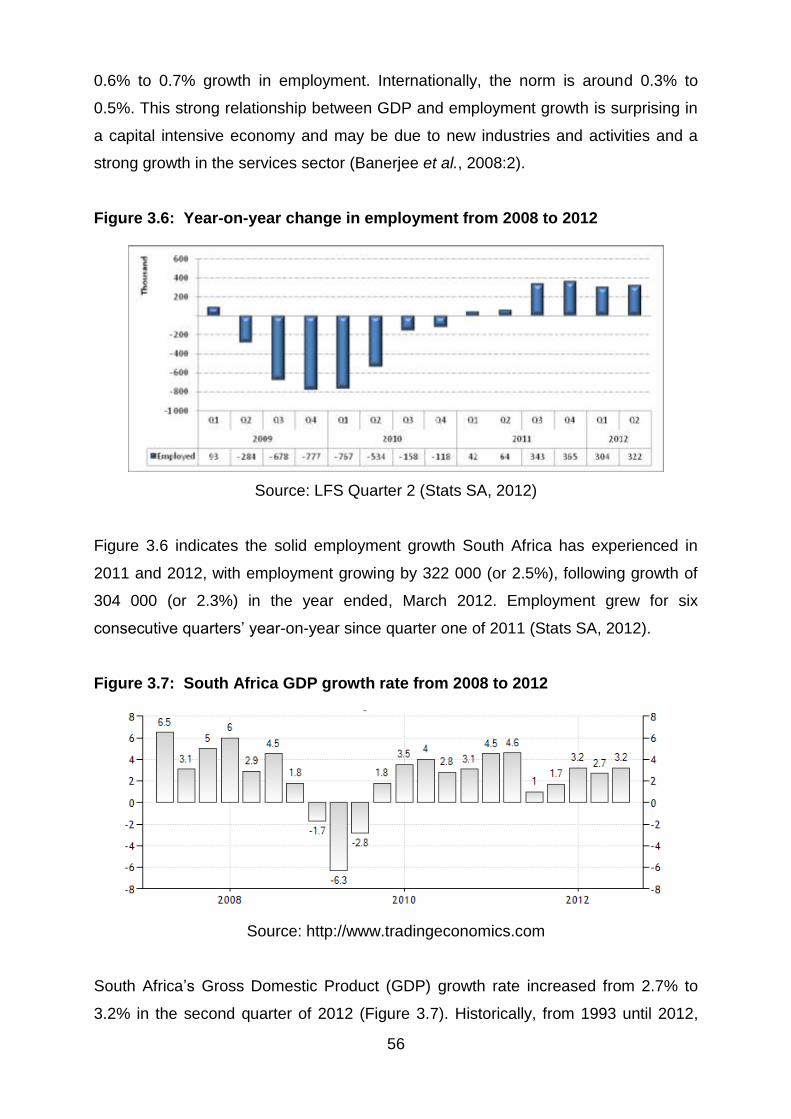
56
0.6% to 0.7% growth in employment. Internationally, the norm is around 0.3% to
0.5%. This strong relationship between GDP and employment growth is surprising in
a capital intensive economy and may be due to new industries and activities and a
strong growth in the services sector (Banerjee et al., 2008:2).
Figure 3.6: Year-on-year change in employment from 2008 to 2012
Source: LFS Quarter 2 (Stats SA, 2012)
Figure 3.6 indicates the solid employment growth South Africa has experienced in
2011 and 2012, with employment growing by 322 000 (or 2.5%), following growth of
304 000 (or 2.3%) in the year ended, March 2012. Employment grew for six
consecutive quarters’ year-on-year since quarter one of 2011 (Stats SA, 2012).
Figure 3.7: South Africa GDP growth rate from 2008 to 2012
Source: http://www.tradingeconomics.com
South Africa’s Gross Domestic Product (GDP) growth rate increased from 2.7% to
3.2% in the second quarter of 2012 (Figure 3.7). Historically, from 1993 until 2012,
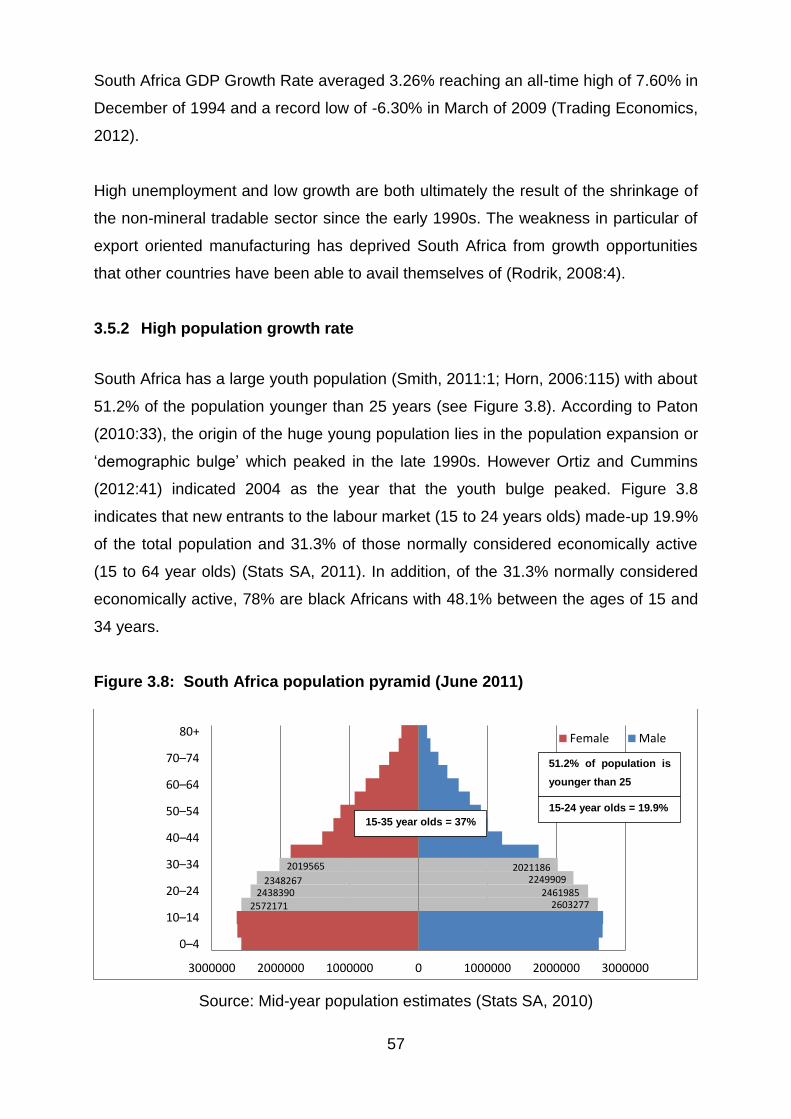
57
South Africa GDP Growth Rate averaged 3.26% reaching an all-time high of 7.60% in
December of 1994 and a record low of -6.30% in March of 2009 (Trading Economics,
2012).
High unemployment and low growth are both ultimately the result of the shrinkage of
the non-mineral tradable sector since the early 1990s. The weakness in particular of
export oriented manufacturing has deprived South Africa from growth opportunities
that other countries have been able to avail themselves of (Rodrik, 2008:4).
3.5.2 High population growth rate
South Africa has a large youth population (Smith, 2011:1; Horn, 2006:115) with about
51.2% of the population younger than 25 years (see Figure 3.8). According to Paton
(2010:33), the origin of the huge young population lies in the population expansion or
‘demographic bulge’ which peaked in the late 1990s. However Ortiz and Cummins
(2012:41) indicated 2004 as the year that the youth bulge peaked. Figure 3.8
indicates that new entrants to the labour market (15 to 24 years olds) made-up 19.9%
of the total population and 31.3% of those normally considered economically active
(15 to 64 year olds) (Stats SA, 2011). In addition, of the 31.3% normally considered
economically active, 78% are black Africans with 48.1% between the ages of 15 and
34 years.
Figure 3.8: South Africa population pyramid (June 2011)
Source: Mid-year population estimates (Stats SA, 2010)
2603277 2461985
2249909 2021186
2572171 2438390
2348267
2019565
3000000 2000000 1000000 0 1000000 2000000 3000000
0–4
10–14
20–24
30–34
40–44
50–54
60–64
70–74
80+Female Male
51.2% of population is
younger than 25
15-24 year olds = 19.9%
15-35 year olds = 37%
58
The prevalence of high unemployment rates of African youth reflects the growing
inflow of increasingly younger job seekers into the labour market combined with a low
outflow into employment due to the mismatch between low skill levels of the majority
of the African youth and decreasing demand for unskilled workers (Schoër et al.,
2012:2; Banerjee et al., 2008:3). It is therefore evident that the inability of the
economy to absorb the growing labour supply has outstripped demand (Pauw et al.,
2008:46).
3.5.3 Change in participation rate of women, legal and illegal migrants
The labour force participation increased with about 6% since the democratic election
in 1994 (Banerjee et al., 2008:5; Horn, 2006:115). Generally males are more likely to
participate in the labour market and less likely to be unemployed (Banerjee et al.,
2008:5). According to the most recent Labour Force Survey (June 2012), published
by Statistics South Africa, the labour force participation rate was at 54.5%, with
women at 47.9% and men at 61.3%. The labour absorption capacity for the total
economy was estimated at 40.9% with women at 34.7% and men at 47.3% (Stats
SA, 2012).
The number of illegal labour migrants is difficult to determine but has increased
substantially in the last two decades (Crush, 2011:5). Immigrants from Africa and
more specific from Zimbabwe come to South Africa in prospect of finding better
employment. Interesting to note is that despite the high unemployment rate in South
Africa, most irregular migrants are able to find jobs in the construction and service
sectors (Crush, 2011:15). The reason for this is that employers prefer non-South
African workers, since they can subvert labour laws, avoid paying benefits, violate
minimum wage legislation and ultimately they work much harder.
3.5.4 Role of the unions and labour market legislation
The share of employees who are members of a union was particularly concentrated
in sectors such as mining, manufacturing and electricity and among the highly skilled
such as professionals and technicians (Arora & Ricci, 2005:25). As unions become
59
larger however, their bargaining power may affect the ability of small firms to recruit
labour.
The South African government made four major changes in labour market regulation
since 1995. The main regulatory reforms have been the Labour Relations Act (LRA)
of 1996 which, among many other things, focuses on workers’ rights to organise,
conflict resolution and hiring and firing laws. The Basic Conditions of Employment Act
(BCEA) of 1997 focuses on better working conditions for all workers who are
employed and workers’ rights in the workplace, among other things. The Employment
Equity Act seeks to correct racial imbalance through, among other things, affirmative
action and the Skills Development Levy of 1998 seeks to encourage firms to provide
more worker-training (Lewis, 2002:12).
Although these regulations improved labour relations and helped raised labour
productivity, most firms adjusted to these regulations by hiring fewer workers or using
more machinery (Lewis, 2002:5).
3.5.5 Minimum wages and labour standards
Although South Africa’s real wage have not raised much since the transition to
democracy in 1994, the wages in the formal sector are quite high by the standards of
countries at similar income levels (Rodrik, 2008:3). The long-term increase in real
wages directly dampens labour demand, a significant factor in the lack of
employment growth among unskilled and semi-skilled workers (Lewis, 2002:13).
3.5.6 Education system
The biggest contributor to youth unemployment is the education system that fails to
produce employable people with the skills required to navigate their way through the
modern labour market (Catholic Parliamentary Liaison Office, 2012:1; Development
Bank of Southern Africa, 2011:5; National Treasury, 2011:16).
The link between education and unemployment is undeniable:
Almost 95% of the unemployed have no tertiary education.

60
Almost 30% to 40% have completed a secondary education.
Almost 60% have less than secondary education (Catholic Parliamentary
Liaison Office, 2012:2).
The education system generally fails to prepare young people with fundamental
literacy, numeracy, problem solving, and critical thinking skills, neither does it
encourage acquisition of values such as a work ethic and self-discipline that are
required in the workplace (Development Bank of Southern Africa, 2011:5). Although
we currently live in an information and service era, learners are educated and
prepared to be successful in an industrial economy (Olivier as quoted by Horn,
2006:118). The content of school textbooks are out-dated and strengthen the
argument that a vacuum developed between the education system and the job
market (Horn, 2006:119).
3.5.7 Structural changes
Structural changes of the economy led to job losses in the agricultural and mining
sector. The financial and business services altered the composition of employment in
terms of educational attainment where the demand for skilled workers is higher
(Banerjee et al., 2008:10; Field, 2000:8). Other factors related to apartheid
necessitate firms to invest in capital-intensive rather than labour-intensive activities.
This argument is also supported by Horn (2006:116) that highlights that as a result of
technology and international competition South Africa had to become more capital
and skill intensive.
Structural change of the economy led to a production decline in tradable sectors
where employment is traditionally generated. The non-tradable sectors such as
finance and business services grew the most, but they are primarily skilled labour
intensive (Banerjee et al., 2008:10; Rodrik, 2008:4). Horn (2006:118) also argues that
the effect of structural unemployment and technological developments in South Africa
highlights the deficiencies in the country’s education system.
61
3.6 OVERVIEW OF YOUTH UNEMPLOYMENT
Youth unemployment is a global phenomenon (Smith, 2011:4) with young people
aged 15 to 24 that are three times more likely to be unemployed (Altman & Marock,
2008:10). Youth unemployment varies from one country to another, but according to
Du Toit (2003:4), there are some common features: (1) youth unemployment is
higher than adult unemployment in most countries, (2) there is a strong link between
youth unemployment and adult unemployment, (3) upsets in the aggregate labour
market have a more pronounced effect on youth unemployment, and (4) there is a
link between (un)employment and economic growth.
3.6.1 Youth unemployment worldwide
The financial crisis has increased global unemployment to 200 million people of
which 75 million are young people between the ages of 16 to 24, an increase of more
than four million since 2007 (Ortiz & Cummins, 2012:1). Although the global
economic crisis only worsened pre-existing trends such as a lack of sufficient jobs
and rising vulnerable employment, many countries experience a youth bulge (Ortiz &
Cummins, 2012:6). The population cohort between 15 to 24 years old is increasing
significantly compared to other age groups, whereas employment opportunities did
not increase at the same rate.
Each year approximately 121 million 16 year olds become eligible to enter the world’s
labour market, but most of those that want to work are unable to find jobs. Although
many young persons will hopefully continue their education and enhance their
careers with a technical or university degree, many may not have this opportunity.
High youth unemployment means young people are not acquiring the skills or
experience needed to drive the economy forward (National Treasury, 2011:9). It is
thus evident that millions of jobs need to be created just to meet the growing supply
of young job seekers (Ortiz & Cummins, 2012:6).
62
3.6.2 Youth unemployment in South Africa
Although youth unemployment is a global problem it poses a special problem for
South Africa were at least half of young school leavers are unlikely to find work
before the age of 24 (Smith, 2011:4; Altman & Marock, 2008:6). Youth in South Africa
are twice as likely to be unemployed, with the 15 to 24 age group accounting for 31%
of aggregate unemployment and the 25 to 34 age group for 41% (Stats SA, 2012)
and if race is taken into consideration, the majority of the unemployed youth are
young Africans between the age group 25 to 34 years (Schoër et al., 2012:2; Altman
& Marock, 2008:10; Du Toit, 2003:9). South Africa’s unemployment crisis is therefore
seen as a youth unemployment crisis in particular.
Youth unemployment in South Africa is acute and has worsened significantly over the
last two years as a result of the recession (National Treasury, 2011:7). In times of a
recession unemployment can be a special problem, because school-leavers are
competing with more jobseekers for fewer vacancies, while the youth already in the
labour market are generally among the first to lose their jobs (Morsy, 2012:16;
Choudhry et al., 2010:4). New entrants are therefore vulnerable and in a weak
position, especially those with low (vocational) qualifications (De Lange et al.,
2012:530).
3.7 REASONS FOR YOUTH UNEMPLOYMENT
3.7.1 Youth poverty
Poverty tends to reproduce itself among children and young people from already
impoverished families (Morrow, Panday & Richter, 2005:10). Conditions of poverty
further hamper access to basic services for large numbers of young people living in
poor households and constrain their ability to take up opportunities offered in the
context of South Africa’s social development approach (NYP, 2009:14).

63
3.7.2 School dropout rate
The school dropout rate in South Africa is a large problem (Lam et al., 2011:4).
According to the National Treasury’s’ report, almost 86% of unemployed youth did
not stay in school beyond Grade 12, while two-thirds have never worked (Paton,
2010:32). Over the past five years, the continuation rate from Grade 11 to Grade 12
has averaged 67% (National Treasury, 2011:13). The Solidarity Research Institute
report (Solidarity Research Institute, 2011) highlighted the incomplete schooling and
low continuation rate of many young South African’s. This might explain why the
education level change so slowly.
However, individuals who have completed some level of tertiary qualification are two
to three times more likely to be formally employed than those with matric or less (see
Figure 3.9). As illustrated in Figure 3.9 pupils with a grade 8 (red line) and those with
no formal training (blue line) have an absorption rate of approximately 30%. The
absorption rate increase to almost 50% for pupils with matric as highest qualification
and for those with tertiary training approximately 80% (Solidarity Research Institute,
2011:9). It is therefore evident that tertiary training does improve a person’s chance
to find employment (National Treasury, 2011:17; Smith, 2011:11; Solidarity Research
Institute, 2011:12).
Figure 3.9: Absorption rate according to training level from 2008 to 2011
Source: Solidarity Research Institute (2011:11)
64
3.7.3 Resource constraints
The youth lack labour market information, job search capabilities, access to the main
information networks in the labour market, experience with the processes of applying
for jobs, mobility and resources, which makes it hard for them to get a secure and
stable job as compared to the established labour workforce (De Lange et al.,
2012:530; Du Toit, 2003:4). They therefore stay close to home where jobs may not
be that readily available (Altman & Marock, 2008:12; Du Toit, 2003:4).
3.7.4 Struggle to gain work experience
An important reason why joblessness is so high among the youth is that young
people struggle to gain work experience, which is an important signal of ability to
potential employers (Klasen & Woolard, 2009:8). This could explain the large number
of young South Africans who are unemployed and the significant numbers who spend
sustained periods without a job after leaving education (National Treasury, 2011:14).
Research have shown that individuals who have never held a job before are 35%
more likely to be unemployed than those who have had prior work experience (Smith,
2011:9; Klasen & Woolard, 2009:8; Altman & Marock, 2008:12).
In addition, many young people lack the skills employers need, often because of the
backward-looking education systems. Education matters and the consequences of an
economic crisis are usually more dramatic for low-skilled youth, already in great
difficulties in good times, since the crisis further increases their risk of long-term
inactivity and exclusion (Morsy, 2012:16). Therefore the lack of skills underpins
employability (Altman & Marock, 2008:11).
3.7.5 Sectoral minimum wage
Many countries differentiate minimum wages by age through the inclusion of sub-
minima for youths, however this is not the case for South Africa. The minimum wage
in South Africa therefore does not account for the lower productivity of younger
workers. This exacerbates the implicit gap between entry-level wages and
65
productivity and hinders the hiring of younger workers (National Treasury, 2011:17;
OECD, 2010).
3.8 EFFECT OF UNEMPLOYMENT
3.8.1 Physical and psychological effect
Work is an essential source of identity (Jahoda, 1982 as sited by De Witte, Rothman
& Jackson, 2012:236) and provides people with the feeling of self-worth and self-
esteem as they experience a feeling of mastery and self-fulfilment when they
successfully engage in work activities (Du Toit, 2003:2). Work also provides dignity,
independence, accomplishment innovation, satisfy creative urges and provide an
avenue for achievement and self-realisation (Sharma, 2012:539; National Treasury,
2011:9).
An unemployed individual may experience physical symptoms such as: head and
stomach aches, sleeping problems, a lack of energy, hypertension, heart and kidney
disease (De Witte et al., 2012:235). Unemployment may also result in a range of
stress-related consequences for the individual including hostility, depression, anxiety,
anger, fear, despair, loneliness, social isolation and even suicide (Wanberg,
2012:370; De Witte et al., 2012:236). Studies found evidence that spells of
unemployment for a young person often hurt the individual’s happiness, job
satisfaction and health for many years thereafter (Morsy, 2012:16; De Witte et al.,
2012:236).
3.8.2 Economic perspective
People work to sustain themselves and their dependents in order to fulfil certain
primary needs (Du Toit, 2003:2). Consumer spending from unemployed workers
reduces business revenue, which forces them to cut more payrolls to reduce their
costs (Pervaiz, Zainab Saleem & Sajjad, 2012:2558). High youth unemployment
therefore means young people are not contributing to drive the economy forward.
This inhibits the country’s economic development and imposes a larger burden on
the state to provide social assistance (National Treasury, 2011:7). If high national
66
unemployment continues, it can deepen a recession or even cause a depression (Du
Toit, 2003:2).
3.8.3 Scarring effects
The negative long-term consequences of early unemployment are known as the
“scarring effects” and the longer a person is unemployed, the longer the scarring
effect are likely to last (Morsy, 2012:16). People who are unemployed for a long time
struggle not only with a loss of financial well-being, but also with a likely deterioration
of their re-employment prospects (Valletta & Kuang, 2012:1; Du Toit, 2003:12).
3.8.4 Social problems
In addition unemployment is associated with social problems such as poverty, crime,
violence, a loss of morale, social degradation and political disengagement (National
Treasury, 2011:7). Unemployment can let to an increase in crime and frustration that
is express through violence (Fallahi, Pourtaghi & Rodriguez, 2012:440-441; Gouws,
2002:41). Over a third of the prison population in South Africa is under the age of 26,
reflecting a high incidence of crime among the youth (Clark, 2012:78; Mahadea et al.,
2011:67).
The effect and consequences of unemployment are clear, but the question remains,
what can be done to relieve the distress of this group (Du Toit, 2003:15).
3.9 YOUTH DEVELOPMENT, POLICIES AND SUPPORT STRUCTURES
Mayer, Gordhan, Manxeba, Hughes, Foley, Maroc, Lolwana and Nell (2011:6)
highlighted that since 1994, significant effort has been invested in developing a
national youth development strategy that would ensure that the generation deeply
affected by apartheid would have an opportunity to participate fully in the South
African economy and society.
Several youth legislative policy frameworks were also undertaken such as:
The National Youth Commission (NYC), Act No. 19 of 1996.
67
The National Youth Policy (NYP) 2000.
The National Youth Development Policy Framework (NYDPF) 2002/2007.
The revised National Youth Policy (NYP) 2009-2014.
Despite these efforts, youth unemployment and marginalisation remain
disconcertingly high at present (Mayer et al., 2011:6). The magnitude of the youth
employment challenge facing South Africa means it cannot be resolved by a single
employment policy. A combination of interventions, or multi-pronged approach, is
likely to offer the greatest potential for young people to gain decent work
opportunities and alleviate youth unemployment (Morsy, 2012:17; Du Toit, 2003:15).
The following government interventions are currently utilised to facilitate young
people’s access to the labour market: formal education; public employment and
development programmes; services available to the youth and entrepreneurship
interventions.
3.9.1 Formal education
3.9.1.1 Schooling system
The schooling system is by far the most significant system supporting young people’s
development in South Africa (Mayer et al., 2011:24). The following improvements are
highlighted:
The access and retention rate in the basic education sub-system has
improved with almost 98% of children between the ages of 7 to 15 attending
school and only 10% of children aged 16 to 18 are reported to be out of
school. Despite high enrolment in basic education, there is a growing concern
with the low progression rate of learners and the quality of education (IYDS,
2011:20).
In 2010 about 8 million (68%) learners where enrolled at 19 000 no-fee
schools (IYDS, 2011:20).
Government has implementing measures to improve the literacy and
numeracy, increase the number of quality passes in maths and science and
encourage the National Curriculum to offer vocational education options for
68
young South Africans in order to reduce drop-out rates after Grade 9 (Mayer et
al., 2011:24).
3.9.1.2 Vocational training
There are 50 Public Further Education and Training (FET) Colleges all over the
country, with about 264 campuses offering a range of programmes that cater for most
students’ needs and interests. Students who are enrolling for either the National
Certificate Vocational (NCV) or the NATED programmes (N Courses); will be able to
apply for bursaries at the college where they wish to study.
Funding available for vocational training
The Government has prioritised the provision of financial assistance to deserving
candidates via the National Student Financial Aid Scheme of South Africa (NSFAS).
The NSFAS is a loan and bursary scheme funded by the Department of Higher
Education (Anon., 2012:38). R1.7 billion is available for college bursaries in 2012
and is aimed at providing access to quality education and training at colleges for all
students who cannot afford to pay for their studies (Nzimande, 2012).
3.9.1.3 Higher education
South Africa’s 36 tertiary institutions merged successful into 23 national universities
and with the National Students Financial Aid Scheme (NSFAS) more students were
able to enrol at tertiary institutions. Although this intervention has contributed towards
growth in enrolment of African students, the graduation rate did not increase
exponentially across all population groups (IYDS, 2011:21). The IDYS report also
highlighted that unemployed graduates account for about 180 000 of unemployed
people, either because they are irrelevantly or inadequately trained.
Funding available for Higher education
The NSFAS offers loans and bursaries for students enrolled in first undergraduate
degrees and approximately R2.6 million are available for university loans for 2012
(Nzimande, 2012).

69
The NSFAS also administers the following bursary funds:
Funza Lushaka Bursary Programme is a multi-year programme that promotes
teaching in public schools. Full-cost bursaries are available to enable eligible
students to complete a full teaching qualification in an area of national priority.
Recipients of these bursaries will be required to teach at a public school for
the same number of years that they receive the bursary (Anon., 2012:38).
Social Work Bursaries are for those interested in studying social work and are
provided by the Department of Social Development. These bursaries also
have a work-back condition – i.e. the student works for the Department of
Social Development for the number of years for which they he received the
bursary (or longer) (Anon., 2012:38).
National Skills Fund Bursaries from the NSF are available for students with a
study focus in an area of scarce skills. Universities determine which students
qualify for these bursaries, to which no conditions are attached. Funding is
made available through a mandate of the Skills Development Act, 1998, and
provides bursary funding to undergraduate students in the following specific
scarce skills areas: Accounting, Financial Management, Actuarial Studies,
Auditing, Business Management, Economics, Physics, Computer Science,
Chemistry, Geology, Information Systems, Mathematical Sciences,
Agriculture, Statistics, Financial Accounting, Biotechnology and Engineering
(Anon., 2012:38).
3.9.2 Public employment and development programmes
3.9.2.1 Expanded public works programme
South Africa already has a policy commitment to public employment through the
Expanded Public Works Programme (EPWP) by the department of Public Works
(Philip, 2012:180). The EPWP is one of several government strategies aimed at
addressing unemployment in South Africa and is short-to-medium term programmes
aimed at the provision of additional work opportunities coupled with training (EPWP,
2012; National Treasury, 2011:18).
The Expanded Public Work Programme (EPWP) was launched in April 2004 to
promote economic growth and create sustainable development. The immediate goal

70
of the EPWP phase one (from 2004/05 to 2008/09) was to help alleviate
unemployment by creating at least one million work opportunities, of which at least
40% of beneficiaries will be women, 30% youth and 2% people with disabilities
(DPW, 2009). The second phase began in 2009, the targets have been significantly
increased to 4.5 million work opportunities, averaging 100 days’ work per opportunity
over five years to 2013/14 (Philip, 2012:180). It will remain a valuable short-term
measure to mitigate unemployment and poverty (Philip, 2012:180; National Treasury,
2011:18).
Philip (2012:180) highlighted that the core activities of the EPWP are tied to wider
processes of delivery and that it is hard to target the poorest areas where
unemployment is highest. Government’s delivery is typically the weakest in these
areas and the capacity to apply labour-based methods is often most constrained. A
complementary model for the delivery of public employment is required.
3.9.2.2 Community Works Programmes
The Community Work Programme (CWP) is a government programme aimed at
tackling poverty and unemployment (Department Of Cooperative Governance &
Traditional Affairs, 2012). The programme provides an employment safety net by
giving participants a minimum number of regular days of work, typically two days a
week or eight days a month, thus providing a predictable income stream (the daily
pay rate at present is R63.18) (TIPS, 2012).
The CWP was started to address the high unemployment and does not replace
government’s social grants programme, but supplements this. The programme is
targeted at unemployed and underemployed women and men of working age. The
programme aims to give those willing and able to work the opportunity to do so and
afford them the dignity and social inclusion that comes from it (Department Of
Cooperative Governance & Traditional Affairs, 2012).
Although the Expanded Public Works Programme creates many temporally jobs and
workers gain ‘valuable experience’ that should enable them to get jobs in the private
sector, these workers are however jobless again after a few months (Steyn,
2012:26).
71
3.9.2.3 Youth Economic Participation programme
The Youth Economic Participation (YEP) programme of the Department of Public
Enterprises (DPE) aims to coordinate the efforts of State Owned Companies (SOC)
under the Department of Public Enterprises, such as Eskom, Transnet, South African
Airways, Broadband Infraco, Alexkor, South African Express, the South African
Forestry Company and Denel, towards maximising their inputs towards youth
economic empowerment, focusing on: job-creation, skills development,
entrepreneurship development and corporate Social Investment (CSI) and related
initiatives (DPE, 2012).
3.9.2.4 Learnerships
Learnerships are structured programmes, integrating theoretical learning with
workplace experience and results in an NQF-registered qualification (NQF, 2012).
The implementation of these learnerships programmes are guided by the Skills
Development Act, aimed at developing the skills of the South African workforce and
to improve the quality of life of workers and their prospects of work (National
Treasury, 2011:18). Learnerships are linked to the Skills Development Strategy and
must be registered with the Department of Labour (DoL) and last between 12 and 18
months (NQF, 2012). Learnerships are partnerships between government, training
service providers and the private sector.
Learnerships are funded mainly from Sector Education and Training Authorities
(SETA) grants to employers, and are linked to tax incentives for employers. Currently
there is a maximum tax allowance of R30 000 on inception/registration and a further
maximum allowance of R30 000 on completion of training (NQF, 2012; National
Treasury, 2011:20). The learnerships incentive operates as a type of employment
subsidy since it lowers the cost of employing jobless individuals.
3.9.2.5 National Rural Youth Service Corps programme
The National Rural Youth Service Corps (NARYSEC) is a youth skills development
and employment programme, aim to train the youth through specifically developed
programmes linked to community needs in rural areas, to develop youth with
multidisciplinary skills through civic education, capacitate youth in retaining
knowledge and technical skills acquired during training and to increase the number of

72
rural communities receiving support in their self-development through the
Comprehensive Rural Development Programme (CRDP) (NARYSEC, 2012).
3.9.3 Services available to the youth
3.9.3.1 National Youth Service
The National Youth Service (NYS) is a national project that is aimed at engaging
young people in a disciplined process of a valued and necessary service to the
community in which they live, while increasing their own skills, education and
opportunities to generate income (NYS, 2012). The National Youth Service offers
young people the chance of structured learning and personal development, preparing
them for opportunities to further their studies, obtain formal employment or venture
into self-employment.
Unemployed youth aged between 18 and 35 with a grade 10, 11 and 12 certificate
are legible to participate in the National Youth Service project. The skills category
offered by the National Youth Service include: technical and life skills and health
sector (NYS, 2012). The National Youth Service differs from learnerships and
internships because emphasis is placed on community services and civic duty with
volunteers rendering for small stipend.
3.9.3.2 National Youth Development Agency
The National Youth Development Agency (NYDA) was formally launched on 16 June
2009, aimed at creating and promoting co-ordination in youth development matters
(Anon., 2012:36). The National Youth Development Agency results from the merger
of the National Youth Commission and the Umsobomvu Youth Fund (NYDA, 2012).
The National Youth Development Agency also provides a number of services that
aim to facilitate the job search and match jobs to the requirements of young work
seekers (Anon., 2012:36; National Treasury, 2011:18). These include:
The Graduate Development Programme (GDP) and Job Preparation Programme
(JPP) aim to enhance the employability of jobless graduates and matriculants by

73
providing job preparation and job development support that helps young people
find work placements (National Treasury, 2011:23).
The National Youth Service assists unemployed youth to acquire skills while
providing community services (National Treasury, 2011:23).
The Jobs & Opportunity Seekers and Graduate Database provide an online job-
linking service which employers can use to find staff and on to which work
seekers can load their CVs (National Treasury, 2011:23).
Youth Advisory Centres (YACs) are walk-in centres established within
communities, where young people can access all National Youth Development
Agency (UYF) products and services including career counselling (National
Treasury, 2011:23).
3.9.4 Entrepreneurship interventions
Since the late 1990s, the government has invested significant resources into growing
the entrepreneurial capacities of its citizens, alongside understanding what is
required to create an enabling environment for entrepreneurs (Mayer et al., 2011:32).
The National Youth Development Agency is responsible for overseeing and
monitoring these interventions for young people, including the provision of loans for
young entrepreneurs, business development services, potential support for youth
cooperatives and the introduction of youth entrepreneurial training in schools (Mayer
et al., 2011:32).
Unfortunately, most entrepreneurs are not aware of these government programmes,
specifically designed to help them. There is little information on the types of financial
products available to entrepreneurs as well as the procedure to apply for these
products. Hence, there is a major gap in youth entrepreneurial training, which needs
to be addressed if self-employment is to provide a pathway into employment for
young people (Mayer et al., 2011:32).
This present government interventions to address youth unemployment shows that
existing programmes are not designed well enough to address the needs of young
people wanting to enter the labour market and are also woefully inadequate.

74
3.10 PRIVATE SECTOR INITIATIVES
3.10.1 South African Graduates Development Association
South African Graduates Development Association (SAGDA) is a non-profit
organisation aiming to prepare students for the world of work and empower
graduates to actively participate in the mainstream economy of our country and the
globe (SAGDA, 2012). The South African Graduates Development Association
partners with private and public universities, FET colleges, SETA, municipalities and
companies to champion the empowerment of graduates through high impact
programmes.
Special projects include: career management, encyclopaedia of scarce & critical
skills, student inventions and innovation, promoting graduates with disabilities,
internship placement and management, reliable graduate database, top graduates
magazine, graduate employability assessment sessions and graduate empowerment
seminars (SAGDA, 2012).
3.10.2 Youth Entrepreneurship Program
The Youth Entrepreneurship Program (YEP) has been launched in South Africa in
association with the Dad Fund and various institutions of higher learning in the United
States of America (USA). The Youth Entrepreneurship Program was launched as an
initiative to assist young entrepreneurs to harness their leadership skills and to
sharpen their business skills by offering exchange and mentorship programmes with
USA-based tertiary intuitions and businesses. A six week mentorship/exchange
period is offered for South African entrepreneurs to be placed with specific institutions
as part of a skills development program (YEP, 2012).
3.10.3 Junior Achievement SA
Junior Achievement South Africa (JASA) is a nationwide, non-profit organisation that
offers experiential entrepreneurial business, financial literacy and workplace
readiness programmes for young people. JASA has educated young South Africans
75
across the country for the past 32 years in the fields of business and entrepreneurial
skills through practical, experiential programmes (JASA, 2012).
JASA runs three programmes to encourage youth entrepreneurship.
Enterprise Dynamics Programme (EDP) is school based and is suitable for
learners from Grade 1 to Grade 12. Teachers use games, simulation activities,
projects and role-play to help youngsters develop an understanding of the
economy and business.
Mini-Enterprise Programme aims to provide business and life skills training for
senior secondary school learners. These skills will help them participate in
corporate and industrial employment and/or start their own businesses. Learners
are recruited from different cultural backgrounds. After participating in the
programme, learners get an opportunity to write the international enterprise exam
conducted by the Cambridge University in the United Kingdom (JASA, 2012).
Business Establishment and Sustainability Programme (BESP) helps young
people who have not finished school and cannot find work. The programme trains
youths to set up and sustain their own job opportunities. Other services offered
include: business plan development, help to access credit, establishing of
businesses, counselling and mentoring (JASA, 2012).
3.10.4 Entrepreneurship competitions
There are also many local business competitions targeting young people. To name
only a few:
The annual Enablis Business LaunchPad competition.
The annual National Innovation Fund Competition.
South African Breweries’ Kickstart Enterprise Development Initiative (Simplybiz,
2012).
76
3.11 SUMMARY
Although South Africa made positive progress since 1994, many challenges still need
to be address. The high unemployment rate of 24.9% and the continued failure to
create employment at the scale required must be a priority for the South African
government because despite the progress there are just not enough job
opportunities. To create more jobs, it is critical for the economy to achieve more
rapid, sustained and inclusive growth.
The South African economy needs to grow at a rate of 6% to 7% to significantly
reduce the country's high unemployment rate, unfortunately South Africa’s current
economic climate does not favour employment and when jobs are scarce young
people are more likely to be unemployed because of their lack of appropriate skills,
work related capabilities and experience.
Unemployment imposes significant costs on the individual, society and a country. Not
only are unemployed individuals not acquiring important skills and experience
needed to provide for themselves and their families, the economy are robbed from
useful talent and economic growth that are needed to elevate the on-going poverty
and societal problems.
Part of the explanation is that unemployment in South Africa is structural in nature
and economic growth has not been high enough over the last 30 years to generate
sufficient employment and to create jobs, especially in the unskilled and semi-skilled
labour category. The South African economy has been undergoing a structural
transformation into a new so-called ‘service-economy’ and the main focus in the
workplace has shifted away from activities based in the primary sector of agriculture
and mining towards the more knowledge-based secondary and tertiary sectors.
Several causes of unemployment are identified and include: weak economic growth
rate, high population growth rate, change in participation rate of women and legal and
illegal migrants, role of unions and labour market legislation, minimum wages and
labour standards, the education system and structural changes.
77
Unemployment is particularly concentrated among historically disadvantaged groups
and is higher among the rural, female, uneducated, and young segments of the
population. Youth in South Africa are twice as likely to be unemployed with the 15 to
24 age group, accounting for 31% of aggregate unemployment and the 25 to 34 age
group for 41%. Youth unemployment in South Africa is acute and has worsened
significantly over the last two years as a result of the recession.
Reasons for the high youth unemployment in South Africa are identifies as; youth
poverty, the school drop-out rate, resource constraints, struggle to gain work
experience and sectoral minimum wage. Unemployment has a negative effect, not
only for the individual but also on the community and economy. Long-term
unemployment can also lead to the “scarring effect” and people who are unemployed
for a long time struggle not only with a loss of financial well-being, but also with a
likely deterioration of their re-employment prospects
In addition unemployment is associated with social problems such as poverty, crime,
violence, a loss of morale, social degradation and political disengagement.
Unemployment can let to an increase in crime and frustration that is express through
violence.
Addressing youth unemployment requires both short- and long-term measures that
encompass increasing demand for labour, improving education and skills, and labour
market interventions that improve the employability of young people. Therefore many
more people need to be provided with the opportunity to work and make a productive
contribution to the economy and society. School leavers and new entrants to the job
market need to be aware of the realities of the changing market conditions in South
Africa and should consider enhancing their employment prospects by taking the
entrepreneurial path as job-creators rather than job-seekers.

78
CHAPTER 4
GATHERING OF DATA, RESULTS AND DISCUSSION
4.1 INTRODUCTION
This section of the study describes the gathering of data from participating schools,
the statistical analysis of the data and the presentation and discussion of the results.
Invitations to participate in the study were sent to Principals of 66 secondary schools
identified by the Department of Education (DoE) in the demarcated area
(Lejweleputswa District, Free State province). The invitation included a short
questionnaire for completion by each principal with provision for the school’s details,
an option to participate in the study and the total number of grade 12 learners for
2012 as well as the most convenient time to visit the school (see Appendix A).
The response on the invitation was very poor, therefore 15 schools were randomly
selected and contacted to participate in the study. At the end, 10 schools were willing
to participate in the study. Thereafter, an appointment was made by telephone with
the 10 schools to gather the data. The 10 schools represented 15.15% of the total
population of 66 schools with a total number of 655 grade 12 learners for 2012.
The data analysis commenced with the data being captured and summarised. The
data was then presented in tabular form and appropriate graphs to allow accurate
analysis of the data.
This chapter discusses the questionnaire, as well as the process that was adopted to
collect the data from the participating schools. It further captures the responses of the
various schools’ grade 12 learners and the completing of the questionnaires. The
chapter will conclude with the presentation and discussion of the empirical data
captured.
79
4.2 GATHERING OF DATA
In this section the questionnaire utilized in this study will be discussed, as well as the
study population, the sample and the process of gathering the information.
4.2.1 The ‘General Enterprising Tendency’ questionnaire
The purpose of qualitative research is to evaluate objective data consisting of larger
numbers based on statistical significance (Welman, Kruger & Mitchell, 2005:6). For
the purpose of this study, the General Entrepreneurial Tendency (GET) questionnaire
developed by (Caird, 1991) was utilised. Refer to par. 2.12 for a comprehensive
discussion of the questionnaire.
4.2.2 Method of data gathering
Data was gathered during school hours under the supervision of the responsible
teacher. Learners were informed, prior to the questionnaires being handed out, that
participation in the study was not compulsory and that anonymity will be ensured.
The responsible teacher provided supervision during completion of the
questionnaires, but did not intervene in the presence of the researcher.
4.2.3 Sample size
All the responding schools participated in the study over a period of two weeks in
August 2012 (10 schools from a population of 66 schools (10/66): 15.15%). A total of
530 questionnaires (n = 530) were completed, translating into 80.92% (530/655) of the
targeted sample size. All the participating schools generated fewer responses for
reasons that were not disclosed.
4.2.4 Statistical analysis of data
The Statistical Consultation Services of the North-West University, Potchefstroom
campus, conducted the statistical analysis of the data. The findings of the statistical
analysis will be discussed in this chapter.

80
4.3 RESULTS OF THE DEMOGRAFIC PROFILE
The demographic profile of the sample includes school, age, gender, home language
and ethnic grouping (see Appendix C).
4.3.1 School distribution of respondents
Purpose of the question
The purpose of the question regarding the school distribution of respondents (refer to
Appendix C) was to determine the school distribution of respondents in order to make
comparisons between the schools’ enterprising tendencies.
Results obtained
Table 4.1 presents the school distribution of the respondents.
Table 4.1: School distribution of respondents
School Total Percentage
Senzile Combined School 61 11.5%
Aramela Combined School 29 5.5%
Boshof Combined School 59 11.1%
Taiwe Secondary School 46 8.7%
Theunissen Combined School 18 3.4%
Winburg Combined School 27 5.1%
Naledi-Ya-Botjabela Secondary School 43 8.1%
Ipopeng Secondary School 40 7.5%
Marematlou Secondary School 119 22.5%
Hentie Cilliers High School 88 16.6%
Total 530 100.0%
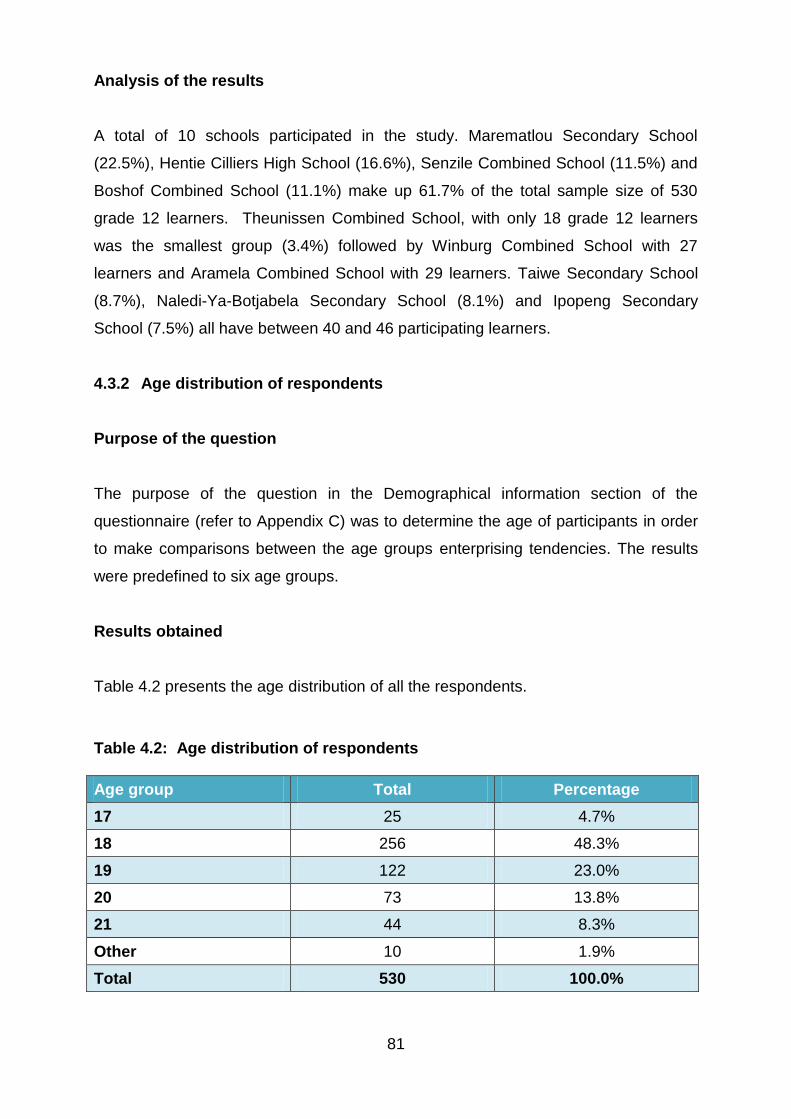
81
Analysis of the results
A total of 10 schools participated in the study. Marematlou Secondary School
(22.5%), Hentie Cilliers High School (16.6%), Senzile Combined School (11.5%) and
Boshof Combined School (11.1%) make up 61.7% of the total sample size of 530
grade 12 learners. Theunissen Combined School, with only 18 grade 12 learners
was the smallest group (3.4%) followed by Winburg Combined School with 27
learners and Aramela Combined School with 29 learners. Taiwe Secondary School
(8.7%), Naledi-Ya-Botjabela Secondary School (8.1%) and Ipopeng Secondary
School (7.5%) all have between 40 and 46 participating learners.
4.3.2 Age distribution of respondents
Purpose of the question
The purpose of the question in the Demographical information section of the
questionnaire (refer to Appendix C) was to determine the age of participants in order
to make comparisons between the age groups enterprising tendencies. The results
were predefined to six age groups.
Results obtained
Table 4.2 presents the age distribution of all the respondents.
Table 4.2: Age distribution of respondents
Age group Total Percentage
17 25 4.7%
18 256 48.3%
19 122 23.0%
20 73 13.8%
21 44 8.3%
Other 10 1.9%
Total 530 100.0%
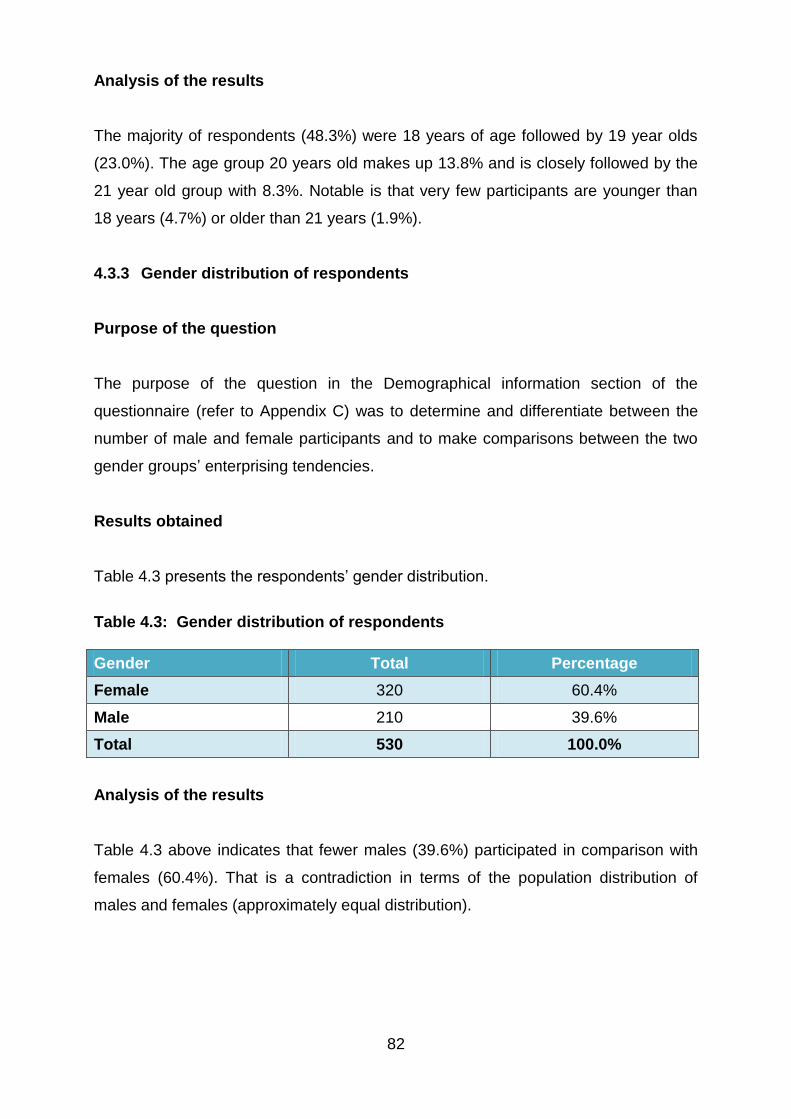
82
Analysis of the results
The majority of respondents (48.3%) were 18 years of age followed by 19 year olds
(23.0%). The age group 20 years old makes up 13.8% and is closely followed by the
21 year old group with 8.3%. Notable is that very few participants are younger than
18 years (4.7%) or older than 21 years (1.9%).
4.3.3 Gender distribution of respondents
Purpose of the question
The purpose of the question in the Demographical information section of the
questionnaire (refer to Appendix C) was to determine and differentiate between the
number of male and female participants and to make comparisons between the two
gender groups’ enterprising tendencies.
Results obtained
Table 4.3 presents the respondents’ gender distribution.
Table 4.3: Gender distribution of respondents
Gender Total Percentage
Female 320 60.4%
Male 210 39.6%
Total 530 100.0%
Analysis of the results
Table 4.3 above indicates that fewer males (39.6%) participated in comparison with
females (60.4%). That is a contradiction in terms of the population distribution of
males and females (approximately equal distribution).
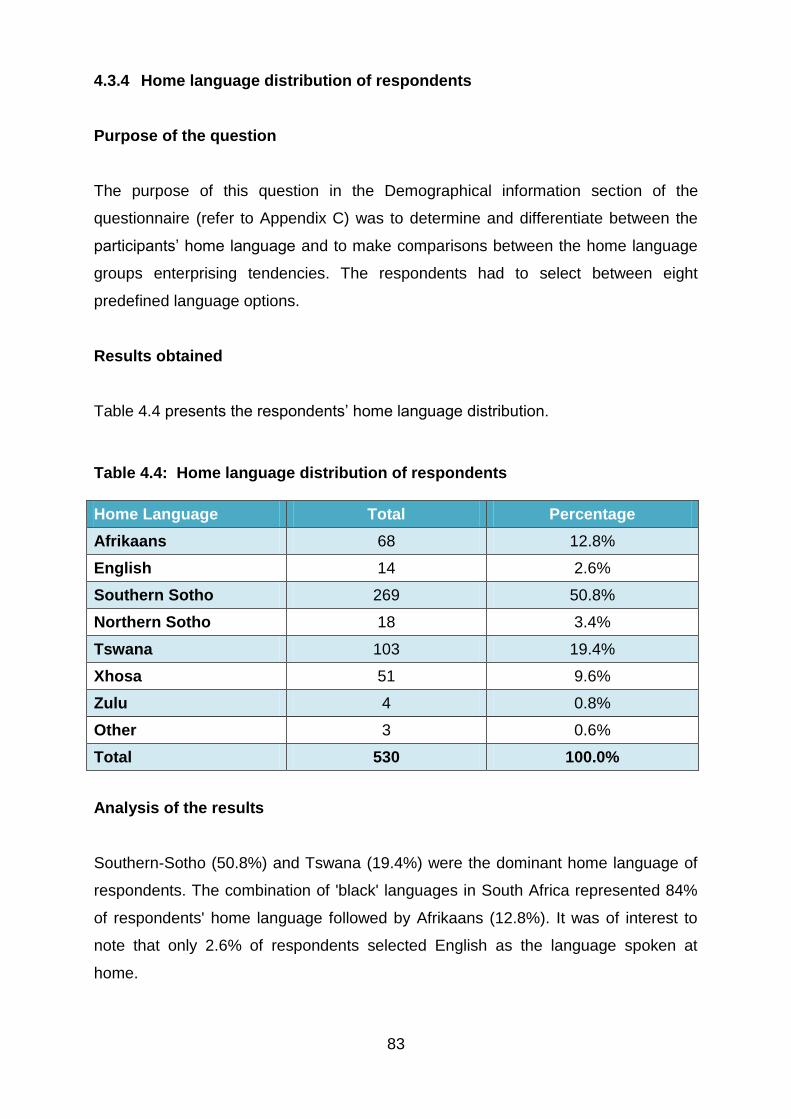
83
4.3.4 Home language distribution of respondents
Purpose of the question
The purpose of this question in the Demographical information section of the
questionnaire (refer to Appendix C) was to determine and differentiate between the
participants’ home language and to make comparisons between the home language
groups enterprising tendencies. The respondents had to select between eight
predefined language options.
Results obtained
Table 4.4 presents the respondents’ home language distribution.
Table 4.4: Home language distribution of respondents
Home Language Total Percentage
Afrikaans 68 12.8%
English 14 2.6%
Southern Sotho 269 50.8%
Northern Sotho 18 3.4%
Tswana 103 19.4%
Xhosa 51 9.6%
Zulu 4 0.8%
Other 3 0.6%
Total 530 100.0%
Analysis of the results
Southern-Sotho (50.8%) and Tswana (19.4%) were the dominant home language of
respondents. The combination of 'black' languages in South Africa represented 84%
of respondents' home language followed by Afrikaans (12.8%). It was of interest to
note that only 2.6% of respondents selected English as the language spoken at
home.
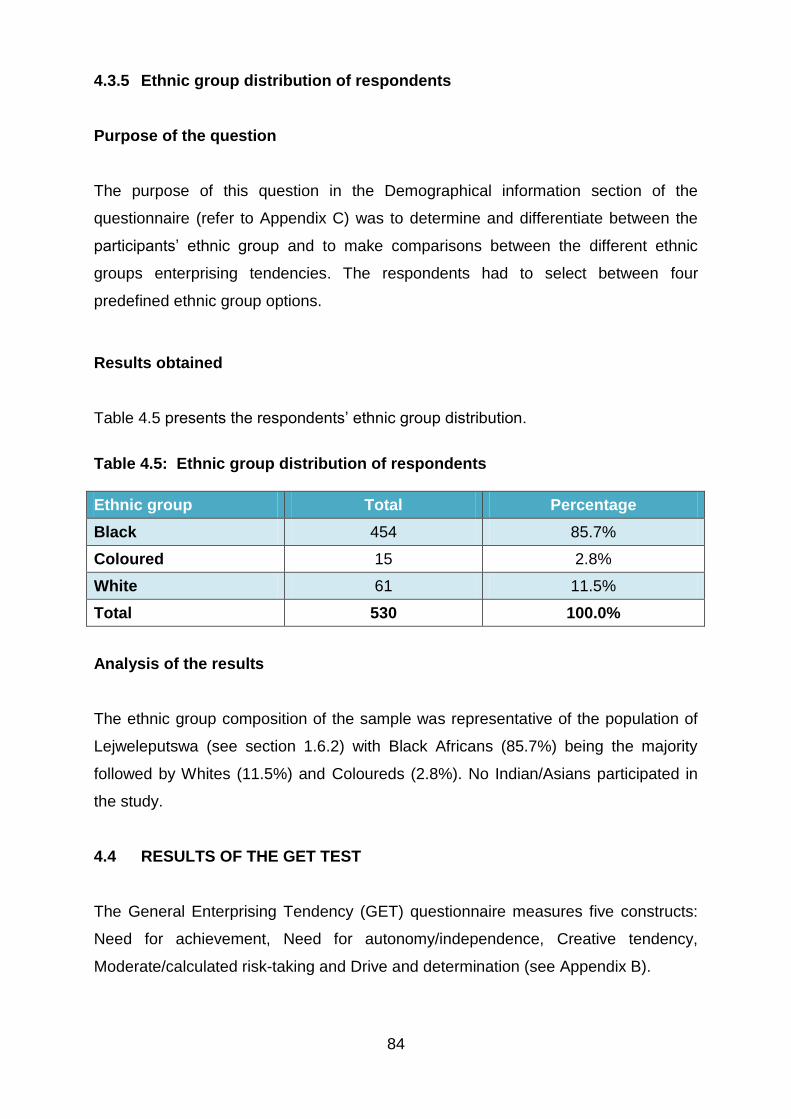
84
4.3.5 Ethnic group distribution of respondents
Purpose of the question
The purpose of this question in the Demographical information section of the
questionnaire (refer to Appendix C) was to determine and differentiate between the
participants’ ethnic group and to make comparisons between the different ethnic
groups enterprising tendencies. The respondents had to select between four
predefined ethnic group options.
Results obtained
Table 4.5 presents the respondents’ ethnic group distribution.
Table 4.5: Ethnic group distribution of respondents
Ethnic group Total Percentage
Black 454 85.7%
Coloured 15 2.8%
White 61 11.5%
Total 530 100.0%
Analysis of the results
The ethnic group composition of the sample was representative of the population of
Lejweleputswa (see section 1.6.2) with Black Africans (85.7%) being the majority
followed by Whites (11.5%) and Coloureds (2.8%). No Indian/Asians participated in
the study.
4.4 RESULTS OF THE GET TEST
The General Enterprising Tendency (GET) questionnaire measures five constructs:
Need for achievement, Need for autonomy/independence, Creative tendency,
Moderate/calculated risk-taking and Drive and determination (see Appendix B).

85
4.4.1 Need for achievement
Purpose of the construct
The purpose of measuring this construct is to determine participants’ need for
achievement that is associated with entrepreneurial behaviour and is measured by 12
questions in the GET test (refer to par. 2.12.1). Individuals with a high need for
achievement have a strong desire to be successful and are consequently more likely
to behave entrepreneurially.
Results obtained
Table 4.6 presents the respondents’ perception of the items measuring the need for
achievement construct.
Analysis of the results
Only 20.97% of the respondents indicated that they would not do an unchallenging
job even if the pay was good and most of the respondents also find it easy to relax on
holiday (61.9%). These answers suggest that most of the respondents have a lack of
ambition and are easy-going. Although respondents would rather work in a team
without taking responsibility for a job (43.4%) they do like challenges that really
stretch their abilities (91.3%) and they think more about the results of succeeding
than the effects of failing (90.2%). This suggests that the respondents have a
tendency to set challenging goals and have a planning orientation for achievement.
Table 4.6: Results of the Need for achievement construct
QUESTION CORRECT ANSWER
INCORRECT ANSWER
MISSING TOTAL
n % n % n % n
1 I would not mind routine unchallenging work if the pay was good.
111 20.9 417 78.7 2 0.4 530
6 I usually defend my point of view if someone disagrees with me.
402 75.8 127 24.0 1 0.2 530

86
10 I like challenges that really stretch my abilities rather than things I can do easily.
484 91.3 45 8.5 1 0.2 530
15 If I am having problems with a task I leave it and move on to something else.
358 67.5 172 32.5 0 0 530
19 I think more of the present and the past than of the future. Disagree
374 70.6 155 29.2 1 0.2 530
24 It is more important to do a job well than to try to please people.
508 95.8 22 4.2 0 0 530
28 I get annoyed if people are not on time.
441 83.2 89 16.8 0 0 530
33
I would rather work with a person I liked, but who was not very good at the job, than work with someone I did not really like who was very good at the job.
385 72.6 141 26.6 4 0.8 530
37
I would rather work on a task as a member of a team than to take responsibility for it myself.
298 56.2 230 43.4 2 0.4 530
42
When I am faced with a challenge I think more about the results of succeeding than the effects of failing.
478 90.2 52 9.8 0 0 530
46 I get up early, stay late or skip meals in order to get special tasks done.
360 67.9 170 32.1 0 0 530
51 I find it easy to relax on holiday.
323 61.9 198 37.4 4 0.8 530
4.4.2 Need for autonomy/independence
Purpose of the construct
The purpose of measuring this construct is to determine participants’ need for
autonomy and is measured by six questions in the GET test (refer to par 2.12.2). It is
believed that an entrepreneur wants more independence and control.
Results obtained
Table 4.7 presents the respondents’ perception of the items measuring the need for
autonomy/independence construct.

87
Analysis of the results
Most of the respondents (90.2%) indicated that they do what is expected and follow
instruction and 61.3% would do conventional things rather than in an individual way.
This suggests that the respondents are flexible with decision-making and have a
preference for working with or for others rather than managing others and
respondents have no need to do things in their own special way.
Table 4.7: Results of the Need for autonomy construct
QUESTION CORRECT ANSWER
INCORRECT ANSWER
MISSING TOTAL
n % n % n % n
3 I do not like to do things that are novel or unconventional.
201 37.9 325 61.3 4 0.8 530
12 I like to do things in my own way without worrying about what other people think.
314 59.2 216 40.8 0 0 530
21 When I am in a group I am happy to let someone else take the lead.
237 44.7 292 55.1 1 0.2 530
30 When tackling a task I rarely need or want help.
354 66.8 175 33.0 1 0.2 530
39 I do what is expected of me and follow instructions.
52 9.8 478 90.2 0 0 530
48 Most people think that I am stubborn.
283 53.4 247 46.6 0 0 530
4.4.3 Creative tendency
Purpose of the construct
The purpose of measuring this construct is to determine participants’ creative
tendency and is measured by 12 questions in the GET test (refer to par 2.12.3). The
entrepreneur is regarded as a creator therefore one’s ability to think creatively and
imaginatively is a vital entrepreneurial trait.

88
Results obtained
Table 4.8 presents the respondents’ perception of the items measuring their
tendency towards creativity.
Table 4.8: Results of the Creative tendency construct
QUESTION CORRECT ANSWER
INCORRECT ANSWER
MISSING TOTAL
n % n % n % n
5 I rarely day dream. 258 48.8 271 51.1 1 0.2 530
8 Sometimes people find my ideas unusual.
352 66.6 177 33.4 0 0 530
14
I like to find out about things even if it means handling some problems whilst doing so.
400 75.5 130 24.5 0 0 530
17 I do not like sudden changes in my life.
183 34.5 346 65.3 1 0.2 530
23 I do not like guessing. 217 40.9 313 59.1 0 0 530
26 Other people think that I ask a lot of questions.
314 59.2 216 40.8 0 0 530
32 I prefer to be quite good at several things rather than very good at one thing.
448 84.5 82 15.5 0 0 530
35 I prefer doing things in the usual way rather than trying out new ways.
357 67.4 173 32.6 0 0 530
41 I like to have my life organised so that it runs smoothly and to plan.
51 9.6 478 90.4 1 0.2 530
44 I can handle a lot of things at the same time.
243 45.8 287 54.2 0 0 530
50 Sometimes I have so many ideas I do not know which one to pick.
432 81.5 98 18.5 0 0 530
53 It is harder for me to adapt to change than keep to routine.
282 53.2 248 46.8 0 0 530
Analysis of the results
A total of 84.5% respondents indicated that they prefer to be quite good at several
things rather than very good at one thing and 81.5% of the respondents indicated that
89
they have so many ideas that they do not know which one to pick. Most of the
respondents (75.5%) indicated that they like to find out more about things even if it
means handling some problems whilst doing so. More than two thirds of the
respondents (65.3%) indicated that have a preference for stability and do not like
sudden changes and would rather prefer a planned life that’s running smoothly
(90.4%).
4.4.4 Moderate/calculated risk taking
Purpose of the construct
The purpose of measuring this construct is to determine participants’ risk-taking
propensity and is measured by 12 questions in the GET test (refer to par 2.12.4). It is
believed that entrepreneurs prefer to take moderate risks in situations where they
have some degree of control or skill to realise a profit.
Results obtained
Table 4.9 presents the respondents’ perception of the items measuring their risk-
taking propensity.
Analysis of the results
Although two thirds of the respondents (64.7%) set difficult targets and 69.1% would
be willing to borrow some money to realise a good money making idea, 85.5%
indicated that they will only take the risks if the chances of success are 50/50. Even
though more than half of the respondents (55.5%) indicated that they would like to
start new projects that may be risky and 81.9% of the respondents would take an
opportunity that might lead to even better things, most of the respondents (89.4%)
find it difficult to make decisions in uncertain conditions and would rather exhaustively
gather information.
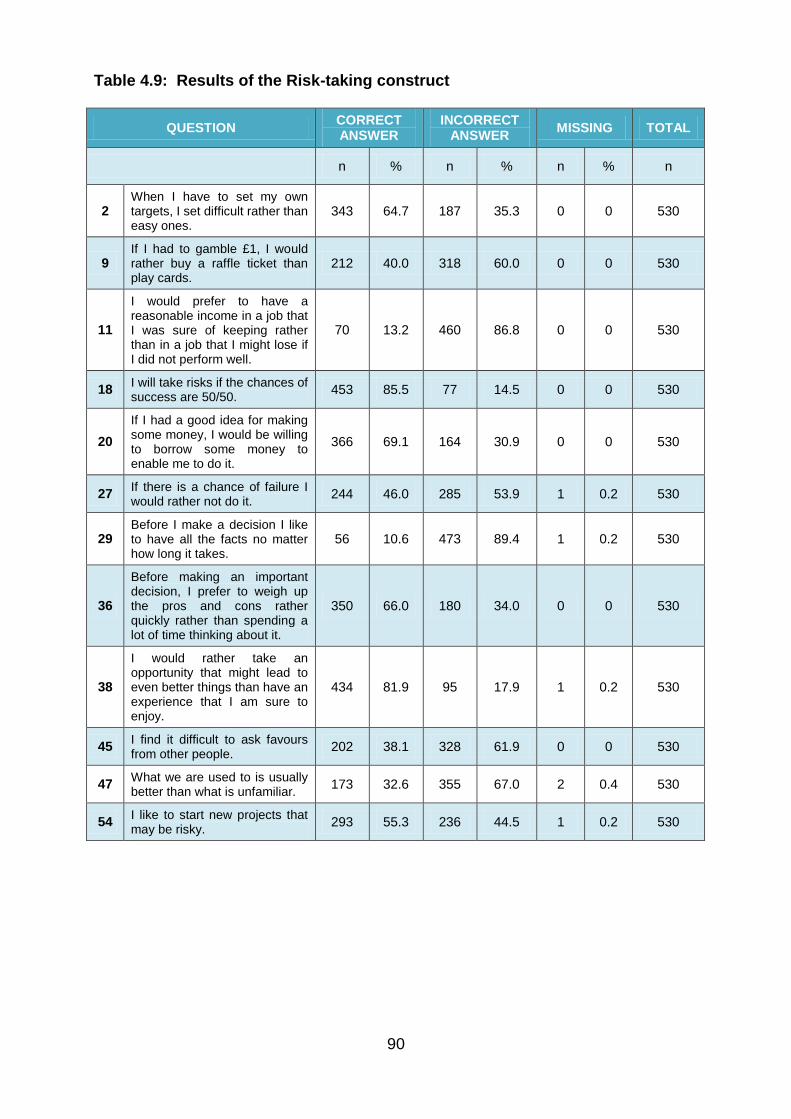
90
Table 4.9: Results of the Risk-taking construct
QUESTION CORRECT ANSWER
INCORRECT ANSWER
MISSING TOTAL
n % n % n % n
2 When I have to set my own targets, I set difficult rather than easy ones.
343 64.7 187 35.3 0 0 530
9 If I had to gamble £1, I would rather buy a raffle ticket than play cards.
212 40.0 318 60.0 0 0 530
11
I would prefer to have a reasonable income in a job that I was sure of keeping rather than in a job that I might lose if I did not perform well.
70 13.2 460 86.8 0 0 530
18 I will take risks if the chances of success are 50/50.
453 85.5 77 14.5 0 0 530
20
If I had a good idea for making some money, I would be willing to borrow some money to enable me to do it.
366 69.1 164 30.9 0 0 530
27 If there is a chance of failure I would rather not do it.
244 46.0 285 53.9 1 0.2 530
29 Before I make a decision I like to have all the facts no matter how long it takes.
56 10.6 473 89.4 1 0.2 530
36
Before making an important decision, I prefer to weigh up the pros and cons rather quickly rather than spending a lot of time thinking about it.
350 66.0 180 34.0 0 0 530
38
I would rather take an opportunity that might lead to even better things than have an experience that I am sure to enjoy.
434 81.9 95 17.9 1 0.2 530
45 I find it difficult to ask favours from other people.
202 38.1 328 61.9 0 0 530
47 What we are used to is usually better than what is unfamiliar.
173 32.6 355 67.0 2 0.4 530
54 I like to start new projects that may be risky.
293 55.3 236 44.5 1 0.2 530

91
4.4.5 Drive and determination
Purpose of the construct
The purpose of this construct is to determine participants’ perception of self-efficacy.
This construct is measured by 12 questions in the GET test (refer to par 2.12.5). Self-
efficacy motivates individuals to demonstrate entrepreneurial behaviour.
Results obtained
Table 4.10 presents the respondents’ perception of the items measuring their drive
and determination (self-efficacy).
Table 4.10: Results of the Drive and determination construct
QUESTION CORRECT ANSWER
INCORRECT ANSWER
MISSING TOTAL
n % n % n % n
4
Capable people who fail to become successful have not taken chances when they have occurred.
389 73.4 141 26.6 0 0 530
7 You are either naturally good at something or you are not, effort makes no difference.
402 75.8 127 24.0 1 0.2 530
13 Many of the bad times that people experience are due to bad luck.
352 66.4 178 33.6 0 0 530
16 When I make plans to do something, I nearly always do what I plan.
411 77.5 119 22.5 0 0 530
22 People generally get what they deserve.
363 68.5 166 31.3 1 0.2 530
25 I will get what I want from life if I please the people with control over me.
415 78.3 115 21.7 0 0 530
31 Success cannot come unless you are in the right place at the right time.
187 35.3 343 64.7 0 0 530
34 Being successful is the result of working hard, luck has nothing to do with it.
483 91.1 47 8.9 0 0 530
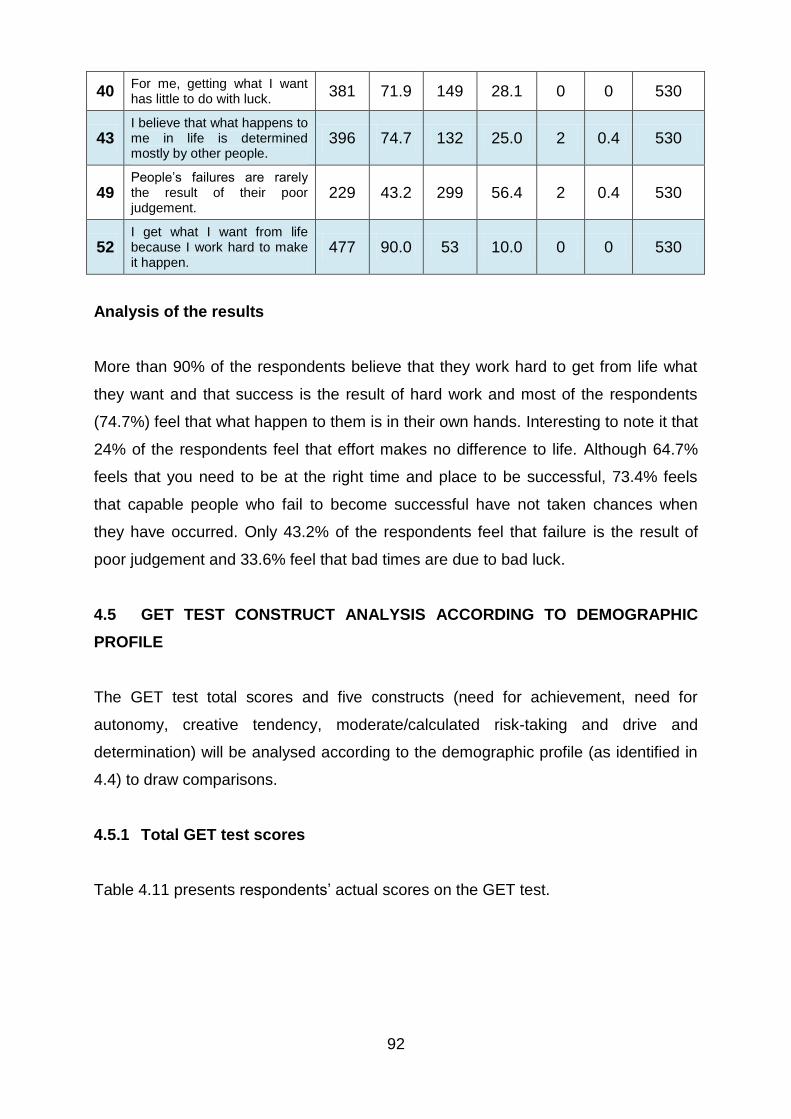
92
40 For me, getting what I want has little to do with luck.
381 71.9 149 28.1 0 0 530
43 I believe that what happens to me in life is determined mostly by other people.
396 74.7 132 25.0 2 0.4 530
49 People’s failures are rarely the result of their poor judgement.
229 43.2 299 56.4 2 0.4 530
52 I get what I want from life because I work hard to make it happen.
477 90.0 53 10.0 0 0 530
Analysis of the results
More than 90% of the respondents believe that they work hard to get from life what
they want and that success is the result of hard work and most of the respondents
(74.7%) feel that what happen to them is in their own hands. Interesting to note it that
24% of the respondents feel that effort makes no difference to life. Although 64.7%
feels that you need to be at the right time and place to be successful, 73.4% feels
that capable people who fail to become successful have not taken chances when
they have occurred. Only 43.2% of the respondents feel that failure is the result of
poor judgement and 33.6% feel that bad times are due to bad luck.
4.5 GET TEST CONSTRUCT ANALYSIS ACCORDING TO DEMOGRAPHIC
PROFILE
The GET test total scores and five constructs (need for achievement, need for
autonomy, creative tendency, moderate/calculated risk-taking and drive and
determination) will be analysed according to the demographic profile (as identified in
4.4) to draw comparisons.
4.5.1 Total GET test scores
Table 4.11 presents respondents’ actual scores on the GET test.

93
Table 4.11: Respondents’ actual scores on GET test
Constructs n Max GET
score
Norm average
GET score
Actual mean score
Need for achievement 530 12 9 8.45
Need for autonomy 530 6 4 2.72
Creative tendency 530 12 8 6.68
Moderate/ Calculated risk-taking 530 12 8 6.03
Drive and determination 530 12 8 8.46
Total GET score 530 54 30-43 32.33
Table 4.11 shows the findings from the GET test of the participating grade 12
learners on the five enterprise tendency constructs and also the overall score. The
GET test has a series of maximum scores for each of the five constructs that range
from 6 to 12, as well as a series of suggested average scores derived from past
studies of other occupational groups (Caird, 1991a). It can be seen that in terms of
the five dimensions all scores accept drive and determination were below average.
The overall GET score was within the average score range, but at the lower end of
the suggested average of 30 to 43.
4.5.2 School distribution
Table 4.12 presents the GET scores of respondents’ according to school distribution.
Table 4.12: GET test scores according to participants’ schools distribution
School n 1 2 3 4 5 TOTAL
Senzile Combined School 61 8.69 2.74 6.62 5.74 8.66 32.44
Aramela Combined School 29 9.17 2.24 6.59 5.86 8.97 32.83
Boshof Combined School 59 7.68 2.56 6.69 6.34 8.49 31.76
Taiwe Secondary School 46 8.37 3.04 6.52 5.48 8.59 32.00
Theunissen Combined School 18 8.22 2.89 5.78 5.83 8.78 31.50
Winburg Combined School 27 8.33 2.81 7.30 6.11 8.63 33.19
Naledi-Ya-Botjabela Secondary School
43 8.72 2.70 7.05 5.74 8.00 32.21
Ipopeng Secondary School 40 8.35 2.80 5.85 5.83 8.00 30.83

94
Marematlou Secondary School 119 8.59 2.66 6.55 5.93 8.36 32.10
Hentie Cilliers High School 88 8.40 2.78 7.16 6.75 8.53 33.63
Suggested average score 530 9.00 4.00 8.00 8.00 8.00 30-43
Comparison of total GET scores according to school distribution
According to Table 4.12, Hentie Cilliers High School (33.63) scored the highest on
the total GET score, while Winburg Combined School (33.19) and Aramela
Combined School (32.83) scored respectively second and third highest. Senzile
Combined School (32.44), Naledi-Ya-Botjabela Secondary School (32.21),
Marematlou Secondary School (32.10) as well as Taiwe Secondary School (32.00)
scored in closed proximity to one another. Boshof Combined School (31.76),
Theunissen Combined School (31.50) and Ipopeng Secondary School (30.83) scored
the lowest on the overall GET test score. However, all the scores are above the
suggested average scores, although at the lower end of the suggested average of 30
to 43.
Comparison of Need for achievement according to school distribution
The respondents from Aramela Combined School scored the highest in the construct
Need for achievement with 9.17 and is the only school that scored above the
suggested average score (see Table 4.12). The remaining schools in descending
order are: Naledi-Ya-Botjabela Secondary School (8.72), Senzile Combined School
(8.69), Marematlou Secondary School (8.59) and Hentie Cilliers High School (8.40).
Taiwe Secondary School (8.37), Ipopeng Secondary School (8.35), Winburg
Combined School (8.33) and Theunissen Combined School (8.22) scored very
similar scores, while Boshof Combined School showed the least need for
achievement with 7.68.
Comparison of Need for autonomy according to school distribution
From the Need for autonomy results (suggested average score 6), it was evident
that the respondents do not have a strong need for autonomy. There is a difference
of 0.8 between the highest score of Taiwe Secondary School (3.04) and Aramela

95
Combined School (2.24). The second highest score was obtained by Theunissen
Combined School (2.89), with Winburg Combined School (2.81), Ipopeng Secondary
School (2.80) and Hentie Cilliers High School (2.78) scoring very close scores.
Senzile Combined School (2.74), Naledi-Ya-Botjabela Secondary School (2.70),
Marematlou Secondary School (2.66) and Boshof Combined School (2.56) scored
respectively the lowest scores.
Comparison of Creative tendency according to school distribution
Table 4.12 indicates that Theunissen Combined School scored the lowest result in
the Creativity tendency construct with 5.78, although Ipopeng Secondary School
differ only slightly with 5.85, followed by Aramela Combined School with 6.59. Taiwe
Secondary School and Marematlou Secondary School’s scores results in the seventh
and sixth lowest scores respectively. Winburg Combined School scored the highest
with 7.30, with a difference of 1.52 from the lowest scoring school followed by Hentie
Cilliers High School (7.16) and Naledi-Ya-Botjabela Secondary School (7.05). It is
worth noting that all the schools scores below the suggested average of 8.
Comparison of Moderate/calculated risks according to school distribution
Hentie Cilliers High School (6.75) measured the highest in the construct
moderate/calculated risk-taking followed by Boshof Combined School (6.34) and
Winburg Combined School (6.11). The rest of the schools scores ranging between
5.93 (Marematlou Secondary School) and 5.74 (Senzile Combined School). It is
evident that all the school’s scored below the suggested average score of 8, which
indicates a low risk-taking propensity.
Comparison of Drive and determination according to school distribution
According to Table 4.12, Aramela Combined School (8.97) scored the highest for
Drive and determination. It is worth noting that all the schools performed above the
suggested average score of 8. The rest of the schools scores ranged between 8.78
(Theunissen Combined School) and 8.00 (Ipopeng Secondary School).
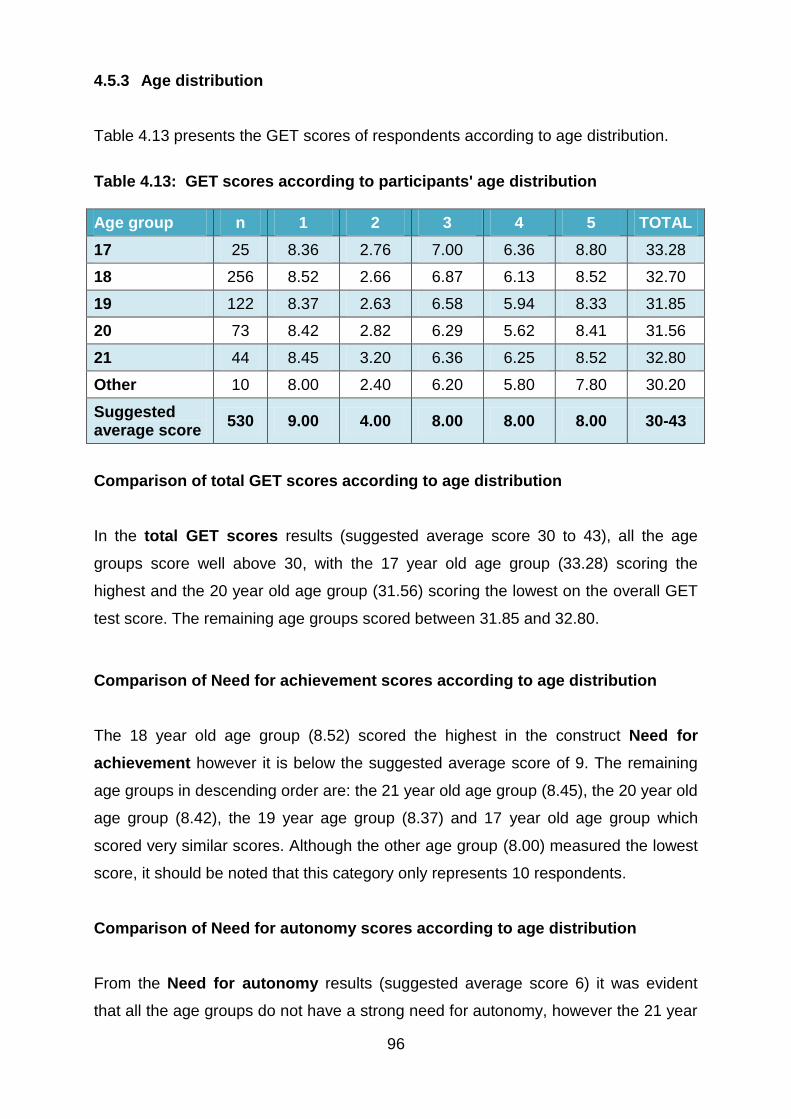
96
4.5.3 Age distribution
Table 4.13 presents the GET scores of respondents according to age distribution.
Table 4.13: GET scores according to participants' age distribution
Age group n 1 2 3 4 5 TOTAL
17 25 8.36 2.76 7.00 6.36 8.80 33.28
18 256 8.52 2.66 6.87 6.13 8.52 32.70
19 122 8.37 2.63 6.58 5.94 8.33 31.85
20 73 8.42 2.82 6.29 5.62 8.41 31.56
21 44 8.45 3.20 6.36 6.25 8.52 32.80
Other 10 8.00 2.40 6.20 5.80 7.80 30.20
Suggested average score
530 9.00 4.00 8.00 8.00 8.00 30-43
Comparison of total GET scores according to age distribution
In the total GET scores results (suggested average score 30 to 43), all the age
groups score well above 30, with the 17 year old age group (33.28) scoring the
highest and the 20 year old age group (31.56) scoring the lowest on the overall GET
test score. The remaining age groups scored between 31.85 and 32.80.
Comparison of Need for achievement scores according to age distribution
The 18 year old age group (8.52) scored the highest in the construct Need for
achievement however it is below the suggested average score of 9. The remaining
age groups in descending order are: the 21 year old age group (8.45), the 20 year old
age group (8.42), the 19 year age group (8.37) and 17 year old age group which
scored very similar scores. Although the other age group (8.00) measured the lowest
score, it should be noted that this category only represents 10 respondents.
Comparison of Need for autonomy scores according to age distribution
From the Need for autonomy results (suggested average score 6) it was evident
that all the age groups do not have a strong need for autonomy, however the 21 year
97
old age group (3.20) scored the highest. The second highest score was obtained by
the 20 year old age group (2.82), followed by the 17 year age group (2.76), 18 year
old age group and 19 year old age group (2.63), which all scored very similar scores.
The other age group (2.40) scored the lowest on the construct Need for achievement.
Comparison of Creative tendency scores according to age distribution
The 17 year old age group (7.00) scored the highest on the construct Creative
tendency and the 20 year old and other age group scored the lowest with (6.29 and
6.20). The remaining age groups scored between 6.36 and 6.87. It is worth noting
that all the age groups scores below the suggested average of 8.
Comparison of Moderate/calculated risks scores according to age
The 17 year old age group (6.36) measured the highest in the construct
moderate/calculated risk-taking followed by the 21 year old (6.25) and 18 year old
age group (6.13) The rest of the age group scores ranging between 5.94 (19 year old
age group) and 5.62 (20 year old age group). It is evident that all the age groups
scored below the suggested average score of 8, which indicates a low risk-taking
propensity.
Comparison of Drive and determination scores according to age distribution
According to Table 4.13, the 17 year age old group (8.80) scored the highest for
Drive and determination. It is worth noting that all the age groups except the 20
year old age group (7.80) performed above the suggested average score of 8. The
rest of the age group scores ranged between 8.52 (18 and 21 year old age group)
and 8.33 (19 year old age group).
4.5.4 Gender distribution
Table 4.14 presents the GET scores of respondents according to gender distribution.

98
Table 4.14: GET scores according to participants' gender distribution
Gender n 1 2 3 4 5 TOTAL
Female 320 8.37 2.81 6.65 5.93 8.52 32.28
Male 210 8.56 2.58 6.71 6.19 8.37 32.41
Suggested average score
530 9.00 4.00 8.00 8.00 8.00 30-43
Although not a marginal difference, male respondents scored on average slightly
higher than the female respondents in the study (32.41 compared to female score of
32.28). Male respondents scored 8.56 and 6.71 respectively on the Need for
achievement and Creative tendency construct with the female respondents’
scoring, 8.37 and 6.65. The male respondents are also more willing to take risks as is
evident from their score on the Moderate/calculated risks-taking construct (6.19)
compared to the female respondents score of 5.93. However the female respondents’
Need for autonomy and Drive and determination construct scores are higher at
2.81 and 8.52 respectively, compared to the males scores of 2.58 and 8.37.
4.5.5 Home language distribution
Table 4.15 presents the GET scores of respondents according to home language
distribution.
Table 4.15: GET scores according to participants' home language distribution
Home language n 1 2 3 4 5 TOTAL
Afrikaans 68 8.28 2.81 6.66 6.51 8.57 32.84
English 14 9.00 2.57 7.43 7.07 8.86 34.94
Southern Sotho 269 8.55 2.72 6.68 5.90 8.36 32.21
Northern Sotho 18 8.22 2.89 6.22 6.50 8.22 32.06
Tswana 103 8.38 2.73 6.78 5.87 8.65 32.41
Xhosa 51 8.39 2.51 6.45 6.06 8.45 31.86
Zulu 4 7.25 3.25 6.00 5.25 8.75 30.50
Other 3 7.00 2.67 6.67 5.33 8.00 29.67
African languages combined
446 8.45 2.70 6.64 5.91 8.42 32.12
Suggested average score
530 9.00 4.00 8.00 8.00 8.00 30-43

99
The total GET scores according to home language distribution indicated that the
English speaking group scored the highest (34.94), followed by the Afrikaans (32.84),
Tswana (32.41), Southern Sotho (32.21) and Xhosa (31.86) speaking groups. All the
African languages combined (32.12) still scored lower than the English and Afrikaans
speaking groups.
4.5.6 Ethnic group distribution
Table 4.16 presents the GET scores of respondents according to ethnic group
distribution.
Table 4.16: GET scores according to participants' ethnic group distribution
Ethnic group n 1 2 3 4 5 TOTAL
Black 454 8.47 2.70 6.67 5.94 8.44 32.22
Coloured 15 9.13 2.73 6.53 6.60 8.07 33.07
White 61 8.13 2.85 6.75 6.54 8.70 32.98
Suggested average score
530 9.00 4.00 8.00 8.00 8.00 30-43
The total GET scores according to ethnic group distribution, indicated that the
Coloured group scored the highest (33.07) closely followed by the White group
(32.98) and the Black group with a score of 32.22.
When the five constructs of the GET test is taken in consideration, the coloured
group (6.75) scored the highest on the constructs Need for achievement and
Moderate/calculated risks-taking (6.60). The White group scored the highest on
the constructs Need for autonomy (2.85), Creative tendency (6.75) and Drive for
determination (8.70). Although the Black group did not score the highest score on
any of the constructs, their scores were in close range of the other two groups.

100
4.6 SUMMARY
The empirical research done in this chapter was of a quantitative nature, as it
consisted of a survey questionnaire. A questionnaire was used to measure the
entrepreneurial tendency of grade 12 learners in the Lejweleputswa District (Free
State province), based on the five constructs discussed in chapter 2. The data
gathering process, response to the survey and demographical profile of the
respondents was discussed.
The questionnaire was then assessed against the five constructs as measured by the
General Enterprising Tendency (GET) test. It was concluded that the enterprising
tendency of grade 12 learners is prevalent however the mean scores were at the
lower end of the suggested average. This low score resulted from the five constructs
measured by the GET test were all the scores, accept Drive and determination
measured below the suggested average score. Creative tendency and Need for
autonomy is a real concern, as it measured far below the suggested average score. It
is evident that these tendencies need to be harnessed for successful youth
entrepreneurship development.
In the following chapter conclusions will be drawn from the findings discussed in this
chapter and recommendation will be made on how to enhance entrepreneurship
education.
101
CHAPTER 5
CONCLUSIONS AND RECOMMENDATIONS
5.1 INTRODUCTION
The preceding chapters presented an overview of the concept of entrepreneurship,
the current status of entrepreneurship and entrepreneurial learning in South Africa
(chapter 2), an examination of unemployment in South Africa, especially youth
unemployment and reasons for youth unemployment (chapter 3) and the results of an
empirical study on the entrepreneurial intentions of grade 12 learners in a small
geographical area in South Africa (chapter 4).
The purpose of this study was to make practical recommendations for enhanced
entrepreneurial learning for school learners in South Africa. Accordingly, this section
of the study draws from earlier chapters to identify the gap between the desired and
the current state of entrepreneurship education in South Africa to reach valid
conclusions, and to construct practical recommendations for improved
entrepreneurial learning.
5.2 GAP-ANALYSIS
5.2.1 Current state
South Africa has a high concentration of discourage work seekers in the younger age
group with income inequality based on race and gender (Stats SA, 2012; Banerjee et
al., 2008:5). A large part of the population is unemployed, lives in poverty and
consequently depends on social grants and on the government to create sufficient
number of new jobs (Altman & Marock, 200814).
In addition, entrepreneurial growth is not supported by education and training (Simrie
et al., 2011:30) because current education focused on preparing the youth to become
employees rather than employers (Isaacs et al., 2007:619; Horn, 2006:125). Although
South African youth have a positive general enterprising tendency, these enterprising

102
tendencies need to be harnessed for successful youth entrepreneurship
development.
Current entrepreneurship exposure at school level is ineffective and sporadic (Shay &
Wood, 2004:34) and teachers with little or no knowledge and enthusiasm for
economical subjects are forced to teach Economic Management Science (EMS)
(Mashiapata, 2006:22). Consequently learners acquire the wrong perception and
attitude of entrepreneurship (Korhonen et al., 2011:2).
5.2.2 Desired state
South Africa needs motivated and skilled young individuals that can actively
contribute to economic growth (Bezuidenhout et al., 2012:39) with income-earnings
that will contribute to sustainable economic development and income equalities that
are only based on skills.
South Africa needs an education system where theoretical and practical knowledge
are shared through innovative methods to prepare the youth to be employers. In
addition entrepreneurship needs to be a central theme during school years where
learners’ are shown why and how to be entrepreneurial (Timmons & Spinelli, 2009:6).
South Africa needs motivated and energised educators to share their knowledge with
passion. In addition, educators and organised businesses also need to be involved in
aligning the curriculum that will better prepare learners for the modern labour market.
5.3 CONCLUSIONS ON THE LITERATURE STUDY
This study concludes that entrepreneurship remains one of the least understood
topics in academic research. There is no consensus on the definition of
entrepreneurship or what an entrepreneur does, but the entrepreneur causes
entrepreneurship (Arthur & Hisrich, 2011:2).
Entrepreneurship is beneficial to a country, community and an individual (Keat et al.,
2011:206). Most importantly it can be a career choice, particularly in situations of high
unemployment, as is the case in South Africa (Mahadea et al., 2011:68; Mashiapata,

103
2006:12, Chigunta et al., 2005:15). Through entrepreneurship people develop new
skills and experience that can be applied to many other challenges in life (Chigunta et
al., 2005:14). Entrepreneurship also increases competitiveness and innovativeness
among citizens and help individuals to develop the personal capacities needed to
cope with risks and uncertainty (Korhonen et al., 2011:3).
South Africa’s unemployment rate of 24.9% is very high (Stats SA, 2012) and
Government has struggled to create employment at the scale required to relieve
unemployment and poverty (Philip, 2012:180). The current economic climate also
does not favour employment and youth are worse affected in times of a recession,
because of their lack of appropriate skills, work related capabilities and experiences
(De Lange et al., 2012:530; McGrath & Akoojee, 2012:423, Altman & Marock,
2008:11).
Unemployment prevents individuals to acquire important skills and experience
needed to obtain a job and to provide for themselves and their families (Grosso &
Smith, 2011:79). Entrepreneurship seems like an alternative job solution for South
Africa’s unemployment crisis (Chigunta et al., 2005:13). Unfortunately there are not
enough people in South Africa who have the orientation and skills to create new
businesses (Fatoki & Patswawairi, 2012:133; Luiz & Mariotti, 2011:47, Isaacs et al.,
2007:613).
Although the school, apart from the home, are regarded as the place where the most
profound impact can be brought about in the development of the youth (Isaacs et al.,
2007:613), the South African school system fails to educate young minds to think and
act entrepreneurial (Von Broembsen et al., 2005:39). Young learners also do not
receive adequate career guidance and support to help them to make the right career
choice that will prepare them for the modern world of work (Catholic Parliamentary
Liaison Office, 2012:1; Development Bank of Southern Africa, 2011:5; National
Treasury, 2011:16).

104
5.4 CONCLUSIONS ON THE EMPERICAL STUDY
The conclusions from the empirical study were drawn from the demographic
composition of the Lejweleputswa sample and the results of the GET test employed
in the study.
5.4.1 Demographical information results
Results obtained from the respondents on the GET test did not differ much. All ten
schools results are within the same range on all five constructs measured by the
GET test as well as the total scores. The 17 year old age group measured the
highest entrepreneurial tendencies, with the 20 year old group the least
entrepreneurial. There is not a marginal difference between males and females,
although the male respondents scored slightly higher. English speaking respondents
measured higher entrepreneurial tendencies with the African languages combined
measured the lowest. This trend was also visible within the ethnic grouping with the
Coloured group the highest followed by the White group. It can be concluded that
entrepreneurial tendency is not very high among secondary school learners within
the Lejweleputswa District, irrespective of their demographic profile.
5.4.2 Conclusions on the GET test results
5.4.2.1 Total on the GET test
Participants scored 32.28 with 30 to 43 being the average suggested score on the
GET test (Caird, 1991). Although the score is within the suggested average score, it
is at the lower end. To identify individuals that have the enterprising tendency to start
their own business, participants need to score higher on the GET test
5.4.2.2 Need for achievement
Participants scored 8.45 with 9 being the suggested average score for need for
achievement (Caird, 1991). This just below average score is influenced by
respondents’ answers on the following questions: I would not mind routine
unchallenging work if the pay was good (78.7%) and I would rather work on a
task as a member of a team than to take responsibility for it myself (43.4%).
105
Persons with a high need for achievement suggest that they have a preference for
challenges, accept personal responsibility for outcomes and innovativeness which
are defining characteristics of successful initiators of new businesses (Lewis,
2011:435; Cromie, 2000:16; Koh, 1996:14). The desire for personal achievement is
needed to provide the motivation and determination to excel in life. Ambition is about
mastering a special skill and receiving recognition (Fels, 2004:51).
5.4.2.3 Need for autonomy
Participants scored 2.72 with 4 being the suggested average score for need for
autonomy (Caird, 1991). This score is far below the average score and is influenced
by respondents’ answers on the following questions: I do what is expected of me
(90.2%), I do not like to do things that are novel or unconventional (61.3%) and
when I am in a group I am happy to let someone else take the lead (55.1%).
Autonomy is a quality of independent, single-minded people with a free spirit who
are self-directed in their pursuit of a new idea and have the ability to carry their ideas
through to completion (Lumpkin & Dess, 1996:140). Conformity is a high priority for
schools as part of enforcing discipline, therefore autonomy is not yet an objective of
respondents as is evident from the GET test results.
5.4.2.4 Creative tendency
Participants scored 6.68 with 8 being the suggested average score for creative
tendency (Caird, 1991). This below average score is influenced by respondents’
answers on the following questions: I like to have my life organised so that it runs
smoothly and to plan (90.4%), I do not like sudden changes in my life (65.3%)
and I do not like guessing (59.1%).
Creativity and innovation refer to an individual’s resourcefulness to create
experiment and investigate new ideas (De Lange, 2000:42; Koh, 1996:16). The
school structure is mainly to blame for inhibiting learners’ creativity.
5.4.2.5 Moderate/calculated risk-taking
Participants scored 6.03 with 8 being the suggested average score for
moderate/calculated risk-taking (Caird, 1991). This well below average score is

106
influenced by respondents’ answers on the following questions: Before I make a
decision I like to have all the facts no matter how long it takes (89.4%), I would
prefer to have a reasonable income in a job that I was sure of keeping rather
than in a job that I might lose if I did not perform well (86.8%), what we are used
to is usually better than what is unfamiliar (67%), I find it difficult to ask favours
from other people (61.9%) and if I had to gamble £1, I would rather buy a raffle
ticket than play cards (60%).
The entrepreneur prefers to take moderate risks in situations where they have some
degree of control or skill in realising a profit (Demirer & Kara, 2007:51; Cromie,
2000:19; Koh, 1996:15). Respondents are still at school and not yet in a real job
situation where they need to take calculated risks.
5.4.2.6 Drive and determination
Participants scored 8.46 with 8 being the suggested average score for drive and
determination (Caird, 1991). This slightly above average score is influenced by
respondents’ answers on the following questions: Being successful is the result of
working hard, luck has nothing to do with it (91.1%), I get what I want from life
because I work hard to make it happen (90%), I will get what I want from life if I
please the people with control over me (negatively assessed) (78.3%) and when I
make plans to do something, I nearly always do what I plan (77.5%).
Successful entrepreneurs do not believe that fate, luck or other powerful, external
forces will govern the success or failure of their ventures; they believe that they
personally can affect the outcome (Timmons & Spinelli, 2009:54). It must be noted
that the respondents’ are school learners and their drive and determination
perception is based on their school career experience.
5.4.3 General conclusions on the GET test results
It should be note that the following conclusions are not based on scientific evidence
emanating from the study. It does, however, provide a starting point that can be
considered to improve entrepreneurial education at secondary schools in South
Africa.
107
Respondents lack ambition: Respondents’ main motivation is money. They have
unrealistic expectations that they will earn a high salary even though they do not
have the skills and experience to justify the high income. There also seems to be
a strong sense of entitlement among the youth expecting to receive rather than to
work for what they want out of life. It seems that they are not willing to work hard,
to start from the bottom and work their way up.
Respondents do not want to take responsibility: The youth are reluctant to take
responsibility because there is safety in numbers. The South African culture of
Ubuntu (I am what I am because of who we all are) and Batho pele (putting other
people first before considering your own needs or yourself) also justify this
reluctance. It is also worth noting that peer group pressure might influence the
youth not to take the lead and associated responsibility.
Respondents are immature: Respondents are still at school therefore extenuating
circumstances exist. However it seems that the youth are immature and lack the
necessary skills and knowledge to do something new and on their own unique
way or to take responsibility for it. Peer group pressure should also be taken into
consideration.
Respondents thought processes are not challenged enough: The low score on the
propensity to be creative is a big concern when the South African context is taken
in consideration. The current curriculum does not challenge learners thought
processes enough and learners are reluctant to challenge themselves or they
may lack the skills to be creative.
Respondents have a sense of insecurity/lack self-confidence: Respondents’
cautious nature and difficulty to make decisions in uncertain conditions can be
contributed to a sense of insecurity or lack of self-confidence. There is also a
correlation with their need for achievement, given that they rather prefer a stable
income even if the work is unchallenging. Buying a raffle ticket seems to be the
easy solution, rather than to strategies in the card game. Respondents’ also feel
uncomfortable when they are challenged or put in situations where they need
other people’s help. It seems that they are insecure about their future and is
rather looking for stability.
Respondents have unrealistic expectations: It seems that respondents have
unrealistic expectations of what a job entails and although they believe that hard
work will get them what they want out of life, that success is the result of hard
108
work and that what happens to them is in their own hands, caution should be
taken when real job expectations are taken into consideration.
5.4.4 General conclusions on the empirical results
Most of this year’s grade 12 learners started their school career in 2000 and were
educated with the Curriculum 2005 programme, aiming to prepare learners for the
world of work and how to engage in entrepreneurial activity. However, the curriculum
with all its revisions seems to be insufficient. Learners are not prepared for the world
of work and lacks creativity, as is evident from their scores on the GET test.
The teaching of entrepreneurship should, in the long run, undoubtedly contribute to
the full development of learners and the social wellbeing of the nation at large. By
developing a positive attitude towards entrepreneurial behaviour among learners, it is
likely that more learners will wish to own and manage their own business. However, a
realistic and balances portrayal of an entrepreneurial career must be provided.
Therefore more should be done to develop young entrepreneurs. The learning
environment that an individual is exposed to play a pivotal role in determining
whether or not a learner is favourable disposed towards becoming an entrepreneur.
Career choices are influenced by a person’s way of upbringing, exposure, frame of
reference and on their perception of capabilities.
All stakeholders; Government, the Department of Education (DoE), schools,
teachers, parents and guardians, learners and entrepreneurs and organised business
must take responsibility to address South Africa’s unemployment crisis. An
entrepreneurship culture and mind-set is needed to unleash the economic potential of
all people in South Africa. Effective entrepreneurship education and development is
required to produce entrepreneurs.
5.5 RECOMMENDATIONS
Entrepreneurial education and training in South Africa is characterised by shortfalls
and weaknesses. However, a new approach needs to be put in place if

109
entrepreneurship education and training is indeed to produce entrepreneurs; one that
should start early as possible to allow for maximum impact and effect.
Practical recommendations are needed to provide stakeholders at the grassroots
level with the means to improve the current situation. Accordingly, this section of the
study provides brief recommendations to each of the stakeholders identified at the
grassroots level to improve youth entrepreneurship education and development.
5.5.1 Government
The South African Government need to find a way to include entrepreneurship as an
independent learning area in the national curriculum. In addition, it is proposed that
Government should take note of the following recommendations:
South Africa needs an explicit policy mandating and enabling youth
entrepreneurship education.
Entrepreneurship education should receive strong governmental support,
sufficient funding as well as thorough monitoring and evaluation.
More research regarding youth entrepreneurship education should be encourage
and funded.
5.5.2 The Department of Education (DoE)
Entrepreneurship education at school level does not receive a high priority in the
South African context, because entrepreneurship is only presented in the Senior
phase (grade seven to nine) and in Business Studies from grade 10 to 12 as an
optional subject.
Schools’ primary function is to help learners develop literacy, numeracy and critical
thinking skills to enhance their ideas and thoughts clearly during their journey through
life. In addition, it is proposed that the Department of Education (DoE) should take
note of the following recommendations:

110
A concerted effort should be made to address the youth’s needs through an
expanded curriculum that integrates small businesses into other courses and
specialities.
Entrepreneurial education needs to be incorporate and integrate in as many
different learning experiences as possible, that will contribute to a realistic
expectation of the work-life of an entrepreneur.
Enforce entrepreneurship market days at all schools.
Provide cross curriculum assessment guidelines (Integrated Assessment Task,
ISAT) to assess entrepreneurship market days.
Assistance and guidance should be provided to previously disadvantage schools
in organising the entrepreneurship market days.
Professional career counselling should be provided at all schools on a permanent
base or through regular school visits by a career counsellor.
Improve the awareness programs at schools to heighten government services
available to the youth (e.g. the National Youth Service and National Youth
Development Agency services).
Encourage schools to partner with businesses as well as stakeholders from the
public and private sector on entrepreneurship education.
Entrepreneurial education demands entrepreneurial teachers therefore suitable,
competent teachers must be found, trained and supported.
5.5.3 Schools
Schools should become active institutional role players in promoting commercial
subjects, business skills and entrepreneurship as a career choice as well as building
the self-image and positive “I can” attitude among young learners (Burger et al.,
2004:202). In addition, it is proposed that schools should take note of the following
recommendations:
The right entrepreneurship mind-set should be enforced from top management,
teachers and learners.
All role players need to make a mind-shift to acknowledge and recognise the
value and importance of entrepreneurship in real life.

111
Schools should adjudicate teachers with the appropriate knowledge, passion,
mind-set and attitude to educate EMS and Business Studies.
At least two entrepreneurship market days needs to be held annually.
Entrepreneurship market days need to be well organised with cross curricular
assessment (ISAT) combined with life skill learning.
All teachers should be involved with the Entrepreneurship market days, not just
the EMS or Business Studies teachers.
Through the entrepreneurship market day, focus should be placed on simulated
work experiences and learners should be encouraged to participate in peer group
partnerships.
These peer group partnerships need to evolve and should be evaluated to provide
guardians and feedback for improvement.
Learners and teachers should be awarded for their efforts to encourage
enthusiasm, creativity and innovation.
Schools should liaise with organisations, businesses and parents to strengthen
cooperation and input from the community.
Formal and direct links between teachers and entrepreneurs should be
encouraged so that the theory and practice are intertwined.
5.5.4 Teachers
Teachers are expected to fulfil various roles, such as “being mediators of learning,
interpreters and designers of learning programmes and materials, leaders,
administrators and managers, scholars, researchers and life-long learners,
community members, citizens and pastors, assessors, as well as subject specialists”
(DoE, 2003:18).
However not all teachers have this kind of skill to fulfil all these various roles and in
order for learners to benefit from entrepreneurship education in the curriculum,
teachers should be trained to teach. In addition, it is proposed that teachers should
take note of the following recommendations:
Strongly dedicated, motivated teachers are needed to teach entrepreneurship.
112
Teachers need to ensure that they have first-hand up to date knowledge of the
latest development in their discipline (Horn, 2006:125).
Teachers also act as role models, therefore a positive attitude and enthusiasm for
their subject will make the subject more attractive to learners and even encourage
them to follow a career in the same discipline.
Teachers need to include interactions with local companies to practically
demonstrate that entrepreneurship as a career option is viable even in their own
small community.
Teachers need to do more to assist learners to develop a greater measure of
entrepreneurial and critical thinking.
Learners should be guided to visualise and plan their business.
Teachers should make use of visuals and multimedia and make use of real
examples to inspire learners.
The achievement of young entrepreneurs should be highlighted.
Learners need to be introduced to various job possibilities and career paths at an
early stage to enable them to make the right subject choice at the end of grade
nine.
Teachers need to make learners aware of South Africa’s unemployment problem
and that they have to take responsibility for creating their own jobs and career
success.
An enterprising culture and mind-set therefore needs to be inculcated which
favours the formation of employers and not employees (Horn, 2006:125).
5.5.5 Parents and guardians
Between providing in financial needs, parents are also responsible for the emotional
wellbeing of their children. Most households require both parents to work to support
the family needs and therefore the absence of parents are inevitable. It seems that
parents are lacking parenting skills and do not spent enough time and effort with their
children from a young age to teach or influence them to be creative, ambitious young
entrepreneurs. In addition, it is proposed that parents should take note of the
following recommendations:

113
Parents should encourage and support their children to do something remarkable.
Parents should set challenges that will stretch their children’s capabilities and
creativity.
Parents should give their children opportunities to see new things, new places
and meet new people, because an inquisitive mind stimulate creative thinking.
Children should be taught the value of work, work ethics, as well as the value of
money and how to use it.
Parents should rather encourage ambition than discourage it and should
celebrate their children’s successes.
5.5.6 Learners
The primary purpose of the National Curriculum Statement (NCS) Grades 10 to 12 is
to equip learners with the knowledge, skills and values that will enable them to
participate in, and offer benefits to society. It also aims to provide a basis for further
learning in Higher Education and Training, to lay a foundation for future careers and
to prepare learners to be productive and responsible citizens (DoE, 2008:12). In
addition, it is proposed that learners should take note of the following
recommendations:
Young people need to start thinking about their future career at a younger age
and should focus their energy on acquiring the specific subject requirements,
skills and knowledge needed to pursue that career.
Learners need to think of themselves as job-creators, rather than job-seekers.
Learners should focus on occupations that are growing or show growth potential
(Horn, 2006:126).
Learners need to start thinking of other career opportunities that have emerge in
the job market because of globalization and information technology.
Learners need to realise that passing matric is not good enough to secure a job in
the competitive job market. Learners need to further themselves through studies
or acquire trade skills, such as: electricians, fitters and turners, boilermakers and
instrument makers.
114
5.5.7 Entrepreneurs and organised business
Businesses all over South Africa, no matter how small, should invite schools to visit
their business as part of a field trip to demonstrate entrepreneurship in practice and
not just theoretical. In addition, it is proposed that entrepreneurs and organised
business should take note of the following recommendations:
Tri-party alliance should be established between the private sector, public sector
and communities.
All businesses should encourage school learners to participate in their internship
programmes and job shadowing opportunities.
Businesses should sponsor schools and provide incentives for schools and
learners to encourage entrepreneurship development.
Entrepreneurship education requires sustained input and expertise from
entrepreneurs and organised business.
Business owners and existing entrepreneurs should act as mentors and coaches
to develop young entrepreneurs.
5.6 AN ENHANCED ENTREPRENEURSHIP EDUCATION STRATEGY AT
SCHOOL LEVEL IN SOUTH AFRICA
It was concluded earlier that a new approach to entrepreneurial education and
training in South African schools could be implemented through an assertive effort
involving all stakeholders.
A cooperative approach to youth entrepreneurship enhancement cannot be over-
emphasized. Government, Department of Education (DoE), teachers, learners,
parents and guardians, organised business and the community should be included to
ensure successful entrepreneurship education.
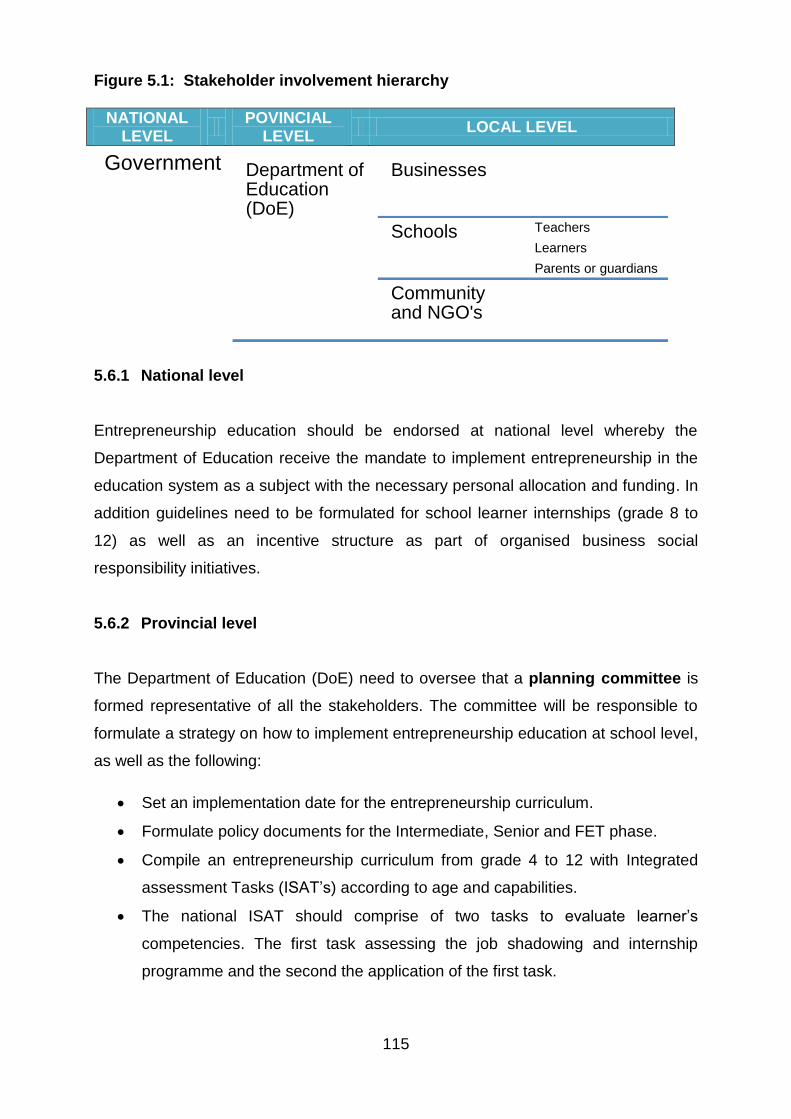
115
Figure 5.1: Stakeholder involvement hierarchy
NATIONAL LEVEL
POVINCIAL
LEVEL LOCAL LEVEL
5.6.1 National level
Entrepreneurship education should be endorsed at national level whereby the
Department of Education receive the mandate to implement entrepreneurship in the
education system as a subject with the necessary personal allocation and funding. In
addition guidelines need to be formulated for school learner internships (grade 8 to
12) as well as an incentive structure as part of organised business social
responsibility initiatives.
5.6.2 Provincial level
The Department of Education (DoE) need to oversee that a planning committee is
formed representative of all the stakeholders. The committee will be responsible to
formulate a strategy on how to implement entrepreneurship education at school level,
as well as the following:
Set an implementation date for the entrepreneurship curriculum.
Formulate policy documents for the Intermediate, Senior and FET phase.
Compile an entrepreneurship curriculum from grade 4 to 12 with Integrated
assessment Tasks (ISAT’s) according to age and capabilities.
The national ISAT should comprise of two tasks to evaluate learner’s
competencies. The first task assessing the job shadowing and internship
programme and the second the application of the first task.
Government Department of Education (DoE)
Businesses
Schools Teachers
Learners
Parents or guardians
Community and NGO's
116
ISAT guidelines should be available at the beginning of the implementation
year to enable entrepreneurship educators to prepare learners accordingly.
Compile the educator’s qualification and minimum requirements to teach
entrepreneurship education.
Compile the objectives and training material for the entrepreneurship
educators training course that will be presented by each provincial education
department.
The Department of Education (DoE) in each province needs to determine the
entrepreneurship teacher allocation, advertise vacancies and employ
entrepreneurship educators and/or career guidance according to the set qualification
and minimum requirements. All appointed educators need to be trained and educated
to implement the entrepreneurship curriculum and objectives.
In addition, the Department of Education (DoE) in each province needs to organise
an Entrepreneurship Expo in all the districts, to introduce the new curriculum and
implementation strategy. As part of the introduction, it is important to involve local
entrepreneurs and businesses to establish role models, mentors and coaches to the
learners. Local businesses need to introduce their job shadowing and internship
programmes at the Entrepreneurship Expo. Learners should also be made aware of
Government’s services available to the youth (National Youth Service and National
Youth Development Agency).
5.6.3 Local level
The success of entrepreneurship education will be determined by the enthusiasm
and support that schools received from the Department of Education (DoE).
Therefore regular visits should be made to the district schools to assess their
progress and to provide support and guidance were needed. Each school’s principal
should take responsibility for his/her schools entrepreneurship education program
and should be evaluated accordingly. In addition the school principal should see to
the following:
That the schools’ learners from grade 4 to 12 as well as all the teachers attend
the District Entrepreneurship Expo.
117
Two entrepreneurship market dates (early in the second term and at the end
of the third term) should be set and all the responsible people should be
informed as well as the district DoE.
Parents and other stakeholders also need to be informed of the
entrepreneurship education curriculum and objectives. Parents should be
encouraged to get involved in the planning of the entrepreneurship market
days and to support children with their tasks.
Principals should have a hands-on approach with regular feedbacks from the
entrepreneurship educator as well as the support and cooperation of all the
staff at the school.
It is vital that the school liaise with businesses, parents and communities for
support and funding of the entrepreneurship market days.
Although the well-trained entrepreneurship educator is responsible for the
implementation and learning of entrepreneurship, all teachers needs to provide
learners with support, enthusiasm and guidance. Local entrepreneurs or businesses
from different sectors should be invited to introduce learners to different business
sectors and operations. Possible career opportunities within the sector should be
highlighted. Learners should be encouraged to explore all possible opportunities
through the job shadowing and internship programmes.
Local businesses need to formulate internship programme and job shadowing
opportunities for grade 8 to 12 learners in accordance with the guidance set by the
Government (Department of Labour) and introduced it at the District
Entrepreneurship Expo. Follow-up school visits should be made to encourage
learners to pursue the opportunities and as a possible career option. In addition, local
businesses need to get involved at schools with sponsorships as part of their
corporate social responsibility and skills development initiatives, aimed at the youth.
Local entrepreneurs need to act as mentors and coaches for learners within the
internship programmes and job shadowing.
118
5.6.4 Right attitude and mind-set
The successful functioning of the proposed entrepreneurship education program
depends on the right attitudes and mind-sets of the stakeholders involved. As
mentioned before attitudes and mind-sets that learners acquire at school are
probably more important than curriculum contents in terms of developing their
entrepreneurial content.
5.7 CRITICAL EVALUATION OF THE STUDY
This section critically evaluates the success of this study against the research
objectives formulated in section 1.5.
5.7.1 Primary objective re-visited
The primary objective of this study is to assess the entrepreneurial intentions of
grade 12 school learners in the Lejweleputswa District (Free State province) registered
with the Department of Education (DoE) and to make recommendations for enhanced
entrepreneurial learning for school learners in South Africa.
5.7.2 Secondary objectives re-visited
To define entrepreneurship.
To examine the entrepreneur and benefits of entrepreneurship.
To examine the current state of entrepreneurship and entrepreneurship
education in South Africa to highlight shortfalls.
To examine successful entrepreneurship education programmes for the
compilation of recommendations.
To examine entrepreneurship tendencies and how to measure it with an
appropriate measure instrument.
To examine unemployment in South Africa, especially youth unemployment,
reasons for youth unemployment and current youth development initiatives.
To measure the current entrepreneurial tendencies of grade 12 school
learners in the Lejweleputswa District with the use of a questionnaire.
119
To compare the enterprising tendencies of the respondents according to their
demographic profile.
To make practical recommendations to enhance entrepreneurship education
at school level in South Africa.
The first secondary objective namely, to define entrepreneurship was achieved
through the definition of entrepreneurship in section 2.3.
The second secondary objective namely, to examine the entrepreneur and
benefits of entrepreneurship was achieved in section 2.4 and 2.5 where
entrepreneurial attributes and behaviours and benefits of entrepreneurship was
discussed.
The third secondary objective was to examine the current state of
entrepreneurship and entrepreneurship education in South Africa to highlight
shortfalls. This objective was achieved in chapter 2, and in particular, in section 2.6
where factors such as entrepreneurial activity in South Africa, emanating from the
South African GEM Reports, were discussed. Section 2.9 addresses
entrepreneurship education in South Africa.
Chapter 2 also addressed the fourth secondary objective to examine successful
entrepreneurship education programmes for the compilation of
recommendations. Section 2.10 on entrepreneurship education provided various
perspectives of successful entrepreneurship education programmes.
The fifth secondary objective namely, to examine entrepreneurship tendencies
and how to measure it with an appropriate measure instrument was achieved in
section 2.11 and 2.12. Entrepreneurship tendencies and the ‘General Enterprising
Tendency’ test were discussed as a valid instrument to evaluate entrepreneurship
orientation.
Chapter 3 addressed the sixth secondary objective to examine unemployment in
South Africa, especially youth unemployment, reasons for youth
unemployment and current youth development initiatives. In section 3.3 to 3.5,
unemployment in South Africa were discussed, with section 3.6 and 3.7 focusing on

120
youth unemployment and reasons for youth unemployment. In section 3.9 youth
development, policies and support structures as part of youth development initiative
were discussed.
The seventh secondary objective namely, to compare the enterprising tendencies
of the respondents according to their demographic profile was achieved through
the empirical research discussed in chapter four and concluded in chapter five.
The eight secondary objective namely, to make practical recommendations to
enhance entrepreneurship education at school level in South Africa was
achieved through the empirical research discussed in chapter four and concluded in
chapter five. The results of this empirical research led to the development of practical
recommendations as presented in this chapter.
Through the achieving of all secondary objectives it can therefore be concluded that
the primary objective namely, to assess the entrepreneurial intentions of grade 12
learners in the Lejweleputswa District (Free State province) registered with the
Department of Education (DoE) and to make recommendations for enhanced
entrepreneurial learning for school learners in South Africa was achieved.
5.8 SUGGESTIONS FOR FURTHER RESEARCH
The fact that there were some discrepancies between the results found in this study
and research provided in the literature study serves as enough motivation that further
research on youth entrepreneurship in South Africa is needed. It is recommended
that further research be conducted to aid a structured understanding of the broader
issues on this subject at a grass root level. The following topics concerning youth
entrepreneurship in South Africa deserve to be investigated further:
The effectiveness of government initiatives to support youth entrepreneurship.
Specific needs to be addressed in training and education programmes for youth
entrepreneurs.
The development of a youth entrepreneurial spirit.
The link between education and being a successful entrepreneur.
121
5.9 SUMMARY
The purpose of chapter 5 was to conclude on the empirical study starting with a gap-
analysis between the current and the desired state of entrepreneurship education in
South Africa. Wide-ranging differences were identified through the gap-analysis, thus
emphasizing the need for interventions to stimulate new venture and job creation in
South Africa.
This study concluded that South African youth have a positive general enterprising
tendency, but these enterprising tendencies need to be harnessed for successful
youth entrepreneurship development. This finding was supported by statistical
evidence showing that there is no practical significant difference in the enterprising
tendencies between learners from different schools, age, gender, home language or
ethnic group.
The empirical research resulted in the formulation of recommendations to enhance
youth entrepreneurship education in South African schools. The study was then
evaluated critically to determine whether the research objectives were achieved.
Finally some suggestions for further research were made.
Whilst it needs further development and empirical research on implementation, it
nevertheless provides a conceptual platform from which to explore further the
complex areas of entrepreneurial education and training and influence design and
delivery.

122
BIBLIOGRAPHY
AHMAD, H.M. 2010. Personality traits among entrepreneurial and professional
CEO’s in SMEs. International Journal of Business and Management, 5(9):203-213.
ALI, A., TOPPING, K.J. & TARIQ, R.H. 2011. Entrepreneurial attitudes among
potential entrepreneurs. Pakistan Journal of Commerce and Social Science, 5(1):12-
46.
ALTMAN, M. & MAROCK, C. 2008. Identifying appropriate interventions to support
the transition from schooling to the workplace. Human Science Research Council &
Centre for poverty employment and growth. http://www.hsrc.ac.za/Document-
3570.phtml Date of access: 4 Jan. 2012.
ANDERSON, K. 2002. Defining entrepreneurship. Center for Entrepreneurial
Leadership Clearinghouse on Entrepreneurship Education (CELCEE). Kansas City:
Kauffman.
ANON. 2012. Introducing the National Youth Development Agency. Management
Today:36-38, Jun.
ARORA, V. & RICCI, L.A. 2005. Unemployment and the labour market. (In NOWAK,
M. & RICCI, L.A. (eds), Post-Apartheid South Africa: the first ten years. Washington,
DC: IMF p. 23-47.) http://www.imf.org/external/pubs/nft/2006/soafrica/eng/
pasoafr/sach3.pdf Date of access: 12 April 2012.
ARTHUR, S.J. & HISRICH, R.D. 2011. Entrepreneurship through the ages: lessons
learned. Journal of Enterprising Culture, 19(1):1-40.
ATHAYDE, R. 2009. Measuring enterprise potential in young people.
Entrepreneurship Theory and Practice, 33(2):481-500.
123
BANERJEE, A., GALIANI, S., LEVINSOHN, L., MCLAREN, Z. & WOOLARD, I.
2008. Why has unemployment risen in the new South Africa? (In NBER Working
Paper. p. 1-28.)
BARKER, A.B. 2003. The South African labour market. Pretoria: Van Schaik
Publishers.
BEEKA, B.H. & RIMMINGTON, M. 2011. Entrepreneurship as a career option for
African youths. Journal of Developmental Entrepreneurship, 16(1):145-164.
BENZING, C., CHU, H.M. & KARA, D. 2009. Entrepreneurs in Turkey: a factor
analysis of motivation, success factors and problems. Journal of Small Business
Management, 47(1):58-91.
BEZUIDENHOUT, A., SCHULTZ, C.M. & DU PLOOY, I. 2012. Investigating the
impact of a Christian based life skills training programme: Perceptions of unemployed
people. International Review of Social Science and Humanities, 3(2):38-56.
BHORAT, H. & LEIBBRANDT, M. 1998. Poverty amongst the self-employed.
Studies in Economics and Econometrics, 22:25-41.
BHORAT, H. & OOSTHUIZEN, M. 2005. What have we learnt about the South
African labour market? (In DPRU Research Report for National Treasury: UCT.)
BJERKE, B. 2007. Understanding entrepreneurship. Cheltenham: Edward Elgar.
BOLTON, B. & THOMPSON, J. 2004. Entrepreneurs: talent, temperament,
technique. Oxford: Butterworth-Heinemann.
BRIGGS-MYERS, I. & MCCAULLEY, M.H. 1985. Guide to the development and use
of the Myers-Briggs type indicator. Palo Alto, CA: Consulting Psychologists Press.
BRIJLAL, P. 2011. Entrepreneurial perceptions and knowledge: a survey of final
year university students. African Journal of Business Management, 5(3):818-825.
124
BROCKHAUS, R.H., HILLS, G.E., KLANDT, H. & WELSCH, H.P. 2001.
Entrepreneurship education: A global view. Aldershot: Ashgate Publishing.
BRUSH, C.G. 2008. Pioneering strategies for entrepreneurial success. Business
Horizons, 51(1):21-27.
BURGER, L., MAHADEA, D. & O'NEILL, C. 2004. Perceptions of entrepreneurship
as a career option in South Africa: an exploratory study among grade 12 learners.
South African Journal of Education, 7(2):187-205.
BURGER, L., O'NEILL, C. & MAHADEA, D. 2005. The impact of previous
knowledge and experience on the entrepreneurial attitudes of Grade 12 learners.
South African Journal of Education, 25(2):89-94.
BUSINESS UNITY SOUTH AFRICA (BUSA). 2011. Key measures that can
materially enhance investment, economic growth and employment creation in South
Africa. http://www.busa.org.za/docs/Key%20Measures.pdf Date of access: 12 April
2012.
BYGRAVE, W. 1993. Theory building in the entrepreneurship paradigm. Journal of
Business Venturing, 8(3):225-280.
CAIRD, S. 1991. The enterprising tendency of occupational groups. International
Small Business Journal, 9(4):75-81.
CAIRD, S. 1992. Problems with the identification of enterprise competencies and
the implications for assessment and development. Management Education and
Development, 23(1):6-17.
CARREE, M. & THURIK, R. 2005. Understanding the role of entrepreneurship for
economic growth. (In Discussion paper on entrepreneurship, growth and public
policy. p. 11.) https://papers.econ.mpg.de/egp/discussionpapers/2005-10.pdf Date of
access: 23 April 2012.
125
CASSON, M. 1982. The entrepreneur: an economic theory. Cheltenham: Edward
Elgar. 272 p.
CHELL, E., HAWORTH, J.M. & BREARLEY, S.A. 1991. The entrepreneurial
personality: concepts, cases and categories. London: Routledge.
CHIGUNTA, F., SCHNURR, J. JAMES-WILSON, D. & TORRES, V. 2005. Being
“real” about youth entrepreneurship in Eastern and Southern Africa: implications for
adults, institutions and sector structures. (In Small Enterprise Development (SEED)
Working Paper, 72. Geneva: Switzerland. p. 1-93.)
CHOUDHRY, M., MARELLI, E. & SIGNORELLI, M. 2012. Youth and total
unemployment rate: the impact of policies and institutions.
http://www.eco.unibs.it/~emarelli/CMS_unemp_instit.pdf Date of accessed: 9 Jan.
2012.
CLARK, J.N. 2012. Youth violence in South Africa: The case for a restorative justice
response. Contemporary Justice Review, 15(1):77-95.
DEPARTMENT OF COOPERATIVE GOVERNANCE & TRADITIONAL AFFAIRS
(COGTA). 2012. Community Work Programme. http://www.cogta.gov.za/cwp/ Date
of access: 10 Sept. 2012.
CORNWALL, J.R. & NAUGHTON, M.J. 2003. Who is the good entrepreneur? An
exploration within the Catholic social tradition. Journal of Business Ethics, 44(1):66-
75.
CATHOLIC PARLIAMENTARY LIAISON OFFICE (CPLO). 2012. Youth
unemployment: finding solutions. (In Briefing Paper 289. p. 4)
CROMIE, S. 2000. Assessing entrepreneurial inclinations: Some approaches and
empirical evidence. European Journal of Work and Organizational Psychology,
9(1):7-30.
126
CROMIE, S. & O’DONOGHUE, J. 1992. Assessing entrepreneurial inclinations.
International Small Business Journal, 10:66-73.
CRUSH, J. 2011. Complex movements, confused responses: labour migration in
South Africa. Southern African Migration Programme Policy Brief, 25:1-27.
http://dspace.cigilibrary.org/jspui/bitstream/123456789/32627/1/SAMP%20-%20
Complex%20Movements,%20Confused%20Responses.pdf Date of access: 10 Sept.
2012.
DEVELOPMENT BANK OF SOUTHERN AFRICA (DBSA). 2011. Youth
employment strategies for South Africa. (In DBSA development conversations,
roundtable held on 9 June 2011. p. 9)
DEAKINS, D., GLANCEY, K., MENTER, I. & WYPER, J. 2005. Enterprise
education: the role of head teachers. International Entrepreneurship and
Management Journal, 1(2):241-263.
DE LANGE, C.J. 2000. The relationship of entrepreneurial attitude and
entrepreneurship. Pretoria: UNISA. (Unpublished dissertation – M.Ed). 234 p.
DE LANGE, M., GESTHUIZEN, M. & WOLBERS, M.H.J. 2012. Trends in labour
market flexibilization among Dutch school-leavers: the impact of economic
globalization on educational differences. International Sociology, 27(4):529-550.
DEMIRER, H. & KARA, M. 2007. The effects of personal background factors on
students’ entrepreneurial attributes. (Paper read at the 6th Knowledge, Economy &
management International Congress, Istanbul on the 26 to 28 Dec. 2007. Istanbul. p.
49-66.)
DEPARTMENT OF EDUCATION see SOUTH AFRICA. Department of education.
DEPARTMENT OF PUBLIC ENTERPRISES see SOUTH AFRICA. Department of
Public Enterprises.
127
DEPARTMENT OF PUBLIC ENTERPRISES see SOUTH AFRICA. Department of
Public Works.
DE WAAL, T.G. 2004. Curriculum 2005: challenges facing teachers in historically
disadvantage school in the Western Cape. Cape Town: UWC. (Unpublished
dissertation – MPA) 101 p.
DE WITTE, H., ROTHMANN, S. & JACKSON, L.T.B. 2012. The psychological
consequences of unemployment in South Africa. South African Journal of
Economics and Management Science, 15(3):235-252.
DRENNAN, J., KENNEDY, J. & RENFROW, P. 2005. Impact of childhood
experiences on the development of entrepreneurial intentions. International Journal
of Entrepreneurship and Innovation, 6(4):231-238.
DRENNAN, J. & SALEH, M. 2008. Dynamics of entrepreneurship intentions of MBA
students: An Asian developing country perspective. http://www.pbfeam2008.
bus.qut.edu.au/papers/documents/MdAbuSalah_Final.pdf Date of access: 10 March
2012.
DRIVER, A., WOOD, E., SEGAL, N. & HERRINGTON, M. 2001. Global
entrepreneurship monitor, South African Executive Report. Cape Town: UCT.
Graduate School of Business.
DRUCKER, P. 1985. Innovation and entrepreneurship. NY: Harper Perennial.
DOUGLAS, E.J. & SHEPHERD, D.A. 2002. Self-employment as a career choice:
attitudes, entrepreneurial intentions, and utility maximization. Entrepreneurial Theory
and Practice, 26(3):81-90.
DURHAM UNIVERSITY BUSINESS SCHOOL (DUBS). 1994. The successful
entrepreneur: a behavioural review and investigation. A report produced at the Small
Business Centre, March.
128
DU TOIT, R. 2003. Unemployed youth in South Africa: the distressed generation.
(Paper read at the Minnesota International Counseling Institute (MICI) on the 27 July
to 1 August 2003. p. 24.)
EATWELL, J. 2000. Unemployment: national policies in a global economy.
International Journal of Manpower, 21(5):343-373.
EXPANDED PUBLIC WORKS PROGRAMME (EPWP). 2012. Department of Public
Works. http://www.epwp.gov.za/index.asp?c=Welcome Date of access: 10 Sept.
2012.
EUROPEAN COMMISSION. 2008. Entrepreneurship in Higher Education,
especially within non-business studies. http://ec.europa.eu/enterprise/policies/sme/
files/support_measures/training_education/entr_highed_en.pdf Date of access: 23
April 2012.
FALLAHI, F., POURTAGHI, H. & RODRIGUEZ, G. 2012. The unemployment rate,
unemployment volatility, and crime. International Journal of Social Economics,
39(6):440-448.
FARRINGTON, S., GRAY, B. & SHARP, G. 2011. Perceptions of an entrepreneurial
career: do small business owners and university students concur? Management
Dynamics, 20(2):2-17.
FATOKI, O. & PATSWAWAIRI, T. 2012. The motivations and obstacles to
immigrant entrepreneurship in South Africa. Journal of Social Science, 32(2):133-
142.
FAULKNER, D. & LOEWALD, C. 2008. Policy change and economic growth: a case
study of South Africa. (In Policy Paper Number ,14. p. 1-41.)
FELS, A. 2004. Do women lack ambition? Harvard Business Review, 82(4):50–60.
129
FIELDS, G.S. 2000. The employment problem in South Africa. Paths to growth and
employment in South Africa. (In Trade and Industrial Policy Secretariat (TIPS) 2000
annual forum held at Glenburn Lodge in Muldersdrift on 18 to 20 September 2000.
Pretoria. p. 1-11.)
FOXCROFT, M.L., WOOD, E., KEW, J., HERRINGTON, M. & SEGAL, N. 2002.
Global entrepreneurship monitor, South African Executive Report. Cape Town: UCT.
Graduate School of Business.
FREE STATE DEPARTMENT OF EDUCATION. 2012.
http://fsdoe.fs.gov.za/SchoolFinder/Schoolfinder.aspx Date of access: 10 March
2012.
GABOR, D. 1970. Innovations: scientific, technical and social. Oxford: University
Press.
GARTNER, W.B. 1989. Who is an entrepreneur? Is the wrong question.
Entrepreneurship Theory and Practice, 13(4):47-68.
GERRY, C., MARQUES, C.S. & NOGUEIRA, F. 2008. Tracking student
entrepreneurial potential: personal attributes and the propensity for business start-
ups after graduation in a Portuguese university. Problem and Perspectives in
Management, 6(4):45-53.
GIBB, A. 2002. Creating conducive environments for learning and entrepreneurship:
living with, dealing with, creating and enjoying uncertainty and complexity. Industry &
Higher Education, 16(3):135-148.
GIBB, A.A. 2007. Enterprise in education: educating tomorrow’s entrepreneurs.
Pentti Mankinen. http://www.enorssi.fi/hankkeet/ yrittajyyskasvatus/pdf/Gibb.pdf. Date
of access: 12 April 2012.
130
GIBSON, S.G., HARRIS, M.L., MICK, T.D. & BURKHALTER, T.M. 2011. Comparing
the entrepreneurial attitudes of university and community college students. Journal
of Higher Education Theory and Practice, 11(2):11-18.
GILAD, B. 1982. On encouraging entrepreneurship: an interdisciplinary approach.
Journal of Behavioural Economics, 11(1):132-163.
GORDHAN, P. 2012. Budget speech. http://d2zmx6mlqh7g3a.cloudfront.net/cdn/
farfuture/ wedtV3LiBqO6vbycs5t5uhVUrvallpvQVqGLvxl9o0/mtime:1329914048/
files/docs/120222Budgetspeech-2012.pdf Date of access: 12 Aug. 2012.
GORMAN, G., HANLON, D. & KING, W. 1997. Some research perspectives on
entrepreneurship education, enterprise education and education for small business
management: a ten-year literature review. International Small Business Journal,
15(3):56-79.
GOUWS, E. 1997. Entrepreneurship education: an educational perspective. South
African Journal of Higher Education, 17:143-149.
GOUWS, E. 2002. Entrepreneurship education: implication for teacher training.
South African Journal of Higher Education, 16(2):41-48.
GROSSO, J. & SMITH, T.L. 2011. Poverty and unemployment: a cultural approach.
Thunderbird International Business Review, 54(1):79-90.
GUROL, Y. & ATSAN, N. 2006. Entrepreneurial characteristics among university
students: some insights for entrepreneurship education and training in Turkey.
Education and Training, 48(1):25-38.
HEBERT, R.F. & LINK, A.N. 1989. In search of the meaning of entrepreneurship.
Small Business Economics, 1(1):39-49.
HERRINGTON, M., KEW, J. & KEW, P. 2010. Tracking entrepreneurship in South
Africa: A GEM perspective. Cape Town: UCT. Graduate School of Business.
131
HERRON, L. 1994. Do skills predict profits? A study of successful entrepreneurship.
NY: Garland Publishers. 288 p.
HISRICH, R.D. 1990. Entrepreneurship/intrapreneurship. Organizational
Psychology, 45(2):209-222.
HISRICH, R.D., PETERS, M.P. & SHEPHERD, D.A. 2010. Entrepreneurship. 8th ed.
NY: McGraw Hill.
HOLLENBECK, G. & HALL, D.T. 2004. Self-confidence and leader performance.
Organizational Dynamics, 33(3):254-269.
HORN, G. 2006. Educational solutions to improve the employability of senior high
school learners. South African Journal of Education, 26(1):113-128.
IBRAHIM, A.B. & SOUFANI, K. 2002. Entrepreneurship education and training in
Canada: a critical assessment. Education and Training, 44(8/9):421-430.
IJEOMA, E.O. & NDEDI, A. 2008. Addressing unemployment challenges among
young graduates in South Africa: the role of entrepreneurship education.
http://137.215.9.22/bitstream/handle/2263/8163/Ijeoma_Addressing(2008)a.pdf?sequ
ence=2 Date of access: 26 May 2012.
INTERNATIONAL LABOUR ORGANISATION (ILO). 2005. Being “real” about youth
entrepreneurship in Eastern and Southern Africa: implications for adults, institutions
and sector structures. International Labour Office – Geneva.
http://www.ilo.org/youthmakingithappen/PDF/WP72-2005.pdf Date of access: 4 Jan.
2012.
INTERNATIONAL LABOUR ORGANISATION (ILO). 2012. Global employment
trends for youth 2012. International Labour Office – Geneva.
http://www.ilo.org/wcmsp5/groups/public/---dgreports/---dcomm/documents/
publication/wcms_180976.pdf Date of access: 28 Aug. 2012
132
ISAACS, E., VISSER, K., FRIEDRICH, C. & BRIJLAL, P. 2007. Entrepreneurship
education and training at the Further Education and Training (FET) level in South
Africa. South African Journal of Education, 27:613-629.
INTEGRATED YOUTH DEVELOPMENT AGENCY (IYDA). 2011. Integrated youth
development strategy for South Africa.
http://www.nyda.gov.za/images/stories/documents/CLEAN%20EDITED%20Improved
%20Draft%20IYDS_July%2020115%20(1)%5B1%5D.pdf Date of access: 15 Oct.
2012.
JACKSON, D.N. 1976. Jackson personality inventory manual. Goshen, NY:
Research Psychologists Press.
JUNIOR ACHIEVEMENT SOUTH AFRICA (JASA). 2012. http://www.jasa.org.za
Date of access: 10 Sept. 2012.
JYOTHI, P. 2009. Revisiting linkages between entrepreneurship and higher
education. Advances in Management, 2(10):39-43.
KALITANYI, V. & VISSER, K. 2011. African immigrants in South Africa: job takers or
job creators? South African Journal of Economic and Management Science,
13(4):376-390.
KAUFMANN, P.J., WELSH, D.H.B. & BUSHMARIN, N. 1995. Locus of control and
entrepreneurship in the Russian Republic. Entrepreneurship Theory and Practice,
20(1):43-56.
KEAT, O.Y., SELVARAJAH, C. & MEYER, D. 2011. Inclination towards
entrepreneurship among university students: an empirical study of Malaysian
university students. International Journal of Business and Social Science, 2(4):206-
220.
KHAWAR, H. 2008. Universities-driven entrepreneurship model: creating pockets of
high entrepreneurial activity in Pakistan. http://papers.ssrn.com/sol3/
papers.cfm?abstract_id=1135115 Date of access: 17 April 2012.

133
KINGDON, G.G. & KNIGHT, J. 2007. Community, comparisons and subjective well-
being in a divided society. Journal of Economic Behavior & Organization, 64(1):69-
90.
KIRBY, D.A. 2005. Entrepreneurship education: can business schools meet the
challenge? (In Silicon Valley review of global entrepreneurship research: Papers read
at the San Francisco-Silicon Valley Global Entrepreneurship Research Conference
held in San Francisco on 9 to 12 March 2005. San Francisco. p. 173-193).
KIRBY, D. & IBRAHIM, N. 2012. An enterprise revolution for Egyptian universities.
Business and Society: Contemporary Middle Eastern Issues, 5(2):98-111.
KIRZNER, I.M. 1973. Competition and entrepreneurship. Chicago, IL: University of
Chicago Press.
KLASEN, S. & WOOLARD, I. 2008. Surviving unemployment without state support:
unemployment and household formation in South Africa. Journal of African
Economies, 18(1):1-51.
KOH, H.C. 1996. Testing hypotheses of entrepreneurial characteristics: a study of
Hong Kong MBA students. Journal of Managerial Psychology, 11(3):12-25.
KORHONEN, M., KOMULAINEN, K. & RÄTY, H. 2011. Not everyone is cut out to
be the entrepreneur type: how Finnish school teachers construct the meaning of
entrepreneurship education and the related abilities of the pupils. Scandinavian
Journal of Educational Research, 56(1):1-19.
KOURILSKY, M. L. 1995. Opportunity in search of a curriculum. Kansas City, MO:
Centre for Entrepreneurial Leadership, Ewing Marion Kauffman Foundation.
KROON, J. 2002. ‘n Strategie vir entrepreneurskapontwikkeling in Suid-Afrika.
Tydskrif vir Geesteswetenskappe, 42(3):215-223.
134
KROON, J. & MEYER, S. The role of entrepreneurship education in career
expectations of students. South African Journal of Higher Education, 15(1):47-53.
KRUEGER, N.F. Jr. 1993. The impact of prior entrepreneurial exposure on
perceptions of new venture feasibility and desirability. Entrepreneurship Theory and
Practice, 18(1):5-21.
KRUEGER, N.F. & BRAZEAL, D.V. 1994. Entrepreneurial potential and potential
entrepreneurs. Entrepreneurship Theory and Practice, 18(3):91-104.
KURATKO, D.F. 2009. Introduction to entrepreneurship. 8th ed. South Western,
Canada: Cengage Learning.
KURATKO, D.F. & HODGETTS, R.M. 2001. Entrepreneurship: a contemporary
approach. Mason, OH: South-Western Thomson Learning.
KURATKO, D.F. & HODGETTS, R.M. 2007. Entrepreneurship: theory, process and
practice. 7th
ed. Mason, OH: South-Western Thomson Learning.
LAM, D., LEIBBRANDT, M. & MLATSHENI, C. 2008. Education and youth
unemployment in South Africa. (In A Southern Africa Labour and Development
Research Unit Working Paper, 22. Cape Town: UCT. p. 1-30.)
LEE, S.M., CHANG, D. & LIM, S. 2005. Impact of entrepreneurship education: a
comparative study of the U.S. and Korea. International Entrepreneurship and
Management Journal, 1:27-43.
LEE, S.M. & PETERSON, S.J. 2000. Culture, entrepreneurial orientation and global
competitiveness. Journal of World Business, 35(4):401-416.
LE ROUX, I. 2003. Economic and management science learning area of Curriculum
2005 and entrepreneurial orientation. Pretoria: UP. (Unpublished dissertation –
M.Phil.) 52 p.
135
LEWIS, J.D. 2001. Policies to promote growth and employment in South Africa.
http://www.tips.org.za/files/Policies_to_Promote_Growth_and_Employment_in_South
_Africa.pdf Date of access: 23 April 2012.
LEWIS, J.D. 2002. Promoting growth and employment in South Africa. African
Region Working Papers, 32:1-29.
LEWIS, H. 2011. A model of entrepreneurial capability based on a holistic review of
the literature from three academic domains. Industry & Higher Education, 25(6):429-
440.
LINAN, F. & CHEN, Y. 2006. Testing the entrepreneurial intention model on a two-
country sample. Document de Treball d'economia de l'empresa, núm. 6/7:1-28, Jun.
LOURENCO, F. & JAYAWARNA, D. 2011. Enterprise education: the effect of
creativity on training outcomes. International Journal of Entrepreneurial Behaviour &
Research, 17(3):224-244.
LUIZ, J. & MARIOTTI, M. 2011. Entrepreneurship in an emerging and culturally
diverse economy: a South African survey of perceptions. South African Journal of
Management Science, 14(1):47-65.
LUMPKIN, G.T. & DESS, G.G. 1996. Clarifying the entrepreneurial orientation
construct and linking it to performance. The Academy of Management review,
21(1):135-172.
LYNG, B. 2008. The impact of information systems development education on
entrepreneurial personality traits and cognitions. Ireland: WIT. (Thesis – MSc) 156 p.
MAHADEA, D., RAMROOP, S. & ZEWOTIR, T. 2011. Assessing entrepreneurship
perceptions of high school learners in Pietermaritzburg, KwaZulu-Natal. South
African Journal of Economic and Management Sciences, 14(1):66-79.

136
MAKGOSA, R. & ONGORI, H. 2012. Perceptions of entrepreneurial behaviour in
Botswana. International Journal of Learning & Development, 2(3):247-259.
MARKMAN, G.D., BALKIN, D.B. & BARON R.A. 2002. Inventors and new venture
formation: the effect of general self-efficacy and regretful thinking. Entrepreneurship
Theory and Practice, 27(2):149-165.
MASHIAPATA, M.B. 2006. Self-evaluation of perceived knowledge and skills of
economic and management sciences teachers in South Africa. Pretoria: UP.
(Unpublished dissertation - M.Phil.) 113 p.
MASSEY, D.S. 1988. Economic development and international migration in
comparative perspective. Population and Development Review, 14(3):383-413.
MAYER, M.J., GORDHAN, S., MANXEBA, R., HUGHES, C., FOLEY, P., MAROC,
C., LOLWANA, P. & NELL, M. 2011. (In Towards a youth employment strategy for
South Africa. Development Planning Division, Working Paper Series, 28:1-56).
MAZZAROL, T. 2007. Awakening the entrepreneur: an examination of
entrepreneurial orientation among MBA students. (Paper read at the EFMD 37th
Entrepreneurship, Innovation & Small Business (EISB) Annual Conference on the 13
and 14 September 2007, Ljubljana, Slovenia. p.15.)
MCCLELLAND, D.C. 1961. The achieving society. Princeton, NJ: Van Nostrand.
530 p.
MCCORD, A. & BHORAT, H. 2003. Employment and labour market trends. HRD
Review, 112-141p.
MCGRATH, S. & AKOOJEE, S. 2012. Education and skills for development in
South Africa: reflection on the accelerated and shared growth initiative for South
Africa. International Journal of Educational Development, 27:421-434.
137
MITTON, D.G. 1989. The complete entrepreneur. Entrepreneurship Theory and
Practice, 13(3):9-20.
MORELAND, N. 2006. Entrepreneurship and higher education: an employability
perspective. http://www.heacademy.ac.uk/assets/York/documents/ourwork/tla/
employability/id461_entrepreneurship_and_higher_education_341.pdf Date of
access: 23 May 2012.
MORROW, S., PANDAY, S. & RICHTER, L. 2005. Where we’re at and where we’re
going: young people in South Africa in 2005. Johannesburg: Umsobomvu Youth
Fund. http://www.hsrc.ac.za/research/output/outputDocuments/3474_Morrow_
Wherewereatandwhereweregoing.pdf Date of access: 23 May 2012.
MORSY, H. 2012. Scared generation. Finance & Development, 49(1):15-17.
MUELLER, S.L. 2004. Gender gaps in potential for entrepreneurship across
countries and cultures. Journal of Developmental Entrepreneurship, 9(3):199-220.
MUELLER, S.L. & THOMAS, A.S. 2000. Culture and entrepreneurial potential: a
nine country study of locus of control and innovativeness. Journal of Business
Venturing, 16:51-75.
MUMFORD, A. 1993. Putting learning styles to work: an integrated approach.
Journal of European Industrial Training, 17(10):3-9.
MUMFORD, A. & HONEY, P. 1992. Questions and answers on learning styles
questionnaire. Industrial and Commercial Training, 24(7):10-13.
MUOFHE, N.J. & DU TOIT, W.F. 2011. Entrepreneurial education’s and
entrepreneurial role models’ influence on career choice. South African Journal of
Human Resource Management, 9(1):1-15.
138
NAONG, M.N. 2011. Promotion of entrepreneurship education – a remedy to
graduates and youth unemployment – a theoretical perspective. Journal of Social
Science, 28(3):181-189.
NATIONAL RURAL YOUTH SERVICE CORPS PROGRAMME (NARYSEC). 2012.
http://www.info.gov.za/aboutgovt/programmes/nrysc/index.html Date of access: 10
Sept. 2012.
NATIONAL TREASURY. 2011. Confronting youth unemployment: policy options for
South Africa. Discussion paper. Pretoria: National Treasury. 55p.
NIEMAN, G.H., HOUGH, J. & NIEWENHUIZEN, C. 2003. Entrepreneurship: a
South African perspective. Pretoria: Van Schaik.
NIEUWENHUIZEN, C. 2004. Basics of entrepreneurship. South Africa: Creda
Communications.
NIEUWENHUIZEN, C. & GROENEWALD, D. 2008. Entrepreneurs’ learning
preferences: a guide for entrepreneurship education. Acta Commercii, 8:128-144.
NORTH, E. 2002. A decade of entrepreneurship education in South Africa. South
African Journal of Education, 22(1):24-27.
NQF (National Qualification Framework). 2012. Do you need reliable independent
career, qualification and provider information? Let the NQF help you …
http://www.nqf.org.za/page/nqf-support/learnerships/index Date of access: 10 Sept.
2012.
NATIONAL YOUTH DEVELOPMENT AGENCY (NYDA). 2012. What is NYDA?
http://www.nyda.gov.za/index.php?option=comcontent&view=article&id=67&Itemid=
137 Date of access: 10 Sept. 2012.
139
NATIONAL YOUTH POLICY (NYP). 2009. National youth policy 2009 – 2014.
http://www.thepresidency.gov.za/MediaLib/Downloads/Home/Publications/YouthPubli
cations/NationalYouthPolicyPDF/NYP.pdf Date of access: 20 Feb. 2012
NATIONAL YOUTH SERVICES (NYS). 2012. http://www.did.gpg.gov.za/
Opportunities/Pages/Nationalyouthservice.aspx Date of access: 10 Sept. 2012.
NZIMANDE, B.E. 2012. Reflecting on the current state of Further Education and
Training Colleges as South Africa celebrates the youth month of 2012 by the Minister
of Higher Education and Training at the Hilton Hotel, Durban.
http://www.info.gov.za/speech/DynamicAction?pageid=461&sid=28331&tid=72560htt
Date of access: 10 Sept. 2012.
ORGANISATION FOR ECONOMIC COOPERATION AND DEVELOPMENT (OECD).
2010. OECD Economic surveys: South Africa 2010. 1-124p.
http://www.treasury.gov.za/comm_media/press/2010/2010071901.pdf Date of
access: 24 May 2012.
ORFORD, J. WOOD, E., FISCHER, C., HERRINGTON, M. & SEGAL, E. 2003.
Global entrepreneurship monitor, South African Executive Report. Cape Town: UCT.
Graduate School of Business.
ORGANISJANA, K. & MATLAY, H. 2012. Entrepreneurship as a dynamic system: a
holistic approach to the development of entrepreneurship education. Industry &
Higher Education, 26(3):207-216.
ORHAN, M. & SCOTT, D. 2001. Why women enter into entrepreneurship: an
explanatory model. Women in Management Review, 16(5):232-43.
ORTIZ, I. & CUMMINS, M. 2012. When the global crisis and youth bulge collide:
double the jobs trouble for youth. (In UNICEF Social and Economic Policy Working
Paper. 43 p.)
140
OZLER, B. 2007. Not separate, not equal: poverty and inequality in Post-apartheid
South Africa. Economic Development and Cultural Change, 55(3):487-529.
PATON, C. 2010. Time bomb: the jobless crisis. Financial Mail, 32-36, March, 26.
PAUW, K., OOSTHUIZEN, M. & VAN DER WESTHUIZEN, C. 2008. Graduate
unemployment in the face of skills shortage: a labour market paradox. South African
Journal of Economics, 76(1):45-57.
PERVAIZ, H., ZAINAB SALEEM, M.S. & SAJJAD, M. 2012. Relationship of
unemployment with social unrest and psychological distress: an empirical study of
juveniles. African Journal of Business Management, 6(7):2557-2564.
PHILIP, K. 2012. The rational for an employment guarantee in South Africa.
Development Southern Africa, 29(1):177-190.
PIHIE, Z.A.L. 2009. Entrepreneurship as a career choice: an analysis of
entrepreneurial self-efficacy and intention of university students. European Journal of
Social Sciences, 9(2):338-349.
PITTAWAY, L., HANNON, P., GIBB, A. & THOMPSON, J. 2009. Assessment
practice in enterprise education. International Journal of Entrepreneurial Behaviour &
Research, 15(1):71-93.
PIKE, R. & SHARP, L. 2010. Let’s get South Africa working! Twelve practical ideas
to eliminate unemployment in South Africa. Management Today, 18(7):25-27.
REYNOLDS, P.D. & CURTAIN, R.T. 2008. Business creation in the United States:
panel study of entrepreneurial dynamics II initial assessment. Foundations and
Trends in Entrepreneurship, 4(3):155-307.
ROBINSON, P. & HAYNES, M. 1991. Entrepreneurship education in America's
major universities. Entrepreneurship Theory and Practice, 15(3):41-52.

141
RODRIK, D. 2008. Understanding South Africa’s economic puzzles. The
Economics of Transition, The European Bank for Reconstruction and Development,
16(4):769-797.
ROTTER, J.B. 1954. Social learning and clinical psychology. Englewood Cliffs, NJ:
Prentice Hall.
ROTTER, J.B. 1966. Generalized expectancies for internal versus external control
of reinforcements. Psychological Mono-graphs, 80 (1, Whole No. 609).
SOUTH AFRICAN GRADUATES DEVELOPMENT ASSOCIATION (SAGDA). 2012.
http://www.sagda.org.za/about.html Date of access: 10 Sept. 2012.
SOUTH AFRICAN INSTITUTE FOR ENTREPRENEURSHIP (SAIE). 2006. South
Africa: Alive with possibility. http://www.entrepreneurship.co.za/news/2006/12/01/
south_africa_alive_with_possibility/ Date of access: 22 Feb. 2012.
SCHÖER, V., RANKIN, N. & ROBERTS, G. 2012. Accessing the first job in a slack
labour market: job matching in South Africa. Journal of International Development (In
press).
SCHUMPETER, J.A. 1934. The Theory of Economic Development. Cambridge,
MA: Harvard University Press. (Originally in German 1911, Theorie der
Wirtschaftlichen Entwicklung, Dunker & Humblot, Leipzig).
SCHUMPETER, J. 1951. Change and the entrepreneur, in essays of J.A.
Schumpeter, Richard V. Clerence (Reading, MA: Addison-Wesley, 255).
SEGAL, G., BORGIA, D. & SCHOENFELD, J. 2005. The motivation to become an
entrepreneur. International Journal of Entrepreneurial Behaviour and Research, 11
(1):42-57.
SHARMA, A. 2012. Well-being of youth: impact of unemployment. Advances in
Asian Social Science, 2(4):539-544.
142
SHAY, D. & WOOD, E.A.S. 2004. Can entrepreneurship education in schools equip
South Africa’s future entrepreneurs? Global Entrepreneurship Monitor: South African
Executive Report, 26-32.
SIMPLYBIZ. 2012. http://simplybiz.co.za/comment/498 Date of access: 14 Oct. 2012
SIMRIE, M., HERRINGTON, M., KEW, J. & TURTON, N. 2011. Global
entrepreneurship monitor, South African Executive Report. Cape Town: UCT.
Graduate School of Business.
SMITH, J. 2011. Connecting young South Africans to opportunity: literature review
and strategy. DGMT. 31p.
SOUTH AFRICA. 1996. National Youth Commission Act, no. 19 of 1996. Pretoria.
SOUTH AFRICA. Department of Education (DoE). 1997. Policy document:
Foundation Phase. Pretoria.
SOUTH AFRICA. Department of Education (DoE). 2003. The national curriculum
statement (NCS) grades 10-12 (General): Business Studies. Pretoria.
SOUTH AFRICA. Department of Education (DoE). 2008. The national curriculum
statement (NCS) grades 10-12 (General): Learning programme guidelines, Business
Studies. Pretoria.
SOUTH AFRICA. Department of Education (DoE). 2011. Curriculum and
assessment policy statement (CAPS) - Senior phase grade 7-9: Economic and
Management Science. Pretoria.
SOUTH AFRICA. Department of Public Enterprises (DPE). 2012. Department of
Public Enterprises Youth Programmes. http://www.dpe.gov.za/youth-pg-43 Date of
access: 10 Sept. 2012.
143
SOUTH AFRICA. Department of Public Works (DPW). 2009. Expanded Public
Works Programme five year report 2004/05–2008/09 - Reaching the one million
target. http://www.epwp.gov.za/downloads/EPWP_Five_Year_Report.pdf Date of
access: 10 Sept. 2012.
SOWMYA, V.D., MAJUMDAR, S. & GALLANT, M. 2010. Relevance of education for
potential entrepreneurs: an international investigation. Journal of Small Business and
Enterprise Development, 17(4):626-640.
SOLIDARITY RESEARCH INSTITUTE (SRI). 2011. The South African labour
market and matriculants. http://www.solidaritymedia.co.za/wp-
content/uploads/2012/01/ Matriekverslag-2011-ENG1.pdf Date of access: 3 Feb.
2012.
STATS SA (Statistics South Africa). 2007. Community Survey by municipality,
population group, gender and age group. http://www.statsa.gov.za Date of access:
22 Feb. 2012.
STATS SA (Statistics South Africa). 2010. Mid-year population estimates.
http://www.statsa.gov.za Date of access: 4 Jan. 2012.
STATS SA (Statistics South Africa). 2011. Quarterly Labour Force Survey,
Statistical release PO211, Pretoria. http://www.statsa.gov.za Date of access: 4 Jan.
2012.
STATS SA (Statistics South Africa). 2011. General household Survey. Pretoria.
http://www.statsa.gov.za Date of access: 10 August. 2012.
STATS SA (Statistics South Africa). 2012. Quarterly Labour Force Survey,
Statistical release PO211. Pretoria. http://www.statsa.gov.za Date of access: 10
August. 2012.
144
STEENEKAMP, A.G. 2009. An exploratory study of the entrepreneurial attitudes of
secondary school learners. Potchefstroom: NWU. (Unpublished dissertation – MBA)
200 p.
STEENEKAMP, A.G., VAN DER MERWE, S.P. & ATHAYDE, R. 2011a. An
investigation into youth entrepreneurship in selected South African secondary
schools: an exploratory study. Southern African Business Review, 15(3):46-75.
STEENEKAMP, A.G., VAN DER MERWE, S.P. & ATHAYDE, R. 2011b. Application
of the Attitude Toward Enterprise (ATE) test on secondary school learners in South
Africa. South African Journal of Economic and Management Sciences, 14(3):314-
332.
STEWART, F. 2012. The impact of global economic crisis on the poor: comparing
the 1980s and the 2000s. Journal of Human development and Capabilities: A Multi-
disciplinary Journal of People-Centered Development, 13(1):83-105.
STEYN, G. 2012. Debunking the jobs myths. Finweek: 1, March. 26p.
STORMER, F., KLINE, T. & GOLDENBERG, S. 1999. Measuring entrepreneurship
with the General Enterprising Tendency (GET) Test: criterion-related validity and
reliability. Human Systems Management, 18:47-52.
TIMMONS, J.A. & SPINELLI, S. Jr. 2009. New venture creation entrepreneurship for
the 21st century. 8th ed. NY: Irwin McGraw-Hill. 666 p.
THOMPSON, A. 2006. Entrepreneurship and business innovation. Perth: Murdoch
University. (Unpublished thesis – PhD) 127 p.
THURIK, R.A., CARREE, M.A., STEL, A. & AUDRETSCH, D.B. 2008. Does self-
employment reduce unemployment? Journal of Business Venturing, 23(6):673-686.
145
TRADE AND INDUSTRIAL POLICY STRATEGIES (TIPS). 2012. Community Work
Programme. http://www.tips.org.za/community-work-programme Date of access: 10
Sept. 2012.
TRADING ECONOMICS. 2012. http://www.tradingeconomics.com Date of access:
12 Sept. 2012.
UMSOBOMVU YOUTH FUND. 2010. Economic sector youth job prospects analysis
report. http://www.uyf.org.za/ur/RR_Economic%20Sector %20and%20Youth%20
Job%20Prospect%20Analysis%20rework%20FINAL.pdf Date of access: 12 Dec.
2011.
VAKALISA, N.C.G. 2005. Unemployment in South Africa on the rise: are schools
and universities to blame? Africa Education Review, 2(1):40-58.
VALLETTA, R. & KUANG, K. 2012. Why is unemployment duration so long?
FRBSF Economic Letter, 3:1-5, Jan. 30
VAN AARDT, I., VAN AARDT, C., BEZUIDENHOUT, S. & MUMBA, M. 2008.
Entrepreneurship and new venture management. 3rd
ed. Cape Town: Oxford
University Press.
VAN DEN AARDWEG, E.M. & VAN DEN AARDWEG, E.D. 1993. Psychology of
education: a dictionary for students. 2nd ed. Pretoria: E & E Enterprises.
VAN PRAAG, C.M. 1999. Some classic views on entrepreneurship. De Economist,
147(3):311-335.
VAN STEL, S., CARREE, M. & THURIK, R. 2005. The effect of entrepreneurial
activity on national economic growth. Small Business Economics, 24:311-321.
VON BROEMBSEN, M. WOOD, E. & HERRINGTON, M. 2005. Global
entrepreneurship monitor, South African Executive Report. Cape Town: UCT.
Graduate School of Business.

146
WANBURG, C.R. 2012. The individual experience of unemployment. Annual
Review of Psychology, 63(1):369-396.
WORLD ECONOMIC FORUM (WEF). 2009. Educating the next wave of
entrepreneurs: unlocking entrepreneurial capabilities to meet the global challenges of
the 21st century. (In A report of the global education initiative. p. 1-179.)
WELMAN, J.C., KRUGER, F. & MITCHELL, B. 2005. Research methodology. 3rd
ed. Cape Town: Oxford University Press. 342 p.
WENNEKERS, S. & THURIK, R.A. 1999. Linking entrepreneurship and economic
growth. Small Business Economics, 13(1):27-55.
WONG, P.K., HO, Y.P. & AUTIO, E. 2005. Entrepreneurship, innovation and
economic growth: evidence from GEM data. Small Business Economics, 24(3):335-
350.
YOUTH ENTREPRENEURSHIP PROGRAM (YEP). 2012. http://www.dadfund.org
/mediacentre/30-dad-fund-launches-youth-entrepreneurship-program-in-south-africa
Date of access: 10 Sept. 2012.

147
APPENDIX A
Invitation letter to participate in the study
Juanita M. Barnard
P.O. Box 828 Bultfontein 9670 - Office Tel: (051) 8531768 - Mobile: 082 473 1714 - E-Mail: [email protected] - Fax: 086 293 4226
June 2012 The Principal Secondary Schools in the Lejweleputswa district Dear Sir / Madam RE: RESEARH ON GRADE 12 LEARNERS I am currently a phase III MBA student at the Potchefstroom Business School, North-West University. As part of the curriculum I must submit a dissertation at the end of October 2012. The aim of my study is to research Youth Entrepreneurship and evaluate the perceptions of secondary school learners in the Lejweleputswa district registered with the DoE (Department of Education), and in particular Grade 12 learners. However, a study of this magnitude cannot be conducted without the support of schools in the research area. The purpose of this letter is therefore:
1. To determine the support of your school. 2. To schedule an appointment.
The envisaged empirical study will be conducted from the 13 – 24 August 2012, where the Grade 12 learners will be expected to complete a questionnaire which would take no longer than 30 minutes. Without the assistance of your schools in the research area it would be impossible to conduct the planned research. I therefore kindly request that you complete the attached questionnaire and return it via e-mail to [email protected] or fax it to 086 293 4226. I trust that the value of this research topic for our learners, and the future development of our country will receive your kind consideration. Thank you in advance for your kind support. Yours truly, Juanita

148
Questionnaire
Research on Youth Entrepreneurship: Perceptions of secondary school learners in South Africa Name of School: _______________________________________________________ Physical Address: _______________________________________________________
_______________________________________________________
_______________________________________________________
Postal Address:
_______________________________________________________
_______________________________________________________
_______________________________________________________
Agreement to participate in Empirical Study (2012)
Yes, we agree to participate in the study
No, we do not wish to participate in the study
Total number of Grade 12 learners for 2012
Most convenient time for visit
Monday Tuesday Wednesday Thursday Friday
Time
Questionnaire completed by: Name: _______________________________________________________
Position: _______________________________________________________
Contact number: _______________________________________________________
Date: _______________________________________________________
Thank you for completing and returning this questionnaire!
149
APPENDIX B
General Enterprising Tendency (GET) Test
UNIVERSITY OF DURHAM
SMALL BUSINESS CENTRE
DURHAM BUSINESS SCHOOL
GENERAL ENTERPRISING TENDENCY
(GET) TEST
150
The Durham University General Enterprising Tendency (GET) Test
INTRODUCTION The test has been designed to bring together and measure a number of personal ‘tendencies’ commonly associated with the enterprising person. These include: need for achievement; need for autonomy; creative tendency; risk taking; and drive and determination. The test was designed as part of the work of the Enterprise in Education and Learning Team within the Foundation for Small and Medium Enterprise Development (formerly the Enterprise and Industry Education Unit at Durham Business School). This work has been concerned with the development of Enterprise in schools, further and higher education institutions. There is obviously a need to develop measures of enterprise for purposes of assessment and perhaps also to identify training needs. The General Enterprising Tendency Test embodies the enterprise tendencies described above, expresses them in statement form and measures enterprise aptitudes against norms. The test has been developed following research into a variety of measures used to measure entrepreneurship and enterprise. It has been validated with a number of different groups of personnel and amended accordingly. The aim during this research and development process has been to develop a measure of enterprising tendency rather than of entrepreneurial traits. The GET test may be of use in a variety of situations. It might for example be used to measure the enterprise of personnel involved in providing support to business, social and community enterprise. It might be used to measure the enterprise of those wishing to set up in business. It might be used, just as importantly, by employers concerned to foster enterprising individuals within their own organisations. It may be used in the recruitment and selection of personnel. It may be used to identify changes that have taken place as a result of training or exposure to certain structured situations designed to encourage enterprise. A great deal of research has been undertaken into the process of enterprise development. Much of this in the past has concentrated on the personality of the entrepreneur in attempting to identify entrepreneurial traits. It has been argued that these desires, drives and attitudes ensure that an individual has the willingness to take responsibility, the determination to complete projects, the creativity which will lead to innovation and a healthy appreciation of risk. This research, much of which stems from the work of Atkinson and McClelland in the 1960’s is controversial, particularly in respect of whether measures taken are of ‘inherent’ as opposed to ‘learned’ traits. The Durham research, funded by the University Grants Committee, carried out by Sally Caird under the direction of Professor Gibb and Cliff Johnson, extensively reviewed the literature and a variety of related tests. *Out of this review and out of subsequent experiment came the GET test. The test has been used extensively in teaching and research. This booklet explains how the test can be administered and the results usefully collated.
*Report on the Development and Validation of a Measure of General Enterprising Tendency. *A Review of Methods of Measuring. Sally Caird DUBS August 1988

151
Instructions This exercise could not be simpler:
It will only take about ten minutes
There are no right or wrong answers
It will help you to gain a better understanding of yourself In the following pages of this booklet, you will find a list of 54 different statements. You are merely required to agree or disagree with the statements that have been made. For example, one statement might say:
I prefer swimming to running
or
I often take on too many tasks On the answer sheet provided, you should:
Circle the A in the box which corresponds to the statement if you agree with the statement,
OR
Circle the D if you disagree with the statement. If, for any reason, you neither fully agree nor fully disagree with a particular statement, please try to decide whether you agree with it more or disagree with it more and circle the appropriate answer. Please be honest when completing the answer sheet. The more accurate your answers are increases the precision of the test. Now turn over the page to begin the test.
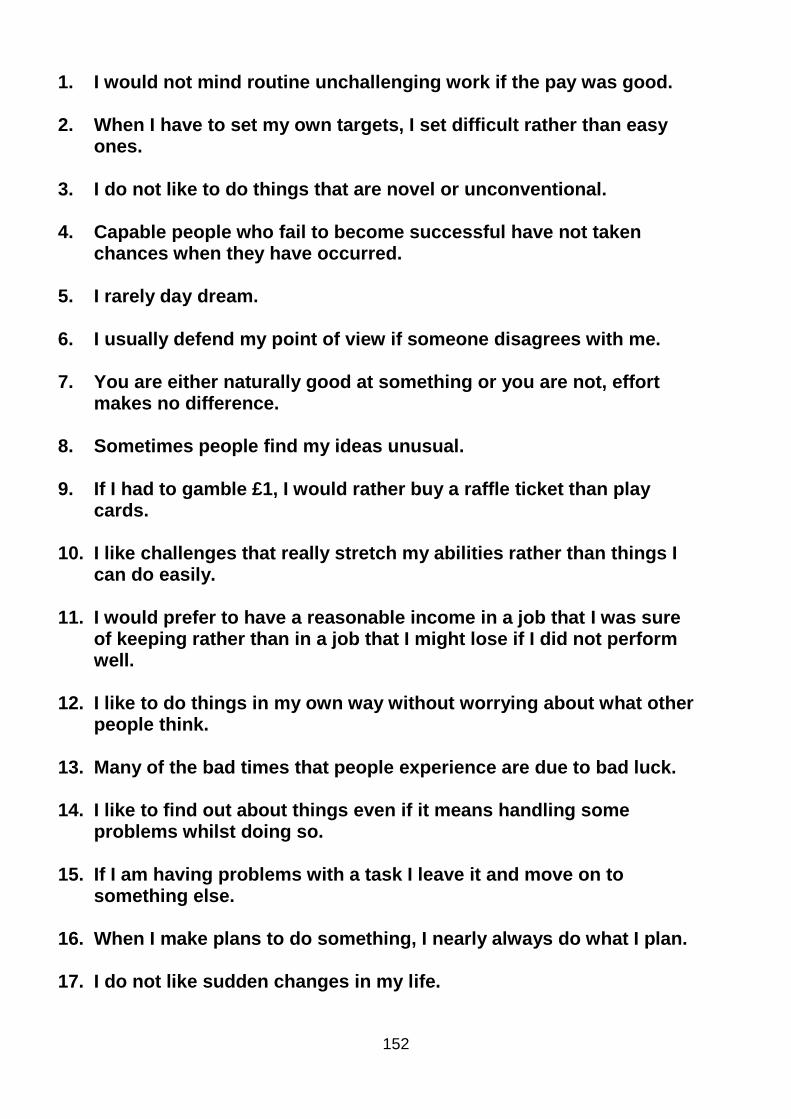
152
1. I would not mind routine unchallenging work if the pay was good.
2. When I have to set my own targets, I set difficult rather than easy ones.
3. I do not like to do things that are novel or unconventional.
4. Capable people who fail to become successful have not taken chances when they have occurred.
5. I rarely day dream.
6. I usually defend my point of view if someone disagrees with me.
7. You are either naturally good at something or you are not, effort makes no difference.
8. Sometimes people find my ideas unusual.
9. If I had to gamble £1, I would rather buy a raffle ticket than play cards.
10. I like challenges that really stretch my abilities rather than things I can do easily.
11. I would prefer to have a reasonable income in a job that I was sure of keeping rather than in a job that I might lose if I did not perform well.
12. I like to do things in my own way without worrying about what other people think.
13. Many of the bad times that people experience are due to bad luck.
14. I like to find out about things even if it means handling some problems whilst doing so.
15. If I am having problems with a task I leave it and move on to something else.
16. When I make plans to do something, I nearly always do what I plan.
17. I do not like sudden changes in my life.

153
18. I will take risks if the chances of success are 50/50.
19. I think more of the present and the past than of the future.
20. If I had a good idea for making some money, I would be willing to borrow some money to enable me to do it.
21. When I am in a group I am happy to let someone else take the lead.
22. People generally get what they deserve.
23. I do not like guessing.
24. It is more important to do a job well than to try to please people.
25. I will get what I want from life if I please the people with control over me.
26. Other people think that I ask a lot of questions.
27. If there is a chance of failure I would rather not do it.
28. I get annoyed if people are not on time.
29. Before I make a decision I like to have all the facts no matter how long it takes.
30. When tackling a task I rarely need or want help.
31. Success cannot come unless you are in the right place at the right time.
32. I prefer to be quite good at several things rather than very good at one thing.
33. I would rather work with a person I liked, but who was not very good at the job, than work with someone I did not really like who was very good at the job.
34. Being successful is the result of working hard, luck has nothing to do with it.
35. I prefer doing things in the usual way rather than trying out new ways.

154
36. Before making an important decision, I prefer to weigh up the pros and cons rather quickly rather than spending a lot of time thinking about it.
37. I would rather work on a task as a member of a team than to take responsibility for it myself.
38. I would rather take an opportunity that might lead to even better things than have an experience that I am sure to enjoy.
39. I do what is expected of me and follow instructions.
40. For me, getting what I want has little to do with luck.
41. I like to have my life organised so that it runs smoothly and to plan.
42. When I am faced with a challenge I think more about the results of succeeding than the effects of failing.
43. I believe that what happens to me in life is determined mostly by other people.
44. I can handle a lot of things at the same time.
45. I find it difficult to ask favours from other people.
46. I get up early, stay late or skip meals in order to get special tasks done.
47. What we are used to is usually better than what is unfamiliar.
48. Most people think that I am stubborn.
49. People’s failures are rarely the result of their poor judgement.
50. Sometimes I have so many ideas I do not know which one to pick.
51. I find it easy to relax on holiday.
52. I get what I want from life because I work hard to make it happen.
53. It is harder for me to adapt to change than keep to routine.
54. I like to start new projects that may be risky.

155
ANSWER SHEET
THE DURHAM UNIVERSITY GET TEST

156
ASSESS THE RESULTS
CALCULATING YOUR SCORE
Starting with box 1 in the top right hand corner of your answer sheet and working across the sheet to the left, give yourself one point for every D that you have circled in the shaded boxes on that line like this:
Similarly give yourself one point for every A that you have circled in the unshaded boxes on
that line like this:
Now add up your total score in the top row and write it in the margin.
Do the same for the remaining eight rows scoring in the same manner as above.
When you have finished transfer your scores for each row to the boxes below.
ROW 1 …. ROW 2 …. ROW 3 ….
ROW 4 …. ROW 5 …. ROW 6 ….
ROW 7 …. ROW 8 …. ROW 9 ….
Please add the total for row 1 and row 6 together.
This will give you a score for Section 1 ….
Row 3 alone will give you a score for Section 2 ….
Add your scores in rows 5 and 8 for Section 3 ….
Add your scores in rows 2 and 9 for Section 4 ….
Add your scores in rows 4 and 7 for Section 5 ….

157
ASSESSING YOUR SCORE
Each section assesses particular attributes. A high score in any category means that you have many of the qualities which that particular section has been measuring. The sections are as follows:
SECTION 1 Need for achievement
Maximum score – 12 Average score – 9 If you have scored well in this section you have many if not all of the following qualities:
Forward looking Self sufficient Optimistic rather than pessimistic Task orientated Results orientated Restless and energetic Self-confident Persistent and determined Dedication to completing a task
SECTION 2 Need for autonomy/independence
Maximum score – 6 Average score – 4 The person who scores high in this section: Likes doing unconventional things
Prefers working alone Need to do their ‘own thing’ Needs to express what they think Dislikes taking orders Likes to make up their own mind Does not bow to group pressure Is stubborn and determined
SECTION 3 Creative tendency
Maximum score – 12 Average score – 8 A high score in this section means that you:
Are imaginative and innovative Have a tendency to daydream Are versatile and curious Have lots of ideas Are intuitive and guess well Enjoy new challenges Like novelty and change

158
SECTION 4 Moderate/calculated risk taking Maximum score – 12 Average score – 8 If you have done well in this section, you tend to:
Act on incomplete information Judge when incomplete data is sufficient Accurately assess your own capabilities Be neither over nor under-ambitious Evaluate likely benefit against likely costs Set challenging but attainable goals
SECTION 5 Drive and determination
Maximum score – 12 Average score – 8 If you have achieved a high score in this section, you tend to:
Take advantage of opportunities Discount fate Make your own luck Be self-confident Believe in controlling your own destiny Equate results with effort Show considerable determination
THANK YOU VERY MUCH FOR COMPLETING THIS EXERCISE
Please discuss your results with the person who supervised your test

159
APPENDIX C
Demographical information
DEMOGRAPHICAL INFORMATION
Please answer the following questions. Mark choice with a clear ‘X’
Name of school:
Your age:
17
[01]
18
[02]
19
[03]
20
[04]
21
[05]
Other (please specify)
…………….. [06]
Gender: Female
[01]
Male
[02]
Home language
Afrikaans
[01]
English
[02]
S.Sotho
[03]
N.Sotho
[04]
Tswana
[05]
Xhosa
[06]
Zulu
[07]
Other (please specify)
…………………[08]
Please mark your ethnic group (for statistical purpose only)
Asian
[01]
Black
[02]
Coloured
[03]
White
[04]
Other (please specify)
…………………………[05]