Amylin Pharmaceuticals, Inc.
Financial Analysis Report
Prepared by: Danielle Davis and Liz Van Hemel
Presented to: Dr. Mohammed Ahmed
December 15, 2009

Amylin Pharmaceuticals, Inc. Financial Analysis Report 1
Table of Contents
EXECUTIVE SUMMARY 5 INTRODUCTION 6 Company Background 6 Mission 7 Goals and Objectives 7 Revenues 8 Assets 11 Growth Rate 14 Market Position 15 Company Strategies/Products 16 Management and Corporate Culture 18 Strategic Partnerships 19 MARKET OUTLOOK 20 General Overview 20 Historical Performance 21 Future Outlook 23 INDUSTRY OUTLOOK 23 Nature of the Industry 23 Industry Composition 26 Industry Growth 26 Opportunities and Threats 27 Future Outlook 29 FINANCIAL STATEMENT ANALYSIS 31 Income Statement 31 Common Size Income Statement 32 Balance Sheet 34 Common Size Balance Sheet 35 Statement of Cash Flows 37 Cash Flow Analysis 40 Financial Ratio Analysis 43

Amylin Pharmaceuticals, Inc. Financial Analysis Report 2
STRENGTHS AND WEAKNESSES ANALYSIS 54 Financial Ratios Industry Comparison 54 Strengths 57 Weaknesses 57 Reasons for Level of Performance 61 FINANCIAL FORECASTING 62 Growth Rate Data 62 Pro Forma Income Statement 68 Pro Forma Balance Sheet 70 CAPITAL STRUCTURE ANALYSIS 72 VALUATION ANALYSIS 77 Book Value 77 Market Value 77 Common Stock Valuation 77 Liquidation Value 78 BANKRUPTCY ANALYSIS 79 VALUE-BASED FINANCIAL ANALYSIS 81 RECOMMENDATIONS 82 REFERENCES 84 APPENDIX 88

Amylin Pharmaceuticals, Inc. Financial Analysis Report 3
List of Tables
Table 1: Product Sales (2006-2008) 8
Table 2: Revenues from Collaborative Agreements (2006-2008) 9
Table 3: Total Revenues (2004-2008) 10
Table 4: First Six Months Total Revenue Comparison (2008 & 2009) 10
Table 5: Amylin & Top Competitors Total Revenue Comparison (2006-2008) 11
Table 6: Summary of Current and Long-Term Assets (2006-2008) 12
Table 7: Mid-year Assets (2008 & 2009) 12
Table 8: Amylin and Top Competitors Asset Comparison (June 30, 2009) 13
Table 9: Product Sales & Total Revenue Growth (2006-2008) 14
Table 10: Amylin Management Team 18
Table 11: Outline of Strategic Collaborations 19
Table 12: Disease Trends 27
Table 13: Company Financial Ratio Comparisons 55
Table 14: Summary of Financial Weaknesses 58
Table 15: Biotechnology Industry Revenue Growth (2005-2008) 63
Table 16: Biotechnology Industry Expected Revenue Growth (2009-2011) 63
Table 17: Weighted Average Cost of Capital 76
Table 18: Bankruptcy Analysis Ratios 80
Table 19: Altman’s Bankruptcy Model Z-Score Computation 80

Amylin Pharmaceuticals, Inc. Financial Analysis Report 4
List of Figures
Figure 1: Historical Performance of Major Market Indices 22
Figure 2: Income Statement (2006-2008) 31
Figure 3: Common Size Income Statement (2006-2008) 32
Figure 4: Operations Overview (2006-2008) 33
Figure 5: Balance Sheet (2006-2008) 34
Figure 6: Common Size Balance Sheet (2006-2008) 35
Figure 7: Asset Structure (2006-2008) 36
Figure 8: Liability & Equity Structure (2006-2008) 36
Figure 9: Statement of Cash Flows (2006-2008) 37
Figure 10: Cash Flow Balances (2006-2008) 39
Figure 11: Cash Flow by Activity (2006-2008) 39
Figure 12: Company Comparisons of ROA, ROE, and ROI (Year ended 12/31/08) 56
Figure 13: Growth Rate Determination 65
Figure 14: Pro Forma Income Statement for 2009 68
Figure 15: Pro Forma Balance Sheet for 2009 70
Figure 16: Capital Structure (2006-2009) 74
Amylin Pharmaceuticals, Inc. Financial Analysis Report 5
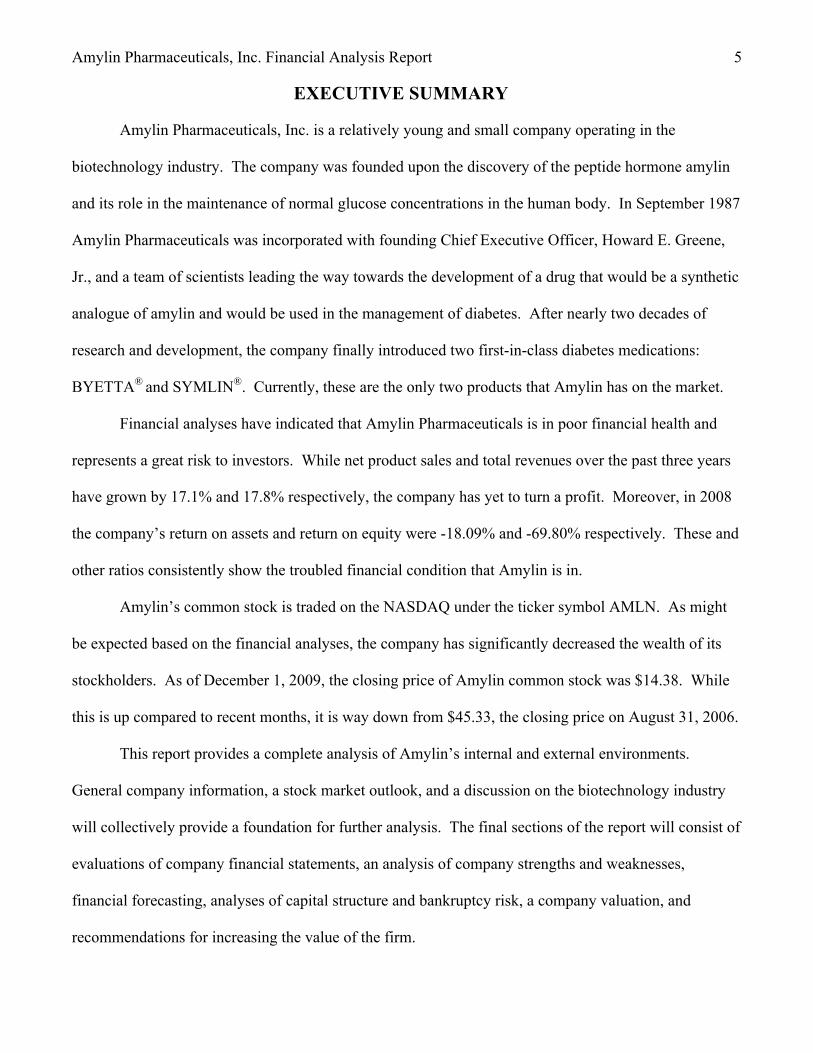
EXECUTIVE SUMMARY
Amylin Pharmaceuticals, Inc. is a relatively young and small company operating in the
biotechnology industry. The company was founded upon the discovery of the peptide hormone amylin
and its role in the maintenance of normal glucose concentrations in the human body. In September 1987
Amylin Pharmaceuticals was incorporated with founding Chief Executive Officer, Howard E. Greene,
Jr., and a team of scientists leading the way towards the development of a drug that would be a synthetic
analogue of amylin and would be used in the management of diabetes. After nearly two decades of
research and development, the company finally introduced two first-in-class diabetes medications:
BYETTA® and SYMLIN®. Currently, these are the only two products that Amylin has on the market.
Financial analyses have indicated that Amylin Pharmaceuticals is in poor financial health and
represents a great risk to investors. While net product sales and total revenues over the past three years
have grown by 17.1% and 17.8% respectively, the company has yet to turn a profit. Moreover, in 2008
the company’s return on assets and return on equity were -18.09% and -69.80% respectively. These and
other ratios consistently show the troubled financial condition that Amylin is in.
Amylin’s common stock is traded on the NASDAQ under the ticker symbol AMLN. As might
be expected based on the financial analyses, the company has significantly decreased the wealth of its
stockholders. As of December 1, 2009, the closing price of Amylin common stock was $14.38. While
this is up compared to recent months, it is way down from $45.33, the closing price on August 31, 2006.
This report provides a complete analysis of Amylin’s internal and external environments.
General company information, a stock market outlook, and a discussion on the biotechnology industry
will collectively provide a foundation for further analysis. The final sections of the report will consist of
evaluations of company financial statements, an analysis of company strengths and weaknesses,
financial forecasting, analyses of capital structure and bankruptcy risk, a company valuation, and
recommendations for increasing the value of the firm.

Amylin Pharmaceuticals, Inc. Financial Analysis Report 6
INTRODUCTION
Company Background
In the late 1980s, groundbreaking research was being carried out by a group of Oxford
University scientists that involved the discovery of the peptide hormone amylin and its role in
the maintenance of normal glucose concentrations in the human body. These scientists
discovered that amylin is created in and secreted from the same pancreatic beta cells that produce
insulin. In a normal, healthy individual these two hormones, in conjunction with another
pancreatic hormone, glucagon, would work together to preserve normal glucose levels; however,
in people with diabetes, the collaborative functions of these three hormones are thrown out of
balance. These research findings were the inspiration behind Amylin Pharmaceuticals, Inc. In
September 1987 Amylin Pharmaceuticals was incorporated in the state Delaware, with Howard
E. Greene, Jr. as the founding Chief Executive Officer. Greene had two decades of experience
with eleven different medical technology companies and was compelled to carry on the research
begun at Oxford with the realization that this revelation could lead to significant improvements
in the treatment of diabetes. So Greene and a team of scientists began efforts to develop a drug
that would be a synthetic analogue of amylin and would be used in the management of the
disease (Funding Universe, 2005).
The company struggled and toiled away for nearly 18 years (relying on R&D funding
from venture capitalists), until finally in 2005 it successfully introduced two first-in-class
diabetes medications: BYETTA® and SYMLIN® (products will be discussed in detail later in the
text). It was at this point in time that the company transformed from a research organization into
an “integrated biopharmaceutical company with capabilities in research, development,
manufacturing, and commercialization” (Amylin, 2009).

Amylin Pharmaceuticals, Inc. Financial Analysis Report 7
In 1992, five years after its inception, the company went public and has since been
trading on the National Association of Securities Dealers Automated Quotations (NASDAQ)
National Market under the ticker symbol AMLN. Amylin Pharmaceuticals is headquartered in
San Diego, California. The company ends its fiscal year on December 31st, and its website
address on the World Wide Web is www.amylin.com.
Mission
“Amylin Pharmaceuticals is a biopharmaceutical company committed to improving the lives of people with diabetes, obesity and other diseases through the discovery, development and commercialization of innovative medicines.”
—Amylin Pharmaceuticals’ 2008 Annual Report
Although Amylin Pharmaceuticals does not layout a specific mission statement, the
following maxim is clearly stated on its company website, in its Annual Report, and throughout
other company documentation, and it certainly serves the purpose of an effective mission
statement in that it identifies who they are (a biopharmaceutical company), who their customers
are (people with diabetes, obesity, and other diseases), and their reason for existence (improve
lives through the discovery, development and commercialization of innovative medicines).
Goals and Objectives
Amylin has outlined a five-point plan to generate value in 2009 (following points taken
directly from www.amylin.com):
• Growing revenue from BYETTA® (exenatide) injection, our first-in-class marketed product for type 2 diabetes;
• Bringing exenatide once weekly to patients as quickly as possible;
• Growing revenue from our second marketed diabetes product, SYMLIN® (pramlintide acetate) injection;
• Continuing development of potentially breakthrough therapies for obesity; and

Amylin Pharmaceuticals, Inc. Financial Analysis Report 8
• Lowering our cost structure to improve operating results and shorten our path to profitability.
Moreover, in a press release dated July 21, 2009 and titled “Amylin Pharmaceuticals Reports
Second Quarter Financial Results,” the company’s senior vice president of finance and chief
financial officer, Mark G. Foletta, made the following statement: “We set a goal of becoming
operating cash flow positive by the end of 2010, and we have taken considerable steps toward
achieving that goal.” This goal reiterates the plan to improve operating results as revealed in the
last point mentioned above while attaching a target deadline to this plan.
While the company is unclear about its specific objectives for growing revenues from
BYETTA® and SYMLIN® and its objectives for swiftly bringing exenatide to market, its 2008
Annual Report does address its goal for lowering its cost structure to boost operating results and
curtail its path to profitability. This will be discussed later in the company strategies section.
Revenues
As mentioned before, Amylin Pharmaceuticals is currently selling only two products,
BYETTA® and SYMLIN®. Table 1 below shows the sales (in millions) from each of these
products over the past 3 years as well as the net product sales (in millions) for the two products
combined.
Table 1: Product Sales (2006-2008)
Year ended December 31, 2008 2007 2006 BYETTA® $678.5 $636.0 $430.2 SYMLIN® 86.8 65.5 43.8 Net Sales $765.3 $701.5 $474.0 Source: Amylin Pharmaceuticals, 10-K, February 27, 2009
What can be gleaned from the above table is that sales for both products have been on the
rise, and clearly BYETTA® accounts for a significant portion of net sales. BYETTA® sales as a
Amylin Pharmaceuticals, Inc. Financial Analysis Report 9
percentage of net product sales were 88.7%, 90.7%, and 90.8% for the years 2008, 2007, and
2006 respectively. On the other hand, SYMLIN® sales as a percentage of net product sales were
11.3%, 9.3%, and 9.2% for those same years.
For a look at individual and net product sales for the current year, attention is turned to
the company’s quarterly report for the quarter ended June 30, 2009. According to this latest
report, revenues for the six months ended June 30, 2009 for BYETTA® and SYMLIN® were
$332.8 million and $44.0 million respectively; these revenues are combined to reach net product
revenues of $376.8 million. Revenues for the same period in 2008 were $336.0 million from
BYETTA® and $43.1 million from SYMLIN® for a total of $379.1 million.
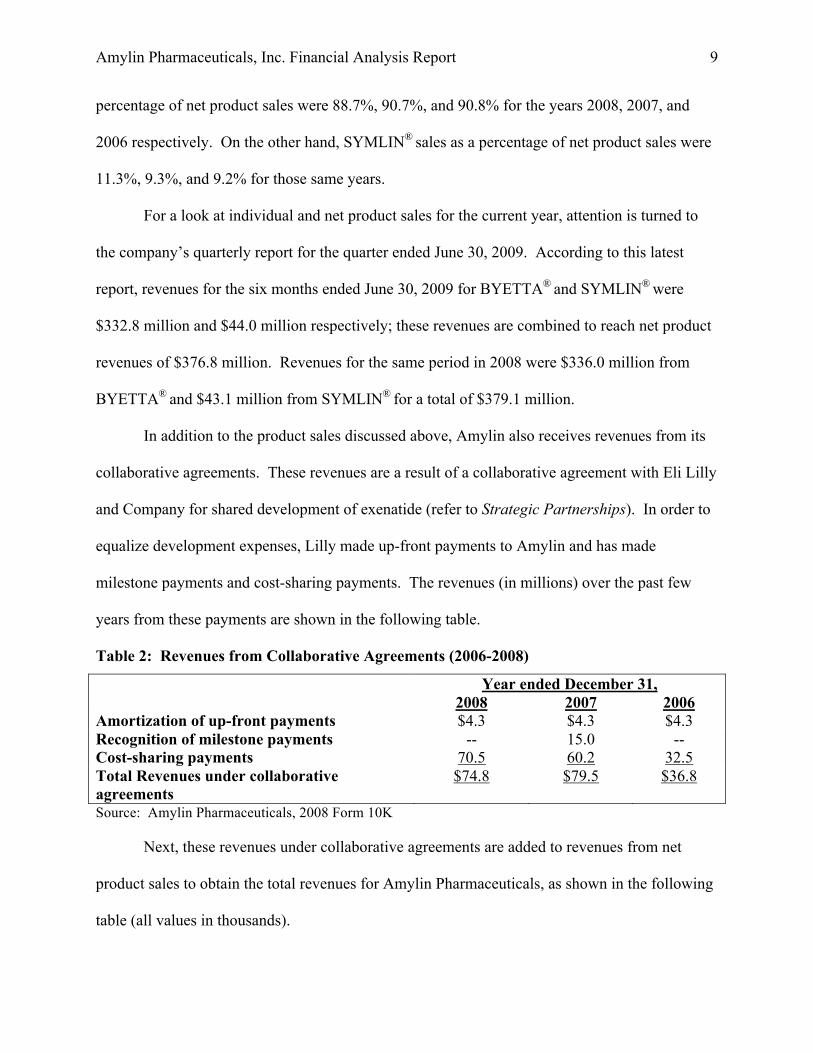
In addition to the product sales discussed above, Amylin also receives revenues from its
collaborative agreements. These revenues are a result of a collaborative agreement with Eli Lilly
and Company for shared development of exenatide (refer to Strategic Partnerships). In order to
equalize development expenses, Lilly made up-front payments to Amylin and has made
milestone payments and cost-sharing payments. The revenues (in millions) over the past few
years from these payments are shown in the following table.
Table 2: Revenues from Collaborative Agreements (2006-2008)
Year ended December 31, 2008 2007 2006 Amortization of up-front payments $4.3 $4.3 $4.3 Recognition of milestone payments -- 15.0 -- Cost-sharing payments 70.5 60.2 32.5 Total Revenues under collaborative agreements
$74.8 $79.5 $36.8
Source: Amylin Pharmaceuticals, 2008 Form 10K Next, these revenues under collaborative agreements are added to revenues from net
product sales to obtain the total revenues for Amylin Pharmaceuticals, as shown in the following
table (all values in thousands).

Amylin Pharmaceuticals, Inc. Financial Analysis Report 10
Table 3: Total Revenues (2004-2008)
Years Ended December 31, 2008 2007 2006 2005 2004 Net Product Sales
$765,342
$701,450
$474,038
$86,713
---
Revenues under collaborative agreements
74,767
79,547
36,837
53,761
34,268
Total Revenues $840,109 $780,997 $510,875 $140,474 $34,268 Source: Amylin Pharmaceuticals, Form 10-K, February, 27, 2009 Note: Amylin’s products were first launched in 2005; thus, no product sales exist for 2004.
It is apparent that Amylin has experienced significant growth in revenues over this five
year period. In fact, the compound annual growth rate (CAGR) is equal to 90% (calculated as
CAGR = [(Ending Value/Beginning Value) ^ (1/#of years)] – 1).
Finally, we’ll take a look at total revenues for the first six months of 2009 compared to
total revenues for the same period in 2008 as provided by Amylin’s quarterly report for the
quarter ended June 30. Again, all values are in thousands of U.S. dollars.
Table 4: First Six Months Total Revenue Comparison (2008 & 2009)
Six Months Ended June 30, 2009 2008 Net Product Sales
$376,829
$379,056
Revenues under collaborative agreements 26,217 40,200 Total Revenues $403,046 $419,256 Source: “Amylin Pharmaceuticals Reports Second Quarter Financial Results,” 2009
Now, in order to have an understanding of how Amylin’s revenues compare to those of
other firms in the Biotechnology industry, attention is turned to Amylin’s top competitors as
defined by Hoover’s and Yahoo Finance: GlaxoSmithKline, Merck & Co., Inc., and Novo
Nordisk. Revenues (in millions of US Dollars) over the past three years for each of these
companies are presented in Table 5 below. Amylin’s total revenues are shown once again to aid
in comparisons.

Amylin Pharmaceuticals, Inc. Financial Analysis Report 11
Table 5: Amylin & Top Competitors Total Revenue Comparison (2006-2008)
December 2008 December 2007 December 2006 GlaxoSmithKline 35,244.6 45,347.9 45,479.2 Merck 23,850.3 24,197.7 22,636.0 Novo Nordisk 8,627.7 8,257.4 6,853.6 Amylin Pharmaceuticals 840.1 781.0 510.9 Source: Hoover’s Company Records
As these numbers reveal, Amylin’s revenues are minimal compared to those of its top
competitors. The most likely reasons for these significant differences in revenues are history and
number of products on the market. Merck and Novo Nordisk were founded in 1891 and 1923
respectively, and while GlaxoSmithKline was only recently established in 2000, its history goes
as far back as the early eighteenth century (“About Merck,” “About Novo Nordisk” & “Our
history-About GlaxoSmithKline,” 2009). With Amylin’s history only tracing back to the late
1980s, it is like a baby in the industry.
Because Amylin’s competitors have been in the industry for a greater length of time, they
have many more products on the market. For instance, Merck markets nearly a hundred different
products and GlaxoSmithKline sells even more (numerous prescription medicines, vaccines, and
consumer healthcare products). Novo Nordisk, on the other hand, currently has nine products on
the market (“About Novo Nordisk,” 2009); this is reflected in their considerably lower revenues
compared to GlaxoSmithKline and Merck. All in all, since Amylin is presently selling only two
products, it is easy to see why their revenues are meager in comparison to its competition.
Assets
The information in the subsequent table shows a summary of Amylin Pharmaceuticals’
current and long-term assets as drawn from its consolidated balance sheets from the years 2006,
2007, and 2008. All values are in thousands of US Dollars.

Amylin Pharmaceuticals, Inc. Financial Analysis Report 12
Table 6: Summary of Current and Long-Term Assets (2006-2008)
December 31, 2008 2007 2006 Current Assets: Cash & cash equivalents $237,263 $422,232 $66,640 Short-term investments 579,575 708,183 700,691 Accounts receivable, net 62,369 73,579 58,089 Inventories, net 115,823 100,214 59,299 Other current assets 41,038 32,100 22,098 Total Current Assets 1,036,068 1,336,308 906,817 Property, plant and equipment, net 636,922 390,301 146,779 Other long-term assets 23,755 28,082 2,870 Debt issuance costs 15,884 19,520 3,920 Total Assets $1,712,629 $1,774,211 $1,060,386 Source: Amylin Pharmaceuticals, 2008 and 2007 Form 10K Between the year 2006 and the year 2007, Amylin had increases in both current assets
and long-term assets. Particularly, the company had a significant increase in cash and cash
equivalents, net inventories, property, plant and equipment, and other long-term assets.
However, by 2008, the company had a nearly 44% decrease in cash and cash equivalents and
about an 18% decrease in short-term investments. Another notable change was the significant
increased investment in property, plant, and equipment between the years 2007 and 2008
(roughly a 63% change).
For a more recent snapshot of Amylin’s current and long-term assets, we turn to its
consolidated balance sheet presented in its most recent quarterly report.
Table 7: Mid-year Assets (2008 & 2009)
June 30, 2009 2008 Current Assets: Cash & cash equivalents $111,272 $237,263 Short-term investments 533,166 579,575 Accounts receivable, net 76,405 62,369 Inventories, net 109,803 115,823 Other current assets 64,839 41,038

Amylin Pharmaceuticals, Inc. Financial Analysis Report 13
Total Current Assets 895,485 1,036,068 Property, plant and equipment, net 714,541 655,444 Other long-term assets 30,077 23,755 Debt issuance costs 10,264 11,786 Total Assets $1,650,367 $1,727,053 Source: Form 10-Q, 2009
Finally, Amylin’s top competitors’ (GlaxoSmithKline, Merck, and Novo Nordisk) assets
will be evaluated to facilitate an understanding of how the company’s assets stack-up relative to
its competition. All values (in millions of US Dollars) are taken from the consolidated balance
sheets of each of the companies’ most recent quarterly reports in order to reflect the most up-to-
date asset information.
Table 8: Amylin and Top Competitors Asset Comparison (June 30, 2009)
GlaxoSmithKline Merck Novo Nordisk
Amylin
06/30/09 06/30/09 06/30/09 06/30/09 Current Assets: Cash & cash equivalents $5,346.0 $12,457.6 $8,863.0 $111.272 Short-term investments 573.0 4,474.7 1,091.0 533.166 Accounts receivable, net 5,363.0 3,663.4 7,254.0 76.405 Inventories, net 3,910.0 2,155.3 9,900.0 109.803 Other current assets 2.0 - - 6.037 Total Current Assets 15,249.0 29,233.9 29,727.0 895.485 Property, plant and equipment, net 8,875.0 11,711.3 18,760.0 714.541 Other long-term assets 3,063.0 6,331.7 1,489.0 40.341 Total Assets $35,961.0 $49,407.1 $51,246.0 $1,650.367 Source: Business & Company Resource Center, 2009
Clearly, the value of Amylin’s assets (current and long-term) is significantly less than
those of its competitors. As aforementioned when differences in revenues were discussed,
Amylin is relatively young and small compared to its competition. This fact accounts for the
sharp contrast between the company’s assets and its top competitors’ assets.

Amylin Pharmaceuticals, Inc. Financial Analysis Report 14
Growth Rate
Amylin continues to grow as a leader in diabetes research and development. In October
2008, the American Diabetic Association (ADA) and its European counterpart, the EASD,
updated guidelines regarding treatment for diabetes establishing BYETTA® (exenatide) as the
only approved secondary treatment option for diabetes type II (Amylin, 2009). In August 2008,
the Food and Drug Administration (FDA) updated a warning for BYETTA®, sighting a link
between the drug and pancreatitis. This resulted in fewer prescriptions of the drug in the second
half of 2008. However, it appears that this trend has stabilized, as Amylin sent out field
representatives to educate about the product's safety profile and prescribing recommendations
(Amylin, 2009). The decrease in prescriptions and product demand is likely the cause of net
sales dropping from $379,056,000 in the six months ending June 30, 2008 to $376,829,000
during the same period in 2009 (Amylin, 2009).
Amylin has also developed a new class of medication under the trade name SYMLIN®.
This medication also focuses on diabetes mellitus type I/II treated with insulin that has not met
glycemic goals. This product utilizes pre-filled pen injections to deliver simple fixed doses at
mealtimes (Amylin, 2009). Product sales in the first six months of 2009 ending June 30 were
$44 million, up from $43.1 million during the same period in 2008 (Amylin, 2009).
Overall, Amylin has experienced significant growth in individual product sales and total
revenues over the past several years. This growth over the past few years is highlighted in Table
9 below.
Table 9: Product Sales & Total Revenue Growth (2006-2008)
Year ended 12/31/08 Year ended 12/31/06 CAGR* BYETTA® sales $678.5M $430.2M 16.3% SYMLIN® sales 86.8M 43.8M 25.3% Net product sales 765.3M 474.0M 17.1% Total Revenues 840.109M 510.875M 17.8%

Amylin Pharmaceuticals, Inc. Financial Analysis Report 15
Source: Form 10-K, 2009 *CAGR=Compound Annual Growth Rate=[(Ending Value/Beginning Value)^(1/#of years)] – 1) Clearly there has been positive growth in sales and revenues for Amylin across the board,
with the most growth seen in product sales of SYMLIN®. However, despite these revenue
growths, Amylin has been unable to grow owner earnings. Investors have seen a dramatic
decrease in stock price over the past few years. As of August 31, 2009, the closing price of
Amylin common stock was $12.60. This is way down from $45.33, the closing price on August
31, 2006 (Yahoo! Finance, 2009). Lack of growth in stockholder wealth will be further
expressed in the financial statement analysis section.
Market Position
As aforementioned, Amylin Pharmaceuticals is a relatively small and young company in
the market. It also has only two products on the market, both for the treatment of diabetes. This
is in sharp contrast to industry leaders who have numerous drugs on the market, often times in
multiple different treatment areas. For example, a leading competitor, GlaxoSmithKline, has its
roots traced back to the 18th century and has over a hundred products on the market ranging from
prescription medications for treatment of osteoporosis to oral health care products (“Our history-
About GlaxoSmithKline,” 2009). Another large-cap company in the industry is Genzyme
Corporation. Genzyme has over twenty diverse products on the market and has been operating
since 1981 (“About Genzyme,” 2009).
While large-cap firms such as the two mentioned above obviously overshadow Amylin, it
is important to understand that they are the exception, rather than the rule. In the biotechnology
industry there are only about a dozen such large-cap companies. The numbers of smaller scale
firms significantly outweigh the number of large firms (Silver, 2009). In this light, it can be
concluded that while Amylin is not a big player in the industry, it is not uncommonly small.
Amylin Pharmaceuticals, Inc. Financial Analysis Report 16
Company Strategy/Products
BYETTA®
Plans with BYETTA® include continued promotion of the product as the first and only
FDA approved product of its class and publicizing data reassuring patients and physicians of the
product safety (over one million users) when compared to other common diabetic medications
(Amylin, 2009). There will be continued emphasis of the ADA guidelines recommending
BYETTA® and continued collaboration with Eli Lilly for product commercialization.
Exenatide Once Weekly
Exenatide once weekly is in the advanced stages of research trials with promising data
and results. Patients have lower incidences of hypoglycemia (low blood sugar), even when used
in combination with other commonly prescribed diabetes medications (Amylin, 2009). The once
weekly administration of exenatide has shown an average 9.5 pound weight loss and lowered
A1C levels by 2% in trials (Amylin, 2009). If approved, this medication will be marketed as the
"opportunity to transform diabetes therapy" (Amylin, 2009). The clinical trials to date have met
FDA requirements to allow for a new drug application (NDA), and the NDA will be submitted
by the end of 2009.
Anticipating approval of once weekly exenatide, Amylin invested with Lilly and
Alkermes Inc. in a manufacturing facility in Ohio in 2008 with the ability to produce commercial
levels of the product ready for immediate distribution. This product will rely on the safety
profile of BYETTA® and unique value proposition to patients, doctors, and payers (Amylin,
2009).

Amylin Pharmaceuticals, Inc. Financial Analysis Report 17
SYMLIN®
Amylin intends to focus growth for the product SYMLIN® on the unmet needs of patients
on insulin who have not been able to meet therapy goals. The product has been used for four
years and assists with glucose fluctuations, weight loss, and over A1C reduction. It is 100%
wholly owned by Amylin and has been used by over 100,000 patients.
OBESITY
Amylin has appropriately identified obesity as a major contributor to diabetes and is
focusing efforts to educate health providers and patients as to the important relationship between
excessive weight and high blood sugar as well as the risks of cardiovascular disease associated
with these conditions. In the research and development pipeline, Amylin is focusing on the
peptides amylin and leptin, as they are related to appetite, saity, and weight management. A new
agent, davalintide, is in clinical trials for weight management (Amylin, 2009).
In response to the FDA warning on BYETTA®, Amylin carefully restructured its sales
force to specifically target medical doctors that write BYETTA® and SYMLIN® prescriptions.
This lead to an actual reduction in sales force, including managed care and the government
affairs sections of the organization. The workforce in San Diego was trimmed by 25%. Amylin
plans to continue to work with Eli Lilly to enhance effectiveness of the sales and marketing
organization. With continued surveillance of the changing marketplace, new products in
development, and anticipatory planning for once weekly exenatide with a commercial
production facility in place, Amylin anticipates positive cash flow by 2010 (Amylin Annual
Report, 2008).
Amylin Pharmaceuticals, Inc. Financial Analysis Report 18
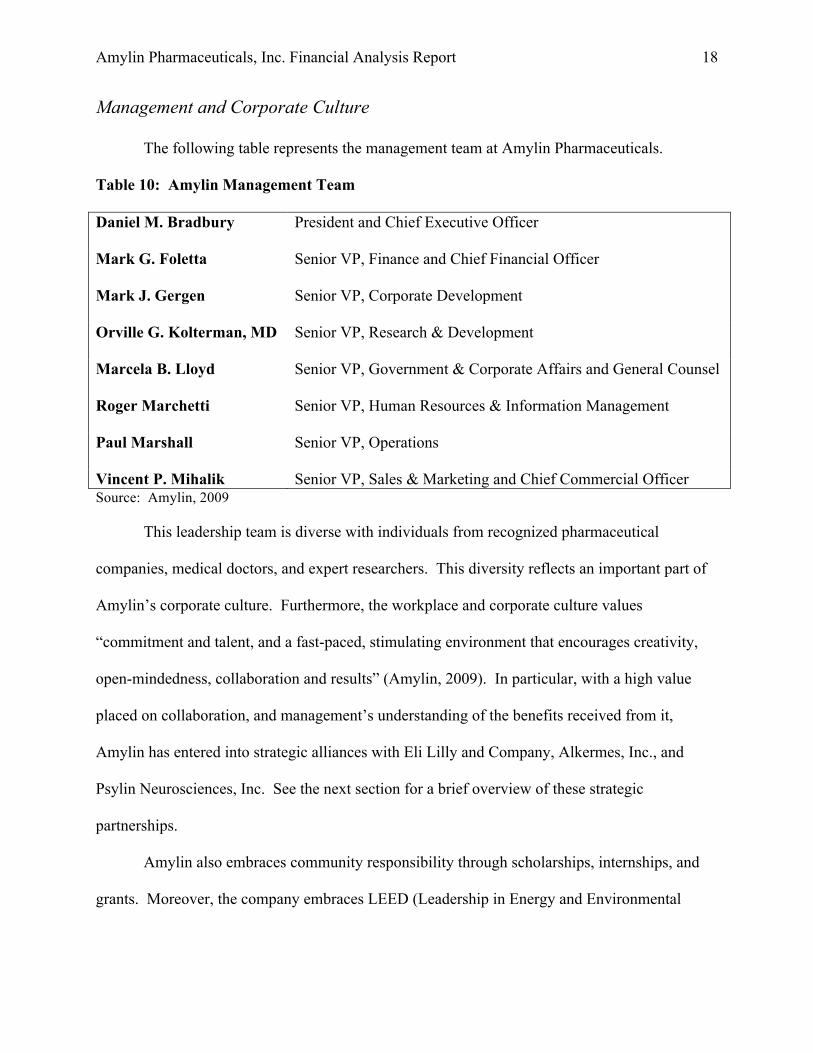
Management and Corporate Culture
The following table represents the management team at Amylin Pharmaceuticals.
Table 10: Amylin Management Team
Daniel M. Bradbury
President and Chief Executive Officer
Mark G. Foletta
Senior VP, Finance and Chief Financial Officer
Mark J. Gergen
Senior VP, Corporate Development
Orville G. Kolterman, MD
Senior VP, Research & Development
Marcela B. Lloyd
Senior VP, Government & Corporate Affairs and General Counsel
Roger Marchetti
Senior VP, Human Resources & Information Management
Paul Marshall
Senior VP, Operations
Vincent P. Mihalik Senior VP, Sales & Marketing and Chief Commercial Officer Source: Amylin, 2009
This leadership team is diverse with individuals from recognized pharmaceutical
companies, medical doctors, and expert researchers. This diversity reflects an important part of
Amylin’s corporate culture. Furthermore, the workplace and corporate culture values
“commitment and talent, and a fast-paced, stimulating environment that encourages creativity,
open-mindedness, collaboration and results” (Amylin, 2009). In particular, with a high value
placed on collaboration, and management’s understanding of the benefits received from it,
Amylin has entered into strategic alliances with Eli Lilly and Company, Alkermes, Inc., and
Psylin Neurosciences, Inc. See the next section for a brief overview of these strategic
partnerships.
Amylin also embraces community responsibility through scholarships, internships, and
grants. Moreover, the company embraces LEED (Leadership in Energy and Environmental
Amylin Pharmaceuticals, Inc. Financial Analysis Report 19
Design) Green Buildings for its California locations and the Ohio plant. Employees of Amylin
have won several awards for environmental care and management (Amylin, 2009).
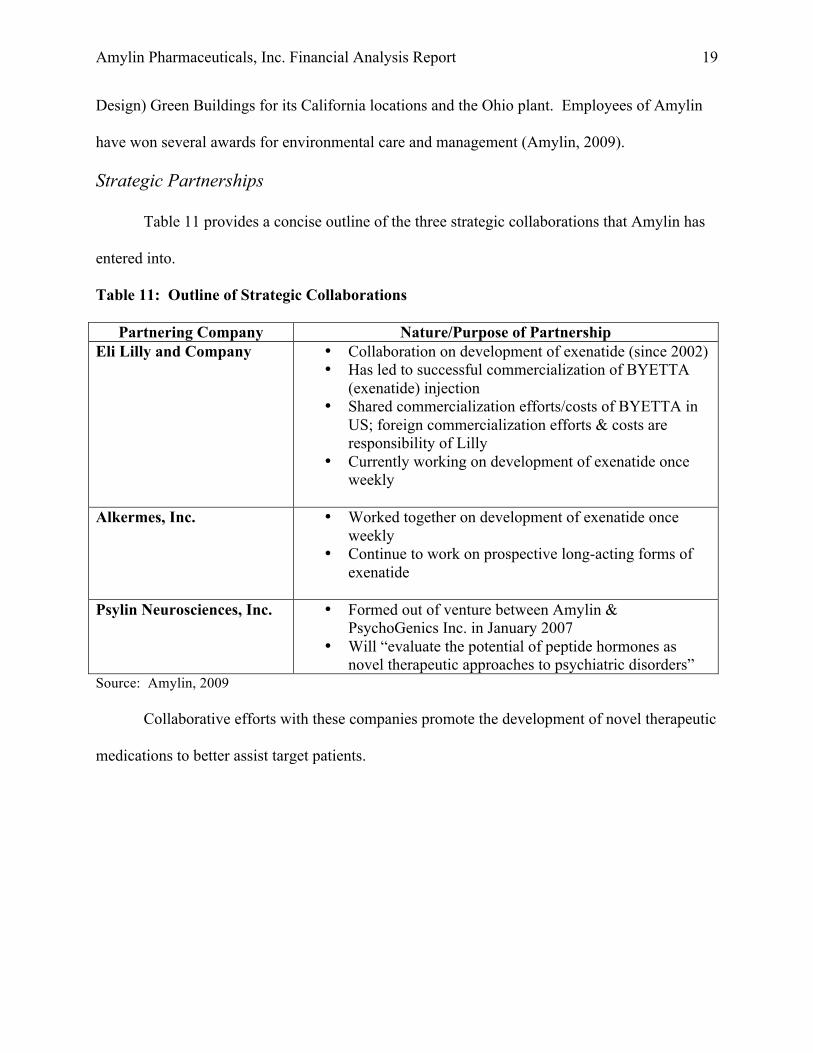
Strategic Partnerships
Table 11 provides a concise outline of the three strategic collaborations that Amylin has
entered into.
Table 11: Outline of Strategic Collaborations
Partnering Company Nature/Purpose of Partnership Eli Lilly and Company • Collaboration on development of exenatide (since 2002)
• Has led to successful commercialization of BYETTA (exenatide) injection
• Shared commercialization efforts/costs of BYETTA in US; foreign commercialization efforts & costs are responsibility of Lilly
• Currently working on development of exenatide once weekly
Alkermes, Inc. • Worked together on development of exenatide once weekly
• Continue to work on prospective long-acting forms of exenatide
Psylin Neurosciences, Inc. • Formed out of venture between Amylin & PsychoGenics Inc. in January 2007
• Will “evaluate the potential of peptide hormones as novel therapeutic approaches to psychiatric disorders”
Source: Amylin, 2009 Collaborative efforts with these companies promote the development of novel therapeutic
medications to better assist target patients.

Amylin Pharmaceuticals, Inc. Financial Analysis Report 20
MARKET OUTLOOK
General Overview
Securities exchanges are the marketplaces where stocks are traded. The New York Stock
Exchange (NYSE) is the most famous and lists more than 3,000 common and preferred stocks
(Boone & Kurtz, 2007). The NYSE has a trading floor in an open auction fashion for stocks that
meet the listing requirements.
The National Association of Securities Dealers Automated Quotations (NASDAQ)
System is a computerized network that links member investment firms (Brigham & Ehrhardt,
2008). While the NYSE occupies a physical place, all trading on the NASDAQ takes place on
the NASDAQ intranet. There are approximately 5,000 stocks traded on the NASDAQ, many of
these being technology company listings and smaller, less well known companies that do not
meet criteria for listing on the NYSE. Amylin has had its stock traded on the NASDAQ (under
the ticker symbol AMLN) since its initial public offering (IPO) in 1992 (Funding Universe,
2005).
In addition to the two aforementioned stock markets, there is the American Stock
Exchange and various regional stock exchanges; however, daily trading volume on these other
stock markets is minimal when compared to the NYSE and NASDAQ.
The securities markets are regulated by the Securities and Exchange Commission (SEC),
which was created in 1934. It is the principal federal overseer of the securities markets and
carries the responsibility of administering securities laws and protecting investors in public
securities transactions. The SEC requires that all new public issues of corporate securities be
registered. Securities laws also require public corporations to issue an annual report called a 10-
K form with the SEC. Moreover, these public corporations must submit reports each time there

Amylin Pharmaceuticals, Inc. Financial Analysis Report 21
is a change in company officers, whenever stock is bought or sold directors, and if there is an
investor that accumulates more than 5% of the company's outstanding stock (Boone & Kurtz,
2007).
Historical Performance
The general performance of the different securities markets are described by the Dow
Jones Industrial Average. It is an index that shows how publicly traded companies have traded
during a session and is considered a gauge of economic activity (Boone & Kurtz, 2007). The
Standard and Poor's (S&P) 500 Index is also used as a stock market indicator. These
performance indices historically fluctuate with economic variables that affect businesses, banks,
and consumers. Most company securities are compared to these indices to assist investors in the
evaluation of their stock purchases with a given company. Historically, the Dow Jones Industrial
Average and the S&P 500 have fluctuated and have had ups and downs. These fluctuations are
due to the rising and falling of the prices of the pooled stocks that make up the indices. To
understand why stock prices are subject to such instability, it is important to remember the basic
fact that it is expectations over the future course of a company’s earnings and the economy that
lead an investor to sell or buy stock. And of course it is the selling and buying (supply and
demand) of the stock that determine its price. Every day, new information is disseminated
through the market which changes investors’ expectations about the future of either the company
or the economy, or both. The changing outlook in turn causes supply and demand for various
stocks to fluctuate. Thus, in a free market such as that of the U.S., the market will always be
fluctuating. Figure 1 below illustrates the performance of Dow Jones Industrial Average (^DJI),
the S&P 500 Index (^GSPC), and the NASDAQ Composite Index (^IXIC) over the past ten

Amylin Pharmaceuticals, Inc. Financial Analysis Report 22
years in terms of price (or value). Collectively viewing the activity of these three key indices
provides a fair understanding of the overall market’s performance.
Figure 1: Historical Performance of Major Market Indices
Source: Yahoo! Finance, 2009
As is evident by the figure above, the market has had its highs and lows over the past
decade. In this time frame, the market was at its highest performance in late 1999 to early 2000
and at its lowest in late 2008 to early 2009 (not surprising given the deep economic recession we
were in).

Amylin Pharmaceuticals, Inc. Financial Analysis Report 23
Future Outlook
The stock market in the past year has experienced extreme volatility. To date, the
economy has been stagnant with various economic changes made to assist with improving the
current conditions. These changes have included lowered interest rates, "Cash for Clunkers,”
various government bailouts, financial institution re-structuring, credit card law changes,
mortgage refinances, etc. The results of these activities have yet to be seen and their outcome
remains uncertain.
The market has seen significant improvements over the past seven months, and the
market is generally expected to improve as the economy recovers. An article posted on
CNNMoney.com on November 2, 2009 stated that, “The first and second quarters of next year
are expected to move toward a more moderate rate of growth, rising 37.6% and 20.9%
respectively” (Twin, 2009). So much of the market performance outlook hinges upon how
quickly the economy recovers. Different analysts have different opinions as to the speed and
strength of recovery, making predictions about the near future market performance challenging.
However, it seems that the general consensus is that the market will be experiencing moderate
growth over the next few years.
INDUSTRY OUTLOOK Nature of the Industry
Amylin Pharmaceuticals, Inc. operates in the biotechnology industry. According to
Standard & Poor’s (S&P’s) survey on the industry, “Biotechnology refers to the application of
biological and biochemical science to large-scale production of products to modify human
health, food supplies, or the environment” (Silver, 2009, 19). While many of the fundamental

Amylin Pharmaceuticals, Inc. Financial Analysis Report 24
foundations of the industry can be traced back thousands of years (i.e. the use of living
organisms such as bacteria and fungus to process foods and beverages), pioneering research in
genetics and molecular biology in recent years has resulted in significant advances for the
industry. Such industry advances and innovations have typically focused on treatment in the
following areas: cancer, infectious diseases (such as HIV and AIDS), auto-immune disorders,
osteoporosis and diabetes. Into the future, it is expected that the industry will continue to
develop and produce cutting-edge drugs in these particular areas. Other advances in areas such
as stem-cell research and human cloning face a more turbulent future due to public and political
opposition. The industry currently faces, and will continue to face, many developmental
obstacles in such areas. However, the biotechnology industry is no stranger to challenges and
obstacles. The industry is highly regulated and vulnerable to legal and political conditions.
Because this is such a major element of the nature of the industry, it merits a brief discussion.
The U.S. Food and Drug Administration (FDA) is the primary overseer of this industry
and are responsible for drug approvals and management of drug safety. The regulatory process
for new drugs is extremely costly and time consuming and represents a critical hurdle that all
potential new products in the industry must pass. Many products fail to get approval from the
FDA, resulting in significant losses for the developing company. Unfortunately, a number of
factors are making FDA approval even more difficult for this industry. First and foremost, the
FDA is inundated with petitions for new product approvals, yet they lack funding and resources
to meet this demand. As a result, the administration often misses deadlines, lengthening the time
for new drug approvals. Moreover, elevated safety concerns are slowing the process due to new
and more guidelines and extended clinical studies. Essentially, it is important to understand here

Amylin Pharmaceuticals, Inc. Financial Analysis Report 25
that the FDA plays a critical role in this industry, and the heavy regulations make for a
challenging industry climate in which significant losses are common.
Extraordinary costs are another aspect of the biotech industry that is inherent in its nature.
Most of these costs arise throughout a drug’s discovery and development process. Typically, this
process consists of the following steps: early discovery, preclinical development, clinical trials,
and regulatory filing and review. A 2006 study conducted by Tufts Center for the Study of Drug
Development estimated that the average cost to develop a new drug in this industry is about $1.2
billion dollars. For small, young biotech firms, this is particularly challenging. These firms
depend heavily on funds from private, wealthy investors, small groups of investors, and venture
capitalists. These high costs also make partnerships critical (and common) in this industry.
Smaller firms join together with larger firms to benefit from shared expenditures. Often times
the larger firms have deep pockets that enable them to cover up-front fees for the smaller firms
as well as provide research and development (R&D) funding. Moreover, these larger companies
typically have greater manufacturing capabilities that the smaller companies can benefit from.
Funding for R&D is perhaps one of the most critical ways that larger companies can help smaller
ones because R&D is very much the backbone of the industry. R&D is necessary in this industry
to stay competitive and for the development of innovative new drugs. Its importance is
supported by the fact that R&D spending as a percentage of revenues in the industry is among
the highest of any U.S. industry. According to Ernst & Young LLP, U.S. public biotech
companies spent approximately $25.3 billion (47% of product sales) on R&D in 2008, compared
to $21 billion (48%) in 2007.

Amylin Pharmaceuticals, Inc. Financial Analysis Report 26
A final point to be made about the nature of the biotechnology industry is that it is very
volatile. Some of the issues discussed above contribute to its volatility, while other reasons will
be addressed in the later section on industry opportunities and threats.
Industry Composition
The biotechnology industry is composed of numerous companies varying in size from
small start-ups to multibillion-dollar firms. There are relatively few multibillion-dollar firms in
the industry, yet these industry leaders (i.e. Amgen Inc., Biogen Idec Inc., Celgene Corp.,
Genzyme Corp., etc.) account for the bulk of industry revenues, profits, and market
capitalization. Moreover, there is a downtrend in the number of large-cap companies due to
industry consolidation. In fact, consolidation through mergers and acquisitions (M&A) is the
name of the game in this industry. This is reflected in the recent decrease in the number of
biotech-related, publicly traded companies in the U.S. There are approximately 350 of these
companies currently trading, versus about 380 in 2008 (Silver, 2009). Bankruptcies and the
absence of initial public offerings since 2008 have also contributed to this trend.
Industry Growth
Industry growth is believed to be slowing; however, evidence still shows overall growth.
“According to BioPharm Insight, a newsletter that focuses on the life sciences business,
biotechs accounted for 42% of preclinical candidates and 26% of submissions for US marketing
approval in 2007 (latest available), up from 34% and 18%, respectively, in 2006” (Silver, 2009,
11). Moreover, it is expected that 50% of the top 100 drugs in 2014 will be biotech drugs.
According to Ernst and Young, industry product sales grew from $52.7 billion in 2007 to
$57.0 billion in 2008, representing an 8.2% change. Revenues grew slightly less (8.0%), from
$64.9 billion in 2007 to $70.1 billion in 2008 (Silver, 2009).

Amylin Pharmaceuticals, Inc. Financial Analysis Report 27
Growth prospects remain positive for this industry in part because industry demand is
predominantly linked to the population’s health, rather than to economic cycles. An aging
population, an increase in average life-expectancy, and the mounting cases of chronic disease all
point to increased demand for biotech drugs (Silver, 2009). A growing market will likely
translate into growth for the industry if companies can continue to develop and produce
innovative, safe, and effective new drugs.
Opportunities and Threats
In discussing the nature, composition, and growth prospects of the biotechnology
industry, some issues have been discussed that represent opportunities and threats for this
industry. Perhaps the greatest opportunity is the demographic trends that were briefly mentioned
in the previous section. These global trends include an aging population, a longer average life
expectancy, and an increase in chronic disease cases. According to the U.S. Census Bureau, as
of late 2006, just less than 13% of the U.S. population was aged 65 or older. This segment of the
population is expected to grow to roughly 19.7% of the total population by the year 2030. This
is a significant trend for the biotech industry considering that over one-third of the country’s total
consumption of prescription drugs came from this segment in 2006 (Silver, 2009, 14). As for the
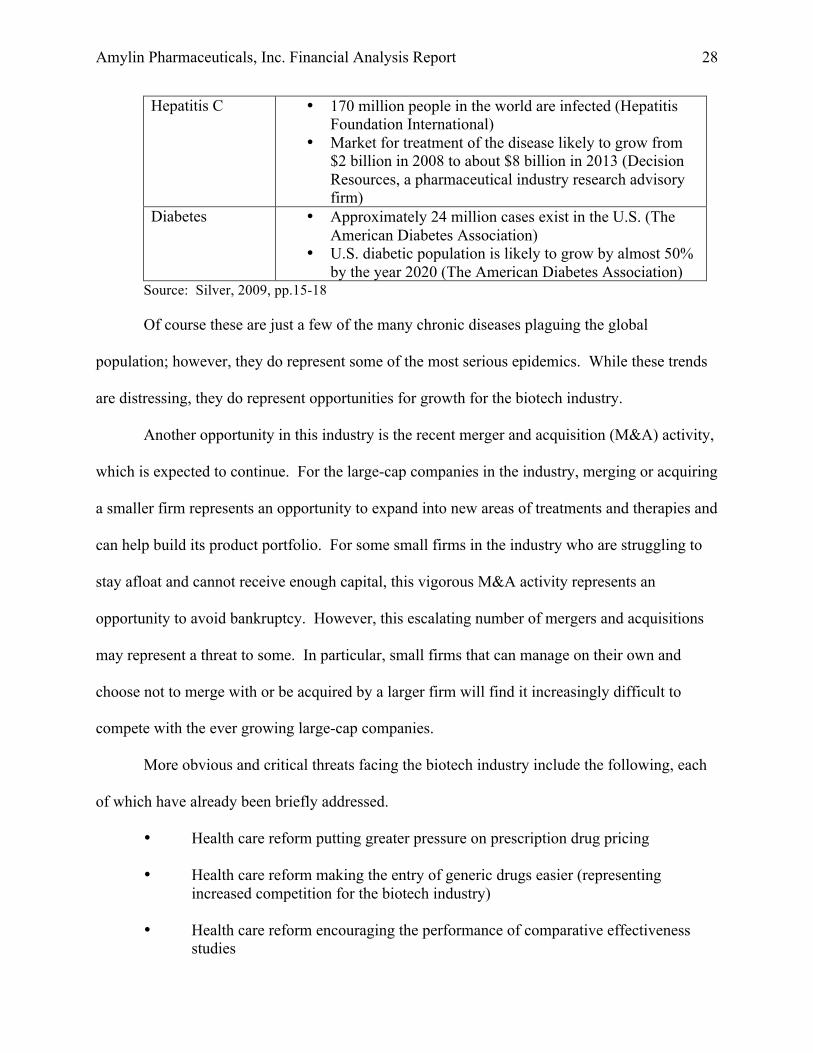
upward trend in chronic disease incidences, Table 12 below highlights a few of the disease trends
being seen globally.
Table 12: Disease Trends
Disease Trend
Cancer • About 12 million new cases internationally in 2007 (American Cancer Society)
• Likely to be #1 killer by 2010 (World Health Org.) HIV/AIDS • 2.5 million new cases in 2007 (United Nations)
• At least 33 million cases globally (United Nations)
Amylin Pharmaceuticals, Inc. Financial Analysis Report 28
Hepatitis C • 170 million people in the world are infected (Hepatitis Foundation International)
• Market for treatment of the disease likely to grow from $2 billion in 2008 to about $8 billion in 2013 (Decision Resources, a pharmaceutical industry research advisory firm)
Diabetes • Approximately 24 million cases exist in the U.S. (The American Diabetes Association)
• U.S. diabetic population is likely to grow by almost 50% by the year 2020 (The American Diabetes Association)
Source: Silver, 2009, pp.15-18
Of course these are just a few of the many chronic diseases plaguing the global
population; however, they do represent some of the most serious epidemics. While these trends
are distressing, they do represent opportunities for growth for the biotech industry.
Another opportunity in this industry is the recent merger and acquisition (M&A) activity,
which is expected to continue. For the large-cap companies in the industry, merging or acquiring
a smaller firm represents an opportunity to expand into new areas of treatments and therapies and
can help build its product portfolio. For some small firms in the industry who are struggling to
stay afloat and cannot receive enough capital, this vigorous M&A activity represents an
opportunity to avoid bankruptcy. However, this escalating number of mergers and acquisitions
may represent a threat to some. In particular, small firms that can manage on their own and
choose not to merge with or be acquired by a larger firm will find it increasingly difficult to
compete with the ever growing large-cap companies.
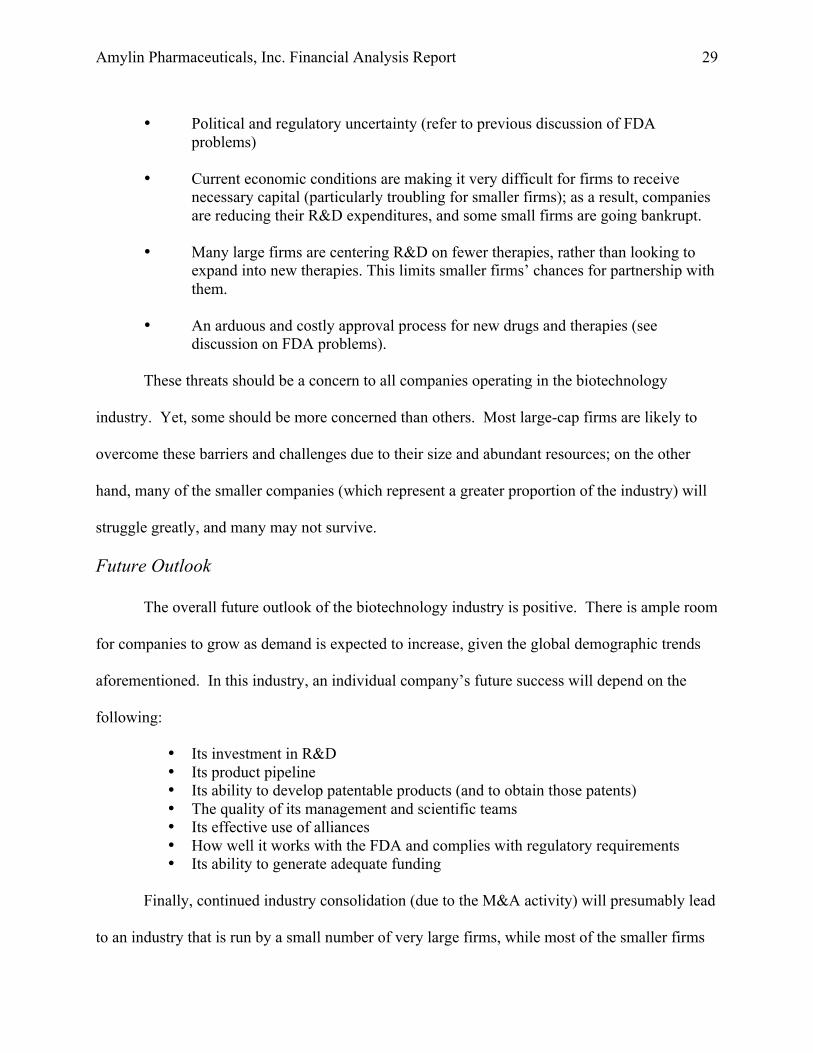
More obvious and critical threats facing the biotech industry include the following, each
of which have already been briefly addressed.
• Health care reform putting greater pressure on prescription drug pricing
• Health care reform making the entry of generic drugs easier (representing increased competition for the biotech industry)
• Health care reform encouraging the performance of comparative effectiveness
studies
Amylin Pharmaceuticals, Inc. Financial Analysis Report 29
• Political and regulatory uncertainty (refer to previous discussion of FDA
problems) • Current economic conditions are making it very difficult for firms to receive
necessary capital (particularly troubling for smaller firms); as a result, companies are reducing their R&D expenditures, and some small firms are going bankrupt.
• Many large firms are centering R&D on fewer therapies, rather than looking to
expand into new therapies. This limits smaller firms’ chances for partnership with them.
• An arduous and costly approval process for new drugs and therapies (see
discussion on FDA problems).
These threats should be a concern to all companies operating in the biotechnology
industry. Yet, some should be more concerned than others. Most large-cap firms are likely to
overcome these barriers and challenges due to their size and abundant resources; on the other
hand, many of the smaller companies (which represent a greater proportion of the industry) will
struggle greatly, and many may not survive.
Future Outlook
The overall future outlook of the biotechnology industry is positive. There is ample room
for companies to grow as demand is expected to increase, given the global demographic trends
aforementioned. In this industry, an individual company’s future success will depend on the
following:
• Its investment in R&D • Its product pipeline • Its ability to develop patentable products (and to obtain those patents) • The quality of its management and scientific teams • Its effective use of alliances • How well it works with the FDA and complies with regulatory requirements • Its ability to generate adequate funding
Finally, continued industry consolidation (due to the M&A activity) will presumably lead
to an industry that is run by a small number of very large firms, while most of the smaller firms

Amylin Pharmaceuticals, Inc. Financial Analysis Report 30
will be weeded out. Moreover, because this M&A activity is not isolated within the industry, but
is also occurring between this industry and the pharmaceutical industry, the distinction between
the two industries will be increasingly blurred.

Amylin Pharmaceuticals, Inc. Financial Analysis Report 31
FINANCIAL STATEMENT ANALYSIS
Figure 2: Income Statement (2006-2008)
Amylin Pharmaceuticals, Inc. Consolidated Income Statements (Years 2006-2008)
(in thousands, except per share data) Year ended December 31, 2008 2007 2006 Revenues:
Net Product Sales $ 765,342 $ 701,450 $ 474,038 Revenues under collaborative agreements 74,767 79,547 36,837
Total Revenues 840,109 780,997 510,875 Costs and expenses:
Costs of goods sold 91,596 65,457 50,073 Selling, general, and administrative 395,112 390,982 281,950 Research and development 293,095 276,600 222,053 Collaborative profit-sharing 302,600 290,934 194,191 Restructuring 54,926 — —
Total costs and expenses
(1,137,329)
(1,023,973) (748,267) Operating loss (297,220) (242,976) (237,392) Make-whole payment on debt redemption — — (7,875) Interest and other income 26,561 46,969 34,903 interest and other expense (29,803) (15,129) (8,492) Loss on impairment of investments (14,943) — —
Net loss $ (315,405.00) $(211,136.00) $ (218,856.00)
Net loss per share--basic & diluted $ (2.30) $ (1.59) $ (1.78) Shares used in computing net loss per share, basic & diluted 137,006 132,621 122,647

Amylin Pharmaceuticals, Inc. Financial Analysis Report 32
Figure 3: Common Size Income Statement (2006-2008)
Amylin Pharmaceuticals, Inc. Common Size Income Statements (Years 2006-2008)
Year ended December 31, 2008 2007 2006 Revenues:
Net Product Sales 91.10% 89.81% 92.79% Revenues under collaborative agreements 8.90% 10.19% 7.21%
Total Revenues 100% 100% 100% Costs and expenses:
Costs of goods sold 10.90% 8.38% 9.80% Selling, general, and administrative 47.03% 50.06% 55.19% Research and development 34.89% 35.42% 43.47% Collaborative profit-sharing 36.02% 37.25% 38.01% Restructuring 6.54% — —
Total costs and expenses -135.38% -131.11% -146.47% Operating loss -35.38% -31.11% -46.47% Make-whole payment on debt redemption — — -1.54% Interest and other income 3.16% 6.01% 6.83% interest and other expense -3.55% -1.94% -1.66% Loss on impairment of investments -1.78% — — Net loss -37.54% -27.03% -42.84%

Amylin Pharmaceuticals, Inc. Financial Analysis Report 33
Figure 4: Operations Overview (2006-2008)

Amylin Pharmaceuticals, Inc. Financial Analysis Report 34
Figure 5: Balance Sheet (2006-2008)
Amylin Pharmaceuticals, Inc.
Consolidated Balance Sheets (Years 2006-2008) (in thousands, except per share data)
December 31, 2008 2007 2006 ASSETS Current assets:
Cash and cash equivalents $ 237,263 $ 422,232 $ 66,640 Short-term investments 579,575 708,183 700,691 Accounts receivable, net 62,369 73,579 58,089 Inventories, net 115,823 100,214 59,299 Other current assets 41,038 32,100 22,098
Total current assets 1,036,068 1,336,308 906,817 Property, plant and equipment, net 636,922 390,301 146,779 Other long-term assets 23,755 28,082 2,870 Debt issuance costs 15,884 19,520 3,920
Total Assets $1,712,629 $ 1,774,211 $1,060,386
LIABILITIES AND EQUITY Current liabilities:
Accounts payable $ 39,467 $ 37,530 $ 36,834 Accrued compensation 65,145 56,428 39,251 Payable to collaborative partner 60,470 66,116 52,338 Other current liabilities 90,125 122,924 71,178 Restructuring liability, current portion 24,235 — — Notes payable, current portion 31,250 — — Deferred revenue, current portion 3,086 4,286 4,286
Total current liabilities 313,778 287,284 203,887 Deferred revenue, net of current portion — 3,086 7,372 Long-term deferred credit 125,000 — — Restructuring liability, net of current portion 22,503 — — Other long-term obligations, net of current portion 31,724 31,023 13,836 Notes payable, net of current portion 93,750 125,000 — Convertible senior notes 775,000 775,000 200,000 Stockholders' equity:
Common stock, $.001 par value, 450,000 shares, 137,623 & 135,044 issued & outstanding at Dec. 31, 2008 & 2007 138 135 130
Additional paid-in capital 2,111,473 1,987,453 1,857,194 Accumulated deficit (1,749,725) (1,434,320) (1,223,184) Accumulated other comprehensive loss (11,012) (450) (1,151)
Total stockholders' equity 350,874 552,818 635,291
Total Liabilities and Stockholder's Equity
$1,712,629 $ 1,774,211 $1,060,386

Amylin Pharmaceuticals, Inc. Financial Analysis Report 35
Figure 6: Common Size Balance Sheet (2006-2008)
Amylin Pharmaceuticals, Inc. Common Sized Balance Sheets (Years 2006-2008)
December 31, 2008 2007 2006 ASSETS Current assets:
Cash and cash equivalents 13.85% 23.80% 6.28% Short-term investments 33.84% 39.92% 66.08% Accounts receivable, net 3.64% 4.15% 5.48% Inventories, net 6.76% 5.65% 5.59% Other current assets 2.40% 1.81% 2.08%
Total current assets 60.50% 75.32% 85.52% Property, plant and equipment, net 37.19% 22.00% 13.84% Other long-term assets 1.39% 1.58% 0.27% Debt issuance costs 0.93% 1.10% 0.37% Total Assets 100% 100% 100% LIABILITIES AND EQUITY Current liabilities:
Accounts payable 2.30% 2.12% 3.47% Accrued compensation 3.80% 3.18% 3.70% Payable to collaborative partner 3.53% 3.73% 4.94% Other current liabilities 5.26% 6.93% 6.71% Restructuring liability, current portion 1.42% — — Notes payable, current portion 1.82% — — Deferred revenue, current portion 0.18% 0.24% 0.40%
Total current liabilities 18.32% 16.19% 19.23% Deferred revenue, net of current portion — 0.17% 0.70% Long-term deferred credit 7.30% — — Restructuring liability, net of current portion 1.31% — — Other long-term obligations, net of current portion 1.85% 1.75% 1.30% Notes payable, net of current portion 5.47% 7.05% — Convertible senior notes 45.25% 43.68% 18.86% Stockholders' equity:
Common stock, $.001 par value, 450,000 shares authorized, 137,623 & 135,044 issued & outstanding at December 31, 2008 & 2007 0.0% 0.01% 0.01% Additional paid-in capital 123.29% 112.02% 175.14% Accumulated deficit -102.17% — — Accumulated other comprehensive loss — — 0.01%
Total stockholders' equity 20.49% 31.16% 59.91% Total Liabilities and Stockholder's Equity 100% 100% 100%

Amylin Pharmaceuticals, Inc. Financial Analysis Report 36
Figure 7: Asset Structure
Figure 8: Liability & Equity Structure (2006-2008)
Amylin Pharmaceuticals, Inc. Financial Analysis Report 37
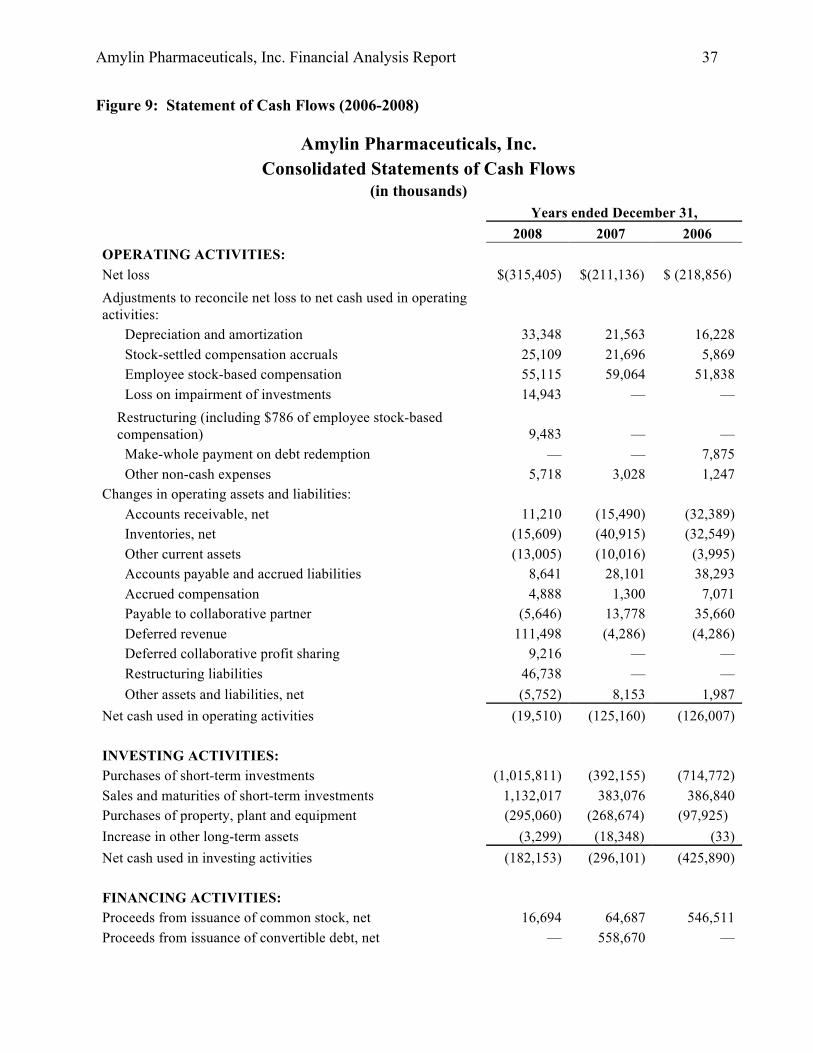
Figure 9: Statement of Cash Flows (2006-2008)
Amylin Pharmaceuticals, Inc. Consolidated Statements of Cash Flows
(in thousands) Years ended December 31, 2008 2007 2006 OPERATING ACTIVITIES: Net loss $(315,405) $(211,136) $ (218,856) Adjustments to reconcile net loss to net cash used in operating activities:
Depreciation and amortization 33,348 21,563 16,228 Stock-settled compensation accruals 25,109 21,696 5,869 Employee stock-based compensation 55,115 59,064 51,838 Loss on impairment of investments 14,943 — —
Restructuring (including $786 of employee stock-based compensation) 9,483 — —
Make-whole payment on debt redemption — — 7,875 Other non-cash expenses 5,718 3,028 1,247
Changes in operating assets and liabilities: Accounts receivable, net 11,210 (15,490) (32,389) Inventories, net (15,609) (40,915) (32,549) Other current assets (13,005) (10,016) (3,995) Accounts payable and accrued liabilities 8,641 28,101 38,293 Accrued compensation 4,888 1,300 7,071 Payable to collaborative partner (5,646) 13,778 35,660 Deferred revenue 111,498 (4,286) (4,286) Deferred collaborative profit sharing 9,216 — — Restructuring liabilities 46,738 — — Other assets and liabilities, net (5,752) 8,153 1,987
Net cash used in operating activities (19,510) (125,160) (126,007) INVESTING ACTIVITIES: Purchases of short-term investments (1,015,811) (392,155) (714,772) Sales and maturities of short-term investments 1,132,017 383,076 386,840 Purchases of property, plant and equipment (295,060) (268,674) (97,925) Increase in other long-term assets (3,299) (18,348) (33) Net cash used in investing activities (182,153) (296,101) (425,890) FINANCING ACTIVITIES: Proceeds from issuance of common stock, net 16,694 64,687 546,511 Proceeds from issuance of convertible debt, net — 558,670 —

Amylin Pharmaceuticals, Inc. Financial Analysis Report 38
Proceeds from long-term note payable — 123,496 — Proceeds from contingent share settled obligation — 30,000 — Principal payments on capital leases — — — Net cash provided by financing activities 16,694 776,853 546,511 Increase (decrease) in cash and cash equivalents (184,969) 355,592 (5,386) Cash and cash equivalents at beginning of year 422,232 66,640 72,026 Cash and cash equivalents at end of year $ 237,263 $ 422,232 $ 66,640 Supplemental disclosures of cash flow information: Interest paid, net of interest capitalized $ 17,701 $ 9,477 $ 6,409 Interest capitalized $ 11,867 $ 4,483 $ 560 Property, plant & equipment additions in other current liabilities at year end $ 6,057 $ 15,559 $ 21,219 Common stock issued upon conversion of senior convertible notes — — $ 175,000
Reclassification of debt issuance costs to additional paid-in capital upon conversion of convertible senior notes — — $ 1,980 Non-cash financing activities: Issuance of common stock upon milestone conversion $ 30,000 — — Shares contributed as employer 401(k) match $ 4,284 $ 2,811
Issuance of common stock for employee stock ownership plan $ 16,996 — —

Amylin Pharmaceuticals, Inc. Financial Analysis Report 39
Figure 10: Cash Flow Balances (2006-2008)
Figure 11: Cash Flow by Activity (2006-2008)

Amylin Pharmaceuticals, Inc. Financial Analysis Report 40
Cash Flow Analysis
An evaluation of cash flows is a critical step in gauging a company’s financial health. As
the name implies, a cash flow is a flow of cash either out of or into a company. These cash flows
are reflected on the statement of cash flows, which shows how a company raised and spent funds
over a given period of time (investopedia.com). When assessing a company, it is often tempting
to focus on the net income reported on the income statement to determine if a company is
profitable or not. This can be very misleading and is subject to manipulation with different
accounting methods. However, cash either exists or does not on the cash flow statements.
Perhaps most importantly, cash is used to maintain a company and to determine whether a
company has enough liquidity to maintain the business and meet its financial obligations. This is
the ultimate measure of potential success or failure.
There are three principal parts of a cash flow statement: cash flows from operations, cash
flows from investment activities, and cash flows from financing activities (Marshall &
McManus, 2007). Cash flow from operations is the key source of cash generation; it is the
primary source of money made by the company from production, as opposed to funds from
outside investors and other financial activities (investopedia.com). The cash flow from investing
activities usually demonstrates an outflow of cash. Investments such as property, plant and
equipment as well as business acquisitions are listed here. Noting capital expenditures is very
relevant, as it is a priority for a business to maintain equipment, plants, et cetera for efficient
operations. The third section is the cash flows from financing. This part shows debt and equity
transactions, as most businesses are constantly borrowing and paying off debt. For investors, a
key item for stock issues is the cash dividends paid (investopedia.com).

Amylin Pharmaceuticals, Inc. Financial Analysis Report 41
The reported financial statements (balance sheet, income statement, and statement of cash
flows) all provide pieces of data that explain a company’s financial position. An analysis of the
cash flows year to year, as well as reviewing certain relevant data from the balance and income
statements, can provide insight into where a company has placed funds, if there is enough
liquidity, how well the business is managed, and if it “measures up” to companies with similar
profiles.
On initial evaluation of Amylin’s cash flow statement, an immediate observation is made.
The net cash used from operating activities is -$19,510,000, yet the net loss is -$315,405,000.
This bears further investigation. Where did the rest of the money go? The following ratio
analyses should provide useful information for answering this question. The operating cash flow
ratio (OCF) provides information as to how well current liabilities are covered by the cash flows
from company operations (investopedia.com). The formula is: OCF = cash flow from current
operations/current liability. For Amylin this is -0.0621 (-19.51/313.778). Typically a number
greater than 1.0 indicates that a company has enough cash flows from operations to cover
expenses. This ratio is one of several tools to evaluate the financial strength of a company.
Comparing a very similar company to Amylin is also beneficial. The company used in this
section for comparison is The Medicines Company (MDCO). Also a bio/pharmaceutical
company with two primary products and traded on the NASDAQ, The Medicines Company is
similar in industry, size, number of products, and research endeavors. The calculated OCF for
The Medicines Company is 0.4260, less than 1.0 but not a negative number. For both
companies, current liabilities may not be covered by the cash flows from current operations.
This appears to be especially concerning for Amylin.

Amylin Pharmaceuticals, Inc. Financial Analysis Report 42
Another ratio is termed flow ratio (fool.com). This ratio compares year to year changes
in cash flows to obtain a sense of improvement/worsening of cash utilization. The formula is:
(current assets - cash + market securities)/current liabilities - short term debt. In 2008, Amylin’s
flow ratio was 0.775 (1036.068 - 816.836/313.778 – 31.25). In 2007, the ratio was 0.716,
indicating an increase in the cash flow ratio. This rising ratio indicates a cash drain on the
company. This is also concerning for Amylin because it represents poor cash management.
The cash flow statement portion regarding investments for Amylin is of particular
interest. Upon review it is apparent that Amylin has been placing significant resources in short
term investments as well as focusing on property, plant, and equipment. This is verified by
reviewing the SEC 10K report filed by Amylin citing the purchase and construction of a
manufacturing and research facility in Ohio (Amylin, 2009). Amylin appears to have
concentrated on raising cash through sales of stock options in the years 2006-2008, as evidenced
by the financing activities section.
When evaluating the cash flow statement and trying to determine where the money has
been utilized between the cash from operating activities and the net loss, the income statement
for Amylin provides information suggested by the ratio analysis as well. The income statement
for 2008 lists selling, general, and administrative (SG&A) expenses at $395.112 million, and a
comparison to The Medicines Company lists SG&A expenses at $164.903 million. Amylin
simply lists these costs as “increased expenses” in its 2008 annual report.
In summary, the cash flow analysis of Amylin provides concerning data that suggests
poor financial management by its leadership and questionable investment in property, plant and
equipment. The investment in the new Ohio facility is especially concerning considering the
company may not even obtain FDA approval for its anticipated long acting product.

Amylin Pharmaceuticals, Inc. Financial Analysis Report 43
Financial Ratio Analysis
When analyzing a company’s financial statements, whether as an investor or as a
manager, an ideal place to start is with financial ratios. Each of these ratios fall into one of the
following five categories: liquidity, asset management, debt management, profitability, or
market value ratios. We will utilize these ratios to begin our analysis of the financial
performance of Amylin Pharmaceuticals over the past three years. We will then proceed into an
evaluation of the company’s common size statements and cash flow statements.
Liquidity Ratios
As the name implies, liquidity ratios help to determine the liquidity of a company’s
assets. As defined in Financial Management: Theory and Practice, “a liquid asset is one that
trades in an active market and hence can be quickly converted to cash at the going market price”
(Brigham & Ehrhardt, 2008, p. 123). Essentially, these ratios assist in answering this question:
“Will the firm be able to pay off its debts as they come due over the next year or so?” (Brigham
& Ehrhardt, 2008, p. 123).
Current Ratio [Formula: Current assets/Current liabilities] The current ratio is used to determine if the company is able to pay-off its short-term
financial obligations (debt and payables) using its short term assets (cash, inventory, &
receivables). A ratio of 1 or greater indicates that the company would be able to meet all of its
current financial obligations given its current assets. Moreover, the higher the ratio, the higher
the firm’s ability to pay-off its short-term liabilities. Generally speaking, the higher the current
ratio, the better; however, one must realize that a very high current ratio could also suggest that
too much is invested in current assets. Amylin’s calculated current ratios for the years 2006
through 2008 are as follows.
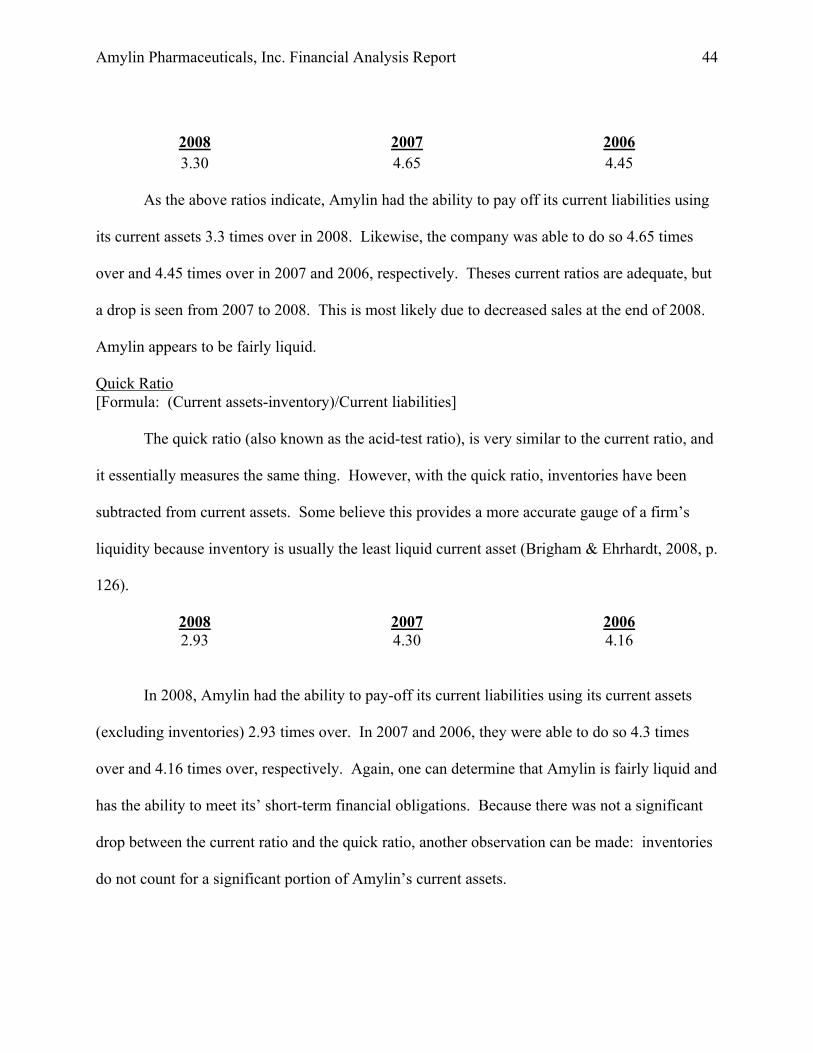
Amylin Pharmaceuticals, Inc. Financial Analysis Report 44
2008 2007 2006 3.30 4.65 4.45
As the above ratios indicate, Amylin had the ability to pay off its current liabilities using
its current assets 3.3 times over in 2008. Likewise, the company was able to do so 4.65 times
over and 4.45 times over in 2007 and 2006, respectively. Theses current ratios are adequate, but
a drop is seen from 2007 to 2008. This is most likely due to decreased sales at the end of 2008.
Amylin appears to be fairly liquid.
Quick Ratio [Formula: (Current assets-inventory)/Current liabilities] The quick ratio (also known as the acid-test ratio), is very similar to the current ratio, and
it essentially measures the same thing. However, with the quick ratio, inventories have been
subtracted from current assets. Some believe this provides a more accurate gauge of a firm’s
liquidity because inventory is usually the least liquid current asset (Brigham & Ehrhardt, 2008, p.
126).
2008 2007 2006 2.93 4.30 4.16
In 2008, Amylin had the ability to pay-off its current liabilities using its current assets
(excluding inventories) 2.93 times over. In 2007 and 2006, they were able to do so 4.3 times
over and 4.16 times over, respectively. Again, one can determine that Amylin is fairly liquid and
has the ability to meet its’ short-term financial obligations. Because there was not a significant
drop between the current ratio and the quick ratio, another observation can be made: inventories
do not count for a significant portion of Amylin’s current assets.

Amylin Pharmaceuticals, Inc. Financial Analysis Report 45
Asset Management Ratios
Using asset management ratios, one can determine how effectively the firm is managing
its assets. This set of ratios help to answer this question: “Does the total amount of each type of
asset as reported on the balance sheet seem reasonable, too high, or too low in view of current
and projected sales levels?” (Brigham & Ehrhardt, 2008, p. 126). Generally speaking, does the
firm have the right amount invested in assets?
Inventory Turnover [Formula: Sales/Inventory]
This ratio refers to how quickly product is moved in relation to sales, and the higher the
number the better (Brigham & Ehrhardt, 2008, pp. 126-127). Specifically, inventory turnover
measures how many times a firm’s inventory is sold and replenished over a period.
2008 2007 2006 6.61 7.00 7.99
In 2008, Amylin sold and replaced its inventory 6.61 times. In 2007 and 2006, the
company sold and replaced its inventory 7 and 7.99 times, respectively. It is a clear that there
has been a negative trend. Normally this can suggest a decrease in sales, but Amylin’s income
statement shows an increase in sales. Thus, it is assumed that Amylin has become less effective
in purchasing the right amount of inventories, given its sales.
Days Sales Outstanding (DSO) [Formula: Receivables/(Annual sales/365)] Days sales outstanding is sometimes referred to as “average collection period.” By
comparing accounts receivables to average daily sales, this ratio shows how long it takes to
collect accounts receivables, or how many days between the time a sale is made and the time a

Amylin Pharmaceuticals, Inc. Financial Analysis Report 46
firm receives cash from that sale (Brigham & Ehrhardt, 2008, p. 127). The lower this ratio is the
better.
2008 2007 2006 29.74 38.29 44.73
In 2008, it took Amylin 29.74 days to collect its accounts receivables. In other words,
there was, on average, about a one month gap between the time a sale was made and the time
Amylin received cash from the sale. This is very good, and suggests that Amylin is efficient in
managing its accounts receivables. Moreover, a downward trend can be observed from the years
2006 to 2008, indicating that the company has improved.
Fixed Assets Turnover [Formula: Sales/Net fixed assets] The fixed assets turnover ratio evaluates how effectively a company uses its fixed assets
(property, plant and equipment) by measuring how much sales are generated from its given net
fixed assets (Brigham & Ehrhardt, 2008, p. 128). The higher this ratio is the better.
2008 2007 2006 1.16 1.68 3.17
In 2008, Amylin generated $1.16 for every dollar invested in net fixed assets. In 2007
and 2006, the company generated $1.68 and $3.17 for every dollar invested in net fixed assets,
respectively. This downward trend (particularly a large drop between the years 2006 and 2007)
is discouraging and suggests decreased efficiency in management of its fixed assets. The sharp
increase in net fixed assets (the new plant in Ohio) explains this. While Amylin’s sales have
increased, in relation to net fixed assets, they have not increased enough. Simply put, net fixed

Amylin Pharmaceuticals, Inc. Financial Analysis Report 47
assets increased more than sales. This further supports the questionability of the company’s new
plant.
Total Assets Turnover [Formula: Sales/Total assets] The total assets turnover ratio measures how effectively the firm uses its total assets
(current and fixed) to produce sales. A high ratio means that the firm is able to generate a lot of
revenues given its total assets and indicates effective management of assets.
2008 2007 2006 0.45 0.40 0.45
Evidently, Amylin has maintained a relatively stable total assets turnover ratio over the
past few years; however, it is very low and this suggests poor asset management. In 2008,
Amylin was only able to generate 45 cents in revenue for every dollar in total assets. The ratios
for 2007 and 2006 can be similarly interpreted.
Debt Management Ratios
Debt management ratios are critical to investors and creditors alike because they help
appraise a firm’s long-term solvency by measuring its level of debt financing (also referred to as
financial leverage). Financial leverage, to a certain extent, can be a positive thing for investors
because their returns can be enhanced, or “leveraged,” when the company receives more on
investments financed with debt that it pays in interest. Furthermore, shareholders can preserve
their control of a company without increasing their investment. However, the greater the extent
of a firm’s financial leverage, the greater the risk. This risk is of concern to the investor, but it is
of particular concern to creditors.

Amylin Pharmaceuticals, Inc. Financial Analysis Report 48
Debt Ratio [Formula: Total liabilities/Total assets] The debt ratio compares current and long-term liabilities (debt) to current and long-term
assets and reveals the percentage of a firm’s total assets that are funded by debt. As the ratio
increases, so does the firm’s risk (Brigham & Ehrhardt, 2008, p.129). Creditors favor a fairly
low debt ratio, as it indicates they are more likely to get paid in the event of liquidation.
However, shareholders tend to like a little higher of a ratio because it means they have greater
leverage. Thus, firms have to find their ideal balance between risk and the benefits of financial
leverage. Amylin’s debt ratios for the years 2006 through 2008 are shown below.
2008 2007 2006
79.51% 68.84% 40.09%
Amylin’s debt ratio for 2006 was actually very good. That year, only about 40% of their
assets were financed with debt. This indicates a fair level of financial leverage without too much
risk. However, by 2007 the ratio had increased significantly. It continued to increase in 2008, at
which point nearly 80% of the company’s assets were financed with debt. This is an undue
amount of risk that is very unappealing to both investors and creditors. Amylin will likely have
trouble continuing to get funds through loans, as creditors will be very hesitant to provide them.
Moreover, Amylin will have to borrow at a much higher interest rate, because naturally, creditors
will require a greater return for taking on the high risk.
Times Interest Earned (TIE) [Formula: EBIT/Interest]
Simply put, the times interest earned ratio indicates a firm’s ability to pay interest. It
measures how many times a firm can make its interest payments based on its pre-tax earnings. A
very low TIE ratio means that the company may not be able to meet these financial obligations

Amylin Pharmaceuticals, Inc. Financial Analysis Report 49
and thus could be forced into bankruptcy (Brigham & Ehrhardt, 2008, p.130). So, the higher this
ratio is the better. Naturally, this ratio is of particular significance to creditors. Amylin’s TIE
ratios for the years 2006 through 2008 are presented below.
2008 2007 2006
-10.75 -4.17 -6.03
The above ratios are very disheartening in that they are negative and increasingly so. It
has become more negative due to the company’s increased use of debt financing (which
translates into greater interest charges) and increasing loss before interest and taxes. These
negative TIE ratios indicate that Amylin will be unable to meet its financial obligations if its
creditors came calling for their money. As a result, Amylin could be forced into bankruptcy.
Profitability Ratios
Up to this point we have examined ratios that help indicate the effectiveness of a firm’s
operations. This next set of ratios, the profitability ratios, takes our analysis a step further to
show the combined effects of what we have looked at so far (liquidity, asset management, and
debt management) on operating results. Generally speaking, these ratios measure a firm’s
success at generating profits.
Profit Margin on Sales [Formula: Net income (loss) available to common stockholders/Sales]
The profit margin on sales ratio specifies what percentage of each dollar of sales is
contributed to the firm’s bottom line, or in other words, how much profit is available to
stockholders for every dollar generated in sales. Amylin’s profit margin on sales for the years
2006-2008 are as follows.
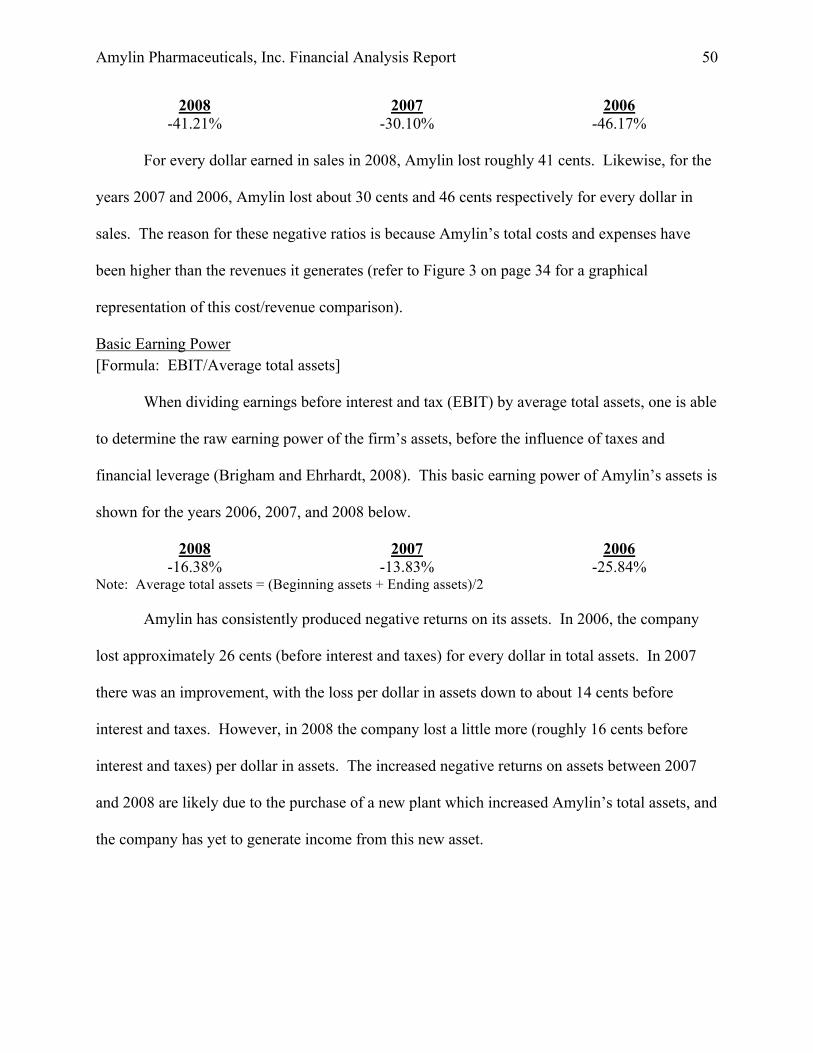
Amylin Pharmaceuticals, Inc. Financial Analysis Report 50
2008 2007 2006 -41.21% -30.10% -46.17%
For every dollar earned in sales in 2008, Amylin lost roughly 41 cents. Likewise, for the
years 2007 and 2006, Amylin lost about 30 cents and 46 cents respectively for every dollar in
sales. The reason for these negative ratios is because Amylin’s total costs and expenses have
been higher than the revenues it generates (refer to Figure 3 on page 34 for a graphical
representation of this cost/revenue comparison).
Basic Earning Power [Formula: EBIT/Average total assets]
When dividing earnings before interest and tax (EBIT) by average total assets, one is able
to determine the raw earning power of the firm’s assets, before the influence of taxes and
financial leverage (Brigham and Ehrhardt, 2008). This basic earning power of Amylin’s assets is
shown for the years 2006, 2007, and 2008 below.
2008 2007 2006 -16.38% -13.83% -25.84%
Note: Average total assets = (Beginning assets + Ending assets)/2
Amylin has consistently produced negative returns on its assets. In 2006, the company
lost approximately 26 cents (before interest and taxes) for every dollar in total assets. In 2007
there was an improvement, with the loss per dollar in assets down to about 14 cents before
interest and taxes. However, in 2008 the company lost a little more (roughly 16 cents before
interest and taxes) per dollar in assets. The increased negative returns on assets between 2007
and 2008 are likely due to the purchase of a new plant which increased Amylin’s total assets, and
the company has yet to generate income from this new asset.

Amylin Pharmaceuticals, Inc. Financial Analysis Report 51
Return on Total Assets (ROA) [Formula: Net income (loss) available to common stockholders/Average total assets]
The ROA ratio, like the previous basic earning power ratio, indicates the return generated
from each dollar in assets; however, with this ratio, interest expense and taxes have been
accounted for. Thus, a company’s tax situation and degree of financial leverage will affect the
ratio.
2008 2007 2006 -18.09% -14.90% -26.88%
Once again we see that Amylin has consistently produced negative returns on its assets.
These figures are slightly more negative than the basic earning power ratios due to Amylin’s
interest expense and taxes being accounted for. In 2008, Amylin lost about 18 cents per dollar of
assets. In 2007 and 2006, the company lost about 15 cents and 27 cents per dollar of assets
respectively. The increased negative return on assets between 2007 and 2008 is a result of the
combination between an increase in assets (the purchased plant) and an increase in interest
expense (which increased the net loss).
Return on Common Equity (ROE) [Formula: Net income (loss) available to common stockholders/Average common equity]
ROE measures a firm’s profitability by showing how much profit is generated with the
funds shareholders have invested. ROE is considered one the most important measures of
profitability, and the higher it is the better.
2008 2007 2006 -69.80% -35.54% -62.13%
Note: Average common equity = (Equity at the beginning of the year + equity at the end of the year)/2
In 2008, Amylin’s stockholders lost nearly 70 cents for every dollar invested! They lost
about 36 cents and 62 cents for every dollar invested in the years 2007 and 2006. These highly
negative returns should be very discouraging to investors.
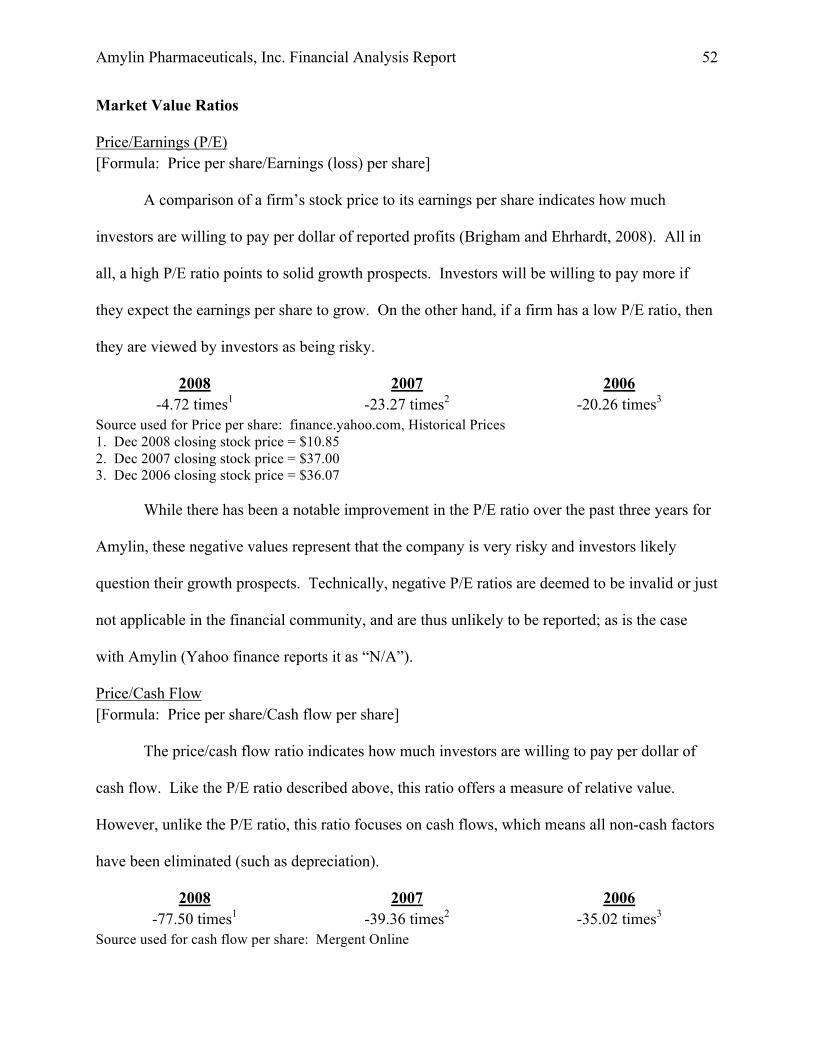
Amylin Pharmaceuticals, Inc. Financial Analysis Report 52
Market Value Ratios
Price/Earnings (P/E) [Formula: Price per share/Earnings (loss) per share]
A comparison of a firm’s stock price to its earnings per share indicates how much
investors are willing to pay per dollar of reported profits (Brigham and Ehrhardt, 2008). All in
all, a high P/E ratio points to solid growth prospects. Investors will be willing to pay more if
they expect the earnings per share to grow. On the other hand, if a firm has a low P/E ratio, then
they are viewed by investors as being risky.
2008 2007 2006 -4.72 times1 -23.27 times2 -20.26 times3
Source used for Price per share: finance.yahoo.com, Historical Prices 1. Dec 2008 closing stock price = $10.85 2. Dec 2007 closing stock price = $37.00 3. Dec 2006 closing stock price = $36.07 While there has been a notable improvement in the P/E ratio over the past three years for
Amylin, these negative values represent that the company is very risky and investors likely
question their growth prospects. Technically, negative P/E ratios are deemed to be invalid or just
not applicable in the financial community, and are thus unlikely to be reported; as is the case
with Amylin (Yahoo finance reports it as “N/A”).
Price/Cash Flow [Formula: Price per share/Cash flow per share]
The price/cash flow ratio indicates how much investors are willing to pay per dollar of
cash flow. Like the P/E ratio described above, this ratio offers a measure of relative value.
However, unlike the P/E ratio, this ratio focuses on cash flows, which means all non-cash factors
have been eliminated (such as depreciation).
2008 2007 2006 -77.50 times1 -39.36 times2 -35.02 times3
Source used for cash flow per share: Mergent Online

Amylin Pharmaceuticals, Inc. Financial Analysis Report 53
Note: Refer to previous table for stock prices used 1. Cash flow per share = (0.14) 2. Cash flow per share = (0.94) 3. Cash flow per share = (1.03)
Amylin’s price/cash flow ratios are very negative, and increasingly so. The ratios are
negative due to the company’s negative cash flows (as shown on the company’s statement of
cash flows). Clearly there was a significant change between the years 2007 and 2008, with the
ratio decreasing from -39.36x to -77.50x. It is suspected that the primary contributing factor to
this was the significant outflow of cash for the purchase of the company’s new Ohio facility as
well as the continued decrease in stock price. This ratio reaffirms the fact that Amylin is a risky
investment venture, and investors currently see no value in the firm.
Market/Book (M/B) [Formula: Market price per share/Book value per share]
This ratio compares the market price per share (determined by the current selling price
per share on the stock market) and the book value per share (the historical or accounting value
per share). It indicates how much investors are willing to pay per dollar of book value. If this
ratio is more than 1.0, then investors consider the stock more valuable than what is stated on the
books. On the other hand, if this ratio is less than 1.0, then investors consider the stock to be of
less value than what is stated on the books.
2008 2007 2006 4.25 times1 9.05 times2 7.41 times3
Source used for book value per share: Mergent Online 1. Book value per share = 2.55 2. Book value per share = 4.09 3. Book value per share = 4.87
The above values show that in 2008, investors were willing to pay 4.25 times the book
value of Amylin’s stock, compared to 9.05 times and 7.41 times in 2007 and 2006 respectively.

Amylin Pharmaceuticals, Inc. Financial Analysis Report 54
The decrease between 2007 and 2008 is due primarily to the significant decrease in the market
price of Amylin’s stock (from $37 per share to $10.85 per share).
Overall, what can be gleaned from an analysis of the above financial ratios is that Amylin
is in poor financial health. Liquidity is adequate but decreasing, assets are being poorly managed
for the most part, debt is being badly managed, profits are nonexistent, and the company poses
no value to investors. Nevertheless, despite these strong conclusions, further analysis is
necessary in order to see how Amylin compares to its peers in the industry.
STRENGTHS AND WEAKNESSES ANALYSIS
Financial Ratios Industry Comparison
The next step in financial analysis is to compare Amylin’s financial ratios to its peers’
ratios. It is important to understand that companies in the industry vary considerably in size,
number of products, years in operation, and in other factors. For instance, one of the industry
leaders, GlaxoSmithKline, has a market cap of 99.66 billion dollars, revenues of $41.95 billion,
and numerous products on the market (Yahoo Finance, 2009). On the other hand, Amylin has a
market cap of only 1.91 billion dollars, revenues of only $823.9 million, and only two products
currently on the market (Yahoo Finance, 2009). Comparing the two companies would be like
comparing apples to oranges. Thus, it is best to compare Amylin to companies in the industry of
similar size, number of products, et cetera, and that is what has been done in Table 13 below.
Ten companies were chosen and their returns on assets (ROA), returns on equity (ROE), returns
on investment (ROI), current ratios, and cash flows per share were averaged to provide a point of
comparison for Amylin. The comparison only involves these five financial performance

Amylin Pharmaceuticals, Inc. Financial Analysis Report 55
indicators because these are among the most relevant and important to investors, plus it is felt
that these are sufficient to provide a sound understanding of how Amylin lines up with its peers.
Table 13: Company Financial Ratio Comparisons
Year ending December 31, 2008
Company
Ratio A B C D E F G H I J Amylin Average
ROA% -18.77 27.07 15.8 3.76 11.2 -8.6 6.05 -2.3 0.95 -1.8 -18.09 3.33
ROE% -25.96 82.48 26.4 11.4 21.4 -14 6.71 -3.0 1.67 -7.7 -69.80 2.69
ROI% -27.41 17.09 30.9 5.73 19.5 -6.7 9.90 -3.8 4.44 -14 -20.83 1.31
Current Ratio
1.91 6.54 1.21 2.85 1.32 1.66 5.75 3.31 2.65 1.61 3.30 3.93
Cash Flow per Share
-7.86 2.15 2.38 2.61 2.47 2.01 3.22 0.73 0.81 2.47 0.14 1.01
Note: Refer to Appendix for Company Index
Referring to Table 13 above, it is evident that Amylin’s return on assets of -18.09% is
significantly lower than the industry average of 3.33%. When discussing ROA in the previous
section, concern was expressed over this negative ROA. Now, seeing that Amylin’s peers, on
average, have been able to generate a positive return on their assets, it becomes even more
apparent that Amylin is doing something wrong. The company is clearly not managing its assets
well. Its return on equity, -69.80%, is also drastically lower than the industry average, which is
2.69%. Like the ROA, concern was expressed over the highly negative ROE in the previous
section. With the above table, it is now evident that on average, Amylin’s peers were able to
generate a positive ROE. This indicates to Amylin’s investors that if they were to invest their
funds in a company similar to Amylin, they could actually experience positive returns. It should

Amylin Pharmaceuticals, Inc. Financial Analysis Report 56
make shareholders ask: “If those companies similar to Amylin can produce returns for their
investors, why can’t Amylin?” Part of the answer to this question is that management has made
the decisions to increase CEO pay and invest heavily in a new plant for development and
production, for which they have been highly scrutinized (Edwards, 2009). Fortunately, Amylin
has been able to maintain an adequate current ratio of 3.30 that is only slightly below its peers’
average of 3.93. This is the one area above in which Amylin has been in line with its peers.
Overall, Amylin’s financial situation is considerably under par when compared to its
peers in the industry. While one can get a good grasp on the company’s financial position from
just studying its financial ratios discussed in the previous section, a comparison to its peers on
the above key ratios further supports our understanding of the financial mess that the company is
in.
Finally, for the purpose of further clarification, the ROAs, ROEs, and ROIs of the ten
companies, along with Amylin’s, is graphed in the figure below.
Figure 12: Company Comparisons of ROA, ROE, and ROI (Year ended 12/31/08)

Amylin Pharmaceuticals, Inc. Financial Analysis Report 57
Strengths
Amylin has an industry/market strength in its novel medications. These medications
focus on a huge demographic worldwide consisting of people that are affected by diabetes and
obesity. The development of the long acting formulation of BYETTA® once weekly has
tremendous implications for patient care: ease of use, compliance, and decrease in co-morbid
complications. At present, Amylin is poised to become the only company in the industry with a
product of this nature and expects to eventually reap billions of dollars in profit as the main
provider of this type of medication. Amylin also holds the patents for research and development
of its products and should enjoy a ten year protection from competitors.
Amylin also maintains a business strength through its collaborative partnership with Eli
Lilly and Company. Eli Lilly is an internationally renowned pharmaceutical company that has
assisted Amylin in the transition from biotech firm to pharmaceutical firm, while providing
millions of dollars in benchmark payments as well as sharing in expenses for marketing and
international promotion.
While these company strengths are relevant, it is important that Amylin’s financial
strengths be evaluated. Unfortunately, financial strengths are almost non-existent for the
company. Upon evaluation of the company’s financial ratios, only one area stands out as a
strength for Amylin, and that is its days sales outstanding for its accounts receivables. It has
markedly improved over the past few years, and in 2008 it was down to 29.75 days. The fact
that the company is able to collect payment for its sales within one month is definitely a strength.
Weaknesses
While Amylin’s strengths are minimal, its weaknesses abound. After evaluating the
company’s financial ratios, it is evident that it is performing poorly with respect to all key areas:

Amylin Pharmaceuticals, Inc. Financial Analysis Report 58
liquidity, asset management, debt management, profitability, and market value. Table 14 below
reiterates these weaknesses.
Table 14: Summary of Financial Weaknesses
Financial Ratio/Element
Weakness
Current & Quick ratios
Not major weaknesses, but downward trend indicates decreasing liquidity. If the trend continues, Amylin will soon have trouble meeting its short-term financial obligations.
Inventory Turnover The decreasing trend suggests the company is becoming less effective at managing its inventory levels.
Fixed Assets Turnover
The low ratio and decreasing trend indicates the company is not effectively managing its fixed assets. Management made the poor decision to invest heavily in a new Ohio plant, which may never even serve its purpose if the new once-weekly product is not approved.
Total Assets Turnover
The company is generating very little revenues from its total assets, again indicating poor asset management.
Debt Ratio This very high ratio and increasing trend indicates that Amylin is very risky to both creditors and investors. Amylin will have trouble receiving additional funds through loans and will have to borrow at a very high interest rate.
Times Interest Earned This negative ratio indicates that the company will not be able to meet its financial obligations. Amylin could be forced into bankruptcy if its creditors came calling for their money.
Profit Margin on Sales
Amylin is losing money for every dollar in sales. The company’s costs and expenses outweigh its revenues.
Basic Earning Power The company’s assets have no earning power. It has continuously produced negative returns from its assets.
Return on Total Assets
Amylin has continuously produced negative returns from its assets. Moreover, it is performing significantly under par when compared to competitors’ ROAs.
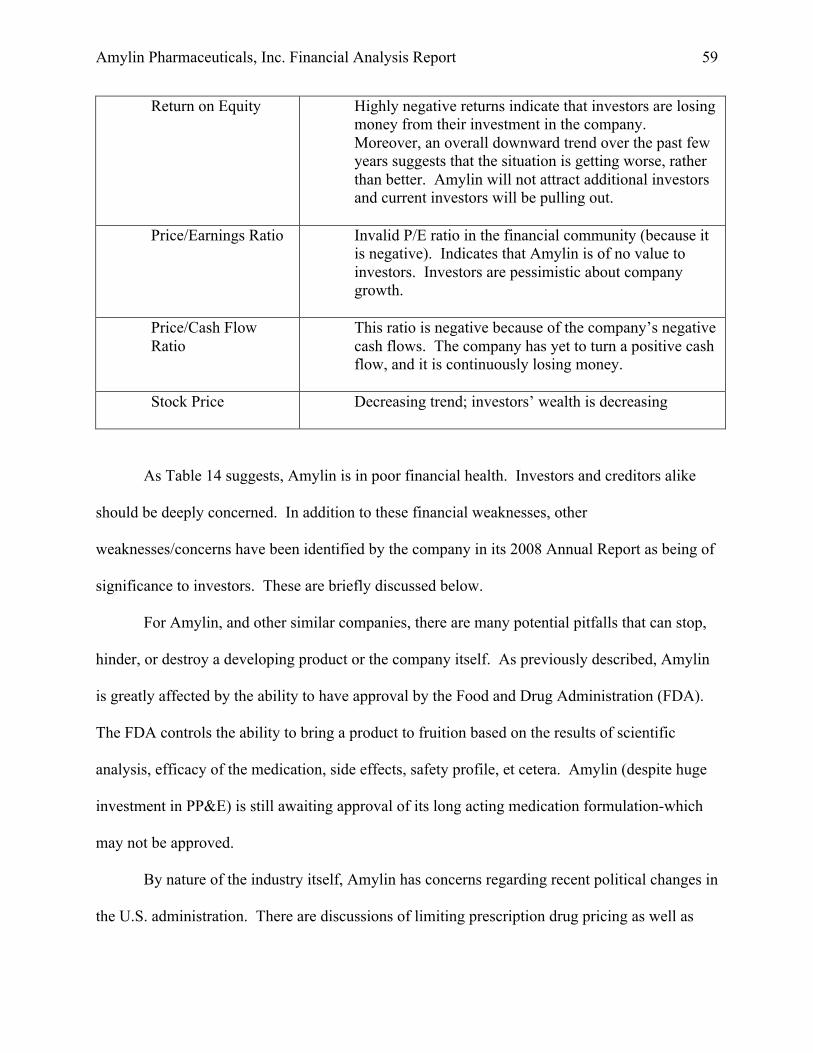
Amylin Pharmaceuticals, Inc. Financial Analysis Report 59
Return on Equity Highly negative returns indicate that investors are losing money from their investment in the company. Moreover, an overall downward trend over the past few years suggests that the situation is getting worse, rather than better. Amylin will not attract additional investors and current investors will be pulling out.
Price/Earnings Ratio Invalid P/E ratio in the financial community (because it is negative). Indicates that Amylin is of no value to investors. Investors are pessimistic about company growth.
Price/Cash Flow Ratio
This ratio is negative because of the company’s negative cash flows. The company has yet to turn a positive cash flow, and it is continuously losing money.
Stock Price Decreasing trend; investors’ wealth is decreasing
As Table 14 suggests, Amylin is in poor financial health. Investors and creditors alike
should be deeply concerned. In addition to these financial weaknesses, other
weaknesses/concerns have been identified by the company in its 2008 Annual Report as being of
significance to investors. These are briefly discussed below.
For Amylin, and other similar companies, there are many potential pitfalls that can stop,
hinder, or destroy a developing product or the company itself. As previously described, Amylin
is greatly affected by the ability to have approval by the Food and Drug Administration (FDA).
The FDA controls the ability to bring a product to fruition based on the results of scientific
analysis, efficacy of the medication, side effects, safety profile, et cetera. Amylin (despite huge
investment in PP&E) is still awaiting approval of its long acting medication formulation-which
may not be approved.
By nature of the industry itself, Amylin has concerns regarding recent political changes in
the U.S. administration. There are discussions of limiting prescription drug pricing as well as

Amylin Pharmaceuticals, Inc. Financial Analysis Report 60
allowing generic versions of medications to become more readily available. This pricing
pressure and increased generic competition will likely have serious financial implications for
Amylin as it will impair the company’s revenues. Other issues include a very recent board
member change with involvement of Carl Icahn who is known for corporate takeovers and
merger/sales of companies perceived to have poor investor returns. The affects of this board
member change may actually trigger a “poison put” cause in the Amylin loan structures, which
would force certain large loans to become due in an accelerated manner. This could be as much
as $900 million of which Amylin currently does not have (Berman, 2009). The financial
repercussion of such an event would likely be bankruptcy. In the Amylin 2008 SEC report, there
was concern regarding attempted corporate takeovers and activation of the accelerated loan
payments.
As a company producing a healthcare product, competition is another concern for
Amylin. Other companies have diabetes products that may be determined to be the most
efficacious in regards to results, cost, and coverage (by insurance).
The overall macroeconomic environment is of concern for Amylin. Potential patients
who cannot afford insurance, or who cannot pay outright for the medication(s), should be
considered lost opportunities. Amylin products may need to be sold at reduced rates or with
coupons for customers to be able to afford the product. As a pharmaceutical product, liability
issues in reference to adverse patient outcomes may become an issue (such as the FDA
pancreatitis warning in late 2008). These issues can result in costly litigation, loss of prescribers,
and even potential removal of the product(s) from the market. It could take years of prescriber
education and reassurance to utilize the product after adverse warnings are issued. In the 2008

Amylin Pharmaceuticals, Inc. Financial Analysis Report 61
annual SEC report, Amylin clearly defines the above concerns for all current and potential
investors to be acutely aware of.
Reasons for Level of Performance
Amylin is a relatively new company in the biotechnology industry, and it has a very small
pipeline of products focusing on a narrow range of diseases (diabetes and obesity). Amylin has
also experienced set-backs, such as the FDA’s damaging warnings about possible complications
associated with its main product, BYETTA®, and the delayed approval of BYETTA® once-
weekly. Moreover, Amylin’s management team made a very poor decision when they decided to
invest heavily in property, plant, and equipment in 2008. This significantly decreased the returns
on assets and investments. The investment in the new Ohio plant was premature given the fact
that the purpose of the plant is to manufacture large quantities of the BYETTA® once-weekly
product which has yet to be approved by the FDA. If the product is not approved to go to
market, the company’s investment in this plant would have been for not, and it will be unable to
recoup the multi-million dollar expense.
All in all, management has made some bad decisions and has not acted in the best interest
of its stockholders. The fact that executives continued to receive hefty compensations and
bonuses while the company struggled financially is just one example of lack of focus on
stockholder wealth maximization.
All these factors have lead Amylin into its current financial position.

Amylin Pharmaceuticals, Inc. Financial Analysis Report 62
FINANCIAL FORECASTING
This section provides a financial forecast for Amylin Pharmaceuticals. The following
steps will be taken to develop a financial plan for the company.
1. Analyze growth rate data (both historical and projected)
2. Estimate projected revenue growth
3. Develop forecasted income statement
4. Develop forecasted balance sheet
5. Determine additional funds needed (AFN)
Growth Rate Data
In an effort to estimate Amylin’s revenue growth rate, both historical and projected
growth rates for the overall market, for the Biotechnology industry, and for Amylin must be
examined. After collectively analyzing the growth rate data, an approximate revenue growth rate
for the company will be determined. The projected revenue growth rate will be the basis for
developing the pro-forma financial statements.
Historical and Projected Market Growth
The S&P 500 Index is a good indicator of overall market performance; thus, it will be
used as the basis of recent and projected market growth. According to a recent article published
by The Wall Street Journal, the S&P 500’s composite third quarter earnings are down
approximately 15% from the previous year (Shwiff, 2009). Despite this, the market has seen
significant improvements over the past seven months, and the market is generally expected to
improve as the economy recovers. An article posted on CNNMoney.com on November 2, 2009
stated that, “The first and second quarters of next year are expected to move toward a more
moderate rate of growth, rising 37.6% and 20.9% respectively” (Twin, 2009). Given the current

Amylin Pharmaceuticals, Inc. Financial Analysis Report 63
economic conditions, it is extremely difficult to accurately predict how the market will perform
over the next few months, let alone the next few years. It is uncertain how quickly the market
will recover from its terrible performance in late 2008; however, it seems that the general
consensus is there will be moderate growth.
Historical and Projected Biotechnology Industry Growth
The biotech industry has seen positive growth in recent years, and the growth prospects
remain optimistic given the national and global demographic trends and growing demand for the
industry’s products (refer to Industry Outlook section). The growth in industry revenues over the
past four years is shown in Table 15 below.
Table 15: Biotechnology Industry Revenue Growth (2005-2008)
2005
2006 2007 2008
Revenue Growth Rate 12.7% 7.5% 9.5% 11.5% Source: IBISWorld Industry Report, 2009, p. 5
Industry revenues are expected to grow in a similar manner over the next few years.
These projections are shown in Table 16 below.
Table 16: Biotechnology Industry Expected Revenue Growth (2009-2011)
Year Expected Revenues (in millions of US $)
Expected Growth (%)
2009 97,118.5 10.3 2010 105,956.3 9.1 2011 116,869.7 10.3
Source: IBISWorld Industry Report, 2009, p. 52
Historical and Projected Company Growth
For mature companies with relatively stable sales growth, a simple regression analysis
performed on historical sales data generally provides a fair estimate of near-future sales growth.
However, because Amylin is a relatively young company whose products have only been on the
market for four years, a regression analysis over the past four years of sales does not provide a

Amylin Pharmaceuticals, Inc. Financial Analysis Report 64
logical basis for future growth. In fact, a regression analysis performed on the company’s
revenues over the past four years would show a growth rate of just over 70%. Such a high
growth rate is not surprising given the fact that Amylin’s two products, BYETTA® and
SYMLIN®, were both first-in-class drugs. It is not unusual for novel products to experience
significant growth in their beginning years; however, such high growth rates are unlikely to be
sustained. Thus, 70% is not a realistic growth rate for Amylin’s revenues in the future given
current circumstances. Instead, a more recent historical trend in revenues would provide a more
rational outlook. If a regression analysis is performed on the company’s revenues over the past
two years, a more realistic growth rate is determined. Using Excel, the regression analysis is
very simple to perform. The years (2007 and 2008) are the independent variables (x), while the
revenues ($780,997,000 and $840,109,000 respectively) are the dependent variables (y). When
using these known variables to perform a “LOGEST” statistical function, the value that Excel
gives is “1 + g.” So, in order to determine the growth rate (g), 1 must be subtracted from Excel’s
given value. Using this method, the growth rate is found to be approximately 7.6%. It is
important to note here that we are measuring the growth rate for the company’s total revenues
(made up of net product sales and revenues under collaborative agreements). This is a
reasonably accurate growth rate for product sales as well given the fact that product sales
typically account for about 90% of the company’s total revenues.
One more important piece of information to consider before the final growth rate to be
used in the pro forma financial statements is determined is the fact that some good news about
Amylin’s premier product, BYETTA®, has been released that might help to boost its sales. The
FDA recently approved the product to be used as a “stand-alone medication” (monotherapy) to
enhance glycemic control in adults with type 2 diabetes. Prior to this approval, BYETTA® was

Amylin Pharmaceuticals, Inc. Financial Analysis Report 65
Expected slight increase in BYETTA
sales
Industry expected growth rate for 2009
= 10.3%
Moderate market growth
Amylin’s historical growth rate of 7.6% (over past 2 years)
g = 8%
only approved to be used by patients who were not able to attain adequate glycemic control with
other common diabetes drugs (Amylin Press Release, 2009). This news means that doctors can
now prescribe BYETTA® as a first-line treatment for their diabetes patients. Thus, it is likely
that there will be a slight increase in prescriptions for the drug in the fourth quarter of 2009.
Increased sales for BYETTA® is significant for Amylin considering the fact that it accounts for
the majority of net product sales (as highlighted in the introduction section of this report).
Collectively reviewing the facts that the industry has a higher expected growth rate than it
has had over the past couple of years, the market is slowly growing, and sales from the
company’s chief product are expected to increase slightly, we felt that the aforementioned
growth rate of 7.6% (calculated using regression analysis) could be rounded up to an even 8%.
Figure 13 below summarizes the information used to arrive at this growth rate.
Figure 13: Growth Rate Determination
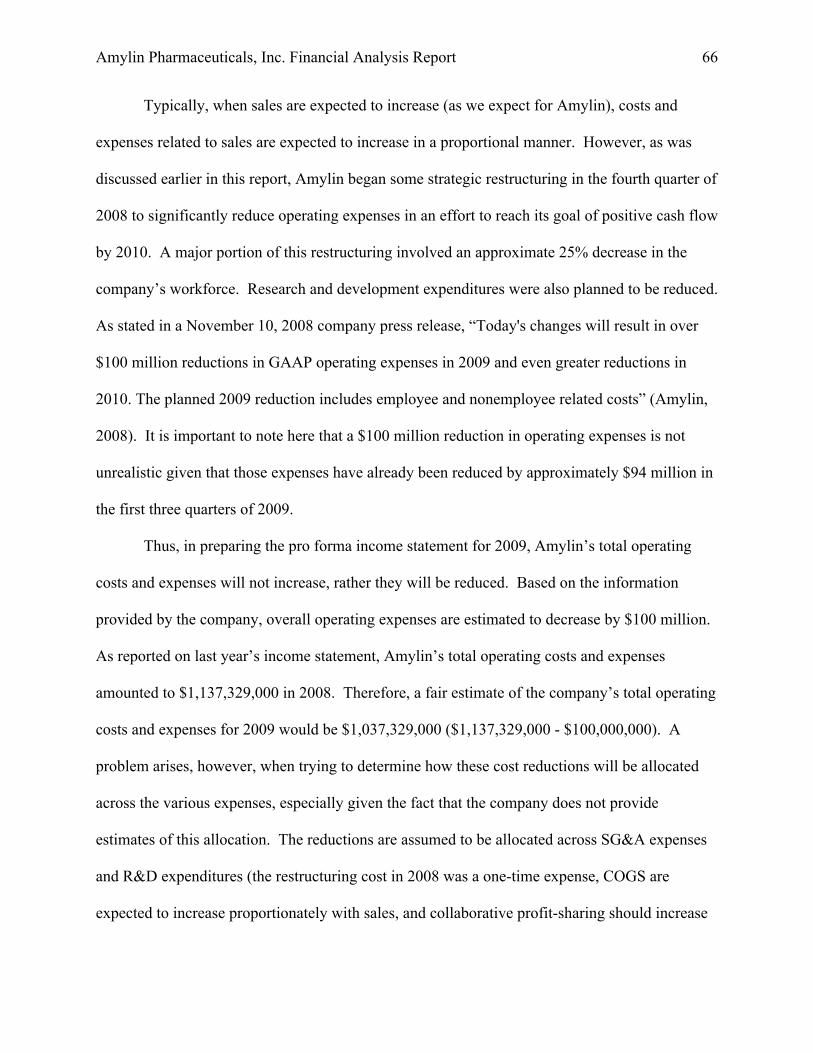
Amylin Pharmaceuticals, Inc. Financial Analysis Report 66
Typically, when sales are expected to increase (as we expect for Amylin), costs and
expenses related to sales are expected to increase in a proportional manner. However, as was
discussed earlier in this report, Amylin began some strategic restructuring in the fourth quarter of
2008 to significantly reduce operating expenses in an effort to reach its goal of positive cash flow
by 2010. A major portion of this restructuring involved an approximate 25% decrease in the
company’s workforce. Research and development expenditures were also planned to be reduced.
As stated in a November 10, 2008 company press release, “Today's changes will result in over
$100 million reductions in GAAP operating expenses in 2009 and even greater reductions in
2010. The planned 2009 reduction includes employee and nonemployee related costs” (Amylin,
2008). It is important to note here that a $100 million reduction in operating expenses is not
unrealistic given that those expenses have already been reduced by approximately $94 million in
the first three quarters of 2009.
Thus, in preparing the pro forma income statement for 2009, Amylin’s total operating
costs and expenses will not increase, rather they will be reduced. Based on the information
provided by the company, overall operating expenses are estimated to decrease by $100 million.
As reported on last year’s income statement, Amylin’s total operating costs and expenses
amounted to $1,137,329,000 in 2008. Therefore, a fair estimate of the company’s total operating
costs and expenses for 2009 would be $1,037,329,000 ($1,137,329,000 - $100,000,000). A
problem arises, however, when trying to determine how these cost reductions will be allocated
across the various expenses, especially given the fact that the company does not provide
estimates of this allocation. The reductions are assumed to be allocated across SG&A expenses
and R&D expenditures (the restructuring cost in 2008 was a one-time expense, COGS are
expected to increase proportionately with sales, and collaborative profit-sharing should increase

Amylin Pharmaceuticals, Inc. Financial Analysis Report 67
proportionately with revenues because the more revenues the company takes in, the more they
must share with their partner, Eli Lilly). It is expected that SG&A expenditures are to be slashed
more than R&D expenditures given the 1/4 reduction in staff. The estimated SG&A and R&D
expenditures in the following pro forma income statement are arbitrary and were determined
based on two factors: (1) SG&A expenditures should reflect a larger decrease than R&D
expenditures, and (2) the expenditures between the two must combine with the expected 8%
increases in COGS and collaborative profit sharing to result in total operating costs and expenses
of $1,037,329,000. While this may not be the ideal way to project the two expenditures, it is the
best that can be done given the information provided to us by the company. Despite the possible
inaccuracies in allocation, the projected $1,037,329,000 in total expenses is assumed to be fairly
accurate. Moreover, it does not matter how the individual cost components are determined, as
long as they add up to $1,037,329,000, it will not affect our projected net loss.
Finally, it will be assumed that interest and other income, interest and other expenses, and
loss on impairment of investments will all remain the same and will thus simply be carried over.
Figure 14 below shows Amylin’s pro forma income statement for 2009.

Amylin Pharmaceuticals, Inc. Financial Analysis Report 68
Figure 14: Pro Forma Income Statement for 2009
Amylin Pharmaceuticals, Inc. Pro-Forma Income Statement (2009)
(in thousands) Year ended December 31, 2008 Forecast Basis 2009 Forecast Revenues:
Net Product Sales $ 765,342 108% $ 826,569 Revenues under collaborative agreements 74,767 108% 80,748
Total Revenues
840,109 108% 907,318 Costs and expenses:
Costs of goods sold (91,596) 108% (98,924) Selling, general, and administrative (395,112) (326,597) Research and development (293,095) (285,000) Collaborative profit-sharing (302,600) 108% (326,808) Restructuring (54,926) 0% 0
Total costs and expenses (1,137,329) 8.79% decrease* (1,037,329) Operating loss (297,220) (130,011) Interest and other income 26,561 100% 26,561 Interest and other expense (29,803) 100% (29,803) Loss on impairment of investments (14,943) 100% (14,943) Net loss $ (315,405) $ (148,196) Notes: According to a Nov. 10, 2008 Amylin press release, overall operating expenses are expected to decrease by roughly $100 million. This means total costs and expenses would go down from $1,137,329,000 to about $1,037,329,000 (a 8.79% decrease).

Amylin Pharmaceuticals, Inc. Financial Analysis Report 69
The next step in the financial forecasting process is to develop a pro forma balance sheet.
In creating this projected balance sheet, the 8% growth rate will again be utilized. The reason for
this proportional increase is that those assets and liabilities that are considered “spontaneous”
will fluctuate based on the firm’s sales. It is understood that so long as sales increase, assets that
support those sales must increase proportionately. However, we will be assuming that only the
current assets will increase. Fixed assets will not increase due to the fact of excess capacity. As
discussed earlier in this report, Amylin has recently made a large investment in fixed assets (the
new manufacturing plant in Ohio), and the company is not expected to increase fixed assets
again anytime in the near future.
As for the debt portion of the balance sheet, current liabilities are all expected to increase
proportionately with sales (except payables to collaborative partner which are expected to remain
the same) because these are considered “spontaneous.” All long-term liabilities are expected to
remain the same over the coming year with the exception of restructuring liability which is not
recurring.
All equity will remain the same (no preferred stock or additional common stock is
expected to be issued in 2009). Of course, there are no retained earnings to be considered due to
the fact that the company has no profits. Accumulated deficit will increase by $148,196,000 (the
projected 2009 net loss), and accumulated other comprehensive losses are assumed to remain the
same.
Figure 15 below shows Amylin’s pro forma balance sheet for 2009.

Amylin Pharmaceuticals, Inc. Financial Analysis Report 70
Figure 15: Pro Forma Balance Sheet for 2009
Amylin Pharmaceuticals, Inc. Pro-Forma Balance Sheet (2009)
(in thousands) Year ended December 31,
2008 Forecast
Basis 2009
Forecast ASSETS Current assets:
Cash and cash equivalents $ 237,263 108% $ 256,244 Short-term investments 579,575 108% 625,941 Accounts receivable, net 62,369 108% 67,359 Inventories, net 115,823 108% 125,089 Other current assets 41,038 108% 44,321
Total current assets 1,036,068 108% 1,118,953 Property, plant and equipment, net 636,922 100% 636,922 Other long-term assets 23,755 100% 23,755 Debt issuance costs 15,884 100% 15,884 Total Assets $1,712,629 $ 2,914,468 LIABILITIES AND STOCKHOLDERS' EQUITY Current liabilities:
Accounts payable $ 39,467 108% $ 42,624 Accrued compensation 65,145 108% 70,357 Payable to collaborative partner 60,470 100% 60,470 Other current liabilities 90,125 108% 97,335 Restructuring liability, current portion 24,235 0% 0 Notes payable, current portion 31,250 100% 31,250 Deferred revenue, current portion 3,086 100% 3,086
Total current liabilities 313,778 305,122 Deferred revenue, net of current portion — — Long-term deferred credit 125,000 100% 125,000 Restructuring liability, net of current portion 22,503 0% 0 Other long-term obligations, net of current portion 31,724 100% 31,724 Notes payable, net of current portion 93,750 100% 93,750 Convertible senior notes 775,000 100% 775,000

Amylin Pharmaceuticals, Inc. Financial Analysis Report 71
Stockholders' equity: Preferred stock, $.001 par value, 7,500 shares authorized, none issued and outstanding at December 31, 2008 and 2007 — Common stock, $.001 par value, 450,000 shares authorized, 137,623 and 135,044 issued and outstanding at December 31, 2008 and 2007 138 100% 138
Additional paid-in capital 2,111,473 100% 2,111,473
Accumulated deficit (1,749,725)
(add 2009 forecasted net
loss) (1,897,921) Accumulated other comprehensive loss (11,012) 100% (11,012)
Total stockholders' equity 350,874 202,678 Total Liabilities and Stockholder's Equity $1,712,629 $ 1,533,274
Looking at the pro forma balance sheet above, it is apparent that Amylin’s specified
sources of financing (the sum of the forecasted levels of operating current liabilities, long-term
debt, common equity, and notes payable) amount to $1,533,274,000 (note: values in the
statement are expressed in thousands of US dollars). However, as the projected balance sheet
shows, based on an estimated 8% increase in sales, the assets required total $2,914,468,000. The
difference between the assets required and the specified sources of financing is $1,381,194,000.
This is Amylin’s additional funds needed (AFN). Amylin must raise these AFN either through
debt or equity, or some combination of the two. The suggested means of additional financing
will be discussed later.
A final issue to address is the fact that Amylin is hoping for its new novel product,
Exenatide once-weekly (which is a once-weekly version of BYETTA®), to be approved by the
FDA. The approval of this new drug has been in limbo for quite some time now, and it is over a
year and a half behind schedule for approval. This drug is not expected to be introduced to the
market anytime during 2009, and most likely not in 2010 either. Thus, it has no bearing on our

Amylin Pharmaceuticals, Inc. Financial Analysis Report 72
forecasted sales. However, it is an important issue to be aware of. If the product is approved and
introduced to the market it would mark a turning point for the company. Because there is
currently no other once-weekly diabetes medication on the market, and because it is anticipated
that most patients would much rather take an injection once a week than daily, sales of the new
product would be expected to be very high. Exenatide once-weekly has the potential to be
Amylin’s blockbuster drug and catapult the company into a profitable position. If the new
product were to be approved and released, the following issues would need to be considered for
estimating the effects on sales.
• Estimated rate of acceptance by doctors and patients (industry figures of new drug
prescriptions would need to be analyzed)
• Cannibalization effect: because Exenatide once-weekly is a once-weekly version
of BYETTA®, sales of BYETTA® would likely diminish significantly as patients
switch prescriptions. Over time, if Exenatide once-weekly proves successful and
becomes the preferred method of treatment over BYETTA®, BYETTA® could
potentially become obsolete.
CAPITAL STRUCTURE ANALYSIS
Current Capital Structure
Capital structure refers to the different sources of funding that a firm uses to finance its
general operations and growth. A company’s capital structure can consist of any combination of
debt, common stock, preferred stock, and retained earnings (Investopedia, 2009). There should
be adequate equity (stock and retained earnings) to provide financial stability to a firm. Capital

Amylin Pharmaceuticals, Inc. Financial Analysis Report 73
structure analysis evaluates the ability of a company to return equity to an investor without
jeopardizing the financial stability of the company.
The capital structure of Amylin Pharmaceuticals consists of 79.5% debt and 20.5%
common stock. At this time, the company is not profitable and thus has no retained earnings.
According to Amylin’s most recent SEC filing, its 2009 third quarter 10-Q form, its long-term
debt consists of convertible senior notes (ones issued in 2004 and ones issued in 2007), and a
long-term note payable (referred to as a Term Loan) with Bank of America. Amylin took out the
loan with Bank of America in December of 2007. The 2004 Notes, the 2007 Notes, and the
Term Loan are due April 15, 2011, June 15, 2014, and December 21, 2010 respectively.
Moreover, Amylin and Eli Lilly negotiated an unsecured line of credit of $165 million in
October 2008. The line of credit can be drawn upon from December 1, 2009 until June 30, 2011.
Amylin will also be receiving funding from its most recent collaborative agreement,
Takeda Pharmaceuticals (2008 Annual Report). The company expects to receive $75 million
from Takeda up-front, with commercial milestone payments that may approach $1 billion
("Amylin signs weight-loss," 2009). This new collaborative partnership with Takeda is a very
recent development and will likely have a significant bearing on the company’s financial
position in 2010. The up-front payment of $75 million and the potential for up to $925 million
more, is a significant source of capital for Amylin. This new source of funding will help Amylin
avoid accumulating more debt in the near future.
Amylin’s capital structure has undergone some considerable changes over the past few
years. There has been a shift from majority financing through equity to majority financing
through debt. This rise in debt financing has increased the firm’s leverage as well as its risk.
The current capital structure is too heavily burdened with debt. The excessive debt exposes the

Amylin Pharmaceuticals, Inc. Financial Analysis Report 74
company’s stockholders to substantial risk, which in turn increases the cost of equity, plus it
raises the cost of new debt. The figure below illustrates Amylin’s change in capital structure
over the past few years.
Figure 16: Capital Structure (2006-2009)
Component Costs and WACC
As mentioned above, Amylin’s capital structure is comprised of 79.5% debt and 20.5%
common stock. This debt and stock are each referred to as a capital component and each of these
components carries with it a cost. This cost of capital exists because the investors who supply
the funds (creditors and stockholders) expect to receive a return on their investment. The rate of
return that the investors require on a particular capital component will equal the cost of that

Amylin Pharmaceuticals, Inc. Financial Analysis Report 75
component to the company. First, Amylin’s cost of common stock, rs, will be calculated. There
are three approaches to solving for a company’s cost of common stock: the Capital Asset Pricing
Model (CAPM) approach, the dividend-yield-plus-growth-rate approach, and the bond-yield-
plus-risk-premium approach (Brigham & Ehrhardt, 2008, pp. 346-355). The last approach is
considered the least accurate of the three and is more of an informal procedure based on
analytical judgment. The dividend-yield-plus-growth-rate approach (also known as the
discounted cash flow approach) can be very useful in determining a company’s cost of common
stock; however, it cannot be applied to Amylin due to the company’s lack of dividend payout.
Thus, the CAPM approach will be employed to determine Amylin’s cost of common stock. The
CAPM equation is as follows:
CAPM: rj = rRF + (rm – rRF) bj or CAPM: rj = rRF + (RPm) bj
The CAPM equation above equates the required rate of return for a given stock (j) to the
risk free rate plus a risk premium for the stock’s systematic risk. The variable “rj” represents the
required rate of return for stock j. This is the minimum return (expressed as a percentage)
required to attract investors. The variable rRF is the risk-free rate of return. This is the rate of
return an investor would expect from a risk-free investment. The return on short-term U.S.
Treasury bills or bonds is usually used as a measure of the risk-free rate. The variable rm denotes
the required rate of return on the market portfolio—a portfolio comprised of all stocks. The S&P
500 is a fair gauge of the rm. The beta variable, bj, is a measure of the systematic (or
nondiversifiable) risk of an individual stock. Under the CAPM, beta is defined as the amount of
risk that the stock contributes to the market portfolio (Brigham & Ehrhardt, 2008, pp.346-351).
The calculated value of rj will be the component cost of common stock for the company. Using
the data shown below, the CAPM was calculated as follows:

Amylin Pharmaceuticals, Inc. Financial Analysis Report 76
Amylin’s beta = 1.72 (Yahoo! Finance, 2009)
Risk-free rate (current 10-year T-bond rate) = 3.32% (Bloomberg.com)
RPM = 5% (WikiWealth.com)
CAPM: rs = 3.32% + (5%)1.72 =11.92%
Thus, Amylin’s cost of common stock is 11.92%, meaning it will cost the company
nearly 12 cents for every $1 that it raises through the issuance of common stock.
The next step is to determine Amylin’s cost of debt. Two methods were considered for
calculating this capital component cost: a weighted average of the interest rates of the various
loans and the current yield of bonds with a rating like that of Amylin’s. Unfortunately, we were
not able to access information regarding Amylin’s credit rating. Furthermore, the company’s
liability structure is very complex with varying interest payments, some specifying different rates
throughout the life of the loans, and some that are based on the London Interbank Offered Rate.
Due to these difficulties, it was necessary to utilize an outside source in order to obtain the most
accurate cost of debt that we could. It was found that Amylin’s after-tax cost of debt is
approximately 7% (WikiWealth.com).
With the capital cost components of common stock and debt determined to be
approximately 11.92% and 7% respectively, Amylin’s Weighted Average Cost of Capital
(WACC) can now be computed. The table below shows this calculation, with each designated
weight being determined by the proportion of the corresponding capital in Amylin’s capital
structure.
Table 17: Weighted Average Cost of Capital
Weight Component Cost Weighted Cost Debt 0.795 x 7% = 5.565% Common Stock 0.205 x 11.92% = 2.4436% WACC: 8.0086%

Amylin Pharmaceuticals, Inc. Financial Analysis Report 77
VALUATION ANALYSIS
In this section, the analysis will focus on evaluating Amylin’s current book value, market
value, market/book ratio, and liquidation value. The company’s common stock will also be
valued.
Book Value
A firm’s book value is its total assets minus its total liabilities, or simply the value of its
equity, as stated on its balance sheet. The book value per share is the common equity divided by
the number of shares outstanding (Brigham & Ehrhardt, 2008). According to Amylin’s most
recent balance sheet for the period ending September 30, 2009, the company’s book value is
$462,631,000 (the book value of its equity). Currently, the company has 141.74 million
common stock shares outstanding (Yahoo! Finance, 2009). Thus, Amylin’s book value per share
is $3.264 ($462,631,000/141,740,000).
Market Value
The market value of a firm, on a per share basis, is the current value (or price) of a share
of its common stock. At the time of this writing, Amylin’s common stock was trading at $14.58
per share (Yahoo! Finance, 2009). The market/book ratio is this market price per share divided
by the book price per share, $3.62, and is currently $4.466 (Yahoo! Finance, 2009).
Common Stock Valuation
Using the constant growth model, a common procedure for common stock valuation,
Amylin’s common stock would be valued as follows:
Growth rate (g) = 8%
Common stock return/dividends: 0

Amylin Pharmaceuticals, Inc. Financial Analysis Report 78
rs = 11.92%
D1 = D0 + g = 0(1+ 0.08) = 0
P0 = D1 / (rs – g) = 0 / (11.92% - 0.08)
P0 = 0
What the formula above is calculating (what determines the value of the common stock)
is the present value of the expected future dividends. Because Amylin has not paid out any
dividends thus far, and they do not expect to pay out any dividends in the foreseeable future,
according to the formula, the company’s common stock is valued at $0. Of course there are
other methods for determining the value of a company’s common stock. These include the Free
Cash Flow approach and the Market Multiple Analysis approach. However, since Amylin
actually has negative cash flow and has yet to produce any earnings, these methods would result
in a conclusion of zero value as well. As further confirmation, an outside source was used.
WikiWealth also currently values Amylin’s common stock at $0. Nevertheless, it is important to
note here that just because Amylin’s stock is of no value now, does not mean it will not be
valuable in the future. If Amylin is able to get new products to the market, in particular its
Exenatide once-weekly, and begin generating profits then its common stock will increase in
value.
Liquidation Value
The final valuation measure to be applied in this section is liquidation value. Liquidation
value is the net amount that is realized by selling assets of a firm after paying the debt (Brigham
& Ehrhardt, 2008). Liquidation should be considered if a business would be exposing creditors
to high losses if operations were continued, the recovery of a business from loss is remote, or if
the business is worth more closed rather than open (Brigham & Ehrhardt, 2008, p.867). Amylin

Amylin Pharmaceuticals, Inc. Financial Analysis Report 79
Pharmaceuticals should consider liquidation if it is unable to bring the long acting formula of
BYETTA® (Exenatide once-weekly) to market. If forced today to liquidate, due to an
accumulated deficit of $1,749,725,000 and high levels of debt, payment of creditor claims would
be minimal or non-existent. Simply put, Amylin has no liquidation value. However, at the time
of this publication, Amylin has received a large cash infusion from another strategic alliance
with Takeda Pharmaceuticals, pocketing $75 million with the possibility of $1 billion for hitting
strategic milestones. This new partnership may very well be what protects Amylin from
liquidation and keeps the company afloat.
BANKRUPTCY ANALYSIS
To evaluate the financial health of Amylin Pharmaceuticals and to measure the
company’s likelihood of bankruptcy within the next two years, the Altman Bankruptcy Model
will be used along with information from Amylin’s 2008 annual report. The Altman model
involves the collective analysis of five financial ratios, each assigned a fixed weight of
importance, to arrive at a Z-Score. The value of the Z-Score determines the financial health of
the company in concern. If the Z-Score is above 2.99, then the company is considered to be in
good financial health and not at risk for bankruptcy over the following two-year period. If the Z-
Score is between 1.88 and 2.99, then the company’s financial health is shaky, and there is
potential for bankruptcy. A Z-Score within that range should serve as a “warning sign” to the
company. Finally, a Z-Score below 1.88 indicates poor financial health and the likelihood of
bankruptcy in the near future. The formula used to calculate the Z-Score is as follows.

Amylin Pharmaceuticals, Inc. Financial Analysis Report 80
Z = 3.3 (EBIT / Total Assets) + 1.2 (Net Working Capital / Total Assets) + 1.0 ( Sales / Total
Assets) + 0.6 ( Market Value of the Equity / Total Liabilities) + 1.4 ( Retained Earnings / Total
Assets)
The first step in performing this bankruptcy analysis is to calculate the five ratios that
will be used in the Z formula. Information from Amylin’s most recent annual report (2008) will
be used. The table below highlights the calculation of each variable.
Table 18: Bankruptcy Analysis Ratios
Financial Ratio
Formula Thousands of US $ Ratio
Return on Total Assets
EBIT / Total Assets -297,220 / 1,712,629 -0.1735
Sales to Total Assets Net Sales / Total Assets 765,342 / 1,712,629
0.4469
Equity to Debt Market Value of Equity / Total Liabilities
1,956,012 / 1,361,755 1.4364
Working Capital to Total Assets
Net Working Capital / Total Assets
722,290 / 1,712,629 0.4217
Retained Earnings to Total Assets
Retained Earnings / Total Assets
0 / 1,712,629 0
Notes: (1) Market Value of Equity = Price per share x # of shares outstanding ($13.80 x 141.74 million) (2) Net Working Capital = Current Assets – Current Liabilities ($1,036,068 - $313,778)
The next step in this bankruptcy analysis is to plug the computed ratios into the Altman’s
formula to arrive at Amylin’s Z-Score. The calculation of Amylin’s Z-Score is shown in the
following table.
Table 19: Altman’s Bankruptcy Model Z-Score Computation
Ratio
Weight Value
-0.1735 x 3.30 = -0.5726 0.4469 x 1.00 = 0.4469 1.4364 x 0.60 = 0.8618 0.4217 x 1.20 = 0.5060
0 x 1.40 = 0 Z-Score: 1.2421

Amylin Pharmaceuticals, Inc. Financial Analysis Report 81
As aforementioned, an Altman’s Z-Score of less than 1.88 indicates poor financial health
and the likelihood of bankruptcy in the near future. Amylin’s Z-Score of 1.2421 suggests that
the company is in financial distress, and it is at risk of going bankrupt. This does not come as a
surprise given the financial analysis performed on the company up to this point. Grim financial
ratios and the abundant financial weaknesses of the company are troubling signs; however, this
bankruptcy analysis has confirmed suspicions of a looming bankruptcy. If Amylin is unable to
improve the key ratios highlighted above they will not survive.
VALUE-BASED FINANCIAL ANALYSIS
After this comprehensive financial review of Amylin Pharmaceuticals, it is apparent that
the company has been through significant company development, product research/distribution,
and investment in property, plant, and equipment at great expense. Exenatide once-weekly is the
lead pipeline drug and has multi-billion dollar potential so long as the company can stay in
business to allow the once-weekly product to make it to market. The epidemic of obesity and
diabetes worldwide allows potential for international product growth and distribution as well.
Currently Amylin has trimmed its sales force to better manage costs, streamlined
production in a new plant in Ohio, and received positive information regarding its chief product,
BYETTA®, from the FDA. The current focus of the company is to move Exenatide once-weekly
to the market as soon as possible and capitalize on the novel medication and delivery system.
The company’s long-term strategy recently disclosed is for Amylin to continue its obesity
drug programs through a new collaborative agreement with Takeda Pharmaceuticals. This will
allow Amylin to move through cash flow issues and “towards profitability” as described by the
company. Amylin must launch a successful Exenatide once-weekly campaign, carefully manage

Amylin Pharmaceuticals, Inc. Financial Analysis Report 82
costs, and increase its new drug pipeline. The recent collaborative agreement with Takeda will
significantly improve the company’s bottom line and strengthen the financial position of Amylin.
Analysts have received this merger agreement with improved optimism, with Citigroup, Barclays
Capital, and Lazard Capital upgrading their recommendations from selling to holding, or holding
to buy for the company stock (Yahoo! Finance, 2009). Amylin may consider selling more stock
as investors at this time have a more optimistic outlook for the company. As soon as the
company becomes profitable it should also focus on reducing the debt burden.
RECOMMENDATIONS
The biopharmaceutical business is volatile and risky. Following the history of Amylin
Pharmaceuticals and critically evaluating the financial strategy for the company, initial
management decisions and collaborations made solid financial sense to meet needed benchmarks
to move its medications to the market. In the past few years though, Amylin has attempted to
compete globally with “big pharma” companies with very limited success and at the expense of
the stockholders. The company was de-valued and is in a financially perilous position as
evidenced by the financial ratio and bankruptcy analyses. The recent collaborative agreement
with Takeda Pharmaceuticals may provide the needed resources and developmental capabilities
to save the company from disaster. Investment in Amylin Pharmaceuticals may be worthwhile
for the investor who has a high tolerance for risk. Our recommendation to the company would
be to carefully consider merging with or being acquired by a larger biotech or pharmaceutical
company if its Exenatide once-weekly product does not attain FDA approval. In such a case, a
strategic merger or acquisition would be in the best interest of the stockholders. Our
recommendation for current investors would be to hold on to their stock and keep close tabs on

Amylin Pharmaceuticals, Inc. Financial Analysis Report 83
the progress of the company. With a more optimistic outlook for the company going into 2010,
we feel it may be too early to sell. On the other hand, it is also too soon to buy given the still
highly uncertain future of this company.

Amylin Pharmaceuticals, Inc. Financial Analysis Report 84
REFERENCES
(2007). 2007 Form 10K. Retrieved from www.amylin.com
(2008). 2008 Form 10K. Retrieved from www.amylin.com
(2009). About Genzyme. Retrieved from http://www.genzyme.com/corp/structure/corp_home.asp
(2009). About Merck. Retrieved from http://www.merck.com/about/
(2009). About Novo Nordisk. Retrieved from http://www.novonordisk.com/about_us/default.asp
(2009). Amylin signs weight-loss drug deal with Takeda. AOL Money & Finance, Retrieved
from http://money.aol.com/article/amylin-signs-weight-loss-drug-deal-with/747264
Amylin (2009). Amylin.com. Retrieved from http://www.amylin.com
Amylin. (2008, November 10). Amylin Pharmaceuticals announces strategic restructuring and
workforce reduction. Press Release, Retrieved from http://phx.corporate-
ir.net/phoenix.zhtml?c=101911&p=irol-newsArticle&ID=1224733&highlight=
Amylin. (2009, October 30). BYETTA approved for expanded use as first-line treatment for type
2 diabetes. Press Release, Retrieved from http://phx.corporate-
ir.net/phoenix.zhtml?c=101911&p=irol-newsArticle&ID=1349163&highlight=
Amylin Pharmaceuticals Form 10-Q. (2009). Retrieved from
http://investors.amylin.com/phoenix.zhtml?c=101911&p=irol-
SECText&TEXT=aHR0cDovL2NjYm4uMTBrd2l6YXJkLmNvbS94bWwvZmlsaW5nL
nhtbD9yZXBvPXRlbmsmaXBhZ2U9NjU4NjY4MyZhdHRhY2g9T04mc1hCUkw9MQ
%3d%3d
(2009). Amylin Pharmaceuticals Reports Second Quarter Financial Results. Press Release,
Retrieved from http://investors.amylin.com/phoenix.zhtml?c=101911&p=irol-
newsArticle&ID=1309662&highlight=

Amylin Pharmaceuticals, Inc. Financial Analysis Report 85
Amylin Pharmaceuticals, Inc. (2009). Hoover's Company Records, 13328. Retrieved from
Hoover's Company Records. (Document ID: 168166681).
Berman, D. (2009, April 14). 'Poison puts' undercut mergers. Wall street journal, pp. C3.
Boone, L., & Kurtz, D. (2007). Contemporary business. Mason, Ohio: Thompson Higher
Education.
Brigham, Ehrhardt, (2008). Financial management theory and practice.
Thompson/Southwestern.
(2009). Business & Company Resource Center. Retrieved from
http://invreports.galegroup.com.library3.webster.edu/reuters/FinancialReport/FinancialRe
ports.jsp?COUNTRY=US&LOCID=edenweb_main&DIGEST=9242fa9e1d53bc318168
3d2789b760f3&CONTEXT=BCRC&TICKER=AMLN
Edwards, J. (2009, April 22). Amlyin CEO got 11% pay raise despite losses. Retrieved from
http://industry.bnet.com/pharma/10001763/amylin-ceo-got-11-pay-rise-despite-losses-
company-paid-355k-for-lawyer-to-move-house
(2009). Form 10-Q. Retrieved from
http://investors.amylin.com/phoenix.zhtml?c=101911&p=IROL-
secToc&TOC=aHR0cDovL2NjYm4uMTBrd2l6YXJkLmNvbS94bWwvY29udGVudH
MueG1sP2lwYWdlPTY0NTY1MDcmcmVwbz10ZW5r&ListAll=1
Fox News (2009, April 16). Icahn calls for amylin chair to step down. Retrieved from
http://www.foxbusiness.com/search-results/m/22109213/icahn-calls-for-amylin-chair-to-
step-down.htm

Amylin Pharmaceuticals, Inc. Financial Analysis Report 86
Funding Universe (2005). Amylin Pharmaceuticals Inc. Retrieved from
http://www.fundinguniverse.com/company-histories/Amylin-Pharmaceuticals-Inc-
Company-History.html
(2009). IBISWorld Industry Report: Biotechnology in the U.S. IBISWorld. Retrieved (2009,
November 10) from
http://www.ibisworld.com.library3.webster.edu/industry/default.aspx?indid=2001
Investopedia. (2009). Retrieved (2009, September 23) from
http://www.investopedia.com/terms/o/operatingcashflow.asp
Investopedia. (2009). Retrieved (2009, September 23) from
http://www.investopedia.com/terms/c/cashflow.asp
Investopedia. (2009). Retrieved (2009, November 20) from
http://www.investopedia.com/terms/c/capitalstructure.asp
Marshall, D.H., McManus, W.W., & Viele, D.F. (2007). Accounting what the numbers mean.
New York, NY: McGraw-Hill
(2009, September 23). Mergent Online. Retrieved from
http://citationmachine.net/index2.php?more=&reqstyleid=2&mode=form&reqsrcid=APA
WebPage1
(2009). Our history-About GlaxoSmithKline. Retrieved from
http://www.gsk.com/about/history.htm
Q4 2008 Earnings Call (2009, January 27). Amylin 2008 4Q Earnings Call transcript. Retrieved
from http://seekingalpha.com/article/116891-amylin-pharmaceuticals-inc-q4-2008-
earnings-call-transcript

Amylin Pharmaceuticals, Inc. Financial Analysis Report 87
SEC (2008, December 31). United States Securities and Exchange Commission. Retrieved from
http://www.sec.gov/Archives/edgar/data/881464/000104746909002008/a2190933z10-
k.htm
Shwiff, K. (2009). S&P 500 composite third-quarter earnings seen down 15% . The Wall Street
Journal, Retrieved from http://online.wsj.com/article/BT-CO-20091106-715607.html
Silver, S. (2009). Industry Survey Biotechnology. Standard & Poor's Net Advantage. Retrieved
(2009, September 10) from http://www.netadvantage.standardandpoor.com.
library3.webster.edu/NASApp/NetAdvantage/showIndustrySurveyPDF.do?loadIndSurFr
omMenu=pdf
Twin, A. (2009). A Surprisingly decent third quarter. CNNMoney.com, Retrieved from
http://money.cnn.com/2009/11/02/markets/earnings_roundup/index.htm
WACC Discount Rate Analysis - Amylin Pharmaceuticals. (2009). WikiWealth. Retrieved (2009,
November 28) from http://www.wikiwealth.com/research:amln
Weiss, P. (1999, December 10). Tying it all together with the flow ratio. Retrieved from
http://www.fool.com/portfolios/rulemaker/1999/rulemaker991210.htm
(2009). Yahoo! Finance. Retrieved from http://finance.yahoo.com/q?s=AMLN

Amylin Pharmaceuticals, Inc. Financial Analysis Report 88
APPENDIX
Index of Competitors used in Comparison
Company A: Abraxis Bioscience Inc (NMS: ABII)
Company B: Cubist Pharmaceuticals Inc. (NMS: CBST)
Company C: Idexx Laboratories, Inc. (NMS: IDXX)
Company D: Integra LifeSciences Holdings Corp (NMS: IART)
Company E: KV Pharmaceutical Co. (NYS: KV A)
Company F: King Pharmaceuticals, Inc. (NYS: KG)
Company G: Martek Biosciences Corp. (NMS: MATK)
Company H: Medicines Co (The) (NMS: MDCO)
Company I: Medicis Pharmaceutical Corp. (NYS: MRX)
Company J: Valeant Pharmaceuticals International (NYS: VRX)