SHALE GAS - CHALLENGES
AND OPPORTUNITIES
Gopal Singh,
Alok Kumar Singh
13th November ’2013

BP Statistical Review of World Energy 2013
Primary energy consumption per capita 2012Tonnes oil equivalent
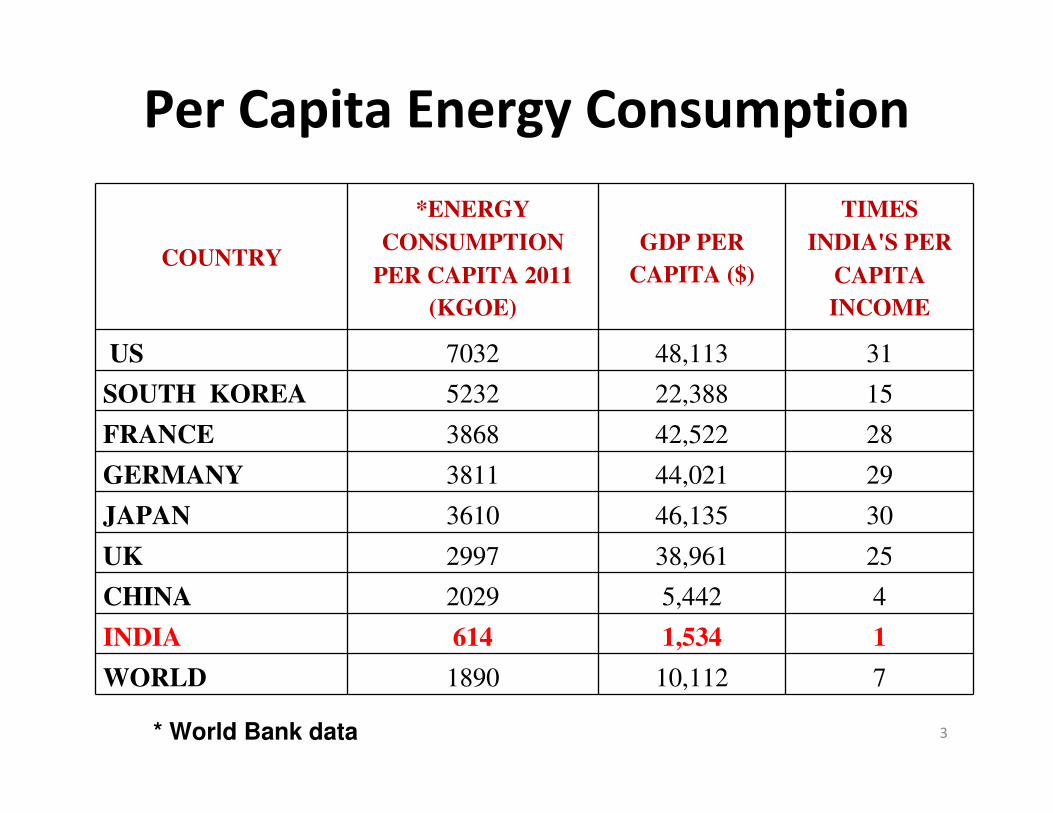
Per Capita Energy Consumption
3
COUNTRY
*ENERGY
CONSUMPTION
PER CAPITA 2011
(KGOE)
GDP PER
CAPITA ($)
TIMES
INDIA'S PER
CAPITA
INCOME
US 7032 48,113 31
SOUTH KOREA 5232 22,388 15
FRANCE 3868 42,522 28
GERMANY 3811 44,021 29
JAPAN 3610 46,135 30
UK 2997 38,961 25
CHINA 2029 5,442 4
INDIA 614 1,534 1
WORLD 1890 10,112 7
* World Bank data
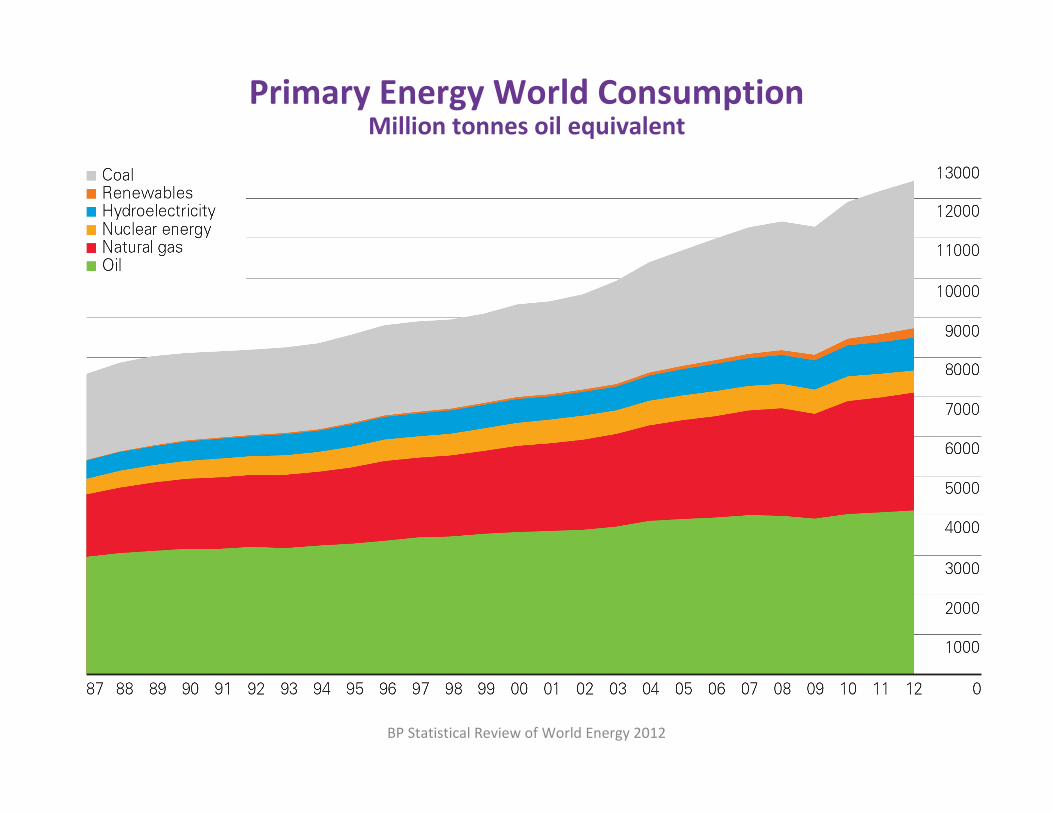
BP Statistical Review of World Energy 2012
Primary Energy World ConsumptionMillion tonnes oil equivalent
5
Country OILNATURAL
GASCOAL
NUCLER ENERGY
HYDRO ELECTRIC
RENEWABLES TOTAL
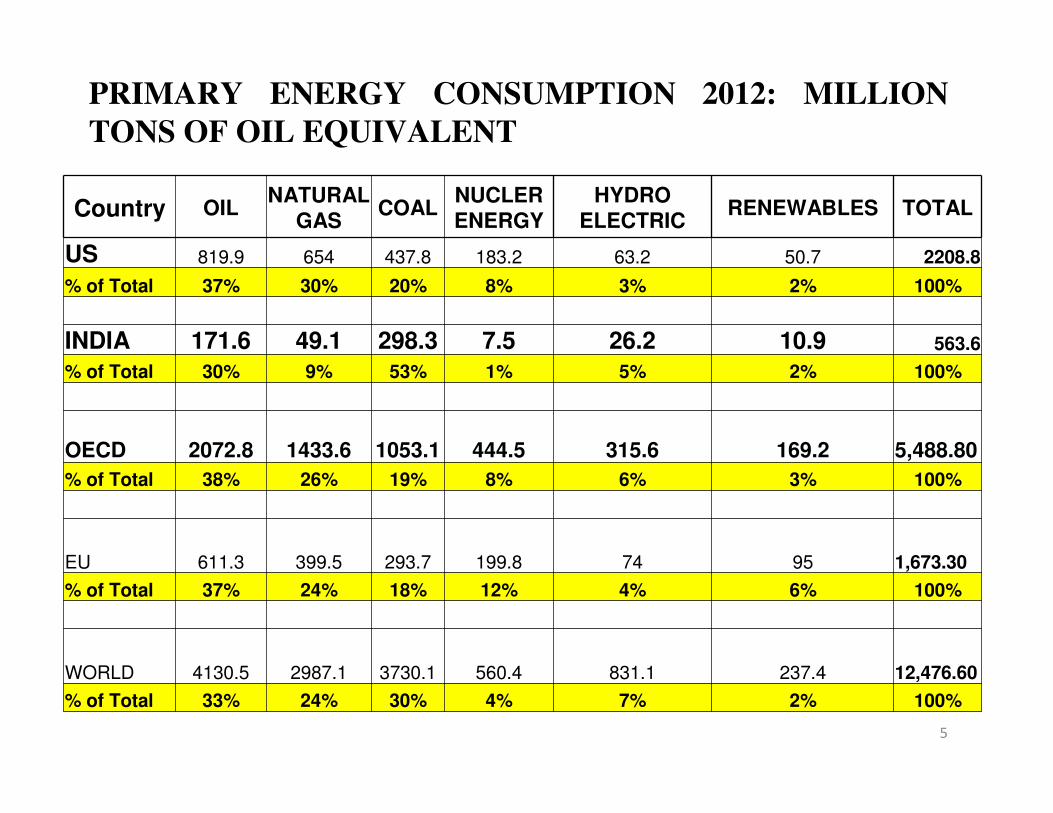
US 819.9 654 437.8 183.2 63.2 50.7 2208.8
% of Total 37% 30% 20% 8% 3% 2% 100%
INDIA 171.6 49.1 298.3 7.5 26.2 10.9 563.6
% of Total 30% 9% 53% 1% 5% 2% 100%
OECD 2072.8 1433.6 1053.1 444.5 315.6 169.2 5,488.80
% of Total 38% 26% 19% 8% 6% 3% 100%
EU 611.3 399.5 293.7 199.8 74 95 1,673.30
% of Total 37% 24% 18% 12% 4% 6% 100%
WORLD 4130.5 2987.1 3730.1 560.4 831.1 237.4 12,476.60
% of Total 33% 24% 30% 4% 7% 2% 100%
PRIMARY ENERGY CONSUMPTION 2012: MILLION
TONS OF OIL EQUIVALENT

Trends in Supply of Primary Commercial
Energy – INDIA (mtoe)*
6
DOMESTIC PRODUCTION 2000-01 2006-07 2011-122016-17
(Proj.)
2021-22
(Proj.)
COAL 130.61 177.24 222.16 308.55 400
LIGNITE 6.43 8.76 10.64 16.8 29
CRUDE OIL 33.4 33.99 39.23 42.75 43
NATURAL GAS 25.07 27.71 42.79 76.13 103
HYDRO POWER 6.4 9.78 11.22 12.9 17
NUCLEAR POWER 4.41 4.91 8.43 16.97 30
RENEWABLE ENERGY 0.13 0.87 5.25 10.74 20
TOTAL DOMESTIC
COMMERCIAL ENERGY 206.45 263.26 339.72 481.84 642
NON COMMERCIAL
ENERGY136.64 153.28 174.2 187.66 202.16
TOTAL 343.09 416.54 513.92 669.5 844.16
*XII PLAN DOCUMENT, PLANNING COMMISSION

Trends in Supply of Primary Commercial
Energy – INDIA (mtoe)
7
IMPORTS 2000-01 2006-07 2011-122016-1 7
(Proj.)
2021-22
(Proj.)
COAL 11.76 24.92 54 90 150
PETROLEUM PRODUCTS 71.25 98.41 129.86 152.44 194
LNG 0 8.45 12.56 24.8 31
HYDRO POWER 0 0.26 0.45 0.52 0.6
TOTAL NET IMPORTS 83.01 132.04 196.87 267.76 375.6
Total Commercial Energy 289.46 395.3 536.59 749.6 1017.6
Commercial Energy
requirement met by
Imports
29% 33% 37% 36% 37%
CAGR over previous 5 years 5.01% 6.25% 6.91% 6.30%
Total Primary Energy 426.1 548.58 710.79 937.26 1219.76
CAGR over previous 5 years 4.09% 5.28% 5.69% 5.41%Primary Energy
requirement met by
Imports
19% 24% 28% 29% 31%

Shale Gas – An introduction
8
Natural gas (mainly methane) is generally classified under two heads:
(a)Conventional Gas: Most of the natural gas that is produced globally comes under the category of
conventional gas where, after drilling in a sedimentary basin that is rich in gas, the gas migrates through
porous rocks into reservoirs and flows freely to the surface where it is collected, treated, and then piped
to various users.and
(b) Unconventional Gas: Shale gas on the other hand is located in rocks of very low permeability and
does not easily flow. Therefore, the technique for recovery of shale gas is quite different from that of
conventional gas.

Natural Gas Resources
9

Natural Gas & Oil Production in India
10
YEAR CBM (BCM)CBM as % of Natural Gas
NATURAL GAS (billion cubic metres)
OIL (Million Tonnes)
2004-05 31.763 33.981
2005-06 32.202 32.19
2006-07 31.747 33.988
2007-08 0.015 0.05% 32.417 34.118
2008-09 0.02 0.06% 32.845 33.508
2009-10 0.038 0.08% 47.496 33.69
2010-11 0.041 0.08% 52.219 37.684
2011-12 0.084 0.18% 47.559 38.09
2012-13 0.107 0.25 % 40.68 37.86

11
Natural Gas & Oil Production in India
The extent of the increase in energy requirement over the Twelfth Five Year Plan depends on the elasticity of energy demand with respect to GDP, which has been falling over time and is currently around 0.80.
Allowing for some further decline in the elasticity, a GDP growth rate of 9.0 per cent per year over the Twelfth Plan will require energy supply to grow at around 6.5 per cent per year. The CAGR for the last 9 years for natural gas and oil production in India is 3.1 and 1.4 % respectively. This is a far cry from the 6.5 % growth required for 9 % GDP growth.

BP Statistical Review of World Energy 2013
Major gas trade movements 2012 Trade flows worldwide (billion cubic metres)

Oil and Gas Reserves in India
Natural Gas Oil
Proved
Reserves
(TCF)
% of
World
Reserves
R / P
(Years)
Proved
Reserves (
Billion
Barrels)
% of
World
Reserves
R / P
(Years)
47 (1.33TCM)
0.7 % 33.1 5.70 0.3 % 17.50
13
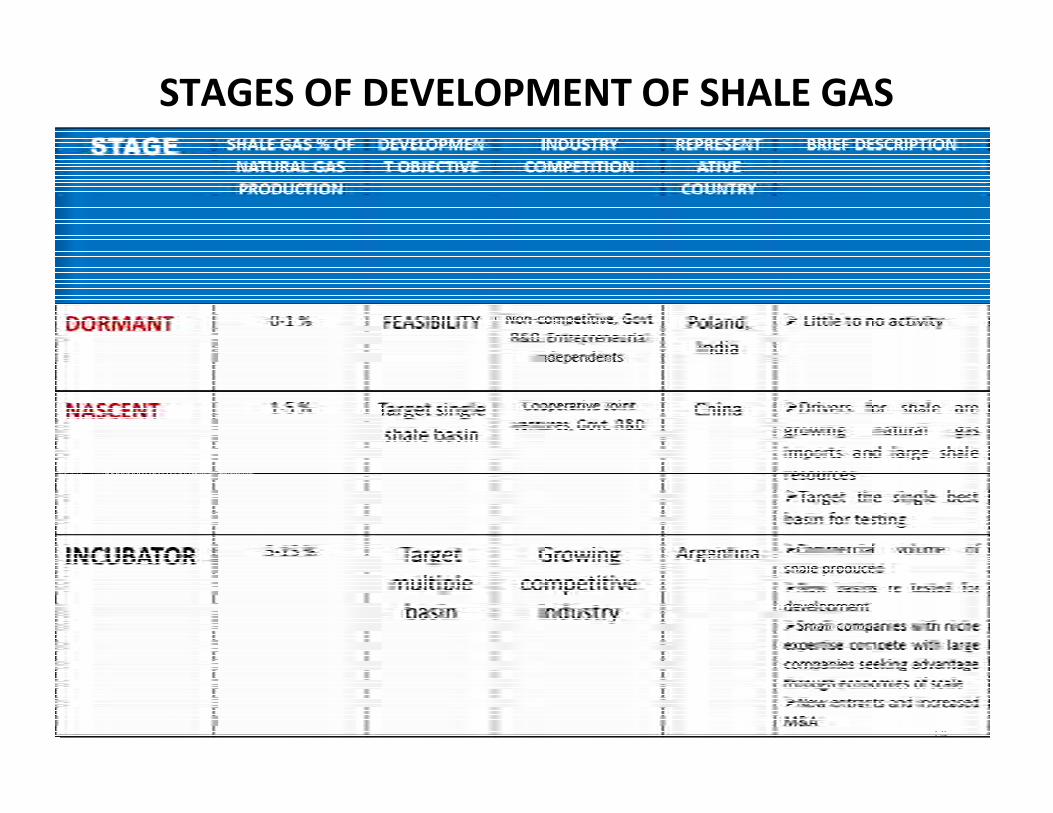
STAGES OF DEVELOPMENT OF SHALE GAS
14

STAGES OF DEVELOPMENT OF SHALE GAS
15
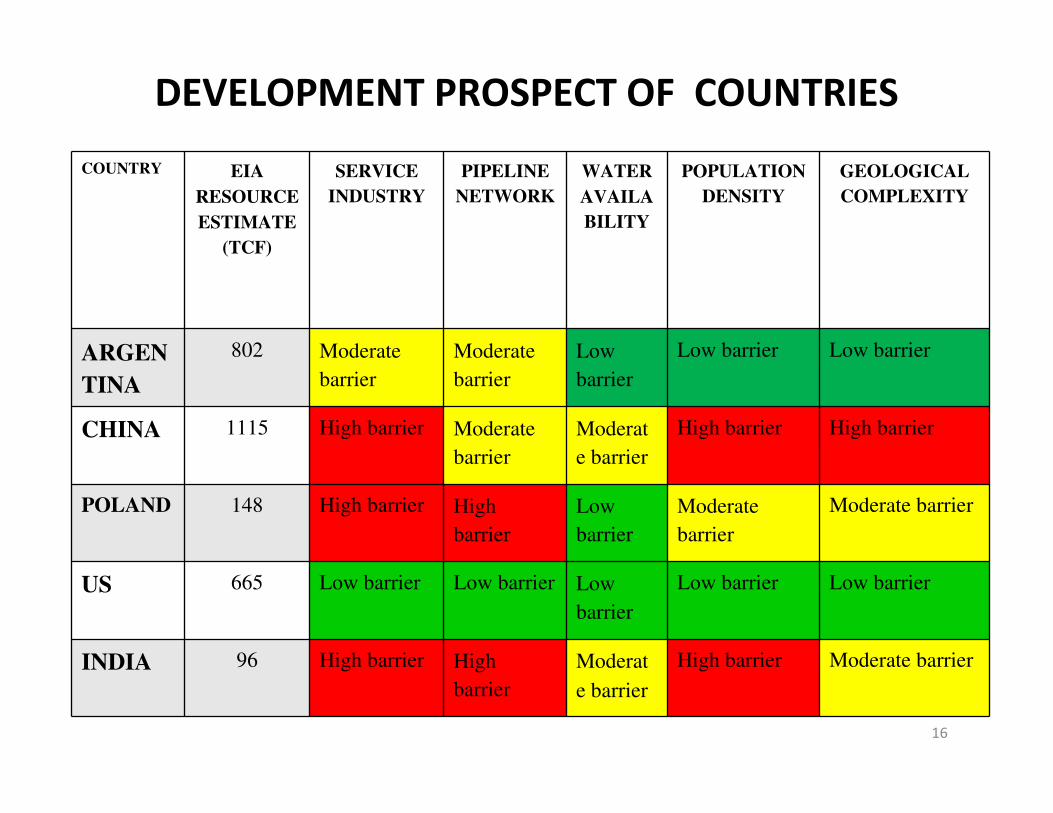
DEVELOPMENT PROSPECT OF COUNTRIES
16
COUNTRY EIA
RESOURCE
ESTIMATE
(TCF)
SERVICE
INDUSTRY
PIPELINE
NETWORK
WATER
AVAILA
BILITY
POPULATION
DENSITY
GEOLOGICAL
COMPLEXITY
ARGEN
TINA
802 Moderate
barrier
Moderate
barrier
Low
barrier
Low barrier Low barrier
CHINA 1115 High barrier Moderate
barrier
Moderat
e barrier
High barrier High barrier
POLAND 148 High barrier High
barrier
Low
barrier
Moderate
barrier
Moderate barrier
US 665 Low barrier Low barrier Low
barrier
Low barrier Low barrier
INDIA 96 High barrier High
barrier
Moderat
e barrier
High barrier Moderate barrier

17
Shale Gas Basins in India

Shale Gas Basins in India *
18
Basin Cambay Basin Damodar Valley
basin
Krishna-
Godavari Basin
Cauvery
Basin
Gross area
(miles2)
7,900 2,270 7,800 9,100
Shale
Formation
Cambay shale Barren measure Permian - Triassic Sattapadi-
Andimada
m
Geologic age Upper
cretaceous /
Tertiary
Permian –
Triassic
Permian –Triassic Cretacious
Physical Extent
Prospective
area (miles2)1940 1,080 8,000 1,010
Average Depth
(ft)
13,000 5,000 11,600 10,000
* EIA ,2013 Assessment

Shale Gas Basins in India
19
Basin Cambay
Basin
Damodar
Valley Basin
Krishna-
Godavari Basin
Cauvery
Basin
TOTAL
Reservoir Properties
Reservoir Pressure Moderately
over pressured
Slightly over
pressured
Normal Normal
Average Total Organic
Content (wt %)2.6 % 3.5 % 6 % 2.3 %
Thermal Maturity
(Ro%)1.6 1.2 1.5 1.15
Clay Content Low /Medium High High High
Resource
Gas In Place (Tcf)* 78 (146) 33 (27) 136 (381) 43 (30) 290 (584)
Technically
recoverable Gas
*(Tcf)
20 (30) 7 (5) 27 (57) 9 (5) 63 (96)
Technically recoverable
Oil * (Billion bbl)2.7 0.20 0.60 0.20 3.7
* EIA ,2011 Assessment, () EIA 2013 Assessment

Other Shale Gas Basins in India
20
1.Upper Assam Basin
2.Vindhyan Basin
3.South Rewa Basin
4.Pranhita- Godavari Basin
5.Rajasthan Basin
Data is not available for the rigorous assessment of reserves of these basins.

India’s Shale Gas Policy - 2013
21
�Delay in policy announcement
�ONGC and OIL given the right to drill for shale oil and gas in the blocks they
have, but fresh auction proposed for all other deposits. India’s first shale gas
well drilled and completed by ONGC, north west of Kolkata. ( depth 2000 m)
�Private sector not allowed to exploit blocks for shale oil and gas in the blocks
they have.
� It provides for auction based on simple production sharing between explorer
and government
�No need to treat shale gas different from conventional natural gas. Traditional
oil comes from drilling in porous and permeable rocks like sandstone and
limestone
�It is possible to have thick limestone / sandstone interspersed with shale
layers, all having oil and gas. To have 2 separate companies drill on sandstone
and shale layers does not make sense. It will lead to unnecessary litigation. US
makes no distinction between the two.
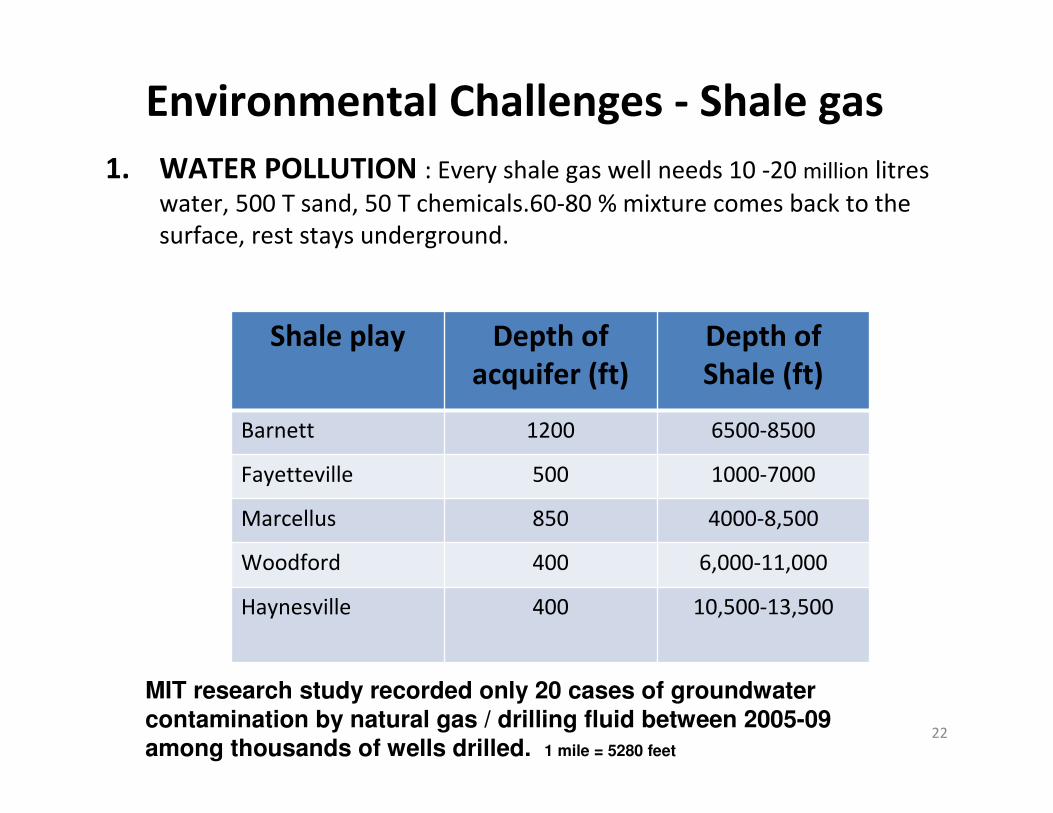
Environmental Challenges - Shale gas
1. WATER POLLUTION : Every shale gas well needs 10 -20 million litres
water, 500 T sand, 50 T chemicals.60-80 % mixture comes back to the
surface, rest stays underground.
22
Shale play Depth of
acquifer (ft)
Depth of
Shale (ft)
Barnett 1200 6500-8500
Fayetteville 500 1000-7000
Marcellus 850 4000-8,500
Woodford 400 6,000-11,000
Haynesville 400 10,500-13,500
MIT research study recorded only 20 cases of groundwater contamination by natural gas / drilling fluid between 2005-09 among thousands of wells drilled. 1 mile = 5280 feet

2. POISONING OF SUB-SOIL BY CHEMICALS
3. Release of methane – a potent greenhouse
gas( 25 times more polluting than CO2) to
atmosphere from shale gas wellsUniversity of Texas study indicated total methane escape is
1 million tons annually from shale gas operations.
However, containment measures captured 99 % of
methane that escaped. Even 3.4 % escape of methane
can change its climate change advantage over coal.
4. MINOR EARTHQUAKES
US HAD HAD OVER 1 MILLION HYDRAULIC
FRACTURING SINCE 1947 WITH FEW ACCIDENTS
Environmental Challenges - Shale gas

US – LEADER IN SHALE GAS
1. HUGE SHALE GAS / TIGHT OIL RESERVES
2. PRIVATE OWNERSHIP OF MINERAL RIGHTS
3. THOUSANDS OF INDEPENDENT OIL COMPANIES : George
P.Mitchell’s ‘Mitchell energy and Development’ was a pioneer,
17 years effort, $ 6 million –”best development money in the
field of gas”
4. HUGE AVAILABILITY OF DRILLING RIGS, OTHER EXPLORATION
AND PRODUCTION TOOLS- 65 % of oil rigs of the world are in US
and Canada. 18,000 DRILL RIGS WITH HORIZONTAL DRILLING
FACILITY .US DRILLS 10,000 SHALE WELLS DRILLED EVERY YEAR
5. ACTIVE FINANCIAL MARKET THAT SUPPLY MONEY FOR NEW
VENTURES
6. LESS POPULATION DENSITY
7. GOVT. SUPPORT IN TERMS OF TAX CREDITS : for drilling in
unconventional natural gas. CARTER’S 1980 LAW TO TAX
WINDFALL PROFITS AT OIL FIRMS ALSO INCLUDED TAX CREDITS
PROVISIONS.24

Ease of Doing Business Index-2013*
25
Economy
Ease of Doing
Business Rank
Starting a Business
Getting Electricity
Getting Credit
Protecting Investors
Paying Taxes
Trading Across Borders
Enforcing
Contracts
Singapore 1 4 5 12 2 5 1 12
Hong Kong 2 6 4 4 3 4 2 10
New Zealand 3 1 32 4 1 21 25 17
United States 4 13 19 4 6 69 22 6
Denmark 5 33 14 23 32 13 4 34
Norway 6 43 14 70 25 19 21 4
United Kingdom 7 19 62 1 10 16 14 21
Korea, Rep. 8 24 3 12 49 30 3 2
Georgia 9 7 50 4 19 33 38 30
Australia 10 2 36 4 70 48 44 15
Finland 11 49 21 40 70 23 6 9
Pakistan 107 98 171 70 32 162 85 155
Nepal 108 105 96 70 82 114 171 137
Bangladesh 129 95 185 83 25 97 119 182
India 132 173 105 23 49 152 127 184
*World Bank Data

26

27

28

POLAND – SHALE GAS EXPERIENCE
1. HUGE SHALE GAS / TIGHT OIL RESERVES, WANTED
TO BECOME SECOND NORWAY
2. DIFFICULT GEOLOGY
3. CUMBERSOME AND DELAYED REGULATION: TAKES
OVER 1 YEAR TO GET PERMITS FOR CHANGED
DRILLING PROGRAM, GOVT’S ENHANCED TAX
PROGRAM – 40 % OF OPERATOR’S PROFIT, ‘NOKE’ A
STATE OWNED COMPANY PROPOSED, TO TAKE
STAKES IN ALL FUTURE PRODUCTION CONCESSIONS
OUTCOME : 40 WELLS DRILLED , MAXIMUM IN EUROPE
WITHOUT ONE PRODUCING COMMERCIAL GAS, EXXON
MOBIL, TALISMAN, MARATHAN OIL QUIT THE COUNTRY29

Qatar’s North Field Vs Iran’s
South Pars Field
30

Qatar’s LNG Development
31
1.Qatar’s North Field discovered by Shell in 1971. Today its reserves are 900 TCF.
2.1970-80s, there was no market for the gas.3.Efficient and determined decision making after
1995 when the Sheikh Hamad became the new Emir saw the development of NF gas reserves.
4.Per capita GDP jumped from 16,238 in 1995 to $ 89,736 in 2011.( almost 6 times). LNG production capacity 77 MTPA.
5.Exxon Mobil technology, $ 60 billion investment6. Iran has not yet been able to export LNG from its
South Pars Field.

Conclusion
1.Shale gas and tight oil exploration and
development is the need of the hour. To start
with we should concentrate on one basin-
Cambay basin .
2. Environmental impact of shale gas
exploration and production is minimal and
manageable.
32

RECOMMENDATIONS
33
1.Development of unconventional gas
resources be given priority by giving it
tax credits, single window clearance.
2. Level playing field - private and public
sector – in policy matters.
3. Investment in upstream and mid stream
infrastructure –drill rigs pipelines –
national grid,

RECOMMENDATIONS
Country R&D Expenditure as a % of GDP
R&D Expenditure ($ Billions)
GDP (2011) ($ Billions)
R&D EXPENDITURE
PER CAPITA ($)
Israel 4.30% 10 243 1250.0Sweden 3.70% 20 539 2083.3
Japan 3.50% 205 5870 1614.2South Korea 3.40% 38 1116 760.0
United
States2.80% 420 14991 1329.1
Germany 2.70% 97 3604 1182.9
China 1.50% 108 7204 79.8
India 0.90% 17 1898 14.0
4. We must encourage innovation and R&D. “Oil and gas lie in the mind of men.

India Vs US- Global Innovation Index
35

12 Disruptive Technologies *
36* McKinsey Global Institute

37
Let me conclude by quoting Daniel Yergin from his famous book - The Quest: “…it is essential
that the conditions are nurtured so that creativity can flourish. For that resource –
creativity- will be critical for meeting the challenges and assuring the security and
sustainability of the energy for a prosperous, growing world. That is at the heart of the
quest; it is as much about the human spirit as it is about technology, and that is why this is
a quest that will never end”.
So let me urge you all to be on the trail of that endless ‘Quest’ for knowledge whereby we would be
skilled enough to put together all the pieces of the large jigsaw puzzle of energy security, and take
the country forward in its quest for prosperity.
Oil is found in the minds of men.

References
1. XII PLAN DOCUMENT, PLANNING
COMMISSION
2. BP Statistical Review of World Energy, June
2013
3. Maugeri, Leonardo. "Oil: The Next
Revolution." Discussion Paper ,June 2012
4. Yergin, Daniel “The Quest”
5. Teri – “Shale Gas in India: Look Before You
Leap”38

References
6. Deloitte – Oil & Gas Reality Check 2013
7. U.S. Energy Information Administration (EIA)
report- Technically Recoverable Shale Oil
and Shale Gas Resources: An Assessment of
137 Shale Formations in 41 Countries
Outside the United States- 2013
39

Thank You
40

Economic Impact of Disruptive
Technologies
41

BP Statistical Review of World Energy 2013
© BP 2013
Primary Energy Regional Consumption pattern 2012Percentage

WORLD SHALE GAS MAP – EIA 2011 Study
43