1 Challenge the future
Introduction to Aerospace Engineering
Lecture slides
15-12-2012
Challenge the future
Delft University of Technology
Introduction Aerospace Engineering
Flight Mechanics
Dr. ir. Mark Voskuijl

2 Flight mechanics
7&8. Flight envelope
3 Flight mechanics
Contents
1. Summary previous lectures
2. Introduction
3. Altitude effects on performance diagram
4. Performance limits
5. Operational limits
6. Flight envelope
7. Flight instruments
8. Example calculations

4 Flight mechanics
Contents
1. Summary previous lectures
2. Introduction
3. Altitude effects on performance diagram
4. Performance limits
5. Operational limits
6. Flight envelope
7. Flight instruments
8. Example calculations
5 Flight mechanics
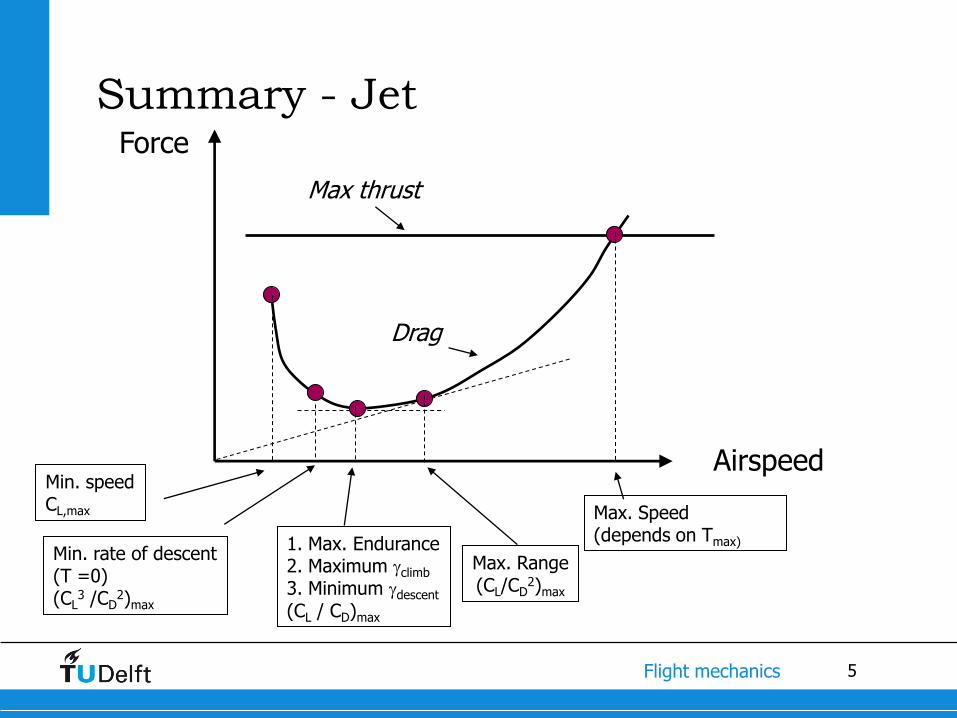
Summary - Jet Force
Drag
Airspeed
Max thrust
1. Max. Endurance 2. Maximum climb
3. Minimum descent (CL / CD)max
Max. Range (CL/CD
2)max
Max. Speed (depends on Tmax)
Min. speed CL,max
Min. rate of descent (T =0) (CL
3 /CD2)max
6 Flight mechanics
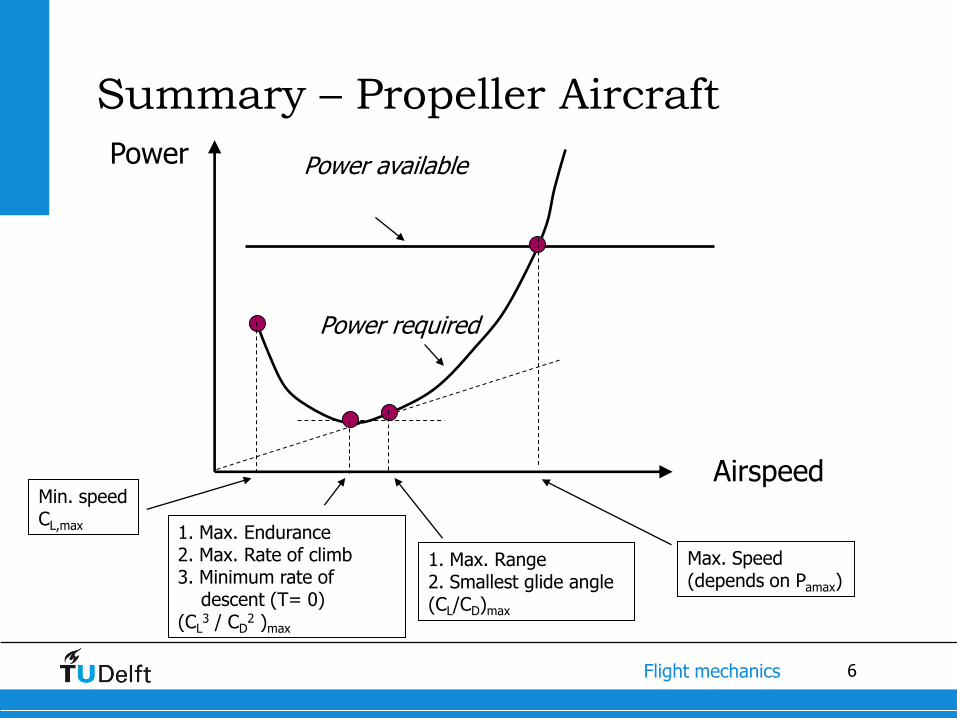
Summary – Propeller Aircraft
Power
Power required
Airspeed
Power available
1. Max. Endurance 2. Max. Rate of climb 3. Minimum rate of descent (T= 0) (CL
3 / CD2 )max
1. Max. Range 2. Smallest glide angle (CL/CD)max
Max. Speed (depends on Pamax)
Min. speed CL,max
7 Flight mechanics
Contents
1. Summary previous lectures
2. Introduction
3. Altitude effects on performance diagram
4. Performance limits
5. Operational limits
6. Flight envelope
7. Flight instruments
8. Example calculations
8 Flight mechanics
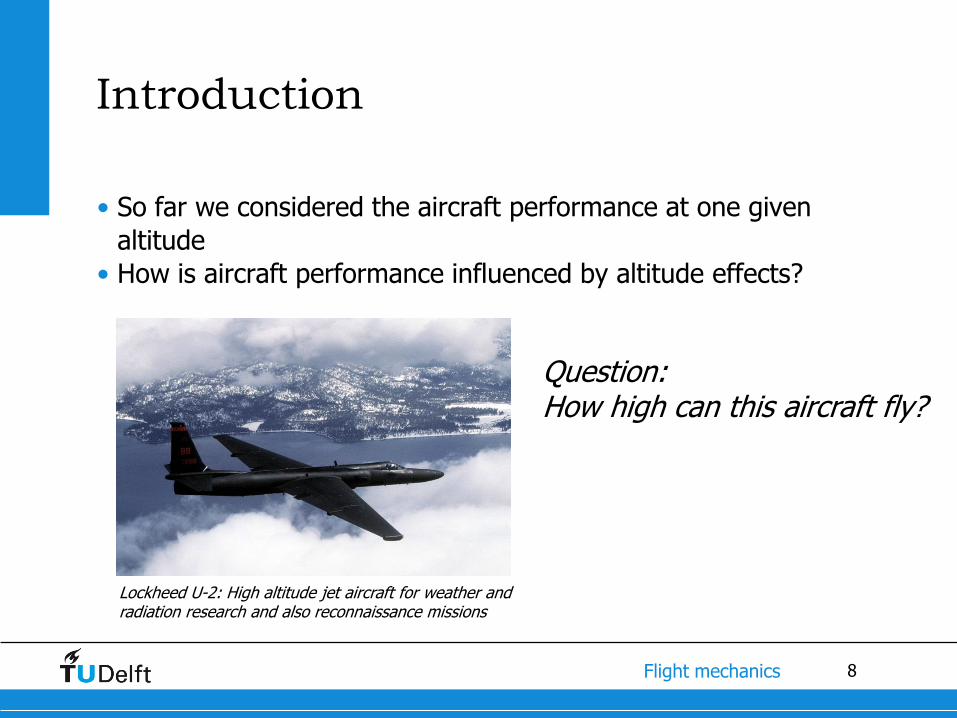
Introduction
• So far we considered the aircraft performance at one given
altitude
• How is aircraft performance influenced by altitude effects?
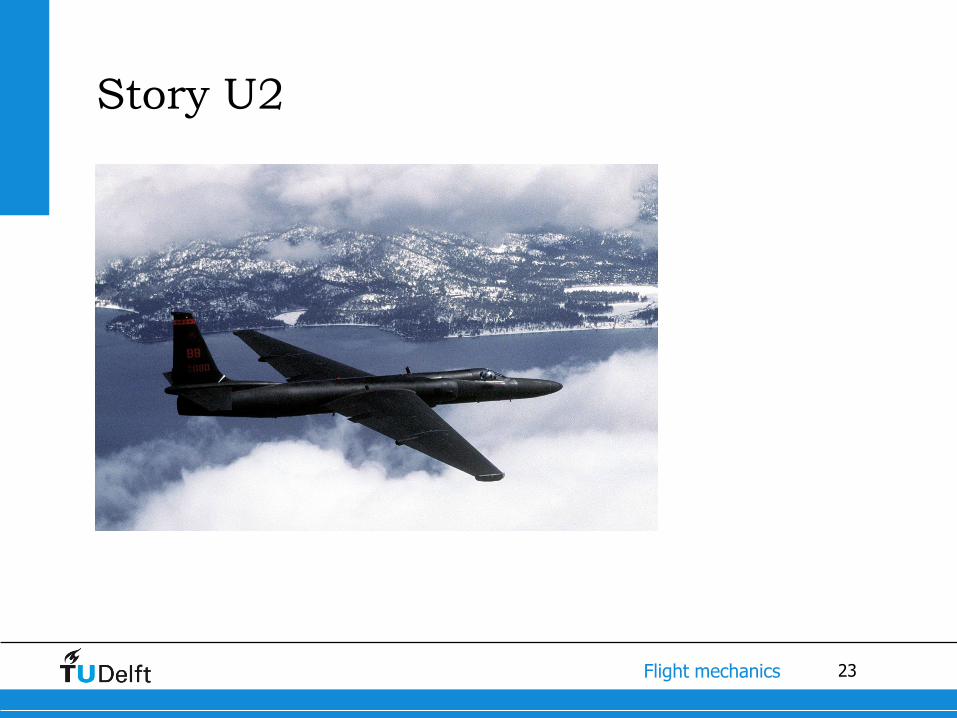
Lockheed U-2: High altitude jet aircraft for weather and radiation research and also reconnaissance missions
Question: How high can this aircraft fly?
9 Flight mechanics
What do you need to learn
The lecture sheets are most important!!!
Background material:
Anderson, Introduction to flight, Par. 6.7, 6.10
Not everything is treated in the book!!!

10 Flight mechanics
Contents
1. Summary previous lectures
2. Introduction
3. Altitude effects on performance diagram
4. Performance limits
5. Operational limits
6. Flight envelope
7. Flight instruments
8. Example calculations
11 Flight mechanics
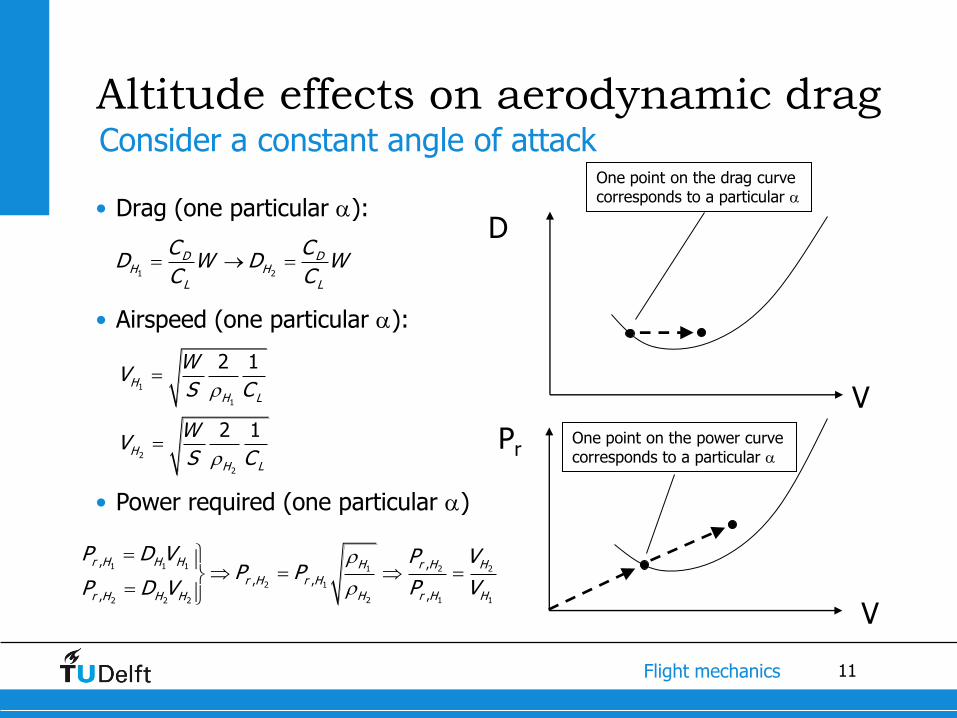
Altitude effects on aerodynamic drag
• Drag (one particular ):
1 2
D DH H
L L
C CD W D W
C C
Consider a constant angle of attack
1
1
2
2
2 1
2 1
H
H L
H
H L
WV
S C
WV
S C
1 1 1 1 2 2
2 1
2 1 12 2 2
, ,
, ,
,,
r H H H H r H H
r H r H
H r H Hr H H H
P D V P VP P
P VP D V
One point on the drag curve corresponds to a particular
D
Pr
V
V
• Airspeed (one particular ):
• Power required (one particular )
One point on the power curve corresponds to a particular

12 Flight mechanics
Altitude effects on aerodynamic drag
For increasing altitude:
• Drag curve shifts to the right
• Power curve shifts up and to the
right
Overview
13 Flight mechanics
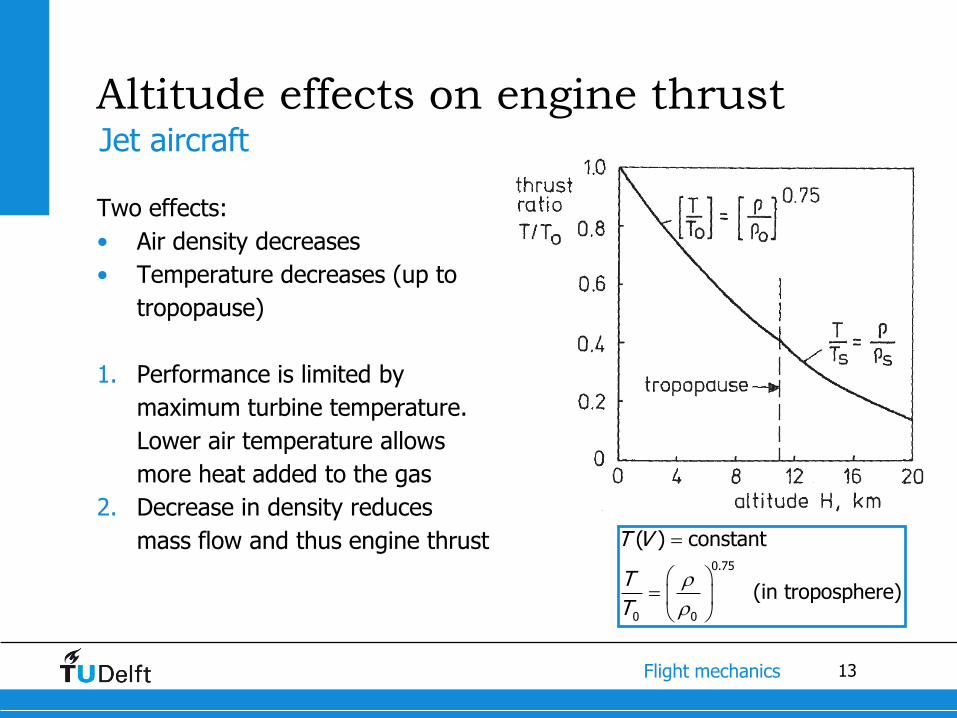
Altitude effects on engine thrust
Two effects:
• Air density decreases
• Temperature decreases (up to
tropopause)
1. Performance is limited by
maximum turbine temperature.
Lower air temperature allows
more heat added to the gas
2. Decrease in density reduces
mass flow and thus engine thrust
Jet aircraft
0.75
0 0
( ) constant
(in troposphere)
T V
T
T
14 Flight mechanics
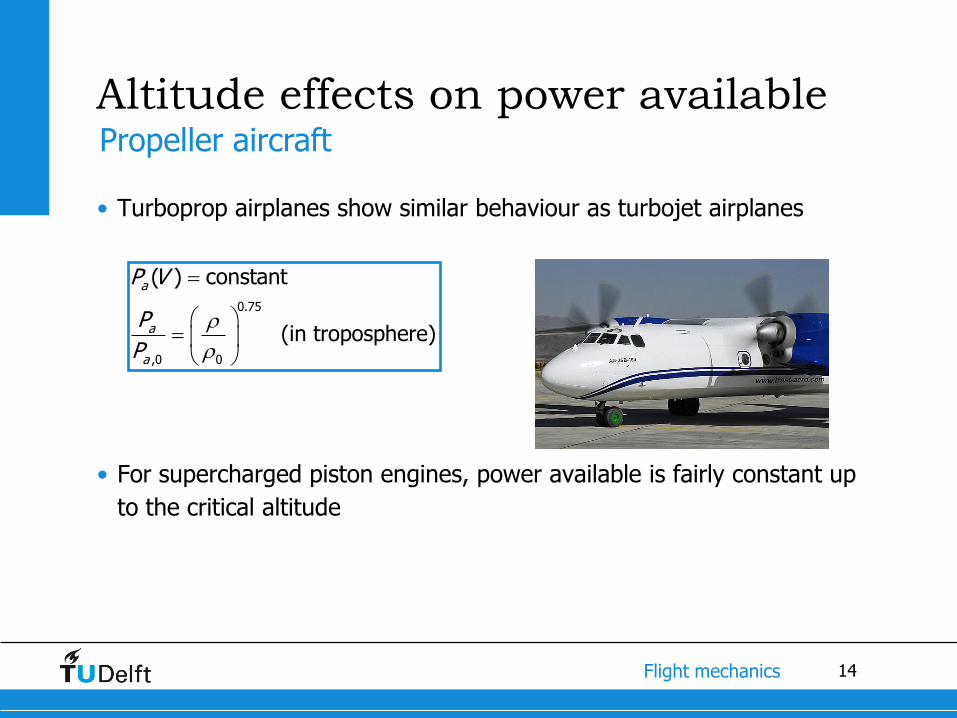
Altitude effects on power available
• Turboprop airplanes show similar behaviour as turbojet airplanes
• For supercharged piston engines, power available is fairly constant up
to the critical altitude
Propeller aircraft
0.75
,0 0
( ) constant
(in troposphere)
a
a
a
P V
P
P
15 Flight mechanics
Performance diagram How does it change with altitude?

16 Flight mechanics
Contents
1. Summary previous lectures
2. Introduction
3. Altitude effects on performance diagram
4. Performance limits
5. Operational limits
6. Flight envelope
7. Flight instruments
8. Example calculations
17 Flight mechanics
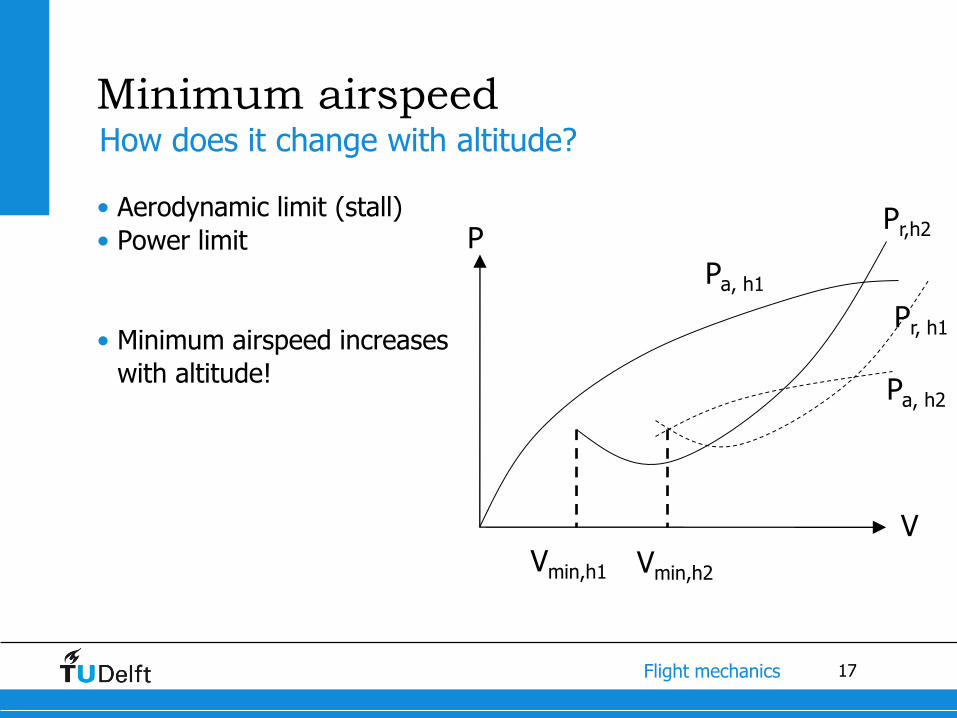
Minimum airspeed
• Aerodynamic limit (stall)
• Power limit
• Minimum airspeed increases
with altitude!
P
V
Pa, h1
Pr,h2
Pa, h2
Pr, h1
Vmin,h1 Vmin,h2
How does it change with altitude?
18 Flight mechanics
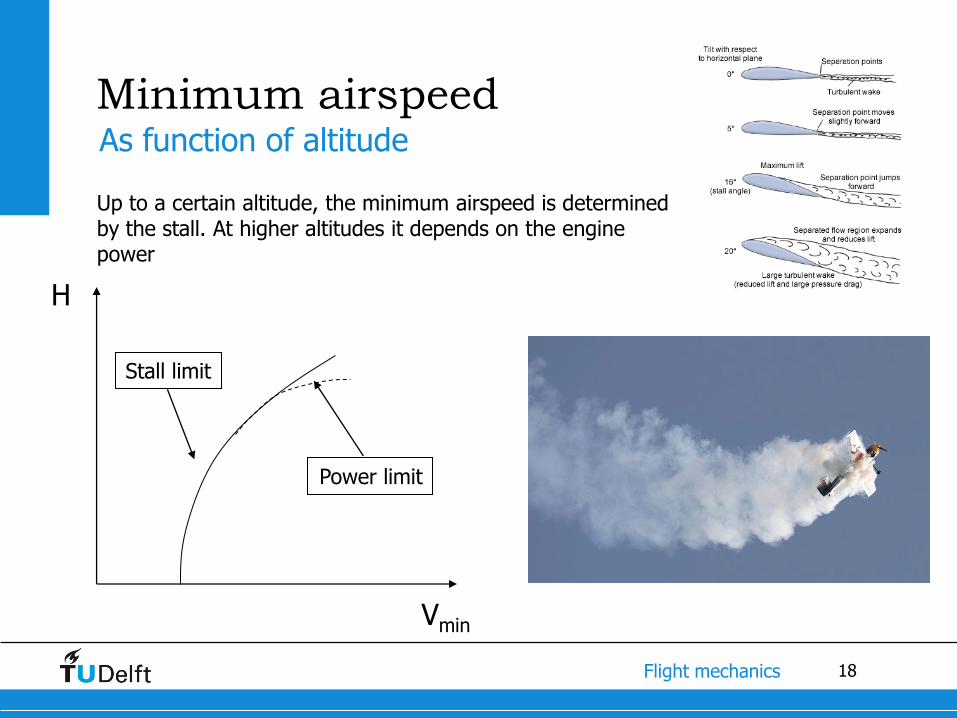
Minimum airspeed As function of altitude
H
Vmin
Stall limit
Power limit
Up to a certain altitude, the minimum airspeed is determined by the stall. At higher altitudes it depends on the engine power
19 Flight mechanics
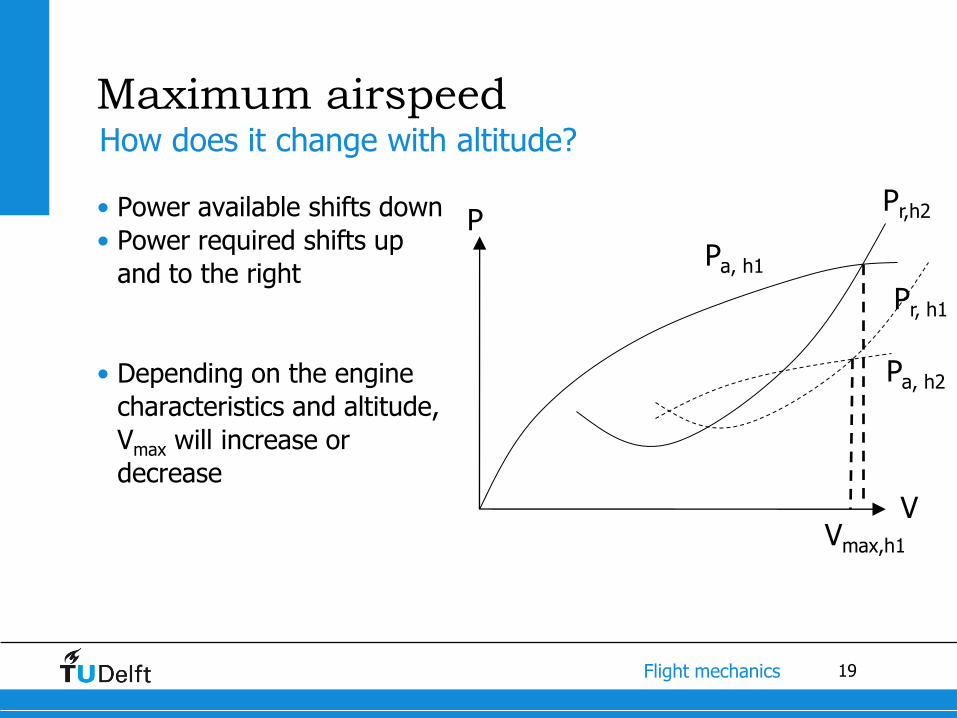
Maximum airspeed
• Power available shifts down
• Power required shifts up
and to the right
• Depending on the engine
characteristics and altitude,
Vmax will increase or
decrease
P
V
Pa, h1
Pr,h2
Pa, h2
Pr, h1
Vmax,h1
How does it change with altitude?

20 Flight mechanics
Maximum rate of climb
• RCmax decreases with altitude
How does it change with altitude?
P
V
Pa, h1
Pr,h2
a rP P
RCW

21 Flight mechanics
Maximum altitude

22 Flight mechanics
Maximum altitude
Practically it is impossible to reach the theoretical (absolute) ceiling in steady flight
23 Flight mechanics
Story U2
24 Flight mechanics
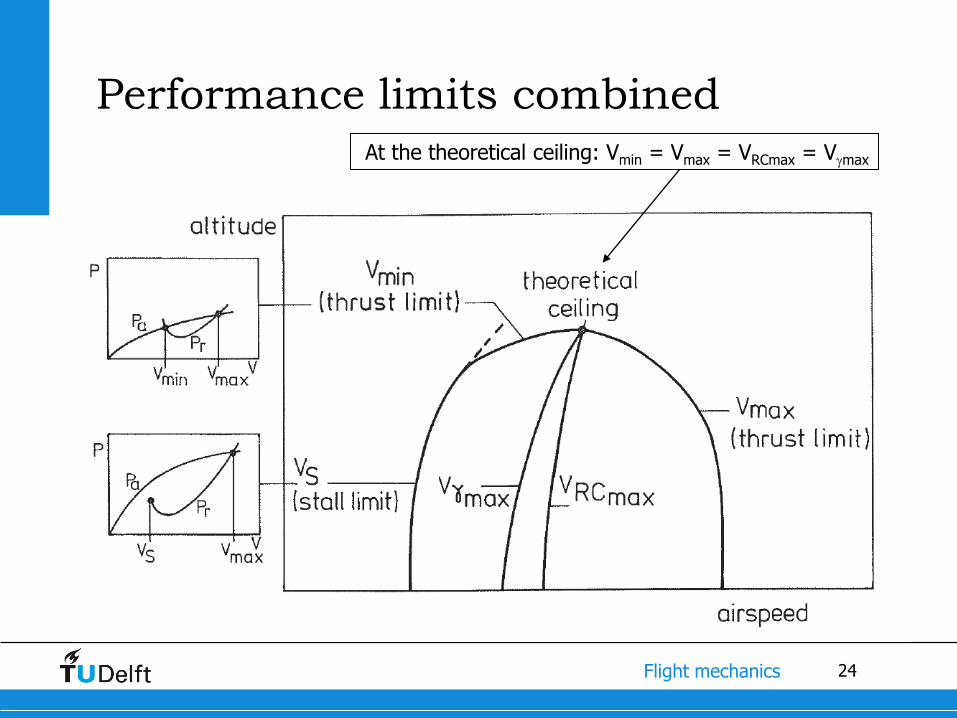
Performance limits combined
At the theoretical ceiling: Vmin = Vmax = VRCmax = Vmax
25 Flight mechanics
Contents
1. Summary previous lectures
2. Introduction
3. Altitude effects on performance diagram
4. Performance limits
5. Operational limits
6. Flight envelope
7. Flight instruments
8. Example calculations
26 Flight mechanics
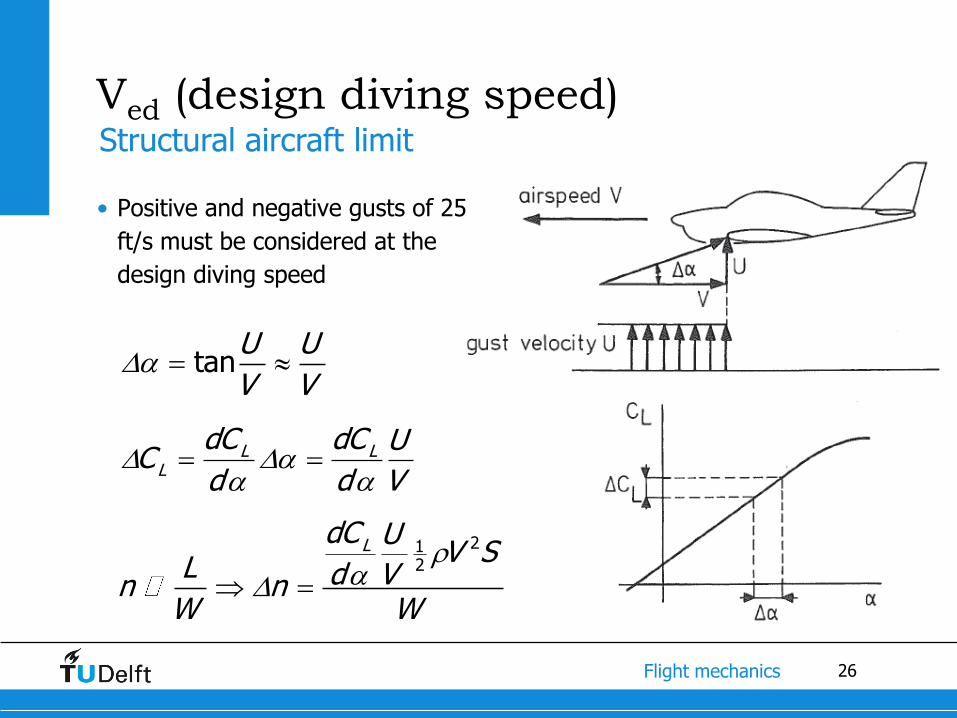
Ved (design diving speed)
• Positive and negative gusts of 25
ft/s must be considered at the
design diving speed
tanU U
V V
Structural aircraft limit
L LL
dC dC UC
d d V
212
LdC UV S
L d Vn nW W
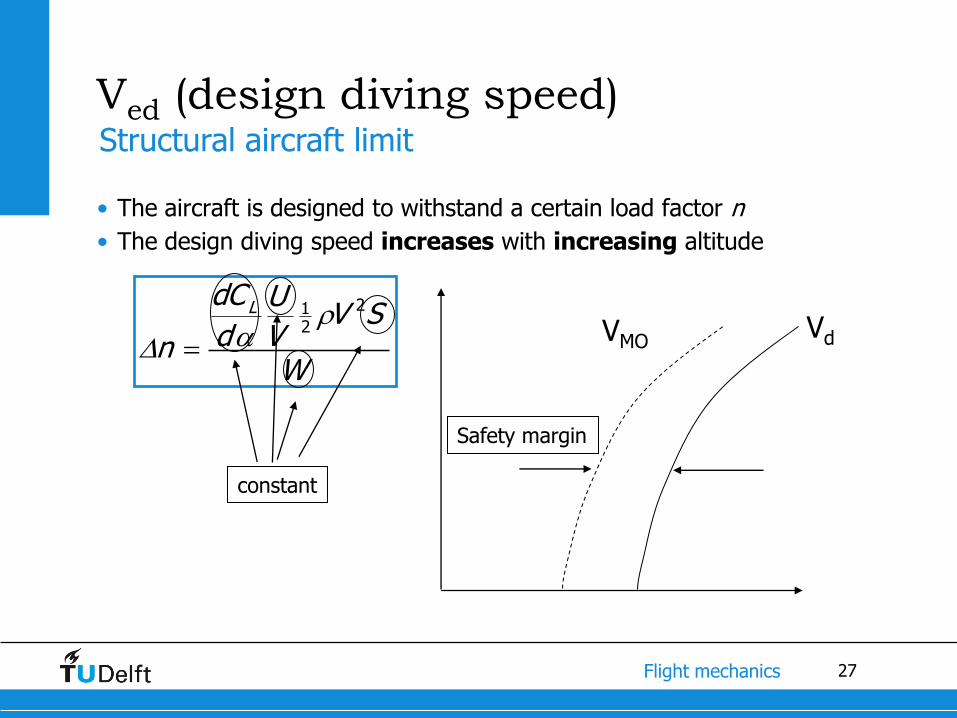
27 Flight mechanics
Ved (design diving speed) Structural aircraft limit
• The aircraft is designed to withstand a certain load factor n
• The design diving speed increases with increasing altitude
212
LdC UV S
d VnW
constant
Vd VMO
Safety margin
28 Flight mechanics
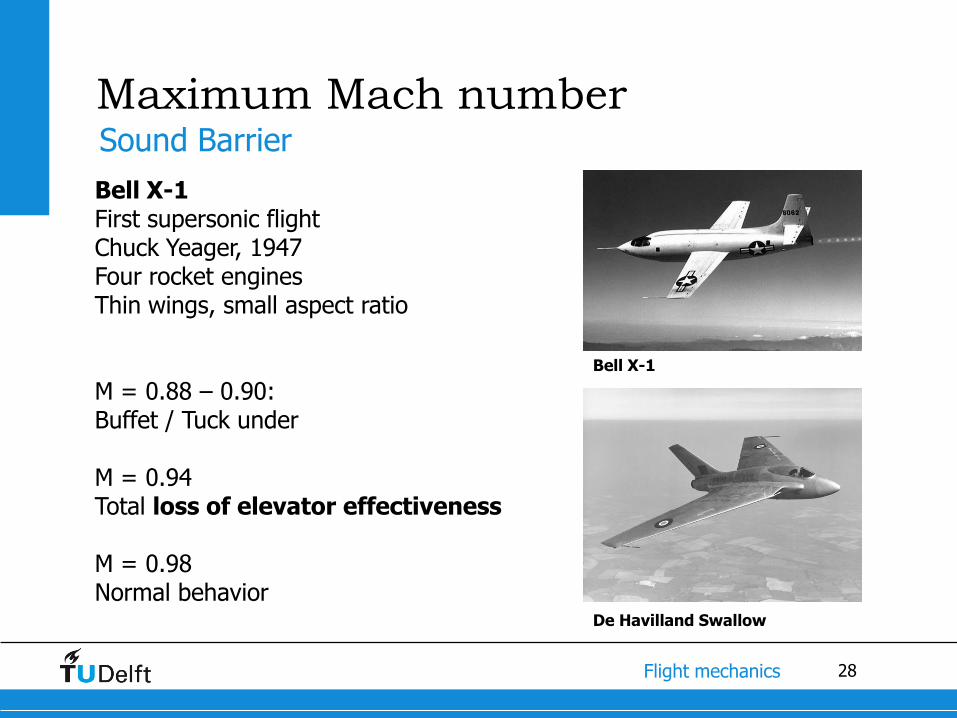
Maximum Mach number
Bell X-1 First supersonic flight Chuck Yeager, 1947 Four rocket engines Thin wings, small aspect ratio M = 0.88 – 0.90: Buffet / Tuck under M = 0.94 Total loss of elevator effectiveness M = 0.98 Normal behavior
Bell X-1
De Havilland Swallow
Sound Barrier

29 Flight mechanics
Maximum Mach number
• Undesirable flying qualities
associated with buffeting effects
0
Troposphere (<11km):
288.15 0.0065
Stratosphere (>11km)
constant
V M a M RT
T T H H
T
H
V
Mmax MMO
Safety margin
Operational limit
30 Flight mechanics
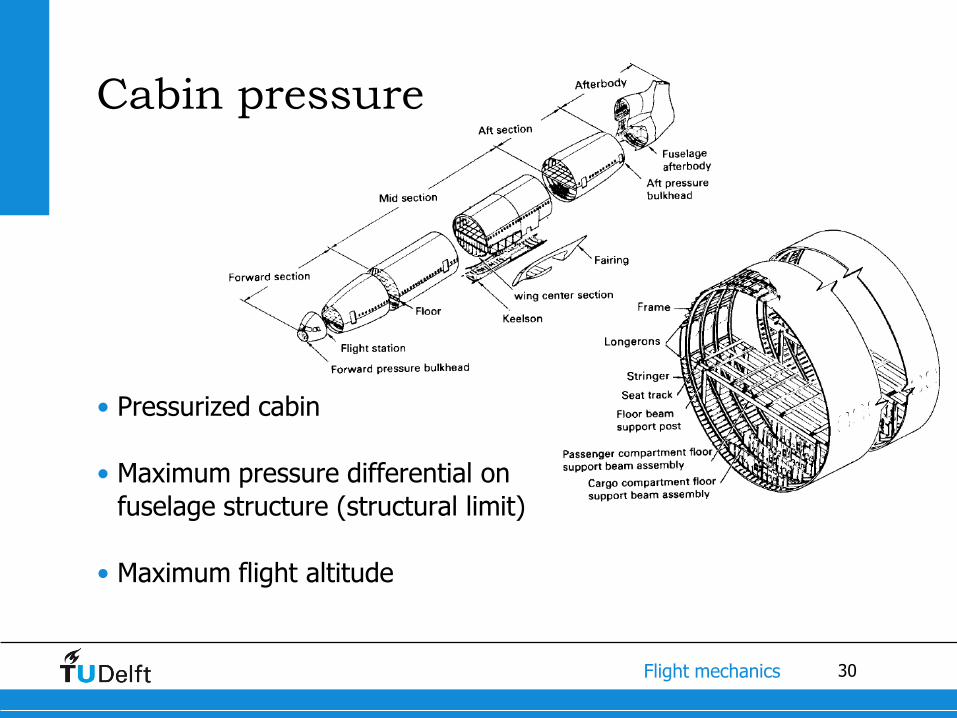
Cabin pressure
• Pressurized cabin
• Maximum pressure differential on
fuselage structure (structural limit)
• Maximum flight altitude
31 Flight mechanics
Contents
1. Summary previous lectures
2. Introduction
3. Altitude effects on performance diagram
4. Performance limits
5. Operational limits
6. Flight envelope
7. Flight instruments
8. Example calculations
32 Flight mechanics
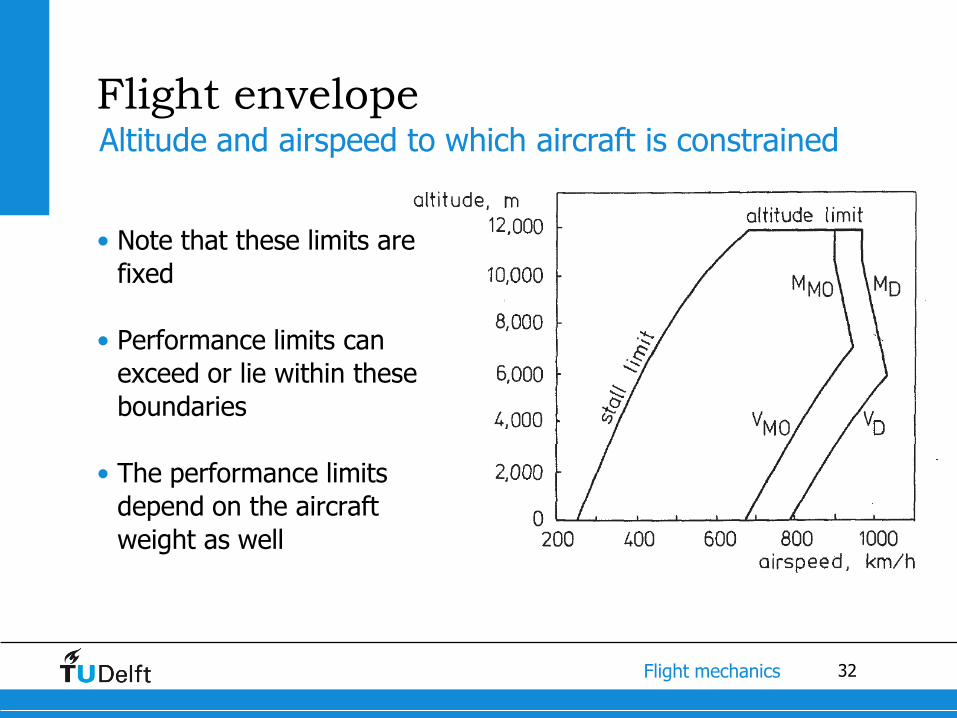
Flight envelope
• Note that these limits are
fixed
• Performance limits can
exceed or lie within these
boundaries
• The performance limits
depend on the aircraft
weight as well
Altitude and airspeed to which aircraft is constrained
33 Flight mechanics
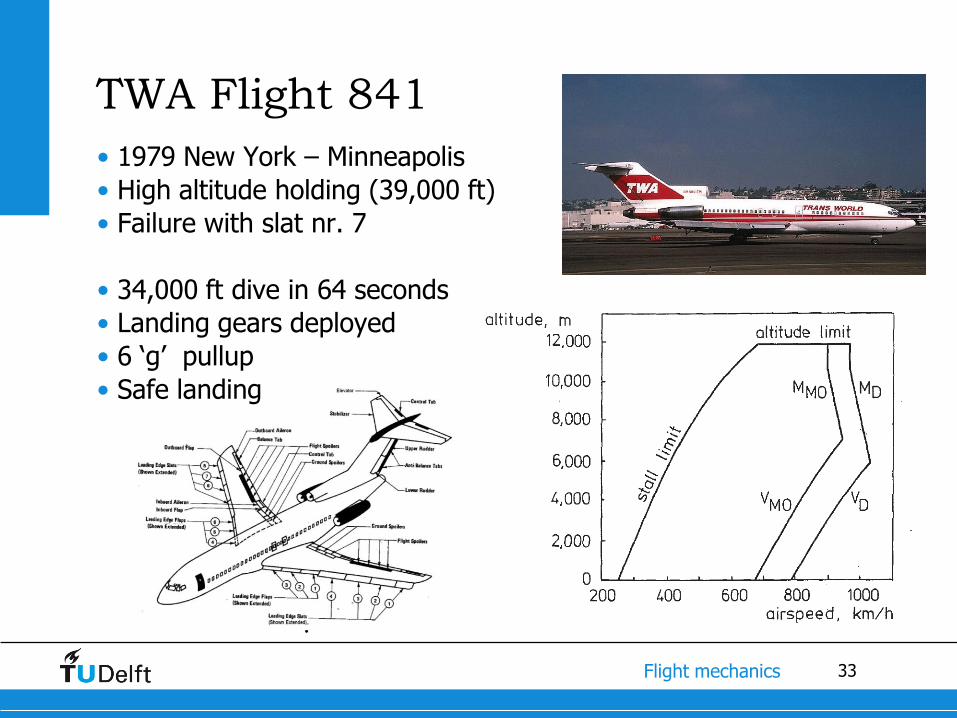
TWA Flight 841
• 1979 New York – Minneapolis
• High altitude holding (39,000 ft)
• Failure with slat nr. 7
• 34,000 ft dive in 64 seconds
• Landing gears deployed
• 6 ‘g’ pullup
• Safe landing
34 Flight mechanics
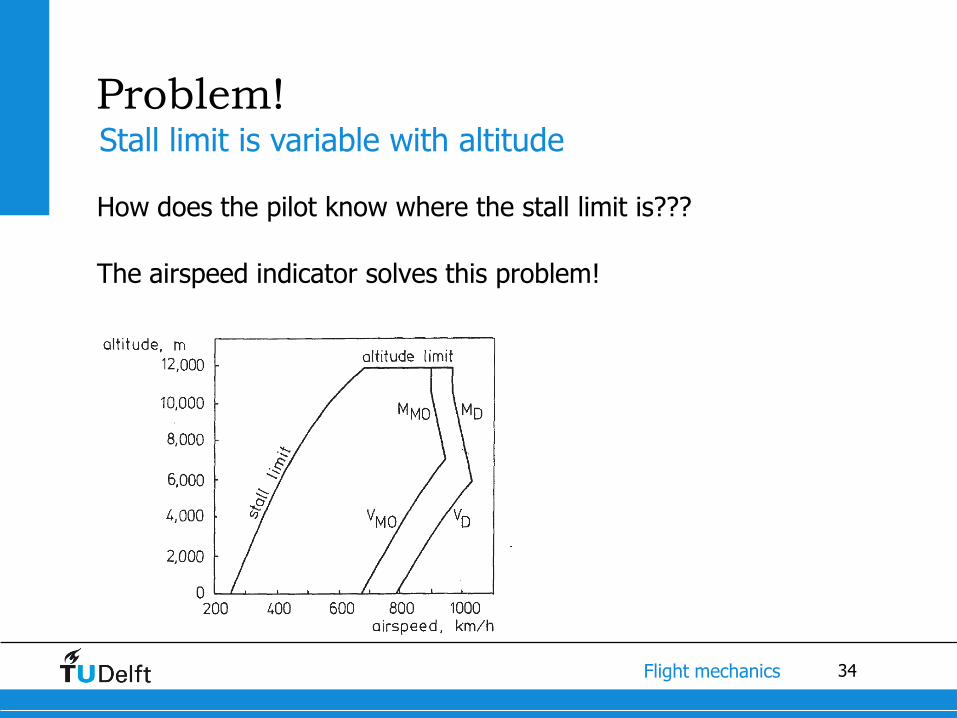
Problem!
How does the pilot know where the stall limit is???
The airspeed indicator solves this problem!
Stall limit is variable with altitude

35 Flight mechanics
Contents
1. Summary previous lectures
2. Introduction
3. Altitude effects on performance diagram
4. Performance limits
5. Operational limits
6. Flight envelope
7. Flight instruments
8. Example calculations
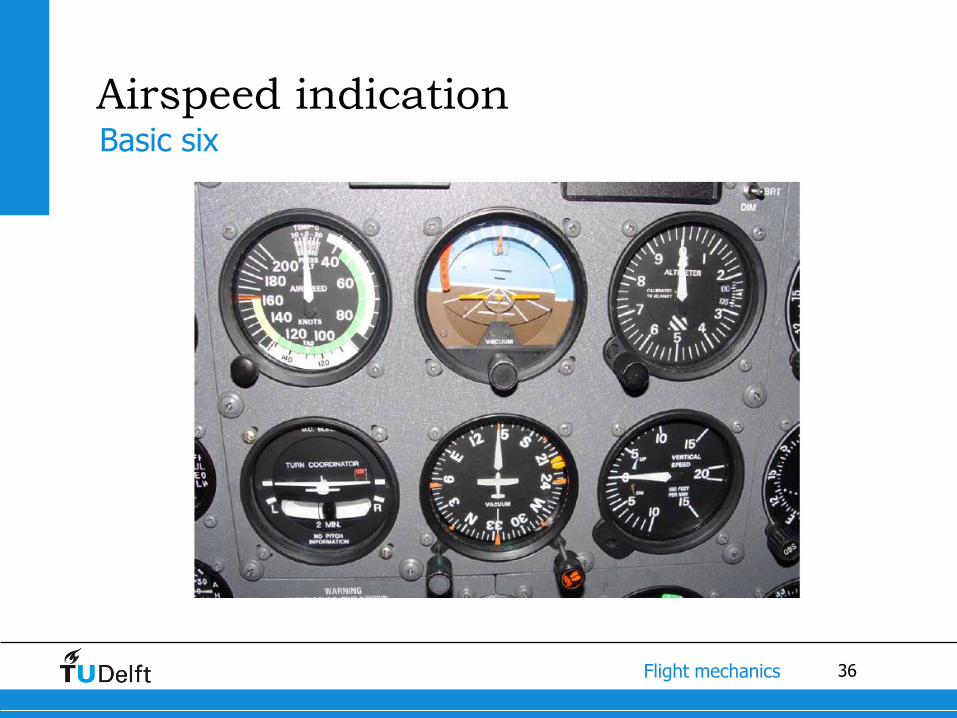
36 Flight mechanics
Airspeed indication Basic six
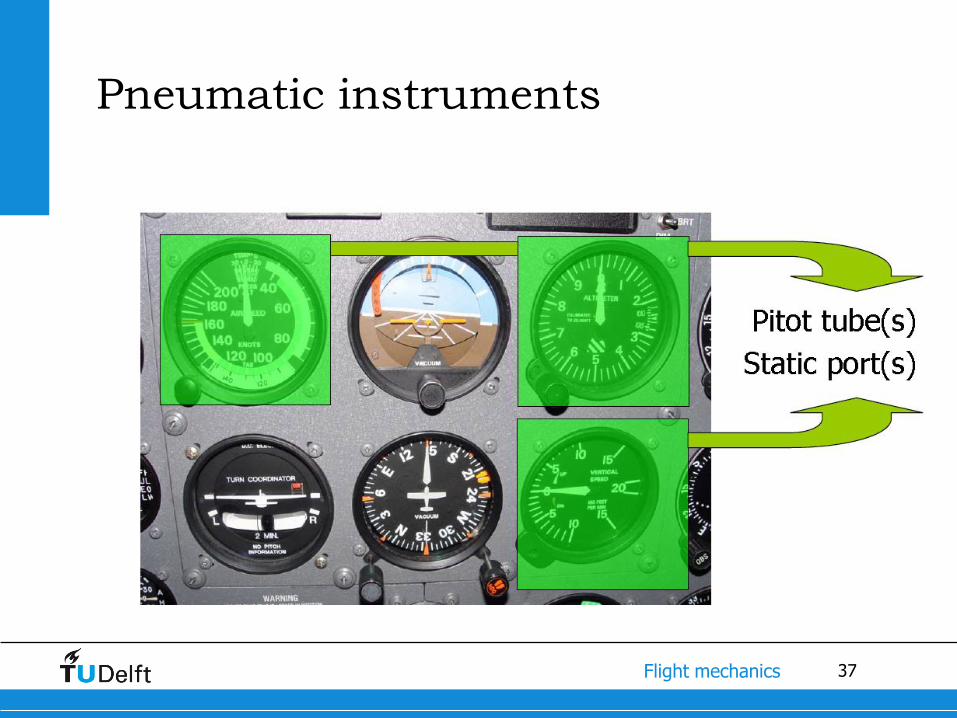
37 Flight mechanics
Pneumatic instruments
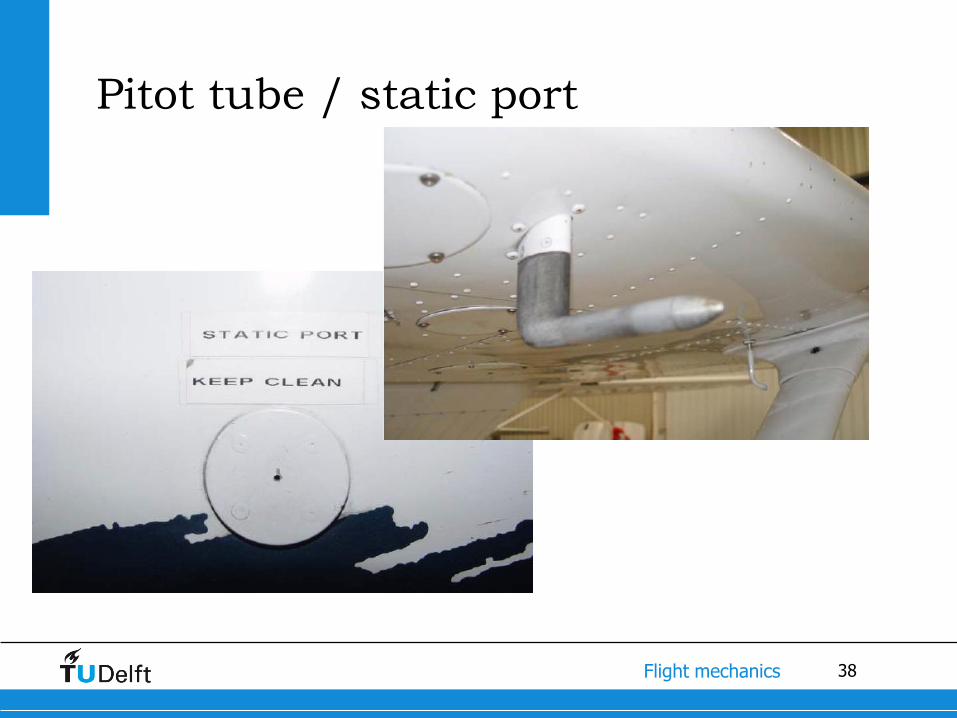
38 Flight mechanics
Pitot tube / static port
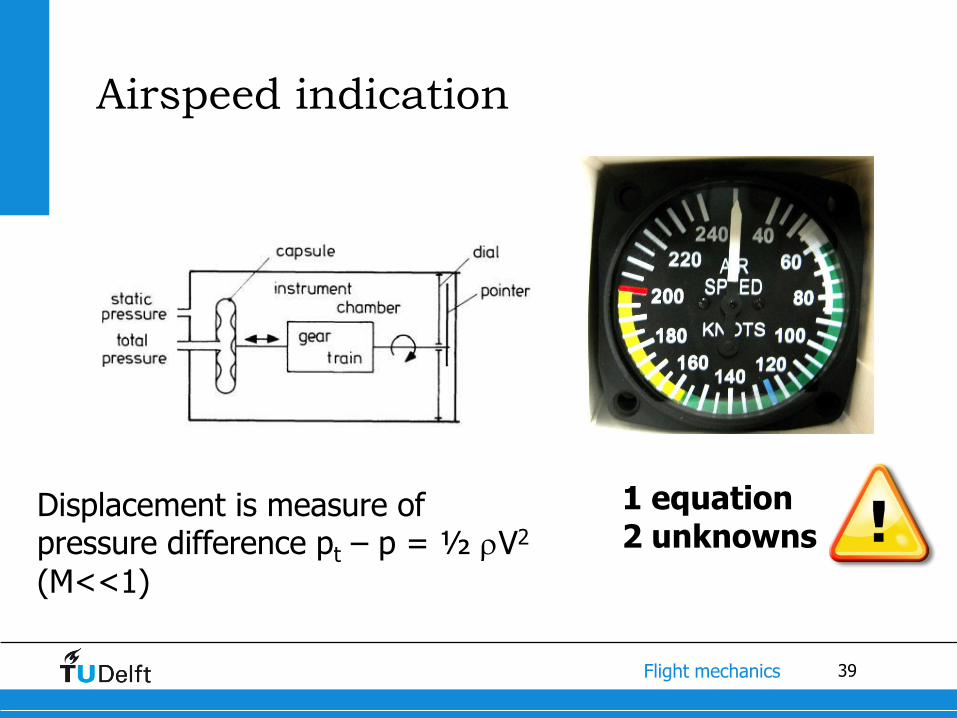
39 Flight mechanics
Airspeed indication
Displacement is measure of pressure difference pt – p = ½ V2 (M<<1)
1 equation 2 unknowns

40 Flight mechanics
Airspeed indication
2 21 102 2
0
e
def
e
V V
V V
Solution: So, the airspeed indicator does not show the true airspeed!
Note, compressibility effects are neglected for now. This will be explained later. (The basic principle is the same; sea level conditions are assumed by the airspeed indicator)
min
,max
2 1 (TAS)
L
WV
S C
,min min
0
(EAS)eV V
,min
0 ,max
2 1 (EAS)e
L
WV
S C
Minimum equivalent airspeed is independent of altitude!

41 Flight mechanics
Altimeter
42 Flight mechanics
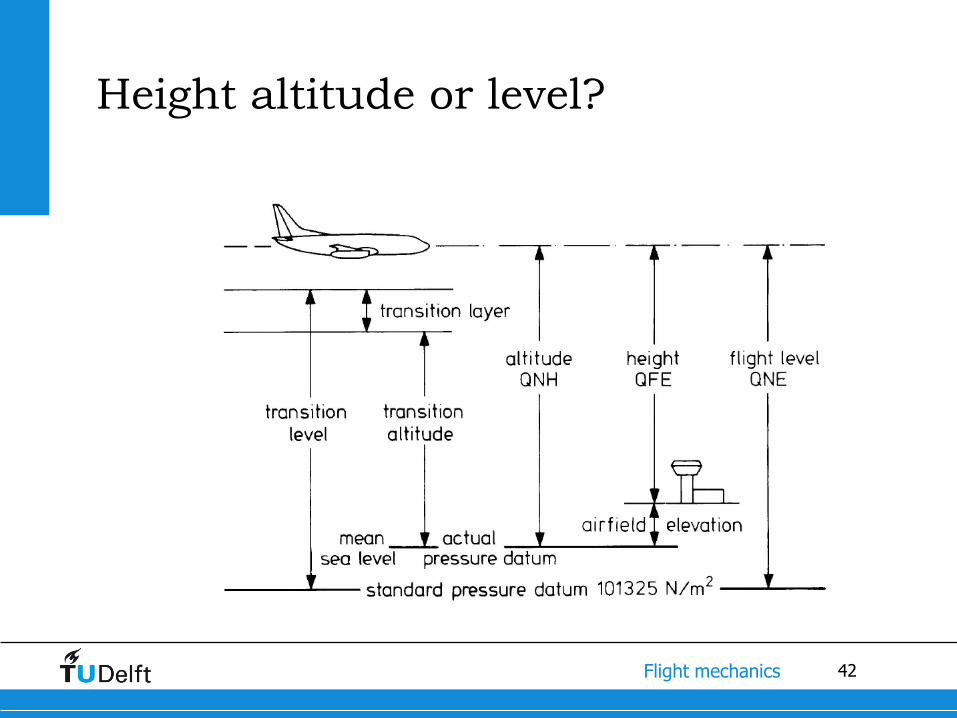
Height altitude or level?
43 Flight mechanics
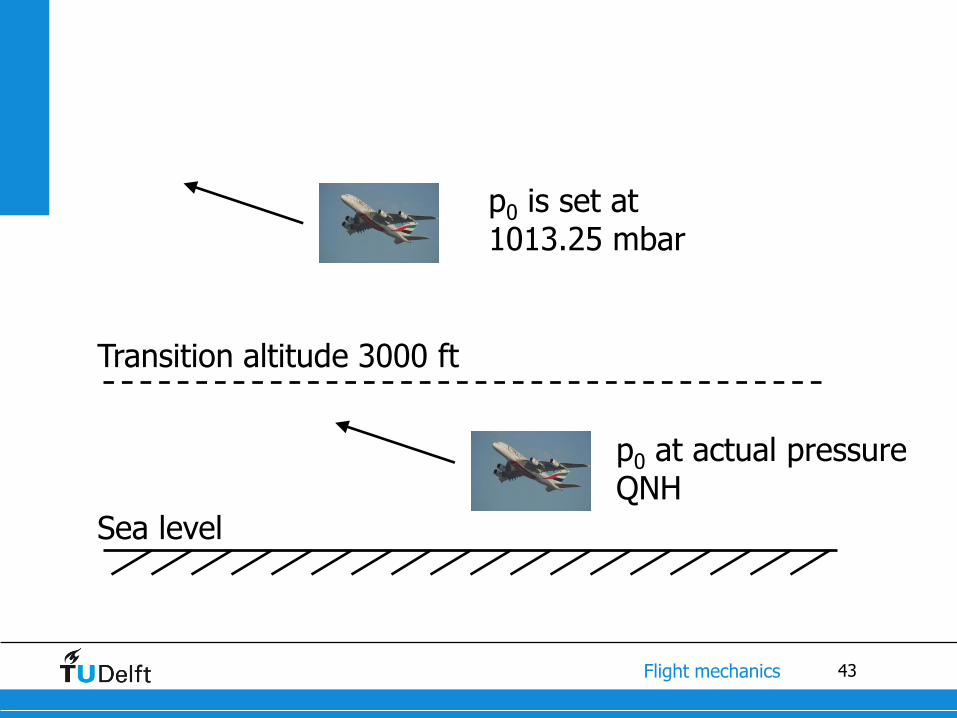
Transition altitude 3000 ft
Sea level
p0 at actual pressure QNH
p0 is set at 1013.25 mbar
44 Flight mechanics
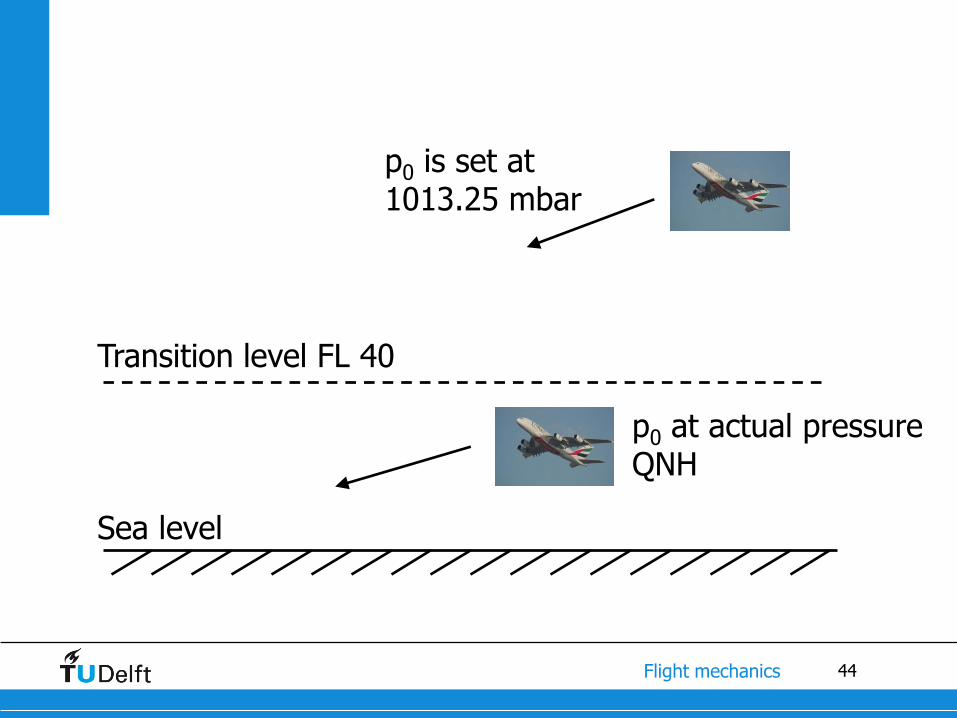
Transition level FL 40
Sea level
p0 at actual pressure QNH
p0 is set at 1013.25 mbar
45 Flight mechanics
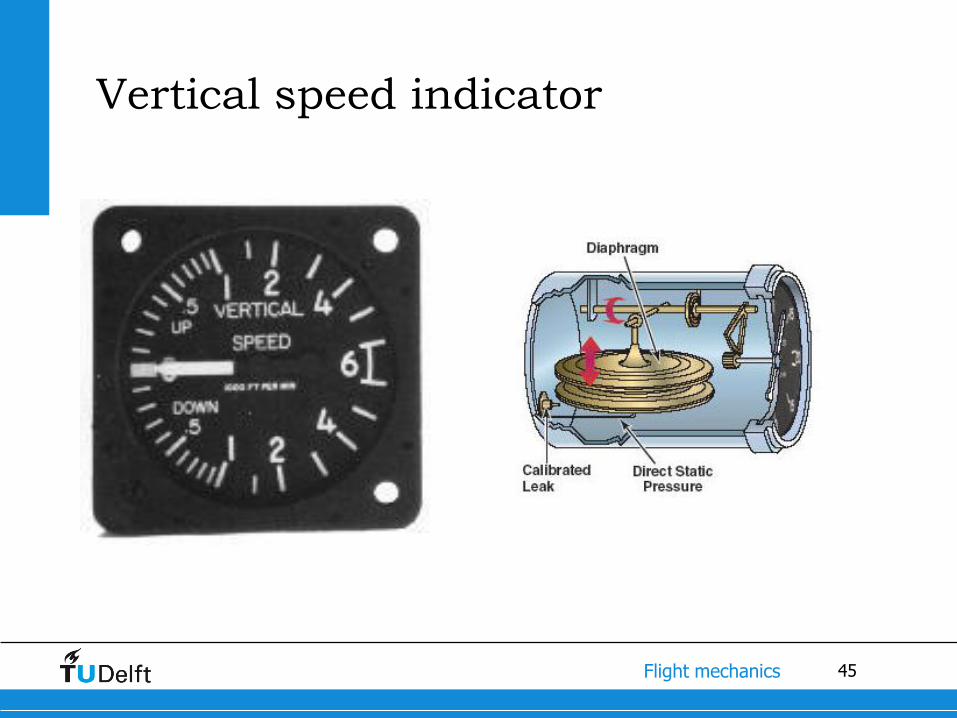
Vertical speed indicator

46 Flight mechanics
Contents
1. Summary previous lectures
2. Introduction
3. Altitude effects on performance diagram
4. Performance limits
5. Operational limits
6. Flight envelope
7. Flight instruments
8. Example calculations
47 Flight mechanics
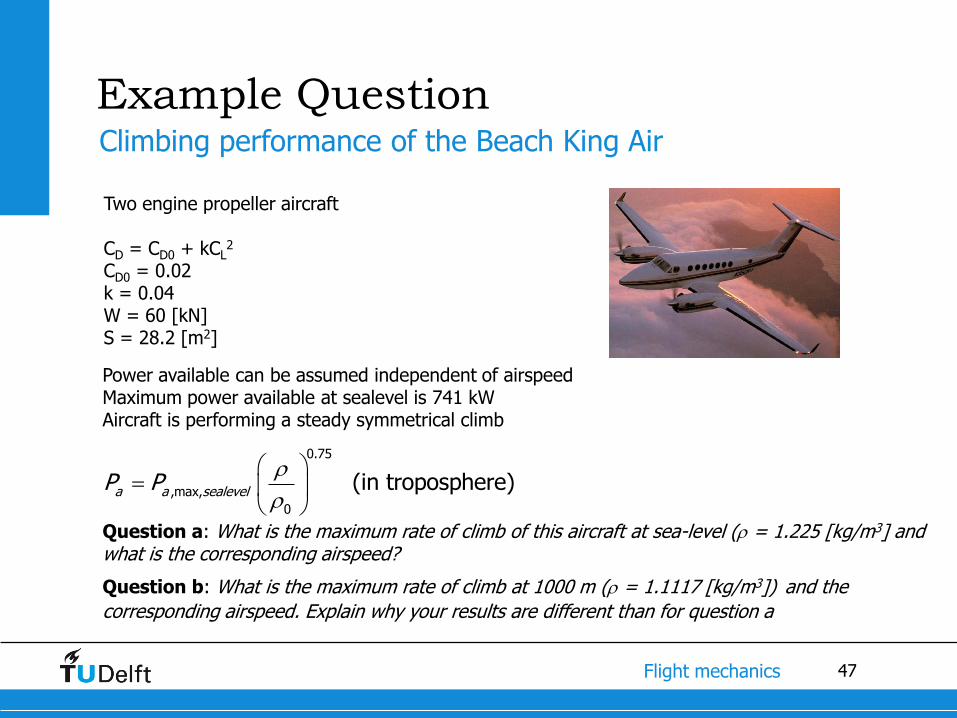
Example Question Climbing performance of the Beach King Air
Two engine propeller aircraft CD = CD0 + kCL
2 CD0 = 0.02 k = 0.04 W = 60 [kN] S = 28.2 [m2]
Power available can be assumed independent of airspeed Maximum power available at sealevel is 741 kW Aircraft is performing a steady symmetrical climb Question a: What is the maximum rate of climb of this aircraft at sea-level ( = 1.225 [kg/m3] and what is the corresponding airspeed?
Question b: What is the maximum rate of climb at 1000 m ( = 1.1117 [kg/m3]) and the
corresponding airspeed. Explain why your results are different than for question a
0.75
,max,
0
(in troposphere)a a sealevelP P


![Chemical Resistance Chart for Metal - ARC Industrial … Chloride [CH3CH2Cl] 4 4 4 4 3 4 4 4 4 4 4 4 4 4 4 4 4 2 4 ethylene Dichloride [ClCH2CH2Cl] 4 4 4 4 3 4 4 4 4 4 4 4 4 4 4 4](https://static.cupdf.com/doc/110x72/5ac7280c7f8b9a220b8e82c8/chemical-resistance-chart-for-metal-arc-industrial-chloride-ch3ch2cl-4-4.jpg)
![Welcome [s3.eu-central-1.amazonaws.com]...bb bb bb bb bb # # # # # b b bb bb bb bb bb bb bb bb 4 4 4 4 4 4 4 4 4 4 4 4 4 4 4 4 4 4 4 4 4 4 4 4 4 4 4 4 4 4 4 4 4 4 4 4 4 4 4 4 44 4](https://static.cupdf.com/doc/110x72/5e9f761d9d1aa23b1a09f03e/welcome-s3eu-central-1-bb-bb-bb-bb-bb-b-b-bb-bb-bb-bb-bb-bb-bb.jpg)