1Monitoring & Diagnostics
4/24/2012
Advanced Sensors and Monitoring & Diagnostics (M&D) for Gas Turbines
Abstract
Advanced sensing and analytics are being used increasingly in power systems, to improve diagnostic and prognostic capabilities for expensive power generation equipment, increase performance and operability, estimate remaining useful life, and manage risk. A wide variety of technologies, from recent sensing technologies to advanced analytics, are being used by power generation equipment manufacturers, and utilities.
This talk will focus on sensor and monitoring & diagnostics (M&D) technologies for gas turbines. A case study in the development and field deployment of sensor and M&D technologies, covering the aspects of signal processing, feature extraction, anomaly detection, and real-world implementation issues will be described in detail.
3Monitoring & Diagnostics
4/24/12
Outline
� Principles of Monitoring & Diagnostics
� Case study of a real-life M&D application with advanced sensors for gas turbine compressor health monitoring
� Summary

How M&D fits into the big picture
Sensors, M&D/PHM & Analytics provide data that enables new products & services … and generate revenue over the life of the asset
High-Value Assets
Sensors, Data Collection & Control
Signal Processing, M&D &Analytics
Intelligent Business Processes, New Products & Services
Prevent catastrophic
failures & forced outages
Part Life Management
Performance Optimization
Better designs & retrofits
Operational Risk Mgmt

Failure
Avoidance
Parts life
Extension
Optimized
Operation
Uses of M&D
Requirements
� Prevent catastrophic
failure
� Get closer to
performance
entitlement
� Support lifing models
� Design validation
Motivation, Goals& Business Impact
6Monitoring & Diagnostics
4/24/2012
Impact of good detection capability on asset downtime
0
200
400
600
800
1000
1200
0
57
113
170
226
283
339
396
453
509
566
622
679
735
792
Downtime (hrs)F
requency
0
50
100
150
200
250
0
57
113
170
226
283
339
396
453
509
566
622
679
735
792
Downtime (hrs)
Fre
quency
System OK
Failure
Detected, “Planned” Event
Not detection“Unplanned” Event
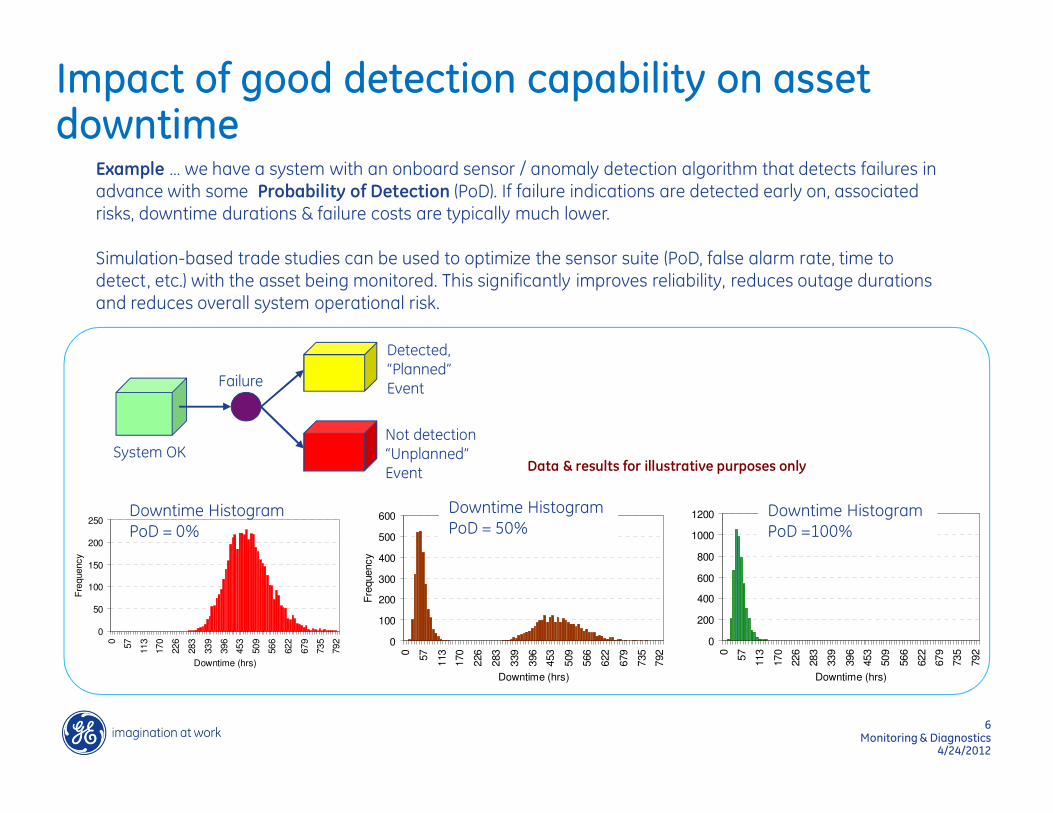
Example … we have a system with an onboard sensor / anomaly detection algorithm that detects failures in advance with some Probability of Detection (PoD). If failure indications are detected early on, associated risks, downtime durations & failure costs are typically much lower.
Simulation-based trade studies can be used to optimize the sensor suite (PoD, false alarm rate, time to detect, etc.) with the asset being monitored. This significantly improves reliability, reduces outage durations and reduces overall system operational risk.
Downtime HistogramPoD = 0%
0
100
200
300
400
500
600
0
57
113
170
226
283
339
396
453
509
566
622
679
735
792
Downtime (hrs)
Fre
quency
Downtime HistogramPoD = 50%
Downtime HistogramPoD =100%
Data & results for illustrative purposes only
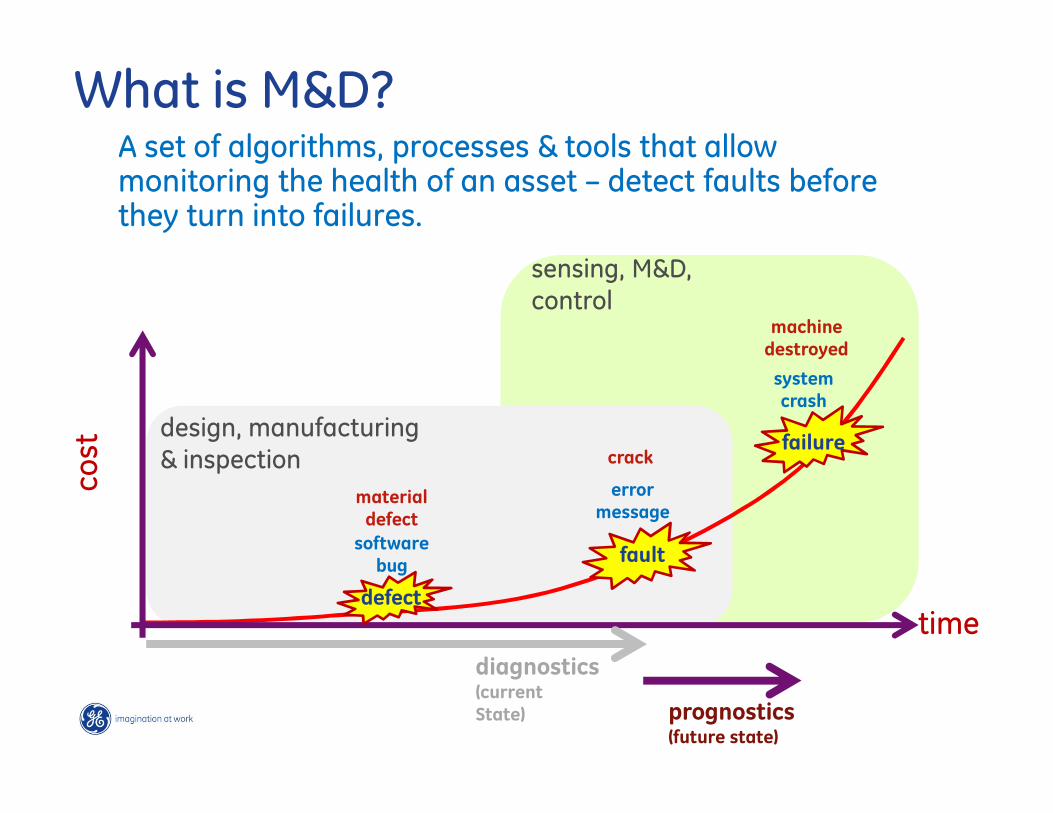
What is M&D?A set of algorithms, processes & tools that allow monitoring the health of an asset – detect faults before they turn into failures.
time
cost
defect
fault
failure
software
bug
error
message
system
crash
material
defect
crack
machine
destroyed
design, manufacturing
& inspection
sensing, M&D,
control
diagnostics(current
State) prognostics(future state)

8Monitoring & Diagnostics
4/24/2012
Preventable failures via M&D
example of a gas turbine compressor blade liberationfollowed by extensive secondary damage
9Monitoring & Diagnostics
4/24/12
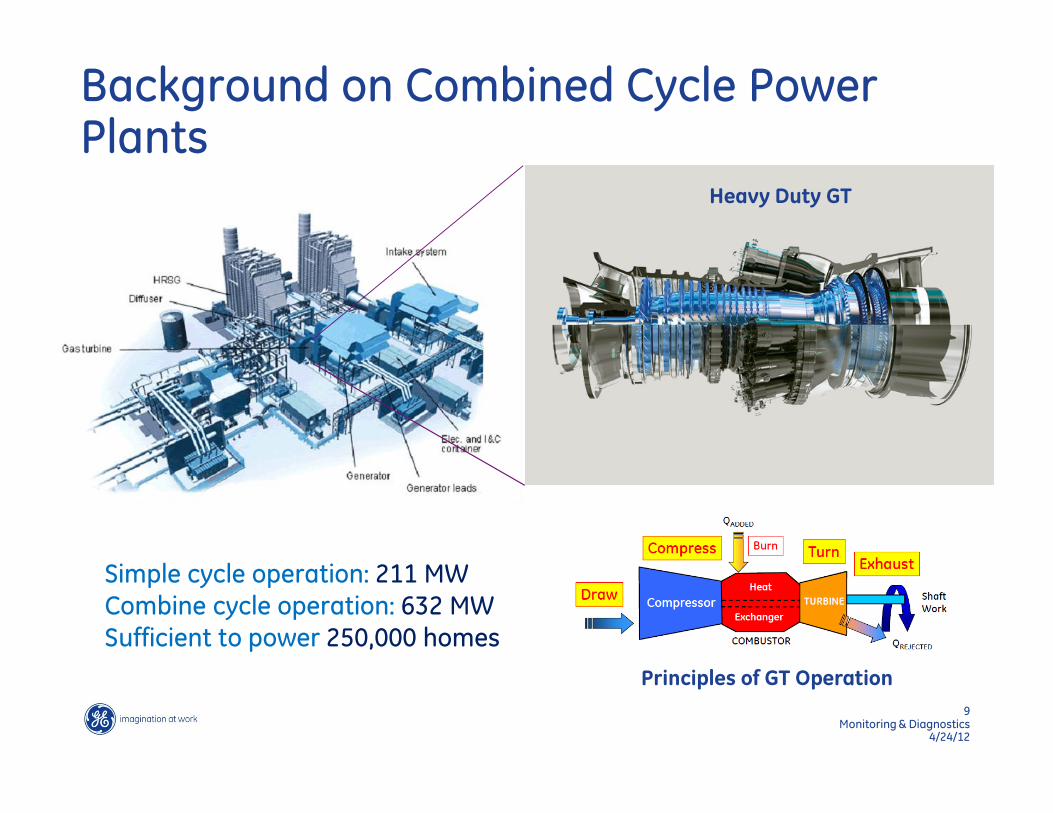
Background on Combined Cycle Power Plants
Simple cycle operation: 211 MW
Combine cycle operation: 632 MW
Sufficient to power 250,000 homes
Heavy Duty GT
Principles of GT Operation
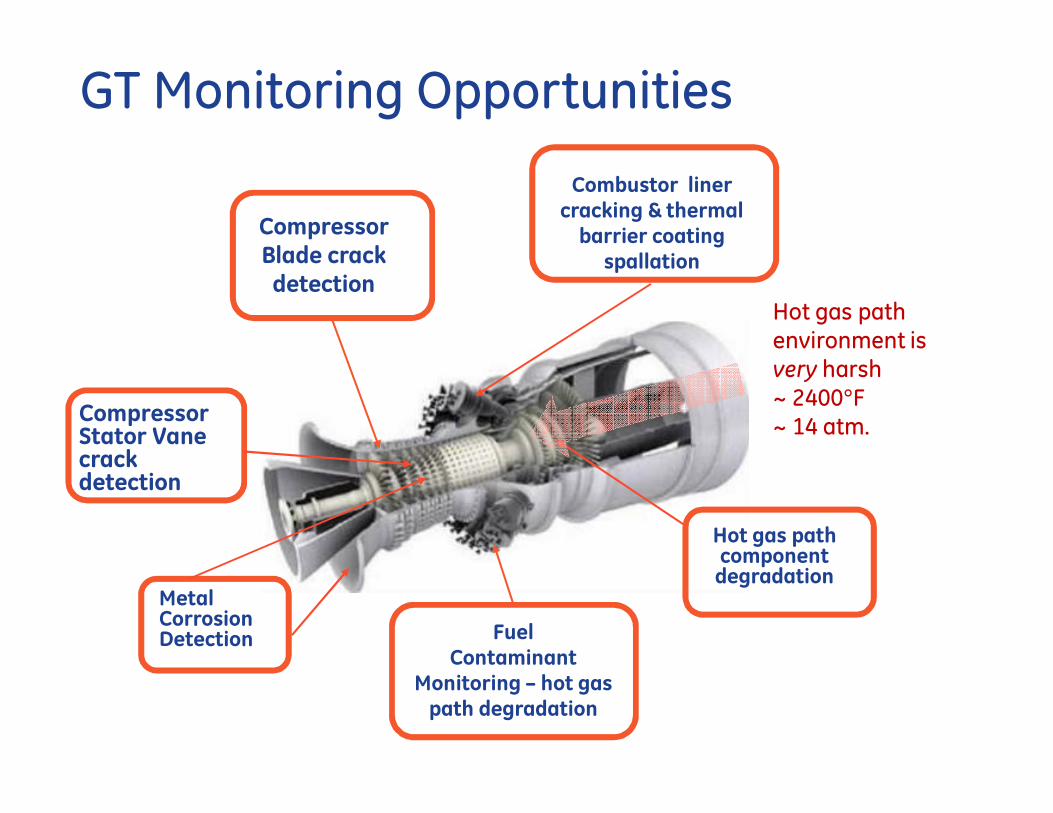
Compressor Stator Vane crack detection
Compressor Blade crack detection
Metal Corrosion Detection
Hot gas path component degradation
GT Monitoring Opportunities
Combustor liner cracking & thermal barrier coating
spallation
FuelContaminant
Monitoring – hot gas path degradation
Hot gas path environment is very harsh~ 2400°F~ 14 atm.

11Monitoring & Diagnostics
4/24/2012
Design of an M&D system

Fossil RM&D Overview
• Collect data from asset
• Process locally; Transmit data remotely over network/internet
• Archive, process more & visualize
• Run anomaly detection algorithms
• Validate and escalateArchive
Power Plant
Plant DataAcquisition
Remote M&D Architecture
Monitor
• Identify problem cause• Predict expected future behavior• Recommend Service Actions
Diagnose &Assess
Diagnostic Assessment
• Identify problem cause• Recommend Service Actions
Communicate

13Monitoring & Diagnostics
4/24/12
Sensing is the fundamental enabler of an M&D system
Mark
VI
level
temperature
pressure
flow
strain
gas properties
position
speed acceleration
Sense Acquire
plant
& turbine
controllers
other
assorted
data
acquisition
systems

14Monitoring & Diagnostics
4/24/12
Data acquisition & pre-processing
Images from National Instruments
Analog-to-Digital Conversion is the key first processing step;
Translates the analog real-world to the digital world of the computer

15Monitoring & Diagnostics
4/24/12
Feature extraction & Anomaly Detection –major approaches
• Statistical Methods: various standard statistical measures, such as higher order moments of key parameters, moving statistical calculations, clustering and pattern recognition
• Time Series Analysis: time evolving nature of the major monitored parameters
• Deviation from expected values: track for deviations from set-point for failure modes and incipient failures detection
• Model based methods: increasing differences between models and observed values can give insights into impending failures and isolation using appropriate classification models
16Monitoring & Diagnostics
4/24/12
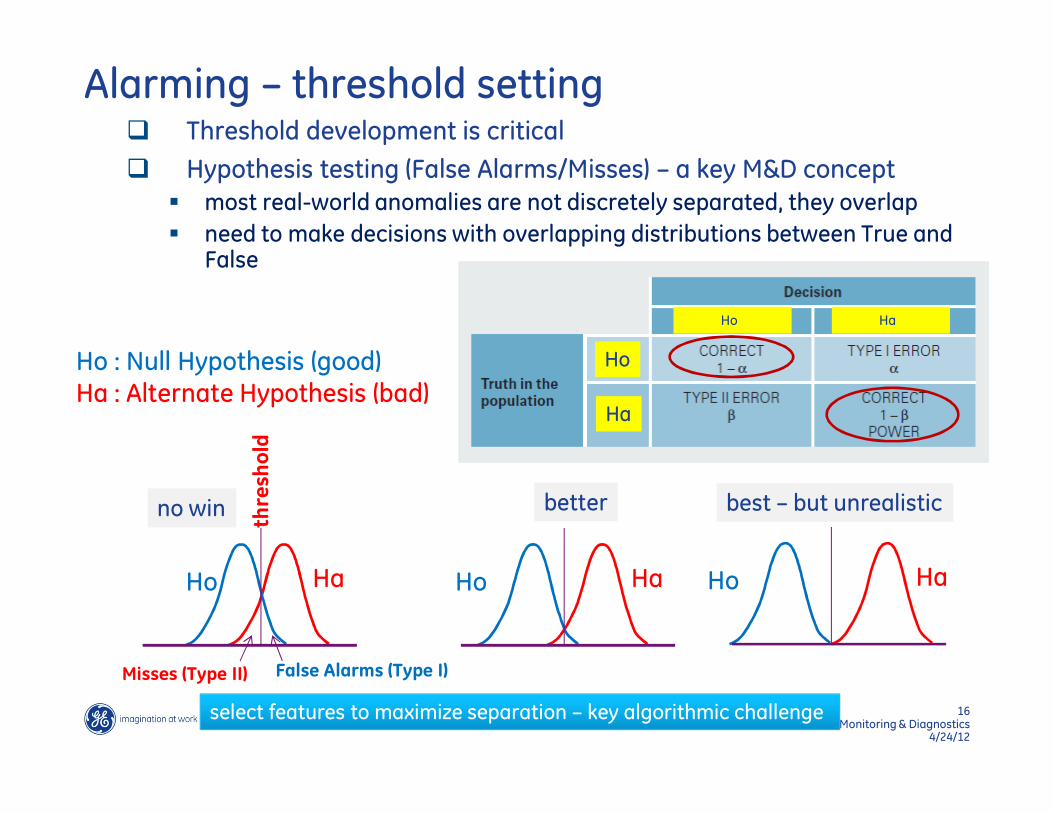
Alarming – threshold setting� Threshold development is critical
� Hypothesis testing (False Alarms/Misses) – a key M&D concept
� most real-world anomalies are not discretely separated, they overlap
� need to make decisions with overlapping distributions between True and False
Ho : Null Hypothesis (good)
Ha : Alternate Hypothesis (bad)
False Alarms (Type I)Misses (Type II)
threshold
no win
HaHo HaHo
better
HaHo
best – but unrealistic
select features to maximize separation – key algorithmic challenge
Ho
Ha
Ho Ha

Case Study
Compressor Blade Health Monitoring (BHM)
18Monitoring & Diagnostics
4/24/12
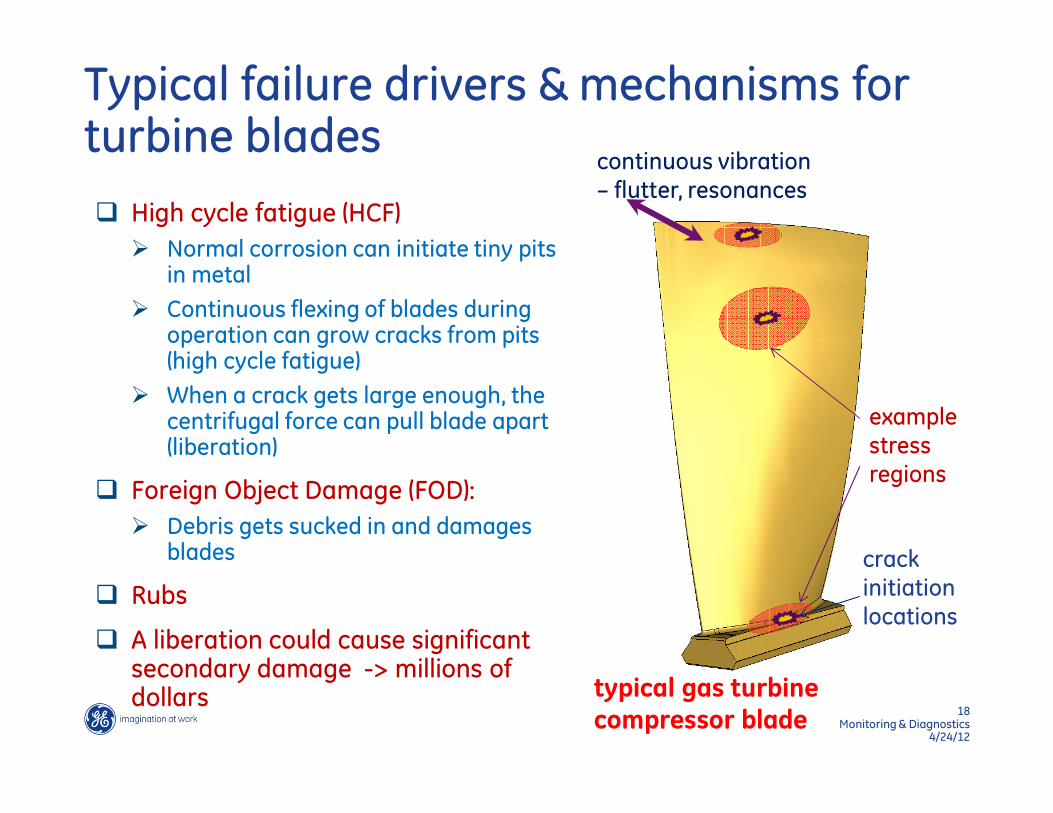
Typical failure drivers & mechanisms for turbine blades
� High cycle fatigue (HCF)
� Normal corrosion can initiate tiny pits in metal
� Continuous flexing of blades during operation can grow cracks from pits (high cycle fatigue)
� When a crack gets large enough, the centrifugal force can pull blade apart (liberation)
� Foreign Object Damage (FOD):
� Debris gets sucked in and damages blades
� Rubs
� A liberation could cause significant secondary damage -> millions of dollars
examplestressregions
continuous vibration – flutter, resonances
typical gas turbine
compressor blade
crack initiationlocations
19Monitoring & Diagnostics
4/24/2012
Expected signatures
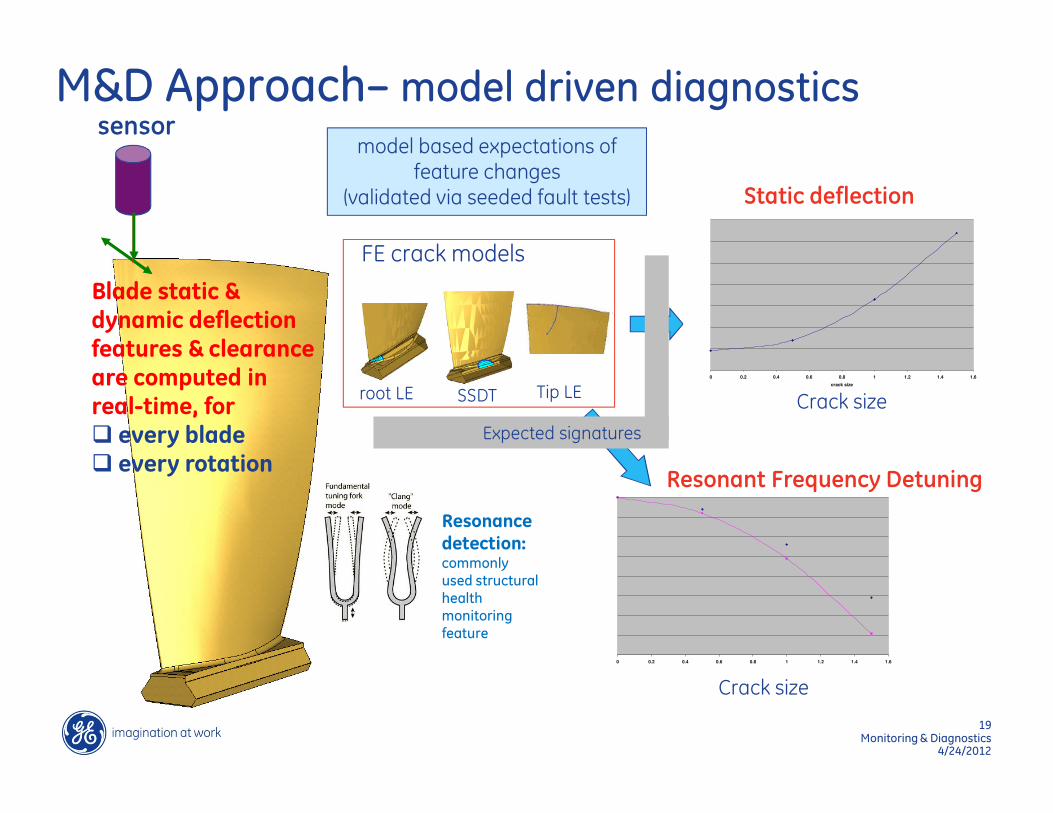
M&D Approach– model driven diagnostics
model based expectations of feature changes
(validated via seeded fault tests)
sensor
Blade static & dynamic deflection features & clearance are computed in real-time, for� every blade� every rotation
0 0.2 0.4 0.6 0.8 1 1.2 1.4 1.6
0 0.2 0.4 0.6 0.8 1 1.2 1.4 1.6
crack size
LE
sta
tic
de
f
Static deflection
Resonant Frequency Detuning
Crack size
Crack size
FE crack models
root LE SSDT Tip LE
Resonance
detection:commonlyused structuralhealth monitoringfeature
20Monitoring & Diagnostics
4/24/2012
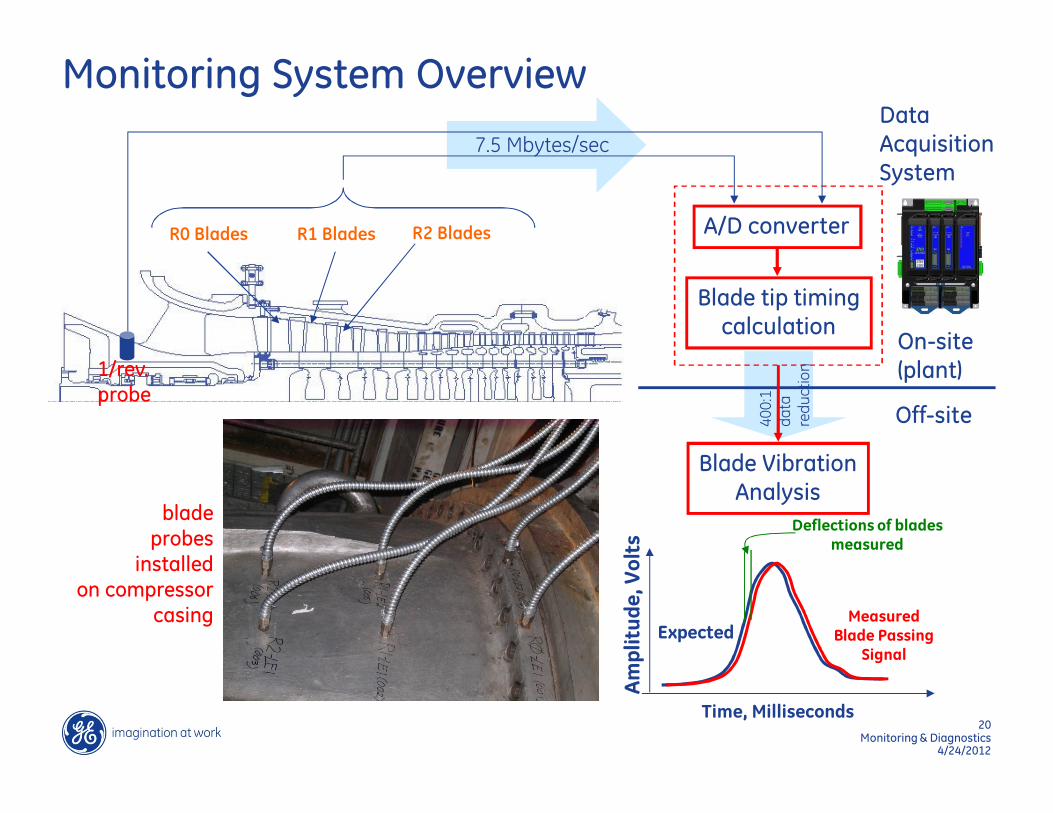
Monitoring System Overview
bladeprobes
installedon compressor
casing
A/D converter
Blade tip timingcalculation
DataAcquisitionSystem
Deflections of blades measured
Amplitude, Volts
Time, Milliseconds
Measured Blade Passing
Signal
Expected
Blade VibrationAnalysis
On-site (plant)
Off-site
R0 Blades R1 Blades R2 Blades
1/rev. probe
7.5 Mbytes/sec
400:1
data
reduction
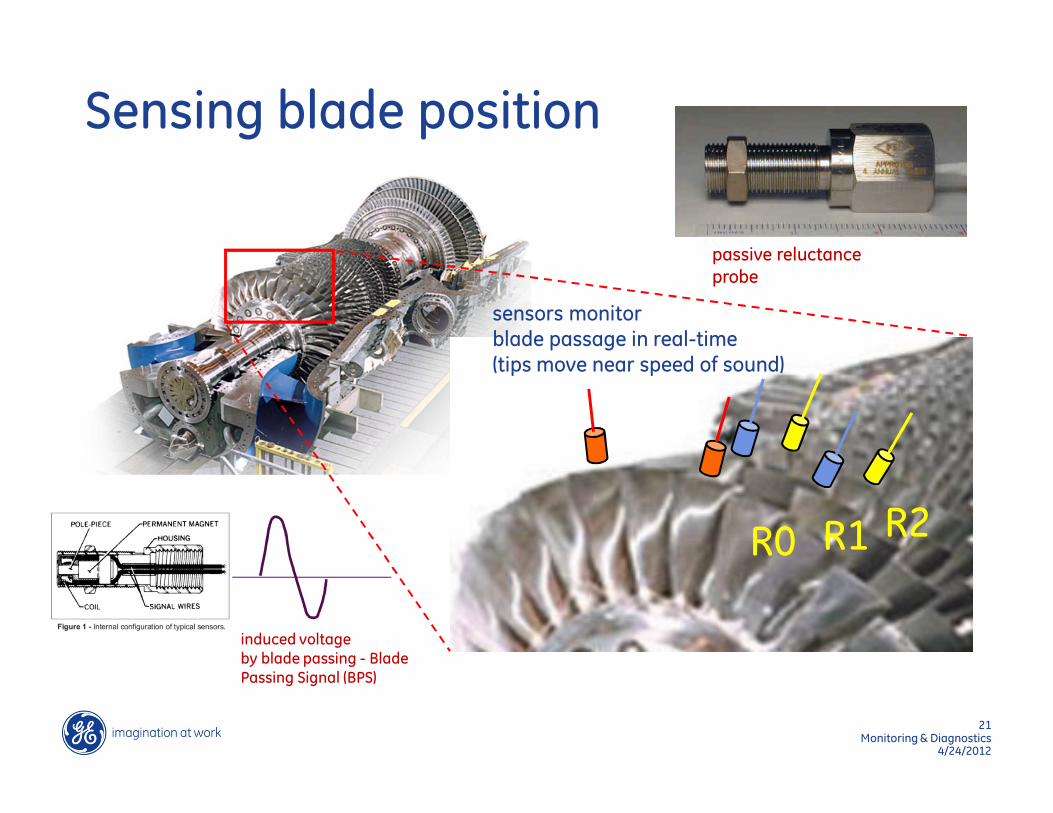
21Monitoring & Diagnostics
4/24/2012
Sensing blade position
R0 R1 R2
sensors monitorblade passage in real-time(tips move near speed of sound)
passive reluctance
probe
induced voltageby blade passing - Blade Passing Signal (BPS)

22Monitoring & Diagnostics
4/24/12
DAQ Data Processing Architecture
DAQ
Pre-processing:� Digitize blade passing
signal
(> 300 kHz)
� Filter signal
� Process and find the Time-of-Arrival (TOA) of each blade in real-time (every 500 microseconds)
Mag
LE2
LE3
TE1
Compressor SensorsPC Buffer (Circular)
Producer Thread
Consumer Thread
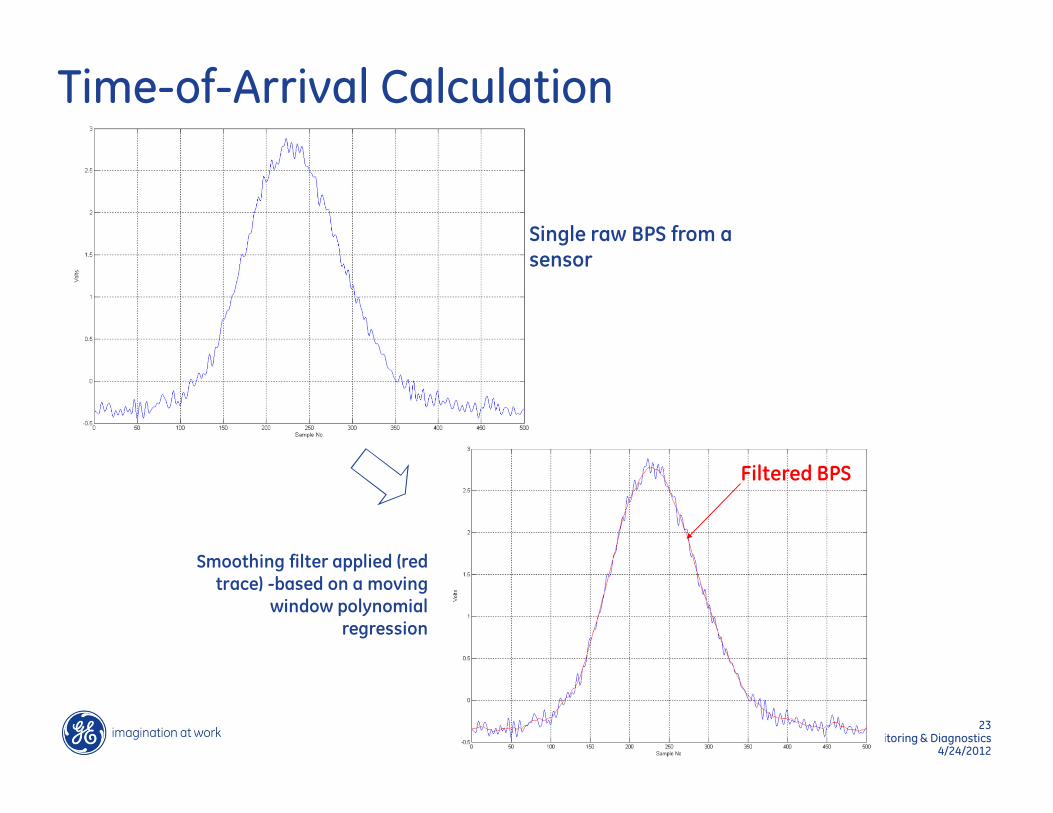
23Monitoring & Diagnostics
4/24/2012
Time-of-Arrival Calculation
Single raw BPS from a sensor
Smoothing filter applied (red
trace) -based on a moving
window polynomial
regression
Filtered BPS

24Monitoring & Diagnostics
4/24/2012
TOA calculation - Interpolation & Centroid Calculation
index
Threshold
x1,x,x2
• Time of Arrival/Departure is measured in terms of the A/D sampling index count.
• Algorithm=(y2-y1/x2-x1)=(y-y1/x-x1). Find X for Y=1.5 volts (example).
• Interpolation needed to reduce quantization error on the DAQ A/D and any residual noise.
First data value > Threshold
First data point
< Threshold
BPSvolts
y1
y2
Time of Departure
TOArr TODep
Peak
TOA = (TOArr+TODep)/2
Time of Arrival
Interpolation
Centroid
25Monitoring & Diagnostics
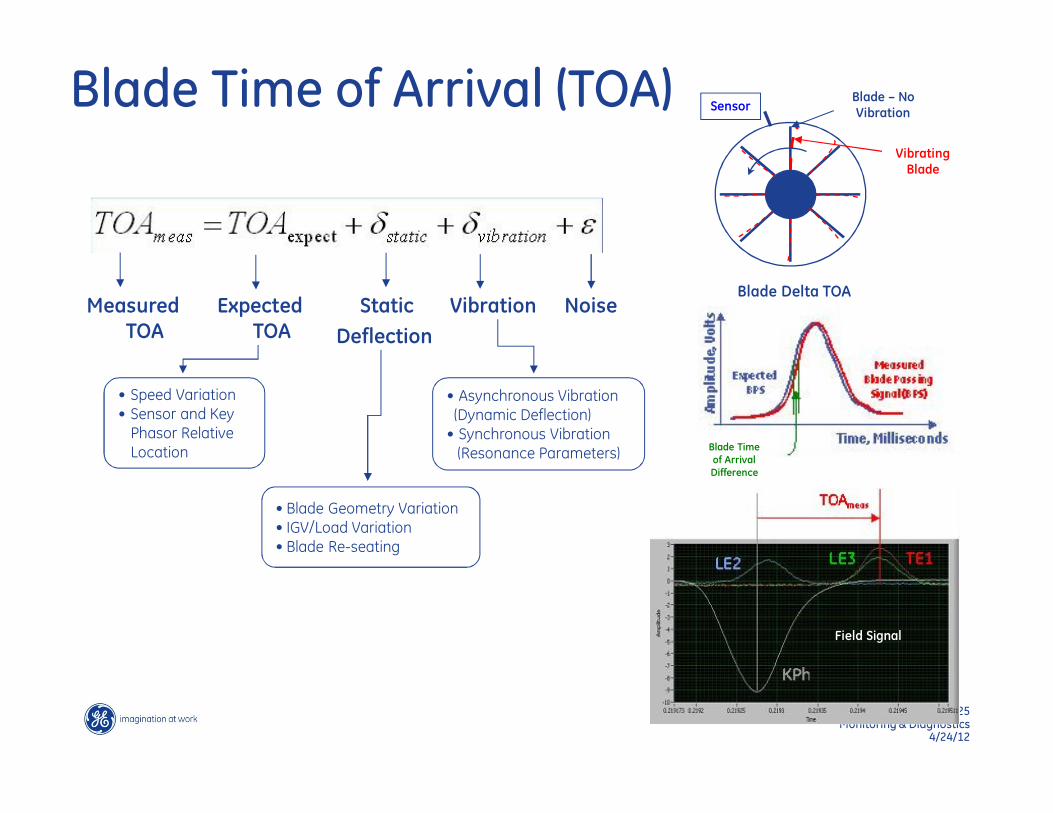
4/24/12
Blade Time of Arrival (TOA)
Static
Deflection
VibrationExpected TOA
NoiseMeasured TOA
• Speed Variation • Sensor and Key Phasor Relative Location
• Blade Geometry Variation• IGV/Load Variation• Blade Re-seating
• Asynchronous Vibration(Dynamic Deflection)• Synchronous Vibration(Resonance Parameters)
Blade Delta TOA
SensorBlade – No Vibration
Vibrating Blade
Blade Time
of Arrival
Difference
Field Signal
26Monitoring & Diagnostics
4/24/2012
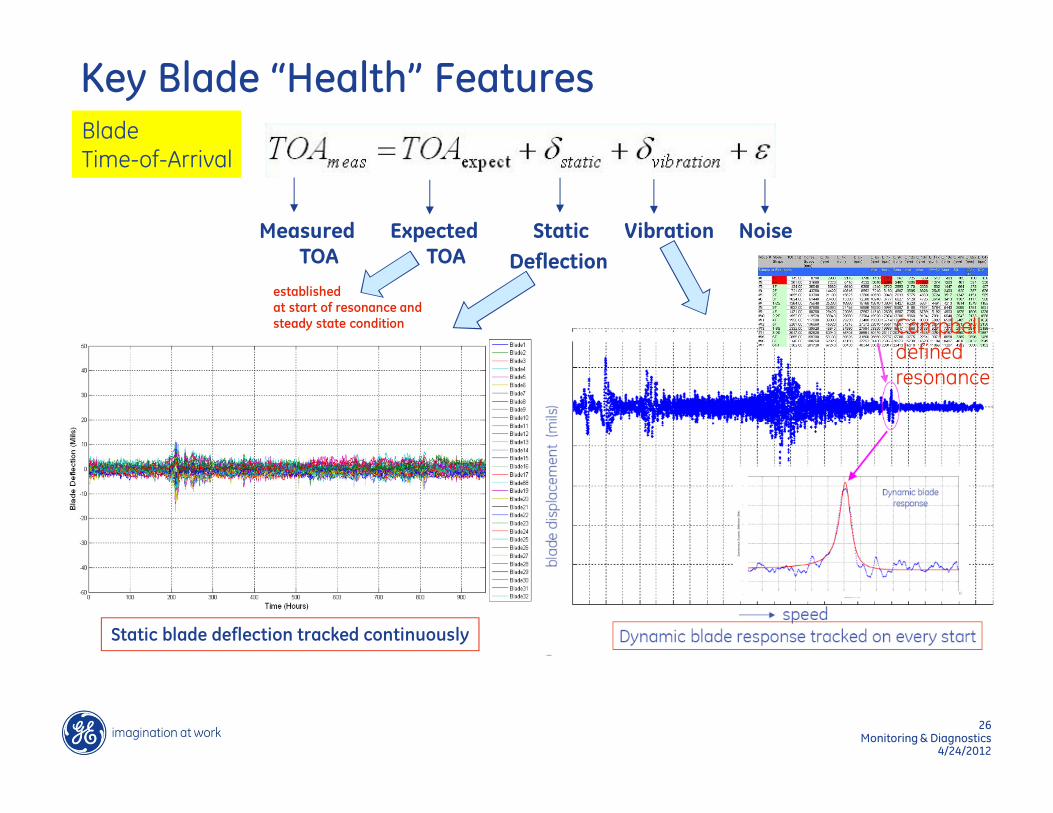
Key Blade “Health” Features
Static
Deflection
VibrationExpected TOA
NoiseMeasured TOA
Static blade deflection tracked continuously
Blade Time-of-Arrival
establishedat start of resonance andsteady state condition Campbell
definedresonance

27Monitoring & Diagnostics
4/24/2012
Feature Trending & Thresholding
Resonances Static Deflection
Thresholds are established prior to monitoring
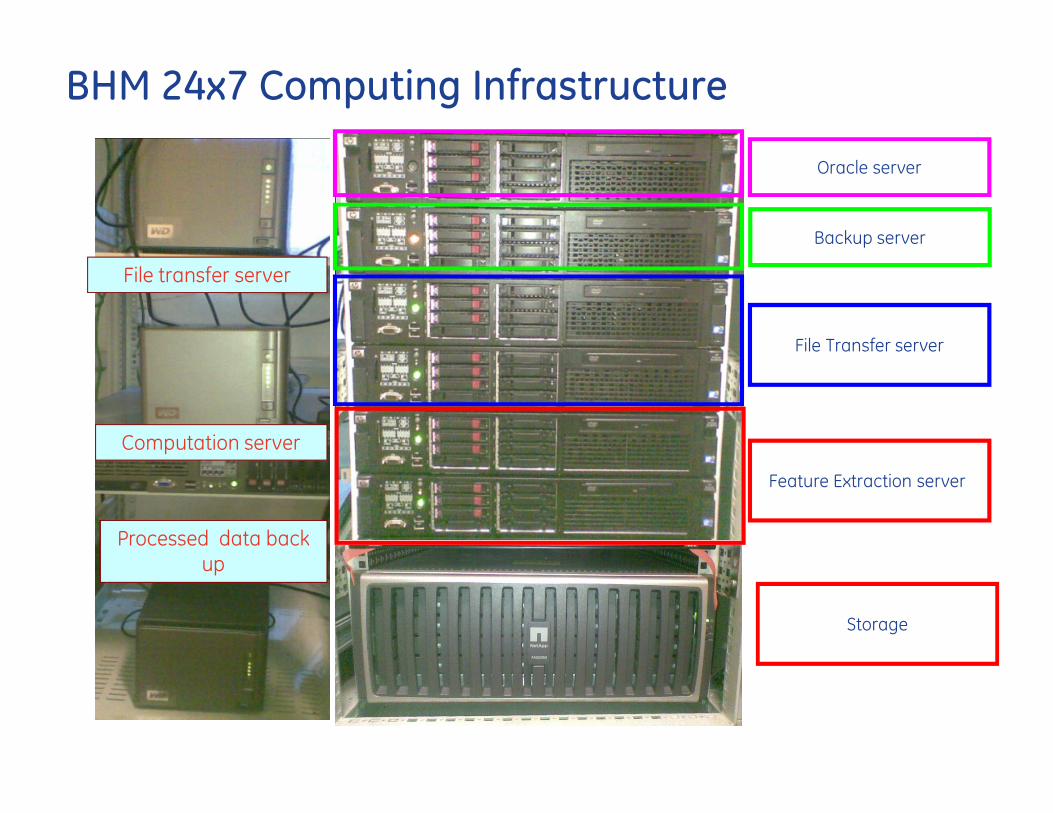
Feature Extraction server
File Transfer server
Backup server
Oracle server
Processed data back up
Computation server
File transfer server
BHM 24x7 Computing Infrastructure
Storage
29Monitoring & Diagnostics
4/24/12
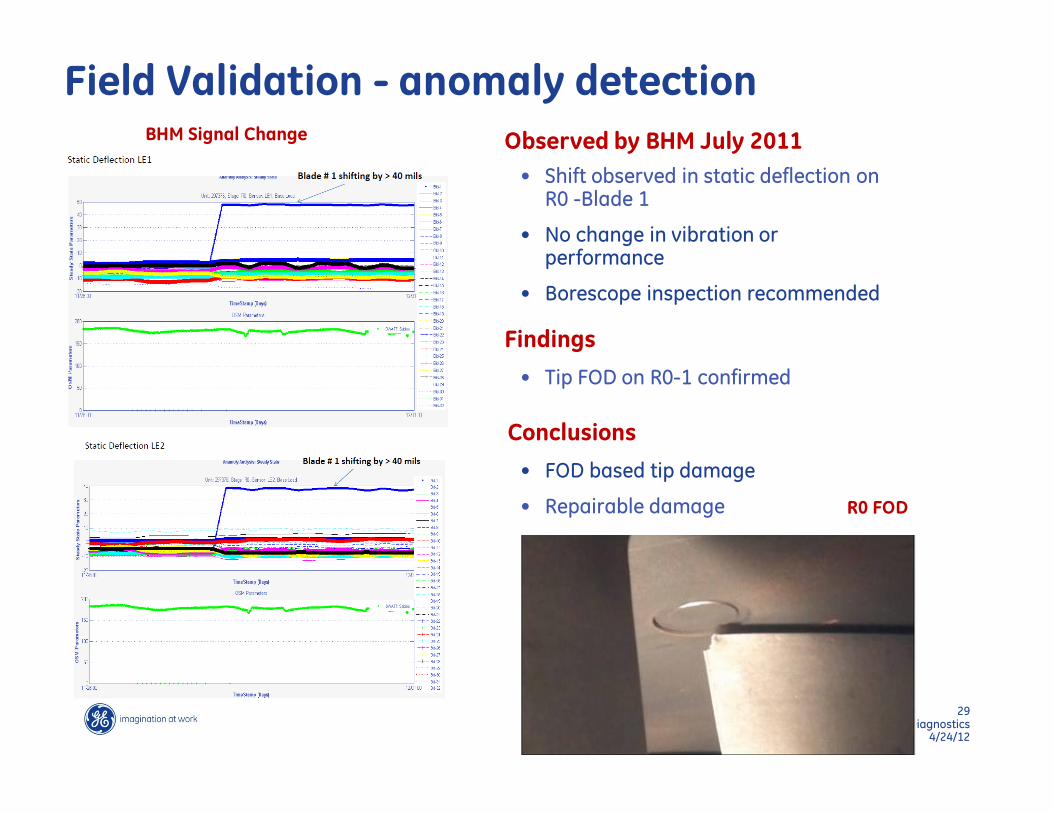
Field Validation - anomaly detection
Conclusions
Observed by BHM July 2011
• Shift observed in static deflection on R0 -Blade 1
• No change in vibration or performance
• Borescope inspection recommended
• Tip FOD on R0-1 confirmed
Findings
• FOD based tip damage
• Repairable damage
BHM Signal Change
R0 FOD
30GE Title or job number
4/24/2012
M&D – the future…
� Use of M&D is increasing rapidly across many industries and applications
� Sensors are getting smaller, cheaper, smarter and pervasive
� Computing becoming cheaper exponentially
� Wireless and portable visualization hardware (iEverything) will enable wider deployment
� Provides significant payback
� The next frontier is Prognostics
� Prediction of time to failure
� Analytics will play an increasingly larger role in processing the oncoming data deluge (“Internet of Things”)