Additive Manufacturing Using FLOW-3D
Paree Allu, MS
Flow Science, Inc.
linkedin.com/in/pareeallu
1
Topics for Discussion
Volume-of-Fluid (VoF) Method
Laser Welding
Laser Powder Bed Fusion
Multi-bed Layer Simulation
DEM Model
Direct Metal Deposition
2
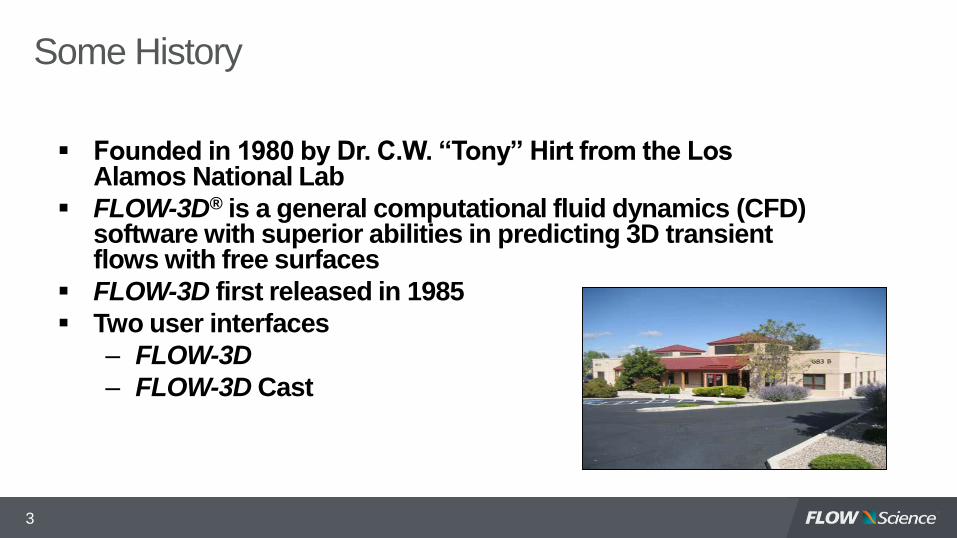
Some History
Founded in 1980 by Dr. C.W. “Tony” Hirt from the Los Alamos National Lab
FLOW-3D® is a general computational fluid dynamics (CFD) software with superior abilities in predicting 3D transient flows with free surfaces
FLOW-3D first released in 1985
Two user interfaces
– FLOW-3D
– FLOW-3D Cast
3

Solver Uniqueness
FAVOR™
Unique meshing advantage
Geometry can be added and
removed without modifying
the existing mesh
Volume of Fluid (VoF) Method
Uniquely suited to study free
surface evolution
4
TruVOF: FLOW-3D’s Free Surface Modeling
A scheme to locate the surface
An algorithm to track the surface as a
sharp interface moving through a
computational grid
A means of applying boundary
conditions at the surface
Advantages
of one-fluid
VoF method
Especially useful when the ratio of liquid to gas density is quite large!
5

VOF modeling
Image courtesy of Eastman Kodak
Example of fluid ejection using heating elements: heat impulse drives local phase change (fluid
to gas) which in turns ejects a fluid droplet
Free surface
Surface tension
Phase change
Heat transfer
Free surface
flows
Multiphase
6

VOF modeling
7
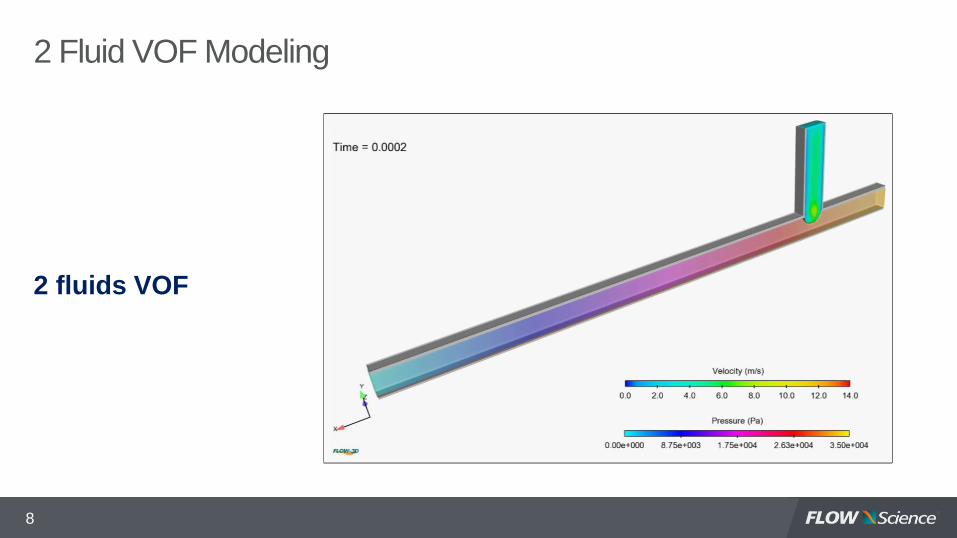
2 Fluid VOF Modeling
2 fluids VOF
8
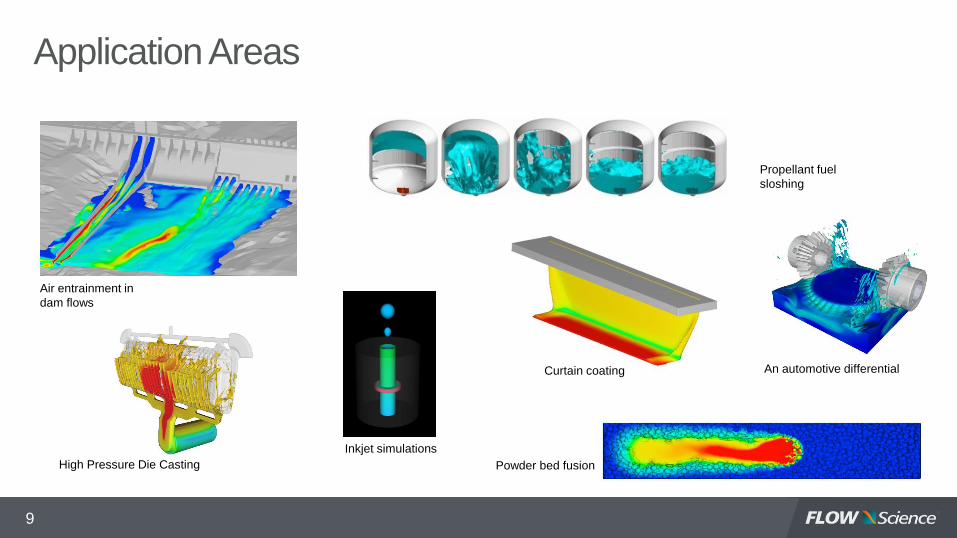
Application Areas
Propellant fuel
sloshing
Curtain coating
Inkjet simulations
High Pressure Die Casting
Air entrainment in
dam flows
An automotive differential
Powder bed fusion
9

LASER WELDING
A prelude to powder bed fusion
10

Relevant Physical Models
Viscous flows
Heat transfer
Solidification
Phase change (vaporization)
Density evaluation
Surface tension
Bubble/voids model
Heat flux produced by the laser
Laser motion
Evaporation pressure
Shield gas
Multiple laser reflections
in keyhole
Add-on ModuleWEL
D
11
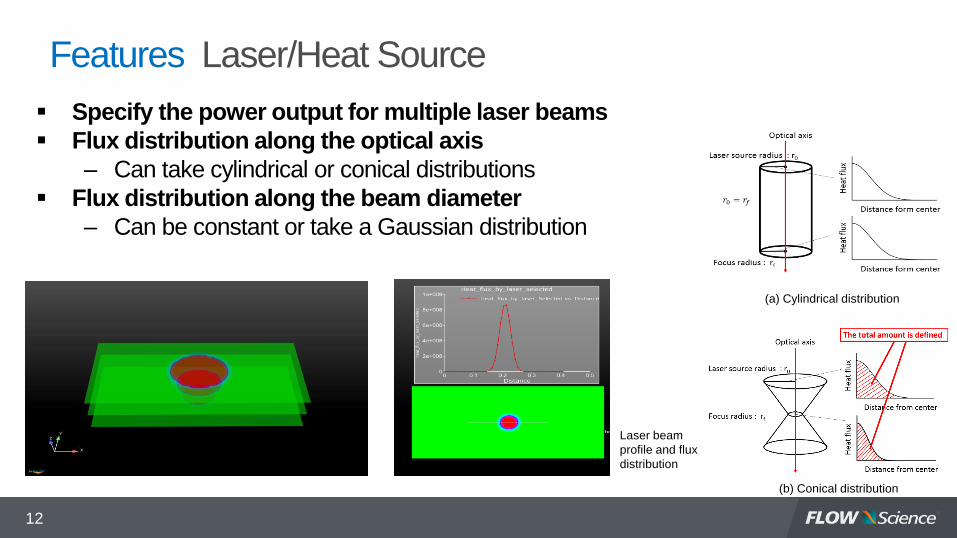
Features Laser/Heat Source
12
Specify the power output for multiple laser beams
Flux distribution along the optical axis
– Can take cylindrical or conical distributions
Flux distribution along the beam diameter
– Can be constant or take a Gaussian distribution
(a) Cylindrical distribution
(b) Conical distribution
Laser beam
profile and flux
distribution

Features Laser Beam Motion
13
High degree of control
– Various shapes for laser beams
– Specify independent motion for nozzle (laser source) and irradiation direction Set using (x,y,z) coordinates and a velocity-time table
Motion can be input using a .csv file
Nozzle position ( x,y,z ) coordinates
Irradiation direction vector (x,y,z)
Vector (x,y,z) to specify direction

Case Study Shiloh Industries
FLOW-3D welding simulations show good
agreement with experiments for welding joints
Case Power Speed Plate thickness
TM1 3300W 4.5 m/min 1.8 mm - 0.7 mm
TM5 3300W 4.5 m/min 1.0 mm - 0.7 mm
0.3 mm
1.0 mm
0.61mm 150mm
y=0.0
z
y
TM5
TM1
14
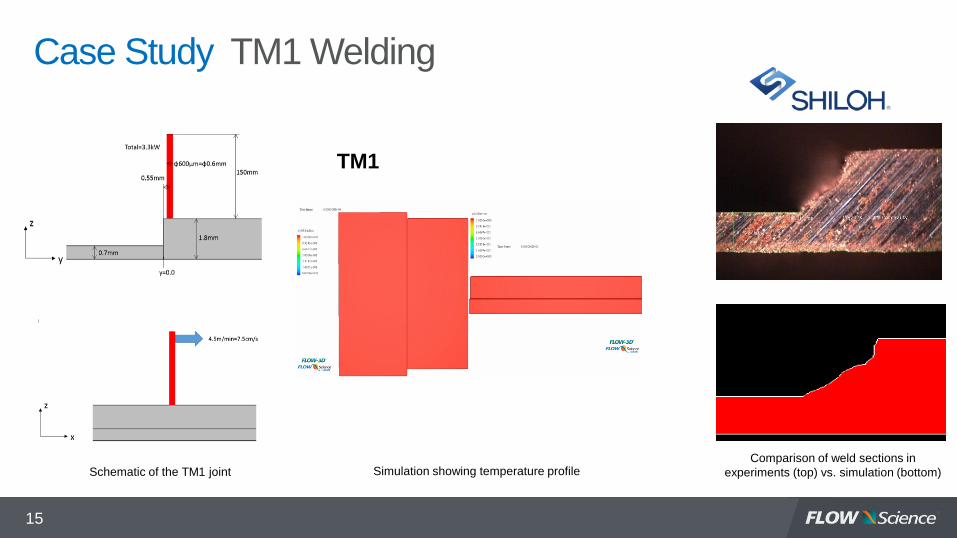
Case Study TM1 Welding
TM1
Schematic of the TM1 joint Simulation showing temperature profileComparison of weld sections in
experiments (top) vs. simulation (bottom)
15

Case Study TM5 Welding
4.5m/min=7.5cm/s
z
x
0.3 mm
1.0 mm0.7 mm
0.61mm 150mm
y=0.0
z
y
φ600μm=φ0.6mm TM5
Schematic of the TM1 joint Simulation showing temperature profile
Comparison of weld sections in
experiments (top) vs. simulation (bottom)
16

Features Shield Gas
17
Shield gas applies a dynamic vapor pressure on the melt pool
surface
Liquid droplet under vapor pressure
The behavior change due to the
shield gas flow can be observed
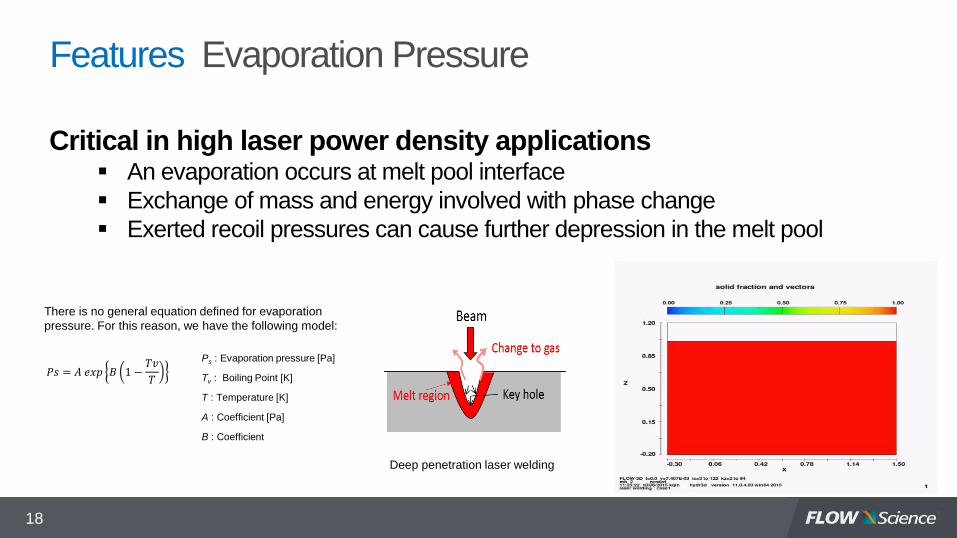
Features Evaporation Pressure
18
Critical in high laser power density applications An evaporation occurs at melt pool interface
Exchange of mass and energy involved with phase change
Exerted recoil pressures can cause further depression in the melt pool
Deep penetration laser welding
There is no general equation defined for evaporation
pressure. For this reason, we have the following model:
𝑃𝑠 = 𝐴 𝑒𝑥𝑝 𝐵 1 −𝑇𝑣
𝑇
Ps : Evaporation pressure [Pa]
Tv : Boiling Point [K]
T : Temperature [K]
A : Coefficient [Pa]
B : Coefficient

Features Multiple Reflections
19
Reference:
Jung-Ho Cho, Suck-Joo Na, 2006, Implementation of real-time multiple reflection and Fresnel absorption of laser beam in keyhole
Absorption rate – angle of incidence
𝐱𝐢
𝐧
𝐱′𝐢
Multiple reflections
𝐱𝐢′ = 𝐱𝐢 − 2 𝐱𝐢 ∙ 𝐧 𝐧Reflected vector calculation
The welding module can account for
multiple reflections.
Simulation and experimental
comparison of keyhole

Multiple reflections - Off Multiple reflections - On
Features Multiple Reflections
20
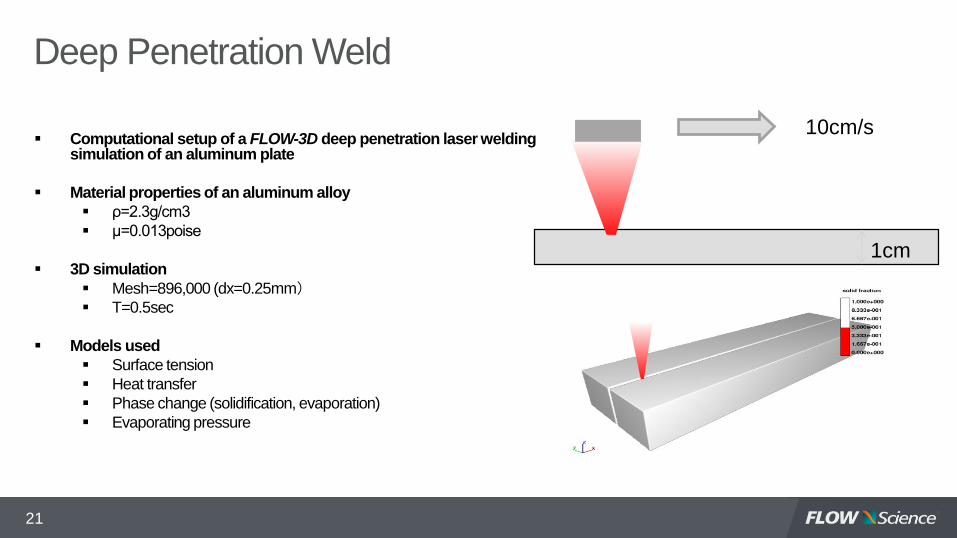
10cm/s
1cm
Deep Penetration Weld
Computational setup of a FLOW-3D deep penetration laser welding simulation of an aluminum plate
Material properties of an aluminum alloy
ρ=2.3g/cm3
μ=0.013poise
3D simulation
Mesh=896,000 (dx=0.25mm) T=0.5sec
Models used
Surface tension
Heat transfer
Phase change (solidification, evaporation)
Evaporating pressure
21

Deep Penetration Weld
Temperature contours in cross-section Solid fraction contours
22
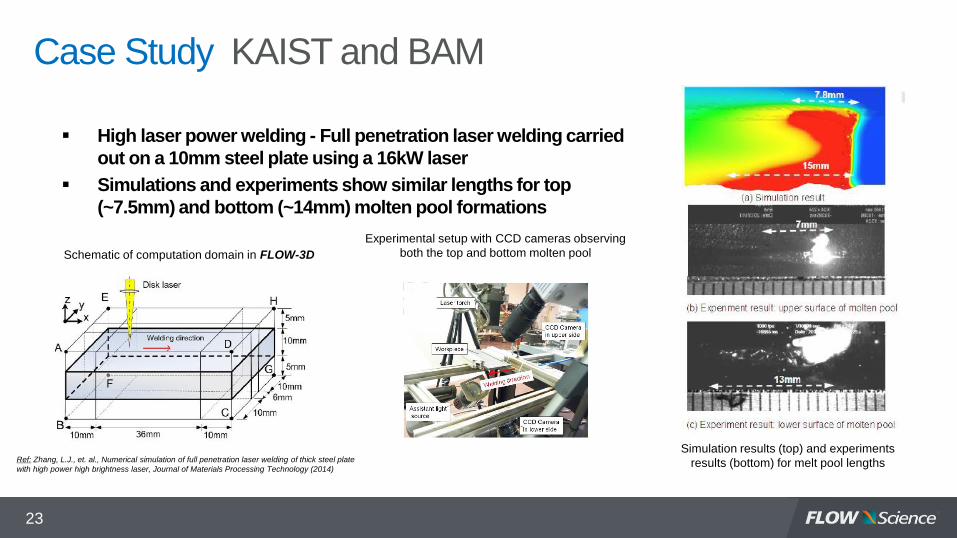
Case Study KAIST and BAM
High laser power welding - Full penetration laser welding carried
out on a 10mm steel plate using a 16kW laser
Simulations and experiments show similar lengths for top
(~7.5mm) and bottom (~14mm) molten pool formations
Ref: Zhang, L.J., et. al., Numerical simulation of full penetration laser welding of thick steel plate
with high power high brightness laser, Journal of Materials Processing Technology (2014)
Schematic of computation domain in FLOW-3D
Experimental setup with CCD cameras observing
both the top and bottom molten pool
Simulation results (top) and experiments
results (bottom) for melt pool lengths
23
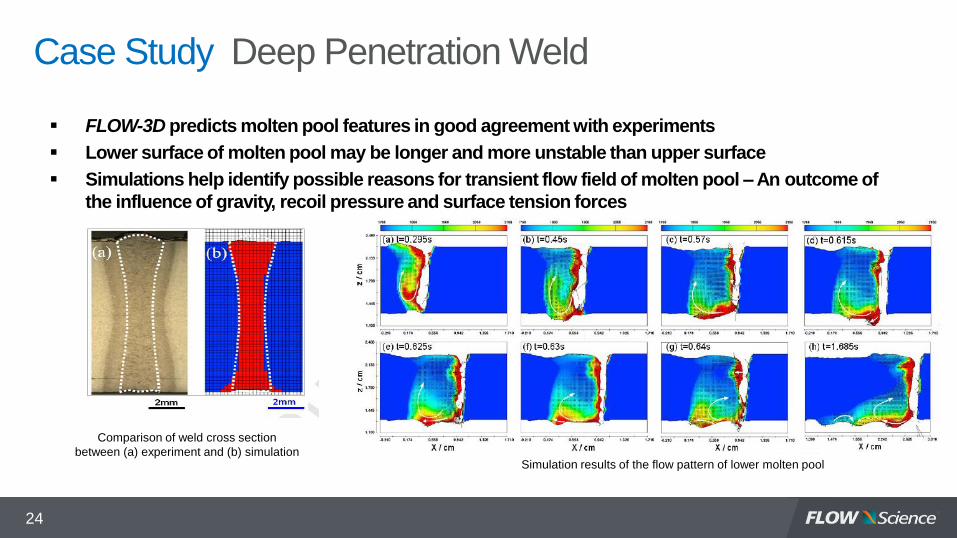
Case Study Deep Penetration Weld
FLOW-3D predicts molten pool features in good agreement with experiments
Lower surface of molten pool may be longer and more unstable than upper surface
Simulations help identify possible reasons for transient flow field of molten pool – An outcome of
the influence of gravity, recoil pressure and surface tension forces
Comparison of weld cross section
between (a) experiment and (b) simulationSimulation results of the flow pattern of lower molten pool
24

Bubble formation and flow pattern of the molten pool Temperature (K) contours in molten pool
Porosity Formation
25

Case Study GM and Shanghai University
Study to determine the influence of welding speed and angle of inclination on
porosity occurrence in keyhole welding
Simulations provided recommendations to mitigate keyhole induced porosity
occurrence
Weld porosity in laser-welded Al joint’s cross section. Keyhole induced porosity
occurs due to flow dynamics and can initiate cracking. Optimized process
parameters can mitigate this kind of porosity.
Major phenomena accounted for by FLOW-3D
in simulating melt pool dynamicsRef: Numerical Study of keyhole dynamics and keyhole-induced porosity formation in remote laser welding of Al alloys,
R. Lin et al., Int. J. Heat Mass Transfer, 108(2017) 244-256
26
Schematic of remote laser lap welding
process on AA5182 1mm + 2mm
plates. Beam spot diameter is 0.6mm
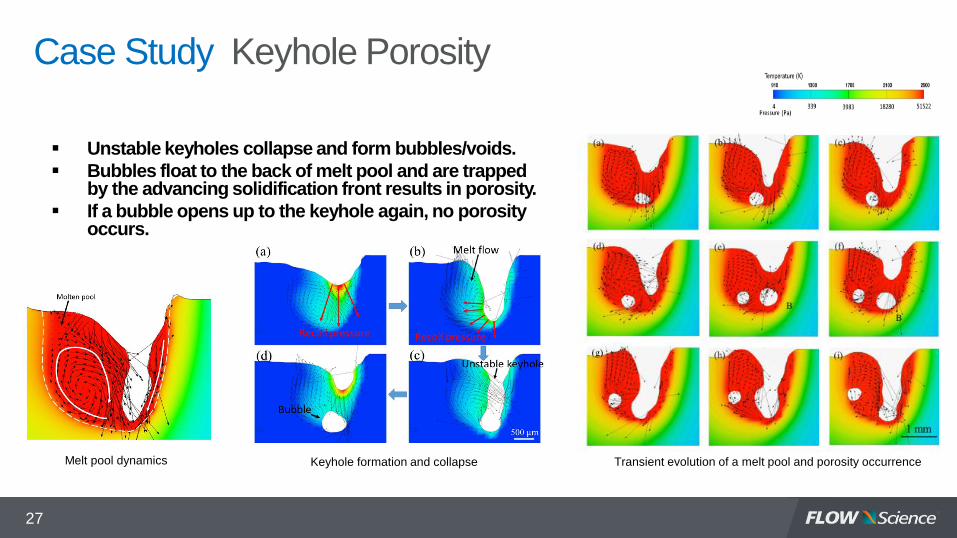
Case Study Keyhole Porosity
Unstable keyholes collapse and form bubbles/voids.
Bubbles float to the back of melt pool and are trapped by the advancing solidification front results in porosity.
If a bubble opens up to the keyhole again, no porosity occurs.
Transient evolution of a melt pool and porosity occurrence Melt pool dynamics Keyhole formation and collapse
27

Simulations vs Experiments
Parametric study
Case (a): P = 2.5 kW, v = 3 m/min
Case (b): P = 5.0 kW, v = 10 m/min
Case (c): P = 6.0 kW, v = 12 m/min
Increasing weld speed results in
decreasing porosity
Case (a) to Case
(c): Increasing
scanning speed
and laser power
Distribution of porosity in longitudinal welding sections
as seen in simulations (top) and experiments (bottom)
28

Simulations vs Experiments
29
Parametric study
Case (a): 2.5 kW, 3 m/min and -150
Case (b): 2.5 kW, 3 m/min and 00
Case (c): 2.5 kW, 3 m/min and 150
Case (d): 3 kW, 3 m/min and 300
Case (e): 3 kW, 3 m/min and 450
Increasing weld angle results in
decreasing porosity
Pore area percentage at different
inclination angles as seen in (a)
experiments and (b) simulation
results.
Case (a) to Case (e):
Increasing weld
angle inclination

Outcomes of the Study
30
With increasing laser power and welding speed
Larger keyhole opening and little fluctuation in depth
Laser beam shines on front keyhole wall with minimal turbulence in rear molten pool
Minimizes porosity formation
With increasing laser beam inclination
At large angles, laminar flow is observed in rear molten pool due to gravity and recoil pressure acting along similar directions
Minimizes porosity occurrence
FLOW-3D simulations gave a realistic understanding of the welding process and helped mitigate porosity formation!

POWDER BED FUSION PROCESSES
31
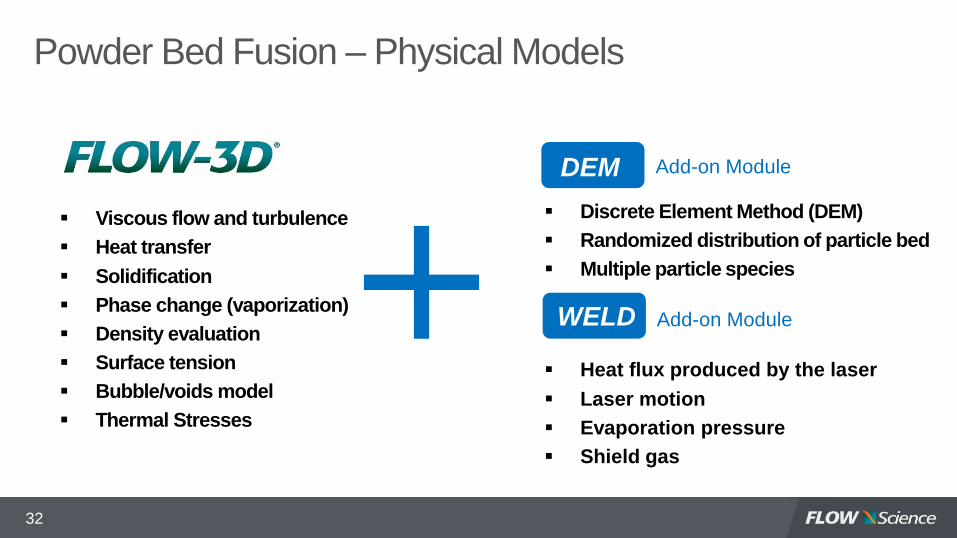
Powder Bed Fusion – Physical Models
Viscous flow and turbulence
Heat transfer
Solidification
Phase change (vaporization)
Density evaluation
Surface tension
Bubble/voids model
Thermal Stresses
Discrete Element Method (DEM)
Randomized distribution of particle bed
Multiple particle species
Heat flux produced by the laser
Laser motion
Evaporation pressure
Shield gas
Add-on Module
Add-on Module
DEM
WELD
32
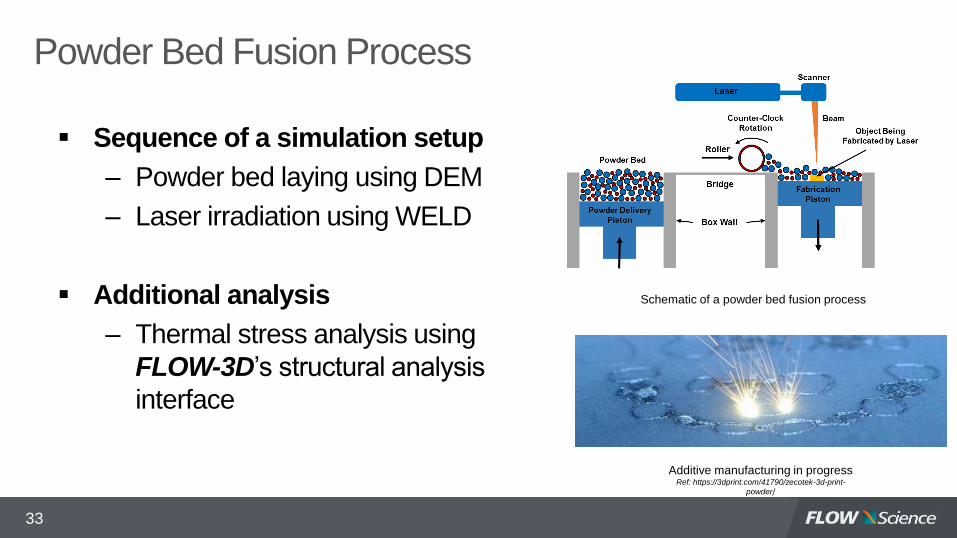
Additive manufacturing in progressRef: https://3dprint.com/41790/zecotek-3d-print-
powder/
Powder Bed Fusion Process
Sequence of a simulation setup
– Powder bed laying using DEM
– Laser irradiation using WELD
Additional analysis
– Thermal stress analysis using
FLOW-3D’s structural analysis
interface
Schematic of a powder bed fusion process
33

DEM – Bed Preparation (Powder Laying)
34
Particles are dropped to simulate the natural
lamination process. Material used is Ni alloy
(Inconel 718) with a particle diameter of 20μm
ref: Wikipedia
Base particle size of 20μm
Face-centered
cubic lattice
Hexagonal close-
packed lattice
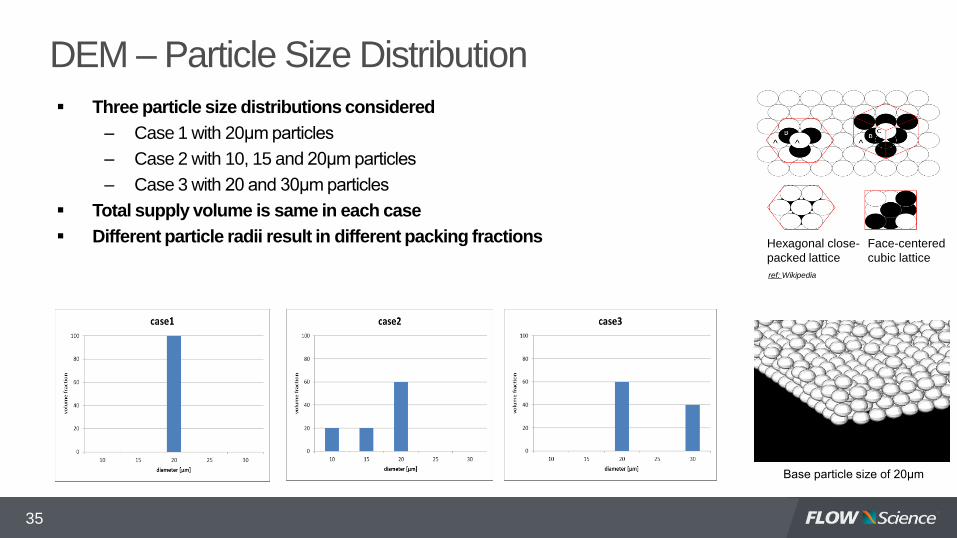
DEM – Particle Size Distribution
35
Three particle size distributions considered
– Case 1 with 20μm particles
– Case 2 with 10, 15 and 20μm particles
– Case 3 with 20 and 30μm particles
Total supply volume is same in each case
Different particle radii result in different packing fractions
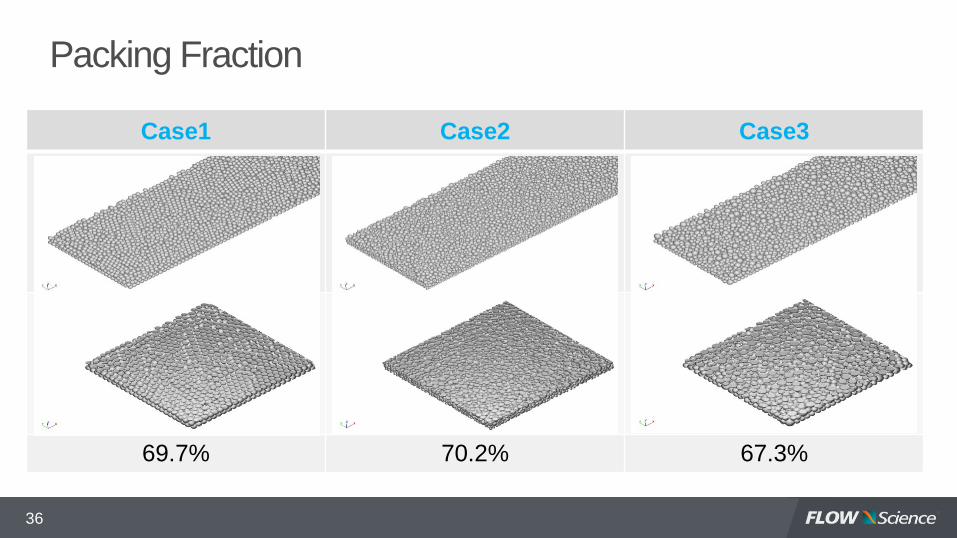
Case1 Case2 Case3
69.7% 70.2% 67.3%
Packing Fraction
36

Powder Spreading
37
Features of interest:
1. Transfer of powder to
build platform
2. Distribution of powder
sizes transferred
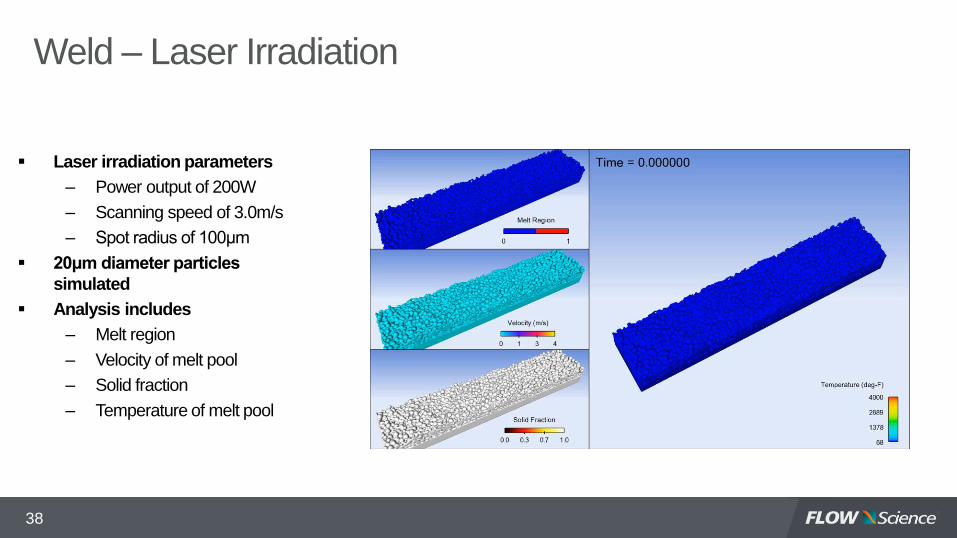
Weld – Laser Irradiation
Laser irradiation parameters
– Power output of 200W
– Scanning speed of 3.0m/s
– Spot radius of 100μm
20μm diameter particles
simulated
Analysis includes
– Melt region
– Velocity of melt pool
– Solid fraction
– Temperature of melt pool
38
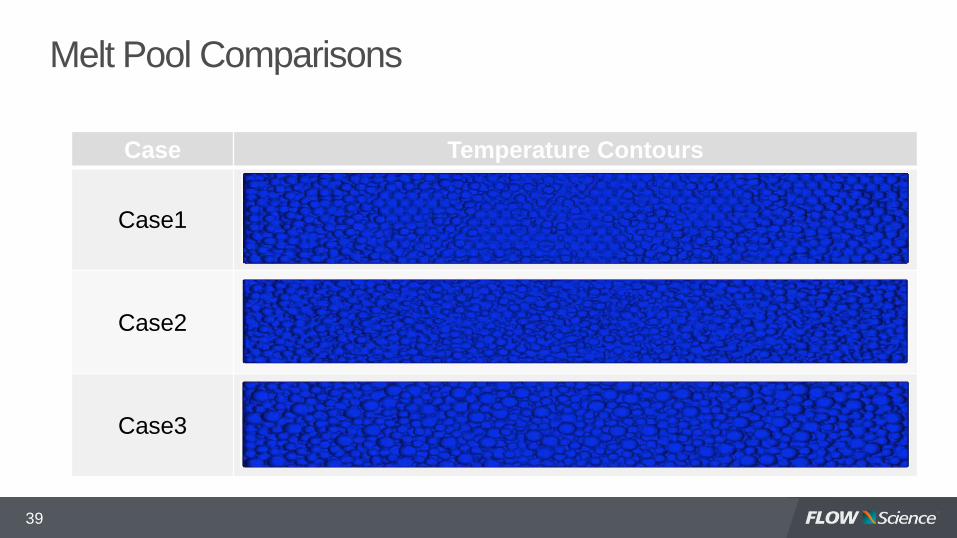
Case Temperature Contours
Case1
Case2
Case3
Melt Pool Comparisons
39

Case Temperature Contour
Case1
Case2
Case3
Melt Pool Comparisons
40

NX Nastran
MSC Nastran
MSC MARC
ABAQUS
Fused particle bed
Internal Structure
Results File
Pressure/Temperature Data
(Load Data)
Thermal Stress Analysis
41
FEA packages

Displacement & Thermal Stresses
42
Displacement contours values showing good agreement
among different FEA packages
Stress contours also showing good agreement among different FEA packages
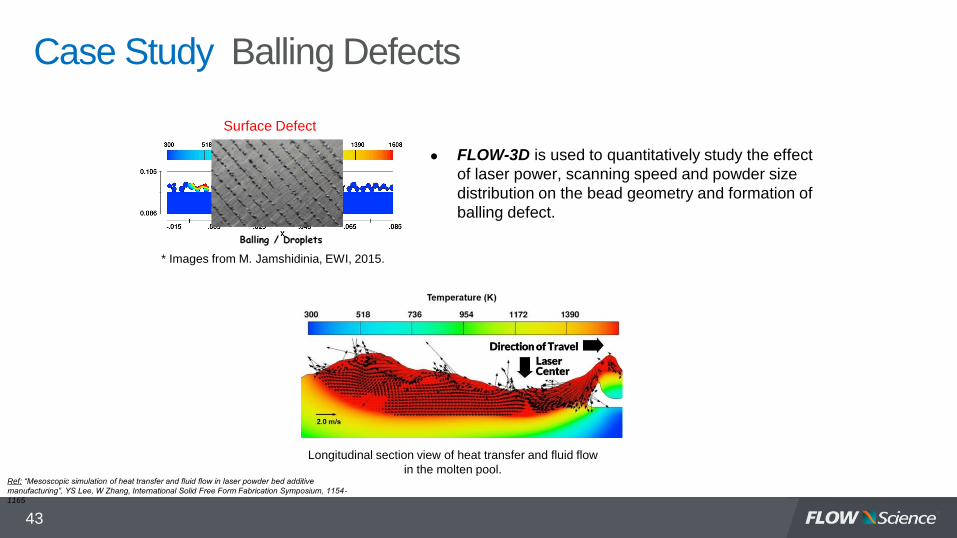
FLOW-3D is used to quantitatively study the effect
of laser power, scanning speed and powder size
distribution on the bead geometry and formation of
balling defect.
* Images from M. Jamshidinia, EWI, 2015.
Surface Defect
Case Study Balling Defects
Longitudinal section view of heat transfer and fluid flow
in the molten pool. Ref: “Mesoscopic simulation of heat transfer and fluid flow in laser powder bed additive
manufacturing”, YS Lee, W Zhang, International Solid Free Form Fabrication Symposium, 1154-
1165
43
Temp.(K) Temp.(K)
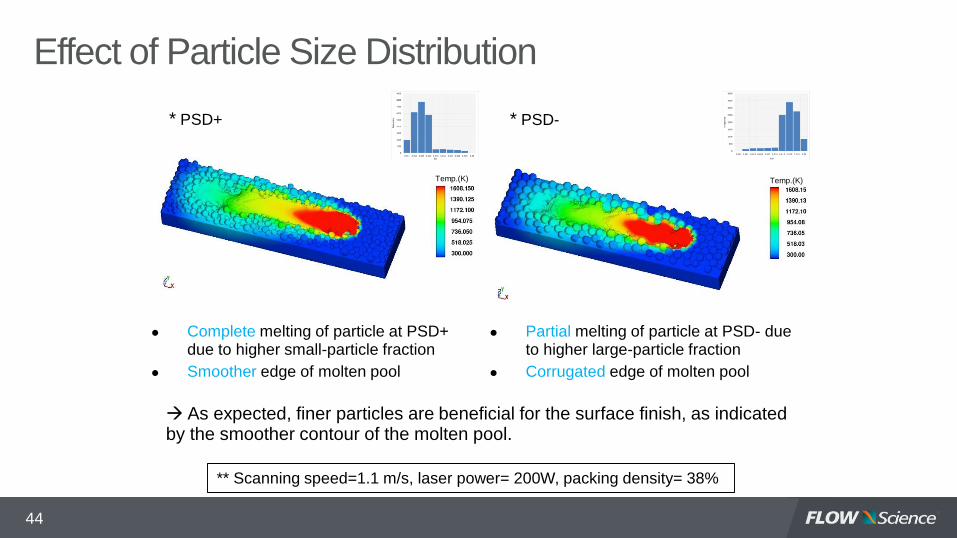
* PSD+ * PSD-
As expected, finer particles are beneficial for the surface finish, as indicated by the smoother contour of the molten pool.
Complete melting of particle at PSD+ due to higher small-particle fraction
Smoother edge of molten pool
Partial melting of particle at PSD- due to higher large-particle fraction
Corrugated edge of molten pool
** Scanning speed=1.1 m/s, laser power= 200W, packing density= 38%
Effect of Particle Size Distribution
44

* Balling at 2.3 m/s
A faster travel speed increases the likelihood of balling defects
Low heat input per unit length and shallow melting
Length to width ratio increases with scanning speed
Rayleigh instability has been used to explain the break-up of molten pool into small islands
** Scanning speed=2.3 m/s, laser power= 200W, packing density= 38% and PSD+
Effect of Scanning Speed
45

* All conditions same except packing density
Increasing the powder packing density not only reduces the formation of balling but also produces a smoother weld pool contour.
** Scanning speed=1.1 m/s, laser power= 150W, packing density= 38% and PSD+
Effect of Packing Density
46

Case Study Microstructure Prediction
Overarching goal: Understanding effect of solidification conditions on
microstructure of IN718 fabricated by L-PBF
– 3D transient heat transfer and fluid flow model
Focus of the present study:
– Laser melting of a single layer of powder particles
– Consideration of laser scanning patterns
Actual scanning patterns used in fabrication are proprietary to the equipment manufacturing.
As a result, a “theoretical” scanning pattern is used in the simulation.
Process parameters: laser power, travel speed and scanning pattern
– Temperature dependent thermo-physical properties for IN718
47
Ref: “Modeling of heat transfer, fluid flow and solidification microstructure of nickel-base superalloy fabricated by laser
powder bed fusion”, YS Lee, W Zhang, Additive Manufacturing 12, 178-188:
http://dx.doi.org/10.1016/j.addma.2016.05.003

Y
X
45o
45o
140 µm
▪ Scanning pattern
Reheating is observed at the boundary of two successive beam paths.
▪ Simulated result
Simulation of Zigzag Scanning Pattern
48

Reheating and Remelting of Track
49

Location Thermal Gradient, G Solidification Rate, R
1 1.43E+06 (K/cm) 150 (cm/s)
2 3.50E+05 (K/cm) 150 (cm/s)
Location Cooling Rate (G*R)PDAS
Trivedi Kurz-Fisher1 2.14E+08 (K/s) 0.17 (µm) 0.23 (µm)2 5.25E+07 (K/s) 0.35 (µm) 0.46 (µm)
Improvements needed:
Scanning speed is 150 cm/s in simulation (cf. 96 cm/s in experiment).
R is assumed as scanning velocity. It varies from location to location in the melt pool.
• Measured PDAS: 0.9~1.8 μm
Prediction of Primary Dendrite Arm Spacing
50
Case Study Keyhole Effects in L-PBF
Overarching goal: Investigating the melt-pool behavior of a randomly-distributed powder bed (H13) with keyhole formation by Nd-YAG laser
– Discrete Element Method (DEM) used to simulate a randomly-packed powder bed
– 3D transient heat transfer and fluid flow model that incorporated evaporation effects
Focus of the present study– DEM validation by analyzing powder size aggregation
– Laser melting model validation through comparison of melt pool temperature, melt pool dimensions and surface morphology.
Conclusions– With evaporation, the melt pool dimensions are deeper and narrower, and the surface temperature is lower.
– The surface morphologies with and without evaporation are totally different because of the recoil pressure triggered by the keyhole formation, which in turn affects the heat and flow behavior as evaporation occurred
51
Ref: “Numerical modeling of melt-pool behavior in selective laser melting with random powder distribution and experimental
validation, Wu, San, et. Al, Journal of Materials Processing Tech., 2017. DOI: https://doi.org/10.1016/j.jmatprotec.2017.11.032
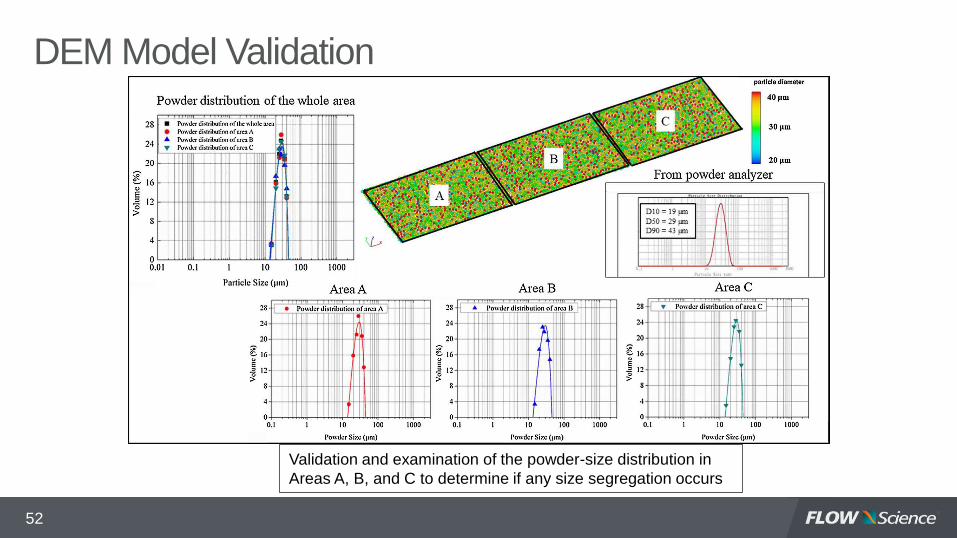
DEM Model Validation
52
Validation and examination of the powder-size distribution in
Areas A, B, and C to determine if any size segregation occurs

Effect of Evaporation in the Laser-Melting Model
53
(a) The melt pool is wide and
shallow when neglecting
evaporation, with
(b) the temperature of the melt
pool overheating.
(c) The melt pool is narrow
and deep when
incorporating evaporation,
in which
(d) the maximum temperature
is 2676 K when evaporation
occurs.
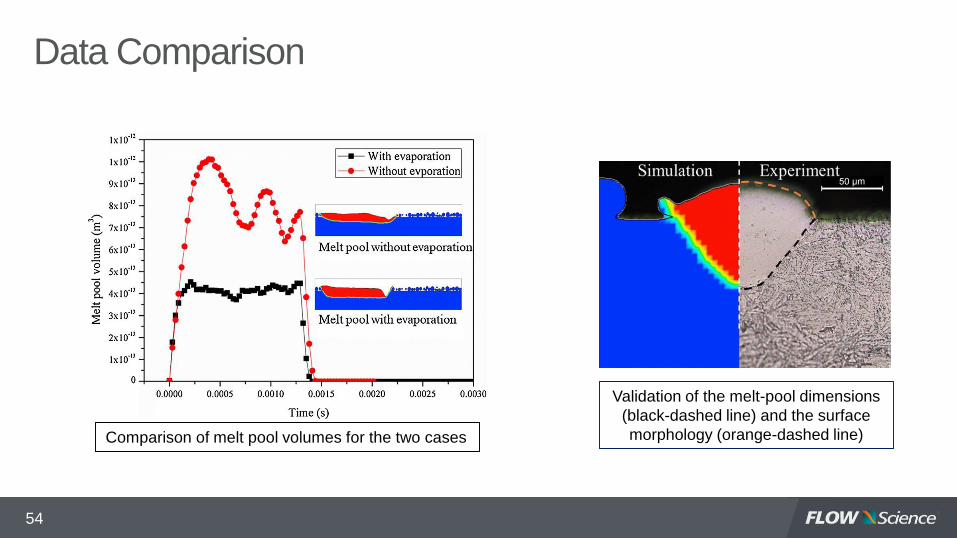
Data Comparison
54
Validation of the melt-pool dimensions
(black-dashed line) and the surface
morphology (orange-dashed line)Comparison of melt pool volumes for the two cases

Numerical Model Analysis
55
Cross-sectional illustration comparing the
surface morphology and melt pool area with
(black line) and without evaporation (red line)
Temperature distributions during keyhole formation at
(a) 0 s; (b) 50 microseconds; (c) 100 microseconds;
(d) 150 microseconds; (e) 200 microseconds; and, (f)
250 microseconds.
MULTI-BED LAYER SIMULATION
56

Scanning Speed & Strategy Study
57
Different scan strategies and scanning speeds were investigated to understand build quality
Laser output of 200W and a spot radius of 0.005 cm used
Scan strategy
– Pattern A
– Pattern B
Scanning speeds
– 3.0 m/s
– 2.25 m/s
– 2.0 m/s
– 1.75 m/s
– 1.5 m/s
Pattern A
Pattern B
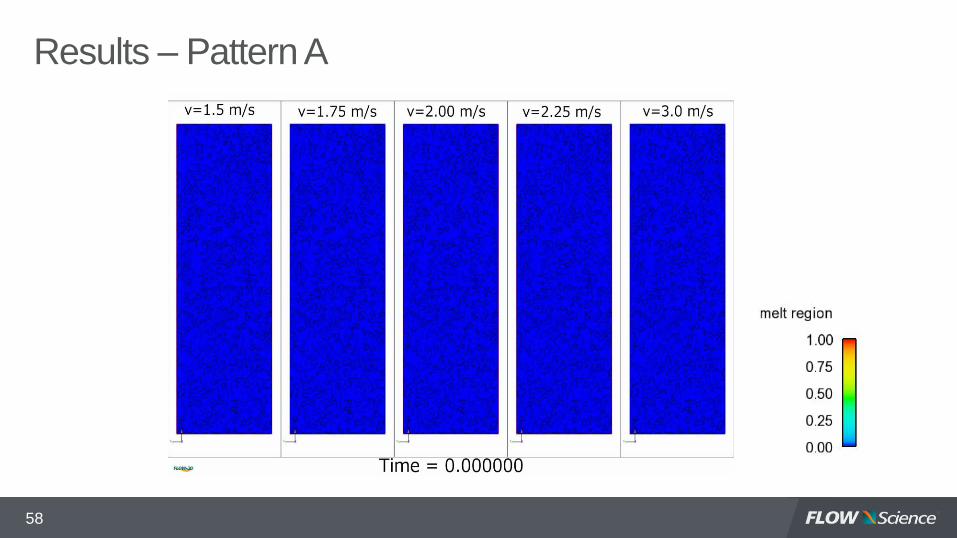
Results – Pattern A
58
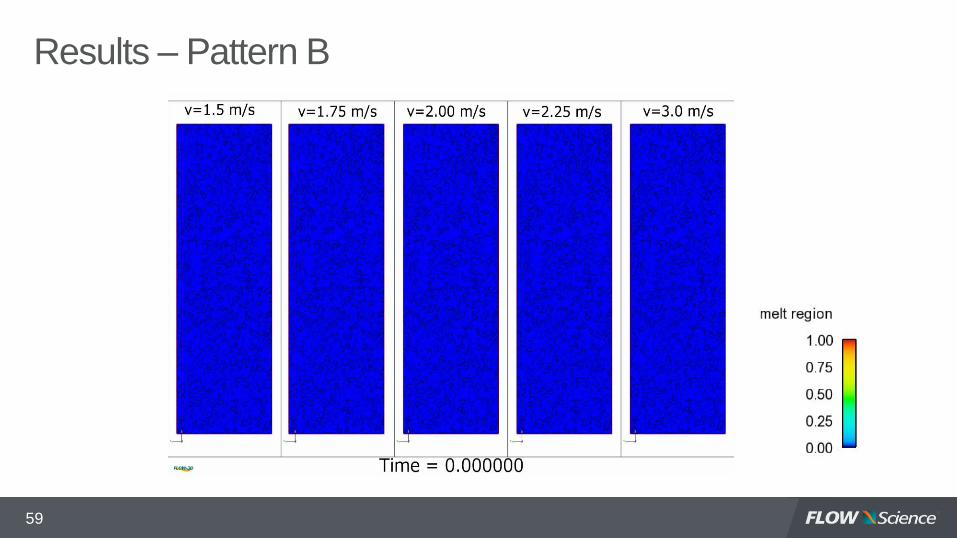
Results – Pattern B
59

Performing a Multi-layer Build
60
Data from the previous build layer is saved Metal powder is dropped on the bed
Another bed layer is formedSimulations are performed on the new powder bed

Process Parameters
61
Particle Distribution
– 10μm (20%)
– 15μm (20%)
– 20μm (60%)
Ni alloy (Inconel 718) properties used
Laser output of 200W and a spot radius of 0.005 cm
Scan strategy
– Pattern A
– Pattern B
Scanning speed
– 1.5 m/s
Pattern A
Pattern B

Bed Laying Animation
62
Powder bed laying on Pattern A vs. Pattern B
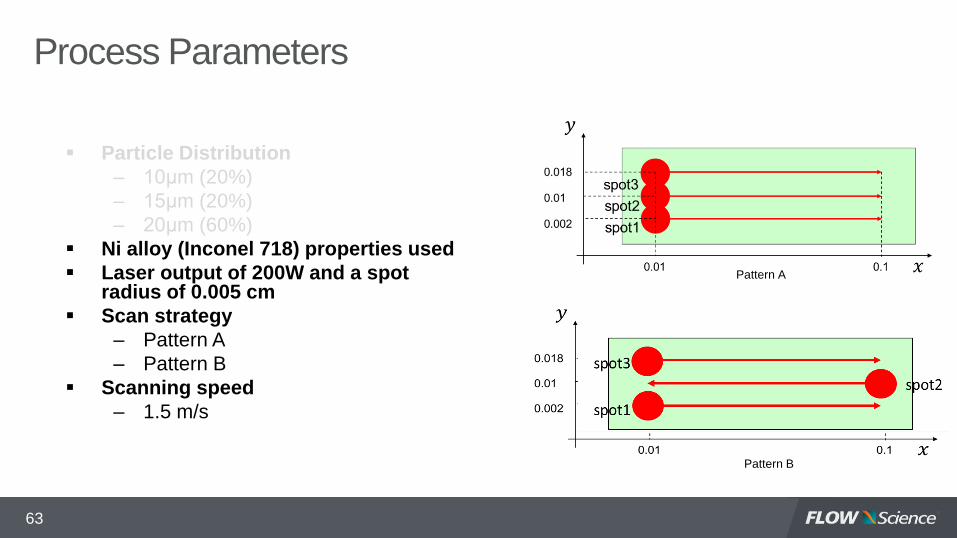
Process Parameters
63
Pattern A
Pattern B
Particle Distribution
– 10μm (20%)
– 15μm (20%)
– 20μm (60%)
Ni alloy (Inconel 718) properties used
Laser output of 200W and a spot radius of 0.005 cm
Scan strategy
– Pattern A
– Pattern B
Scanning speed
– 1.5 m/s

Different Scan Strategies
64
Pattern A – Multi layer build Pattern B – Multi layer build
DIRECT METAL DEPOSITION
65

Laser Metal Deposition – Single Layer
40 micron fluid particles injected at 500,000/s
Laser power is 100W
Scan speed is 1cm/sec
Beam diameter is 2mm
IN-718 material alloy
66
Case Study Ohio State University
67
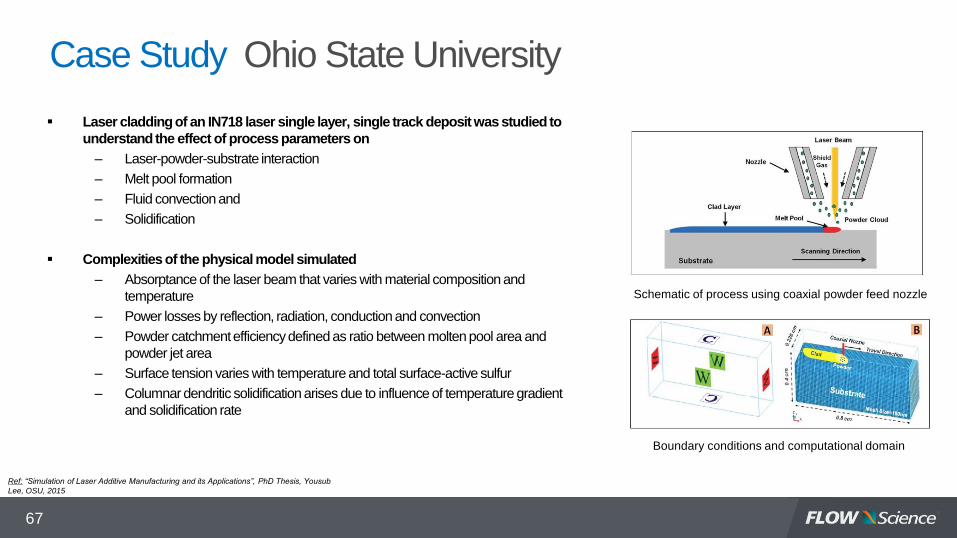
Laser cladding of an IN718 laser single layer, single track deposit was studied to
understand the effect of process parameters on
– Laser-powder-substrate interaction
– Melt pool formation
– Fluid convection and
– Solidification
Complexities of the physical model simulated
– Absorptance of the laser beam that varies with material composition and
temperature
– Power losses by reflection, radiation, conduction and convection
– Powder catchment efficiency defined as ratio between molten pool area and
powder jet area
– Surface tension varies with temperature and total surface-active sulfur
– Columnar dendritic solidification arises due to influence of temperature gradient
and solidification rate
Schematic of process using coaxial powder feed nozzle
Ref: “Simulation of Laser Additive Manufacturing and its Applications”, PhD Thesis, Yousub
Lee, OSU, 2015
Boundary conditions and computational domain
Case Study Melt Pool Analysis
68
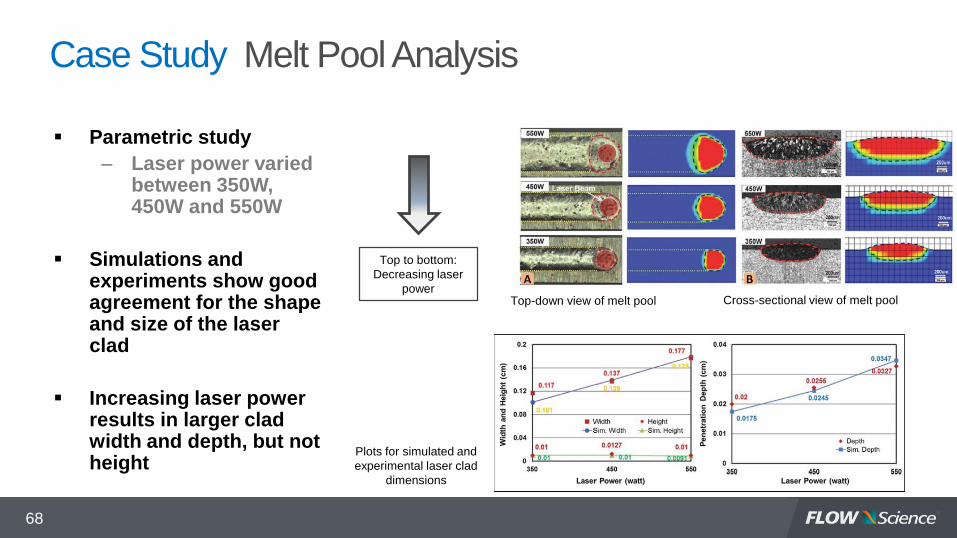
Plots for simulated and
experimental laser clad
dimensions
Top-down view of melt pool Cross-sectional view of melt pool
Parametric study
– Laser power varied between 350W, 450W and 550W
Simulations and experiments show good agreement for the shape and size of the laser clad
Increasing laser power results in larger clad width and depth, but not height
Top to bottom:
Decreasing laser
power
Case Study Melt Pool Analysis
69
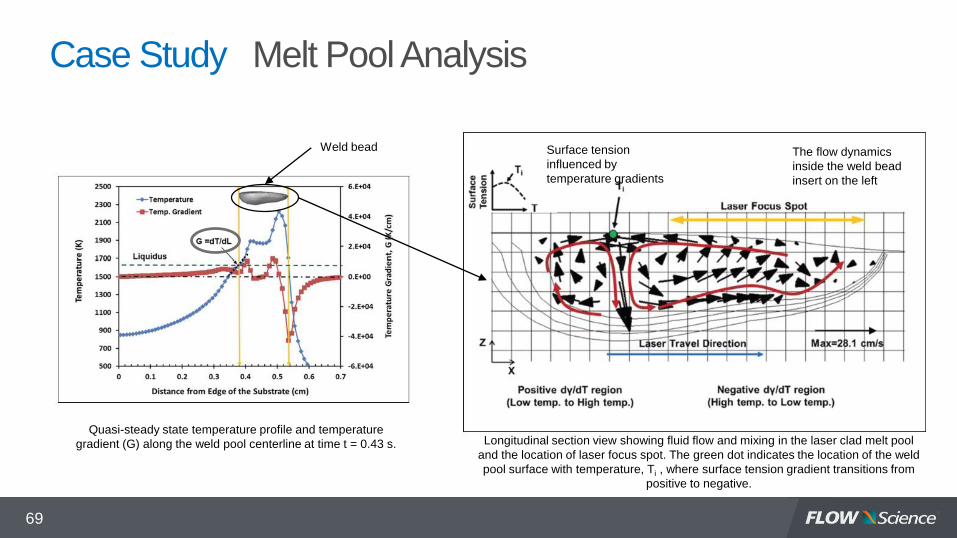
Quasi-steady state temperature profile and temperature
gradient (G) along the weld pool centerline at time t = 0.43 s. Longitudinal section view showing fluid flow and mixing in the laser clad melt pool
and the location of laser focus spot. The green dot indicates the location of the weld
pool surface with temperature, Ti , where surface tension gradient transitions from
positive to negative.
Weld bead The flow dynamics
inside the weld bead
insert on the left
Surface tension
influenced by
temperature gradients

Case Study Mitsubishi Heavy Industries
70
The researchers at Mitsubishi Heavy Industry had an interesting problem
– Single Ni-crystal blades used in gas turbines are damaged often
– It’s quite expensive to replace them, so repair is always preferable
Laser metal deposition can repair damaged blades
– However, the weld metal needs to have same crystal orientation as base metal
Objective
– To maximize growth of single crystal in weld metal
And how did they achieve that?
– Calibrate numerical parameters with experiments
– Control thermal gradient and the solidification rate which depend on process
parameters used
Schematic of LMD
Ref: “Mitsubishi Heavy Industries Technical Review Vol. 52 No. 4 (December
2015)

Case Study Laser Welding Repair
71
Calibrate numerical parameters with experiments
Process parameter optimization
– Scanning speed
30mm/min – 105mm/min
– Laser power
100W – 1000W
– Powder feed rate
1.2g/min – 2.0g/min
Optimum parameters achieved
– Laser power of 650 W, a scanning speed of 60 mm/min and a powder supply rate of 2g/min
Dependence of single crystal
orientation length in the melted
region on LMD parameters Transverse sections comparison
between numerical analysis and
Actual LMD.
Sweet spot
or rather
sweet weld!