Organisation for Economic Co-operation and Development
ENV/CBC/MONO(2021)15
Unclassified English - Or. English
28 July 2021
ENVIRONMENT DIRECTORATE CHEMICALS AND BIOTECHNOLOGY COMMITTEE
Cancels & replaces the same document of 28 July 2021
STUDY REPORT ON A TEST FOR REMOVAL IN WASTEWATER TREATMENT PLANTS OF GOLD MANUFACTURED NANOMATERIAL (MN): ACTIVATED SLUDGE SORPTION ISOTHERM
Series on Testing and Assessment, No. 340
JT03479786 OFDE
This document, as well as any data and map included herein, are without prejudice to the status of or sovereignty over any territory, to the
delimitation of international frontiers and boundaries and to the name of any territory, city or area.
2 ENV/CBC/MONO(2021)15
Unclassified
SERIES ON TESTING AND ASSESSMENT
NO. 340
STUDY REPORT ON A TEST FOR REMOVAL IN WASTEWATER TREATMENT PLANTS OF GOLD MANUFACTURED NANOMATERIAL (MN): ACTIVATED SLUDGE
SORPTION ISOTHERM
Environment Directorate
ORGANISATION FOR ECONOMIC COOPERATION AND DEVELOPMENT
Paris 2021
ENV/CBC/MONO(2021)15 3
Unclassified
About the OECD
The Organisation for Economic Co-operation and Development (OECD) is an intergovernmental organisation in which representatives of 36 industrialised countries in North and South America, Europe and the Asia and Pacific region, as well as the European Commission, meet to co-ordinate and harmonise policies, discuss issues of mutual concern, and work together to respond to international problems. Most of the OECD’s work is carried out by more than 200 specialised committees and working groups composed of member country delegates. Observers from several countries with special status at the OECD, and from interested international organisations, attend many of the OECD’s workshops and other meetings. Committees and working groups are served by the OECD Secretariat, located in Paris, France, which is organised into directorates and divisions. The Environment, Health and Safety Division publishes free-of-charge documents in eleven different series: Testing and Assessment; Good Laboratory Practice and Compliance Monitoring; Pesticides; Biocides; Risk Management; Harmonisation of Regulatory Oversight in Biotechnology; Safety of Novel Foods and Feeds; Chemical Accidents; Pollutant Release and Transfer Registers; Emission Scenario Documents; and Safety of Manufactured Nanomaterials. More information about the Environment, Health and Safety Programme and EHS publications is available on the OECD’s World Wide Web site (www.oecd.org/chemicalsafety/).
This publication was developed in the IOMC context. The contents do not necessarily reflect the views or stated policies of individual IOMC Participating Organizations. The Inter-Organisation Programme for the Sound Management of Chemicals (IOMC) was established in 1995 following recommendations made by the 1992 UN Conference on Environment and Development to strengthen co-operation and increase international co-ordination in the field of chemical safety. The Participating Organisations are FAO, ILO, UNDP, UNEP, UNIDO, UNITAR, WHO, World Bank and OECD. The purpose of the IOMC is to promote co-ordination of the policies and activities pursued by the Participating Organisations, jointly or separately, to achieve the sound management of chemicals in relation to human health and the environment.
4 ENV/CBC/MONO(2021)15
Unclassified
This publication is available electronically, at no charge.
Also published in the Testing and Assessment link
For this and many other Environment,
Health and Safety publications, consult the OECD’s World Wide Web site (www.oecd.org/chemicalsafety/)
or contact:
OECD Environment Directorate, Environment, Health and Safety Division
2 rue André-Pascal 75775 Paris Cedex 16
France
Fax: (33-1) 44 30 61 80
E-mail: [email protected]
© OECD 2021 Applications for permission to reproduce or translate all or part of this material should be made to: Head of Publications Service, [email protected], OECD, 2 rue André-Pascal, 75775 Paris Cedex 16, France OECD Environment, Health and Safety Publications
ENV/CBC/MONO(2021)15 5
Unclassified
FOREWORD
This document presents a draft Study Report on “Gold Manufactured Nanomaterial (MN) Removal in
Wastewater Treatment Plants: Activated Sludge Sorption Isotherm”.
The study report was prepared by the United States, leading the project between 2014 and 2021. The original
plan was to develop a Test Guideline. To this end, the lead country conducted experimental work with one
type of nanoparticles but ran short of resources to test further nanomaterials. The Expert Group following
the project had several teleconferences to provide input. Experts recognised that additional test would be
needed for a Test Guidelines but also recognised the value of the experimental work completed by the United
States. The Expert Group and the Secretariat recommended to share the outcome of the experimental work
in the form of a Study Report intended to be published in the Series on Testing and Assessment.
This report includes: i) the results obtained; ii) the protocol followed; iii) the relationship with other existing
OECD Test Guidelines in the area of environmental fate, and iv) an annex containing an Excel spreadsheet
to be used as a template for the reporting of data. The Study Report and its associated Excel spreadsheet
were approved by the WNT in April 2021. The Study Report is published under the responsibility of the
Chemicals and Biotechnology Committee.
6 ENV/CBC/MONO(2021)15
Unclassified
Table of contents
1 INTRODUCTION 9
2 SIGNIFICANCE AND USE 11
3 SCOPE 12
4 INITIAL CONSIDERATIONS 13
5 PROPOSED REFERENCED SUBSTANCE 14
6 PRINCIPLE OF THE TEST 15
7 STUDY DESIGN 16
8 TEST RESULTS 18
9 STUDY SUMMARY AND CONCLUSIONS 34
10 ANNEX- DETAILED TEST PROCEDURE APPLIED IN THE STUDY 35
11 REFERENCES 45
12 APPENDIX - GLOSSARY 47
ENV/CBC/MONO(2021)15 7
Unclassified
FIGURES Figure 1. Average percent removal of Au MN for each of the five labs, in the first ring test. 23 Figure 2. Gold MN adsorption isotherms from the first ring test as a function of the final Au solution
concentration. 24 Figure 3. Log normalized Au sorption isotherms and linear regression results of the log transformed data
from the first round of testing. 24 Figure 4. Average percent removal of Au MN for each of the five biomass samples, in second round of
testing. 26 Figure 5. Gold MN adsorption isotherms from the second ring test as a function of the final Au solution
concentration. 26 Figure 6. Log normalized Au sorption isotherms and linear regression results of the log transformed data
from the second round of testing. 27 Figure 7. Average percent removal of Au MN for each of the seven biomass samples, in third and fourth
round of testing. 29 Figure 8. Gold MN adsorption isotherms from the second ring test as a function of the final Au solution
concentration. 29 Figure 9. Log normalized Au sorption isotherms and linear regression results of the log transformed data
from the Third and Fourth Round of testing. 30 Figure 10 Log normalized Au sorption isotherms and linear regression results of the log transformed data
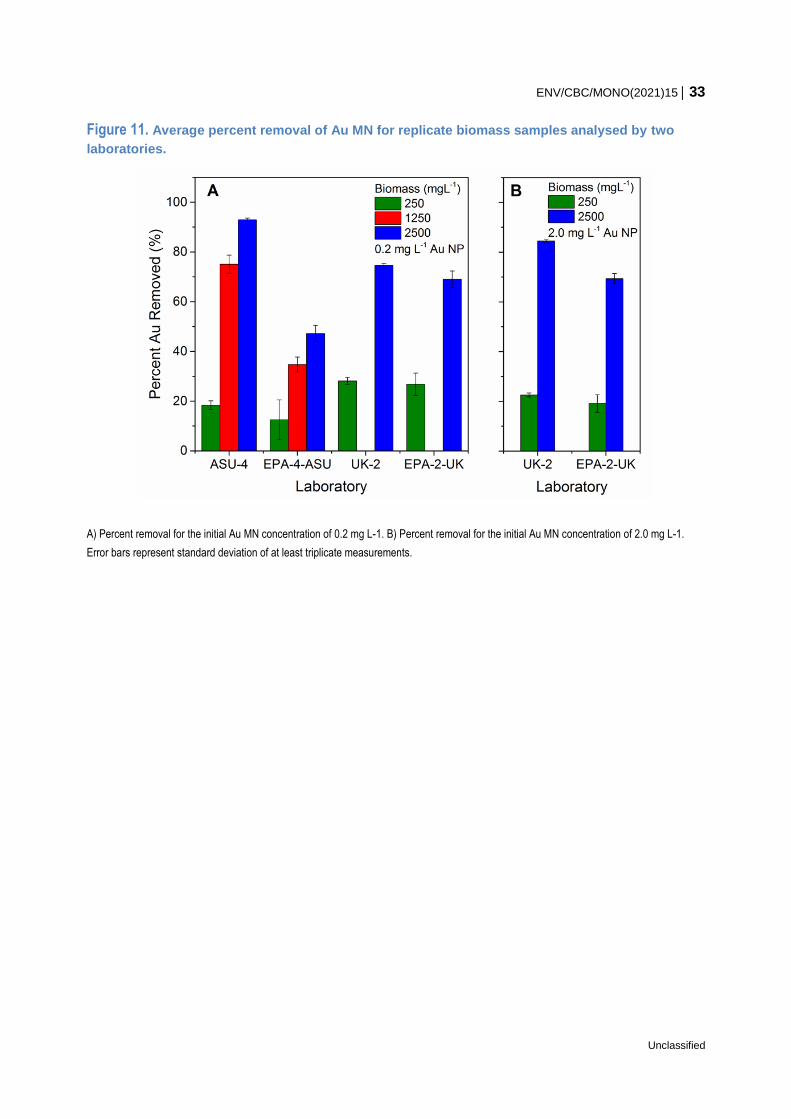
from all four rounds of testing. Results are presented for each round of testing. 32 Figure 11. Average percent removal of Au MN for replicate biomass samples analysed by two
laboratories. 33 Figure 12. Flow diagram of the laboratory steps involved in preparing nanomaterial and biomass samples
for determination of net removal. 39
8 ENV/CBC/MONO(2021)15
Unclassified
TABLES Table 1. Physicochemical properties of the Au MNs and biomass for each lab. 17 Table 2. Physicochemical properties of Au MNs and Biomass measured by participants for Round 1 of the
ring test. 19 Table 3. Results from the linear regression of the log normalized sorption data from the first ring test. 24 Table 4. Results from the linear regression of the log normalized sorption data from the second round of
testing. 28 Table 5. Results from the linear regression of the log normalized sorption data from the Third and Fourth
Round of testing. 31 Table 6. Sample table outlining the test conditions to be evaluated in the net removal experiment 41 Table 7. Net Removal Experimental Matrix (n=15) 42
ENV/CBC/MONO(2021)15 9
Unclassified
1. The increased production and a wide range of uses for manufactured nanomaterials (MN) in
commercial products and applications would suggest that a portion of these MNs will make their way to
waste water treatment plants (WWTP). The primary mechanisms by which chemical contaminants are
removed from wastewater treatment include: volatilization, biodegradation, hydrolysis, or
association/adsorption with sludge. The association of MN with suspended solids (microbial
biomass/bioflocs) in WWTP is likely to be the dominant pathway of their removal (Ganesh, R., et al.,
2010; Gomez-Rivera, F., et al., 2012; Kaegi, R., et al., 2011 and 2013; Kiser, M.A., et al., 2009, 2010;
Mueller, N.C. and B. Novack, 2008; Westerhoff, P., et al., 2011). While some MNs may undergo
dissolution, redox transformations and biodegradation, the extent of transformation reactions will be
nanomaterial- and coating-specific and may occur at slower rates than aggregation with suspended
solids (i.e. biofloc) (Kaegi, R., et al., 2011 and 2013; Clar, J.G., et al., 2016). When a MN is associated
with sludge biomass, it will be removed from the system along with other solids. Only a very small
percentage of biomass exits clarifiers as un-settled solids, so most MNs associated with solids will
reside in sewage sludge residuals that WWTPs dispose to land applications, landfills and/or
incinerators. MNs that have a poor affinity for suspended solids that are not biodegradable, or volatile
compounds will pass through a biological treatment system unaffected. Therefore, information on the
affinity of MNs for suspended solids is needed to assess the possibility of their removal by wastewater
treatment systems.
2. The method applied in this study follows a procedure for estimating the potential of activated
sludge solids to remove MNs from the water phase. Many MNs are expected to undergo only
aggregation/deposition (e.g. affinity to sludge) and may be expected to associate largely with sludge
during wastewater treatment (Ganesh, R., et al., 2010; Kaegi, R., et al., 2011 and 2013; Kiser, M.A., et
al., 2009, 2010; Mueller, N.C. and B. Novack, 2008; Westerhoff, P., et al., 2011). Some MNs (e.g.,
nano-silver materials) may undergo dissolution and/or surface reactions (Kaegi, R., et al., 2011 and
2013; Meier, C., et al., 2016). Testing for affinity of MNs to sludge, including the eventual fate and
dissolution by-products, will simulate their potential removal during secondary clarification in a WWTP.
While some dissolved organic chemical solutes, follow reversible sorption/desorption mechanisms,
other dissolved metal ions and ionized organic chemicals exhibit a strong affinity for sorption onto
activated sludge or other suspended materials (i.e., bioflocs). As colloids, MNs behave differently from
these dissolved chemicals but still interact with activated sludge or other suspended materials, and
nanoparticle interactions with suspended materials are likely to be dominated by heteroaggregation and
shear-off or break-up, respectively (Kiser, M.A., et al., 2010; OECD, 2017). The distribution between
dispersed MNs and MNs associated with larger bioflocs, evolves over time, and may reach a pseudo
steady state between aggregation and break-up. The kinetics and extent of these aggregation / break-
up processes depends upon the amount of bioflocs (i.e., total suspended solids (TSS) in the mixed
liquor suspended solids (MLSS) of suspended growth biological wastewater treatment systems, such
as activated sludge processes) and mixing conditions (e.g., shear forces, duration).
3. Existing OECD Test Guidelines (TG) may apply to some extent to estimate properties such as
adsorption to and desorption from sludge (e.g. via TG 106 (OECD, 2000) or TG 121 (OECD, 2001a),
or behaviour in wastewater (e.g. removal using wastewater simulation tests in TG 303 (OECD, 2001b)
or TG 314 (OECD, 2008)). However, limitations exist, and specific considerations must be addressed
1 INTRODUCTION
10 ENV/CBC/MONO(2021)15
Unclassified
before deciding on the suitability of a TG for MNs. For example, Annex 5 in TG 303 does discuss the
application of the method to poorly water-soluble substances, of which MN may be characterized. The
method discusses utilizing a solid liquid mass balance approach for determining if the material had been
“degraded” or removed from the effluent. However, there is no outlined procedure for monitoring the
removal/degradation of inorganic contaminants. OECD Test Guideline TG 318, Dispersion Stability of
Nanomaterials in Simulated Environmental Media (OECD, 2017) does provide a detailed over view of
the physicochemical properties that will affect the stability of a MN suspensions and provides several
methods for quantifying the stability of MN suspensions under varying environmental conditions.
However, the focus of the methods discussed is on the stability of the MN suspension in the absence
of other colloids or suspended solids.
4. The current report is intended to help bridge the current gap that exists in OECD TGs to quantify
the association of MN with biomass in WWTP and to understand the utility of the proposed test method
in the context of wastewater treatment screening and testing methodologies. As such the method differs
from those TG previously mentioned by focusing on measuring the removal of MN through association
with sewage sludge using an approach that differs from both TG 303 and 318. As knowledge and
experience increase on the properties and behaviour of various types of MN, understanding on the
utility of the method studied in this document will inform its possibility to complement existing OECD
TGs, as such, modified, or in an overall strategy.
ENV/CBC/MONO(2021)15 11
Unclassified
5. This document includes a detailed description of a procedure for measuring the net removal
extent (NR) to which a MN distributes between activated sludge and water in wastewater treatment
systems. The goal of this test is to provide sufficient information to predict the removal of a test MN in
a wastewater treatment facility through association with sludge. The distribution of conventional
contaminants between supernatant and biomass is often described by a sorption isotherm (Pagga, U.
and K. Taeger, 1994). These isotherms can be used to develop mass balances expressions for WWTP
unit processes to estimate the amount of the chemical that will be removed during wastewater
treatment. The Activated Sludge Sorption Isotherm, in Fate, Transport, and Transformation Test
Guideline (OPPTS 835.1110) method uses freeze-dried biomass and has been validated for neutral
and ionized organic chemicals and dissolved metals (USEPA, 1998). However, the OPPTS 835.1110
method has recently been demonstrated ineffective for predicting the removal of a variety of different
MNs during wastewater treatment (Ag, Au, Ti) (Kiser, M.A., et al., 2009, 2010; 2012). The freeze-drying
process significantly alters the physical size and structure of the biofloc, which reduces interaction with
the MNs. The current document provides an update to the existing method that may be used for
predicting the removal of MNs during wastewater treatment by employing the use of fresh
biomass/biofloc collected from a WWTP or generated under laboratory conditions.
6. MN interactions with biofloc under most WWTP conditions reaches a steady-state condition
related to aggregation and/or dissolution, rather than thermodynamic equilibrium that exist for some
organic chemicals (e.g., neutral organic molecules). Over time, the processes that bring MNs into
association with larger suspended solids (heteroaggregation) and those involved in the release from
heteroaggregates (break-up) may reach a steady state. This steady state describes the maximum
amount of MNs that may be removed by settling alone. This removal will vary as a function of mixing
conditions and the chemistry of the suspended solids and nature of the MNs under testing.
7. Evaluations of the net removal of MNs observed at bench scale conditions provide useful
information on what might be expected at full scale. The test procedures presented here are formulated
to be used as a screening level assessment for estimating the removal of MN from wastewater due to
association with biomass.
2 SIGNIFICANCE AND USE
12 ENV/CBC/MONO(2021)15
Unclassified
8. This study report proposes a procedure for evaluating the association of MN with mixed liquor
suspended solids (MLSS) to advance a screening level assessment of the removal of MNs during
wastewater treatment. The study relies upon measuring the quantity of the MN removed from a
suspension following prescribed mixing periods and biomass concentrations to estimate the amount of
MN associated with the sludge as a function of biomass concentration.
3 SCOPE
ENV/CBC/MONO(2021)15 13
Unclassified
9. In this study, we propose to evaluate the reproducibility of a protocol designed to estimate the
removal in batch bench-scale experiments of MNs under a set of conditions of MLSS, mixing,
temperature and residence time using return activated sludge from a variety of WWTPS. The test
conditions are selected to simulate removal in the activated sludge and clarifier unit processes of a
WWTP that will allow for extrapolation to operating conditions that are outside of the test protocol.
10. By setting the conditions in the test to mimic wastewater treatment (e.g., amount of biomass
per volume of water), the measured percentage removal of MN at a small number of concentrations
from the water phase will provide the evaluator with a rough estimate of the percentage removal to be
anticipated in WWTPs and, together with other information, will justify the release numbers used in the
environmental exposure assessment. A 0% WWTP removal is used in assessments unless relevant
data is available in the literature or produced by the manufacturer. Research groups have demonstrated
the ability to use batch bench-scale MN removal data to model and/or match continuous-flow lab-scale
reactors or full-scale WWTP removals of MNs (Kiser, M.A., et al., 2009; Westerhoff, P., et al., 2011).
The benefits of the batch bench-scale protocol and simpler tests than continuous-flow reactors are the
ability to simulate a larger range of site-specific conditions (temperatures, MLSS levels, hydraulic
residence times, etc.) using a smaller mass of MNs.
4 INITIAL CONSIDERATIONS
14 ENV/CBC/MONO(2021)15
Unclassified
11. A reference MN is defined to ensure the test system is functional and responsive, and that data
can be compared across studies using the same reference MN. The reference MN will be defined in a
future standardized method or Guideline, as well as the expected outcome of the test. A candidate
reference material for use should:
Be easily detectable by the specific method of detection;
Have low elemental abundance in the biomass;
Be non-reactive;
Have a narrow particle size range;
Be stable in suspension.
12. In the current study, a gold (Au) MN is used as it fulfils the above criteria. Au MNs may be
purchased for a nominal fee, are easily detectable by ICP and UV/Vis analysis, have a low elemental
abundance in WWTPs, are non-reactive over short time periods, and may be purchased with a narrow
size distribution.
5 PROPOSED REFERENCED
SUBSTANCE
ENV/CBC/MONO(2021)15 15
Unclassified
13. The current method evaluates the partitioning of MN to return activated sludge (RAS) collected
from a wastewater treatment facility. The method is based on a simple experimental procedure of
conducting a sorption isotherm on buffered biomass samples at multiple solid: solution ratios and
concentrations of nanomaterials mixed for a set time and then allowed to settle prior to sampling.
Analytical techniques for determining the concentration of MN remaining in solution after the test is left
to the discretion of the experimenter, as one specific analytical technique is not suitable for all
nanomaterials.
14. The method only evaluates the MN concentration remaining in solution after equilibration with
the active biomass. The method does not distinguish between sorption onto biomass or
homo/heterogeneous aggregation of particles. The method does not account for specific chemical
transformation of the MN being investigated, e.g. dissolution, redox transformation, and/or secondary
precipitation. Further details on the test procedure, material, method, analysis and reporting are
available in this report in Section 10.
15. The report presents the results from a series of experiments conducted by a variety of
researchers within the United States. The purpose of the study was to determine:
if MN sorption/partitioning to active biomass was similar between different wastewater
treatments plants representative of different parts of the country,
if results from Au-NP removal from the same biomass is reproducible between labs,
if different wastewater streams e.g. urban or rural result in differences in Au-NP removal, and
whether Au-NP sorption/partitioning to biomass collected from the same WWTP at different
time periods throughout the year vary. For the present study, a gold nanomaterial suspension
stabilized with a tannic acid coating was used.
16. Two target concentrations of gold (0.2 and 2.0 mg L-1 Au) and up to three different
concentrations of biomass (250, 1250, and 2500 mg L-1 TSS) were evaluated in each assay.
17. The initial suggestion was to conduct a round robin of experiments using locally procured
activated sludge and a tannin coated nano gold reference material (~12 nm) as the first MN. However,
resource limitations in the lead country (United States) and OECD member countries did not allow
moving to a broader ring-test with more MN tested across multiple laboratories.
6 PRINCIPLE OF THE TEST
16 ENV/CBC/MONO(2021)15
Unclassified
18. Five laboratories were recruited to participate in the method evaluation, the laboratories
included: Arizona State University (ASU), University of Arizona (UA), University of Kentucky (UK),
University of Missouri (U Mizzou), and the U.S. Environmental Protection Agency, Office of Research
and Development (EPA). UK provided the engineered nanomaterials for the test, gold nanoparticles 14
± 3.1 nm in diameter with a tannic acid coating. Complete details of the physicochemical properties of
the gold nanomaterials may be found in Judy et al. 2012. Participants were given a copy of the method
and a spreadsheet for reporting data. The first page of the spreadsheet gathered basic information
about the planned test, the biomass to be used, and the instrument used for analysis (Table 1). The
second sheet within the spreadsheet contained a table for recording results from the experiments.
Participants only needed to enter results from the analysis of Au remaining in solution after the test
period. If the data were entered into the appropriate cells, the spreadsheet would calculate the percent
of Au removed from solution and the concentration of Au sorbed to the biomass. Calculation of the
biomass affinity constant was not included in the spreadsheet provided, and participants were expected
to determine the values based on the equations provide in the method.
7 STUDY DESIGN
ENV/CBC/MONO(2021)15 17
Unclassified
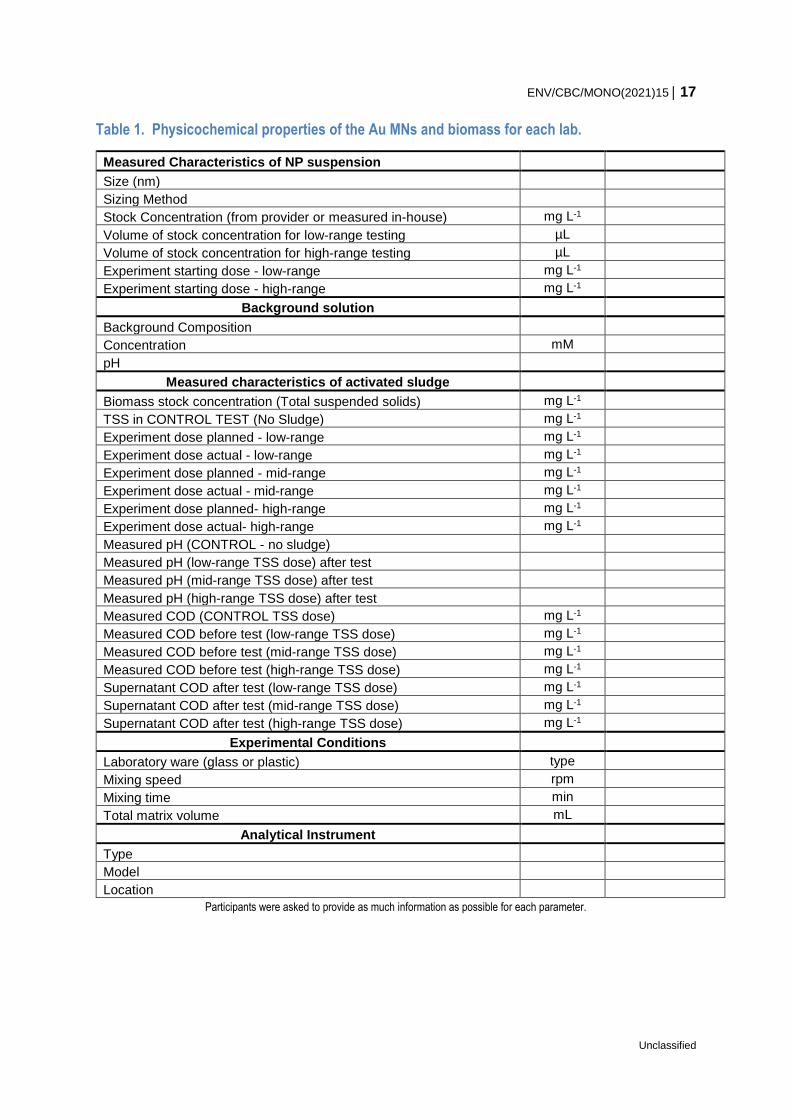
Table 1. Physicochemical properties of the Au MNs and biomass for each lab.
Measured Characteristics of NP suspension
Size (nm)
Sizing Method
Stock Concentration (from provider or measured in-house) mg L-1
Volume of stock concentration for low-range testing µL
Volume of stock concentration for high-range testing µL
Experiment starting dose - low-range mg L-1
Experiment starting dose - high-range mg L-1
Background solution
Background Composition
Concentration mM
pH
Measured characteristics of activated sludge
Biomass stock concentration (Total suspended solids) mg L-1
TSS in CONTROL TEST (No Sludge) mg L-1
Experiment dose planned - low-range mg L-1
Experiment dose actual - low-range mg L-1
Experiment dose planned - mid-range mg L-1
Experiment dose actual - mid-range mg L-1
Experiment dose planned- high-range mg L-1
Experiment dose actual- high-range mg L-1
Measured pH (CONTROL - no sludge)
Measured pH (low-range TSS dose) after test
Measured pH (mid-range TSS dose) after test
Measured pH (high-range TSS dose) after test
Measured COD (CONTROL TSS dose) mg L-1
Measured COD before test (low-range TSS dose) mg L-1
Measured COD before test (mid-range TSS dose) mg L-1
Measured COD before test (high-range TSS dose) mg L-1
Supernatant COD after test (low-range TSS dose) mg L-1
Supernatant COD after test (mid-range TSS dose) mg L-1
Supernatant COD after test (high-range TSS dose) mg L-1
Experimental Conditions
Laboratory ware (glass or plastic) type
Mixing speed rpm
Mixing time min
Total matrix volume mL
Analytical Instrument
Type
Model
Location
Participants were asked to provide as much information as possible for each parameter.
18 ENV/CBC/MONO(2021)15
Unclassified
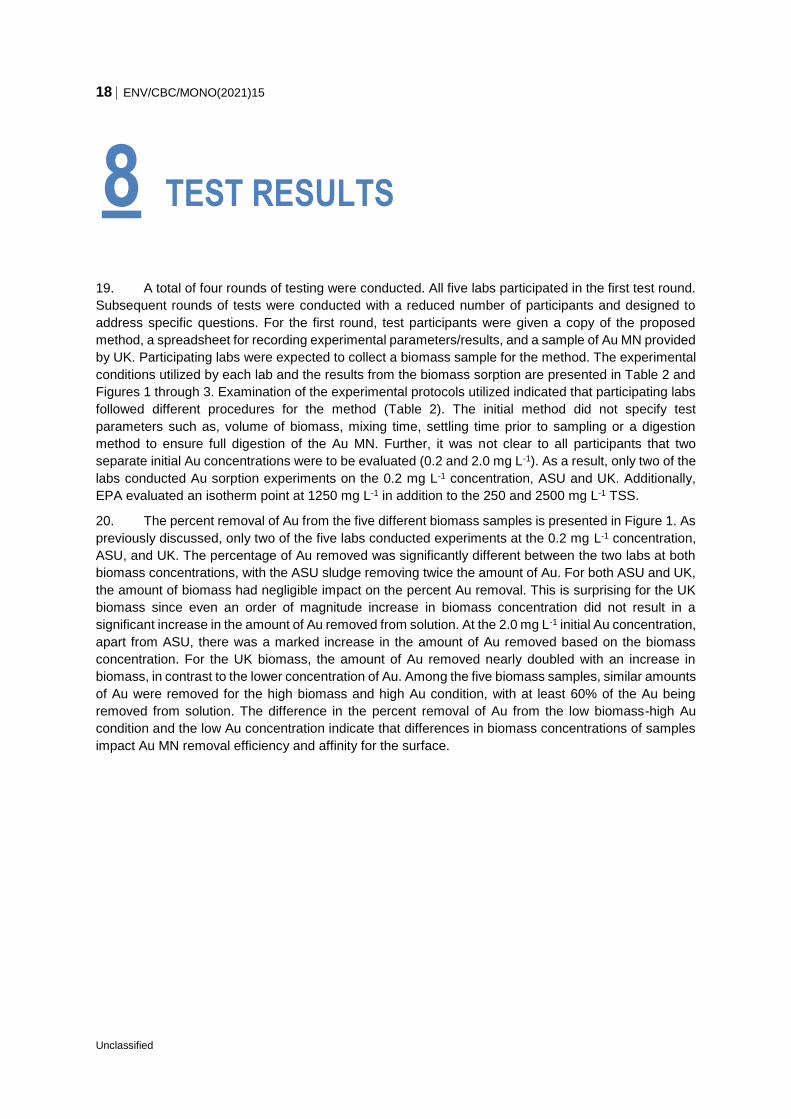
19. A total of four rounds of testing were conducted. All five labs participated in the first test round.
Subsequent rounds of tests were conducted with a reduced number of participants and designed to
address specific questions. For the first round, test participants were given a copy of the proposed
method, a spreadsheet for recording experimental parameters/results, and a sample of Au MN provided
by UK. Participating labs were expected to collect a biomass sample for the method. The experimental
conditions utilized by each lab and the results from the biomass sorption are presented in Table 2 and
Figures 1 through 3. Examination of the experimental protocols utilized indicated that participating labs
followed different procedures for the method (Table 2). The initial method did not specify test
parameters such as, volume of biomass, mixing time, settling time prior to sampling or a digestion
method to ensure full digestion of the Au MN. Further, it was not clear to all participants that two
separate initial Au concentrations were to be evaluated (0.2 and 2.0 mg L-1). As a result, only two of the
labs conducted Au sorption experiments on the 0.2 mg L-1 concentration, ASU and UK. Additionally,
EPA evaluated an isotherm point at 1250 mg L-1 in addition to the 250 and 2500 mg L-1 TSS.
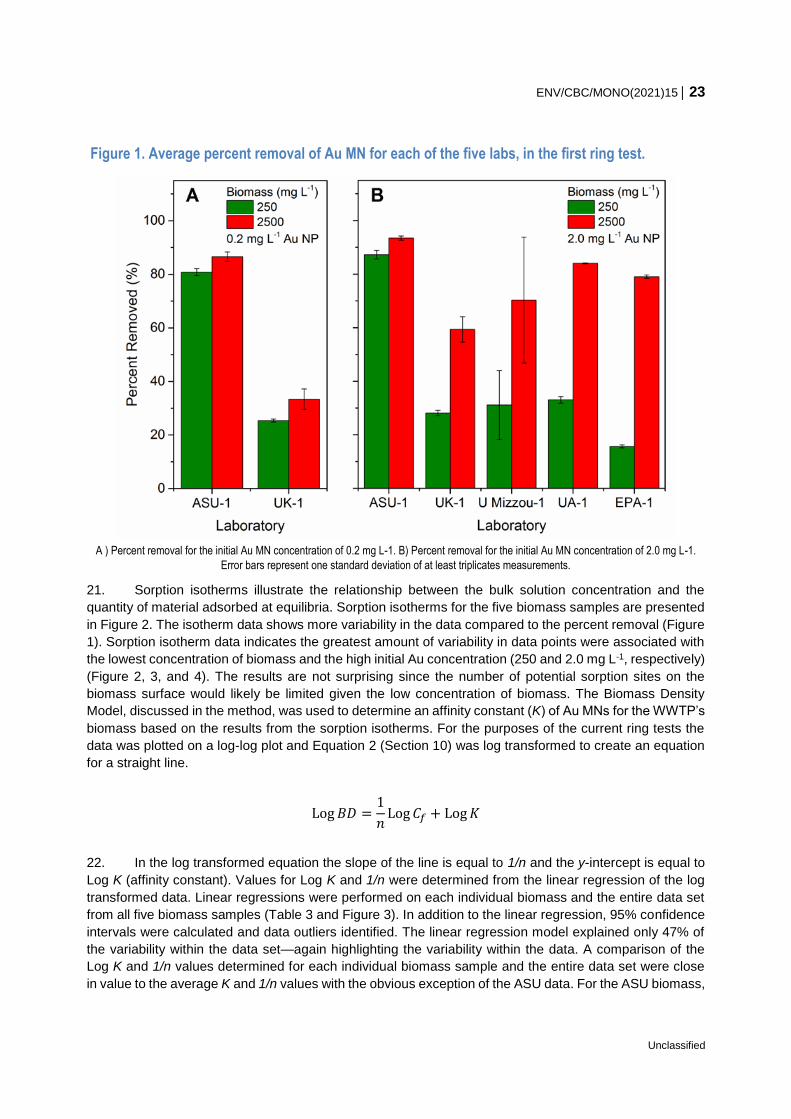
20. The percent removal of Au from the five different biomass samples is presented in Figure 1. As
previously discussed, only two of the five labs conducted experiments at the 0.2 mg L-1 concentration,
ASU, and UK. The percentage of Au removed was significantly different between the two labs at both
biomass concentrations, with the ASU sludge removing twice the amount of Au. For both ASU and UK,
the amount of biomass had negligible impact on the percent Au removal. This is surprising for the UK
biomass since even an order of magnitude increase in biomass concentration did not result in a
significant increase in the amount of Au removed from solution. At the 2.0 mg L-1 initial Au concentration,
apart from ASU, there was a marked increase in the amount of Au removed based on the biomass
concentration. For the UK biomass, the amount of Au removed nearly doubled with an increase in
biomass, in contrast to the lower concentration of Au. Among the five biomass samples, similar amounts
of Au were removed for the high biomass and high Au condition, with at least 60% of the Au being
removed from solution. The difference in the percent removal of Au from the low biomass-high Au
condition and the low Au concentration indicate that differences in biomass concentrations of samples
impact Au MN removal efficiency and affinity for the surface.
8 TEST RESULTS
ENV/CBC/MONO(2021)15 19
Unclassified
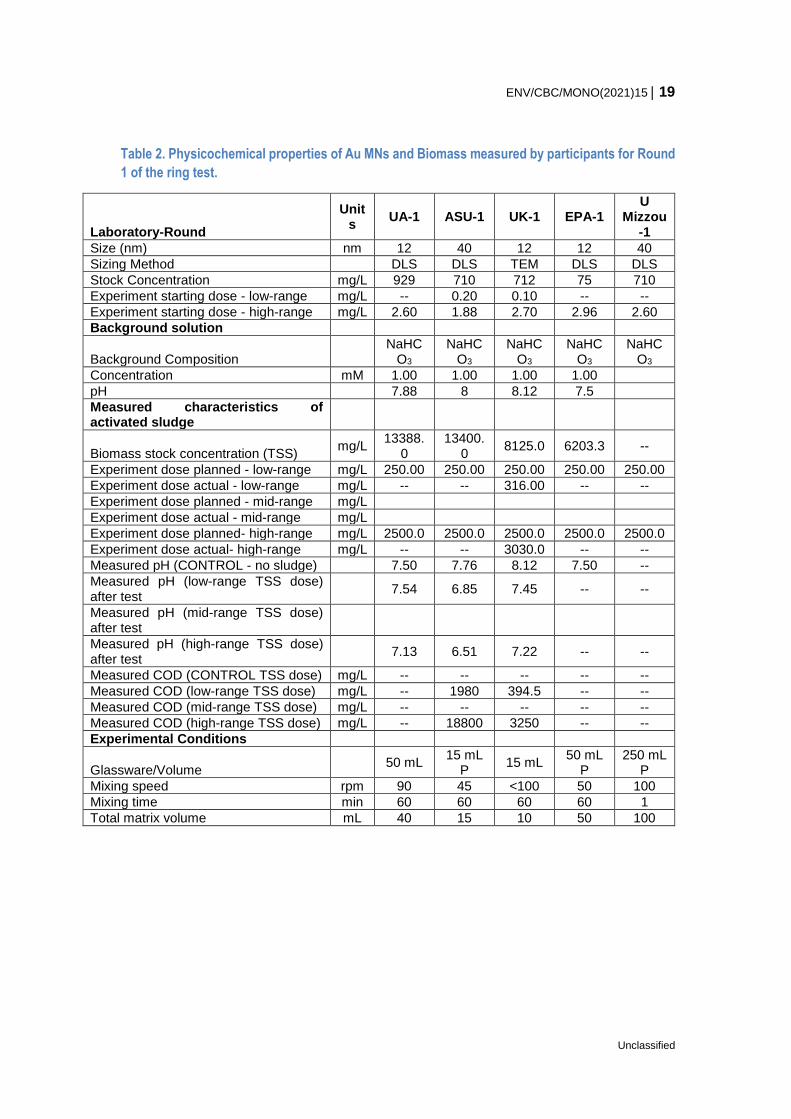
Table 2. Physicochemical properties of Au MNs and Biomass measured by participants for Round
1 of the ring test.
Laboratory-Round
Units
UA-1 ASU-1 UK-1 EPA-1 U
Mizzou-1
Size (nm) nm 12 40 12 12 40
Sizing Method DLS DLS TEM DLS DLS
Stock Concentration mg/L 929 710 712 75 710
Experiment starting dose - low-range mg/L -- 0.20 0.10 -- --
Experiment starting dose - high-range mg/L 2.60 1.88 2.70 2.96 2.60
Background solution
Background Composition NaHC
O3 NaHC
O3 NaHC
O3 NaHC
O3 NaHC
O3
Concentration mM 1.00 1.00 1.00 1.00
pH 7.88 8 8.12 7.5
Measured characteristics of activated sludge
Biomass stock concentration (TSS) mg/L
13388.0
13400.0
8125.0 6203.3 --
Experiment dose planned - low-range mg/L 250.00 250.00 250.00 250.00 250.00
Experiment dose actual - low-range mg/L -- -- 316.00 -- --
Experiment dose planned - mid-range mg/L
Experiment dose actual - mid-range mg/L
Experiment dose planned- high-range mg/L 2500.0 2500.0 2500.0 2500.0 2500.0
Experiment dose actual- high-range mg/L -- -- 3030.0 -- --
Measured pH (CONTROL - no sludge) 7.50 7.76 8.12 7.50 --
Measured pH (low-range TSS dose) after test
7.54 6.85 7.45 -- --
Measured pH (mid-range TSS dose) after test
Measured pH (high-range TSS dose) after test
7.13 6.51 7.22 -- --
Measured COD (CONTROL TSS dose) mg/L -- -- -- -- --
Measured COD (low-range TSS dose) mg/L -- 1980 394.5 -- --
Measured COD (mid-range TSS dose) mg/L -- -- -- -- --
Measured COD (high-range TSS dose) mg/L -- 18800 3250 -- --
Experimental Conditions
Glassware/Volume 50 mL
15 mL P
15 mL 50 mL
P 250 mL
P
Mixing speed rpm 90 45 <100 50 100
Mixing time min 60 60 60 60 1
Total matrix volume mL 40 15 10 50 100
20 ENV/CBC/MONO(2021)15
Unclassified
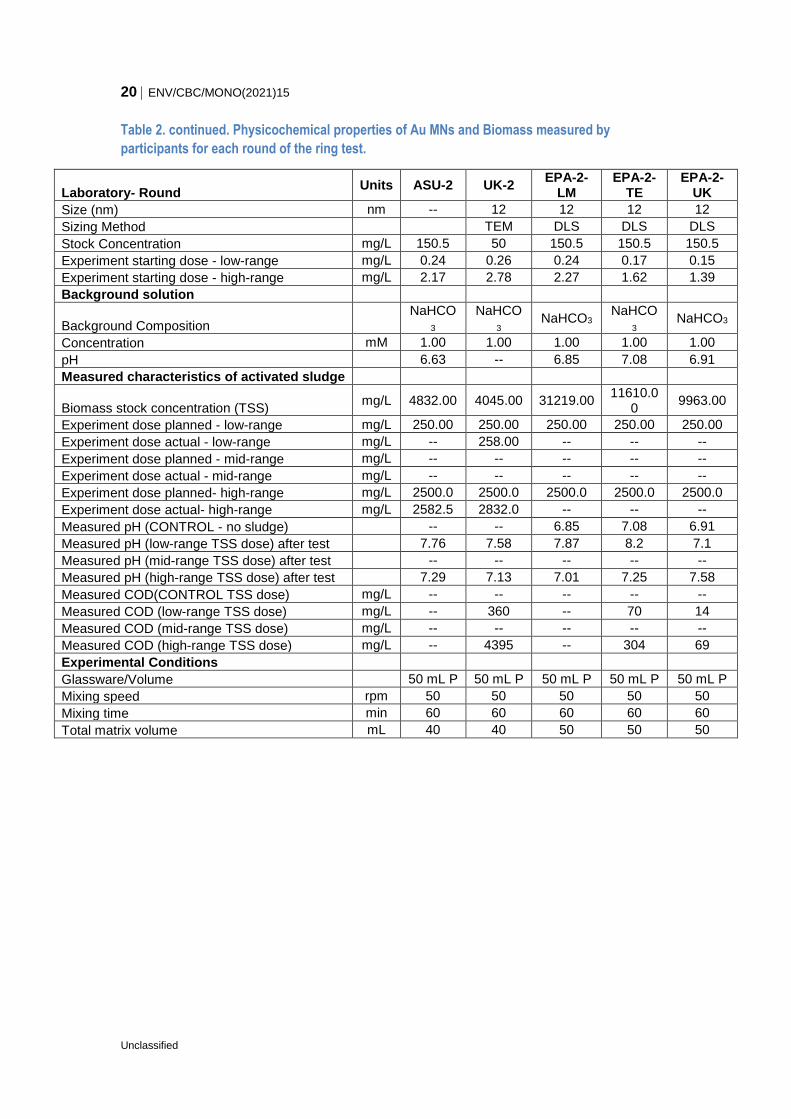
Table 2. continued. Physicochemical properties of Au MNs and Biomass measured by
participants for each round of the ring test.
Laboratory- Round Units ASU-2 UK-2
EPA-2-LM
EPA-2-TE
EPA-2-UK
Size (nm) nm -- 12 12 12 12
Sizing Method TEM DLS DLS DLS
Stock Concentration mg/L 150.5 50 150.5 150.5 150.5
Experiment starting dose - low-range mg/L 0.24 0.26 0.24 0.17 0.15
Experiment starting dose - high-range mg/L 2.17 2.78 2.27 1.62 1.39
Background solution
Background Composition NaHCO
3 NaHCO
3 NaHCO3
NaHCO
3 NaHCO3
Concentration mM 1.00 1.00 1.00 1.00 1.00
pH 6.63 -- 6.85 7.08 6.91
Measured characteristics of activated sludge
Biomass stock concentration (TSS) mg/L 4832.00 4045.00 31219.00
11610.00
9963.00
Experiment dose planned - low-range mg/L 250.00 250.00 250.00 250.00 250.00
Experiment dose actual - low-range mg/L -- 258.00 -- -- --
Experiment dose planned - mid-range mg/L -- -- -- -- --
Experiment dose actual - mid-range mg/L -- -- -- -- --
Experiment dose planned- high-range mg/L 2500.0 2500.0 2500.0 2500.0 2500.0
Experiment dose actual- high-range mg/L 2582.5 2832.0 -- -- --
Measured pH (CONTROL - no sludge) -- -- 6.85 7.08 6.91
Measured pH (low-range TSS dose) after test 7.76 7.58 7.87 8.2 7.1
Measured pH (mid-range TSS dose) after test -- -- -- -- --
Measured pH (high-range TSS dose) after test 7.29 7.13 7.01 7.25 7.58
Measured COD(CONTROL TSS dose) mg/L -- -- -- -- --
Measured COD (low-range TSS dose) mg/L -- 360 -- 70 14
Measured COD (mid-range TSS dose) mg/L -- -- -- -- --
Measured COD (high-range TSS dose) mg/L -- 4395 -- 304 69
Experimental Conditions
Glassware/Volume 50 mL P 50 mL P 50 mL P 50 mL P 50 mL P
Mixing speed rpm 50 50 50 50 50
Mixing time min 60 60 60 60 60
Total matrix volume mL 40 40 50 50 50
ENV/CBC/MONO(2021)15 21
Unclassified
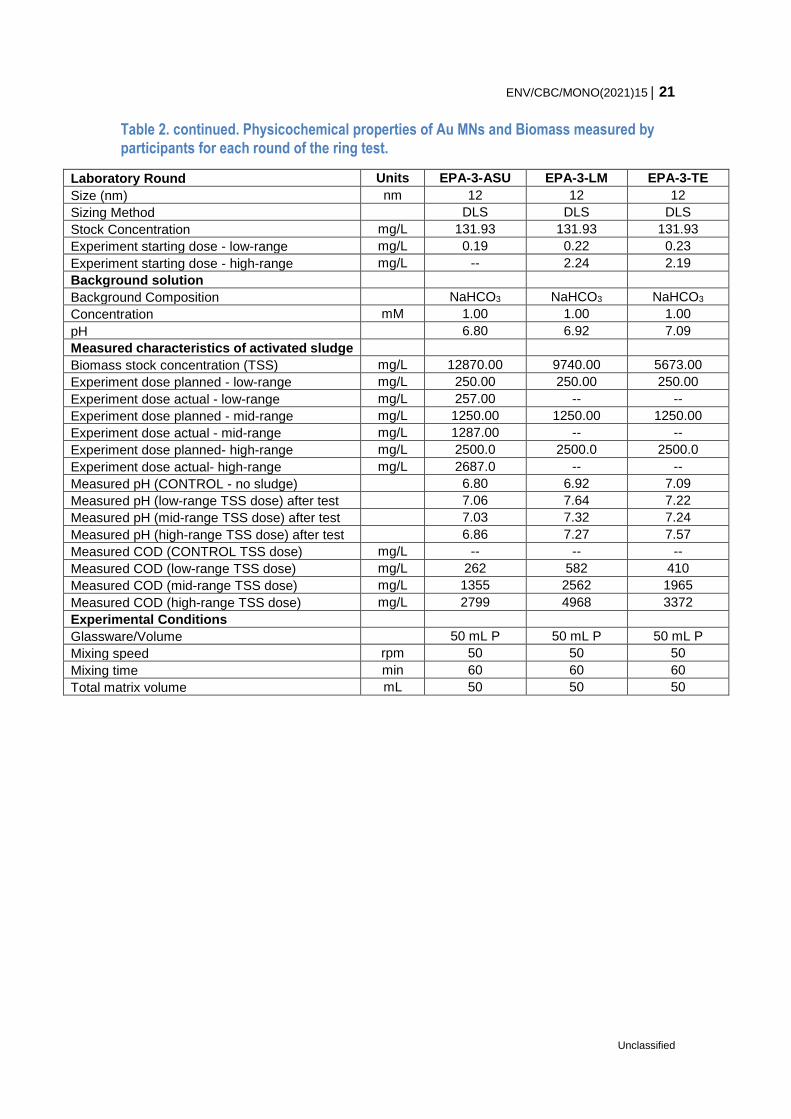
Table 2. continued. Physicochemical properties of Au MNs and Biomass measured by participants for each round of the ring test.
Laboratory Round Units EPA-3-ASU EPA-3-LM EPA-3-TE
Size (nm) nm 12 12 12
Sizing Method DLS DLS DLS
Stock Concentration mg/L 131.93 131.93 131.93
Experiment starting dose - low-range mg/L 0.19 0.22 0.23
Experiment starting dose - high-range mg/L -- 2.24 2.19
Background solution
Background Composition NaHCO3 NaHCO3 NaHCO3
Concentration mM 1.00 1.00 1.00
pH 6.80 6.92 7.09
Measured characteristics of activated sludge
Biomass stock concentration (TSS) mg/L 12870.00 9740.00 5673.00
Experiment dose planned - low-range mg/L 250.00 250.00 250.00
Experiment dose actual - low-range mg/L 257.00 -- --
Experiment dose planned - mid-range mg/L 1250.00 1250.00 1250.00
Experiment dose actual - mid-range mg/L 1287.00 -- --
Experiment dose planned- high-range mg/L 2500.0 2500.0 2500.0
Experiment dose actual- high-range mg/L 2687.0 -- --
Measured pH (CONTROL - no sludge) 6.80 6.92 7.09
Measured pH (low-range TSS dose) after test 7.06 7.64 7.22
Measured pH (mid-range TSS dose) after test 7.03 7.32 7.24
Measured pH (high-range TSS dose) after test 6.86 7.27 7.57
Measured COD (CONTROL TSS dose) mg/L -- -- --
Measured COD (low-range TSS dose) mg/L 262 582 410
Measured COD (mid-range TSS dose) mg/L 1355 2562 1965
Measured COD (high-range TSS dose) mg/L 2799 4968 3372
Experimental Conditions
Glassware/Volume 50 mL P 50 mL P 50 mL P
Mixing speed rpm 50 50 50
Mixing time min 60 60 60
Total matrix volume mL 50 50 50
22 ENV/CBC/MONO(2021)15
Unclassified
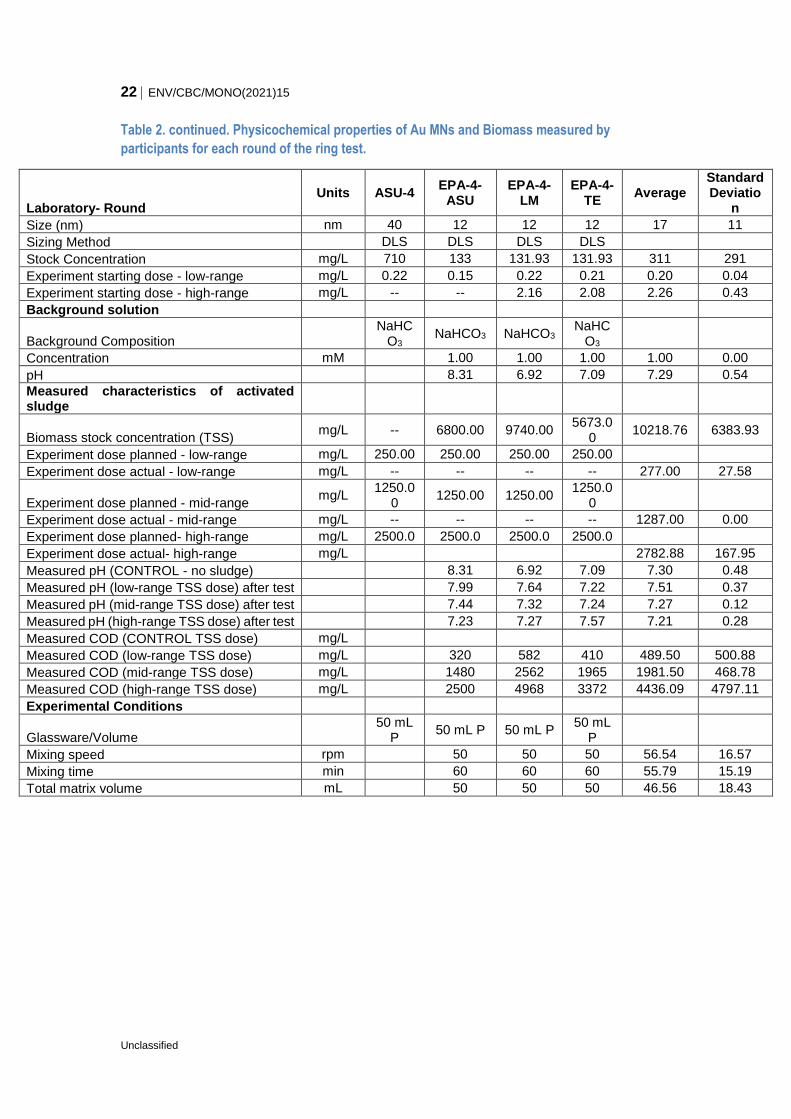
Table 2. continued. Physicochemical properties of Au MNs and Biomass measured by
participants for each round of the ring test.
Laboratory- Round Units ASU-4
EPA-4-ASU
EPA-4-LM
EPA-4-TE
Average Standard Deviatio
n
Size (nm) nm 40 12 12 12 17 11
Sizing Method DLS DLS DLS DLS
Stock Concentration mg/L 710 133 131.93 131.93 311 291
Experiment starting dose - low-range mg/L 0.22 0.15 0.22 0.21 0.20 0.04
Experiment starting dose - high-range mg/L -- -- 2.16 2.08 2.26 0.43
Background solution
Background Composition NaHC
O3 NaHCO3 NaHCO3
NaHCO3
Concentration mM 1.00 1.00 1.00 1.00 0.00
pH 8.31 6.92 7.09 7.29 0.54
Measured characteristics of activated sludge
Biomass stock concentration (TSS) mg/L -- 6800.00 9740.00
5673.00
10218.76 6383.93
Experiment dose planned - low-range mg/L 250.00 250.00 250.00 250.00
Experiment dose actual - low-range mg/L -- -- -- -- 277.00 27.58
Experiment dose planned - mid-range mg/L
1250.00
1250.00 1250.00 1250.0
0
Experiment dose actual - mid-range mg/L -- -- -- -- 1287.00 0.00
Experiment dose planned- high-range mg/L 2500.0 2500.0 2500.0 2500.0
Experiment dose actual- high-range mg/L 2782.88 167.95
Measured pH (CONTROL - no sludge) 8.31 6.92 7.09 7.30 0.48
Measured pH (low-range TSS dose) after test 7.99 7.64 7.22 7.51 0.37
Measured pH (mid-range TSS dose) after test 7.44 7.32 7.24 7.27 0.12
Measured pH (high-range TSS dose) after test 7.23 7.27 7.57 7.21 0.28
Measured COD (CONTROL TSS dose) mg/L
Measured COD (low-range TSS dose) mg/L 320 582 410 489.50 500.88
Measured COD (mid-range TSS dose) mg/L 1480 2562 1965 1981.50 468.78
Measured COD (high-range TSS dose) mg/L 2500 4968 3372 4436.09 4797.11
Experimental Conditions
Glassware/Volume 50 mL
P 50 mL P 50 mL P
50 mL P
Mixing speed rpm 50 50 50 56.54 16.57
Mixing time min 60 60 60 55.79 15.19
Total matrix volume mL 50 50 50 46.56 18.43
ENV/CBC/MONO(2021)15 23
Unclassified
Figure 1. Average percent removal of Au MN for each of the five labs, in the first ring test.
A ) Percent removal for the initial Au MN concentration of 0.2 mg L-1. B) Percent removal for the initial Au MN concentration of 2.0 mg L-1.
Error bars represent one standard deviation of at least triplicates measurements.
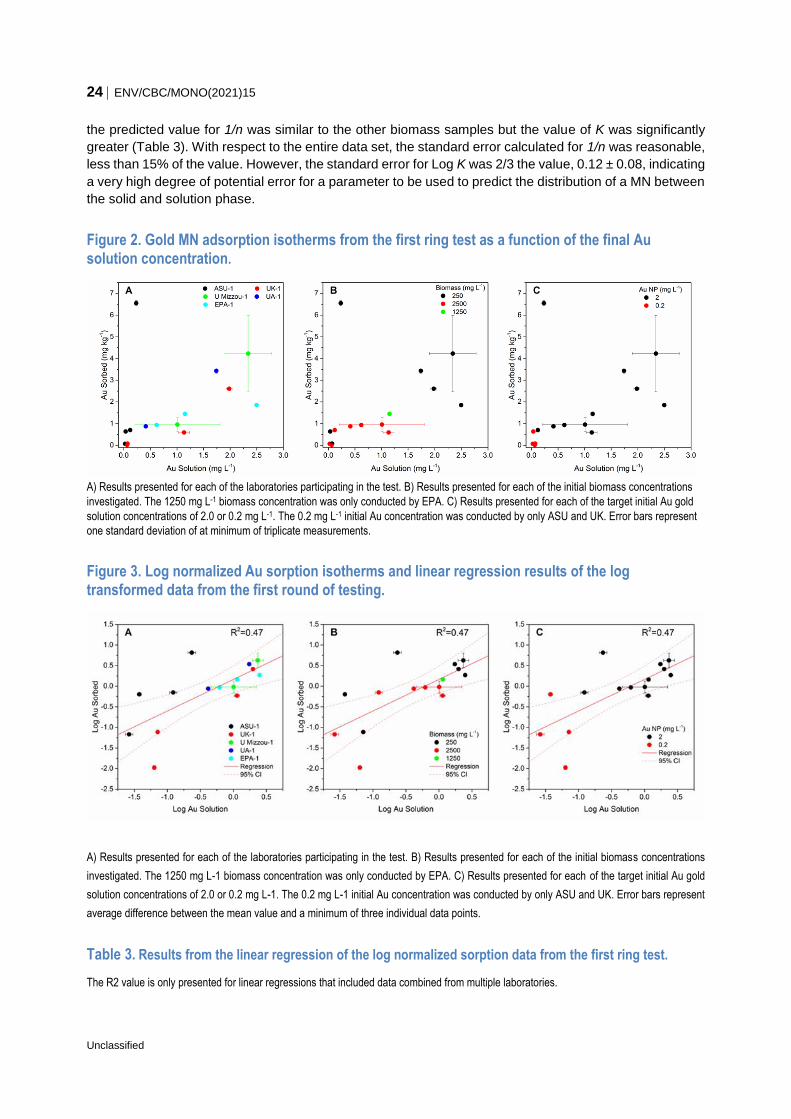
21. Sorption isotherms illustrate the relationship between the bulk solution concentration and the
quantity of material adsorbed at equilibria. Sorption isotherms for the five biomass samples are presented
in Figure 2. The isotherm data shows more variability in the data compared to the percent removal (Figure
1). Sorption isotherm data indicates the greatest amount of variability in data points were associated with
the lowest concentration of biomass and the high initial Au concentration (250 and 2.0 mg L-1, respectively)
(Figure 2, 3, and 4). The results are not surprising since the number of potential sorption sites on the
biomass surface would likely be limited given the low concentration of biomass. The Biomass Density
Model, discussed in the method, was used to determine an affinity constant (K) of Au MNs for the WWTP’s
biomass based on the results from the sorption isotherms. For the purposes of the current ring tests the
data was plotted on a log-log plot and Equation 2 (Section 10) was log transformed to create an equation
for a straight line.
Log 𝐵𝐷 =1
𝑛Log 𝐶𝑓 + Log 𝐾
22. In the log transformed equation the slope of the line is equal to 1/n and the y-intercept is equal to
Log K (affinity constant). Values for Log K and 1/n were determined from the linear regression of the log
transformed data. Linear regressions were performed on each individual biomass and the entire data set
from all five biomass samples (Table 3 and Figure 3). In addition to the linear regression, 95% confidence
intervals were calculated and data outliers identified. The linear regression model explained only 47% of
the variability within the data set—again highlighting the variability within the data. A comparison of the
Log K and 1/n values determined for each individual biomass sample and the entire data set were close
in value to the average K and 1/n values with the obvious exception of the ASU data. For the ASU biomass,
24 ENV/CBC/MONO(2021)15
Unclassified
the predicted value for 1/n was similar to the other biomass samples but the value of K was significantly
greater (Table 3). With respect to the entire data set, the standard error calculated for 1/n was reasonable,
less than 15% of the value. However, the standard error for Log K was 2/3 the value, 0.12 ± 0.08, indicating
a very high degree of potential error for a parameter to be used to predict the distribution of a MN between
the solid and solution phase.
Figure 2. Gold MN adsorption isotherms from the first ring test as a function of the final Au solution concentration.
A) Results presented for each of the laboratories participating in the test. B) Results presented for each of the initial biomass concentrations
investigated. The 1250 mg L-1 biomass concentration was only conducted by EPA. C) Results presented for each of the target initial Au gold
solution concentrations of 2.0 or 0.2 mg L-1. The 0.2 mg L-1 initial Au concentration was conducted by only ASU and UK. Error bars represent
one standard deviation of at minimum of triplicate measurements.
Figure 3. Log normalized Au sorption isotherms and linear regression results of the log transformed data from the first round of testing.
A) Results presented for each of the laboratories participating in the test. B) Results presented for each of the initial biomass concentrations
investigated. The 1250 mg L-1 biomass concentration was only conducted by EPA. C) Results presented for each of the target initial Au gold
solution concentrations of 2.0 or 0.2 mg L-1. The 0.2 mg L-1 initial Au concentration was conducted by only ASU and UK. Error bars represent
average difference between the mean value and a minimum of three individual data points.
Table 3. Results from the linear regression of the log normalized sorption data from the first ring test.
The R2 value is only presented for linear regressions that included data combined from multiple laboratories.
ENV/CBC/MONO(2021)15 25
Unclassified
Lab Slope Intercept
K R2 1/n Std. Error Log K Std. Error
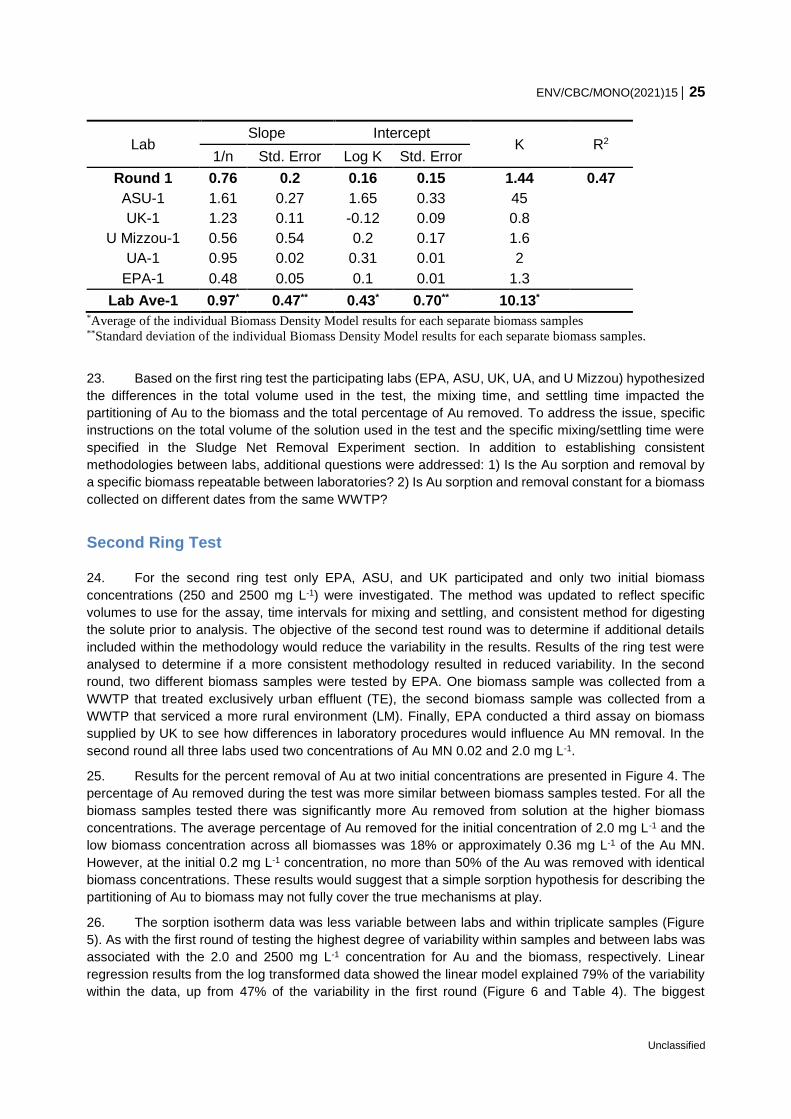
Round 1 0.76 0.2 0.16 0.15 1.44 0.47
ASU-1 1.61 0.27 1.65 0.33 45
UK-1 1.23 0.11 -0.12 0.09 0.8
U Mizzou-1 0.56 0.54 0.2 0.17 1.6
UA-1 0.95 0.02 0.31 0.01 2
EPA-1 0.48 0.05 0.1 0.01 1.3
Lab Ave-1 0.97* 0.47** 0.43* 0.70** 10.13*
*Average of the individual Biomass Density Model results for each separate biomass samples **Standard deviation of the individual Biomass Density Model results for each separate biomass samples.
23. Based on the first ring test the participating labs (EPA, ASU, UK, UA, and U Mizzou) hypothesized
the differences in the total volume used in the test, the mixing time, and settling time impacted the
partitioning of Au to the biomass and the total percentage of Au removed. To address the issue, specific
instructions on the total volume of the solution used in the test and the specific mixing/settling time were
specified in the Sludge Net Removal Experiment section. In addition to establishing consistent
methodologies between labs, additional questions were addressed: 1) Is the Au sorption and removal by
a specific biomass repeatable between laboratories? 2) Is Au sorption and removal constant for a biomass
collected on different dates from the same WWTP?
Second Ring Test
24. For the second ring test only EPA, ASU, and UK participated and only two initial biomass
concentrations (250 and 2500 mg L-1) were investigated. The method was updated to reflect specific
volumes to use for the assay, time intervals for mixing and settling, and consistent method for digesting
the solute prior to analysis. The objective of the second test round was to determine if additional details
included within the methodology would reduce the variability in the results. Results of the ring test were
analysed to determine if a more consistent methodology resulted in reduced variability. In the second
round, two different biomass samples were tested by EPA. One biomass sample was collected from a
WWTP that treated exclusively urban effluent (TE), the second biomass sample was collected from a
WWTP that serviced a more rural environment (LM). Finally, EPA conducted a third assay on biomass
supplied by UK to see how differences in laboratory procedures would influence Au MN removal. In the
second round all three labs used two concentrations of Au MN 0.02 and 2.0 mg L-1.
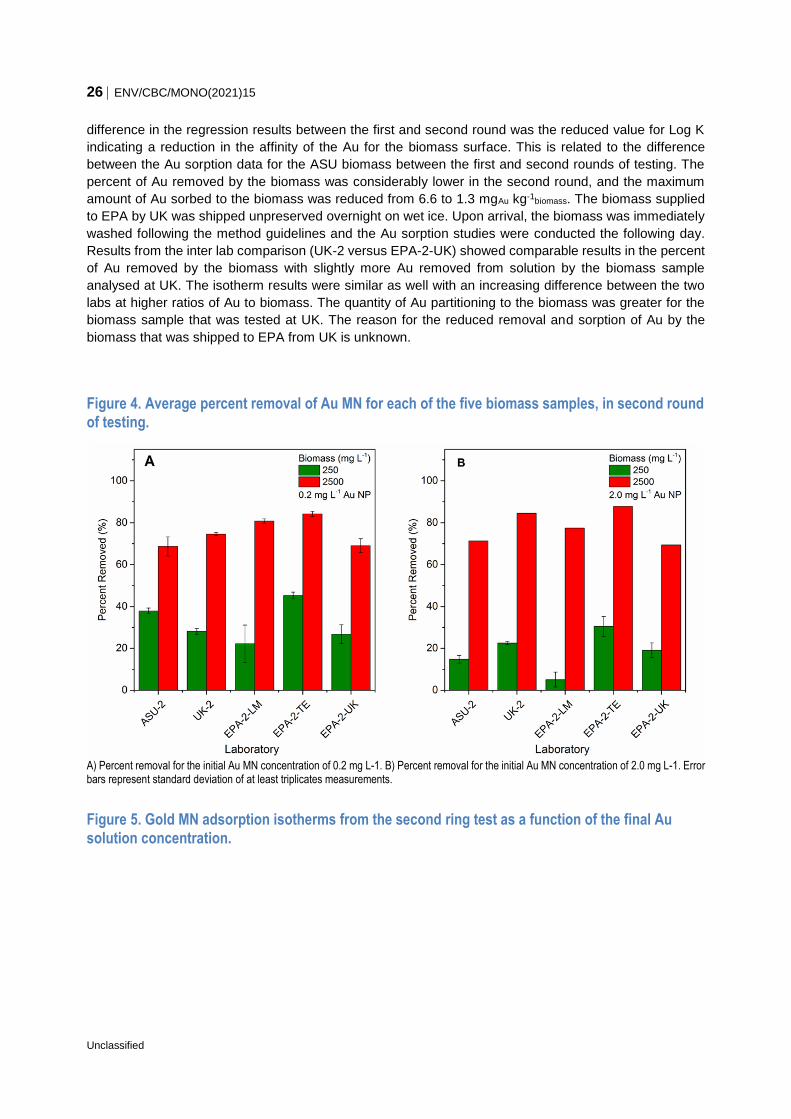
25. Results for the percent removal of Au at two initial concentrations are presented in Figure 4. The
percentage of Au removed during the test was more similar between biomass samples tested. For all the
biomass samples tested there was significantly more Au removed from solution at the higher biomass
concentrations. The average percentage of Au removed for the initial concentration of 2.0 mg L-1 and the
low biomass concentration across all biomasses was 18% or approximately 0.36 mg L-1 of the Au MN.
However, at the initial 0.2 mg L-1 concentration, no more than 50% of the Au was removed with identical
biomass concentrations. These results would suggest that a simple sorption hypothesis for describing the
partitioning of Au to biomass may not fully cover the true mechanisms at play.
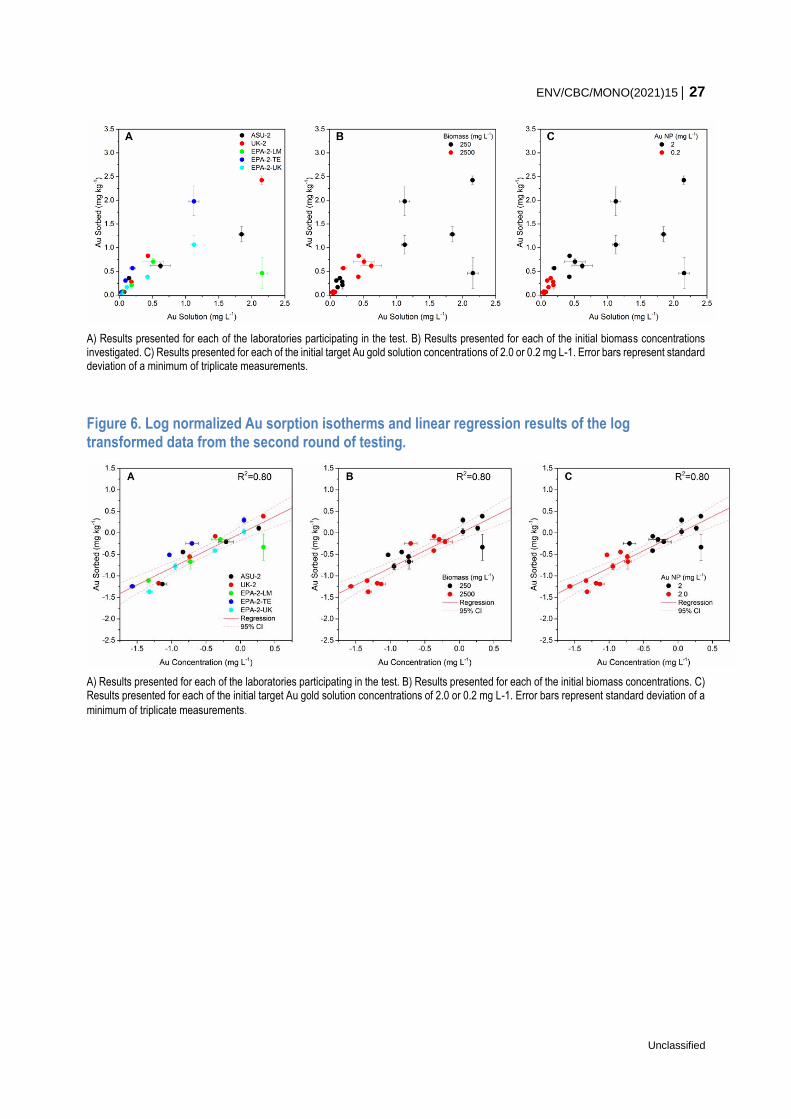
26. The sorption isotherm data was less variable between labs and within triplicate samples (Figure
5). As with the first round of testing the highest degree of variability within samples and between labs was
associated with the 2.0 and 2500 mg L-1 concentration for Au and the biomass, respectively. Linear
regression results from the log transformed data showed the linear model explained 79% of the variability
within the data, up from 47% of the variability in the first round (Figure 6 and Table 4). The biggest
26 ENV/CBC/MONO(2021)15
Unclassified
difference in the regression results between the first and second round was the reduced value for Log K
indicating a reduction in the affinity of the Au for the biomass surface. This is related to the difference
between the Au sorption data for the ASU biomass between the first and second rounds of testing. The
percent of Au removed by the biomass was considerably lower in the second round, and the maximum
amount of Au sorbed to the biomass was reduced from 6.6 to 1.3 mgAu kg-1biomass. The biomass supplied
to EPA by UK was shipped unpreserved overnight on wet ice. Upon arrival, the biomass was immediately
washed following the method guidelines and the Au sorption studies were conducted the following day.
Results from the inter lab comparison (UK-2 versus EPA-2-UK) showed comparable results in the percent
of Au removed by the biomass with slightly more Au removed from solution by the biomass sample
analysed at UK. The isotherm results were similar as well with an increasing difference between the two
labs at higher ratios of Au to biomass. The quantity of Au partitioning to the biomass was greater for the
biomass sample that was tested at UK. The reason for the reduced removal and sorption of Au by the
biomass that was shipped to EPA from UK is unknown.
Figure 4. Average percent removal of Au MN for each of the five biomass samples, in second round of testing.
A) Percent removal for the initial Au MN concentration of 0.2 mg L-1. B) Percent removal for the initial Au MN concentration of 2.0 mg L-1. Error bars represent standard deviation of at least triplicates measurements.
Figure 5. Gold MN adsorption isotherms from the second ring test as a function of the final Au
solution concentration.
ENV/CBC/MONO(2021)15 27
Unclassified
A) Results presented for each of the laboratories participating in the test. B) Results presented for each of the initial biomass concentrations investigated. C) Results presented for each of the initial target Au gold solution concentrations of 2.0 or 0.2 mg L-1. Error bars represent standard deviation of a minimum of triplicate measurements.
Figure 6. Log normalized Au sorption isotherms and linear regression results of the log transformed data from the second round of testing.
A) Results presented for each of the laboratories participating in the test. B) Results presented for each of the initial biomass concentrations. C) Results presented for each of the initial target Au gold solution concentrations of 2.0 or 0.2 mg L-1. Error bars represent standard deviation of a
minimum of triplicate measurements.
28 ENV/CBC/MONO(2021)15
Unclassified
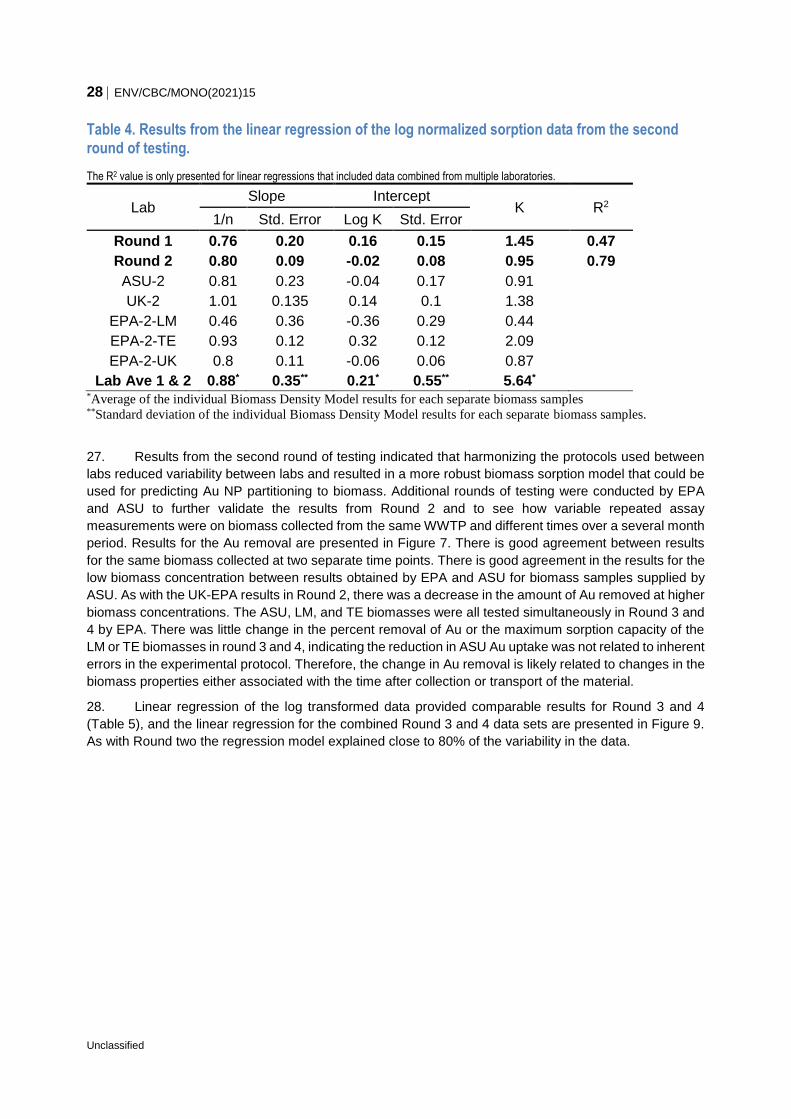
Table 4. Results from the linear regression of the log normalized sorption data from the second round of testing.
The R2 value is only presented for linear regressions that included data combined from multiple laboratories.
Lab Slope Intercept
K R2 1/n Std. Error Log K Std. Error
Round 1 0.76 0.20 0.16 0.15 1.45 0.47
Round 2 0.80 0.09 -0.02 0.08 0.95 0.79
ASU-2 0.81 0.23 -0.04 0.17 0.91
UK-2 1.01 0.135 0.14 0.1 1.38
EPA-2-LM 0.46 0.36 -0.36 0.29 0.44
EPA-2-TE 0.93 0.12 0.32 0.12 2.09
EPA-2-UK 0.8 0.11 -0.06 0.06 0.87
Lab Ave 1 & 2 0.88* 0.35** 0.21* 0.55** 5.64* *Average of the individual Biomass Density Model results for each separate biomass samples **Standard deviation of the individual Biomass Density Model results for each separate biomass samples.
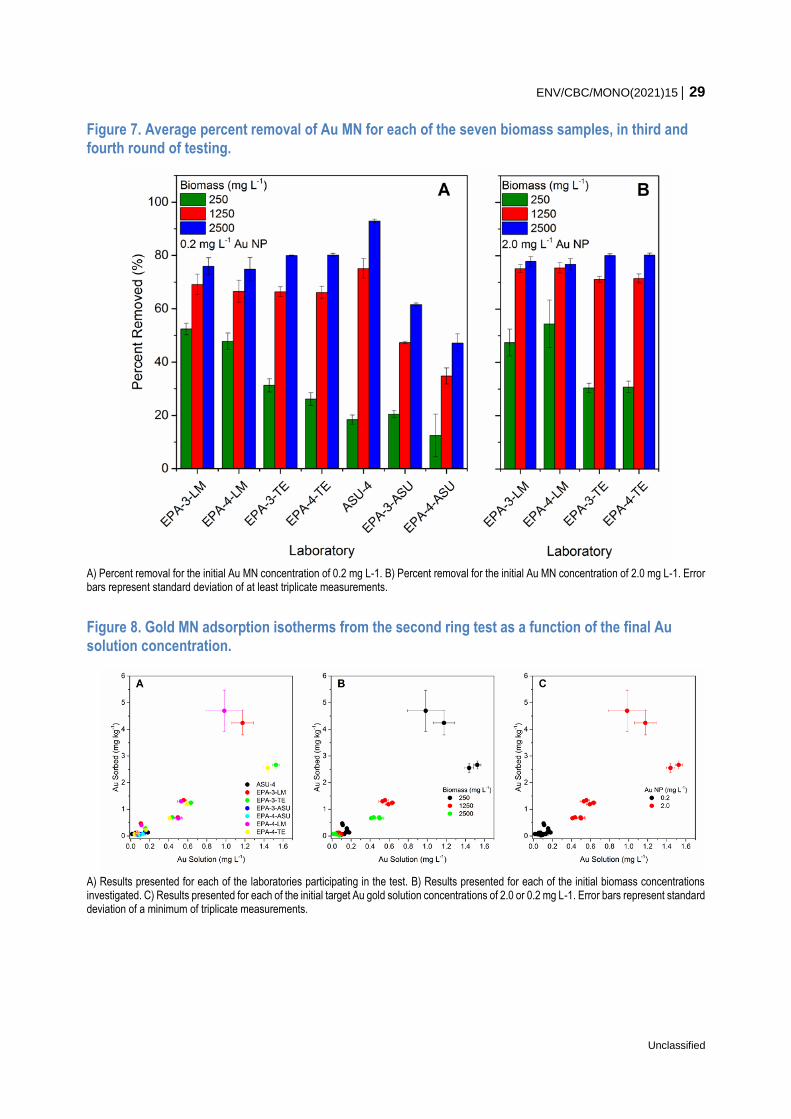
27. Results from the second round of testing indicated that harmonizing the protocols used between
labs reduced variability between labs and resulted in a more robust biomass sorption model that could be
used for predicting Au NP partitioning to biomass. Additional rounds of testing were conducted by EPA
and ASU to further validate the results from Round 2 and to see how variable repeated assay
measurements were on biomass collected from the same WWTP and different times over a several month
period. Results for the Au removal are presented in Figure 7. There is good agreement between results
for the same biomass collected at two separate time points. There is good agreement in the results for the
low biomass concentration between results obtained by EPA and ASU for biomass samples supplied by
ASU. As with the UK-EPA results in Round 2, there was a decrease in the amount of Au removed at higher
biomass concentrations. The ASU, LM, and TE biomasses were all tested simultaneously in Round 3 and
4 by EPA. There was little change in the percent removal of Au or the maximum sorption capacity of the
LM or TE biomasses in round 3 and 4, indicating the reduction in ASU Au uptake was not related to inherent
errors in the experimental protocol. Therefore, the change in Au removal is likely related to changes in the
biomass properties either associated with the time after collection or transport of the material.
28. Linear regression of the log transformed data provided comparable results for Round 3 and 4
(Table 5), and the linear regression for the combined Round 3 and 4 data sets are presented in Figure 9.
As with Round two the regression model explained close to 80% of the variability in the data.
ENV/CBC/MONO(2021)15 29
Unclassified
Figure 7. Average percent removal of Au MN for each of the seven biomass samples, in third and fourth round of testing.
A) Percent removal for the initial Au MN concentration of 0.2 mg L-1. B) Percent removal for the initial Au MN concentration of 2.0 mg L-1. Error bars represent standard deviation of at least triplicate measurements.
Figure 8. Gold MN adsorption isotherms from the second ring test as a function of the final Au solution concentration.
A) Results presented for each of the laboratories participating in the test. B) Results presented for each of the initial biomass concentrations investigated. C) Results presented for each of the initial target Au gold solution concentrations of 2.0 or 0.2 mg L-1. Error bars represent standard deviation of a minimum of triplicate measurements.
30 ENV/CBC/MONO(2021)15
Unclassified
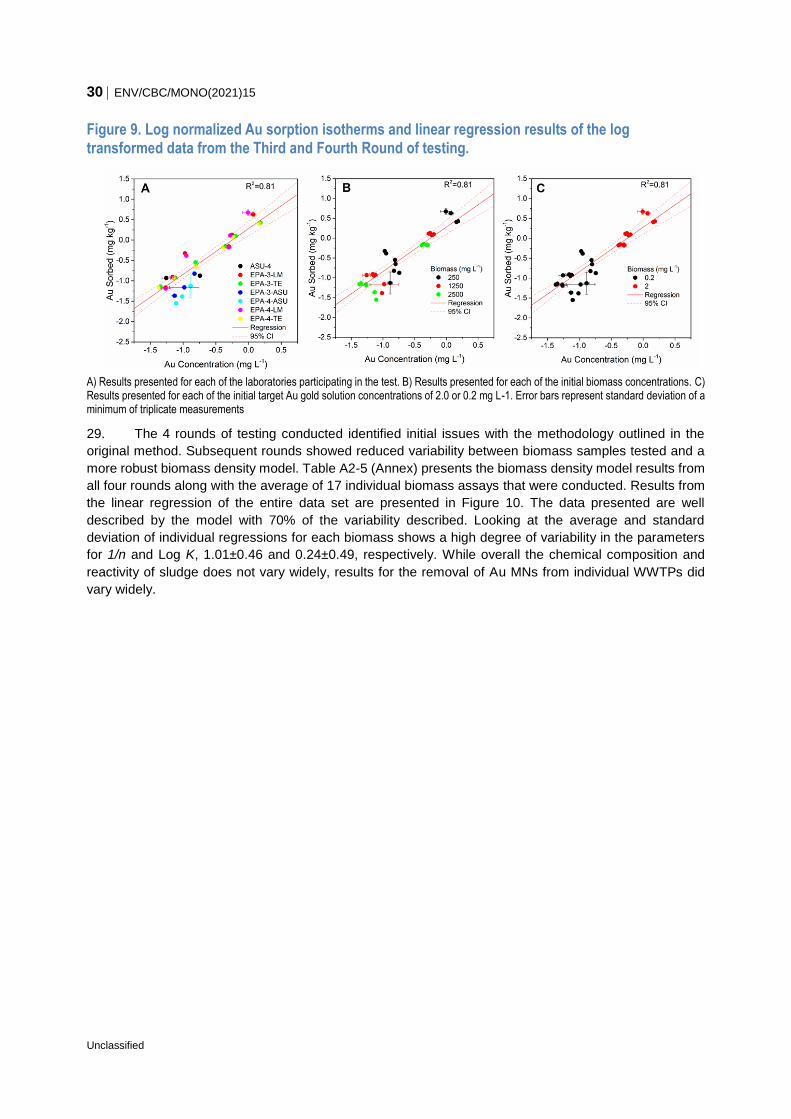
Figure 9. Log normalized Au sorption isotherms and linear regression results of the log transformed data from the Third and Fourth Round of testing.
A) Results presented for each of the laboratories participating in the test. B) Results presented for each of the initial biomass concentrations. C) Results presented for each of the initial target Au gold solution concentrations of 2.0 or 0.2 mg L-1. Error bars represent standard deviation of a minimum of triplicate measurements
29. The 4 rounds of testing conducted identified initial issues with the methodology outlined in the
original method. Subsequent rounds showed reduced variability between biomass samples tested and a
more robust biomass density model. Table A2-5 (Annex) presents the biomass density model results from
all four rounds along with the average of 17 individual biomass assays that were conducted. Results from
the linear regression of the entire data set are presented in Figure 10. The data presented are well
described by the model with 70% of the variability described. Looking at the average and standard
deviation of individual regressions for each biomass shows a high degree of variability in the parameters
for 1/n and Log K, 1.01±0.46 and 0.24±0.49, respectively. While overall the chemical composition and
reactivity of sludge does not vary widely, results for the removal of Au MNs from individual WWTPs did
vary widely.
ENV/CBC/MONO(2021)15 31
Unclassified
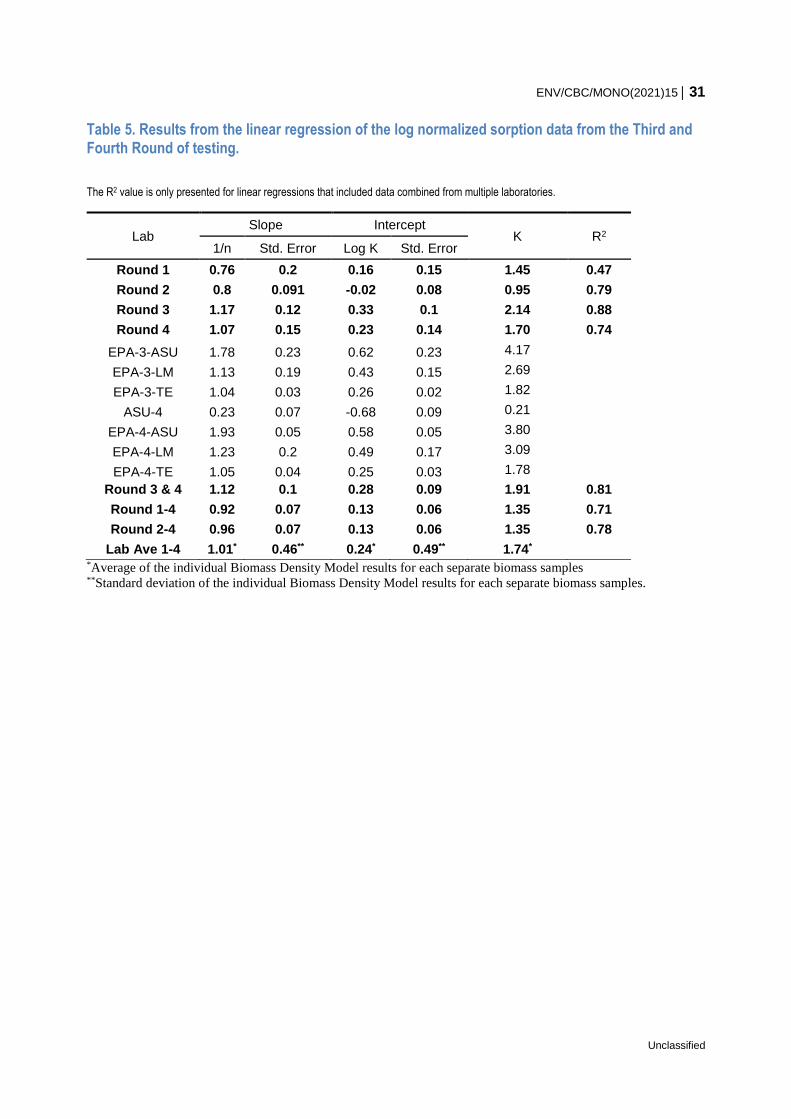
Table 5. Results from the linear regression of the log normalized sorption data from the Third and Fourth Round of testing.
The R2 value is only presented for linear regressions that included data combined from multiple laboratories.
Lab Slope Intercept
K R2 1/n Std. Error Log K Std. Error
Round 1 0.76 0.2 0.16 0.15 1.45 0.47
Round 2 0.8 0.091 -0.02 0.08 0.95 0.79
Round 3 1.17 0.12 0.33 0.1 2.14 0.88
Round 4 1.07 0.15 0.23 0.14 1.70 0.74
EPA-3-ASU 1.78 0.23 0.62 0.23 4.17
EPA-3-LM 1.13 0.19 0.43 0.15 2.69
EPA-3-TE 1.04 0.03 0.26 0.02 1.82
ASU-4 0.23 0.07 -0.68 0.09 0.21
EPA-4-ASU 1.93 0.05 0.58 0.05 3.80
EPA-4-LM 1.23 0.2 0.49 0.17 3.09
EPA-4-TE 1.05 0.04 0.25 0.03 1.78 Round 3 & 4 1.12 0.1 0.28 0.09 1.91 0.81
Round 1-4 0.92 0.07 0.13 0.06 1.35 0.71
Round 2-4 0.96 0.07 0.13 0.06 1.35 0.78
Lab Ave 1-4 1.01* 0.46** 0.24* 0.49** 1.74* *Average of the individual Biomass Density Model results for each separate biomass samples **Standard deviation of the individual Biomass Density Model results for each separate biomass samples.
32 ENV/CBC/MONO(2021)15
Unclassified
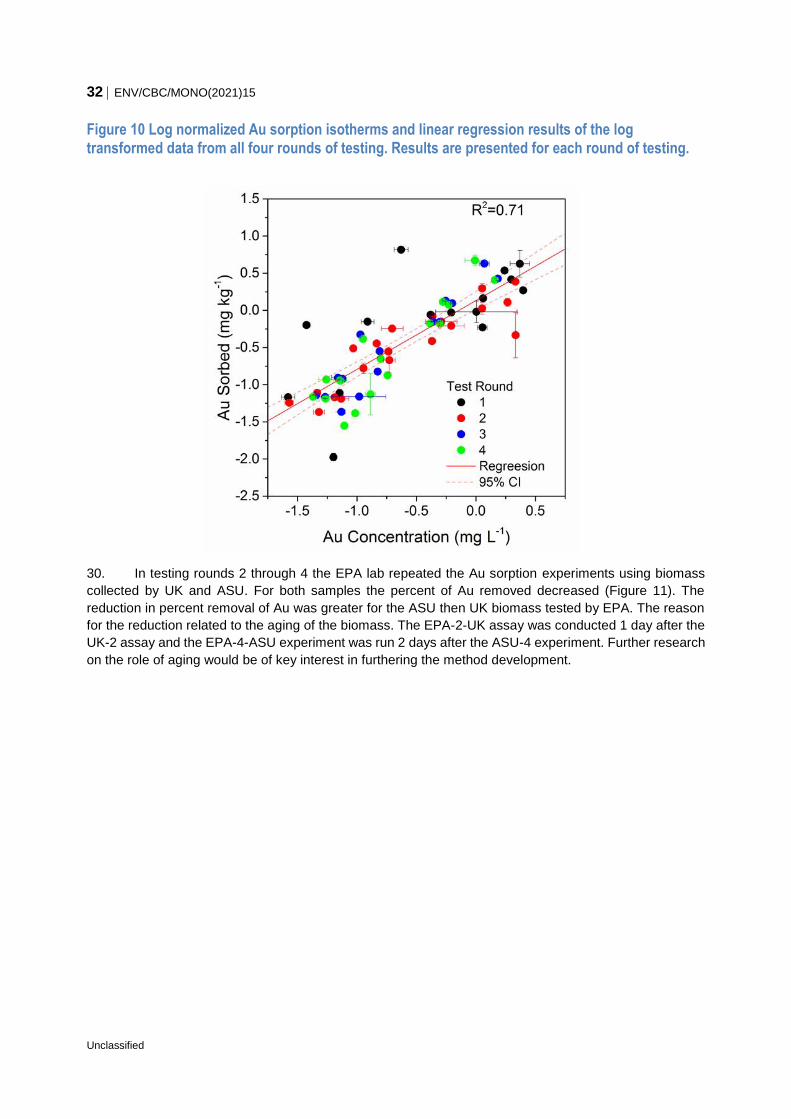
Figure 10 Log normalized Au sorption isotherms and linear regression results of the log transformed data from all four rounds of testing. Results are presented for each round of testing.
30. In testing rounds 2 through 4 the EPA lab repeated the Au sorption experiments using biomass
collected by UK and ASU. For both samples the percent of Au removed decreased (Figure 11). The
reduction in percent removal of Au was greater for the ASU then UK biomass tested by EPA. The reason
for the reduction related to the aging of the biomass. The EPA-2-UK assay was conducted 1 day after the
UK-2 assay and the EPA-4-ASU experiment was run 2 days after the ASU-4 experiment. Further research
on the role of aging would be of key interest in furthering the method development.
ENV/CBC/MONO(2021)15 33
Unclassified
Figure 11. Average percent removal of Au MN for replicate biomass samples analysed by two
laboratories.
A) Percent removal for the initial Au MN concentration of 0.2 mg L-1. B) Percent removal for the initial Au MN concentration of 2.0 mg L-1.
Error bars represent standard deviation of at least triplicate measurements.
34 ENV/CBC/MONO(2021)15
Unclassified
31. Initial results from the ring test after the first round showed a high degree of variability between
participating laboratories in the study. A review of the experimental parameters used by each lab revealed
a wide discrepancy in how the method was conducted. A subsequent update to the method and ring test
by a smaller test group showed reduced variability in the data between labs indicating the primary source
of variability in the first round was method related. Subsequent rounds of testing, and inter-laboratory
comparisons, and a time series analysis of two biomass samples demonstrated the method was robust,
and that variations in the composition and chemistry of the biomass did not result in large differences
between labs. However, inter-laboratory comparisons using the same biomass always showed reduced
affinity of the Au for the biomass that was transported to another laboratory. Every attempt was made to
ensure biomass samples remained cold (> 4oC) during transport and experiments were conducted at both
laboratories within 48 h of collection. The immediate reason for the difference in behaviour is unknown.
However, it is suspected the age of the biomass suspension may be related.
32. Based on the results of the four rounds of testing the test participants believe the results are
promising and the method will be an effective method for screening the potential for MN to be removed
during water treatment. The test participants would recommend the lowest biomass level (250 mg/L) be
dropped from the test. The method should consider higher biomass concentrations that are more
representative of WWTPs. Additionally, the test participants would recommend additional testing on other
MN to ensure the method is robust for a wide variety of materials. However, the participants recognize that
working with more soluble/reactive materials (Ag, CeO2, transition metal oxides) or hydrophobic material
(CNT and graphene) will introduce additional variables for consideration.
33. In addition to estimating removal of MN during wastewater treatment, the test has the potential to
be used to quantify the removal of micro or nano-plastics that may be present. The concepts discussed
and presented would allow for a broader array of materials to be considered. The main difference between
using the method to estimate removal on inorganic MN and plastics the would be the analytical method
chosen to quantify the amount of material remaining in solution after settling of the biomass.
9 STUDY SUMMARY AND
CONCLUSIONS
ENV/CBC/MONO(2021)15 35
Unclassified
Definitions and units
34. Definitions and units are set out in Appendix 1.
Principle of the Test
35. This t e s t describes a procedure to estimate the net removal (NR) of manufactured
nanomaterials (MN). The range of concentrations investigated for the Rinsed Activated Sludge (RAS) and
the MN of interest is up to the user to define. It is suggested that at a minimum two RAS and two MN
concentrations are investigated whose concentrations would differ by an order of magnitude. The method
described below uses sample biomass and MN concentrations. The test is designed to quantify the extent
to which a MN distributes between two phases of the MN, activated sludge and water in wastewater
treatment systems. Most WWTPs have hydraulic retention times longer than this period necessary to reach
steady-state conditions. Therefore, a fixed percentage removal of MNs under a given set of conditions
(Mixed liquor suspended solids [MLSS] level (i), temperature, mixing time) calculated as follows:
𝑁𝑒𝑡 𝑅𝑒𝑚𝑜𝑣𝑎𝑙 (𝑁𝑅𝑖) = [1 −𝐶𝑓
𝐶0⁄ ] × 100%
Equation 1
where Cf, is the concentration of MNi remaining in the supernatant at the end of a batch test with a single MLSS level (mg/L), and C0 is the initial MN concentration.
36. Experiments conducted at different MLSS levels (i) can be used to fit removal data to a simple
biomass density (BD) exponential model shown in equation 2, where BD is the MN concentration
associated with the biosolids (e.g., mg MN / g TSS), K is an empirical value related to the affinity of the
MN to undergo hetero-aggregation with the biomass., and 1/n is a fitted constant specific to temperature,
mixing condition, etc.). This model can be used to estimate removals over a range of MLSS concentrations.
𝐵𝐷 = 𝐾 𝐶𝑓1/𝑛
Equation 2
10 ANNEX- DETAILED TEST
PROCEDURE APPLIED IN THE
STUDY
36 ENV/CBC/MONO(2021)15
Unclassified
37. Preliminary knowledge of the dispersion stability of the test MN is useful before undertaking a
sludge association test. If the test chemical will not maintain a stable dispersion, it is possible the material
will not be associate/interact with the sludge, and instead deposit along the bottom and surfaces of the
container. Dispersion is affected by characteristics of the media, requiring consideration of characteristics
of influent. Additional details on generating a stable MN suspension are provided in the section Preparing
Nanoparticle Suspension. A stable suspension in the context of the current method would be no detectable
aggregation or settling for the time period of the test (4h). Generating a stable suspension of MN is critical
for the test. If the MN does not form a stable suspension the current test as described would not be
suitable. The current method determines partitioning of the MN to the biomass by measuring the quantity
of on MN remaining in solution after settling and dividing that quantity by the initial concentration of MN
(Equation 1). If there is uncertainty in the initial MN concentration due to an unstable MN suspension it will
not be possible to determine with a high degree of accuracy the quantity of MN removed. OECD TG 318
should be consulted to determine if the test MN forms a stable suspension. If the MN utilized does not
form a stable suspension a complete mass balance of the system is required which would include
quantifying the MN in solution and in the settled solid phase. The mass of MM in solution and in the solid
phase would be used to calculate Co in Equation 1 using the following equation
𝐶0 = 𝐶𝑓 + (𝑞𝑓 + 𝑇𝑆𝑆)
Equation 3
Where Cf is the concentration of MN (ug L-1), qf is the solid phase concentration (g mg-1), and TSS is the
total suspended solids (mg L-1)
38. If the MN has functional groups that may biodegrade or undergo other transformation processes
these should be considered before beginning the test. If the submitter considers that during processing,
formulation, use, or release the MN will undergo transformation before arriving at a wastewater treatment
plant, it is advised to consider testing of the most relevant MN species, which may not be the original MN
as manufactured. The test method is based on the procedures developed during the work described in the
references (Ganesh, R., et al., 2010; Kiser, M.A., et al., 2010, 2012; Pagga, U. and K. Taeger, 1994;
USEPA, 1998; Hyung, H. and J.H. Kim, 2009).
39. The key parameters introduced above should be chosen to represent a wide range of biomass
concentrations that may be present within a WWTP. The ionic strength of the system and pH is buffered
with 1 mM NaCO3 to provide a consistent background between varying MLSS obtained at local sewage
treatment plants. The goal of this testing is to provide sufficient information to help predict the removal of
a test MNs to sludge in wastewater treatment through association with sludge.
40. A critical component of the test is the ability to quantify the MN remaining in solution after settling
of the biomass. The method used to quantify the MN remaining in solution will be based upon the MN
tested and the desired results. If the total elemental abundance of a MN remaining in solution after
partitioning is of interest, the sample may be chemically digested and analysed by the appropriate
technique. For inorganic MN (metals, metal oxides, or quantum dots) an acid assisted digestion may be
appropriate for quantification using an emission or mass-based spectrometry. If physicochemical
properties on the particles remaining in solution is of interest (particle size, aggregation state, particle
concentration, dissolution extent) preservation techniques should be employed to preserve the suspension
prior to analysis by the technique of interest.
Apparatus and Chemical Reagents
41. Standard laboratory equipment, including but not limited to:
ENV/CBC/MONO(2021)15 37
Unclassified
a. 50 mL graduated plastic centrifuge tubes and racks (testing metal and metal oxide MNs).
b. 40mL borosilicate glass vails and racks (for testing carbonaceous nanomaterials).
c. 1-L Bottles.
d. 2-L glass volumetric flask.
e. Centrifuge.
f. Magnetic stir bar and plate.
g. Oven/Muffle Furnace capable of reaching 105o C.
h. Balance 0.01 mg resolution.
i. Glass fiber filter, nominal pore size 1.5 micron (m) (Whatman #8) and filtration setup.
j. pH probe.
k. Chemical oxygen demand test kit.
l. Hotplate/Block for sample digestion capable of maintaining 95o C.
m. Nitrocellulose filter membrane 0.45 micron
42. Materials:
a. Distilled Deionized Water (18 MΩ DI water).
b. Minimum of 1-L Return Activated Sludge (RAS) from local water treatment municipality.
c. Buffer Matrix Solution 1-mM NaHCO3. Approximately 1 to 2 L of the buffer/matrix solution will be
required, depending on the number of samples and controls.
d. Dissolve 1.68 g of NaHCO3 in Distilled Deionized water and dilute to 2 L.
43. A Microsoft® Excel worksheet to be used for entering data in from the experiment and to calculate
the net removal in Equation 1 and the affinity constant (K) in Equation 2 is available on the OECD website
General Conditions and Quality Check Measure
44. The concentration of the biomass (e.g., gTSS/L) used in the testing should be relevant to
wastewater treatment systems. A control sample (no MN added) should be considered as a quality control
check. A non-reactive and well-dispersed MN that is stable in suspension should be included for a
consistency or quality control check. Due to a low background of gold, a well-dispersed and stable
suspension of gold nanoparticle is recommended as a quality check due to its low solubility and reactivity.
Preparation of Test Nanoparticle Suspension
45. Prior to preparation of the biomass stock solution, the specific biomass and nanoparticles
concentrations to be evaluated need to be identified in Table 6. This is critical in order to appropriately
prepare the biomass suspension for the test. If the nanomaterial to be tested is supplied/produced as liquid
suspension, this stock dispersion is directly diluted into the required test concentrations. The dispersion
stability of the nanomaterial should be determined, as described in OECD Test Guideline 318 (OECD,
2017). As the state of dispersion can influence the rate of dissolution, and where practical, should be
monitored throughout the test. In case of high degree of agglomeration in the stock dispersion
38 ENV/CBC/MONO(2021)15
Unclassified
(agglomerate size >> primary particle size) it may be considered to add some energy into the system for
example by sonication or agitation. If sonication is performed the potential influence of sonication on
dissolution should be considered and the energy input should be quantified and reported.
46. If the nanomaterial to be tested is supplied/produced as a powder it must be dispersed in the
aqueous media prior to testing. In this case, the stock dispersion should be freshly prepared (<1 hour) prior
to making the working suspensions (diluting the stock dispersion in the selected test media).
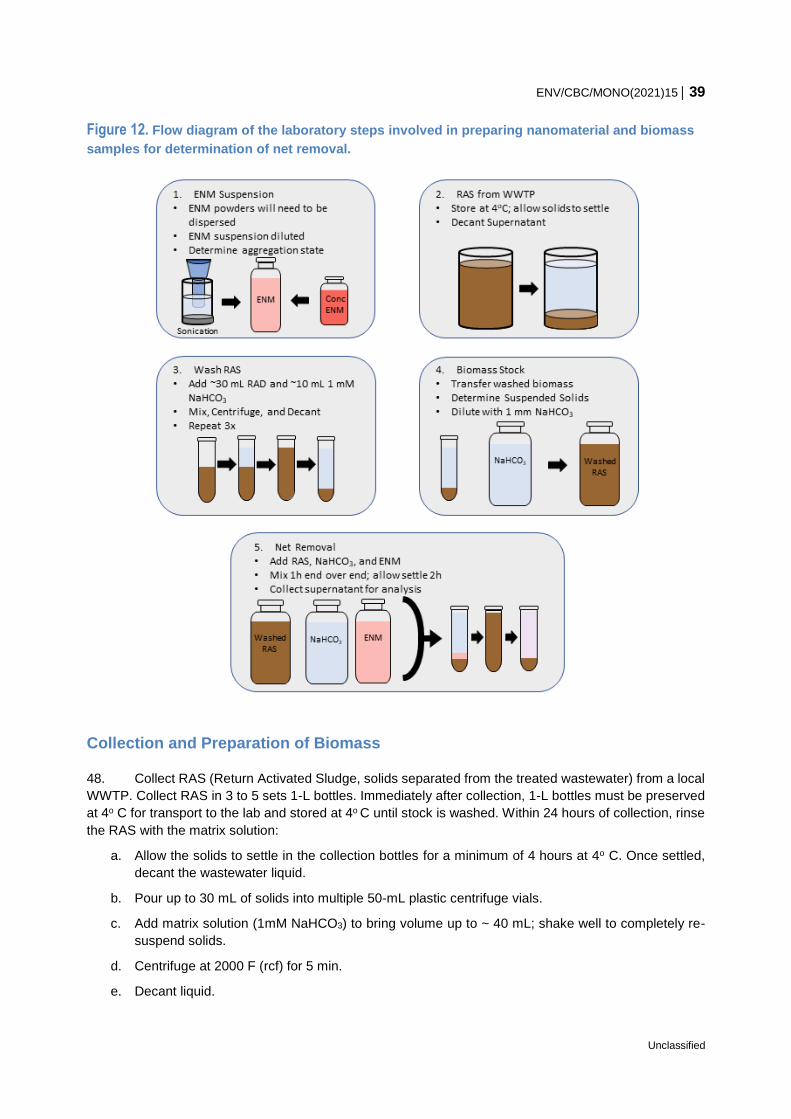
47. To prepare a nanomaterial stock dispersion from powder, reference the protocol described in
OECD Test Guideline No 318 (OECD, 2017). Very briefly, this method includes the following steps (Figure
12):
a. The nanomaterial is pre-wetted in deionized water and left as a wet paste for 24 h to insure the
proper interaction of material surface with water.
b. The wet paste is dispersed into known volume of ultrapure water, thus providing a stock
suspension with a known material concentration.
c. The concentration of stock dispersion shall be sufficient to allow the further dilution to the desired
test concentrations but should not exceed the concentration of nanomaterial within test samples
more than 20 times. Hence, if 1 mg/L is the highest tested concentration, the stock dispersion
should not exceed 20 mg/L.
d. Usage of sonication probe is mandatory. The energy input to the dispersion from the sonication
probe should be calibrated (supporting information and tools can be found in TG 318).
e. 125 mL stock dispersion is prepared in a 250-mL glass beaker placed in an >1L ice bath and
sonicated using an ultrasonic probe ½” or 13 mm diameter, tip placed in the center, 2.5 cm below
surface. It is recommended to begin at 40 W output power for 10 min, although a higher power
output may be needed based on material type. Users should consider the tradeoff of dispersing
materials versus changing the materials and utilize the lowest W possible to enable dispersion.
f. The resulting stock dispersion is stored in an amber glass container at 4°C until use within a 24 h
period.
ENV/CBC/MONO(2021)15 39
Unclassified
Figure 12. Flow diagram of the laboratory steps involved in preparing nanomaterial and biomass
samples for determination of net removal.
Collection and Preparation of Biomass
48. Collect RAS (Return Activated Sludge, solids separated from the treated wastewater) from a local
WWTP. Collect RAS in 3 to 5 sets 1-L bottles. Immediately after collection, 1-L bottles must be preserved
at 4o C for transport to the lab and stored at 4o C until stock is washed. Within 24 hours of collection, rinse
the RAS with the matrix solution:
a. Allow the solids to settle in the collection bottles for a minimum of 4 hours at 4o C. Once settled,
decant the wastewater liquid.
b. Pour up to 30 mL of solids into multiple 50-mL plastic centrifuge vials.
c. Add matrix solution (1mM NaHCO3) to bring volume up to ~ 40 mL; shake well to completely re-
suspend solids.
d. Centrifuge at 2000 F (rcf) for 5 min.
e. Decant liquid.
40 ENV/CBC/MONO(2021)15
Unclassified
f. Repeat steps (c) through (e) for a total of three rinses (three volume changes).
g. Consolidate prepared biomass in a clean high density polypropylene (HDPP) bottle and use within
24 hours.
h. Store washed biomass at 4o C.
Total Suspended Solids (TSS) of Washed Biomass
49. The total suspended solids (TSS) of washed biomass can be achieved in the following
a. Pre-weigh and record the mass of the glass fiber filter using a balance with at least 0.01 mg
resolution.
b. Place rinsed biomass suspension on a magnetic stir plate, add a magnetic stir bar, and mix well.
c. Filter 20 mL of the well mixed rinsed biomass through the filter. (If the filtration process takes more
than 10 minutes reduce the volume of biomass to be filtered and repeat.)
d. After filtration dry the glass fiber filter and biomass at 105o C for 1 hour and reweigh the filter.
I. The mass of biosolids retained on the filter should be between 100 and 200 mg.
II. If the mass retained on the filter is less than 20 mg repeat using a larger volume of
biomass.
III. If the value is greater than 200 mg repeat using a smaller volume of biomass
e. Calculate and record the suspension density of the biomass using Equation 4.
𝑇𝑆𝑆 =𝐹𝑖𝑛𝑎𝑙 𝐹𝑖𝑙𝑡𝑒𝑟 𝑀𝑎𝑠𝑠 (𝑚𝑔)−𝐼𝑛𝑡𝑖𝑎𝑙 𝐹𝑖𝑙𝑡𝑒𝑟 𝑀𝑎𝑠𝑠(𝑚𝑔)
𝐹𝑖𝑙𝑡𝑒𝑟𝑒𝑑 𝑉𝑜𝑙𝑢𝑚𝑒 (𝐿)
Equation 4
f. In addition to TSS other biomass properties may be useful interpreting the results and comparing
results of multiple MN. Other properties of interest include but are not limited to: chemical oxygen
demand (COD), dissolved organic carbon (DOC), specific ultraviolet absorbance at 254 nm
(SUVA-254), floc size distribution, and elemental composition.
Biomass Stock Preparation
50. The biomass stock can be prepared by the following.
a. Transfer all the washed biomass to a clean 1-L HDPP bottle.
b. Dilute the biomass to a suspension density 500 mg L-1 greater than the maximum test
concentration by pouring all the rinsed solids into one bottle and diluting to the appropriate
suspension density using the matrix solution (1 mM NaHCO3), e.g. if the maximum test
concentration is 2,500 mg L-1 the proper suspension density would be 3,000 mg L-1.
c. Measure the total suspended solid concentration (TSS), chemical oxygen demand (COD), and pH
of the biomass suspension. To make biomass stock for experiments, the rinsed biomass
suspension must be diluted with matrix solution to achieve the desired final TSS concentration
minus the volume of NM solution to be added to the vessel.
ENV/CBC/MONO(2021)15 41
Unclassified
d. Based on the TSS measured for the Biomass Stock calculate the volume required to achieve the
desired concentration for a total volume of 40 mL.
Sludge Net Removal Experiment
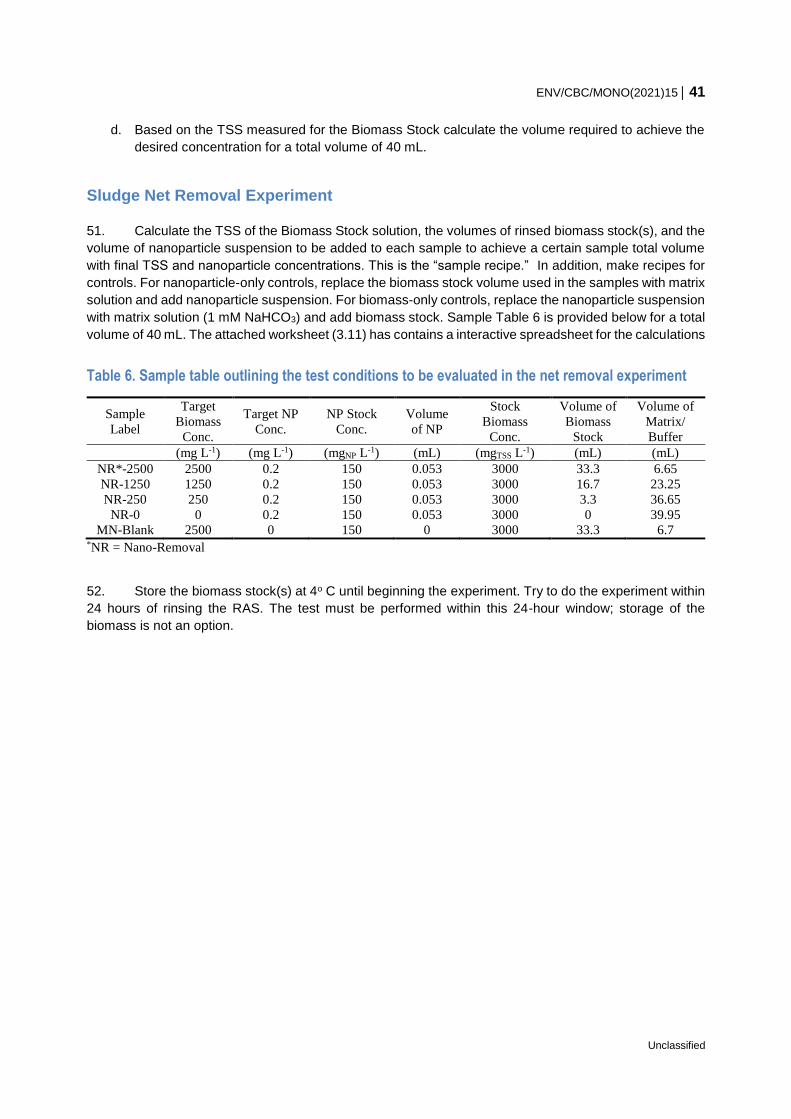
51. Calculate the TSS of the Biomass Stock solution, the volumes of rinsed biomass stock(s), and the
volume of nanoparticle suspension to be added to each sample to achieve a certain sample total volume
with final TSS and nanoparticle concentrations. This is the “sample recipe.” In addition, make recipes for
controls. For nanoparticle-only controls, replace the biomass stock volume used in the samples with matrix
solution and add nanoparticle suspension. For biomass-only controls, replace the nanoparticle suspension
with matrix solution (1 mM NaHCO3) and add biomass stock. Sample Table 6 is provided below for a total
volume of 40 mL. The attached worksheet (3.11) has contains a interactive spreadsheet for the calculations
Table 6. Sample table outlining the test conditions to be evaluated in the net removal experiment
Sample
Label
Target
Biomass
Conc.
Target NP
Conc.
NP Stock
Conc.
Volume
of NP
Stock
Biomass
Conc.
Volume of
Biomass
Stock
Volume of
Matrix/
Buffer
(mg L-1) (mg L-1) (mgNP L-1) (mL) (mgTSS L-1) (mL) (mL)
NR*-2500 2500 0.2 150 0.053 3000 33.3 6.65
NR-1250 1250 0.2 150 0.053 3000 16.7 23.25
NR-250 250 0.2 150 0.053 3000 3.3 36.65
NR-0 0 0.2 150 0.053 3000 0 39.95
MN-Blank 2500 0 150 0 3000 33.3 6.7 *NR = Nano-Removal
52. Store the biomass stock(s) at 4o C until beginning the experiment. Try to do the experiment within
24 hours of rinsing the RAS. The test must be performed within this 24-hour window; storage of the
biomass is not an option.
42 ENV/CBC/MONO(2021)15
Unclassified
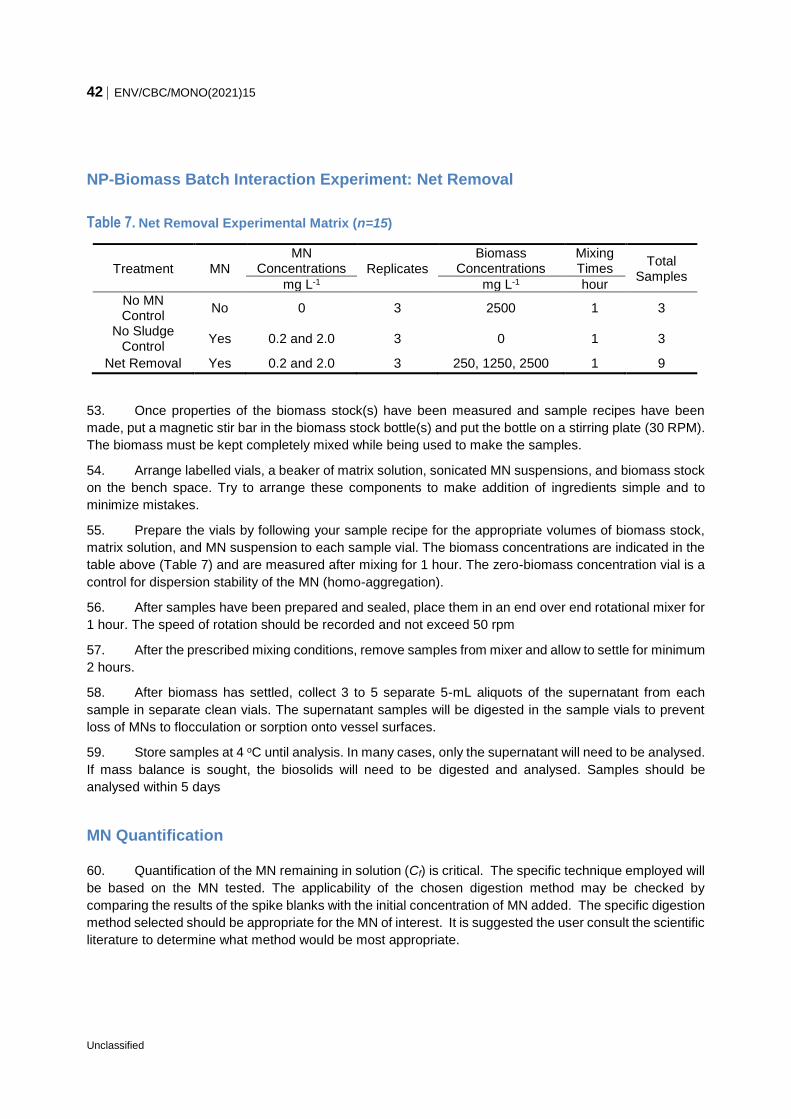
NP-Biomass Batch Interaction Experiment: Net Removal
Table 7. Net Removal Experimental Matrix (n=15)
Treatment MN
MN Concentrations Replicates
Biomass Concentrations
Mixing Times
Total Samples
mg L-1 mg L-1 hour
No MN Control
No 0 3 2500 1 3
No Sludge Control
Yes 0.2 and 2.0 3 0 1 3
Net Removal Yes 0.2 and 2.0 3 250, 1250, 2500 1 9
53. Once properties of the biomass stock(s) have been measured and sample recipes have been
made, put a magnetic stir bar in the biomass stock bottle(s) and put the bottle on a stirring plate (30 RPM).
The biomass must be kept completely mixed while being used to make the samples.
54. Arrange labelled vials, a beaker of matrix solution, sonicated MN suspensions, and biomass stock
on the bench space. Try to arrange these components to make addition of ingredients simple and to
minimize mistakes.
55. Prepare the vials by following your sample recipe for the appropriate volumes of biomass stock,
matrix solution, and MN suspension to each sample vial. The biomass concentrations are indicated in the
table above (Table 7) and are measured after mixing for 1 hour. The zero-biomass concentration vial is a
control for dispersion stability of the MN (homo-aggregation).
56. After samples have been prepared and sealed, place them in an end over end rotational mixer for
1 hour. The speed of rotation should be recorded and not exceed 50 rpm
57. After the prescribed mixing conditions, remove samples from mixer and allow to settle for minimum
2 hours.
58. After biomass has settled, collect 3 to 5 separate 5-mL aliquots of the supernatant from each
sample in separate clean vials. The supernatant samples will be digested in the sample vials to prevent
loss of MNs to flocculation or sorption onto vessel surfaces.
59. Store samples at 4 oC until analysis. In many cases, only the supernatant will need to be analysed.
If mass balance is sought, the biosolids will need to be digested and analysed. Samples should be
analysed within 5 days
MN Quantification
60. Quantification of the MN remaining in solution (Cf) is critical. The specific technique employed will
be based on the MN tested. The applicability of the chosen digestion method may be checked by
comparing the results of the spike blanks with the initial concentration of MN added. The specific digestion
method selected should be appropriate for the MN of interest. It is suggested the user consult the scientific
literature to determine what method would be most appropriate.
ENV/CBC/MONO(2021)15 43
Unclassified
Analysis
Sample Analysis Tips
61. For quality control, select at least 1 out of 20 samples to perform duplicates and spike recovery.
Be sure to check the calibration curve against an independent certified standard If internal standard
intensity is below the intensity in the calibration blank by more than 15%, the samples will need to be
diluted to avoid matrix interferences.
Reporting
62. After the test has been performed and analysis for test compound is complete, tabulate the data
generated using the following format:
63. Report the following information in the Excel Document Spreadsheet1 (see paragraph 43):
a. Test conditions: Temperature and pH at which the test was conducted. Provide the duration of
each step of the testing. Physicochemical properties of the MN tested including composition,
particle size, technique used for particle size determination, presence of coating, and chemical
composition of coating.
b. Detailed description of the analytical techniques used in the recovery and quantitative analysis for
test compound. Testing that analytically measures the MN in the water phase and associated to
the sludge is preferred. The method by which the biomass was separated from the supernatant
should be recorded (e.g. settling, filtering, or centrifugation).
c. Amount of test compound dosed (C0 solution volume), and the amount recovered in each reaction
vessel (Ce solution volume).
d. Volume of each reaction vessel and total volume of the sorbent (Biomass) and sorbate (MN)
mixture.
e. QA/QC data such as duplicate analyses, background interferences, spikes, and matrix spikes, etc.
f. Data analysis would be conducted at two levels, if desired. First, for each MLSS concentration and
fixed mixing time representative of a WWTP (t = 3 hours) the net removal can be calculated via
Equation 1. The steady-state biomass density of MNs (BD, mgMN/gTSS) is calculated for each
MLSS level as C0-Cf (mgMN/L) divided by the MLSS concentration (gTSS/L). A non-linear
regression analysis of Cf (x-variable) against BD (y-variable) yields the parameters K and 1/n
(Equation 2)
g. Sludge solids information: Sampling location, observations, age of the biomass used in the test,
calculations for volume sampled, sample custody. Reference samples of unused sludge should
be maintained for potential testing of TOC and metals.
h. Any unusual observations made during the experiments.
1 A Microsoft® Excel worksheet to be used for entering data in from the experiment and to calculate the net removal
in Equation 1 and the affinity constant (K) in Equation 2 is available on the OECD website.
44 ENV/CBC/MONO(2021)15
Unclassified
Example Application of Experimental Data
64. To predict MN net removals under near steady-state conditions at a typical WWTP either the
experimental bench-scale data for the MLSS level that most closely represents the MLSS levels in the full-
scale WWTP can be selected, or Equation 3 can be used to estimate removals under different MLSS
levels.
ENV/CBC/MONO(2021)15 45
Unclassified
Clar, J.G., et al. (2016). Copper Nanoparticle Induced Cytotoxicity to Nitrifying Bacteria in Wastewater
Treatment: A Mechanistic Copper Speciation Study by X-ray Absorption Spectroscopy. Environmental
Science & Technology. 50(17): p. 9105-9113.
Ganesh, R., et al. (2010) Evaluation of Nanocopper Removal and Toxicity in Municipal Wastewaters.
Environmental Science & Technology. 44(20): p. 7808-7813.
Gomez-Rivera, F., et al. (2012) Fate of cerium dioxide (CeO2) nanoparticles in municipal wastewater
during activated sludge treatment. Bioresource Technology. 108: p. 300-304.
Hyung, H. and J.H. Kim (2009) Dispersion of C-60 in natural water and removal by conventional drinking
water treatment processes. Water Research 43(9): p. 2463-2470.
Judy, J.D., et al. (2012).Bioaccumulation of Gold Nanomaterials by Manduca sextathrough Dietary Uptake
of Surface Contaminated Plant Tissue. Environmental Science & Technology. 46(22): p. 12672-12678.
Kaegi, R., et al. (2011) Behavior of Metallic Silver Nanoparticles in a Pilot Wastewater Treatment Plant.
Environmental Science & Technology 45(9): p. 3902-3908.
Kaegi, R., et al. (2013) Fate and transformation of silver nanoparticles in urban wastewater systems. Water
Research. 47(12): p. 3866-3877.
Kiser, M.A., et al. (2009) Titanium Nanomaterial Removal and Release from Wastewater Treatment Plants.
Environmental Science & Technology. 43(17): p. 6757-6763.
Kiser, M.A., et al. (2010) Biosorption of nanoparticles to heterotrophic wastewater biomass. Water
Research. 44(14): p. 4105-4114.
Kiser, M.A., et al. (2012) Nanomaterial Transformation and Association with Fresh and Freeze-Dried
Wastewater Activated Sludge: Implications for Testing Protocol and Environmental Fate. Environmental
Science & Technology. 46(13): p. 7046-7053.
Meier, C., et al. (2016) Transformation of Silver Nanoparticles in Sewage Sludge during Incineration.
Environmental Science & Technology. 50(7): p. 3503-3510.
Mueller, N.C. and B. Nowack (2008) Exposure modeling of engineered nanoparticles in the environment.
Environmental Science & Technology. 42(12): p. 4447-4453.
OECD, 2001a. Test Guideline 121 - Estimation of the Adsorption Coefficient (Koc ) on Soil and on Sewage
Sludge using High Performance Liquid Chromatography (HPLC) https://www.oecd-
ilibrary.org/environment/test-no-121-estimation-of-the-adsorption-coefficient-koc-on-soil-and-on-sewage-
sludge-using-high-performance-liquid-chromatography-hplc_9789264069909-en
OECD, 2001b. Test Guideline 303- Simulation Test - Aerobic Sewage Treatment -- A: Activated Sludge
Units; B: Biofilms https://www.oecd-ilibrary.org/environment/test-no-303-simulation-test-aerobic-sewage-
treatment-a-activated-sludge-units-b-biofilms_9789264070424-en
OECD, 2008. Test Guideline 314 - Simulation Tests to Assess the Biodegradability of Chemicals
Discharged in Wastewater https://www.oecd-ilibrary.org/environment/test-no-314-simulation-tests-to-
assess-the-biodegradability-of-chemicals-discharged-in-wastewater_9789264067493-en
11 REFERENCES
46 ENV/CBC/MONO(2021)15
Unclassified
OECD, 2017. est No. 318: Dispersion Stability of Nanomaterials in Simulated Environmental Media.
https://www.oecd.org/env/ehs/testing/test-no-318-dispersion-stability-of-nanomaterials-in-simulated-
environmental-media-9789264284142-en.htm
Pagga, U. and K. Taeger (1994) development of a method for adsorption of dyestuffs on activated-sludge.
Water Research. 28(5): p. 1051-1057 .
USEPA, OPPTS 835.1110 Activated Sludge Sorption Isotherm, in Fate, Transport, and Transformation
Test Guidelines, P. Prevention, and Toxic Substances, Editor. 1998, USEPA: Washington, DC. p. 9.
https://www.regulations.gov/document/EPA-HQ-OPPT-2009-0152-0003
USEPA, SW-846 Test Method 6020B: Inductively Coupled Plasma - Mass Spectrometry - Revision 2. SW-
846. Hazardous Waste Test Methods. 2014, Wasshignton D.C.: USEPA. https://www.epa.gov/hw-
sw846/sw-846-test-method-6020b-inductively-coupled-plasma-mass-spectrometry
Westerhoff, P., et al., (2011) Occurrence and removal of titanium at full scale wastewater treatment plants:
implications for TiO2 nanomaterials. Journal of Environmental Monitoring. 13(5): p. 1195-1203.
ENV/CBC/MONO(2021)15 47
Unclassified
Aggregation – The formation of a number of particles into a cluster, happening due to interparticle
interactions.
Concentrations – concentrations of the particles and NOM in samples are reported in g/L, mg/L (ppm)
and g/L (ppb). Concentrations of salts (NaHCO3) present in the samples are reported in mM.
Hydraulic Residence Time, Hydraulic Retention Time – is a measure of the average length of time in
which a compound remains in a storage unit.
Manufactured Nanomaterial (MN) – A engineered particle with at least one dimension between 1 and
100 nm.
MLSS – Mixed Liquor Suspended Solids, refers to the concentration of suspended solids, in an aeration
tank during the activated sludge process, which occurs during the treatment of wastewater. MLSS consists
mostly of microorganisms and non-biodegradable suspended matter and is mostly expressed as
milligrams per liter (mg/L).
MN- Manufactured Nanomaterials
NOM - Natural Organic Matter, refers to the organic material present in surface or ground water.
RAS – Return Activated Sludge, refers to a tank, known as the clarifier, where the solids settle and are
separated from treated wastewater.
Size – Size of the particles are reported in micrometers (m) or nanometers (nm) and can be determined
using TEM imaging, or in (d.nm) using DLS size measurements.
TOC – Total Organic Carbon, refers to the amount of carbon found in an organic compound.
TSS – Total Suspended Solids, refers to the dry-weight of particles trapped by a filter. It is a water quality
parameter used to assess the quality of wastewater after treatment in a wastewater treatment facility.
12 APPENDIX - GLOSSARY