Access to care
Timely access to care
Cost as a barrier to health care
1

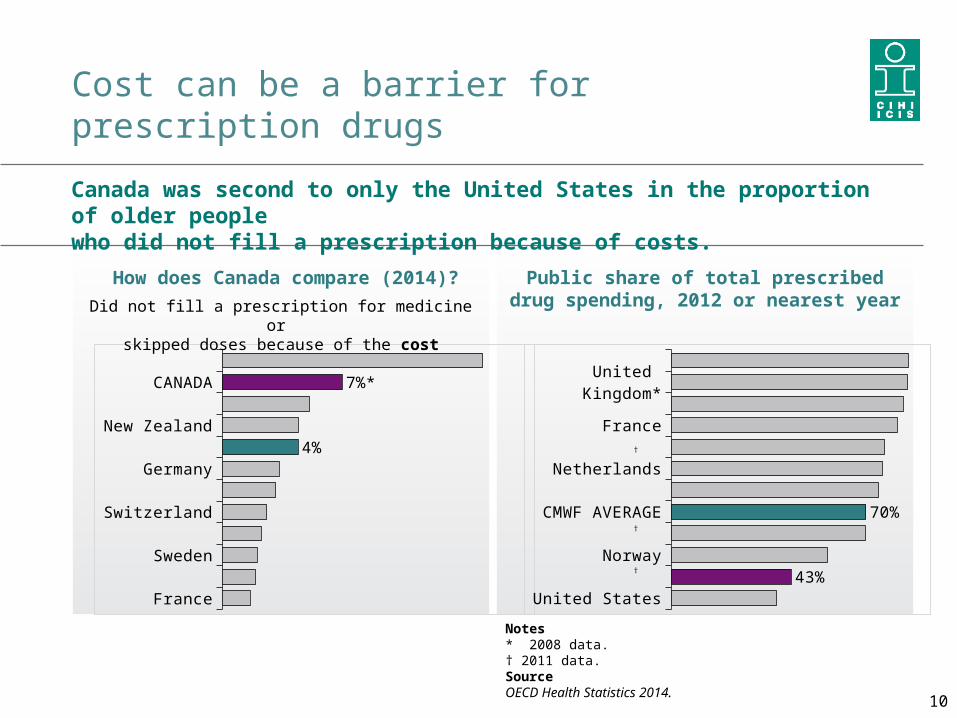
France
Netherlands
Germany
Norway
Switzerland
Australia
CANADA
New Zealand
CMWF AVERAGE
United Kingdom
United States
Sweden
96%*
93%
Most older Canadians have a regular doctor
of Canadians age 55 and older had 1 or more doctors they usually went to for their medical care.
How does Canada compare (2014)?
• Older Canadians were more likely to have a regular doctor than younger Canadians.
• 85% of Canadians older
than 12 had a regular doctor.
Source Statistics Canada. Table 105-0501—Health indicator profile, annual estimates, by age group and sex, Canada, provinces, territories, health regions (2013 boundaries) and peer groups, occasional.
96%
2

Older Canadians wait longest for primary care
No improvement since 2007
SourceThe Commonwealth Fund, 2007 International Health Policy Survey in Seven Countries.
waited for at least 2 days to see a doctor or a nurse the last time they were sick or needed medical attention.
53%How does Canada compare (2014)?
France
New Zealand
Germany
Netherlands
Switzerland
Australia
CMWF AVERAGE
United Kingdom
Sweden
United States
Norway
CANADA
32%
53%*2007
of older Canadians waited at least 6 days or gave up (2014).
30%
53%
3

CANADA
Australia
Norway
Sweden
Germany
CMWF AVERAGE
United Kingdom
Netherlands
New Zealand
United States
Switzerland
France
63%*
72%
Canadians are least likely to get timely responses
Proportion of older Canadians who wished to or were able to email their doctors with a medical question, 2014
Proportion of older Canadians who always or often got an answer the same
day when they called their regular doctor with a medical concern
In 2012, 11% of family physicians
offered patients the option to email them
about a medical question or concern.
SourceThe Commonwealth Fund, 2012 Commonwealth Fund International Survey of Primary Care Doctors.
Wished to Were able to
25%
4%
4

Canadians have fewer after-hours options for primary care
SourceThe Commonwealth Fund, 2012 Commonwealth Fund International Survey of Primary Care Doctors.
thought it was very or somewhat difficult to get medical care in the evenings and on weekends or holidays without going to the emergency department (ED).
51%Proportion of family physicians
whose practice had an arrangement for after-hours care
How does Canada compare (2014)?
Netherlands
France
Switzerland
New Zealand
United Kingdom
Norway
Germany
CMWF AVERAGE
Australia
Sweden
United States
CANADA
29%
51%*
2012
45%
5

Lack of access to timely care has an impact on ED use
How does Canada compare (2014)?
Netherlands
Germany
United Kingdom
Australia
Norway
CMWF AVERAGE
Sweden
Switzerland
New Zealand
France
CANADA
United States
28%
37%*
In 2013–2014, 1 in 5 emergency visits in
Canada was for a condition that could have been treated elsewhere, such as a doctor’s office.
The most common conditions were upper respiratory infections (13%) and antibiotic therapy (13%).SourceCanadian Institute for Health Information. Sources of Potentially Avoidable Emergency Department Visits. Ottawa, ON: CIHI; 2014.
of older Canadians went to an ED for a condition that could have been treated by their regular doctor.37%
6

Canadians wait longest for specialist care
How does Canada compare (2014)?
United States
Switzerland
Netherlands
France
United Kingdom
CMWF AVERAGE
Australia
Germany
Sweden
New Zealand
Norway
CANADA
15%
25%*
Specialist wait times, by year
SourcesThe Commonwealth Fund, 2010 and 2013 Commonwealth Fund International Health Policy Survey.
of older Canadians waited for at least 2 months to see a specialist; these waits had not improved over time. 25%
2010 2013 20140%
10%
20%
30%
40%
50%
60%
<4 weeks 1 month to <2 months2 months or longer
7

How do the provinces compare?
Older Canadians (55+) who B.C. Alta. Sask. Man. Ont. Que. N.B. N.S. P.E.I. N.L. Can. CMWF Avg.
Waited for at least 2 days to see a doctor 50% 55% 57% 54% 50% 58% 54% 55% 53% 53% 53% 32%
Said it was very or somewhat difficult to get medical care after hours
47% 45% 49% 55% 47% 60% 53% 59% 57% 65% 51% 29%
Went to the ED for a condition that could have been treated by their regular doctor
30% 39% 33% 34% 39% 38% 42% 37% 40% 50% 37% 28%
Waited for at least 2 months to see their specialist 24% 28% 32% 32% 24% 25% 29% 27% 28% 34% 25% 15%
The timeliness of primary and specialist care was significantly below the international average for all Canadian provinces.
Compared with the CMWF average
Above average Same as average Below average
8

In the past year Canada CMWF average United States
Did not see a doctor for a medical problem because of the cost
Skipped a medical test, treatment or follow-up recommended by a doctor because of the cost
Did not fill a prescription for medicine or skipped doses of medications because of the cost
Did not see a dentist when needed to because of the cost
Is cost a barrier to accessing care?
4%
In Canada’s publicly funded health care system, most older Canadians accessed the medical care they needed without having to worry about costs.
5% 15%
5% 5% 15%
7% 4% 15%
15% N/A
N/A
Compared with the CMWF average
Above average Same as average Below average Not applicable9
FranceNorwaySweden
United KingdomSwitzerlandNetherlands
GermanyCMWF AVERAGE
New ZealandAustraliaCANADA
United States
4%
7%*
Cost can be a barrier for prescription drugs
How does Canada compare (2014)? Public share of total prescribed drug spending, 2012 or nearest year
Notes* 2008 data.† 2011 data.SourceOECD Health Statistics 2014.
Did not fill a prescription for medicine or skipped doses because of the cost
Canada was second to only the United States in the proportion of older people who did not fill a prescription because of costs.
United StatesCANADA
NorwayAustralia
CMWF AVERAGESweden
NetherlandsNew Zealand
FranceSwitzerland
United Kingdom*Germany
43%
70%
†
†
†
10

Drug costs affect a higher proportion of people age 55 to 65
Proportion by age
Canadians age 55 to 64 did not fill their prescriptions or skipped their medications because of the cost.
1 in 10
10%
55–64 65+
5%
Most Canadian provinces have public drug coverage programs for seniors age 65+.
11

Cost can be a barrier for dental care
Only 4 jurisdictions (Alberta,
Yukon, the Northwest Territories and Nunavut) have public oral health care services for seniors.
Proportion who did not receive dental care by age, 2014
SourceCanadian Academy of Health Sciences. Improving Access to Oral Health Care for Vulnerable People Living in Canada. Ottawa, ON: CAHS; 2014.
of older Canadians did not receive the dental care they needed because of the cost.
15%
19%
55–64
12%
65+
12

Public coverage of dental care is lower in Canada
Share of public spending on outpatient dental care, 2012 or nearest year
SourceOrganisation for Economic Co‑operation and Development. Health at a Glance 2013: OECD Indicators. 2013.
Probability of a dental visit, by income, 2009
Low income High income
Notes† 2011 data.SourceOECD Health Statistics 2014.
47%79%
Canada
Switzerland
United States
Netherlands
CMWF AVERAGE
Norway
Australia
France
New Zealand
Sweden
Germany
6%
25%
†
†
†
13
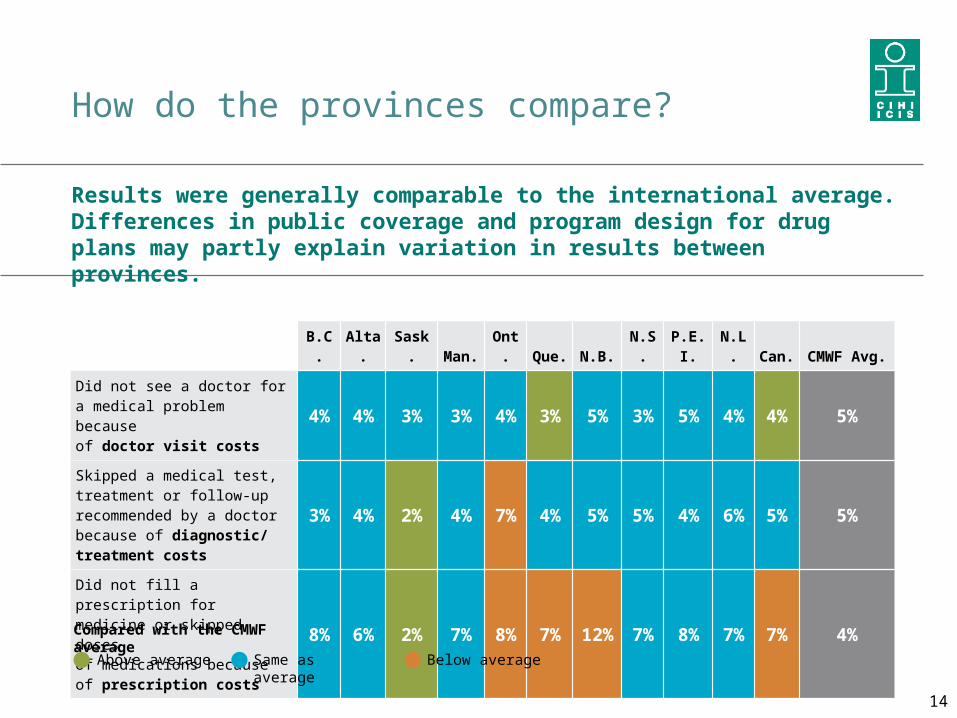
How do the provinces compare?
B.C. Alta. Sask. Man. Ont. Que. N.B. N.S. P.E.I. N.L. Can. CMWF Avg.
Did not see a doctor for a medical problem because of doctor visit costs
4% 4% 3% 3% 4% 3% 5% 3% 5% 4% 4% 5%
Skipped a medical test, treatment or follow-up recommended by a doctor because of diagnostic/treatment costs
3% 4% 2% 4% 7% 4% 5% 5% 4% 6% 5% 5%
Did not fill a prescription for medicine or skipped doses of medications because of prescription costs
8% 6% 2% 7% 8% 7% 12% 7% 8% 7% 7% 4%
Compared with the CMWF average
Above average Same as average Below average
14
Results were generally comparable to the international average. Differences in public coverage and program design for drug plans may partly explain variation in results between provinces.