1 | P a g e
MBA VI
Master of Business Administration Program in Management and
Finance 2009 – 2011
Absenteeism: A Myth or Reality?
A study of an agriculture Company in Suriname
By
Permila Bissumbhar
Supervisor: Dr. Geert Heling, PhD
Date: December 2011
Maastricht School of Management (MSM) in Netherlands and
F.H.R. Lim A Po Institute for Social Studies in Suriname
2 | P a g e
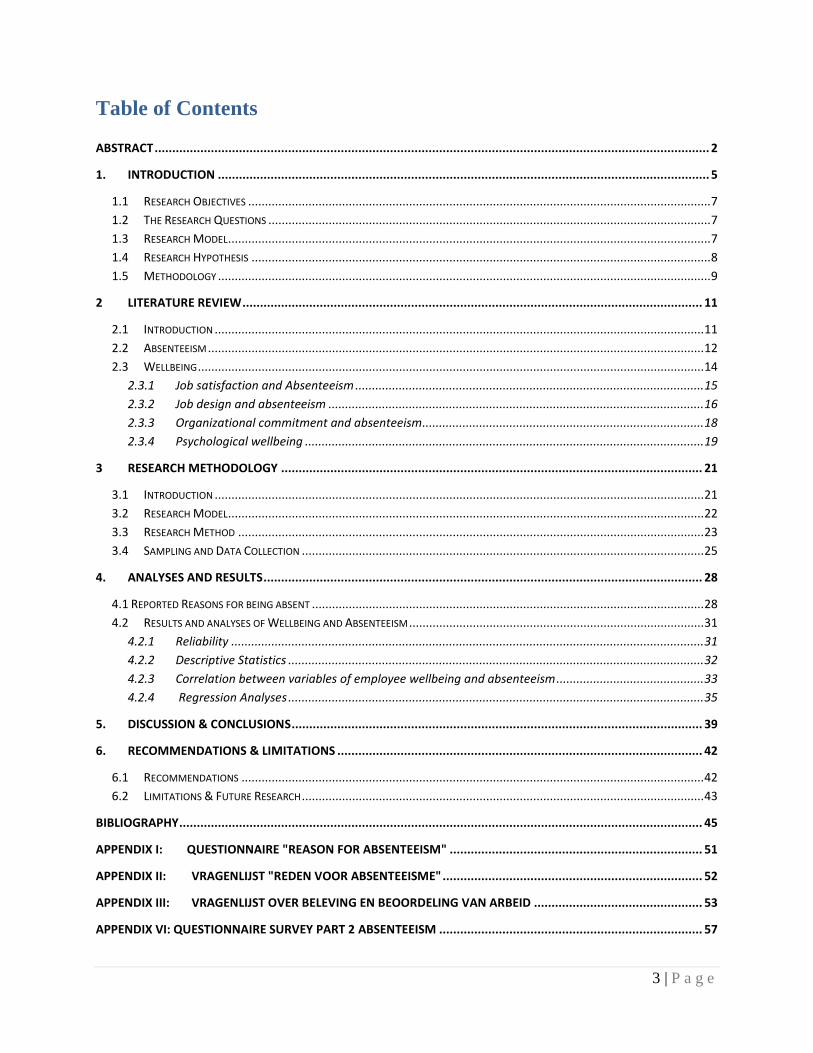
ABSTRACT
Many production companies in Suriname have the challenge to improve productivity and cost
price in order to remain successful in an increasingly competitive world. One factor that leads to
lower productivity is absenteeism. This thesis therefore focuses on the main determinants of
employee absenteeism in an agriculture production company of Suriname. The study was
divided in two parts.
The objective of the first part was to learn and quantify the reasons for employee absenteeism
from workers themselves and management. Management and workers agreed that illness was the
most important reason for being absent. Other common reasons are illness of a child or family
members, and tiredness. However workers mentioned also having appointment with a doctor and
injuries as important reasons, while management believed that transport problems, wage rate and
no childcare were important reasons.
In the second part of this thesis a quantitative research was carried out to examine the
relationship between absenteeism and 5 independent variables of wellbeing ; job satisfaction, job
design, workload, organizational commitment and psychological wellbeing. Also 5 moderated
variables were included in this study. The results show psychological wellbeing as the most
significant predictors of absenteeism. Availability of money, safety, age and tenure were also
significantly correlated to absenteeism. Some results are similar to result found in past research
and some are the contrary.
By understanding what causes employees to miss work, a company can find ways to reduce and
control this phenomenon in order to increase productivity and decrease cost price.
3 | P a g e
Table of Contents
ABSTRACT .............................................................................................................................................................. 2
1. INTRODUCTION ............................................................................................................................................ 5
1.1 RESEARCH OBJECTIVES .......................................................................................................................................... 7
1.2 THE RESEARCH QUESTIONS .................................................................................................................................... 7
1.3 RESEARCH MODEL ................................................................................................................................................ 7
1.4 RESEARCH HYPOTHESIS ......................................................................................................................................... 8
1.5 METHODOLOGY ................................................................................................................................................... 9
2 LITERATURE REVIEW ................................................................................................................................... 11
2.1 INTRODUCTION .................................................................................................................................................. 11
2.2 ABSENTEEISM .................................................................................................................................................... 12
2.3 WELLBEING ....................................................................................................................................................... 14
2.3.1 Job satisfaction and Absenteeism ........................................................................................................ 15
2.3.2 Job design and absenteeism ................................................................................................................ 16
2.3.3 Organizational commitment and absenteeism .................................................................................... 18
2.3.4 Psychological wellbeing ....................................................................................................................... 19
3 RESEARCH METHODOLOGY ........................................................................................................................ 21
3.1 INTRODUCTION .................................................................................................................................................. 21
3.2 RESEARCH MODEL .............................................................................................................................................. 22
3.3 RESEARCH METHOD ........................................................................................................................................... 23
3.4 SAMPLING AND DATA COLLECTION ........................................................................................................................ 25
4. ANALYSES AND RESULTS ............................................................................................................................. 28
4.1 REPORTED REASONS FOR BEING ABSENT ..................................................................................................................... 28
4.2 RESULTS AND ANALYSES OF WELLBEING AND ABSENTEEISM ........................................................................................ 31
4.2.1 Reliability ............................................................................................................................................. 31
4.2.2 Descriptive Statistics ............................................................................................................................ 32
4.2.3 Correlation between variables of employee wellbeing and absenteeism ............................................ 33
4.2.4 Regression Analyses ............................................................................................................................ 35
5. DISCUSSION & CONCLUSIONS ..................................................................................................................... 39
6. RECOMMENDATIONS & LIMITATIONS ........................................................................................................ 42
6.1 RECOMMENDATIONS .......................................................................................................................................... 42
6.2 LIMITATIONS & FUTURE RESEARCH ........................................................................................................................ 43
BIBLIOGRAPHY ..................................................................................................................................................... 45
APPENDIX I: QUESTIONNAIRE "REASON FOR ABSENTEEISM" ........................................................................ 51
APPENDIX II: VRAGENLIJST "REDEN VOOR ABSENTEEISME" .......................................................................... 52
APPENDIX III: VRAGENLIJST OVER BELEVING EN BEOORDELING VAN ARBEID ................................................ 53
APPENDIX VI: QUESTIONNAIRE SURVEY PART 2 ABSENTEEISM ........................................................................... 57

4 | P a g e
APPENDIX V: RESULTS REGRESSION ANALYSES .............................................................................................. 61

5 | P a g e
1. INTRODUCTION
In many businesses in Suriname absenteeism is one of the most important challenges they face in
trying to increase efficiency and productivity. They have problems in meeting deadlines and the
lost time and production is very difficult to manage without negative consequences in quality and
costs. Today with globalization the market is accessible for everyone and to stay in the market
you need to be highly competitive to keep the market or to increase market share. This is also a
very important aspect for especially the export companies in Suriname. Absenteeism occurs
when an employee is not present at his/her work when he/she is expected to be at work according
to the schedule (Brooke, 1986).The management of absenteeism is a fundamental part of the
human resources function, which still is very poorly understood by management.
This research focuses on absenteeism in one agriculture labor intensive production
company. Data is collected in the banana producing company of Suriname, SBBS (Stichting
Behoud Bananen Sector). It is a production company operating on the international market. Not
only in this company, but almost all companies working with mostly low skilled labor have
problems with high absenteeism. For the agricultural sector this absent phenomena is very costly
because agricultural products are perishable (fresh fruit & vegetables). In order to control these
costs, this phenomenon needs to be studied to find methods to reduce employee absence.
Most of the research done on absenteeism assumes that some of the factors leading to
absenteeism possible can be influenced. This suggests that absenteeism is sensitive to some
degree of volition (Stamm, C & Farrel, D, 1988). (Steers, R. & Rhodes, S, 1978) have
developed a model explaining absenteeism and attendance. Attendance and absence are
influenced by two important factors; the employee‟s motivation to attend and the employee‟s
ability to attend (Steers, R. & Rhodes, S, 1978). An employee is present at work when he/she is
6 | P a g e
motivated, or has reasons to come to work, and also must be able to come to work (Rhodes, S &
Steers, R. M., 1981).
Numerous studies have examined the relationship with absenteeism and job satisfaction,
but the empirical findings have not been consistent (K.D. Scott, G.Stephen Taylor , 1985).The
meta-analyses of the relationship between employee absenteeism and job satisfaction (K.D.
Scott, G.Stephen Taylor , 1985) showed that job satisfaction was found consistently to be
negatively associated with absence. A person who is not satisfied with his or her job has a higher
intent to be absent (Jase Ramsey, Betty Jane Punnett and Dion Greenidge, 2008). (J. R. Rentsch,
R.P. Steel, 2003) have identified individual characteristics, job-related characteristics, and
contextual characteristics as three major types of potential absence determinants. Employees
with high levels of organizational commitment are less likely to miss work because it jeopardizes
their membership in the company (Harrison, D. A., & Martocchio, J. , 1998).
Job satisfaction, job related characteristics like job demand and workload are some of the
factors of employee wellbeing. In many studies employee wellbeing has been operationalized by
these variables (Wright, 2005). Employee wellbeing can be defined as the overall quality of an
employee‟s experience and functioning at work (Warr, 1987). If employees feel better they are
likely to perform better and take fewer days off sick. Employee well-being has also a significant
impact on also the performance of companies by its effect on costs which are related to sickness,
absenteeism and turnover (Spector, P., 1997).
The focus of this study is to understand why individuals are absent from work. With this
knowledge, HR managers can better select the most cost-effective interventions aimed at
preventing or reducing absence.
7 | P a g e
1.1 Research Objectives
When an employee decides not to come to work there can be different reasons for this behavior.
Some of these reasons may be in his/her control and some may not. When the causes of the
absenteeism are determined than strategies can be developed to reduce the rate of absenteeism in
production companies in Suriname. The main objectives of this study are to identify the main
factors leading to absenteeism and to measure the impact of these variables on absenteeism.
1.2 The Research Questions
The main research question is:
What are the main determinants of employee‟s absenteeism?
Sub Research Questions are:
1. What are according to employees the main reasons for being absent?
2. What are according to management the reasons why their workers are absent?
3. How can absenteeism be reduced in this company?
1.3 Research Model
The research model has 2 constructs, absenteeism and employee wellbeing. Absenteeism is the
dependent variable and the construct “employee wellbeing” consist of 5 independent variables.
There are also 5 moderating variables included in this study, which can influence the dependent
variable.

8 | P a g e
Employee Wellbeing Absenteeism
1.4 Research Hypothesis
Ho1: Employees who are more satisfied with their job are less absent
Ho2: High perceived workload result in higher absenteeism
Ho3: High physical workload results in higher absenteeism
Ho4: There is no relation between job design and absenteeism
Ho5: More committed employees are less absent.
Ho6: Employees with higher level of psychological wellbeing are less absent
Independent Variables
1. Job satisfaction
2. Job Design
3. Organizational Commitment
4. Workload: perceived & physical
5. Psychological Wellbeing
Dependant Variable
Absenteeism
(Frequency)
Moderating Variables
1. Age
2. Gender
3. Marital Status
4. Job Tenure
5. No of children
living at home

9 | P a g e
1.5 Methodology
Absence can be voluntary and involuntary. Voluntary absences are absences that the worker has
control over and consist of “those absences which occur when the worker is able to work but for
some reason decides to miss work” (Hinze, J., Ugwu, M., and Hubbard, L., 1985). Involuntary
absences are absences that the worker has little control over and consist primarily of illnesses
and injuries (Hinze, J., Ugwu, M., and Hubbard, L., 1985). In this study both type of absence
will be considered, since employees who are absent due to sickness sometimes are not really
sick.
Measure of absence frequency is derived from the personnel records of participating
employees. Absence frequency referred to the total number of absence incidences, ignoring the
length of each absence event. Absence duration (total days lost) is also available but will not be
used in this study because it is likely to show extreme deviations in their statistical properties
(Hammer, T. H., & Landau, J. , 1981).
To identify the reasons employees are absent, a questionnaire was developed to collect
quantitative data from workers and management. This would give their perception of the factors
leading to employee absenteeism. This questionnaire consist of 15 reasons why a worker might
be absent from work (Awad S. Hanna, Cindy L. Menches, Sullivan, & Sargent, November 2005)
.The workers had to rate each factor as strong or weak reason for their absence at work on a 5-
point liker scale. The management had to rate also each factor as strong or weak factors for their
workers absence. The management and the workers could add other factors if necessary. With
this first part of the study the perception of workers and management for the main determinant of
absenteeism becomes clear. A comparison will be made between the perception of workers and
management.
10 | P a g e
To reduce absenteeism it is important to know the underlying causes for the absence
behavior. In this second part of the study the construct employee wellbeing with 5 variables will
be measured to find the relations between these variable and absenteeism. Job satisfaction was
measured with the Job Satisfaction Questionnaire of (Warr, P. B., Cook, J. and Wall, T. D. ,
1979). Job features were measured by a scale of (Warr, P., 2007), which include some of the
scale of the Job Diagnostic Survey (JDS) (Hackman, J. R., & Oldham, G. R. , 1975)
(Organizational commitment was measured by 4-items scale employed by (Currivan, 2000). This
measure was assessed on a 5-point scale. The general perceptions of workload were measured by
a 3-items scale employed by (Currivan, 2000) and the physical workload was measured by
(Hollmann S, Klimmer F, Schmidt K-H, Kylian H., 1999). Psychological Well-Being was
measured by the General Health Questionnaire GHQ12 (Goldberg, D. & Williams, P, 1988).
11 | P a g e
2 LITERATURE REVIEW
2.1 Introduction
Suriname is a developing country with only half a million people. The labor force is thus very
limited and needs to be managed properly. Employees not showing up at work when they are
scheduled is one of the mayor problems many company face and finding solutions to reduce this
absence is very essential. There are currently no reliable statistics on absenteeism in Suriname
available, but from different personal resources there are some indications that it varies between
7% and 20 %. This percentage is the number of days lost to absenteeism divided with the total no
of day scheduled. Barbados; also a developing country in the Caribbean, has around 7%
absenteeism (Betty Jane Punnett, Dion Greenidge, Jase Ramsey, 2007). This is an indication that
we could find possibilities in Suriname to reduce the absenteeism. A reduction of the
absenteeism rate can have a substantial impact on the labor force, the productivity of companies
and ultimately the whole economy. The absenteeism rate will vary with the type of industry,
organization, occupation and culture, but they are all experiencing this increasingly costly
problem (Fred Luthans & Mark Martinko , 1976); (Steers, R. M., & Rhodes, S. R. , 1984). These
large differences led researcher to hypothesize that working conditions experienced by
employees will influence the pattern of absenteeism (Chadwick-Jones, J. K., Nicholson, N., &
Brown, C., 1982) (Kaiser, 1998) .

12 | P a g e
2.2 Absenteeism
Attending work or being absent from work are behaviors and this behavior is caused by different
factors (Fred Luthans & Mark Martinko , 1976) It is a behavior where positive and negative
reinforces (rewards and punishments) are interacting with one another. When an employee is less
absent after a verbal reprimand than the verbal reprimand is a punisher. But if instead of
decreasing, the absenteeism increases, than the verbal reprimand is reinforcing absenteeism. In
the research done by Luthans and Martinko it is states that in order to analyze attendance or
absenteeism, the antecedents and also the consequences must be analyze. Examples of some of
the variables in this kind of analyses are given in Figure 1.
Figure 1: Functional analyses of absenteeism behavior
Getting up late
Sleeping-in
Staying home
Drinking
Fishing/hunting
Working at home
Visiting
Caring for sick child
Discipline Programs
Verbal reprimands
Written reprimands
Pay docks
Layoffs
Dismissals
Consequences from
co-workers
Escape and avoidance
of working
Nothing
Illness/accident
Hang-over
Lack of transportation
Traffic
No day care facilities
Family problems
Company policies
Group/personal norms
Seniority/age
Awareness/observation of
any consequence

13 | P a g e
In absenteeism a distinction is made in paid and unpaid absence. Paid absence can be absence
due to sickness or injuries. All public companies and many of the private companies provide
healthcare and also normal payment on sick leave which is authorized by a physician. Other
researchers divide the absenteeism in voluntary or involuntary absence (Brooke, P.P. and Price,
J.L., 1989). Voluntary absence occurs when an employee by its own choice doesn‟t attend work
for reasons that are within his or her control. Involuntary absence is more or less beyond the
control of the employee like illness and injuries. The distinction between the two components is
often whether the employee had an approved excuse for being absent. Being on sick-leave when
the employee is not really sick is within the control of the employee. In this case the employee
was not motivated to attend work for some reason. Most of the times employees are absent from
work for reasons other than sickness (Fred Luthans & Mark Martinko , 1976). In this research
absenteeism includes paid as well as unpaid absence and also voluntary and involuntary absence
since there are overlapping issues between them.
One of the most cited models used in the absenteeism research is the process model of
employee absence by (Steers, R. M., & Rhodes, S. R., 1978). This model is the result of analyses
done on 104 empirical studies on absenteeism. It states that for an employee to be present at
work, the employee must be motivated or have a reason to come to work and in addition must be
able to come to work. Attendance motivation is largely influenced by satisfaction with the job
situation and the social, economic and personal pressure to attend (Steers, R. M., & Rhodes, S.
R. , 1984).
It is difficult for employers to verify the claims of employee‟s about the causes of their
absence. How will an employer check if the employee claims that he or she had to look after a
sick child? It is self-reported and it is difficult to obtain objective evidence. Also questioning an

14 | P a g e
employee‟s claim can damage the relationship between the employer and employee, which is not
in favor for both parties. Asking employees to report on their previous absences can give biased
results due to errors of memory and unconscious processes can occur (Nicholson. N,. & Payne.
R., 1987). In this study the opinions of the workers and also the management about the cause of
absenteeism will be assessed and compared.
2.3 Wellbeing
Employee wellbeing can be defined as the overall quality of experience and functioning at work
(Warr, 1987). This definition suggests that employee wellbeing can have an impact on the
performance and sustainability of organization. Happy and healthy employees make more effort
resulting in an increase of their contribution and productivity (Fisher, 2003). Research has also
indicated that employee wellbeing affects the cost of health care, absenteeism and turnover in a
company (Spector, P., 1997). When an employee doesn‟t feel well in an organization he will
tend to go frequently to the doctor, be more absent and the risk that he will leave the company
will increase. In organizational research employee wellbeing has been divided in 3 dimensions:
the psychological wellbeing, the physical wellbeing and the social wellbeing (Warr, 1987)
(Diener, E., & Seligman, M. E. P., 2004). The psychological wellbeing of employees is the
subjective experience and functioning of the employee. This has more to do with the satisfaction
of their job and lives (Judge, T. A., & Watanabe, S. , 1993). Other researchers describe the
psychological wellbeing as the employee‟s feelings of fulfillment and purpose in their effort
(Wrzesniewski, A., Dutton, J. E., & Debebe, G. , 2003).

15 | P a g e
The physical wellbeing of employees refers to the health and functioning of the employee. The
social wellbeing of employees focus on the quality of an employee‟s relationship with other
employees and his/her functioning (Bradbury, H., & Lichtenstein, B. M. B. , 2000).
The construct employee wellbeing is according to the literature very broad and has
different variables. In this study we will focus on the variables job satisfaction, job
characteristics, perceived workload, physical workload, organizational commitment and
psychological wellbeing in term of perception of general health. Health of an individual is also a
very broad concept and the status of health should be determined by physicians. This study
focuses on organizational behavior and therefore it is important to know how an employee feels
about certain health aspects.
2.3.1 Job satisfaction and Absenteeism
Job satisfaction is a variable that is widely and extensively researched by many researchers in
organizational psychology (Spector, P., 1997). It is defined as "the extent to which people like
(satisfaction) or dislike (dissatisfaction) their jobs" (Spector, P., 1997). This definition gives an
accurate picture of the perception, the employee‟s have about their job. Accept a global, general
appreciation of their job; it is for some researchers more interesting to know the satisfaction of
the different aspects of the job and the work situation. Assessing the different aspects like:
relation with the supervisor, pay or working conditions gives a more detail and clear view of the
job satisfaction. The satisfaction level is normally a combination of the different aspects, but it
can be largely influenced by one or few aspects. Many of the scales used to measure job
satisfaction have included different aspects and combined these to have an overall global

16 | P a g e
assessment of job satisfaction (Weiss, D. J., Dawis, R. W. and Lofquist, L. H., 1967) (Warr, P.
B., Cook, J. and Wall, T. D. , 1979).
The relationship between job satisfaction and absenteeism is extensively and widely
researched. Contradictory to the model of Steers and Rhodes, other researchers have found very
weak correlations between job satisfaction and absenteeism (Chadwick-Jones, J. K., Nicholson,
N., & Brown, C., 1982). According to (Steers, R. M., & Rhodes, S. R. , 1984), the relationship is
not direct, but biographical and situational factors like job involvement moderate it. The meta-
analysis of (Harrison, D. A., & Martocchio, J. , 1998), concluded that in addition to job
satisfaction, absence relationship, a number of direct relationships exist. Another meta-analysis
of the relationship between employee absenteeism and job satisfaction (K.D. Scott, G.Stephen
Taylor , 1985) concluded that this relationship was consistently negative. Employees, who are
more satisfied, are less likely to be absent or to leave a job (Lease S., 1998). They are also more
committed and usually more satisfied with their lives. In this study a hypothesis is formulated
and this will test the strength of the relationship between job satisfaction and absenteeism in the
agricultural industry.
Ho1: Employees who are more satisfied with their job are less absent
2.3.2 Job design and absenteeism
Job design refers to the components of an individual job, in a very broad sense (Mandy Unterslak
, 2009). In research many different terms are used with overlapping and additional aspects which
make these terms different and specific. Job characteristics, job content, job demand, work
design and job features are some examples. Two of the most influential and dominated models in
17 | P a g e
job design are the Job Characteristics Model of (Hackman, J. R., & Oldham, G. R., 1975) and
the Demand-Control-Support Model of (Karasek, R. A., Jr., 1979), (De Jonge, J., & Schaufeli,
W. B., 1998). The Job Characteristics Model (JCM) proposes five core job dimensions
(autonomy, feedback, skill variety, and task identity and task significance) which reflect the
experienced meaningfulness, responsibility and knowledge of the job (R. B. Briner , 2000). In
the Demand-Control-Model (DCM) the relationship between job demand and wellbeing (health)
depends on the level of control. Jobs which have negative impact on health are jobs combined
with high demand and low control (Karasek, R. A., Jr., 1979).
Many researchers who focus on job characteristics have used these models. Warr (1999)
developed a model incorporating the JCM and the JDC model. This model is part of his vitamin
model which includes many variables of wellbeing. It is based on 12 job features which can
make a job enjoyable or not. Also (Frederick P. Morgeson and Stephen E. Humphrey, 2006)
have developed another model for job design. They have divided job design in motivational,
social and contextual job design characteristics. They have included also a wide range of job
designs to acknowledge the job and the links between job and the environment in which the job
is performed (Parker, S. K., & Wall, T. D. , 1998). Researcher have used different approached to
assess job designs.
Most of the research done on the relationship between job design and absenteeism have
found a significant negative correlation (Stamm, C & Farrel, D, 1988) and (J. R. Rentsch, R.P.
Steel, 2003) and especially for autonomy, feedback from the job and skill variety (Fried, Y., &
Ferris, G. R. ., 1987). Absenteeism is assumed to be influence by the job design aspects as low
autonomy and repetitiveness (Bain, P. and Taylor, P. , 2000), (Peter G. W. Smulders, 1983) and
bad working condition (Peter G. W. Smulders, 1983) Low autonomy and repetitiveness

18 | P a g e
(monotony of work) restricts the opportunity for learning and handling problems at work
properly and thus implying negative relationship with job satisfaction and workload (Hackman,
J. R. and Oldham, G. R., 1980).
Researchers as (Philipsen, H. , 1969) and (Shepherd, R. D. and Walker. J., 1957), have
found a positive relation between one or more unpleasant working conditions (noise, dust, heavy
work, etc.) and absence. More recent research shows that workload is related to health problems
(Hendrix, W.J., Steel, R.P. & Shultz, S.A., 1987). Also there is a relationship between job
characteristics and job satisfaction. Work which is more challenging, meaningful and
autonomous is also more satisfying and motivational (Fried, Y., & Ferris, G. R. ., 1987) and
(Hackman, J. R., & Oldham, G. R., 1975).
The study is carried out in the agriculture banana industry. Work in a banana farm is
labor intensive and 90 % of the work is done manually. The work itself is mostly repetitive with
low autonomy. The physical working conditions are specific and the general perception of
workload is high or heavy workload. To assess the relation between job design and absenteeism
the following hypothesis are formulated:
Ho2: High perceived workload result in higher absenteeism
Ho3: High physical workload result in higher absenteeism
Ho4: There is no relation between job design and absenteeism
2.3.3 Organizational commitment and absenteeism
Organizational commitment can be referred to as a behavior or an attitude (Mowday, R. T.,
Porter, L. W., & Steers, R. M., 1982) When an employee becomes committed because of
financial consequences in case he/she decides to leave it is a behavior. Organizational

19 | P a g e
commitment referred as an attitude can be defined as a state in which an employee identifies with
a certain organization and its goal, and the employee wishes to be a member of this organization
in order to facilitate its goals.
Other researchers divide organizational commitment in 3 types of commitment: the
affective, the continuous and the normative commitment (Allen, N. J. and Meyer, J. P., 1990).
The affective commitment is the emotional attachment, the identification with and the
involvement in the organization. Continuous commitment is the commitment linked to the costs
that an employee associates with, in case of leaving the company. And normative commitment
has to do with the feeling of obligation to stay in the organization.
Most of the studies done on organizational commitment and absenteeism have found a
negative relationship (Payne, S.C., & Huffman, A.H. , 2005); (Harrison, D. A., & Martocchio, J.
, 1998); (Mowday, R. T., Porter, L. W., & Steers, R. M., 1982). Employees who are committed
are dedicated, loyal, looking for long term relationships with the organization and social
responsible. They are less likely to be absent because of the negative consequences it can have
on the company. Some researchers suggest that when organizational commitment increases, job
satisfaction increases, and absenteeism decreases (Stamm, C & Farrel, D, 1988); (Somers, M. ,
1995). In this study the general perception of organizational commitment will be assessed in
relation with absenteeism. The following hypothesis will be tested:
Ho5: More committed employees are less absent.
2.3.4 Psychological wellbeing
Researchers have used many different definitions of psychological wellbeing. Psychological
wellbeing is a person‟s cognitive and affective evaluation of his/her life (Diener, E., Seligman,

20 | P a g e
M.E.P., 2002) and it refers to how healthy, satisfied and happy someone is about life (Rainey, D.,
1995). It is their own perception about the quality of their life which can be influence by
different factors (Wright, T.A. & Staw, B.M., 1999). (Ryff, C. D. , 1989) has divided
psychological wellbeing in 6 dimensions; self-acceptance, environmental mastery, positive
relations with others, purpose in life, personal growth and autonomy. Employees achieve higher
psychological wellbeing by working towards a goal they think are worthwhile, with the support
of the manager and the whole team (Ivan T. Robertson, Cary L. Cooper, 2010). Psychological
wellbeing has an impact on absenteeism since healthier, happier and more satisfied employees,
are likely to work harder and take less sick days (Ivan T. Robertson, Cary L. Cooper, 2010). In
this study we therefore hypothesize that:
Ho6: Employees with higher level of psychological wellbeing are less absent

21 | P a g e
3 RESEARCH METHODOLOGY
3.1 Introduction
The research was conducted in the banana production company of Suriname “Stichting Behoud
Bananen Sector” (SBBS) employing 2500 employees. This company cultivates, harvests,
packages and exports the fruit with around 2200 employees, mostly low skilled. Almost 90 % of
the work in the farms and packing stations are done manually. Besides absenteeism due to
sickness, employees are absent for many different reasons. Employees who are on sick leave are
also sometimes not really sick. Perhaps there are other underlying reasons why they didn‟t come
to work and sometimes they even don‟t realize that. For this reason this research is divided in
two parts. In the first part a survey was conducted to have an opinion from employees and
management about the main reasons of absenteeism. The second part of this research was
implemented to find the relationship between absenteeism and 5 variables of employee
wellbeing. The data of the first part was analyzed only descriptive and the second part a
regression analysis was carried out.

22 | P a g e
3.2 Research Model
Most of the research done on absenteeism, have found relationship with these variables; job
satisfaction, job design, workload, organizational commitment and psychological wellbeing.
These variables were measured by different validated scales to establish the correlation with
absenteeism in this company.
Job Design
Job Satisfaction
Psychological wellbeing
AB
SE
NT
EE
ISM
Organizational
Commitment
Workload
Age, Gender, Tenure, No of
children, Marital Status
EM
PL
OY
EE
WE
LL
BE
ING
23 | P a g e
3.3 Research Method
To investigate opinions from management and workers about the reasons why workers missed
work, a questionnaire was developed. This questionnaire was listed with 15 reasons for being
absent, as identified in previous research and also from information of human resources
department of the company. Management was asked to identify why they feel that their workers
were absent from their work and workers were asked to identify the reasons why they actually
missed work. Both types of respondents had to rate each reason as “strong” or weak” on a scale
from 0 to 6. It was also possible to write down additional reasons for absence. The data collected
is a mix qualitative and quantitative. A comparison is made between the opinion and perception
of the employees and management.
Absenteeism can be measured in frequency and duration. Frequency is the number of absence
occurrence (incidences) and duration is the total number of days absent. In this study
absenteeism is measured in frequency and all types of absence are included since sick leave or
leave because of injuries in many cases are not clear. I have gathered one year absenteeism data
from the selected sample through the human resources department of SBBS.
The scales to measure the variables included in this study of the construct employee wellbeing
have demonstrated acceptable reliability and validity in previous studies (Warr, P. B., Cook, J.
and Wall, T. D. , 1979), (Currivan, 2000), (Hollmann S, Klimmer F, Schmidt K, Kylian H. ,
1999), (Goldberg, D. & Huxley, P. , 1980).
The Job Satisfaction Scale of (Warr, P. B., Cook, J. and Wall, T. D. , 1979) was used to measure
job satisfaction. From this scale with 15 items, 2 items were excluded due to misinterpretations.
The 13 items consisted of different aspects of the job. None of the items were reverse scored.

24 | P a g e
Respondents had to indicate their level of satisfaction for each items on a 7-point liker scale how
satisfied they were with the different aspects, from very dissatisfied to very satisfy.
For the measurement of job design, the scale of (Warr, P. , 1999) was used. This scale was
developed on the basis of the 12 features of the “Vitamin Model” of (Warr, P. , 1999). It consists
of 26 items which account for each of the 12 features in this model. Due to a low number of
items in each subscale it was not possible to determine the reliability of all the 12 subscales. On a
7-point liker scale the respondents had to indicate from 0 to 6 how much of each features
included in their job. None of the questions were reverse-scored. The score of this scale gives an
interpretation of how enjoyable a job is for a respondent. A high score indicate an enjoyable job
(Warr, P. , 1999).
The perceived workload was measured by the 3 item scale of (Currivan, 2000). Respondents had
to indicate on a 5-point liker scale from strongly agree to strongly disagree for the 3 items related
to the speed of working, the time available and how heavy the job is. All 3 items were reverse
scored. For assessing the physical workload a questionnaire of (Hollmann S, Klimmer F,
Schmidt K, Kylian H. , 1999) with 19 items, describing different work situations was used. Five
items described the postures of the trunk, 3 items asked for the positions of the arms, 5 items
asked for positions of the legs and the last 6 items described the lifting of weights. Respondents
were asked how often they have to work with the body postures described and how often they
have to lift or carry the weights mentioned. The answers were given on a 5-point liker scale from
“never” to “very often”. The score of these 19 items were multiplied with weighting factors to
calculate an index of physical workload (Hollmann S, Klimmer F, Schmidt K, Kylian H. , 1999).
A high score indicates a higher physical workload.

25 | P a g e
Organizational Commitment was measured by the 4 item scale of (Currivan, 2000) on a 5-point
liker scale. Three items were reverse scored. A high score indicates that the respondent is more
committed to the organization he or she works for.
The score of psychological wellbeing tend to be relative when people compare themselves with
others or with other periods in their past lives (Argyle, M., 1997). The same amount of'
„happiness‟ can be scored differently or different levels of happiness can have the same score.
That‟s why it is important for this study to find a more objective questionnaire. The General
Health Questionnaire (GHQ-12) is objective and reliable indicator of psychological distress
(Argyle, M., 1997), and is used by many researchers to asses psychological wellbeing (Goldberg
D, 1978) The GHQ-12 is a 12 item scale of (Goldberg, D. & Williams, P, 1988) and it measures
both positive and negative aspects of mental health. It focuses on the inability to carry out
normal functions and the appearance of new distressing experiences. Each item is rated on a 4-
point liker scale from strongly disagree (scored 0) to strongly agree (scored 3). From the 12
items 6 are reverse coded (question 1,3,4,7,8,12). High score for this scale correspond with low
feelings of psychological wellbeing (high levels of stress/depression) and healthy individuals
will score around 10-13 (Goldberg, D. & Williams, P, 1988).
3.4 Sampling and Data Collection
The survey was conducted by two students of the local university. They were involved from the
sampling, the testing of questionnaires and collecting the data. Eight employees were involved in
testing the questionnaires and after that some small corrections were made to clarify some

26 | P a g e
questions. All questionnaires were back to back translated in Dutch before. It was also clear
during this testing that except of the illiterate employees, some of the others also needed
assistance in understanding the questions. So for both part of the survey assistance to fill in the
questionnaire was necessary due to the fact that some employees were illiterate, and some didn‟t
understand the Dutch language. The questionnaires for the management were filled in by
themselves.
The sampling for the first part of the survey was at random. From 5 different farms 20 workers
were selected at random. This survey was anonymous. The management team consists only of 75
employees and compared to the rest of the workforce it is very small. All 75 were chosen for the
survey. For the second part the sampling was done on basis of the different functions in the
company, except the management. This was to include as much as possible all types of work
with different aspects. With the support of the human resources department 30 functions were
identified. From each function 5 employees, employed longer than one year were selected. In
total 150 employees were selected. Only employees working more than one year were included
in this study, since I needed absenteeism data for one year.
The first survey was done in small groups of ten, at convenient times and the second was done
per person. It was organized per department and mostly early in the morning and late in the
afternoons. The two students explained the purpose of this study and how to complete the
questionnaire. They stressed also to all the respondents that the results of the survey would be
handled with strict confidentiality. No contact with co-respondents was allowed during these
sessions to avoid influencing each other. The 150 respondents for the second part of the survey
had to write down their registration number on the questionnaire in order to link the information
on the questionnaire with absenteeism data. The complete survey was done in 3 weeks. From the

27 | P a g e
150 questionnaire 43 were rejected because I was unable to match their code with company
absenteeism data. Some codes were missing, some were incorrect and some were incomplete.
28 | P a g e
4. ANALYSES AND RESULTS
4.1 Reported Reasons for being absent
The purpose of this mix of qualitative and quantitative analysis was to identify the reasons why
workers miss work, as believed by management and reported by the workers themselves.
Self-reported reason for being absent
Workers had to rate the actual reasons for missing work using a scale from 0 to 6, with 0
indicating not a reason for absenteeism, 1 indicating a weak reason and 6 indicating a strong
reason. None of the respondents added another reasons for being absent on the list. The data was
analyzed in a descriptive way. The average rating for the different reasons was calculated and is
presented in Table 2. The rating of the 17 reasons the workers reported for actually missing work
are arranged from strongest to weakest reason. The 5 strongest reasons for absenteeism as
reported by the workers were (1) personal illness, (2) doctor appointments, (3) injuries, (4)
child/family illness, and (5) tired.
Reported reasons for absenteeism as believed by Managers
Managers were asked to rate a list of reasons they felt (believed) workers are absent. The rating
was the same as that of the workers. Two respondents added 3 other reasons they believe
workers are absent and they are: time needed to arrange their personal schedule, lack of
responsibility (towards company or family) and no permitted days on leave available. Because
of the low rating for these reasons they were excluded from further analysis. The results are also

29 | P a g e
presented in Table 2. The 5 strongest reasons managers believed workers are absent were (1)
personal illness, (2) tired, (3) child/family illness, (4) transport problems, and (5) wage rate.
Table 2: Rating of reported reasons for absenteeism
Mean rating Mean difference
Reason for Absenteeism Workers Management Significance
Personal illness 2.15 2.57 0.011
Doctor appointments 1.75 1.24 0.017
Injury 1.44 1.29 0.375
Family/Child illness 1.30 1.75 0.017
Tired 1.16 1.83 0.000
Excessive rework 0.94 0.72 0.206
Transport problems 0.89 1.54 0.000
Wake up late 0.65 1.22 0.000
Wage rate 0.63 1.37 0.000
Simply did not feel like working 0.60 1.00 0.006
Too much overtime 0.46 0.69 0.149
No childcare 0.37 1.25 0.000
Unsafe working conditions 0.37 0.27 0.360
Bad weather 0.32 0.83 0.000
Travel distance 0.31 0.52 0.128
Bad relations with boss/co-worker 0.28 0.28 0.951
Under influence of drugs or alcohol 0.10 0.58 0.000

30 | P a g e
Comparison between the reasons reported from workers and management
Both managers and workers agreed that the strongest reason for being absent is personal illness.
Also illness of a child or family member and tiredness are also two important reasons. To
compare the rating of the two groups, the mean difference was calculated with an independent
sample test in SPSS. For 4 reasons there is a significant difference and practical importance in
the mean rating between the workers and management. The workers reported “doctor
appointment” as the second important reason while management believed that workers rarely
miss work because of this. Management believed that 3 reasons were significant causes for
absenteeism while workers reported that they often miss work for these following reasons:
transport problems, wage rate and no childcare.
Graph 1 Rating reasons for absenteeism

31 | P a g e
4.2 Results and analyses of Wellbeing and Absenteeism
4.2.1 Reliability
The reliability tests were done with SPSS and the Cronbach‟s Alpha was above 0.7. This means
that all scales used in this study were reliable. Three questions from the Job Design scale were
not included in the analyses since these question were not clear to the respondent which led to
misinterpretations (no5, 8, and 10). Table 3 shows the results of the reliability tests. It was not
possible to test the reliability of all the 12 subscales of the job design scale. Only from the
subscales with 3 or more items the test was done and those are job demand (0.54), feedback
(0.286) and safety (0.614). The Cronbach‟s Alpha‟s were lower than 0.7, indicating a low
reliability. From the scale of wellbeing question 12 was also removed since this question seems
to be contradictory to the rest of the questions and in a way misleading the respondents of this
survey.
Table 3: Reliability Statistics
Cronbach's
Alpha No of Items N
Job Satisfaction .724 13 107
Job design .766 23 105
- Job Demand .540 5 105
- Feedback .286 3 105
- Safety .614 3 105
Organizational commitment .745 4 105
Perceived Workload .706 3 107
Physical workload .772 19 107
Psychological wellbeing .708 11 107
32 | P a g e
4.2.2 Descriptive Statistics
The descriptive analysis of the data from the second part of the survey was done with SPPS.
Table 4 presents the mean, the standard deviations and significance level of the mean difference
of the moderating, independent variables and dependent variables, separately for men and
women. For the analysis the item marital status was re-coded; 0 was coded for living alone and1
for married or living together. Gender was coded 1 for men and 2 for women. To analyze the
difference of the different variables, an independent sample test was carried out to compare the
means with significant differences. The majority of the sample consisted of men (70%). The
mean age of the sample is 41.4 years and there is no significant difference in the mean of men
(41.9 years) and women (40.1 years). Table 4 shows that men and women had significantly
different means on marital status, no of children living at home, tenure and physical workload.
Approximately half of the sample is “married” or “living together”, but men were “married” or
“living together” (67%) in more significant cases than women (25%). This means that women
employees are more “single” or “living alone”, than men. The average number of children living
at home is 1.83. Women have significantly more children at home (2.47) than men employees
(1.56). The average number of years employed in the company is 6.45 years and it is
significantly longer for men (6.91) compared to women (5.38).
There is no significant difference between men and women in the mean of job satisfaction, job
design, organizational commitment, perceived workload and psychological wellbeing. The
average score of job satisfaction was 63.18 from a maximum of 91. The employees were on
average satisfied for 70%. The job design score gives an indication of how enjoyable a job is
perceived and the mean score was 87.28 from a maximum of 156. This indicates that the level of

33 | P a g e
enjoyment of the job is 56%, which is low. Employee commitment is around 70% and perceived
workload 64 % from the maximum scores. The physical workload is significantly different for
men and women. Men have an average score of 21.22 and women have 11.63. This means that
the workload of men is almost the double of that of the women. The results of psychological
wellbeing in this survey was on average 10.98 and according to Goldberg, D. and Williams, P.
(1988) healthy employees will score around 10-13. This indicates that the employees in this
survey had normal levels of stress/depression and could be considered psychologically healthy.
Table 4: Descriptive Statistics
N (107) Male (N=75) Female (N=32) Mean diff
Moderating Variables Mean SD Mean SD Mean SD t Sign.
Age 41.4 11.03 41.9 11.09 40.1 10.9 0.794 0.429
Marital Status 0.54 0.50 0.67 0.47 0.25 0.44 4.247 0.000
No of children living at
home 1.83 1.93 1.56 1.52 2.47 256 -2.28 0.025
Tenure 6.45 2.43 6.91 2.38 5.38 2.22 3.108 0.020
Independent Variables
Job Satisfaction 63.18 11.01 62.59 11.45 64.56 9.94 -0.85 0.398
Job Design 87.28 16.94 85.33 17.44 91.88 14.96 -1.85 0.067
Organizational
Commitment 13.86 3.54 13.61 3.64 14.44 3.26 -1.11 0.272
Perceived Workload 9.56 2.99 9.8 3.06 9 2.78 1.27 0.207
Physical Workload 18.35 12.97 21.22 13.79 11.63 7.41 3.708 0.000
Psychological
Wellbeing 10.98 4.53 11.53 4.76 9.69 3.68 1.957 0.053
Dependant Variable
Absenteeism 17.20 14.39 16.21 13.87 19.5 15.51 -1.08 0.281
4.2.3 Correlation between variables of employee wellbeing and absenteeism
34 | P a g e
A correlation analyses was carried out in SPPS to measure the relationship between the
moderating, the independent and the dependent variables. The results are presented in table 5.
From the moderating variables only age and tenure were significantly correlated to absenteeism.
Older employees are significantly less absent than younger employees (p<0.05) and employees
who have more time in the company are significantly less absent than employees with less years
working for the company. The results show also that there is a significant correlation between
gender and physical workload. Women have a significant lower physical workload in this
company than men (p<0.001). Also older employees have a significantly higher rating of job
design, indicating that older employees perceive their job more enjoyable than younger
employees.
None of the independent variables were significantly correlated to absenteeism. Job Satisfaction
was significantly correlated with job design, perceived workload and wellbeing (p <0.001). The
strongest positive correlation was with job design; employees who are more satisfied have a
perception of a more enjoyable job. Workload and wellbeing are negatively correlated to job
satisfaction. A higher perceived workload results in less satisfied employees. A high score of
wellbeing indicated a low feeling of psychological wellbeing (high levels of stress/anxiety).
Employees with low feelings of psychological wellbeing are significantly less satisfied with their
job (p<0.001). Job design is also significantly negatively correlated to workload and wellbeing.
And perceived workload is also significantly positively correlated to workload and wellbeing.
There is no significant correlation between commitment and any of the independent variable.

35 | P a g e
Table 5: Results of Correlation Analyses
Freq. of
Absence
Job
Satisfaction
Job
Design
Commit
ment
Work
load
Well
being
Physical
Workload
Moderating
Gender .105 .083 .178 .107 -.123 -.188 -.340**
Age -.208* .101 .220* -.026 -.040 -.062 -.023
Marital Status -.189 .073 .059 .054 .161 .092 .145
No of Children .119 -.055 -.086 .100 -.062 -.061 .004
Tenure -.197* -.002 .038 -.013 .001 .070 -.063
Wellbeing
Job satisfaction .027 1 .719** .015 -.389** -.452** -.104
Job design -.037 .719** 1 .004 -.358** -.433** -.124
Commitment .096 .015 .004 1 .151 .084 -.004
Workload .099 -.389** -.358** .151 1 .371** .270*
Psychological
Wellbeing -.179 -.452** -.433** .084 .371** 1 .181
Physical
Workload .081 -.104 -.124 -.004 .270* .181 1
Frequency of
Absence 1 .027 -.037 .096 .099 -.179 .081
* p < 0/.05; ** p < 0/.001; (all two-tailed).
A second correlation test was carried out to analyze the relation between the different subscales
of job design and absenteeism (Table 6). The subscales money and safety were significantly
correlated to absenteeism. Employees who were less satisfied with the payments were more
absent. And employees who perceived their work environment as unsafe were more absent.

36 | P a g e
Table 6: Results of Correlation Analyses of the 12 features of Job Design
12 Features of Job design Frequency of
Absence
Sign.
Personal Control -.049 0.616
Skill use -.102 0.297
Job Demand -.056 0.565
Task variety -.022 0.824
Environmental Clarity -.040 0.683
Contact with others -.098 0.313
Money -.197* 0.042
Safety -.201* 0.038
Valued Social position .002 0.983
Supportive supervision -.043 0.657
Career outlook .091 0.350
Equity -.079 0.419
* p < 0/.05; ** p < 0/.001

37 | P a g e
4.2.4 Regression Analyses
To obtain a better view of the relationship between the dependent variable “Absenteeism” and
the 5 independent variable and the 5 moderating variables a regression analyses was performed.
A full regression analyses was carried out with the variable absenteeism on all the 10 variables
and the results are presented in Table 7. The only variable which is significant predictor of
absenteeism according to these results is psychological wellbeing (t=-2.225, p=0.028).
Employees with higher levels (feelings) of psychological wellbeing are less absent. In the
correlation analyses there were significant correlation between age and absenteeism and tenure
and absenteeism.
Table 7: Results of Regression Analyses
Model
Unstandardized
Coefficients
Standardized
Coefficients
t Sig. B Std. Error Beta
1 (Constant) 22.033 15.364 1.434 .155
Gender -.386 3.695 -.012 -.105 .917
Age -.254 .159 -.194 -1.600 .113
Marital Status -3.470 3.247 -.121 -1.069 .288
No of Children 1.304 .806 .174 1.617 .109
Tenure -.357 .665 -.060 -.537 .593
Physical Workload .089 .117 .080 .763 .447
Job Satisfaction .089 .186 .068 .480 .633
Job Design -.039 .124 -.046 -.317 .752
Commitment .292 .394 .072 .742 .460
Workload .911 .533 .189 1.708 .091
Wellbeing -.786 .353 -.247 -2.225 .028
a. Dependent Variable: Frequency of Absence

38 | P a g e
The results of the regression analyses show that there is no correlation between independent
variables job satisfaction, job design, workload (perceived and physical), organizational
commitment and the dependant variable absenteeism. Therefore I reject the hypotheses: Ho1,
Ho2, Ho3, and Ho5. Ho4 was accepted since the results shows that there is no significant relation
between job design and absenteeism. Ho6 is also accepted since the results shows that higher
levels of psychological wellbeing are significantly less absent.
Ho1: Employee’s who are more satisfied with their job are less absent (Reject)
Ho2: High perceived workload result in higher absenteeism (Reject)
Ho3: High physical workload result in higher absenteeism (Reject)
Ho4: There is no relation between job design and absenteeism (Accept)
Ho5: More committed employees are less absent. (Reject)
Ho6: Employees with higher level of psychological wellbeing are less absent (Accept)
39 | P a g e
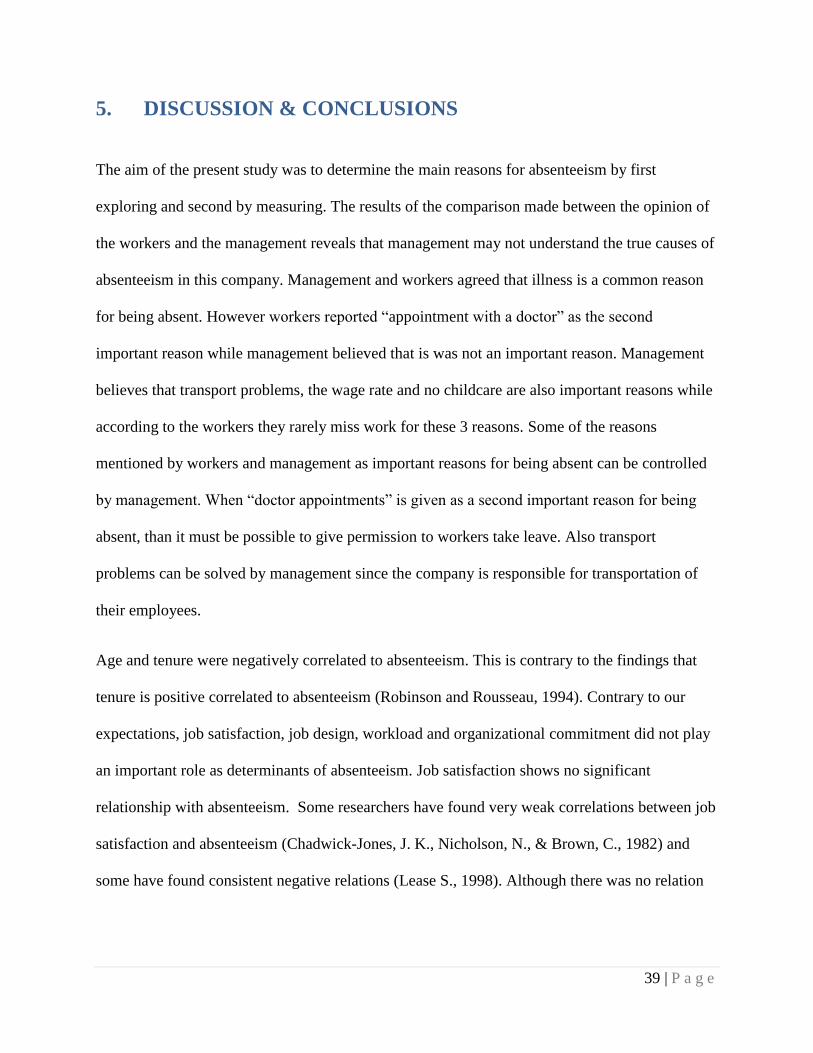
5. DISCUSSION & CONCLUSIONS
The aim of the present study was to determine the main reasons for absenteeism by first
exploring and second by measuring. The results of the comparison made between the opinion of
the workers and the management reveals that management may not understand the true causes of
absenteeism in this company. Management and workers agreed that illness is a common reason
for being absent. However workers reported “appointment with a doctor” as the second
important reason while management believed that is was not an important reason. Management
believes that transport problems, the wage rate and no childcare are also important reasons while
according to the workers they rarely miss work for these 3 reasons. Some of the reasons
mentioned by workers and management as important reasons for being absent can be controlled
by management. When “doctor appointments” is given as a second important reason for being
absent, than it must be possible to give permission to workers take leave. Also transport
problems can be solved by management since the company is responsible for transportation of
their employees.
Age and tenure were negatively correlated to absenteeism. This is contrary to the findings that
tenure is positive correlated to absenteeism (Robinson and Rousseau, 1994). Contrary to our
expectations, job satisfaction, job design, workload and organizational commitment did not play
an important role as determinants of absenteeism. Job satisfaction shows no significant
relationship with absenteeism. Some researchers have found very weak correlations between job
satisfaction and absenteeism (Chadwick-Jones, J. K., Nicholson, N., & Brown, C., 1982) and
some have found consistent negative relations (Lease S., 1998). Although there was no relation
40 | P a g e
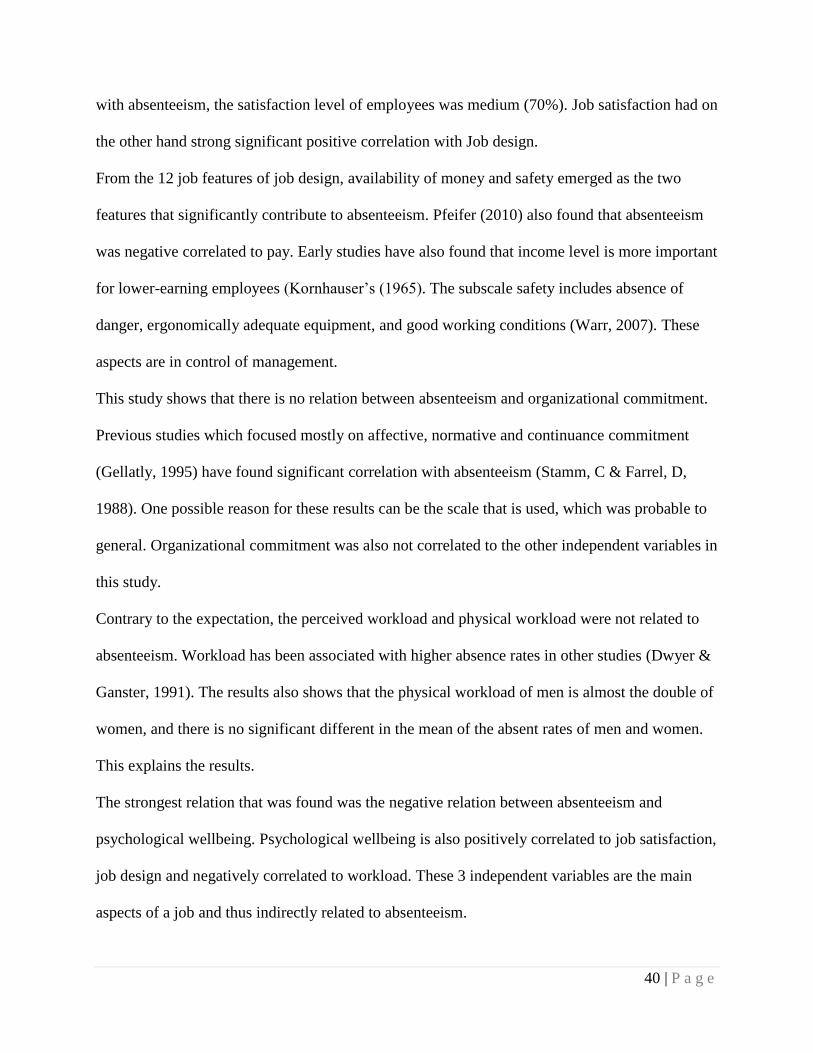
with absenteeism, the satisfaction level of employees was medium (70%). Job satisfaction had on
the other hand strong significant positive correlation with Job design.
From the 12 job features of job design, availability of money and safety emerged as the two
features that significantly contribute to absenteeism. Pfeifer (2010) also found that absenteeism
was negative correlated to pay. Early studies have also found that income level is more important
for lower-earning employees (Kornhauser‟s (1965). The subscale safety includes absence of
danger, ergonomically adequate equipment, and good working conditions (Warr, 2007). These
aspects are in control of management.
This study shows that there is no relation between absenteeism and organizational commitment.
Previous studies which focused mostly on affective, normative and continuance commitment
(Gellatly, 1995) have found significant correlation with absenteeism (Stamm, C & Farrel, D,
1988). One possible reason for these results can be the scale that is used, which was probable to
general. Organizational commitment was also not correlated to the other independent variables in
this study.
Contrary to the expectation, the perceived workload and physical workload were not related to
absenteeism. Workload has been associated with higher absence rates in other studies (Dwyer &
Ganster, 1991). The results also shows that the physical workload of men is almost the double of
women, and there is no significant different in the mean of the absent rates of men and women.
This explains the results.
The strongest relation that was found was the negative relation between absenteeism and
psychological wellbeing. Psychological wellbeing is also positively correlated to job satisfaction,
job design and negatively correlated to workload. These 3 independent variables are the main
aspects of a job and thus indirectly related to absenteeism.

41 | P a g e
The conclusion of this study is that absenteeism is significantly influenced by illness, thus the
psychological wellbeing of the employee, availability of money, safety, age and tenure.

42 | P a g e
6. RECOMMENDATIONS & LIMITATIONS
6.1 Recommendations
The results of both surveys show that illness is the mayor reasons for employee‟s absence. In
practice we see that employees often have sick leave, when they are not really sick. In Suriname
also the culture exist that when an employer has a doctor appointment, the doctor normally gives
on day leave even if the employer is not sick. To solve this, method must be developed to ensure
that doctors do not issue unjustified sickness certificates. This only can ensure that workers
report sick when they are really sick. This for example can be controlled with special company
doctors or company clinics.
Before recruitment of employees, a medical check must be done to ensure that the new
employees are medically fit to do the job. Another recommendation is to send employees who
are regularly sick for a second medical check to ensure that the employee is medical and
physically fit to do the job required. This is very important because of the physically intensive
labor requirements. Policies need to be put in place how to handle employees after a medical re-
check.
In both studies was safety given as one of the significant reasons for being absent. The company
has to look into this and find solutions for a safe work environment and adequate equipment with
the right procedures. The risk assessment should be evaluated and possibly extended.

43 | P a g e
Return to work interview is also a recommendation in order to decrease absenteeism. When an
employee is absent for a day, his direct supervisor should have an interview the next day he/she
is present, to find out what the reasons is for the absence and find solutions for the reason which
are in control of management and give support, if possible for reasons out of management
control. Injury was the third important reason for being absent and this is largely controllable by
management. Preventive is always better than curative.
6.2 Limitations & Future Research
One of the important limitations of this study was the language barrier. Many respondents had
problems with the Dutch language since it wasn‟t their main language and it was difficult to
understand the questions. The respondent group consisted also of foreigners from Haiti and
Guyana. Most of the Surinamese respondents have also their own language (dialect). The two
students from the university helped in translating and explaining the question verbally. The
survey was done mostly per respondent.
Another potential limitation for the second part of the survey was that it could not be
anonymous. In order to link the variables that were measured with actual absenteeism data, it
was necessary to have individual information. Confidentially was assured by expressing that this
research was for academic use and only the results would be presented to the company. A few
participants had some concern in this regard, and I can‟t be sure that this didn‟t bias the
responses. The questionnaires without registrations coded were excluded for further analyses.

44 | P a g e
Analyses in dept of the subscales of job design would have given also more insight in the
different aspect of the job design. Due to a low reliability of some of the subscale the decision
was taking to measure job design as one variable.
In this survey 5 independent variables were measured. It is also possible that one or more
important variable was not included. There is not must research done in Suriname and the
Caribbean about this topics and it is interesting to explore to find more information on causes of
absenteeism. Culture could be probable one of them. For future research it is also important to
make distension between absenteeism and sickness absenteeism. This will allow having more
detailed analyses about the relation between the different variables. This survey was carried out
in the agricultural sector and the results could be generalized to other sector were physical labor
is essential like the building and construction sector. Research in other sectors and comparisons
between sectors is also necessary for efficient human resources management in the future.
45 | P a g e
BIBLIOGRAPHY
Allen, N. J. and Meyer, J. P. (1990). The measurement and antecedents of affective, continuance
and normative commitment. Journal of Occupational Psychology, Volume 63, 1-18.
Argyle, M. (1997). Is happiness a cause of health? . Psychology & Health, Volume 12.
Awad S. Hanna, M., Cindy L. Menches, M., Sullivan, K. T., & Sargent, a. J. (November 2005).
Factors Affecting Absenteeism in Electrical Construction. Awad S. Hanna, M.ASCE; Cindy L.
Menches, M.ASCE; Kenneth T. Sullivan; and Joseph R. Sargent. Factors Affecting Absenteeism
in ElectricalJournal of Construction Engineering and Management, Vol. 131, No. 11, 1212-
1218.
Bain, P. and Taylor, P. . (2000). Entrapped by the Electronic Panopticon?: Worker Resistance in
the Call Centre. New Technology, Work and Employment 15(1), 2-18.
Betty Jane Punnett, Dion Greenidge, Jase Ramsey. (2007). Betty Jane Punnett, Dion Greenidge,
Jase Ramsey. Job attitudes and absenteeism: A study in the English speaking Caribbean. Journal
of World Business. Volume 42 , 211-227.
Bradbury, H., & Lichtenstein, B. M. B. . (2000). Relationality in organizational research:
Exploring the space between. Organization Science, 11(5), 551-564.
Brooke, P. (1986). Beyond the Steers and Rhodes Model of Employee Attendance. Academy of
Management Revieuw, 11:345-61.
Brooke, P.P. and Price, J.L. (1989). 'The Determinants of Employee Absenteeism: An Emperical
Test of a Causal Model. Journal of Occupational Pschychology, Volume 62, 1-19.
Chadwick-Jones, J. K., Nicholson, N., & Brown, C. (1982). Social psychology of absenteeism.
New York: Praeger Publishers.
Currivan, D. B. (2000). The Causal Order Of Job Satisfaction and Organizational Commitment.
D.B. Currivan. The Causal Order Of Job Satisfaction.
De Jonge, J., & Schaufeli, W. B. (1998). Job characteristics and employee well-being: a test of
Warr‟s Vitamin Model in health care workers using structural equation modeling7. Journal of
Organizational Behavior, 19,, 387-407.
Diener, E., & Seligman, M. E. P. (2004). Beyond money. Psychological Science in the Public
Interest, Volume 5. No 1, 1-3.
Diener, E., Seligman, M.E.P. (2002). Very happy people. Psychological Science, Volume 13, 81-
84.

46 | P a g e
Fisher, C. D. (2003). Why do lay people believe that satisfaction and performance are correlated?
Possible sources of a commonsense theory. Journal of Organizational Behavior, Volume 24. No
6, 753-777.
Fred Luthans & Mark Martinko . (1976). An Organizational Behavior Modification Analysis Of
Absenteeism. Human Resource Management, 11-18.
Frederick P. Morgeson and Stephen E. Humphrey. (2006). The Work Design Questionnaire
(WDQ): Developing and Validating a Comprehensive Measure for Assessing Job Design and the
Nature of Work . Journal of Applied Psychology.
Fried, Y., & Ferris, G. R. . (1987). The validity of the job characteristics model: A review and
meta-analysis. Personnel Psychology, Volume 40., 287-322.
Goldberg D. (1978). Manual of the General Health Questionnaire. Windsor: NFER Publishing
Company.
Goldberg, D. & Huxley, P. . (1980). Mental Illness in the community: The pathway to psychiatric
care. London: Tavistock Publications.
Goldberg, D. & Williams, P. (1988). A users guide to the General Health Questionnaire. NFER-
Nelson.
Hackman, J. R. and Oldham, G. R. (1980). Work redesign. Massachusetts: Addison-Wesley.
Hackman, J. R., & Oldham, G. R. . (1975). Development of the Job Diagnostic Survey. Journal
of Applied Psychology,Volume 60, 159-170.
Hackman, J. R., & Oldham, G. R. (1975). Development of the Job Diagnostic Survey. Journal of
Applied Psychology, Volume 60, 159-170.
Hammer, T. H., & Landau, J. . (1981). Methodological issues in the use of absence data. Journal
of Applied Psychology.Volume 66, 574-581.
Harrison, D. A., & Martocchio, J. . (1998). Time for absenteeism: A 20-year review of
origins,offshoots, and outcomes. Harrison, D. A., & Martocchio, J. J. (1998). Time for
absenteeism: A Journal of Management, Volume 24, No 3, 305 - 350.
Hendrix, W.J., Steel, R.P. & Shultz, S.A. (1987). Job stress and life stress: Their causes and
consequences. Hendrix, W.J., Steel, R.P. & Shultz, S.A. (1987). Job stress andJournal of Social
Behavior and Personality, Volume 2. No 3, 291-302.

47 | P a g e
Hinze, J., Ugwu, M., and Hubbard, L. (1985). Absenteeism in construction industry. Journal
Management Engineering. Volume 1. No 4, 188-200.
Hollmann S, Klimmer F, Schmidt K, Kylian H. . (1999). Validation of a questionnaire for
assessing physical work load. Scand Journal Work Environment Health, Volume 25. No 2, 105-
114.
Hollmann S, Klimmer F, Schmidt K-H, Kylian H. (1999). Validation of a questionnaire for
assessing physical work load. Scand Journal Work Environment Health. Volume25. No 2, 105-
114.
Ivan T. Robertson, Cary L. Cooper. (2010). Full engagement: the integration of employee
engagement and psychological well-being. Leadership & Organization Development Journal
Vol. 31 No. 4, 324-336.
J. R. Rentsch, R.P. Steel. (2003). What does unit-level absence mean? Issues for future unit level
absence research. Human Resource Management Review. Volume 13, No 2, 185-202.
J. R. Rentsch, R.P. Steel. (2003). What does unit-level absence mean? Issues for future unit-level
absence research. Human Resource Management Review, Volume 13 , 185-202.
Jase Ramsey, Betty Jane Punnett and Dion Greenidge. (2008). A social pscychological account
of absenteeisme in Barbados. Human Resource Management,Volume 18, No 2, 2008, 97 - 117.
Judge, T. A., & Watanabe, S. . (1993). Another look at the job satisfaction-life satisfaction
relationship. Journal of Applied Psychology, 78(6), 939-948.
K.D. Scott, G.Stephen Taylor . (1985). An Examination of Conflicting findings on the
relationship between Job Satisfaction and Absenteeism: A Meta-Analysis. Academy of
Management Journal, 1985, Vol. 28, No. 3, 599-612.
K.D. Scott, G.Stephen Taylor . (1985). An Examination of Conflicting findings on the
relationship between Job Satisfaction and Absenteeism: A Meta-Analysis . K.D. Scott, G.Stephen
Taylor. An Examination of Conflicting findings on the relationship between Job Satisfact
Academy of Management Journal, 1985, Vol. 28, No. 3 , 599-612.
Kaiser, C. P. (1998). What do we know about employee absence behavior? An interdisciplinary
interpretation. Journal of Socio-Economics, Volume 27, No.1, 79-96.
Karasek, R. A., Jr. (1979). Job demands, job decision latitude, and mental strain:Implications for
job redesign8. Administrative Science Quarterly, 24, 258-308.
Lease S. (1998). Annual review, 1993-1997: Work attitudes and outcomes. Journal. Vocational
Behavior. 53(2), 154-183.

48 | P a g e
Mandy Unterslak . (2009). Job Features And Individual Factors:Testing A Model Of Well-Being,
A Research Project. Johannesburg: University of Withwatersrand.
Mowday, R. T., Porter, L. W., & Steers, R. M. (1982). Employee organization linkages: The
psychology of commitment, absenteeism and turnover. New York: New York, NY: Academic
Press.
Mowdy, R. T. (1981). The influence of Task and personality characters on employee turnover
and absenteeisme incidents. Academy of Management Journal, 634 - 680.
Nicholson. N,. & Payne. R. (1987). Absence from work: Explanations and attributions.
Intemational Review of Applied Psychology, Volume 36. No, 2, 121-132.
Parker, S. K., & Wall, T. D. . (1998). Job and work design: Organizing work to promote well-
being and effectiveness. San Francisco: San Francisco, CA: Sage.
Payne, S.C., & Huffman, A.H. . (2005). A longitudinal examination of the influence of
mentoring on organizational commitment and turnover. Academy of Management Journal,
Volume 48. No 1, 158–168.
Peter G. W. Smulders. (1983). Personal, Nonwork And Work Characteristics In Male And
Female Absence Behavior. Journal Of Occupational Behaviour. Volume 4 , 285-295.
Philipsen, H. . (1969). Afwezigheid wegens ziekte. Groningen: Wolters-Noordhoff.
R. B. Briner . (2000). Relationships between work environments, psychological environments
and psychological well-being,, pp. 299-303, 2000 . Occup. Med. Vol. 50, No. 5 Department of
Organizational Psychology, Birkbeck College, University of London, London, UK, 299-303.
Rainey, D. (1995). Stress, burnout, and intention to terminate among umpires. Journal of Sport
Behavior, Volume 18. No 93, 312 - 323.
Rhodes, S & Steers, R. M. (1981). A systematic approach to diagnosing employee to diagnosing
employee absenteeisme. Employee Relations, Volume 3, No 2, , 17 - 22.
Ryff, C. D. . (1989). Happiness is everything, or is it? Explorations on the meaning of
psychological wellbeing. Journal of Personality and Social Psychology, Volume 57., 1069–1081.
Shepherd, R. D. and Walker. J. (1957). Absence and the physical conditions of worki. British
Journal of Industrial Medicine, vOLUME 14, 266-274.
Somers, M. . (1995). Organizational commitment, turnover and absenteeism: an examination of
direct and indirect effects. Journal of Organizational Behavior, Vol. 16, 49-58.
Spector, P. (1997). Job satisfaction: Applications, assessment, causes, and consequences.
Thousand Oaks, CA: Sage Publications.

49 | P a g e
Spector, P. (1997). Job satisfaction: Applications, assessment, causes, and consequences.
Thousand Oaks, CA: Sage Publications.
Stamm, C & Farrel, D. (1988). Meta Analysis of the corelates of employee absence Human
Relations, volume 21. 211 -227.
Steers, R. & Rhodes, S. (1978). Major Influences on employee Attendance: A Process model.
Journal of Applied Pschychology, 63, 391-407.
Steers, R. M., & Rhodes, S. R. . (1984). Knowledge and speculation about absenteeism. In P. S.
Goodman & R. S. Atkin (Eds.),Absenteeism: New approaches to understanding, measuring .
Steers, R. M., & Rhodes, S. R. (1978). Steers, R. M., & Rhodes, S. R. (1978). Major influences
on employee attendance: A process model. Journal of Applied Psychology, 63(4): 391. Journal
of Applied Psychology, Volume 63. No 4, 391-407.
Warr, P. . (1999). Well-Being and the Workplace. In D. Kahneman, E. Diener & N. Schwarz
(Eds.), Well-being: The foundations of hedonic psychology (pp.392-412). New York: Russell
Sage Foundation.
Warr, P. (1987). Work, unemployment, and mental health. Oxford: Oxford Clarendon Press.
Warr, P. (2007). Work, Happiness, and Unhappiness. New Jersey: Lawrence Erlbaum
Associates, Inc., Publishers.
Warr, P. B., Cook, J. and Wall, T. D. . (1979). Warr„Scales for the Measurement of Some Work
Attitudes and Aspects of Psychological Well-Being. Journal of Occupational Psychology.
Volume52, 129-148.
Weiss, D. J., Dawis, R. W. and Lofquist, L. H. (1967). Manual for the Minnesota Satisfaction
Questionnaire, Minnesota Studies in Vocational Rehabilitation: XII. Minneapolis. Weiss, D. J.,
Dawis, R. W. and Lofquist, L. H. Manual for the Minnesota Satisfaction Questionnaire,
Minnesota Studies in Vocational Rehabilitation: XII. Minnesota: University of Minnesota
Industrial Relations Center, Work Adjustment Project.
Wright, T. (2005). Wright, T.A. 2005. The role of “happiness” in organizational research: Past,
present and future directions. In P. L. Perrewe & D.C. Gangster (Eds). Wright, T.A. 2005. The
role of “happiness” in organizational research: Past, present and future directions. In P. L.
Perrewe & D.C. Gangster Research in occupational stress and well-being, Vol.4, 225-268.
Wright, T.A. & Staw, B.M. (1999). Affect and favorable work outcomes: two longitudinal tests
of the happy productive worker thesis . Journal of Organizational Behavior, Volume 20, 1-23.

50 | P a g e
Wrzesniewski, A., Dutton, J. E., & Debebe, G. . (2003). Interpersonal Sense making and the
meaning of work. In B. Staw & R. Kramer (Eds.). Research in organizational behavior. Volume
25, 93-135.
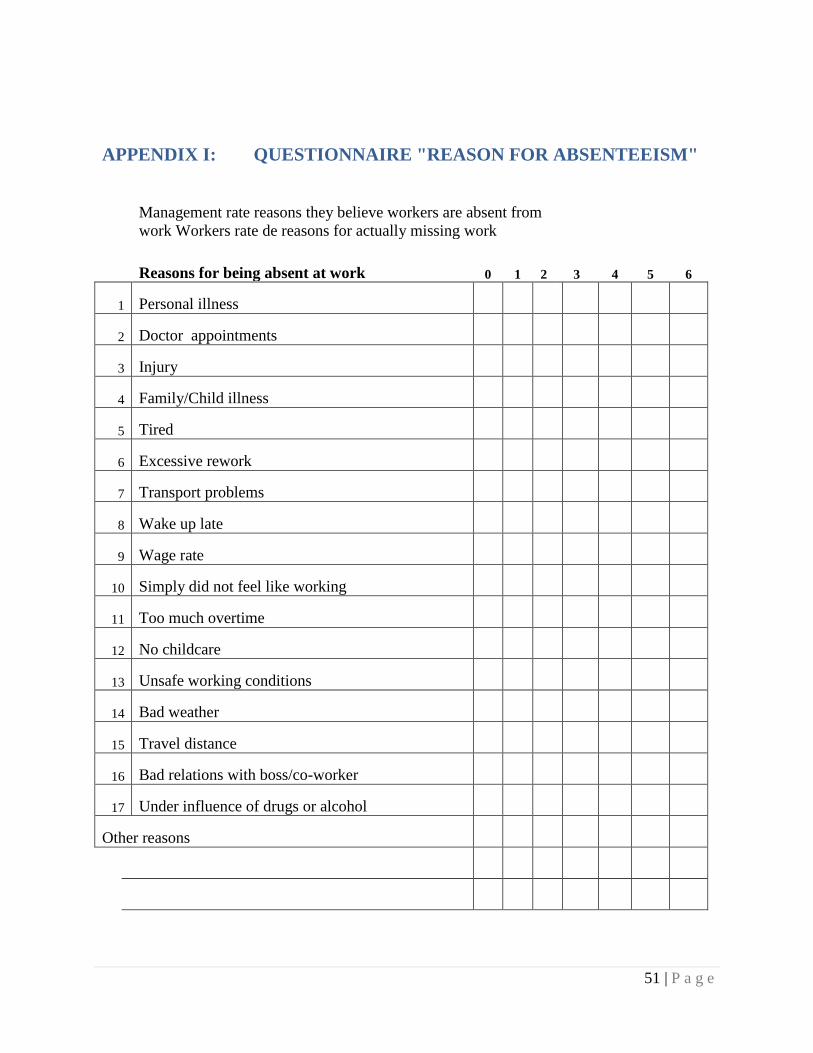
51 | P a g e
APPENDIX I: QUESTIONNAIRE "REASON FOR ABSENTEEISM"
Management rate reasons they believe workers are absent from
work Workers rate de reasons for actually missing work
Reasons for being absent at work 0 1 2 3 4 5 6
1 Personal illness
2 Doctor appointments
3 Injury
4 Family/Child illness
5 Tired
6 Excessive rework
7 Transport problems
8 Wake up late
9 Wage rate
10 Simply did not feel like working
11 Too much overtime
12 No childcare
13 Unsafe working conditions
14 Bad weather
15 Travel distance
16 Bad relations with boss/co-worker
17 Under influence of drugs or alcohol
Other reasons

52 | P a g e
APPENDIX II: VRAGENLIJST "REDEN VOOR ABSENTEEISME"
Management geeft aan wat de reden is dat werknemers niet aan het werk komen wanneer
ze gescheduled zijn.
Werknemers geven de reden aan waarom ze niet aan het werk zijn gekomen.
Reden waarom je niet aan het werk kon komen
0 1 2 3 4 5 6
1 Ziekte
2 Ziekte van Kind of Familie
3 Afspraken met de dokter
4 Geen opvang voor kinderen
5 Moe
6 Verslapen
7 Ik voelde niet voor om te werken
8 Onder invloed van drugs of alcohol
9 Slecht weer (regen)
10 Ongeval
11 Transportproblemen (bus gemist/ autopech etc.)
12 Slechte relatie met de baas/ collega's
13 Afstand van huis naar werk
14 Veel herstel werk
15 Erg veel overtime
16 Lonen
17 Onveilige werkomstandigheden
Andere

53 | P a g e
APPENDIX III: VRAGENLIJST OVER BELEVING EN BEOORDELING
VAN ARBEID
Geslacht: man/ vrouw
Leeftijd:……………….
Burgelijke Staat: ongehuwd/ gehuwd
Aantal inwonende kinderen: ………….
Wat is je hoogste opleiding:…………………..
Hoe lang werk je al voor dit bedrijf (jaren):……………..
Wat voor werk doe je (functie) :……………………….
Wat is afstand van huis naar werk:…………………
Transport: bedrijfbus / eigenvervoer
Tevredenheid over je werk (Warr-Cook-Wall)
Geef aan hoe tevreden je bent over de onderstaande items van je
werk Heel erg ontevreden
1 2 3 4 5
1 Fysieke werkomstandigheden
2 Vrijheid om eigen manier van werken te kiezen
3 Je collega's en medewerkers
4 Waardering (erkenning) die je krijgt voor goed werk (geen geld)
5 Hoeveelheid verantwoordelijkheid die je hebt gekregen
6 Je salaris (Loon)
7 Gelegenheid om je bekwaamheid te tonen (laten zien wat je kan)
8 Je uren dat je werkt
9 Variatie in je werk
10 Je directe baas (leidinggevende)
11 Zekerheid over je werk
12 De aandacht die gegeven wordt aan voorstellen die je doet
13 Als je alles in overweging neemt, hoe voel je over je werk ?

54 | P a g e
Taak Karakteristieken
Ga na in jouw werk hoeveel van elk onderdeel aangegeven voorkomt in je
werk
(1= niets, 7= heel veel) 1 2 3 4 5
1 Mogelijkheid om onafhankelijk te werken
2 Invloed om besluiten te kunnen nemen
3 Gebruik van je vaardigheden (skills)
4 Nieuwe dingen leren
5 Aantal taakeisen
6 Moeilijkheids graad van taakeisen
7 Mogelijkheid om een taak af te ronden van begin tot eind
8 Problemen met taakeisen
9 Problemen tussen werk en thuis
10 Hoeveelheid aan verschillende taken
11 Toekomst voorspellingen
12 Duidelijke omschrijving van je functie
13 Is er feedback over je werk (goed/slecht)
14 Mate van sociaal contact onderling
15 Kwaliteit van sociaal contact
16 Salaris niveau
17 Plezierige werkomgeving
18 Veilige werk omstandigheden
19 Adequate equipment
20 Belangrijkheid voor de rest van de gemeenschap
21 Belangrijkheid voor jezelf
22 Zorg voor werknemers
23 Zekerheid van je werk
24 Goede toekomst perspectieven
25 Werknemers worden eerlijk/gelijk behandeld
26 Normen en waarden van het bedrijf

55 | P a g e
Betrokkenheid bij de organisatie (Currivan 2000)
1
Het bedrijf waar ik werk is de beste plaats van alle plaatsen om te
werken
2 Ik maak me niet druk om het lot van dit bedrijf
3 Ik spreek heel positief over dit bedrijf tegen mijn vrienden
4 Ik ben trots om anderen te vertellen dat ik deel ben van dit bedrijf
(1= helemaal eens, 2= eens, 3=nog eens of oneems, 4=oneens, 5=helemaal oneens)
Arbeidsbelasting (Currivan 2000)
1 Ik moet erg snel werken (heel veel doen in een bepaalde tijd)
2 Ik heb niet voldoende tijd om mijn taak af te ronden
3 De arbeidsbelasting van mijn werk is zwaar
(1= helemaal eens, 2= eens, 3=nog eens of oneems, 4=oneens, 5=helemaal oneens)
Algemene Gezondsheids Vragenlijst (GHQ 12) Goldberg & Williams (1988)
(1=helemaal eens, 2= eens, 3=oneens, 4=helemaal oneens)
1 Je kan je concentreren op wat je ook doet.
2 Niet geslapen omdat je je zorgen maakt
3 Je voelt dat je een nuttig rol hebt
4 Voelt in staat of besluiten te nemen over dingen 5 Voel regelmatig onder druk
6 Voel dat ik moeilijkheden niet kan overwinnen 7 Ben in staat om te genieten van de normale dag tot dag activiteiten
8 Ben in staat om problemen te confronteren
9 Voel niet gelukkig en ben depressief 10 Heb minder vertrouwen in mezelf
11 Denk dat ik een waardeloos persoon ben 12 Voel redelijk gelukkig met alles

56 | P a g e
Fysieke Werkbelasting (Hollmann S, Klimmer F, Schmidt K-H, Kylian H., 1999)
Schat, hoe vaak je moet werken met je lichaamshoudingen onderstaand aangegeven en hoe vaak je moet tillen of gewicht dragen zoals onderstaand aangegeven. Vul alle
rijen.
1= nooit, 2= zelden, 3=soms, 4=vaak en 5=heel vaak
Romp 1 2 3 4 5
Rechtop
Licht gebogen
Sterk gebogen
Gedraaid
Zijwaarts gebogen
Armen 1 2 3 4 5
Beide armen onder schouderhoogte
1 arm boven schouderhoogte
beide armen boven schouderhoogte
Benen 1 2 3 4 5
Zittend
Staand
Squatting
Geknield of een knie of op beide
Lopend bewegend
Gewicht, dragen met rechte romp 1 2 3 4 5
Licht (tot 10 kg)
Medium (10-20 kg)
Zwaar (meer dan 20 kg)
Gewicht, dragen met gebogen romp 1 2 3 4 5
Licht (tot 10 kg)
Medium (10-20 kg)
Zwaar (meer dan 20 kg)
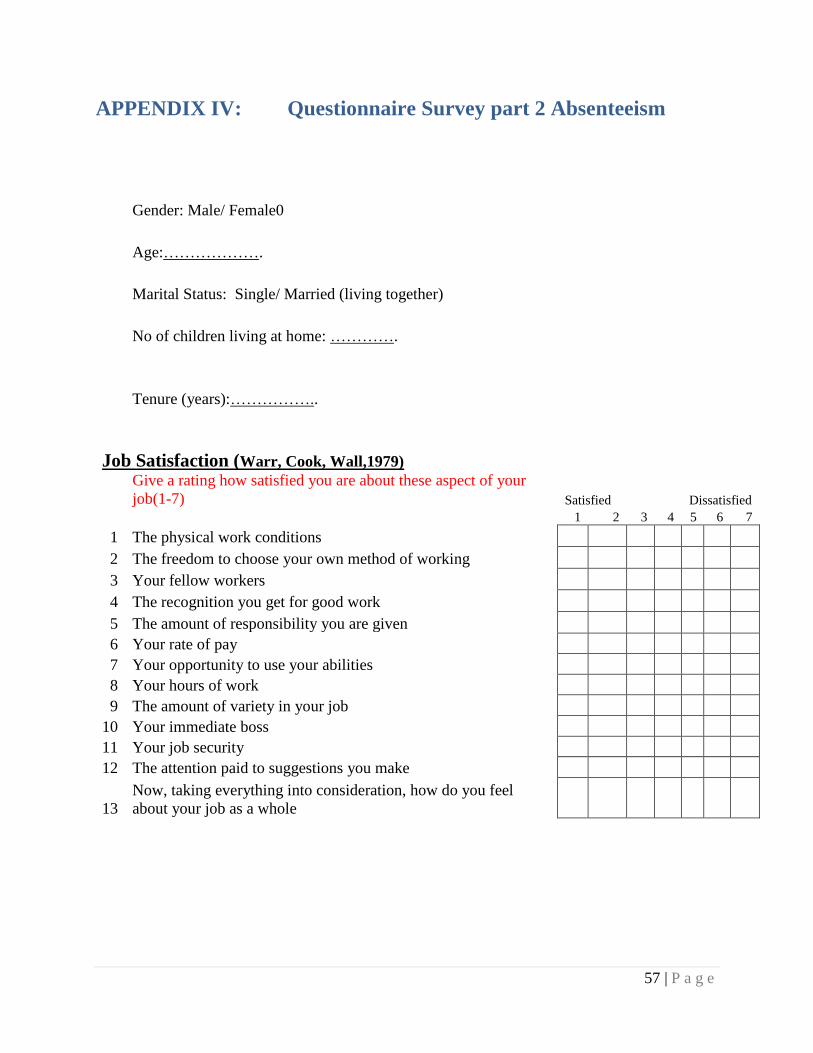
57 | P a g e
APPENDIX IV: Questionnaire Survey part 2 Absenteeism
Gender: Male/ Female0
Age:……………….
Marital Status: Single/ Married (living together)
No of children living at home: ………….
Tenure (years):……………..
Job Satisfaction (Warr, Cook, Wall,1979)
Give a rating how satisfied you are about these aspect of your
job(1-7) Satisfied
Dissatisfied
1 2 3 4 5 6 7
1 The physical work conditions
2 The freedom to choose your own method of working
3 Your fellow workers
4 The recognition you get for good work
5 The amount of responsibility you are given
6 Your rate of pay
7 Your opportunity to use your abilities
8 Your hours of work
9 The amount of variety in your job
10 Your immediate boss
11 Your job security
12 The attention paid to suggestions you make
13
Now, taking everything into consideration, how do you feel
about your job as a whole

58 | P a g e
Job Design
How much of each aspect do you have in your job
(1= nothing, 7= a lot) 1 2 3 4 5 6 7
1 Ability to work independently
2 Influence over decisions made in the organization
3 Skill use
4 New learning
5 Number of job demands
6 Difficulty of job demands
7 Ability to perform a complete task, from beginning to end
8 Conflict between job demands
9 Conflict between work and home
10 Range of different tasks
11 Future predictability
12 Clear role requirements
13 Availability of feedback
14 Amount of social contact
15 Quality of social contact
16 Pay level
17 Pleasant work environment
18 Safe work practices
19 Adequate equipment
20 Value to society
21 Significance to self
22 Concern for staff
23 Job security
24 Good future prospects
25 Fair treatment of employees
26 The organization‟s business ethics

59 | P a g e
Organizational Commitment (Currivan 2000)
1
The company in which I work is the best of all possible places to
work. (r)
2 I do not care about the fate of the company in which I work.
3 I speak highly of the company in which I work to my friends. (r)
4
I am proud to tell others I am part of the company in which I
work. (r)
(1= strongly agree, 2= agree, 3=agree/disagree, 4=disagree, 5=strongly disagree)
Workload (Currivan 2000)
1
I have to work very fast on the job (e.g., cover a lot of material).
(r)
2 I do not have enough time to get everything done on my job. (r)
3 The workload on my job is too heavy. (r)
(1= strongly agree, 2= agree, 3=agree/disagree, 4=disagree, 5=strongly disagree)
General Health Questionnaire (GHQ 12) Goldberg & Williams (1988)
1 Been able to concentrate on whatever you are doing?*
2 Lost much sleep over worry?
3 Felt that you are playing a useful part in things?*
4 Felt capable of making decisions about things?*
5 Felt constantly under strain?
6 Felt you couldn‟t overcome your difficulties?
7 Been able to enjoy your normal day to day activities?*
8 Been able to face up to your problems?*
9 Been feeling unhappy and depressed?
10 Been losing confidence in yourself?
11 Been thinking of yourself as a worthless person?
12 Been feeling reasonably happy all things considered?*”
Answers are coded on a four-point scale running from „Disagree strongly‟ (coded 0) to
`agree
strongly‟

60 | P a g e
Physical workload (Hollmann S, Klimmer F, Schmidt K-H, Kylian H., 1999)
Please estimate, how often you have to work with the body postures displayed
below, and how often you have to lift or to carry the weights mentioned
below. Please fill up all lines!
1= never, 2= seldom, 3=somethimes, 4=often en 5= very often
Trunk 1 2 3 4 5
straight, upright
slightly inclined
strongly inclined
Twisted
laterally bent
Arms 1 2 3 4 5
both arms below shoulder height
one arm above shoulder height
both arms above shoulder height
Legs 1 2 3 4 5
Sitting
Standing
Squatting
kneeling with one knee or with both
walking, moving
Weight, lifted 1 carried with upright trunk 1 2 3 4 5
light (up to 10 kg)
medium (10 - 20 kg)
heavy (more than 20 kg)
Weight, lifted I carried with inclined trunk 1 2 3 4 5
light (up to 10 kg)
medium (10 - 20 kg)
heavy (more than 20 kg)

61 | P a g e
APPENDIX V: RESULTS REGRESSION ANALYSES
Model Summary b
Model R R Square Adjusted R Square
Std. Error of the
Estimate
1 .418a .174 .079 13.806
a. Predictors: (Constant), Wellbeing, No of Children, Marital Status,
Commitment, Physical Workload, Tenure, Workload, Job Design,
Gender, Age, Job Satisfaction
b. Dependent Variable: Frequency of Absence
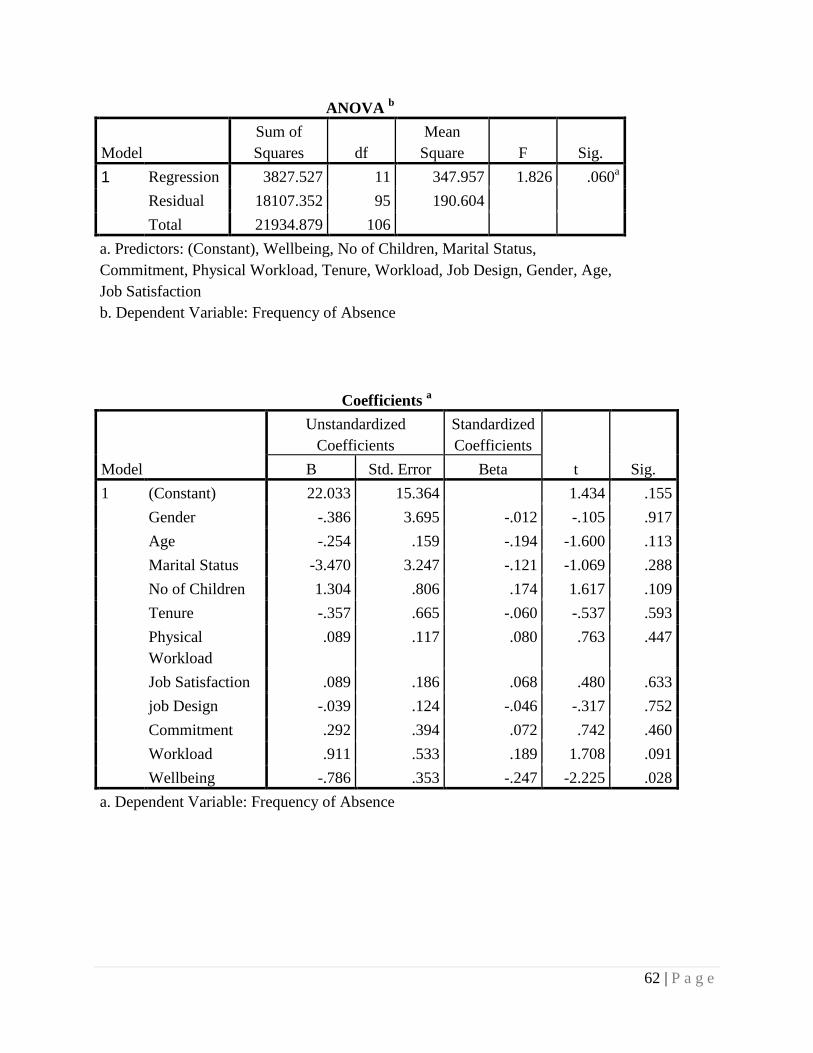
62 | P a g e
ANOVA b
Model
Sum of
Squares df
Mean
Square F Sig.
1 Regression 3827.527 11 347.957 1.826 .060a
Residual 18107.352 95 190.604
Total 21934.879 106
a. Predictors: (Constant), Wellbeing, No of Children, Marital Status,
Commitment, Physical Workload, Tenure, Workload, Job Design, Gender, Age,
Job Satisfaction
b. Dependent Variable: Frequency of Absence
Coefficients a
Model
Unstandardized
Coefficients
Standardized
Coefficients
t Sig. B Std. Error Beta
1 (Constant) 22.033 15.364 1.434 .155
Gender -.386 3.695 -.012 -.105 .917
Age -.254 .159 -.194 -1.600 .113
Marital Status -3.470 3.247 -.121 -1.069 .288
No of Children 1.304 .806 .174 1.617 .109
Tenure -.357 .665 -.060 -.537 .593
Physical
Workload
.089 .117 .080 .763 .447
Job Satisfaction .089 .186 .068 .480 .633
job Design -.039 .124 -.046 -.317 .752
Commitment .292 .394 .072 .742 .460
Workload .911 .533 .189 1.708 .091
Wellbeing -.786 .353 -.247 -2.225 .028
a. Dependent Variable: Frequency of Absence