The Federal Aviation Administration’s
Office of Commercial Space Transportation
(FAA/AST) licenses and regulates U.S.
commercial space launch and reentry activity
as authorized by Executive Order 12465
(Commercial Expendable Launch VehicleActivities) and 49 United States Code Subtitle
IX, Chapter 701 (formerly the CommercialSpace Launch Act). AST’s mission is to license
and regulate commercial launch and reentry
operations to protect public health and safety,
the safety of property, and the national security
and foreign policy interests of the United States.
Chapter 701 and the 2004 U.S. SpaceTransportation Policy also direct the Federal
Aviation Administration to encourage, facilitate,
and promote commercial launches and reentries.
The Commercial Space Transportation Advisory
Committee (COMSTAC) provides information,
advice, and recommendations to the
Administrator of the Federal Aviation
Administration within the Department of
Transportation (DOT) on matters relating to the
U.S. commercial space transportation industry.
Established in 1985, COMSTAC is made up of
senior executives from the U.S. commercial
space transportation and satellite industries,
space-related state government officials, and
other space professionals.
The primary goals of COMSTAC are to:
• Evaluate economic, technological and
institutional issues relating to the U.S.
commercial space transportation
industry;
• Provide a forum for the discussion of issues
involving the relationship between industry
and government requirements; and
• Make recommendations to the Administrator
on issues and approaches for Federal
policies and programs regarding the
industry.
Additional information concerning AST and
COMSTAC can be found on AST’s web site,
http://ast.faa.gov.
i
2008 Commercial Space Transportation Forecasts
About the Office of Commercial Space Transportation and theCommercial Space Transportation Advisory Committee
Cover: Art by John Sloan (2008)

ii
Federal Aviation Administration and the Commercial Space Transportation Advisory Committee (COMSTAC)

iii
2008 Commercial Space Transportation Forecasts
Table of ContentsExecutive Summary ............................................................................................1
Introduction .....................................................................................................5About the COMSTAC GSO Forecast . . . . . . . . . . . . . . . . . . . . . . . . . . . . . . . . . . . . . . . . . . . .5
About the FAA NGSO Forecast . . . . . . . . . . . . . . . . . . . . . . . . . . . . . . . . . . . . . . . . . . . . . . . .5
Characteristics of the Commercial Space Transportation Market . . . . . . . . . . . . . . . . . . . . . .5
Demand Forecasts . . . . . . . . . . . . . . . . . . . . . . . . . . . . . . . . . . . . . . . . . . . . . . . . . . . . . . . . .6
COMSTAC 2008 Commercial Geosynchronous Orbit (GSO) Launch Demand Forecast...............7Executive Summary . . . . . . . . . . . . . . . . . . . . . . . . . . . . . . . . . . . . . . . . . . . . . . . . . . . . . . . .7
Background . . . . . . . . . . . . . . . . . . . . . . . . . . . . . . . . . . . . . . . . . . . . . . . . . . . . . . . . . . . . . .8
Forecast Methodology . . . . . . . . . . . . . . . . . . . . . . . . . . . . . . . . . . . . . . . . . . . . . . . . . . . . . .9
2008 COMSTAC Commercial GSO Launch Demand Forecast Results . . . . . . . . . . . . . . . . . .11
Near-Term Demand Model . . . . . . . . . . . . . . . . . . . . . . . . . . . . . . . . . . . . . . . . . . . . . .11
Satellite Launch Forecast Mass Class Trend . . . . . . . . . . . . . . . . . . . . . . . . . . . . . . . .12
Comparison with Previous COMSTAC Demand Forecasts . . . . . . . . . . . . . . . . . . . . . . .13
Comparison to International Comprehensive Inputs . . . . . . . . . . . . . . . . . . . . . . . . . . .14
Launch Vehicle Demand . . . . . . . . . . . . . . . . . . . . . . . . . . . . . . . . . . . . . . . . . . . . . . .14
COMSTAC Demand Projection vs. Actual Launches Realized . . . . . . . . . . . . . . . . . . . . . . . .15
Factors That Affect Satellite Launch Realization . . . . . . . . . . . . . . . . . . . . . . . . . . . . . .15
Projecting Actual Satellites Launched Using a Realization Factor . . . . . . . . . . . . . . . . .15
Forecasted Satellite Demand versus Actual Satellite Launches in 2007 . . . . . . . . . . . .16
Launch Assurance Agreements . . . . . . . . . . . . . . . . . . . . . . . . . . . . . . . . . . . . . . . . . .17
Factors That May Affect Future Demand . . . . . . . . . . . . . . . . . . . . . . . . . . . . . . . . . . . . . . .17
Supplementary Questionnaire Results . . . . . . . . . . . . . . . . . . . . . . . . . . . . . . . . . . . . . . . . .19
Commercial GSO Satellite Trends . . . . . . . . . . . . . . . . . . . . . . . . . . . . . . . . . . . . . . . . . . . .20
Trends in Number of Transponders per Satellite . . . . . . . . . . . . . . . . . . . . . . . . . . . . . .20
Trends in Average Satellite Mass . . . . . . . . . . . . . . . . . . . . . . . . . . . . . . . . . . . . . . . . .21
Summary . . . . . . . . . . . . . . . . . . . . . . . . . . . . . . . . . . . . . . . . . . . . . . . . . . . . . . . . . . . . . .22
2008 Commercial Space Transportation Forecast for Non-Geosynchronous Orbits ...............29
Executive Summary . . . . . . . . . . . . . . . . . . . . . . . . . . . . . . . . . . . . . . . . . . . . . . . . . . . . . . .29
Introduction . . . . . . . . . . . . . . . . . . . . . . . . . . . . . . . . . . . . . . . . . . . . . . . . . . . . . . . . . . . .30
NGSO Satellite Systems . . . . . . . . . . . . . . . . . . . . . . . . . . . . . . . . . . . . . . . . . . . . . . . . . . .32
International Science and Other Payloads . . . . . . . . . . . . . . . . . . . . . . . . . . . . . . . . . .32
Digital Audio Radio Services . . . . . . . . . . . . . . . . . . . . . . . . . . . . . . . . . . . . . . . . . . . . . . .33
Military . . . . . . . . . . . . . . . . . . . . . . . . . . . . . . . . . . . . . . . . . . . . . . . . . . . . . . . . . . . . . . .34
Market Demand . . . . . . . . . . . . . . . . . . . . . . . . . . . . . . . . . . . . . . . . . . . . . . . . . . . . . . . . .34

iv
Federal Aviation Administration and the Commercial Space Transportation Advisory Committee (COMSTAC)
Commercial Remote Sensing Satellites . . . . . . . . . . . . . . . . . . . . . . . . . . . . . . . . . . . .34
DigitalGlobe . . . . . . . . . . . . . . . . . . . . . . . . . . . . . . . . . . . . . . . . . . . . . . . . . . . . . . . . . . .36
GeoEye . . . . . . . . . . . . . . . . . . . . . . . . . . . . . . . . . . . . . . . . . . . . . . . . . . . . . . . . . . . . . . .36
ImageSat International NV . . . . . . . . . . . . . . . . . . . . . . . . . . . . . . . . . . . . . . . . . . . . . . . .38
Infoterra Group . . . . . . . . . . . . . . . . . . . . . . . . . . . . . . . . . . . . . . . . . . . . . . . . . . . . . . . . .38
MacDonald, Dettwiler and Associates . . . . . . . . . . . . . . . . . . . . . . . . . . . . . . . . . . . . . . . .38
RapidEye AG . . . . . . . . . . . . . . . . . . . . . . . . . . . . . . . . . . . . . . . . . . . . . . . . . . . . . . . . . . .39
Market Demand . . . . . . . . . . . . . . . . . . . . . . . . . . . . . . . . . . . . . . . . . . . . . . . . . . . . . . . . .39
NGSO Telecommunications Systems . . . . . . . . . . . . . . . . . . . . . . . . . . . . . . . . . . . . . .39
Globalstar . . . . . . . . . . . . . . . . . . . . . . . . . . . . . . . . . . . . . . . . . . . . . . . . . . . . . . . . . . . . .40
Iridium . . . . . . . . . . . . . . . . . . . . . . . . . . . . . . . . . . . . . . . . . . . . . . . . . . . . . . . . . . . . . . .41
ORBCOMM . . . . . . . . . . . . . . . . . . . . . . . . . . . . . . . . . . . . . . . . . . . . . . . . . . . . . . . . . . . .42
Other Systems . . . . . . . . . . . . . . . . . . . . . . . . . . . . . . . . . . . . . . . . . . . . . . . . . . . . . . . . . .42
Market Demand . . . . . . . . . . . . . . . . . . . . . . . . . . . . . . . . . . . . . . . . . . . . . . . . . . . . . . . . .43
Orbital Facility Assembly and Services . . . . . . . . . . . . . . . . . . . . . . . . . . . . . . . . . . . .43
Bigelow Aerospace Orbital Habitats . . . . . . . . . . . . . . . . . . . . . . . . . . . . . . . . . . . . . . . . . .44
NASA COTS . . . . . . . . . . . . . . . . . . . . . . . . . . . . . . . . . . . . . . . . . . . . . . . . . . . . . . . . . . . .44
Commercial ISS Resupply . . . . . . . . . . . . . . . . . . . . . . . . . . . . . . . . . . . . . . . . . . . . . . . . .45
Market Demand . . . . . . . . . . . . . . . . . . . . . . . . . . . . . . . . . . . . . . . . . . . . . . . . . . . . . . . . .45
Future Markets . . . . . . . . . . . . . . . . . . . . . . . . . . . . . . . . . . . . . . . . . . . . . . . . . . . . . . . . . .45
Risk Factors That Affect Satellite and Launch Demand . . . . . . . . . . . . . . . . . . . . . . . . . . . . .46
Methodology . . . . . . . . . . . . . . . . . . . . . . . . . . . . . . . . . . . . . . . . . . . . . . . . . . . . . . . . . . . .48
Vehicle Sizes and Orbits . . . . . . . . . . . . . . . . . . . . . . . . . . . . . . . . . . . . . . . . . . . . . . . . . . .49
Satellite and Launch Forecast . . . . . . . . . . . . . . . . . . . . . . . . . . . . . . . . . . . . . . . . . . . . . . .50
Historical NGSO Market Assessments . . . . . . . . . . . . . . . . . . . . . . . . . . . . . . . . . . . . . . . . .52

v
2008 Commercial Space Transportation Forecasts
List of FiguresFigure 1. GSO Satellite and Launch Demand . . . . . . . . . . . . . . . . . . . . . . . . . . . . . . . . . . . . . . . . . . . . . . .2
Figure 2. NGSO Satellite and Launch Demand . . . . . . . . . . . . . . . . . . . . . . . . . . . . . . . . . . . . . . . . . . . . . .3
Figure 3. Combined GSO and NGSO Historical Launches and Launch Forecasts . . . . . . . . . . . . . . . . . . . .3
Figure 4. Historical Commercial Space Transportation Forecasts . . . . . . . . . . . . . . . . . . . . . . . . . . . . . . .6
Figure 5. Commercial GSO Satellite and Launch Demand . . . . . . . . . . . . . . . . . . . . . . . . . . . . . . . . . . . . .7
Figure 6. Trends in GSO Satellite Mass Distribution . . . . . . . . . . . . . . . . . . . . . . . . . . . . . . . . . . . . . . . .12
Figure 7. 2003 Through 2007 vs 2008 Commercial GSO Satellite Demand Forecast . . . . . . . . . . . . . . . .13
Figure 8. 2008 COMSTAC GSO Satellite and Launch Demand Forecast . . . . . . . . . . . . . . . . . . . . . . . . . .14
Figure 9. Commercial GSO Satellite Demand: Historical, Near-Term, and Long-Term Forecasts . . . . . . . .16
Figure 10. Total C/Ku/Ka Transponders Launched per Year and Average Transponders per Satellite . . . . .21
Figure 11. Total Satellite Mass Launched per Year and Average Mass per Satellite . . . . . . . . . . . . . . . . .22
Figure 12. Satellite Forecast . . . . . . . . . . . . . . . . . . . . . . . . . . . . . . . . . . . . . . . . . . . . . . . . . . . . . . . . . .50
Figure 13. Launch Demand Forecast . . . . . . . . . . . . . . . . . . . . . . . . . . . . . . . . . . . . . . . . . . . . . . . . . . . .51
Figure 14. Comparison of Past Baseline Launch Demand Forecasts . . . . . . . . . . . . . . . . . . . . . . . . . . . .54
Figure 15. Average and Maximum Launches per Year from NGSO Forecasts 1998–2008 . . . . . . . . . . . . .54
Table 1. Commercial Space Transportation Satellite and Launch Forecasts . . . . . . . . . . . . . . . . . . . . . . . .2
Table 2. Commercial GSO Satellite and Launch Demand Forecast Data . . . . . . . . . . . . . . . . . . . . . . . . . .8
Table 3. Satellite Mass Class Categorization . . . . . . . . . . . . . . . . . . . . . . . . . . . . . . . . . . . . . . . . . . . . .10
Table 4. Commercial GSO Near-Term Manifest . . . . . . . . . . . . . . . . . . . . . . . . . . . . . . . . . . . . . . . . . . . .11
Table 5. Trends in GSO Satellite Mass Distribution . . . . . . . . . . . . . . . . . . . . . . . . . . . . . . . . . . . . . . . . .12
Table 6. 2008 COMSTAC Survey Questionnaire Summary . . . . . . . . . . . . . . . . . . . . . . . . . . . . . . . . . . . .19
Table 7. Total C/Ku/Ka Transponders Launched per Year and Average Transponders per Satellite . . . . . .21
Table 8. Total Satellite Mass Launched per Year and Average Mass per Satellite . . . . . . . . . . . . . . . . . .22
Table 9. Historical Addressable Commercial GSO Satellites Launched (1993–2007) . . . . . . . . . . . . . . . .24
Table 10. Historical Non-Addressable Commercial GSO Satellites Launched (1993–2007) . . . . . . . . . . . .27
Table 11. Commercially Competed Launches . . . . . . . . . . . . . . . . . . . . . . . . . . . . . . . . . . . . . . . . . . . . .30
Table 12. Commercial Satellite Remote Sensing Systems . . . . . . . . . . . . . . . . . . . . . . . . . . . . . . . . . . . .35
Table 13. Current Commercial Satellite Remote Sensing Licenses . . . . . . . . . . . . . . . . . . . . . . . . . . . . . .37
Table 14. Little LEO Systems . . . . . . . . . . . . . . . . . . . . . . . . . . . . . . . . . . . . . . . . . . . . . . . . . . . . . . . . .40
Table 15. Big LEO Systems . . . . . . . . . . . . . . . . . . . . . . . . . . . . . . . . . . . . . . . . . . . . . . . . . . . . . . . . . . .41
Table 16. Near-Term Identified NGSO Satellite Manifest . . . . . . . . . . . . . . . . . . . . . . . . . . . . . . . . . . . . .48
Table 17. Satellite and Launch Demand Forecast . . . . . . . . . . . . . . . . . . . . . . . . . . . . . . . . . . . . . . . . . .50
Table 18. Distribution of Satellite Masses in Near-Term Manifest . . . . . . . . . . . . . . . . . . . . . . . . . . . . . .51
Table 19. Distribution of Launches Among Market Sectors . . . . . . . . . . . . . . . . . . . . . . . . . . . . . . . . . . .52
Table 20. Historical Commercial NGSO Activity . . . . . . . . . . . . . . . . . . . . . . . . . . . . . . . . . . . . . . . . . . . .53
Table 21. Historical NGSO Satellite and Launch Activities (1993–2007) . . . . . . . . . . . . . . . . . . . . . . . . .55
List of Tables

vi
Federal Aviation Administration and the Commercial Space Transportation Advisory Committee (COMSTAC)

The Federal Aviation Administration’s Office of
Commercial Space Transportation (FAA/AST)
and the Commercial Space Transportation
Advisory Committee (COMSTAC) have
prepared forecasts of global demand for
commercial space launch services for the
period 2008 to 2017.
The 2008 Commercial Space TransportationForecasts report includes:
• The 2008 COMSTAC CommercialGeosynchronous Orbit Launch DemandForecast which projects demand for
commercial satellites that operate in
geosynchronous orbit (GSO) and the
resulting commercial launch demand to
geosynchronous transfer orbit (GTO); and
• The FAA’s 2008 Commercial SpaceTransportation Forecast for Non-Geosynchronous Orbits, which projects
commercial launch demand for satellites
to non-geosynchronous orbits (NGSO),
such as low Earth orbit, medium Earth orbit,
elliptical orbits, and external orbits beyond
the Earth.
Together, the COMSTAC and FAA forecasts
project an average annual demand of 27.4 com-
mercial space launches worldwide from 2008 to
2017. The combined forecasts are an increase of
17 percent compared to the 2007 forecast of
23.4 launches per year. Twenty-four commercial
launches occurred worldwide in 2007. The fore-
casts project a launch demand increase up to 33
launches during 2008 (22 GSO and 11 NGSO).
In the GSO market, demand averaged 21.8
satellites per year, compared to 21.0 satellites in
the 2007 forecast. The resulting demand for
launches, after accounting for dual-manifested
missions, increased to an average of 16.2
launches per year compared to 15.3 per year in
last year’s forecast. Launch demand increased
in the GSO market in part because of missions
delayed from 2007. An analysis of mass trends
in the report indicates continued stabilization of
the average mass per satellite.
In the NGSO market, the number of satellites
expanded 38 percent to an average of 27.6 per
year compared to 19.1 per year in last year’s
forecast. More telecommunications and com-
mercial resupply missions to the International
Space Station are included in this year’s fore-
cast. After calculating the number of satellites
that are multiple-manifested, launch demand
increased to an average of 11.2 launches per
year. The increase means an average demand of
about three more NGSO launches per year,
mostly on medium-to-heavy vehicles, versus the
2007 forecast.
COMSTAC and FAA project an average annual
demand for:
• 16.2 launches of medium-to-heavy launch
vehicles to GSO;
• 8.1 launches of medium-to-heavy launch
vehicles to NGSO; and
• 3.1 launches of small vehicles to NGSO.
Table 1 shows the totals for the 2008 forecast.
Figures 1, 2, and 3 compare historical activity
in GSO and NGSO to the 2008 forecast.
1
2008 Commercial Space Transportation Forecasts
Executive Summary

2
Federal Aviation Administration and the Commercial Space Transportation Advisory Committee (COMSTAC)
Table 1. Commercial Space Transportation Satellite and Launch Forecasts
Figure 1. GSO Satellite and Launch Demand

3
2008 Commercial Space Transportation Forecasts
Figure 2. NGSO Satellite and Launch Demand
Figure 3. Combined GSO and NGSO Historical Launches and Launch Forecasts

4
Federal Aviation Administration and the Commercial Space Transportation Advisory Committee (COMSTAC)

Each year, the Federal Aviation Administration’s
Office of Commercial Space Transportation
(FAA/AST) and the Commercial Space
Transportation Advisory Committee (COM-
STAC) prepare forecasts of global demand for
commercial space launch services.
The jointly-published 2008 Commercial SpaceTransportation Forecasts report covers the
period from 2008 to 2017 and includes two
separate forecasts: one for launches to
geosynchronous orbit and one for launches
to non-geosynchronous orbits.
About the COMSTAC GSO Forecast
COMSTAC is comprised of representatives
from the U.S. satellite and launch industry. The
COMSTAC 2008 Commercial GeosynchronousOrbit Launch Demand Forecast projects demand
for commercial satellites that operate in
geosynchronous orbit (GSO) and the resulting
commercial launch demand to geosynchronous
transfer orbit (GTO).
Established in 1993, the COMSTAC geosyn-
chronous launch demand forecast is prepared
using plans and projections supplied by global
commercial satellite and launch companies.
Projected payload and launch demand is limited
to those spacecraft and launches that are open
to internationally competed launch services
procurements. Since 1998, the model has also
included a projection of launch vehicle demand,
which is derived from the payload demand and
takes into account dual-manifesting of satellites
on a single launch vehicle.
About the FAA NGSO Forecast
The FAA’s 2008 Commercial SpaceTransportation Forecast for Non-GeosynchronousOrbits projects commercial launch demand
for all space systems to be deployed in non-
geosynchronous orbits (NGSO), including low
Earth orbit, medium Earth orbit, elliptical
orbits, and external orbits such as to the
Moon or other solar system destinations.
First compiled in 1994, the FAA NGSO forecast
assesses global satellite and other payloads most
likely to seek commercial launch services
during the next 10 years. The forecast uses a
model to estimate launch demand after a review
of multiple-manifesting; i.e., how many satel-
lites will ride per launch vehicle.
The majority of the satellites included in the
forecast are open to international launch
services procurement. The NGSO forecast also
includes satellites or payloads that are spon-
sored by commercial entities for commercial
launch or are commercially competed U.S.
launches for orbital facility supply missions.
Characteristics of the CommercialSpace Transportation Market
Demand for commercial launch services, a
competitive global business, is directly affected
by activity in the global satellite market ranging
from customer needs and introduction of new
applications to satellite lifespan and regional
economic conditions.
The GSO market is served by both medium and
heavy lift launch vehicles and has a steady
commercial customer demand for telecommuni-
cations satellites with a current average satellite
mass of about 4,185 kilograms. The NGSO
market has a wider variety of satellite and
payload missions but with more demand fluctu-
ation. This market is served by small, medium,
and heavy lift launch vehicles and the average
satellite mass of known satellites in the near-
term NGSO forecast is around 540 kilograms.
5
2008 Commercial Space Transportation Forecasts
Introduction
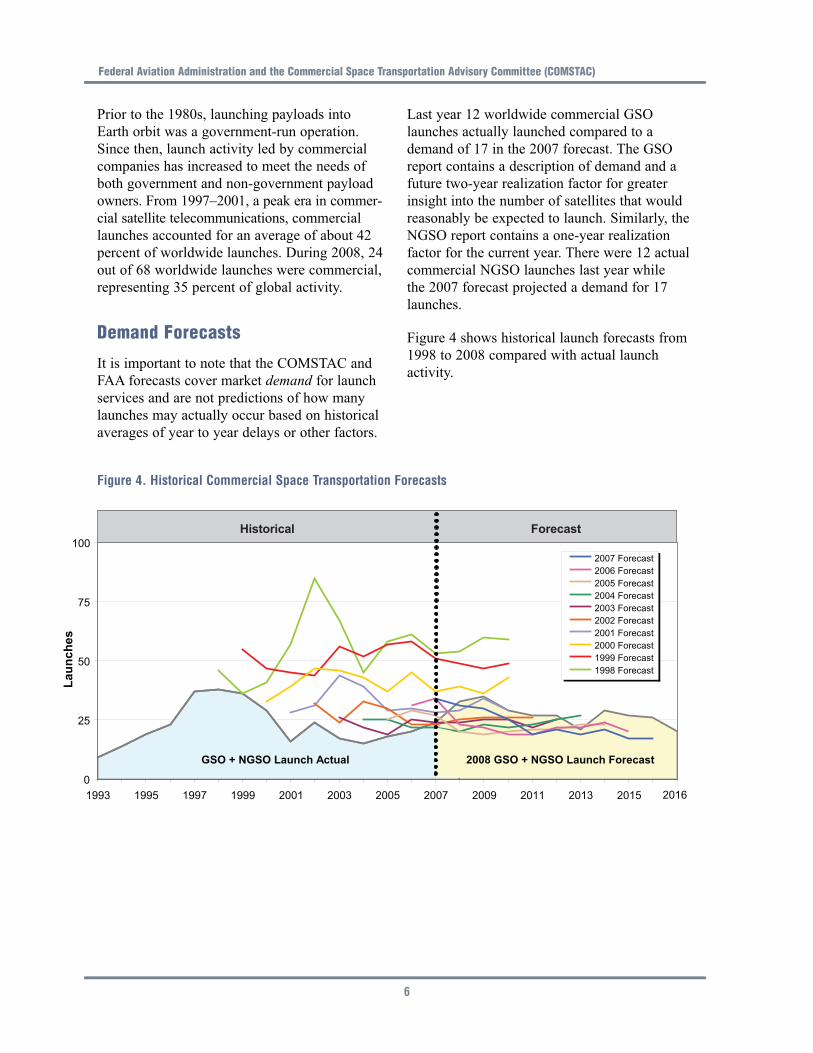
Prior to the 1980s, launching payloads into
Earth orbit was a government-run operation.
Since then, launch activity led by commercial
companies has increased to meet the needs of
both government and non-government payload
owners. From 1997–2001, a peak era in commer-
cial satellite telecommunications, commercial
launches accounted for an average of about 42
percent of worldwide launches. During 2008, 24
out of 68 worldwide launches were commercial,
representing 35 percent of global activity.
Demand Forecasts
It is important to note that the COMSTAC and
FAA forecasts cover market demand for launch
services and are not predictions of how many
launches may actually occur based on historical
averages of year to year delays or other factors.
Last year 12 worldwide commercial GSO
launches actually launched compared to a
demand of 17 in the 2007 forecast. The GSO
report contains a description of demand and a
future two-year realization factor for greater
insight into the number of satellites that would
reasonably be expected to launch. Similarly, the
NGSO report contains a one-year realization
factor for the current year. There were 12 actual
commercial NGSO launches last year while
the 2007 forecast projected a demand for 17
launches.
Figure 4 shows historical launch forecasts from
1998 to 2008 compared with actual launch
activity.
6
Federal Aviation Administration and the Commercial Space Transportation Advisory Committee (COMSTAC)
Figure 4. Historical Commercial Space Transportation Forecasts

2008 Commercial Space Transportation Forecasts: COMSTAC GSO Forecast
Executive Summary
This report was compiled by the Commercial
Space Transportation Advisory Committee
(COMSTAC) for the Office of Commercial
Space Transportation of the Federal Aviation
Administration (FAA/AST). The 2008Commercial Geosynchronous Orbit (GSO)Launch Demand Forecast is the sixteenth annual
forecast of the global demand for commercial
GSO satellites and launches addressable to the
U.S. commercial space launch industry. The fore-
cast extends 10 years and provides more specific
detail for the near-term three years. It is intended
to assist FAA/AST in its planning for licensing
and efforts to foster a healthy commercial space
launch capability in the United States.
The commercial forecast is updated annually,
and is prepared using the inputs from commer-
cial companies across the operator, satellite, and
launch industries. Both a satellite and a launch
demand forecast are included in this report; the
satellite demand is a forecast of the number of
GSO satellites that satellite operators intend to
have launched, and launch demand is deter-
mined by adjusting satellite demand by the
number of satellites projected to be launched
together, referred to in the report as a “dual-
manifest” launch. This forecast includes only
commercial satellite launches addressable to the
U.S. space launch industry. Addressable is
defined as launch service procurements
open to international competition.
The 2008 Commercial GSO Launch Demand
Forecast for 2008 through 2017 is shown in
Figure 5. Table 2 provides the corresponding
values of forecasted satellites to be launched,
the estimated number of dual-manifested
launches, and the resulting number of projected
launches for each year. This year’s data shows
increased demand from the two previous
forecasts.
The 2008 forecast predicts an average demand
for 21.8 satellites to be launched annually in the
ten-year time frame from 2008 through 2017.
7
COMSTAC 2008 Commercial Geosynchronous Orbit (GSO) Launch Demand Forecast
Figure 5. Commercial GSO Satellite and Launch Demand
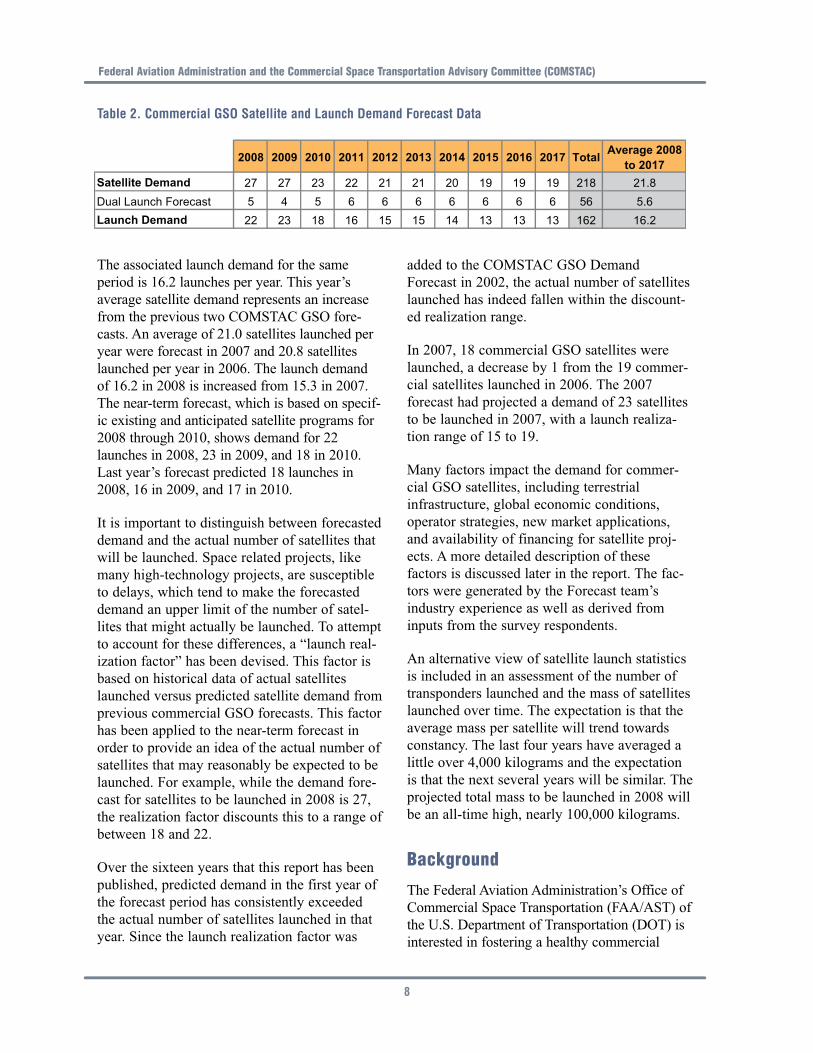
The associated launch demand for the same
period is 16.2 launches per year. This year’s
average satellite demand represents an increase
from the previous two COMSTAC GSO fore-
casts. An average of 21.0 satellites launched per
year were forecast in 2007 and 20.8 satellites
launched per year in 2006. The launch demand
of 16.2 in 2008 is increased from 15.3 in 2007.
The near-term forecast, which is based on specif-
ic existing and anticipated satellite programs for
2008 through 2010, shows demand for 22
launches in 2008, 23 in 2009, and 18 in 2010.
Last year’s forecast predicted 18 launches in
2008, 16 in 2009, and 17 in 2010.
It is important to distinguish between forecasted
demand and the actual number of satellites that
will be launched. Space related projects, like
many high-technology projects, are susceptible
to delays, which tend to make the forecasted
demand an upper limit of the number of satel-
lites that might actually be launched. To attempt
to account for these differences, a “launch real-
ization factor” has been devised. This factor is
based on historical data of actual satellites
launched versus predicted satellite demand from
previous commercial GSO forecasts. This factor
has been applied to the near-term forecast in
order to provide an idea of the actual number of
satellites that may reasonably be expected to be
launched. For example, while the demand fore-
cast for satellites to be launched in 2008 is 27,
the realization factor discounts this to a range of
between 18 and 22.
Over the sixteen years that this report has been
published, predicted demand in the first year of
the forecast period has consistently exceeded
the actual number of satellites launched in that
year. Since the launch realization factor was
added to the COMSTAC GSO Demand
Forecast in 2002, the actual number of satellites
launched has indeed fallen within the discount-
ed realization range.
In 2007, 18 commercial GSO satellites were
launched, a decrease by 1 from the 19 commer-
cial satellites launched in 2006. The 2007
forecast had projected a demand of 23 satellites
to be launched in 2007, with a launch realiza-
tion range of 15 to 19.
Many factors impact the demand for commer-
cial GSO satellites, including terrestrial
infrastructure, global economic conditions,
operator strategies, new market applications,
and availability of financing for satellite proj-
ects. A more detailed description of these
factors is discussed later in the report. The fac-
tors were generated by the Forecast team’s
industry experience as well as derived from
inputs from the survey respondents.
An alternative view of satellite launch statistics
is included in an assessment of the number of
transponders launched and the mass of satellites
launched over time. The expectation is that the
average mass per satellite will trend towards
constancy. The last four years have averaged a
little over 4,000 kilograms and the expectation
is that the next several years will be similar. The
projected total mass to be launched in 2008 will
be an all-time high, nearly 100,000 kilograms.
Background
The Federal Aviation Administration’s Office of
Commercial Space Transportation (FAA/AST) of
the U.S. Department of Transportation (DOT) is
interested in fostering a healthy commercial
8
Federal Aviation Administration and the Commercial Space Transportation Advisory Committee (COMSTAC)
Table 2. Commercial GSO Satellite and Launch Demand Forecast Data

2008 Commercial Space Transportation Forecasts: COMSTAC GSO Forecast
space launch capability in the United States. In
1993, the DOT requested that its industry adviso-
ry group, the Commercial Space Transportation
Advisory Committee (COMSTAC), annually
prepare a commercial geosynchronous orbit
(GSO) satellite launch demand forecast to obtain
the commercial space launch industry’s view of
future space launch requirements.
COMSTAC prepared the first commercial
demand forecast in April 1993 as part of a
report on commercial space launch systems
requirements. It was developed by the major
U.S. launch service providers and covered the
period 1992–2010. The following year, the
major U.S. satellite manufacturers and the satel-
lite service providers began to contribute to the
demand forecast. In 1995, the Technology and
Innovation Working Group (the Working Group)
was formally chartered by the FAA/AST to pre-
pare the annual Commercial Payload Mission
Model Update. Since 2001, the Commercial
Launch Demand Forecast has covered a ten-
year period, with this year’s report covering
2008 through 2017. This year the committee
received 29 inputs from satellite service
providers, satellite manufacturers, and launch
service providers. COMSTAC would like to
thank all of the participants in the 2008
Commercial GSO Launch Demand Forecast.
Forecast Methodology
Except for minor adjustments, the Working
Group’s launch demand forecast methodology
has remained consistent throughout the history of
the forecast. The Working Group, via the FAA
Associate Administrator for Commercial Space
Transportation, requests commercial GSO satel-
lite forecasts from global satellite operators,
satellite manufacturers, and launch service
providers. Two types of requests are made:
Individual input is requested from satellite opera-
tors for a projection of their individual company
requirements for the period 2008–2017; and
comprehensive input is requested for the same
period from satellite manufacturers and launch
service providers for a broad perspective.
Addressable payloads in the context of this
report are defined as commercial satellite
launches open to internationally competitive
launch service procurement. Excluded from this
forecast are satellites captive to national flag
launch service providers (i.e., U.S. or foreign
government satellites that are captive to their
own national launch providers or commercial
satellites that are not internationally competed).
In 2007, two commercial satellite launches
(Chinasat 6B (China) and Sinosat 3 (China))
were excluded from the actual number of
addressable commercial launches listed in this
report because they were not internationally
competed.
As more nations without national launch
providers enter the commercial satellite market-
place, it is likely to be more common to see
government-to-government agreements on
building and launching spacecraft. This was the
case with Kazsat 1, which was negotiated
directly with the Russian government and never
opened for international competition. China
continues to lead the way with these relation-
ships. In some cases they have won what began
as an international competition by bundling
satellite, launch, and other incentives, as with
Nigcomsat. In others, they have preempted the
opening of a competition, as in the Venesat
opportunity. These kinds of instances will cause
some variation in the forecast.
The commercial GSO satellite demand forecast
is divided into four different mass classes based
on the mass of the satellite at separation into
geosynchronous transfer orbit (GTO). The mass
categories are logical divisions based on stan-
dard satellite models offered by satellite
manufacturers. The four classifications are:
below 2,500 kilograms (<5,510 pounds); 2,500
to 4,200 kilograms (5,510 to 9,260 pounds);
4,200 to 5,400 kilograms (9,260 to 11,905
pounds); and above 5,400 kilograms (>11,905
pounds). A list of current satellite models asso-
ciated with each mass category is shown in
Table 3. This year, the Working Group modified
the definition of the mass classes. The smallest
mass class group is now defined as satellites up
9

to 2,500 kilograms from a maximum of up to
2,200 kilograms analyzed in prior years. This
adjustment was made to capture the recent
growth in the mass of the smallest satellites
being manufactured.
This year, the following 29 organizations (noted
with the country in which their headquarters are
located) responded with data used in the devel-
opment of the 2008 report:
• Arianespace (France)
• AR-SAT S.A. (Argentina)
• Asia Satellite Telecommunications, Ltd.
(China-Hong Kong)
• Astrium satellites (France)
• The Boeing Company* (U.S.)
• Eutelsat (France)
• Hisdesat (Spain)
• Hispasat (Spain)
• Hughes Network Systems (U.S.)
• Intelsat (U.S.)
• JSAT Corporation (Japan)
• Lockheed Martin Space Systems Co.* (U.S.)
• Lockheed Martin Commercial Launch
Services * (U.S)
• MEASAT ITU Coordination (Malaysia)
• Mobile Broadcasting Corporation (Japan)
• Mobile Satellite Ventures (U.S.)
• Ondas (Spain)
• Orbital Sciences Corp.* (U.S.)
• Protostar (U.S.)
• Sea Launch* (U.S.)
• Sirius Satellite Radio (U.S.)
• Space Communications Corporation (Japan)
• Space Systems/Loral* (U.S.)
• Telenor Satellite Broadcasting AS (Norway)
• Telesat (Canada/U.S.)
• Thales Alenia (Europe)
• Thuraya (United Arab Emirates)
• Wild Blue (U.S)
• XM Radio (U.S.)
Forecasting commercial satellite launch demand
presents significant difficulty and thus there is
uncertainty in the predictions. The satellite pro-
duction cycle for an existing satellite design is
approximately two years; it is typically longer
for heavier, more complex satellites. Orders
within a two-year time period are thus generally
more certain. Satellite orders in the third year
and beyond become more difficult to identify
by name as many of these satellites are in pre-
mature stages of the procurement cycle. Beyond
a five-year horizon, new markets or new uses of
satellite technology may emerge that were not
known during the forecast year.
Some of the factors that were considered by
respondents in creating this forecast included:
• Firm contracted missions
• Current satellite operator planned and
replenishment missions
• Projection of growth in demand from new
and existing satellite services and applications
• Availability of financing for commercial
space projects
• Industry health and consolidation
10
Federal Aviation Administration and the Commercial Space Transportation Advisory Committee (COMSTAC)
Table 3. Satellite Mass Class Categorization
* The Working Group uses the comprehensive inputs from the U.S. respondents to derive the average satellite demandexpected per year by mass class. The sum of the demand in the four mass categories then provides total demand per year.

2008 Commercial Space Transportation Forecasts: COMSTAC GSO Forecast
The combined comprehensive input from U.S.
respondents was used to generate the long-term
demand forecast 2011–2017. The remaining
inputs were used for a cross check. The
Working Group, using individual satellite opera-
tors’ inputs, developed the near-term forecast,
covering the first three years (2008–2010) of
the ten-year forecast. It is a compilation of
launch vehicle providers’ and satellite manufac-
turers’ manifests, as well as an assessment of
potential satellite systems to be launched.
In order to determine the demand for commer-
cial GSO launches, the satellite demand forecast
was adjusted by the projected number of dual-
manifested launches per year (i.e., launch of
two satellites at once). Based on the future
plans and capability of Arianespace’s Ariane 5,
it is estimated that six launches per year will be
dual-manifested in the long-term forecast; the
near-term forecast of dual-manifest launches is
based on an assessment of the current
Arianespace manifest.
2008 COMSTAC Commercial GSOLaunch Demand Forecast Results
NEAR-TERM DEMAND MODEL
The three-year near-term demand forecast is
based on input from each U.S. satellite manu-
facturer and launch services provider, along
with the inputs received from individual satel-
lite operators. Developing the near-term forecast
11
Table 4. Commercial GSO Near-Term Manifest
* Indicates slip from COMSTAC 2007 GSO Forecast

in this way results in the maximum identifiable
demand for satellites to be launched each year.
Identified demand for any particular year is
defined as the number of satellites that
customers wish to have launched, with no
adjustment for potential launch schedule delays.
Table 4 shows the near-term mission model for
2008 through 2010.
SATELLITE LAUNCH FORECAST MASS CLASSTREND
Figure 6 and Table 5 show the trends in annual
GSO satellite mass distribution. Actual data are
presented for 1993 through 2007, followed by
the distribution projected in this year’s demand
forecast.
The distribution of forecasted satellites to be
launched for the two smallest mass classes has
changed since last year’s forecast. The change
follows an update to the satellite mass class cat-
egory definitions in the forecast survey sent out
for this year’s forecast, as seen in Table 3 and
discussed in the Forecast Methodology section.
The smallest mass class group has been changed
to include satellites up to 2,500 kilograms from a
12
Federal Aviation Administration and the Commercial Space Transportation Advisory Committee (COMSTAC)
Figure 6. Trends in GSO Satellite Mass Distribution
Table 5. Trends in GSO Satellite Mass Distribution

2008 Commercial Space Transportation Forecasts: COMSTAC GSO Forecast
maximum of up to 2,200 kilograms analyzed in
prior years. This adjustment was made to capture
the recent growth in the mass of the smallest
satellites being manufactured. Orbital’s Star bus
has incorporated design changes that bring its
mass close to the 2,500-kilogram range, now
within the small mass class category. Astrium
and ISRO are jointly marketing the INSAT bus
which can weigh as much as 3,000 kilograms;
this bus is categorized in the next largest mass
class. The ability to grow these small satellites to
the 2,500 and 3,000 kilogram mass class has
been assisted by the introduction of two new
launchers with capability between 3,000 and
3,500 kilograms: Soyuz (from Kourou) and Land
Launch (from Baikonur). The increase in the
forecast of satellites to be launched in the small-
est mass class was offset exactly by the decrease
in the forecast for the second mass category.
There is no change in the percentage of satel-
lites to be built in the two largest mass class
categories (satellites with mass greater than
4,200 kilograms) between this year’s forecast
and last year’s forecast. This indicates that the
forecasted growth in large satellites has stabi-
lized at an average of 5.6 satellites per year for
satellites over 5,400 kilograms and an average
of 7.3 satellites per year for those with mass
4,200 to 5,400 kilograms.
COMPARISON WITH PREVIOUS COMSTACDEMAND FORECASTS
The 2008 forecast for commercial GSO satel-
lites launched is compared to the 2003 through
2007 forecasts in Figure 7. The ten-year
demand forecast dropped by 10–15 percent
annually from 2001 to 2004. Since 2004, the
ten-year forecast has remained fairly consistent,
thus establishing the floor of the demand fore-
cast. Based upon this year’s input, there has
been a marked increase in the 2008 and 2009
launch forecast, with a leveling in the later
years. A portion of the increase can be account-
ed for in the five launches that moved from
2007 to 2008 due to return-to-flight delays and
Land Launch production delays. Additionally,
many of the satellites that were launched in
1995–1997 are nearing the end of mission life
and replacements will have to be launched. As
always, the third year of the near-term manifest,
when satellites are being planned but have not
been named publicly, is the hardest to predict.
But, with the currently crowded launch mani-
fests even that third year is becoming more
stable, and is comparable to the 2007 forecasts.
The Proton failure in March 2008 will have an
effect on the 2008 forecast as written in this
report, but the impact will depend on the timing
of return-to-flight and satellite operators
choosing to use other launch options.
13
Figure 7. 2003 Through 2007 vs 2008 Commercial GSO Satellite Demand Forecast

COMPARISON TO INTERNATIONALCOMPREHENSIVE INPUTS
This year, the Working Group received compre-
hensive inputs from one major international
launch service provider (Arianespace) and two
major international satellite manufacturers
(EADS Astrium and Thales Alenia). The
combined average of these international inputs is
higher than the combined 2008 demand forecast
based on U.S. satellite and launch vehicle manu-
facturer inputs. The international input average
annual demand for 2008 through 2017 is 26.1
satellites per year; the U.S.-based average annual
demand forecast is 21.8 satellites per year. The
distribution between mass classes is higher for
the large mass class versus the intermediate
mass class for international respondents, and
effectively the same for the lower mass classes.
LAUNCH VEHICLE DEMAND
The commercial GSO launch forecast is based
on the forecasted number of satellites expected
to launch and an assumption on the amount to
which launch vehicles will dual-manifest
payloads (launch two satellites at once).
Currently only the Ariane 5 has the capability
to dual-manifest commercial GSO satellites.
Given the history of dual-manifest realization
and the unlikely expectation that new dual-
manifest capabilities will emerge during the
forecast period, the Working Group has based
its projection of dual-manifest launches on
Arianespace’s projected manifest. Arianespace
has indicated a launch expectation of approxi-
mately seven Ariane 5 launches in 2008 and
eight in 2009, with most, if not all, commercial
missions expected to be dual-manifested. Based
on Arianespace’s launch history, we project that
one per year will likely be of a non-commercial
(e.g., European government) payload, and one
commercial mission will have to fly on a single-
manifested mission due to schedule, manifesting,
or customer choice, meaning that six dual-
manifested missions can be expected each year
14
Federal Aviation Administration and the Commercial Space Transportation Advisory Committee (COMSTAC)
Figure 8. 2008 COMSTAC GSO Satellite and Launch Demand Forecast

2008 Commercial Space Transportation Forecasts: COMSTAC GSO Forecast
for the 2011–2017 forecast period. The
2008–2010 near-term forecast includes dual-
manifest launches consistent with the best
current understanding of the mission set.
Figure 8 presents the 2008 satellite and launch
demand forecast as well as actual values for
1993 through 2007.
COMSTAC Demand Projection vs.Actual Launches Realized
FACTORS THAT AFFECT SATELLITE LAUNCHREALIZATION
The demand projection is a representation of the
number of new or replacement satellites that
customers hope to launch in a given year. This
demand is typically larger than the number of
satellites actually launched.
Some of the factors that affect the realization of
actual launches for a given year are:
Satellite issues. Satellite manufacturers may
have factory, supplier, or component issues that
can delay the delivery of a spacecraft. Increased
satellite complexity has increased the likelihood
of a delay due to technical challenges or imma-
ture planning. Delays in delivery of spacecraft
to the launch site in turn impacts the planning
and order of launches.
Launch vehicle issues. Launch vehicle manufac-
turers may have factory, supplier, or component
issues that can delay the availability of the
launch vehicle or cause a delay at the launch pad.
A launch failure or component problem can
cause a stand-down to all subsequent launches
until the anomaly is identified to determine if
there are fleet issues that need to be resolved.
Scheduling issues. Both satellite and launch
issues lead to scheduling issues. One individual
launch delay has a cascading impact on subse-
quent launches scheduled in a given year.
Missing one launch window may cause a
significant delay, especially in a well-packed
launch manifest.
Dual-manifesting. The desire to dual-manifest
creates additional schedule complexity, in that
one launch is dependent on two satellites being
delivered on time. Payload compatibility issues
may also cause manifesting challenges.
Weather. Weather, including ground winds,
flight winds, cloud cover, and currents, can cause
multiple launch delays, though these typically are
short-term (i.e. on the order of days) delays.
Planning. Failure to perform to plan will result
in delays. Corporate reprioritization or changing
strategies may delay or even cancel currently
planned launches.
Funding. Satellite service providers may be
unable to obtain the funding needed to carry out
their planned satellite launch, or it may be
delayed until alternate funding is found.
Regulatory issues. Export compliance prob-
lems, Federal Communications Commission
(FCC) licensing issues, or trouble in dealing
with international licensing requirements can
slow down or stop progress on a program. The
U.S. Government policy regarding satellite and
launch vehicle export control is hampering U.S.
satellite suppliers and launch vehicle providers
in their efforts to work with their international
customers. This has caused both delays and
program cancellations.
PROJECTING ACTUAL SATELLITES LAUNCHEDUSING A REALIZATION FACTOR
The Working Group acknowledges that over the
history of this report, the forecasted demand in
terms of both satellites and launches has almost
always exceeded the actual number of satellites
and launchers for the near-term (first three
years) forecast. In order to provide an estimate
of the number of near-term satellites one might
reasonably expect to be launched, the near-term
demand for satellites has been adjusted by a
“realization factor.” Each time the report is pub-
lished, an historical variance is calculated. This
year, a five-year rolling window of forecasted
demand and the actual number of satellites
15

launched for the first two forecast years was
used, versus total historical launches since
1996. The working group believes this provides
a more accurate factor for the near-term fore-
cast. The average variance for the first year is
27 percent while the average variance for the
second year is 23 percent.
The range of expected actual satellites launched
is calculated by multiplying the near-term
demand forecast for the first and second years
by the five year rolling window highest and
lowest variance for the first and second years.
Applying the calculated realization band to the
2008 forecast demand of 27 satellites yields a
probable range of satellites that will actually be
launched of 18 to 22. For the 2009 demand
forecast of 27 satellites, a realized number of
launches of between 20 and 23 are expected.
Figure 9 shows the historical first year forecast
compared to actual satellites launched from
1993 to 2005, as well as the near-term and long-
term demand forecast with realization ranges
shown for 2002 through 2008.
Since the launch realization factor was added to
the COMSTAC GSO Launch Demand Forecast
in 2002, the actual number of satellites launched
has indeed fallen within the discounted launch
realization range.
FORECASTED SATELLITE DEMAND VERSUSACTUAL SATELLITE LAUNCHES IN 2007
The 2007 COMSTAC Commercial GSO
Demand Forecast listed 23 satellites for the
2007 near-term manifest. Eighteen satellites
were actually launched in 2007. The difference
between actual and manifested satellite launches
were due to two reasons:
• Three satellites were delayed due to launch
vehicle scheduling issues caused by the Sea
Launch failure and recovery operations and
Proton return-to-flight delays following
launch failures
• Two satellites were delayed due to satellite
issues
All five of the delayed satellites have subse-
quently been launched as of publication of
this report (one of these launches, the Proton
carrying AMC 14, failed).
16
Federal Aviation Administration and the Commercial Space Transportation Advisory Committee (COMSTAC)
Figure 9. Commercial GSO Satellite Demand: Historical, Near-Term, and Long-Term Forecasts

2008 Commercial Space Transportation Forecasts: COMSTAC GSO Forecast
LAUNCH ASSURANCE AGREEMENTS
As discussed earlier in the report, launch delays
may drive a customer to explore alternative
launch solutions in order to meet revised on-orbit
requirements. To address this circumstance,
launch service providers have developed schedule
assurance offerings that provide for backup
arrangements on a different vehicle. The Launch
Services Alliance (LSA), formed by Arianespace,
Sea Launch, and Mitsubishi Heavy Industries,
offers dual or triple integration among the Ariane
5, Zenit-3SL, and H-IIA launch systems if this
backup option is selected at the time of contract
signing.
Factors That May Affect FutureDemand
Global and industry environmental factors can
affect current and future demand forecasts for
commercial GSO satellite launches. The
Working Group has identified the following
issues as potential factors that may impact
satellite demand in the future.
Global economic conditions have changed
dramatically in the past twelve months. In the
U.S., economic conditions have deteriorated
leading to a “credit crunch” and the “subprime
crisis.” This has affected the supply of capital
for satellite programs as well as consumer
demand for communications services. Financial
institutions have suffered dramatic losses due to
excess liquidity, low interest rates, high level of
securitization, and leverage. These conditions
have led to the tightening of the availability of
capital and the willingness to invest in specula-
tive projects. Globally, weakness in the U.S.
dollar, while appearing to help U.S. exports, has
devalued the buying power of those foreign
entities holding large U.S. dollar reserves. The
rising price of oil has affected both consumer
spending and industrial production. In sum, the
uncertainty and volatility has dampened enthu-
siasm on both the supply and demand sides of
the market for telecommunications services.
Nonetheless, given the long lead-time and
lifecycle of commercial satellite assets, the fall-
out on specific satellite programs has not been
dramatic. The effect on new satellite orders
(particularly for the established players) should
be minimal barring additional significant
declines. Pure consumer-oriented operators, like
digital audio radio service (DARS) and mobile
satellite services (MSS) operators, are at great-
est risk of impact as their revenue generation is
dependent on short-term rather than long-term
consumer spending.
New commercial launch competitors will
impact the launch market over the next few
years with increased competition. Sea Launch is
now marketing Land Launch vehicles to be
launched from the Baikonur Cosmodrome and
has recently successfully completed its maiden
flight (after a year’s delay). Land Launch uses a
Zenit-3SLB vehicle, modified slightly from the
Sea Launch Zenit-3SL. Its lift capability of
3,600 kilograms moves Sea Launch Company,
L.L.C. into the medium launch market segment
(2,500–4,000 kilograms), complementing the
Sea Launch heavy-lift capability. Launch rate
capacity is planned to be four launches per year.
The debut of Arianespace’s Soyuz launch from
French Guiana (Kourou) has been delayed until
2009, with launch site construction starting in
late March of this year. This modified Soyuz
will provide medium-lift capability: the Soyuz
2-1-a can lift 2,700 kilograms to GTO, and the
Soyuz 2-1-b will be capable of lifting 3,000
kilograms to GTO. The near-equatorial launch
location significantly increases the capacity of
the upgraded Soyuz over the launch capacity
from Baikonur. This will add another new com-
petitor in the medium launch market segment. A
new entrant to the space launch industry is
SpaceX, a commercially-funded company
designing the Falcon 1 and Falcon 9 launch
vehicles. The Falcon 1 has been launched twice,
both times failing to put its payload into the
correct orbit. While the Falcon 1 is too small to
launch payloads to GTO, the larger Falcon 9
will be able to launch just under 5,000 kilo-
grams to GTO in the single core version and
over 12,000 kilograms to GTO in the common
17

booster core configuration. Its first launch is
scheduled for late this year or early next year.
Indigenous launch vehicles will likely
decrease the demand for internationally-compet-
ed commercial launches as more countries
decide to build and launch their own govern-
ment and commercial payloads. Potential
indigenous competitors in the commercial mar-
ket include the Indian GSLV, the Chinese Long
March 3B, and the Japanese H-IIA. The GSLV
has a lift capability of 2,200 kilograms to GTO.
However, it is still in the development phase,
with two out of five of the GSLV launches hav-
ing failed. India is continuing with its launch
vehicle program, and will eventually launch its
Insat satellites, which had previously been part
of the internationally-competed commercial
launch market. The Long March 3B can lift
5,000 kilograms to GTO. As China expands its
satellite offerings, Long March will continue to
be packaged in bids intended to preempt full
international competition as with Venesat sched-
uled for launch in 2008. It is currently
scheduled to launch one commercial GEO satel-
lite in 2009, Palapa D. The H-IIA has a lift
capacity of 4,100–5,000 kilograms to GTO.
Japan has successfully performed 13 out of 14
launches of the H-IIA. The Japanese space
agency, JAXA, plans to build an H-IIB vehicle
with greater lift capability. Like China, the
introduction of domestic satellites to the mar-
ketplace may result in higher usage of the
H-IIA. As more countries grow their internal
launch capability, the degree of open (commer-
cial) competition for launches will decrease.
New market applications continue to drive
demand for satellite services and new satellite
systems. High-definition television (HDTV) and
satellite broadband access services have firmly
established commercial applications for Ka-
band satellites. Continued growth of video
services and HDTV is expected to underpin
future satellite demand in general. Satellite
broadband systems have demonstrated signifi-
cant consumer demand in North America and
new systems are in development for other
regions. In the MSS segment, new systems from
ICO, TerreStar, and MSV will be launched
over the next two years using the Ancillary
Terrestrial Component authorized by the FCC.
ATC enables an integrated terrestrial/satellite
network solution for MSS providers. If these
systems are successful, similar systems could be
developed worldwide. The U.S. market success
of XM and Sirius Satellite Radio is also spark-
ing interest in DARS and mobile video
broadcast services in other regions.
U.S. Government regulatory environment
continues to be an issue for domestic manufac-
turers as international competitors develop
satellite and launch offerings that are not
subject to U.S. export regulations for the
commercial market.
Consolidation in recent years has reconfigured
the satellite operator landscape, yielding global
fleet operators SES and Intelsat and large region-
al and multi-regional operators such as Eutelsat,
Telesat, and JSAT. While consolidation has not
slowed new satellite orders to date and market
growth has helped improve operator capacity
utilization rates, some operators have said they
plan to reduce their future replacement satellite
requirements by reducing overall fleet size.
Hosted payloads are payloads who cannot
afford the cost of a dedicated spacecraft, paired
with a satellite service operator who wants to off-
set their commercial launch costs. There are a
variety of potential hosted payloads including:
experimental, scientific, weather, FAA, and mili-
tary communications missions. Payload hosting
offers many benefits to both parties. The cost of
launch is shared, thereby reducing the primary
payload’s launch costs while providing afford-
able space access for the hosted payload. In
addition, the hosted payload gains the efficiency
of utilizing a commercial launch system that pro-
vides access to more orbital locations.
There are limitations to widespread acceptance
and utilization of hosted payloads. The contrac-
tual relationships are more complex because
there are three (or more) parties, rather than
two, involved in the spacecraft purchase. In
18
Federal Aviation Administration and the Commercial Space Transportation Advisory Committee (COMSTAC)

2008 Commercial Space Transportation Forecasts: COMSTAC GSO Forecast
some cases, the commercial satellite service
provider does not want to impact its program
and requires firm deadlines for delivery of the
hosted payload as well as clearly defined inter-
faces at the start of satellite construction. If the
hosted payload fails to arrive on time, the client
could be liable for covering any residual
impacts to the satellite cost and schedule.
Supplementary Questionnaire Results
As part of the COMSTAC request for inputs
from industry participants, a supplemental
questionnaire was provided to satellite service
providers. The questions focus on factors that
impact service providers’ plans to purchase and
launch satellites. A summary of the responses to
this questionnaire is provided in Table 6. The last
column is a comparison to the survey responses
received for the 2007 COMSTAC report.
The following 18 satellite service providers
responded to the supplementary questionnaires.
The Working Group would like to offer special
thanks for providing this additional input:
ARsat
Asia Satellite Telecommunications, Ltd. *
Hisdesat
Hispasat
Hughes Network Systems, LLC.
Intelsat, Ltd. *
19
Table 6. 2008 COMSTAC Survey Questionnaire Summary

JSAT Corporation
Mobile Broadcasting Corporation (MBCO)
Measat Satellite Systems Sdn. Bhd.
Mobile Satellite Ventures (MSV)
ONDAS Media S. A.
Sirius Satellite Radio
Space Communications Corporation (SCC) *
Telenor ASA
Telesat *
Thuraya Satellite Telecommunications Company
Wildblue Communications, Inc.
XM Satellite Radio
* Indicates 2007 survey respondents
The 2008 survey reflects a generally positive
perception of the industry and satellite market
demand drivers, along with positive improve-
ments in industry’s ability to meet the needs of
satellite service providers. The global economic
conditions, ability to compete with terrestrial
providers, and ability to acquire licensing, how-
ever, were cited as neutral to slightly negative.
It should be noted that only four of the 18
respondents to the 2008 questionnaire submitted
responses to the 2007 questionnaire, which
could have some influence on the comparison
of results.
The industry appears to have adjusted to the
recent wave of satellite service provider consol-
idation, with 94 percent of the respondents
seeing “no effect” this year compared with 36
percent of respondents indicating significant or
some negative impact in 2007. Additionally, the
reliability and availability of the satellite sys-
tems are identified as having a more positive
impact according to the survey.
Launch vehicle reliability was cited as a nega-
tive factor by 22 percent of the respondents
versus 50 percent of the respondents in 2007,
despite the fact that there were two launch
failures of commercial vehicles in 2007 (Sea
Launch/NSS-8 and Proton M/JCSAT-11) com-
pared to one launch failure (Proton M/Arabsat
4) in 2006. Seventy-six percent of the 2008
respondents indicated that launch vehicle relia-
bility had either no effect or a positive effect on
their plans. Launch vehicle availability was
cited as a negative factor by 11 percent of the
2008 respondents compared to 59 percent of the
2007 respondents, which is a significant swing
to the positive, considering the launch failures
and the full near-term manifests of other
commercial launch providers.
There were only two survey areas that experi-
enced a downward trend from 2007 to 2008.
Twenty-two percent of the 2008 respondents
cited the perceived ability to compete with
terrestrial services as a negative influence
compared with only 17 percent of the 2007
respondents, and 22 percent of the 2008 respon-
dents stated that they were negatively impacted
by the ability to obtain the required operating
licenses versus 8 percent of the respondents
in 2007.
Commercial GSO Satellite Trends
TRENDS IN NUMBER OF TRANSPONDERS PERSATELLITE
Figure 10 and Table 7 show the number of
C-band, Ku-band, and Ka-band transponders
launched per year and the average number of
transponders per satellite launched from 1993 to
2007, with a projection for 2008 based on the
near-term manifest shown in Table 4. Peaks in
total number of transponders launched corre-
spond to peaks in number of satellites launched
for a given year. The average number of
transponders launched in recent years tends to
trend up and down with respect to the numbers
of each class of satellite launched with
variances year over year. A five-year moving
average reveals that despite the growth period
in the number of transponders per satellite seen
in the early part of this decade, the past several
years have remained very stable. This corre-
sponds with the stabilization of the move to
heavier, higher-powered satellites. The average
in 2008 is expected to drop slightly, but it will
come back up in 2009. The average will continue
20
Federal Aviation Administration and the Commercial Space Transportation Advisory Committee (COMSTAC)

2008 Commercial Space Transportation Forecasts: COMSTAC GSO Forecast
to shift slightly, but overall stability seems
likely. For the purpose of this analysis, a small
number of satellites were excluded because
their application is substantially different from
the standard commercial GSO satellite. The
satellites excluded are those used primarily for
mobile applications because their communica-
tion payloads are not easily analyzed in terms
of typical C-band, Ku-band, and Ka-band
transponders. Examples include the Inmarsat,
Paradigm (Skynet 5), Thuraya, XTAR/Spainsat,
ICO, XM and Sirius satellites, which have
X-band, L-band, and/or S-band transponders.
TRENDS IN AVERAGE SATELLITE MASS
Figure 11 and Table 8 show the total mass
launched per year and the average mass per
satellite launched. The total mass launched per
year correlates with the number of satellites
launched per year, as does the total number of
transponders. The average satellite mass peaked
in 2005 with 2006 showing a slight downturn.
Like the discussion on mass classes earlier in
the report, the expectation is that the average
mass per satellite will trend towards constancy.
The last four years have averaged a little over
4,000 kilograms and the expectation is that the
next several years will be similar. This again
correlates to the stabilization of the shift to
heavier, higher-power satellites. The projected
total mass to be launched in 2008 will be an all-
time high, nearly 100,000 kilograms.
21
Figure 10. Total C/Ku/Ka Transponders Launched per Year and Average Transponders per Satellite
Table 7. Total C/Ku/Ka Transponders Launched per Year and Average Transponders per Satellite

Summary
The 2008 COMSTAC Commercial GSO
Launch Demand Forecast projects an average
annual demand of 21.8 satellites to be launched
from 2008 through 2017, an increase of approx-
imately one satellite when compared to the
2007 forecast of 21.0 and the 2006 forecast of
20.8 satellites per year. For the fifth year in a
row however, the actual number of satellites
launched has remained less than 20, with 18
launched in 2007.
The Working Group is forecasting 22 total
launches (including 5 dual-manifest) in 2008,
increasing to 23 total (including 4 dual-mani-
fest) launches in 2009, with 18 (including 5
dual-manifest) launches expected in 2010. The
long term forecast of average annual single-
manifest launches over the ten-year period
spanning 2008 through 2017 is 10.6 launches
per year. The average annual dual-manifest
launches during 2008 through 2017 are fore-
casted to be 5.6. Based upon these data and the
satellite demand projection, the 2008
Commercial GSO Launch Demand Forecast
averages 16.2 launches per year from 2008
through 2017—an increase of one launch from
last year’s forecast.
Though there has been steady growth in satellite
mass since 1993, the trend looks to be stabiliz-
ing, after peaking in 2005 at 4,500 kilograms.
The total mass launched will continue to hit
highs with almost 100,000 kilograms forecast
for 2008. At the same time, the trend in increas-
ing average number of transponders per satellite
22
Federal Aviation Administration and the Commercial Space Transportation Advisory Committee (COMSTAC)
Figure 11. Total Satellite Mass Launched per Year and Average Mass per Satellite
Table 8. Total Satellite Mass Launched per Year and Average Mass per Satellite

2008 Commercial Space Transportation Forecasts: COMSTAC GSO Forecast
is also stabilizing, although the peak number of
over 1,000 transponders launched in 2002 has
not been topped.
The Working Group has identified market
events that have the potential of impacting over-
all GSO spacecraft and launch demand within
the space launch industry. Continued consumer
acceptance of HDTV and growth in leased
capacity is driving strength in the FSS and DTH
markets. This is being supplemented by growth
in segments such as MSS and regional opera-
tors, as well as the emergence of new entrants.
Key factors affecting global satellite market
demand at this time include the ability to eco-
nomically secure financing for new satellite
projects and operators, the overall affordability
of the space segment, and timely and reliable
access to space.
The launch vehicle industry is adding capacity
with three new launch vehicle entrants capable
of launching medium-class payloads in the
immediate and mid-term periods: Land Launch,
successfully launching its initial commercial
satellite in April 2008; Falcon 9, planning to
launch in late 2008 or early 2009; and Soyuz
from Kourou, planning to conduct its initial
launch sometime in 2009. Other U.S. launch
vehicles in development, or those in existence
from other emerging space nations, may provide
additional capacity in the future.
23

24
Federal Aviation Administration and the Commercial Space Transportation Advisory Committee (COMSTAC)
Table 9. Historical Addressable Commercial GSO Satellites Launched (1993–2007)

2008 Commercial Space Transportation Forecasts: COMSTAC GSO Forecast
25
Table 9. Historical Addressable Commercial GSO Satellites Launched (1993–2007) [Continued]

26
Federal Aviation Administration and the Commercial Space Transportation Advisory Committee (COMSTAC)
Table 9. Historical Addressable Commercial GSO Satellites Launched (1993–2007) [Continued]

2008 Commercial Space Transportation Forecasts: COMSTAC GSO Forecast
27
Table 10. Historical Non-Addressable Commercial GSO Satellites Launched (1993–2007)

28
Federal Aviation Administration and the Commercial Space Transportation Advisory Committee (COMSTAC)

Executive Summary
The Federal Aviation Administration’s 2008
forecast projects a 38 percent increase in
demand for worldwide commercial launches to
non-geosynchronous orbits (NGSO) during
2008–2017 compared to last year’s forecast. A
total demand of 112 launches is forecast
compared to 81 launches in the 2007 forecast.
This increase is attributed to two factors: the
inclusion of Iridium replacement launches in
the forecast and the addition of a new category
called orbital facility assembly and services as
commercial companies today prepare to support
the International Space Station (ISS). The
forecast could be higher or lower in the future
depending on the successful development of
new vehicles attempting to meet this new
orbital services market.
The 2008 Commercial Space TransportationForecast for Non-Geosynchronous Orbits is an
annual report prepared by the Federal Aviation
Administration’s Office of Commercial Space
Transportation (AST). The report assesses the
worldwide market for satellites and other space-
craft expected to be available for competition
between providers of commercial launch
services, have commercial sponsors, or involve
delivery of commercially operated services.
The 2008 forecast contains 276 satellites during
the next ten years, an increase of 45 percent
compared to the 2007 forecast of 191 satellites.
Diversity continues to characterize the global
NGSO market with combinations of private and
government funding for missions ranging from
science and commercial remote sensing to space
station cargo and telecommunications.
2008 Launch Forecast: FAA/AST is forecast-
ing an average demand of 11.2 worldwide
launches per year during 2008–2017 with
some sustained activity in the far-term, a
change from recent forecasts that showed
declining activity in the far term. During
2007 there were 12 actual commercial
NGSO launches, the most since 1999.
Demand is divided into two vehicle size classes
with an average of 8.1 medium-to-heavy launch
vehicles per year and about 3.1 small vehicle
launches per year during the forecast period.
While the number of small launches is similar
to last year’s forecast, the number of medium-
to-heavy launches increased by almost three
launches per year.
The largest growth sector of the satellite (or
payload) market is for telecommunications
because of the addition of 72 satellites for
Iridium’s next-generation constellation.
Telecommunications makes up half of the satel-
lite market but only about 21.5 percent of the
launch market because of multiple-manifesting;
each launch for the second-generation Iridium,
Globalstar, and ORBCOMM systems is expected
to carry about six satellites per launch.
About 28 percent of the satellite market is
comprised of international science and other
satellites, such as technology demonstrations.
This translates to 39 percent of the launch
market. The new orbital facilities assembly and
services category accounts for 25 percent of the
launch market. A potential demand of 28 or
more launches exists throughout the next ten
years if companies are successful in developing
new vehicles capable of launch, docking, and
some for reentry. Commercial remote sensing
satellites account for about 14 percent of the
launch demand market.
2008 Commercial Space Transportation Forecast for Non-Geosynchronous Orbits
2008 NGSO Commercial Space Transportation Forecast
29

Introduction
The 2008 non-geosynchronous orbits forecast
shows changes again in the makeup of the
market with addition of a new category called
orbital facility assembly and services (OFAS) as
well as the return to the forecast of the largest
satellite constellation ever launched, Iridium.
This is the fourth consecutive forecast to
contain an overall increase in the number of
launches in the ten-year projection, continuing
the trend away from a weakened market during
2001 to 2003.
To back up this trend, last year 12 actual NGSO
commercial launches took place, more than the
previous three years combined. There were as
many NGSO launches as geosynchronous orbit
(GSO) launches during 2007 (see Table 11).
The GSO market was limited to 12 launches
because of delays from launch failures and a
new vehicle.
In last year’s report, the FAA began use of a
“realization” factor for the NGSO forecast
because of a relatively high demand of 17
launches that appeared unlikely to occur in the
first year (2007) of the ten-year forecast. The pro-
jected realization was for 10–13 launches during
2007. This year, the FAA realization is only 8–10
launches with a demand for 11 launches (see
Table 16). Because the realization matches more
closely with the demand forecast, this could be a
sign of stabilization in the market. Four launches
scheduled in 2007 carried over into 2008 com-
pared to eight launches that shifted from 2006
into the 2007 forecast.
The near-term NGSO manifest shows a steady
rate of NGSO launch demand with 11 in the
forecast for 2008, 12 in 2009, 11 in 2010, and
10 in 2011. Unlike previous forecasts since
2003, the out-years also have a steady amount
of activity comparable with the near-term
because of the deployment of Iridium’s next
generation system of 72 satellites and projected
consistent rate of commercial launches for
resupply of the ISS.
However, the OFAS market is new and although
demand is healthy and funding appears to be
available both in the private sector and from
government, forecasting the successful technical
development by industry of new vehicles needed
to meet the demand is uncertain. These vehicles
include launch vehicles and automated ren-
dezvous vehicles as well as spacecraft capable of
carrying people. In addition, the competition for
bids to provide services to NASA for ISS has not
been completed. Furthermore, if a vehicle capa-
ble of carrying people is available, the market
could grow quickly. Bigelow Aerospace could
buy launch and rendezvous services for its
planned habitat modules, some of which are
under construction today.
Instead of excluding the ISS market or setting
high and low rates of activity, the FAA is fore-
casting a launch rate necessary for two launch
providers to meet commercial ISS supply upmass
needs based on NASA’s 2010–2015 model pub-
lished in an April 2008 Request for Proposals.
The forecast at this time does not include place-
holders for Bigelow Aerospace modules or a
projection of supply activity. It is entirely possi-
ble that flight rates and schedules to support both
ISS and Bigelow Aerospace could change based
on demand and when space transportation
vehicles under development emerge.
30
Federal Aviation Administration and the Commercial Space Transportation Advisory Committee (COMSTAC)
Table 11. Commercially Competed Launches

Extensive private investment is being made by
Bigelow Aerospace, SpaceX, and Orbital
Sciences. For the latter two, the investment in
new launch and rendezvous vehicles is supported
by NASA funding from the Commercial Orbital
Transportation Services (COTS) program.
Today’s NGSO launch market is characterized by:
• An increase in activity by telecommunica-
tions satellites;
• A steady demand by international science;
• The new and promising sector of orbital
facility assembly and services; and
• A small number of commercial remote
sensing satellites.
With replacement plans for second generation
systems for Globalstar, ORBCOMM, and
Iridium all included in the forecast, telecommu-
nications comprises the largest sector of the
market. Fifty-three percent of all satellites
seeking commercial launch services in during
the next 10 years are in the telecommunications
sector. However, no new telecommunications
systems are forecast to compete with these
existing systems. This may be an indicator that
NGSO demand may be satisfied and companies
and investors eager to enter the business have
shifted to GSO systems.
The second largest satellite market segment is
international science or “other” satellites (such
as technology demonstrations) at 28 percent.
After accounting for multiple-manifesting where
more than one satellite can ride aboard per
launch, the science market accounts for 39 per-
cent of the launch demand market. The future
science market continues to be difficult to assess
beyond the near-term because of limited budgets
and uncertainty on multiple- or single-manifest-
ing. Historically, the science and other sector is
the most dependable sector of activity. Because
of the transfer of COTS launches from the
“other” sector into the new OFAS category, sci-
ence/other is the only sector to show a decline
from the 2007 launch forecast.
The emerging OFAS market contains 10 percent
of total spacecraft in the forecast but accounts
for 25 percent of the launch market demand,
all on medium-to-heavy launch vehicles. The
commercial remote sensing sector encompasses
only nine percent of the satellite market and 14
percent of the launch demand market with up
and down demand cycles for both new pro-
grams and replacements of existing satellites.
The financial situation for existing NGSO oper-
ators, as with the entire satellite business sector,
has been positive in recent years because of
favorable lending terms, driven by the overall
increase in global private equity investment pro-
grams and a healthy economy. Although there
are signs of a slow down in the U.S. economy
(including the housing subprime mortgage
crisis and credit crunch) and rising fuel and
food prices worldwide during 2008, it is unclear
when and to what extent the satellite sector will
be affected.
Unlike the 1990s when primary investors were
the companies building the NGSO satellites,
major backers today include private equity
investors and global banking interests. Many
private equity investors, however, may be look-
ing to exit the overall satellite market through
public offerings or other mechanisms.
After bankruptcies of the first generation of
NGSO mobile constellations, new owners of
the fully-deployed orbital systems started with
a clean balance sheet. ORBCOMM and
Iridium have prospered with new subscribers.
ORBCOMM’s stock has performed well and it
signed a second-generation satellite construction
contract in May 2008. Iridium posted record
revenue during the first quarter of 2008 and
plans to award a satellite construction contract
in 2009 with the possibility of gaining further
investment from hosting small guest payloads
aboard its satellites. With its existing first
generation in good shape, Iridium has time
and momentum to build up more financing.
Globalstar finds itself in the opposite situation
31
2008 NGSO Commercial Space Transportation Forecast

after initially gaining subscribers following
restructuring from bankruptcy. With the voice
capabilities of its first-generation system
degrading from S-band antenna problems,
Globalstar faces some urgency to start launching
its second-generation replacement satellites as
soon as it can. After completing two launches of
remaining first-generation spare satellites in
2007, second-generation satellite launches are
scheduled to start in 2009. However, revenue
and stock price declined in 2007 compared to
2006 and the company needs to raise additional
financing.
In the U.S. commercial remote sensing sector
there is broader optimism. GeoEye, which is
publicly traded, saw its stock price increase
almost 74 percent in 2007. Both GeoEye and its
competitor DigitalGlobe (privately held, with
Morgan Stanley as a key investor) have benefited
from National Geospatial-Intelligence Agency
(NGA) contracts and regular commercial cus-
tomers. With near-term launches of new satellites
funded, U.S. commercial remote sensing could
have long-term financial stability.
Launch market share in the near-term NGSO
market continues to be led by vehicles built by
Russia and Ukraine. Of the 29 commercial
NGSO launches from 2008–2010 that have
known launch contracts, Russia/Ukraine is
launching 18, followed by 10 for the U.S. and
one launch by India.
The FAA Office of Commercial Space
Transportation compiles the Commercial SpaceTransportation Forecast for Non-GeosynchronousOrbits on an annual basis. The forecast covers
commercial launch demand for global space sys-
tems expected to be deployed in orbits other than
GSO, including low Earth orbit (LEO), medium
Earth orbit (MEO), elliptical orbit (ELI), and
external orbit (EXT) such as to the Moon, Mars,
and beyond. This forecast only contains demand
for orbital launches.
It is important to note that this report represents
the FAA’s assessment of how many satellites are
seeking launch services to determine the overall
demand for launches and is therefore not a pre-
diction of how many launches might actually
occur throughout the entire forecast. The fore-
cast also does not evaluate if operators will
attract enough business to prosper after launch.
The results of this forecast do not indicate FAA
support or preference for any particular satellite
system. The majority of satellites in the forecast
are (or were) open for international launch serv-
ices procurement or sponsored by commercial
entities for commercial launch. In an addition to
past methodology, U.S. commercially-competed
launches for ISS resupply missions were includ-
ed in this forecast.
The following sections review each market
segment and describe the results of the 2008
forecast.
NGSO Satellite Systems
INTERNATIONAL SCIENCE AND OTHERPAYLOADS
Government programs, technology development
missions, and satellite radio are significant cus-
tomers of commercial launch services to NGSO.
These are the primary constituents of the inter-
national science and other payload market
category. Though most government missions do
not use commercially-procured or commercially-
licensed launches, there are select missions that
do, particularly by governments that do not have
domestic launch capabilities. For technology
demonstration missions, most involve small
satellites on modest budgets, so the demand
leans toward low-cost, small launch vehicles.
The continued availability of inexpensive
launches on refurbished Russian and Ukrainian
ballistic missiles, and new U.S. vehicles, prom-
ises to support demand for such launch services.
In the past few years, science or technology
demonstration payloads have been launched
commercially for operators in a number of
countries, including China, France, Italy, Saudi
Arabia, South Korea, Taiwan, Turkey, and the
United Kingdom.
International science satellites can be classified
32
Federal Aviation Administration and the Commercial Space Transportation Advisory Committee (COMSTAC)

into three groups. The first group is remote sens-
ing satellites that are operated non-commercially,
typically by government agencies, but are often
built by commercial firms in other countries. The
imagery products generated from these satellites
are usually offered for free or are used for gov-
ernment purposes. RazakSat, built by Astronautic
Technology (M) Sdn Bhd for the Malaysian gov-
ernment, is a small remote sensing satellite that
will operate in a low-inclination orbit to permit
frequent passes over Malaysia. The satellite is
scheduled for launch in 2008 on a Falcon 1. The
Disaster Monitoring Constellation (DMC) is a
remote sensing system that provides multispectral
imaging in support of disaster relief operations.
The system currently consists of five spacecraft
built by Surrey Satellite Technology Ltd. (SSTL)
for Algeria, China, Nigeria, Turkey, and the U.K.
individually. Two next-generation DMC satellites
are currently under development for Spain and
the U.K., DEIMOS-1 and UK DMC-2. These
satellites are planned to be launched together,
along with two Aprize satellites and the primary
payload Dubaisat-1, by a Dnepr vehicle in late
2008. Dubaisat-1, weighing in around 200 kilo-
grams (440 pounds), is another remote sensing
satellite within the international science market.
The 2.5-meter (8.2-foot) resolution imaging satel-
lite will serve civil infrastructure development
and environmental monitoring purposes through
the Emirates Institution for Advanced Science
and Technology (EIAST), a Dubai government
organization.
A second class of satellites includes spacecraft
designed to carry out other scientific work in
space, ranging from specialized Earth sciences
research to planetary missions. One example is
Gravity Field and Steady-State Ocean
Circulation Explorer (GOCE), a European
Space Agency (ESA) mission to generate high-
resolution maps of the Earth’s gravity field; it is
scheduled for launch on a Rockot in 2008.
The third class of satellites feature spacecraft
designed to perform technology demonstrations.
An example is the Cascade, Smallsat, and
Ionospheric Polar Explorer (CASSIOPE) space-
craft. A prime objective of the CASSIOPE
mission is to space qualify high-performance
payload components that will be utilized in the
CASCADE mission currently under develop-
ment at MacDonald, Dettwiler and Associates
(MDA). The CASCADE mission will enable a
service business that will offer users in remote
areas the ability to move potentially thousands
of gigabits on a daily basis to and from anywhere
on earth. MDA expects to launch the first
constellation of four CASCADE satellites in
2010. The Swedish Space Corporation is also
constructing a technology demonstration mission,
named Prisma. This mission consists of two
satellites demonstrating formation flying and
rendezvous activities. The satellites will launch
in June 2009 on a Dnepr.
Small, one-kilogram satellites measuring about
ten centimeters square, called CubeSats, are
increasingly popular with universities world-
wide as educational tools. The CubeSat
specification, conceived by Stanford
University’s Bob Twiggs and developed for
launch by California Polytechnic University, can
form the basis for picosatellites costing less than
$50,000. Over 40 universities are building
CubeSats for a variety of applications.
Seventeen CubeSats have been successfully
launched to date, including seven that were
launched on a commercial Dnepr mission in
April 2007; 14 CubeSats were lost in the failure
of the noncommercial launch of a Dnepr rocket
in July 2006. Launch costs per CubeSat can be
as low as $40,000. Because of the small size of
the satellites and their developers’ limited
budgets, these payloads do not stimulate
commercial launch demand on their own.
DIGITAL AUDIO RADIO SERVICES
Satellite digital audio radio services (DARS)
providers, commonly referred to as satellite
radio, have solidified their position in the U.S.
consumer market, while new providers are
looking to the European consumer market in the
near future. In the United States, XM and Sirius
Satellite Radio are continuing to boost their cus-
tomer base, but are also planning to consolidate
their operations and await a final determination
from the Federal Communications Commisssion
33
2008 NGSO Commercial Space Transportation Forecast

(FCC). The U.S. Department of Justice gave its
go-ahead to the XM-Sirius merger in early
2008. These merger plans add some uncertainty
to the number and timing of future NGSO
DARS satellites in the United States. Sirius
currently has plans for one NGSO satellite
launch and both companies have additional
GSO launches booked, but a merger could
affect these deployments.
In Europe, Ondas Media is making the strongest
movement towards an NGSO DARS system.
They have signed an authorization to proceed
with Space Systems/Loral for the design and
development of their system, which would
include three ELI satellites launched around
2012. Ondas is currently in the financing phase.
Ondas faces possible market competition from
Europa Max, which reportedly plans a similar
HEO system to Ondas, and GSO DARS players
WorldSpace and an SES-Eutelsat partnership.
This forecast assumes that there is a market for
one European NGSO DARS system, based on
the Ondas satellite and timeframe plans.
MILITARY
Commercial launches are sometimes procured
by governments for military satellites. These are
minority cases, but two European systems
currently use this commercial method: Italy’s
Cosmo-Skymed and Germany’s SAR-Lupe. A
third European country, Sweden, might also
have future government missions launched
under commercial contract.
The Italian Cosmo-Skymed constellation is a
grouping of four synthetic aperture radar imag-
ing satellites procured by the Italian Space
Agency (ASI) for Italian government use. The
spacecraft have a mass of 1,700 kilograms (3,745
pounds) and will orbit at an altitude of around
619 kilometers (385 miles). ASI contracted with
Boeing Launch Services for the first three
Cosmo-Skymed launches. The first two satellites
were launched individually by Delta II vehicles
in 2007. The third is planned for a Delta II in
2008, while the fourth is planned for a yet-to-be-
determined vehicle in 2009.
SAR-Lupe is a constellation of five radar
imagery satellites for use by the German Armed
Forces. The 770-kilogram (1,968-pound) satel-
lites are being placed into three 500-kilometer
(311-mile) orbital planes, from which they will
be able to observe the Earth’s surface between 80
degrees north and south latitude. The satellites
were built by a team led by German satellite
manufacturer OHB-System under a 15-year,
€300-million (US$480-million) contract with the
German Defense Ministry that began in 2002.
The German government contracted with
Rosoboronexport, the Russian state corporation
that handles the import and export of military
systems, to launch the satellites on several
Cosmos 3M boosters. The first SAR-Lupe satel-
lite was launched in December 2006, two more
were launched in 2007, and the final two will be
launched in 2008.
MARKET DEMAND
FAA/AST projects that 76 satellites of the
international science or other categories will be
launched during the forecast period. These
payloads will be deployed on 44 launches,
including 19 medium-to-heavy and 25 small
vehicles. Comparing market categories, this is
the second largest number of satellites to be
launched and the highest amount of total launch
demand in the forecast.
COMMERCIAL REMOTE SENSING SATELLITES
Remote sensing has become a strong worldwide
market with the advent of advanced and widely-
distributed geographic information systems
(GIS). Commercial remote sensing satellites are
one set of systems that provide imagery and data
for GIS applications, along with high-resolution
government satellites and aerial systems. One
sign of competition within the market is invest-
ment in vertical markets by major players, such
as combining aerial and satellite assets together
while offering additional value-added GIS
services. There is sufficient demand for imagery
and data from both government and commercial
customers, though, to support several new and
existing commercial satellites.
34
Federal Aviation Administration and the Commercial Space Transportation Advisory Committee (COMSTAC)

The U.S. Government continues to be an impor-
tant driver of the commercial remote sensing
satellite market. The NGA partially funded the
development of the current generation of
GeoEye and DigitalGlobe satellites (although
DigitalGlobe’s WorldView 2 was not funded
through an NGA contract). This satellite funding
is provided by NextView contracts. The NGA
also purchases imagery through ClearView con-
tracts. The future of NGA contracts with
commercial operators, which has yet to be
announced, will be a significant determining
factor on future satellite plans. Civil govern-
ments are also commercial imagery users. The
U.S. Geological Survey announced in May 2008
new multi-year imagery acquisition contracts
with GeoEye, DigitalGlobe, and SPOT Image
Corporation for civil uses. Public-private part-
nerships in Europe have also spurred system
development. For example, Germany and
Infoterra partnered for the development of the
TerraSAR system.
The National Oceanic and Atmospheric
Administration (NOAA) is the U.S. agency with
authority to license commercial remote sensing
systems. There have been 28 licenses issued to
date since 1993. Twelve of these licenses were
35
2008 NGSO Commercial Space Transportation Forecast
Table 12. Commercial Satellite Remote Sensing Systems

granted to GeoEye and DigitalGlobe, or their
predecessor companies. Fourteen other compa-
nies have received licenses, however, eight of
these companies have retired their licenses. A
listing of NOAA licenses is presented in Table
13. On June 29, 2007, NOAA lifted its 24-hour
hold rule on satellite imagery of better than .82-
meter ground resolution. This change allows the
sale of imagery with a resolution no better than
.5 meters ground sample distance resolution
without a waiting period. This “no better than
.5 meter ground sample distance resolution” is
also the limit on commercially-sold imagery.
As has been the case in recent forecasts, the
overall commercial remote sensing sector
exhibits low, but steady, commercial launch
demand. Though the GIS market is growing, it
is not generating a significant amount of new
commercial satellite and launch opportunities.
The major companies operating or actively
developing remote sensing satellites across the
globe are profiled below. A summary of the
commercial remote sensing systems is provided
in Table 12.
DIGITALGLOBE
DigitalGlobe is a U.S. commercial remote sens-
ing data provider, based in Longmont, Colorado.
The company was established in 1993 and is
privately held. In April 2008, DigitalGlobe filed
a registration statement with the SEC relating to
a proposed initial public offering of its common
stock, though, signaling a possible move
towards public ownership. The company is
currently expanding its on-orbit capability while
also expanding its aerial assets and value-added
capabilities.
DigitalGlobe has two remote sensing satellites on
orbit within its Quickbird and WorldView sys-
tems. Quickbird, its first operational satellite, was
launched by a Boeing Delta II on October 18,
2001 and continues to operate with a current pro-
jected operational lifetime lasting until around
2010. A previous Quickbird satellite was lost due
to a Cosmos launch vehicle failure in November
2000. A higher-capability generation of satellites,
beginning with WorldView 1, is also now opera-
tional. WorldView 1 was launched onboard a
Boeing Delta II on September 18, 2007. The
satellite has an average revisit time of 1.7 days
and a swath width of 16 kilometers (10 miles).
It is capable of collecting up to 500,000 square
kilometers (200,000 square miles) per day of
half-meter imagery.
DigitalGlobe also has a second WorldView
satellite in development, with another Boeing
contract announced for a Delta II launch in the
mid-2009 timeframe. WorldView 2, also with
half-meter resolution, will operate in an 800-
kilometer (500-mile) orbit designed to reduce
revisit times and has an estimated lifetime of at
least seven years.
Both government and commercial customers
have driven demand for DigitalGlobe’s satellite
imagery. The NGA awarded the company
NextView and ClearView contracts beginning in
2003, which partially funded WorldView 1 and
provided a sustained customer for imagery.
Commercial imagery demand has grown since
the early 2000s to significantly supplement
government demand. The strong market is
evidenced by the development of WorldView 2
without a significant NGA funding vehicle like
NextView.
GEOEYE
GeoEye, Inc., based in Dulles, Virginia, is a pub-
licly-traded U.S. commercial remote sensing data
provider. The company was formed by the
acquisition of Space Imaging by ORBIMAGE in
January 2006. GeoEye is nearing the launch of its
next-generation satellite system, which will add
higher-resolution satellite capability to its two
currently-operational satellites, two imaging air-
craft, network of ground stations, and geospatial
information products and services.
GeoEye currently operates the IKONOS and
OrbView-2 imaging satellites. IKONOS was
launched on September 24, 1999, by an Athena
II vehicle. The satellite operates in a 680-kilo-
36
Federal Aviation Administration and the Commercial Space Transportation Advisory Committee (COMSTAC)

meter (423-mile) polar orbit with a ground reso-
lution of 0.82 meters (2.7 feet). IKONOS is
expected to remain operational for the foresee-
able future, possibly into the next decade. The
OrbView-2 satellite, launched by a Pegasus XL
booster on August 1, 1997, continues to provide
images of up to 1.1 kilometers (0.71 miles)
much past its projected operational lifetime.
Imagery from this satellite is primarily used by
the commercial fishing industry and for scientif-
ic research. GeoEye’s OrbView-3 satellite
provided imagery until April 2007, when it
experienced an imaging malfunction and was
declared no longer operational.
The company’s high-resolution next-generation
satellite, GeoEye-1, is currently planned for
launch aboard a Boeing Delta II from
Vandenberg Air Force Base in August 2008. The
satellite will operate in a sun-synchronous polar
orbit at an altitude of 684 kilometers (425
miles) and will have the ability to take panchro-
matic images with a ground resolution of 0.41
meters (16 inches) and multispectral images
with a resolution of 1.65 meters (5.4 feet).
Imaging technology will allow 0.41-meter color
imagery to be produced. The spacecraft will be
able to collect about 700,000 square kilometers
(270,000 square miles) of images per day in the
panchromatic mode and half that in the multi-
spectral mode. The satellite has a planned
operational lifetime of seven years or longer
GeoEye has also begun the development of its
next satellite, GeoEye-2. The company
announced a contract with ITT in October 2007
for the commencement of work on the new
satellite’s imaging system. The satellite’s ground
resolution could possibly be as good as 0.25
meters (9.75 inches). Current development time-
lines place the launch of this third-generation
satellite around 2011.
The U.S. government continues to be GeoEye’s
largest customer, though commercial customers
also provide significant demand. The NGA had
around $100 million of purchases from GeoEye
in 2007. These purchases amounted to about 55
percent of company revenues, meaning that other
government and commercial customer purchases
were also significant drivers of demand.
37
2008 NGSO Commercial Space Transportation Forecast
Table 13. Current Commercial Satellite Remote Sensing Licenses
Note: Please see www.licensing.noaa.gov/licenses for public summaries for these systems.

IMAGESAT INTERNATIONAL NV
ImageSat, founded as West Indian Space in
1997, is a Netherlands Antilles company that
provides commercial high-resolution imagery
from its Earth Remote Observation Satellite
(EROS) family of satellites. The EROS satellite
contracting team includes Israel Aerospace
Industries Ltd. as the satellite bus manufacturer
and ELBIT-Electro Optics Industries as builder
of the imaging system. Like the U.S. compa-
nies, ImageSat has seen recent growth in
commercial customer revenue, though their
customer base is still based on a few large
government customers.
ImageSat currently operates two satellites,
EROS A and EROS B. The EROS A and EROS
B spacecraft were both placed into orbit by
START 1 vehicles. EROS A was launched from
Svobodny, Russia in December 2000, and is
expected to operate until 2012 or later. In April
2006, the second ImageSat satellite, EROS B, a
very-high-resolution satellite with panchromatic
resolution of 0.7 meters, was launched from
Svobodny. EROS B, like its predecessor, offers
flexible imaging capabilities at various angles,
azimuth, and lighting conditions; the satellite is
projected to operate until 2018 or longer.
ImageSat plans to develop and launch a third
satellite, EROS C, though the company has not
finalized mission requirements for this satellite.
EROS C is projected to launch around 2011 or
2012 as a replacement for EROS A.
INFOTERRA GROUP
Infoterra GmbH is a part of the Infoterra Group
and is a subsidiary of EADS Astrium GmbH.
Through a public-private partnership with the
German Aerospace Center (DLR), Infoterra
provides radar imagery from the TerraSAR-X
satellite. Infoterra is involved with commercial
imagery, while DLR is responsible for science
missions using the satellite. Additional satellites
from this German partnership are planned to
accompany TerraSAR-X on orbit in the upcom-
ing years, adding to their imagery and data
capability. Infoterra’s customer profile fits the
industry trend of a slight majority core of defense
and security customers with other public and
private customer demand showing growth.
TerraSAR-X is the first of a pair of X-band
synthetic aperture radar satellites that will be
launched and operated for Infoterra commercial
use. The operational satellite, built by EADS
Astrium with a projected operational lifetime of
five or more years, was launched on June 15,
2007 by a Russian Dnepr vehicle. The second
satellite of the pair is TanDEM-X, which will
fly in close formation with TerraSAR-X. Adding
this second satellite will allow Infoterra to
create high-resolution digital elevation models.
The satellite is currently under development at
EADS Astrium and will also have a five-year
or longer expected lifetime. The satellite is
scheduled to launch on a Dnepr in 2009.
Two future satellite missions are under
consideration to continue Infoterra’s mission.
TerraSAR-X2 would be the successor to
TerraSAR-X around the time of its expected end
of life in approximately 2012. The funding for
this satellite is currently planned to come solely
from monies earned through Infoterra’s
commercial activity, rather than from a public-
private partnership like the first two satellites.
There is also a proposal for an L-band radar
satellite, TerraSAR-L, but a decision to proceed
with this mission is pending and details
regarding its implementation are not finalized.
MACDONALD, DETTWILER AND ASSOCIATES
MacDonald, Dettwiler and Associates Ltd.
(MDA) is a commercial provider of radar
satellite remote sensing data coming from the
Canadian RADARSAT series of satellites. The
company distributes data from two operational
satellites, RADARSAT-1 and RADARSAT-2.
RADARSAT-1 was a Canadian Space Agency
government-led program, while RADARSAT-2
is owned and operated by MDA under a public
private partnership with the Government of
Canada.
Alliant Techsystems (ATK), based in the United
States, announced on January 8, 2008 that it
planned to acquire the MDA Information
38
Federal Aviation Administration and the Commercial Space Transportation Advisory Committee (COMSTAC)

Systems and Geospatial Information Services
business units, which would include the
RADARSAT activities. This acquisition has
since been blocked by the Canadian govern-
ment, keeping the company and its activities at
the status quo. If allowed to proceed, however,
this acquisition would likely have an effect on
future RADARSAT plans.
The first RADARSAT satellite was launched in
November 1995 aboard a Delta II, while the
second was launched on December 14, 2007
using a Starsem Soyuz vehicle from the
Baikonur Cosmodrome. RADARSAT-1 pro-
vides data with resolutions between 8 and 100
meters (26 and 328 feet) and has a repeat cycle
of 24 days. RADARSAT-2 includes improve-
ments that allow for greater imaging flexibility,
dual polarization and full polarimetric imaging
options, and 3-meter (10-foot) resolution.
To provide continuation of the radar data
missions, the Government of Canada and the
Canadian Space Agency have proposed a
three-satellite RADARSAT Constellation as a
follow-on to RADARSAT-2. There has been
C$200 million (US$198 million) committed for
the first phase of the constellation program. The
RADARSAT Constellation Mission will serve
surveillance and monitoring purposes. These
satellites, projected to weigh approximately
1,200 kilograms (2,600 pounds) each, are cur-
rently planned for launch between 2014 and
2017.
RAPIDEYE AG
RapidEye, a German company providing
satellite-based geo-information services, has
developed a five-satellite remote sensing con-
stellation designed to provide data for customers
interested in agricultural and cartographic
applications, among other possible markets.
RapidEye expects their revenues to come from
both commercial and government clients within
these markets.
In May 2004 a supply agreement was signed for
MDA to provide a satellite constellation, launch
arrangements, and ground infrastructure for the
RapidEye system. SSTL built the satellite
platforms and the German company Jena-
Optronik GmbH provided the optical payload.
The launch of the five RapidEye satellites is
planned for mid-2008 on a Dnepr vehicle. Each
RapidEye satellite will be placed into the same
orbital plane, and will be supported by an S-
band command center and an X-band downlink
ground component. The satellites, each provid-
ing resolution of up to 6.5 meters (21 feet), have
an expected operational lifetime of seven years.
RapidEye currently intends to maintain a satel-
lite system beyond the lifetime of these five
first-generation satellites, but detailed planning
for a next generation has yet to be determined.
MARKET DEMAND
FAA/AST projects that the commercial satellite
remote sensing sector will yield about 24 pay-
loads throughout the forecast period, with a
peak of 7 in 2015 due to the projected launch of
future generation satellites for system continu-
ity. The commercial remote sensing satellites
will be deployed on 16 launches, including 14
on medium-to-heavy vehicles.
NGSO TELECOMMUNICATIONS SYSTEMS
The NGSO telecommunications satellite market
is based on large constellations of small-to-
medium-sized satellites that provide worldwide
or near-worldwide communications coverage.
The constellations fall into two categories, Little
LEO and Big LEO, derived from the frequencies
that satellites use: Little LEO systems operate at
frequencies below 1 GHz and Big LEO systems
use frequencies in the range of 1.6–2.5 GHz.
Little LEO systems provide narrowband data
communications such as e-mail, two-way paging,
and simple messaging for automated meter read-
ing, vehicle fleet tracking, and other remote data
monitoring applications. Big LEO systems pro-
vide mobile voice telephony and data services.
There is one Little LEO system, ORBCOMM,
and two Big LEO systems, Globalstar and
Iridium, currently on-orbit and operational. All
three of these systems are in the planning or
development stage of their new generation of
39
2008 NGSO Commercial Space Transportation Forecast

satellites. A second Little LEO system,
AprizeStar, also has a small number of satellites
in orbit. Little LEO systems are summarized in
Table 14 and Big LEO systems in Table 15.
Other telecommunications systems have been
proposed in the past, including Broadband LEO
systems that would provide high-speed data serv-
ices at Ka- and Ku-band frequencies. There are
proposals to develop similar systems, using a mix
of NGSO and GSO satellites, but these have not
advanced beyond the planning stages. Other
smaller systems have been developed, but have
not played a significant role in the market.
Details about the three major operational constel-
lations, and other NGSO telecommunications
operations, are provided below.
GLOBALSTAR
Globalstar, Inc. is a publicly-traded Big LEO
system operator primarily serving the global
satellite voice and data markets. Their full serv-
ice offering began in the first quarter of 2000. In
February 2002 the company filed for Chapter 11
bankruptcy. The company emerged from bank-
ruptcy in 2004 when its assets were acquired by
affiliates of Thermo Capital Partners. It subse-
quently conducted an IPO in November 2006,
and is currently designing and constructing 48
replacement satellites for its on-orbit satellite
constellation that is degrading as it ages.
For Globalstar’s first-generation satellite con-
stellation, a total of 52 satellites—48 operational
satellites plus four on-orbit spares—were placed
into orbit using Boeing Delta II boosters and
Starsem Soyuz boosters between February 1998
and February 2000. The company suffered one
launch failure of 12 satellites on a Zenit 2 in
September 1998. The company announced in
February 2007 that these operational satellites
are continuing to experience S-band amplifier
problems, a problem that started to a lesser
extent in 2001. The amplifier degradation
affected the company’s voice and two-way data
services. The simplex one-way L-band data
services provided by the satellites are not
affected by these problems.
Globalstar reported decreased revenues in 2007
largely as a result of its reduced voice service
quality. The company reported $98.4 million in
revenue in 2007, compared to $136.7 million in
2006. Service revenue fell by 13 percent while
subscriber equipment sales dropped over 50 per-
cent. The company reported a net loss of $27.9
million in 2007, compared to net income of
$23.6 million in 2006. Globalstar reported hav-
ing approximately 284,000 subscribers (defined
by the number of devices under agreement for
Globalstar services) at the end of 2007, a mod-
est increase over the 262,802 reported at the end
of 2006.
40
Federal Aviation Administration and the Commercial Space Transportation Advisory Committee (COMSTAC)
Table 14. Little LEO Systems

As a mitigation measure against the S-band
problems and to begin the process of updating
its on-orbit constellation, Globalstar launched its
final eight first-generation replacement satellites
on two Soyuz vehicles in May and October
2007. These eight satellites are expected to form
part of the replacement constellation. In addition
to these two launches, the company plans to
launch a second-generation system beginning
in late 2009. In September 2007, Globalstar
announced a contract with Arianespace for four
Soyuz launches of six satellites each, with an
option for four additional launches. The compa-
ny expects to use the four launches during 2009
and 2012 to launch 24 of the satellites. The
satellites are currently being constructed by
Thales Alenia Space. Together with the eight
replacement satellites launched in 2007,
Globalstar will create a 32-satellite system as
the initial deployment of its new constellation.
In addition to the FCC licenses granted for its
satellite constellation, Globalstar has FAA
acuthority to provide ancillary terrestrial com-
ponent (ATC) service. The company was
originally granted permission to use 11 MHz for
an ATC system. In April 2008, the FCC granted
it permission to use additional spectrum, 19.275
MHz in total, for ATC. Globalstar signed an
agreement in late 2007 with Open Range
Communications, permitting that company to
use Globalstar’s ATC spectrum to provide ter-
restrial WiMAX service, a technology to
provide wireless data over long distances, in
rural communities. Open Range Communications
has yet to deploy that system, and has recently
received a $267 million loan from the
Department of Agriculture’s Rural Utilities
program. Globalstar said it plans to enter
discussions with other companies that could
use the ATC spectrum.
IRIDIUM
Iridium Satellite LLC, a privately-held compa-
ny, is the successor to the original Iridium
Corporation that built and launched the 66-
spacecraft Iridium satellite constellation in the
late 1990s. Iridium Satellite purchased the assets
of Iridium, including the satellite constellation,
for approximately $25 million in December
2000 and restarted Big LEO commercial com-
munications services using the satellite system a
few months later. In addition to the 66 opera-
tional spacecraft, there are nine functioning
spare satellites in orbit as of March 2008.
Iridium is now taking the first steps to develop
and launch a second-generation satellite
constellation, named Iridium NEXT.
A total of 95 Iridium satellites have been
launched as a part of the first-generation system,
including seven spare satellites launched in
2002: five on a Delta II and two on a Rockot.
These satellites comprise a fully-operational
system that is expected to provide service until
at least 2014. The company has no spare satel-
lites remaining on the ground and has no plans
to build any until it deploys Iridium NEXT.
41
2008 NGSO Commercial Space Transportation Forecast
Table 15. Big LEO Systems

Iridium has begun the process to implement its
next-generation constellation. In March 2008,
Iridium announced it had selected three compa-
nies as finalists for the contract to develop the
Iridium NEXT satellites: Lockheed Martin,
Space Systems/Loral, and Thales Alenia Space.
The three companies will perform design studies
for five months, after which Iridium will select
two to proceed into the system development
phase. Iridium will select a prime contractor by
April 2009. Iridium is considering hosted pay-
load options for its next-generation satellites in
addition to the primary communications payload.
Iridium has made no formal plans for the launch
of Iridium NEXT. The company’s current
notional launch plans call for launching 72
satellites on approximately 12 launches of 6
spacecraft each. Those launches would be
spread over a three-year period, which could
begin as soon as 2012. Iridium is considering a
number of launch vehicle options.
As Iridium begins its Iridium NEXT plans, the
company is experiencing continued growth of
its current business. Iridium reported an EBIT-
DA (earnings before interest, taxes, depreciation,
and amortization) of $73.6 million in 2007, com-
pared to $53.8 million in 2006. The company
also reported increased revenues, totaling $260.4
million in 2007 versus $212.4 million in 2006.
The company had 234,000 subscribers (defined
as customers, not active devices) at the end of
2007, an increase of 59,000 from the end of
2006. The number of subscribers increased 37
percent from the end of the first quarter of 2007
to the end of the first quarter of 2008.
ORBCOMM
Between 1995 and 1999, ORBCOMM deployed
a Little LEO constellation of 35 satellites, 29 of
which are operational as of April 2008. It is the
only company to have fully deployed a dedicat-
ed commercial system that provides low-
bandwidth packet data services worldwide.
ORBCOMM plans to launch a new generation
of satellites early next decade, as well as six
satellites in 2008, to continue their telecommu-
nications services.
As plans are set for new satellite development,
ORBCOMM reported improved financial
statistics in 2007. A publicly-traded company,
ORBCOMM earned revenues of $28 million in
2007, up 15 percent from $24.5 million in 2006.
A strong increase in service revenues offset a
decline in product sales. The company also
recorded $1.5 million in 2007 from the sale of
gateway earth station assets. For year end 2007,
the company reported a net loss of $3.6 million,
compared to a loss of $11.2 million for 2006.
ORBCOMM intends to launch six satellites on a
Cosmos 3M in June 2008, as part of its plan to
replenish its current 29-satellite constellation
with 24 satellites. Five of the six satellites to
be launched in June 2008 are the company’s
“QuickLaunch” spacecraft, originally scheduled
to be launched in 2007 but delayed due to
“electromagnetic compatibility testing” problems.
The sixth satellite to be launched is a U.S. Coast
Guard demonstration satellite with an Automatic
Identification System (AIS) payload.
The remaining 18 new satellites will be
“Generation 2” satellites. ORBCOMM chose
MicroSat Systems to be the prime contractor for
these 18 spacecraft in May 2008. The projected
plans are to launch these satellites in 2010 and
2011, most likely with three launches of six
spacecraft each. Generation 2 will likely create
demand for small launch vehicles, as did the
first generation and QuickLaunch missions. The
new ORBCOMM constellation will operate in
four orbital planes, each in 750-kilometer
circular orbits at an inclination of 48.5°. ORB-
COMM received FCC authorization for these
new satellite and launch plans in March 2008.
OTHER SYSTEMS
A number of additional NGSO satellite telecom-
munications systems have been proposed, but
have not been major drivers of launch demand.
These systems run the gamut of Big LEO, Little
LEO, and Broadband LEO satellites. Some
potential providers of satellite telecommunica-
tions services struggled to gain necessary
funding or failed to follow through on their
business plans. Others have had slow deployment
42
Federal Aviation Administration and the Commercial Space Transportation Advisory Committee (COMSTAC)

timelines or have delayed satellite plans.
Some Little LEO satellite systems are so small
that they do not necessarily generate launch
demand. Aprize Satellite, Inc. is deploying one
such system. A total of four AprizeStar (also
known by its ITU registration as LatinSat) satel-
lites weighing 10 kilograms (22 pounds) were
launched as secondary payloads on a Russian
Dnepr rocket; two in 2002 and two in June
2004. Two AprizeStar satellites will be launched
as secondary payloads on a Dnepr vehicle in
late 2008. In addition, two more Aprize micro-
satellites are prospectively planned to be
launched next year. A constellation with 48
satellites is planned by Aprize, depending on
funding opportunities and customer demand for
additional data-communication capacity and
frequency of contact. Aprize received an experi-
mental license from the FCC in 2004 for the
two satellites launched that year. The systems
also received licenses from the Argentine
National Communications Commission (CNC)
in 1995 and Industry Canada in 2003.
ICO Global Communications—a name derived
from the acronym for intermediate circular
orbit—had planned to deploy a Big LEO system
of ten operational satellites plus two on-orbit
spares located in MEO at an altitude of 10,390
kilometers (6,450 miles). ICO did begin NGSO
launches, but did not complete the deployment
of its planned system. One ICO satellite was
lost in a launch failure in March 2000. A second
satellite was successfully launched in June
2001. ICO then changed its satellite plans to a
GSO system. In January 2005, ICO filed an
application with the FCC seeking approval to
modify its non-geosynchronous satellite service
authorization to substitute a geosynchronous
satellite system to access the United States mar-
ket. The FCC approved this application in May
2005. The ICO G1 satellite, built by Space
Systems/Loral, successfully launched to GSO
on April 14, 2008. In May 2007, ICO stated
intentions to pursue a European operating
license and hoped to still launch its ten NGSO
satellites that remain in storage, four of which
are in various stages of assembly.
Two companies have made initial plans to
develop broadband satellite systems using a
combination of GSO and NGSO satellites.
@Contact and Northrop Grumman have filed
applications with the FCC for hybrid
GSO/NGSO systems. Each company is planning
to incorporate four GSO satellites plus three
HEO satellites in their system. @Contact
received a license from the FCC for its Ka-band
system in April 2006; the license includes mile-
stones that require the company to have its
entire system certified as operational by April
2012. No launch contract for its system has
been announced, however, the company entered
into a non-contingent satellite manufacturing
contract with Space Systems/Loral in April
2007 and filed a confirmation with the FCC that
it completed a critical design review of the sys-
tem in April 2008. Northrop Grumman updated
the FCC application for its Global EHF Satellite
Network, meant to operate at Ka- and V-band
frequencies, as recently as February 2007, but
no other visible activity has been undertaken to
advance the development of the system.
MARKET DEMAND
FAA/AST projects that 28 Little LEO satellites
will be launched during the coming decade and
generate a demand for four launches of small
vehicles. FAA/AST projects that 120 Big LEO
satellites will be launched during the coming
decade to cover the replenishment of two existing
systems. These payloads will be deployed on 20
launches of medium-to-heavy vehicles.
ORBITAL FACILITY ASSEMBLY AND SERVICES
A new market has emerged for the commercial
launch of cargo and people to orbital facilities.
This market includes the International Space
Station (ISS) and orbital habitats under
development by Bigelow Aerospace. These
commercially-provided launch services will carry
supplies and eventually people to and from orbit.
They will meet the needs of ISS as well as the
emerging orbital space tourism market and
possibly other exploration or science purposes
such as microgravity experiments. Some
vehicles will have pressurized and unpressurized
43
2008 NGSO Commercial Space Transportation Forecast

cargo accomodations.
NASA is accepting bids for regular U.S. com-
mercial cargo supply missions to support the
ISS during the transition from the Space Shuttle
to the Constellation vehicles. NASA’s
Commercial Orbital Transportation Services
(COTS) program has sparked the necessary
technology development for these missions.
This OFAS market category is new to the fore-
cast, although orbital facility launches have
historical precedence within the “other” market
category, which previously included launches of
Bigelow’s Genesis habitat technology demon-
stration spacecraft.
BIGELOW AEROSPACE ORBITAL HABITATS
The first commercial orbital facilities are under
development by Bigelow Aerospace. Bigelow’s
goal is to create crewed orbital facilities based
on expandable habitats. Two initial demonstra-
tion spacecraft, Genesis I and Genesis II, were
commercially launched by Dnepr rockets in
2006 and 2007, respectively. These spacecraft
are successfully testing and validating systems
critical for future Bigelow expandable habitats.
Bigelow Aerospace is currently constructing its
first habitable spacecraft, the Sundancer.
Sundancer will offer 175 cubic meters of habit-
able volume and be able to support up to three
people. The Sundancer’s ultimate launch date
will be determined by the availability of the
necessary transportation systems to support the
transfer of crew and cargo. Shortly after
Sundancer, Bigelow plans to launch a node and
bus system that will be combined with
Sundancer to add operational functionality as
part of the first orbital complex. Bigelow then
anticipates launching two of the larger full stan-
dard modules, which will each provide roughly
300 cubic meters of habitable volume, to join
with Sundancer and the node/bus to complete its
first orbital complex.
Bigelow business plans include selling four-week
trips to its modules to astronauts from various
national space agencies. The company will also
offer full module lease opportunities. A critical
consideration for Bigelow’s plans is the avail-
ability of affordable commercial transportation to
carry people and cargo to and from its orbital
facilities. Once in orbit, the habitats will require a
regular supply of both crew and cargo. The
development of a new private sector crew cap-
sule to affordably, reliably, and safely transfer
Bigelow personnel and customers to and from its
orbital complexes is needed. Because of the
transportation uncertainty, at this time, the
forecast does not include launch demand for
Bigelow Aerospace.
NASA COTS
The COTS program at NASA is supporting the
development of orbital cargo transportation
capabilities within U.S. commercial industry.
COTS includes two funded Space Act
Agreements with SpaceX and Orbital Sciences,
totaling approximately $500 million, as well as
several unfunded Space Act Agreements with
other companies. COTS is intended to promote
systems that could provide cargo resupply to the
ISS. There is an option for developing a COTS
crew capability as well, but this option has not
yet been exercised.
The funded Agreements require four FAA/AST-
licensed demonstration launches during the next
few years, three by SpaceX and one by Orbital
Sciences. Both companies are developing new
launch and orbital vehicles for COTS and must
provide private financing in addition to the
COTS funding. The SpaceX system uses the
company’s Falcon 9 launch vehicle and Dragon
spacecraft. Their first two demonstration flights
are planned for 2009, with the third flight in
2010. The Orbital Sciences system combines the
Taurus II launch vehicle and the Cygnus space-
craft. One COTS demonstration launch is
planned for Orbital Sciences, in late 2010.
44
Federal Aviation Administration and the Commercial Space Transportation Advisory Committee (COMSTAC)

COMMERCIAL ISS RESUPPLY
Building on the projected success of the COTS
program and other U.S. commercial space tech-
nology, NASA is beginning the process to
acquire commercial cargo transportation servic-
es to resupply the ISS. These launches will be
licensed by the FAA. Between the time when
the Space Shuttle is retired and the new
Constellation transportation systems are opera-
tional, the United States will face a shortfall in
transportation capability to the ISS. Procuring
U.S. commercial services is part of the solution
for filling this transportation demand gap, which
also includes the use of foreign orbital vehicles.
NASA will depend on the cargo capability of
the European ATV and Japanese HTV and rely
on pre-positioned spares, delivered by the
Shuttle before its retirement in 2010, until U.S.
commercial cargo vehicles are operational.
NASA released a Request for Information in
August 2007 and held a pre-proposal conference
in March 2008 regarding the provision of these
services. The agency has issued a final Request
for Proposals (RFP) with a contract award date
in late 2008. The projected NASA demand for
commercial transportation services is spelled
out in this RFP, with requirements for internal
and external upmass, return downmass, and dis-
posal downmass listed for calendar years 2010
to 2015.1 Forecasted launch demand is projected
to primarily fall within the 2011 to 2015 time-
frame for commercial ISS resupply, though the
number of launches per year remains uncertain.
The ISS is a continuing market for cargo supply,
though. Demand for commercial service could
possibly continue after 2015, the last year under
the RFP, depending on decisions regarding
continued operations on the ISS and NASA
transportation choices.
MARKET DEMAND
FAA/AST projects that 28 orbital facility assem-
bly and service missions will launch during the
ten-year forecast period. Each of these missions
will require a medium-to-heavy launch vehicle,
thus creating a demand for 28 launches in this
vehicle category. This demand could increase if
new commercial transportation services capable
of carrying people become availalable for use
by Bigelow Aerospace.
Future Markets
Demand for commercial launches to NGSO
could be affected by new emerging markets and
even by a series of prize competitions. The
launch demand possibilities of future markets
are evidenced by this year’s inclusion of the
OFAS market category in the forecast model.
The orbital public space travel market could
potentially grow into a fruitful NGSO launch
market. Connected to OFAS missions, private
space travel would include paying customer
missions to orbit either solely onboard a vehicle
or on a trip to an orbital facility. A number of
companies are developing suborbital vehicles to
be used for public space travel—these are not
considered in the forecast since they are not
orbital missions—and other companies have
proposed new commercial orbital vehicles.
Though the suborbital industry is forming, the
orbital industry has yet to concretely come
together. There have been a number of individ-
ual space tourist missions onboard Russian
Soyuz ISS missions, but because of the
government nature of these missions, they do
not constitute the beginnings of a market when
considering commercial launch demand.
Prize competitions are also driving possible new
commercial launch demand. The Google Lunar
X PRIZE, announced in September 2007, is an
international competition to promote the private
exploration of the Moon, with a total available
prize purse of $30 million. The contest rules
require private launch arrangements with incen-
tives for landing on the surface with a robotic
45
2008 NGSO Commercial Space Transportation Forecast
1 Up-to-date information can be found on NASA’s ISS Commercial Resupply Services webpage:
http://procurement.jsc.nasa.gov/issresupply/default.asp

rover by 2012. It is too early to include a pro-
jection of launch demand in the forecast for this
prize. Bigelow Aerospace is also offering a
prize competition, America’s Space Prize, to
promote orbital transfer vehicle development for
the future servicing of its habitats. Successful
flight of a docking and return vehicle must be
repeated within 60 days to win the $50 million
prize. The prize offer expires in January 2010.
NASA’s “Centennial Challenges” prize competi-
tion program, within the Innovative Partnerships
Program, may include future Challenges for
spacecraft missions, including breakthrough
technology demonstration missions and mis-
sions to the Moon and other destinations that
could stimulate demand for low-cost, emergent
launch capabilities. A provision of the National
Aeronautics and Space Administration
Authorization Act of 2005 allows NASA to
award multimillion-dollar prizes, although
awards in excess of $10 million require
Congressional notification. The largest competi-
tion to date, the Northrop Grumman Lunar
Lander Challenge, features $2 million in prizes
for vehicles that can simulate the liftoff and
landing of a lunar spacecraft; the same technol-
ogy could be used for the development of future
commercial suborbital and orbital spacecraft.
No prize money was awarded for the competi-
tion in 2006 or 2007, but the competition will
be held again in 2008.
Risk Factors That Affect Satelliteand Launch Demand
Several factors could negatively or positively
impact the NGSO forecast:
• U.S. national and global economy—Strong
overall economic conditions have historical-
ly fostered growth and expansion in satellite
markets. Similarly, relatively weaker curren-
cy exchange rates in one nation generally
create favorable circumstances for exporters
and buyers in a given marketplace. Global
satellite manufacturers and purchasers have
shown strong interest in taking advantage of
the highly attractive values offered by the
historically low U.S. dollar exchange rates.
However, it is difficult to project if this trend
will be sustained given the very mixed pic-
ture created by the overall economic data.
The troubled credit markets have eroded
investor confidence broadly and soaring
prices for basic necessities such as food and
fuel typically foreshadow significant con-
tractions of all consumer based markets
particularly in the short term.
• Investor confidence—After investors suf-
fered large losses from the bankruptcies of
high-profile NGSO systems, confidence in
future and follow-on NGSO telecommunica-
tions systems plummeted. There are signs of
renewed investor confidence in this market,
but skepticism remains about broadband
NGSO systems, especially because of high
entry costs. Investors may be waiting for
examples of success in the GSO broadband
market.
• Increase in government purchases of com-
mercial services—For a variety of reasons,
government entities have been purchasing
more space-related services from commer-
cial companies. For example, the DoD has
purchased significant remote sensing data
from commercial providers, funded the
continuation of Iridium service as a major
customer, and has made extensive use of
Iridium in Afghanistan and Iraq. NGSO
systems such as Globalstar and Iridium were
used extensively by government agencies
during hurricane relief operations on the
Gulf Coast in 2005.
• Satellite lifespan—Many satellites outlast
their planned design life. The designated
launch years in this forecast for replacement
satellites are often estimates for when a new
satellite would be needed. Lifespan estimates
are critical for the timing of replacements of
existing NGSO satellite systems, given the
high capital investment required for deploy-
ing a replacement system.
46
Federal Aviation Administration and the Commercial Space Transportation Advisory Committee (COMSTAC)

• Need for replacement satellites—Although
a satellite might have a long lifespan, it
could be replaced early because it is no
longer cost effective to maintain, or an
opportunity could arise that would allow a
satellite owner/operator to leap ahead of
the competition with a technological
advancement. An example of this factor
is higher-resolution commercial remote
sensing satellites.
• Business case changes—The satellite own-
er/operator can experience budget shortfalls,
change strategies, or request technology
upgrades late in the manufacturing stage, all
of which can contribute to schedule delay.
There could also be an infusion of cash from
new investors that could revive a stalled
system or accelerate schedules.
• Corporate mergers—The merging of two
or more companies may make it less likely
for each to continue previous plans and can
reduce the number of competing satellites
that launch. Conversely, mergers can have a
positive impact by pooling the resources of
two weaker firms to enable launches that
would not have otherwise occurred.
• Regulatory and political changes—
Changes in FCC or NOAA processes, export
control issues associated with space technol-
ogy, and political relations between countries
can all affect demand. The FCC adopted a
new licensing process in 2003 to speed up
reviews that put pressure on companies that
are not making progress towards launching
satellites.
• Terrestrial competition—Satellite services
can complement or compete with ground-
based technology such as cellular telephones
or communications delivered through fiber
optic or cable television lines. Aerial remote
sensing also competes with satellite imagery.
Developers of new space systems have to
plan ahead extensively for design, construc-
tion, and testing of space technologies, while
developers of terrestrial technologies can
react and build to market trends more quick-
ly and possibly convince investors of a faster
return on investment.
• Launch failure—A launch vehicle failure
can delay plans, delay other satellites await-
ing a ride on the same vehicle, or cause a
shift to other vehicles and, thus, possibly
impact their schedules. Failures, however,
have not caused customers to terminate
plans. The entire industry is affected by
failures, however, because insurers raise
rates on all launch providers.
• Satellite manufacturing delay—Increased
emphasis on quality control at large satellite
manufacturing firms seen in the past few
years can delay delivery of completed satel-
lites to launch sites. Schedule delays could
impact timelines for future demand.
• Failure of orbiting satellites—From the
launch services perspective, failure of orbit-
ing satellites could mean ground spares are
launched or new satellites are ordered. This
would only amount to a small effect on the
market, however. A total system failure has
not happened to any NGSO constellation,
although Globalstar is experiencing difficul-
ties with its existing satellites.
• Increase in government missions open to
launch services competition—Some
governments keep launch services contracts
within their borders to support domestic
launch industries. The European Space
Agency has held international launch
competitions for some of its small science
missions. Some remote sensing satellite
launches are also competed. While estab-
lished space-faring nations are reluctant to
open up to international competition, the
number of nations with new satellite
programs but without space launch access
is slowly increasing.
• Introduction of a low price launch
vehicle—Although relatively inexpensive
launches are available on Russian launch
47
2008 NGSO Commercial Space Transportation Forecast

vehicles and emerging U.S. vehicles, low
prices have not increased demand for the
past several years for either large or small
satellites. In addition to market factors
already discussed, all the other costs to do
business in space are expensive, from satel-
lite design and construction to insurance to
ground systems and continued operations.
However, to open an entirely new market in
NGSO, such as for public space travel, an
expendable or reusable vehicle offering low
launch prices would likely increase demand,
according to the 2003 NASA ASCENT StudyFinal Report.
• New markets—The emergence of new mar-
kets, such as orbital public space travel, can
be difficult to forecast with certainty. The
development of these markets can be
delayed or accelerated by a combination of
technical, financial, and regulatory issues.
The NASA COTS program is an example of
government promotion of a new commercial
market. Prize competitions can also stimu-
late the development of new markets,
allowing both winning and losing competi-
tors to pursue a return on the investment
made to capture a prize. A successful
competition can inspire other competitions.
Methodology
This report is based on FAA/AST research and
discussions with industry, including satellite
service providers, satellite manufacturers, launch
service providers, system operators, government
offices, and independent analysts. The FCC was
also interviewed for this report. The forecast con-
siders progress for publicly-announced satellites,
including financing, regulatory developments,
spacecraft manufacturing and launch services
48
Federal Aviation Administration and the Commercial Space Transportation Advisory Committee (COMSTAC)
Table 16. Near-Term Identified NGSO Satellite Manifest
* Carryover from 2007
Note: Chart includes only those payloads announced as of May 2, 2008
Does not include secondary payloads that do not generate launch demand

contracts, investor confidence, competition from
space and terrestrial sectors, and overall econom-
ic conditions. Future deployments of satellites
that have not yet been announced are projected
based on market trends, the status of existing
satellites, and the economic conditions of
potential satellite developers.
Traditionally, very small satellites—those with
masses of less than 100 kilograms (220
pounds)—ride as secondary payloads and thus do
not generate “demand” for a single launch in this
forecast. However, the launch providers for the
Russian/Ukrainian Dnepr and Russian Cosmos
are flexible enough to fly several small satellites
together without a single large primary payload.
Therefore, these missions can act as a driver of
demand in this report. Satellites below 10 kilo-
grams (22 pounds) in mass are excluded from the
forecast model because they do not create
demand for a single launch, and therefore, have
negligible effect on global launch demand.
Follow-on systems and replacement satellites
for existing systems are evaluated on a case-by-
case basis. In some cases, expected future
activity is beyond the timeframe of the forecast
or is not known with enough certainty to merit
inclusion in the forecast model. Satellite sys-
tems considered likely to be launched are
entered into an Excel-based “traffic model.” The
model tracks satellites and launches in this fore-
cast based on the research discussed above,
known replacement cycles, and other industry
trends for existing and planned telecommunica-
tions and remote sensing systems. For the
international science and other miscellaneous
markets, near-term primary payloads that gener-
ated individual commercial launches were used
in the model while future years were estimated
based on historical activity.
In past years, the number of launches that have
taken place has often been substantially less
than the number in that year’s forecast. This
mismatch is due to a number of factors, includ-
ing funding, satellite manufacturing, and launch
vehicle delays, that cause the launch to be post-
poned to the following year. Historically only a
small number of primary satellites scheduled for
launch have been delayed indefinitely or can-
celed. The forecast includes a “realization
factor” that provides an estimate of the number
of launches that will take place in 2008, based
on historical trends in past forecasts and an
assessment of current activity.
International launch providers were surveyed
for the latest available near-term manifests.
Table 16 shows the announced near-term mani-
fests for the markets analyzed in this report, as
well as the realization factor for launches in the
near-term manifest for 2008.
Vehicle Sizes and Orbits
Small launch vehicles are defined as those with
a payload capacity of less than 2,268 kilograms
(5,000 pounds) to LEO, at 185 kilometers (100
nautical miles) altitude and 28.5° inclination.
Medium-to-heavy launch vehicles are capable
of carrying more than 2,268 kilograms at 185
kilometers altitude and 28.5° inclination.
Commercial NGSO systems use a variety of
orbits, including the following:
• Low Earth orbits (LEO) range from 160-
2,400 kilometers (100–1,500 miles) in
altitude, varying between 0° inclination for
equatorial coverage and 101° inclination for
global coverage;
• Medium Earth orbits (MEO) begin at 2,400
kilometers (1,500 miles) in altitude and are
typically at a 45° inclination to allow for
global coverage using fewer higher-powered
satellites. However, MEO is often a term
applied to any orbit between LEO and GSO;
• Elliptical orbits (ELI, also known as highly-
elliptical orbits, or HEO) have apogees
ranging from 7,600 kilometers (4,725 miles)
to 35,497 kilometers (22,000 miles) in alti-
tude and up to 116.5° inclination, allowing
49
2008 NGSO Commercial Space Transportation Forecast

satellites to “hang” over certain regions on
Earth, such as North America; and
• External or non-geocentric orbits (EXT) are
centered on a celestial body other than the
Earth. They differ from highly-elliptical
orbits (ELI) in that they are not closed loops
around Earth and a spacecraft in EXT will
not return to an Earth orbit. In some cases,
this term is used for payloads intended to
reach another celestial body (e.g., the Moon)
even though part of the journey is spent in a
free-return orbit that would result in an Earth
return if not altered at the appropriate time to
reach its destination orbit.
Satellite and Launch Forecast
In this forecast, 276 satellites are seeking future
commercial launch, creating demand for 112
launches after multi-manifesting. These num-
bers are significantly greater than those in the
2007 forecast, which predicted 191 satellites to
be launched on 81 vehicles in the 2007–2016
timeframe. This increase is the most significant
overall forecast change experienced in the past
few years. The inclusion of an additional full
Big LEO replacement constellation and the
addition of several OFAS missions are the
primary causes of the increase in satellites and
launches from last year’s forecast. Table 17 and
Figures 12 and 13 show the satellites and
launches forecasted between 2008 and 2017.
50
Federal Aviation Administration and the Commercial Space Transportation Advisory Committee (COMSTAC)
Figure 12. Satellite Forecast
Table 17. Satellite and Launch Demand Forecast

The forecast anticipates the following satellite
market characteristics from 2008–2017:
• Telecommunications satellites account for
about 53 percent of the market with 148
satellites, an increase from the 81 satellites
in last year’s forecast because of new plans
regarding the deployment of next-generation
Big LEO and Little LEO systems.
• International science and other satellites (such
as military spacecraft and technology demon-
strations) will comprise about 28 percent of
the NGSO satellite market with 76 satellites, a
significant drop from the 48 percent share
from 91 satellites in the 2007 forecast.
• Orbital facility assembly and service satel-
lites account for 10 percent of the 2008
forecast with 28 spacecraft. This is a new
market category that has not been counted
in previous forecasts.
• Commercial remote sensing satellites
encompass 9 percent of the 2008 forecast
with 24 satellites, a slight increase in number
of satellites from the 2007 forecast because
of one future system replacement plan.
Table 18 shows the mass distributions of known
manifested satellites over the next four years.
Large spacecraft, those with a mass higher than
600 kilograms (1,324 pounds), make up 55 per-
cent of those manifested from 2008 to 2011. This
trend has increased from 49 percent in the 2007
forecast and 31 percent in the 2006 forecast.
The launch forecast of 112 launches is
composed of 31 small vehicle and 81 medium-
to-heavy vehicle launches. This demand breaks
down to an average of just over three launches
annually on small launch vehicles and about
eight launches annually on medium-to-heavy
launch vehicles. The total number of launches is
38 percent greater than the 2007 forecast, with
51
2008 NGSO Commercial Space Transportation Forecast
Figure 13. Launch Demand Forecast
Table 18. Distribution of Satellite Masses in Near-Term Manifest

the increase solely in launches of medium-to-
heavy vehicles. This increase is primarily
attributable to higher demand in the Big LEO
and OFAS market categories in 2008. The
amount of small vehicles decreased by one
launch between the 2007 and 2008 forecasts.
The forecast starts with a total of 24 satellites
demanding 11 launches in 2008. Because of
launch vehicle and satellite schedule delays, as
described in the Methodology section, a realiza-
tion factor was applied to the number of
launches planned for 2008. Therefore, the FAA
expects 8 to 10 launches to occur in 2008. The
highest amount of forecasted launch demand
falls in 2014 and 2015, with 15 and 14 launch-
es, respectively. The forecast shows steady
launch demand around 11 to 12 launches per
year between 2008 and 2012, but then experi-
ences an increase in demand and some overall
demand fluctuation until the end of the forecast
in 2017.
Though the telecommunications market, led by
Big LEO systems, dominates the forecasted
satellite market, the international science plus
other and the OFAS market categories lead the
forecasted launch market. As shown in Table 19,
44 of the 112 launches in the current forecast
will carry international science and other pay-
loads, while 28 will carry OFAS spacecraft. The
international science and other launches are split
between small and medium-to-heavy vehicles,
with slightly more small vehicles forecasted.
The OFAS market uses all medium-to-heavy
vehicles. Twenty-four launches are forecasted
for telecommunications, with all Big LEO mis-
sions using medium-to-heavy vehicles and all
Little LEO missions using small vehicles.
Sixteen launches are forecast to carry commer-
cial remote sensing satellites, the majority of
which will use medium-to-heavy vehicles.
Historical NGSO MarketAssessments
The 2008 FAA/AST forecast of commercial
NGSO launches and payloads for 2008–2017
shows new overall trends from recent forecasts.
The 2004 through 2007 forecasts both began
with the maximum number of forecasted
launches in the first few years of the forecast
period, generally decreasing to the end of the
period. The 2008 forecast, though, begins with
five years steadily near the ten-year average
number of launches and then increases for the
second half of the forecast. The second half of
the forecast, 2013 through 2017, experiences
both the maximum and minimum number of
launch demand.
Historically, there have been significant changes
in the amount of payloads and launches that are
expected in the forecast period, particularly with
a large increase from 1996 to 1998, a decrease
from 1999 to 2001, and now an increase from
2007 to 2008. Figure 14 provides a historical
comparison of FAA/AST forecasts from 2002 to
the present, with actual launches to date includ-
ed. After the high rate of demand for launches
in the late 1990s and forecasts projecting con-
tinued high rates of launches, FAA/AST reduced
its annual forecasts as it saw the demand for
launches fall.
The last few years’ forecasts show a gradual
upward trend in the amount of forecasted pay-
loads and launches, while the change from the
2007 to the 2008 forecast shows a greater
growth rate with 276 payloads projected to
launch on 112 vehicles from 2008 to 2017. This
represents an increase of 85 spacecraft from last
year’s forecast, the sixth consecutive year of
increased payload projections. The 112 launches
52
Federal Aviation Administration and the Commercial Space Transportation Advisory Committee (COMSTAC)
Table 19. Distribution of Launches AmongMarket Sectors

is a 31-launch increase from the 2007 forecast,
which is the third year in a row that has seen an
increased forecast of total launches. Figure 15
illustrates the launch trends by displaying the
average number of launches each year in fore-
casts dating back to 1998, as well as the
maximum number of launches in any given year
of each forecast.
Examining historical commercial NGSO satel-
lite launch activity, the telecommunications
market put large constellations of satellites into
orbit within a few years, creating a short spurt
of intense launch activity. This was the case in
1997 to 1999 when the three major systems,
Globalstar, Iridium, and ORBCOMM, were
launched. The 2008 forecast shows a slightly
more spread-out schedule of launches as each of
these systems is being replaced with new satel-
lites. The future next-generation deployment
schedules do not fully overlap as they did in the
late 1990s.
The international science and commercial
remote sensing satellite markets create steady
and less-intense launch demand according to
historical figures. Since 1996, there has always
been at least one international science or other
satellite launched, with a maximum amount of
11 satellites launched in one year (2000). The
commercial remote sensing market has low
launch demand that is more sporadic than inter-
national science and other; since 1993 there
have been eight years with at least one satellite
launched, while there have been seven years
with none from this market. Next year, histori-
cal data for the OFAS market will begin to be
tabulated.
Table 20 lists the number of payloads launched
by market sector and total commercial launches
that were internationally competed or commer-
cially sponsored from 1993–2007. Small
vehicles performed 45 launches during this peri-
od, while medium-to-heavy vehicles conducted
53 launches. In 2007, the historical number of
launches between vehicle classes was equal, 43
launches for both small and medium-to-heavy
vehicles. The 2008 forecast estimates that the
larger vehicle class will continue to conduct the
most launches.
Historical satellite and launch data from
1993–2007 are shown in Table 21. Secondary
and piggyback payloads on launches with larger
primary payloads were not included in the pay-
load and launch tabulations.
53
2008 NGSO Commercial Space Transportation Forecast
Table 20. Historical Commercial NGSO Activity*
* Includes payloads open to international launch services procurement and other commercially-sponsored payloads.
Does not include dummy payloads. Also not included in this forecast are those satellites that are captive to national
flag launch service providers (i.e., USAF or NASA satellites, or similar European, Russian, Japanese, or Chinese gov-
ernment satellites that are captive to their own launch providers). Does not include piggyback payloads. Only primary
payloads that generate a launch are included unless combined secondaries generate the demand.

54
Federal Aviation Administration and the Commercial Space Transportation Advisory Committee (COMSTAC)
Figure 14. Comparison of Past Baseline Launch Demand Forecasts
Figure 15. Average and Maximum Launches per Year from NGSO Forecasts 1998–2008
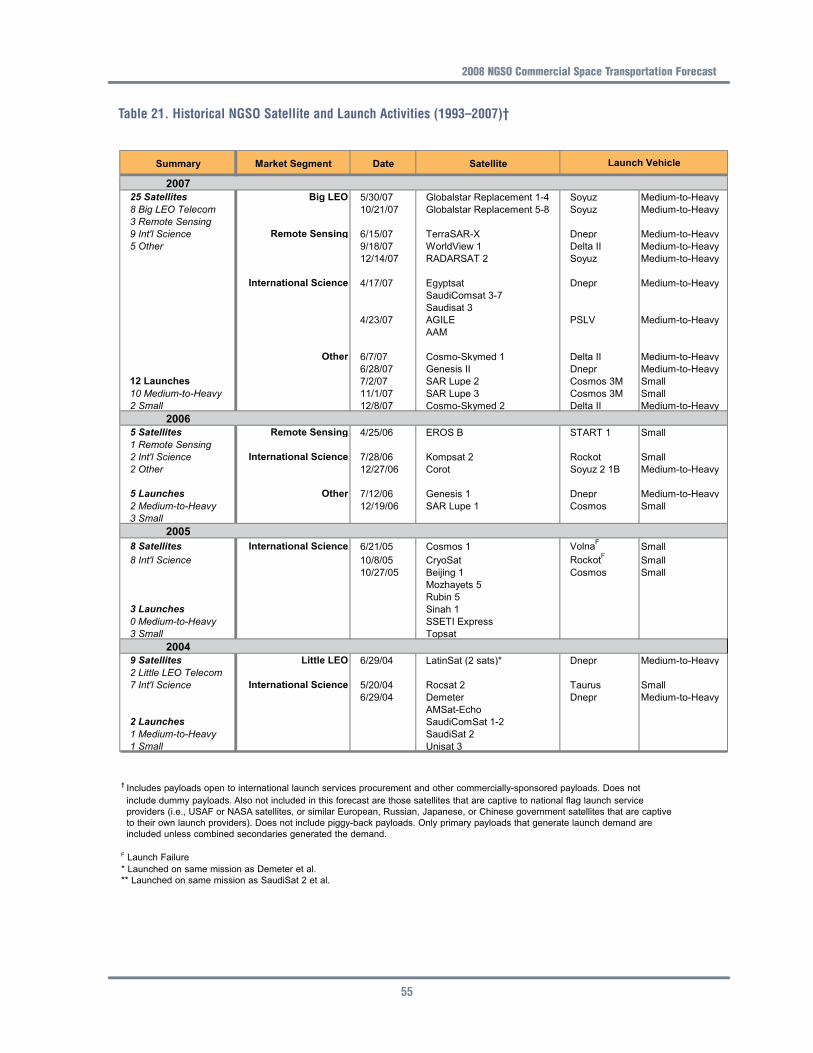
55
2008 NGSO Commercial Space Transportation Forecast
Table 21. Historical NGSO Satellite and Launch Activities (1993–2007)†
† Includes payloads open to international launch services procurement and other commercially-sponsored payloads. Does not
include dummy payloads. Also not included in this forecast are those satellites that are captive to national flag launch service
providers (i.e., USAF or NASA satellites, or similar European, Russian, Japanese, or Chinese government satellites that are captive
to their own launch providers). Does not include piggy-back payloads. Only primary payloads that generate launch demand are
included unless combined secondaries generated the demand.
F Launch Failure
* Launched on same mission as Demeter et al.
** Launched on same mission as SaudiSat 2 et al.
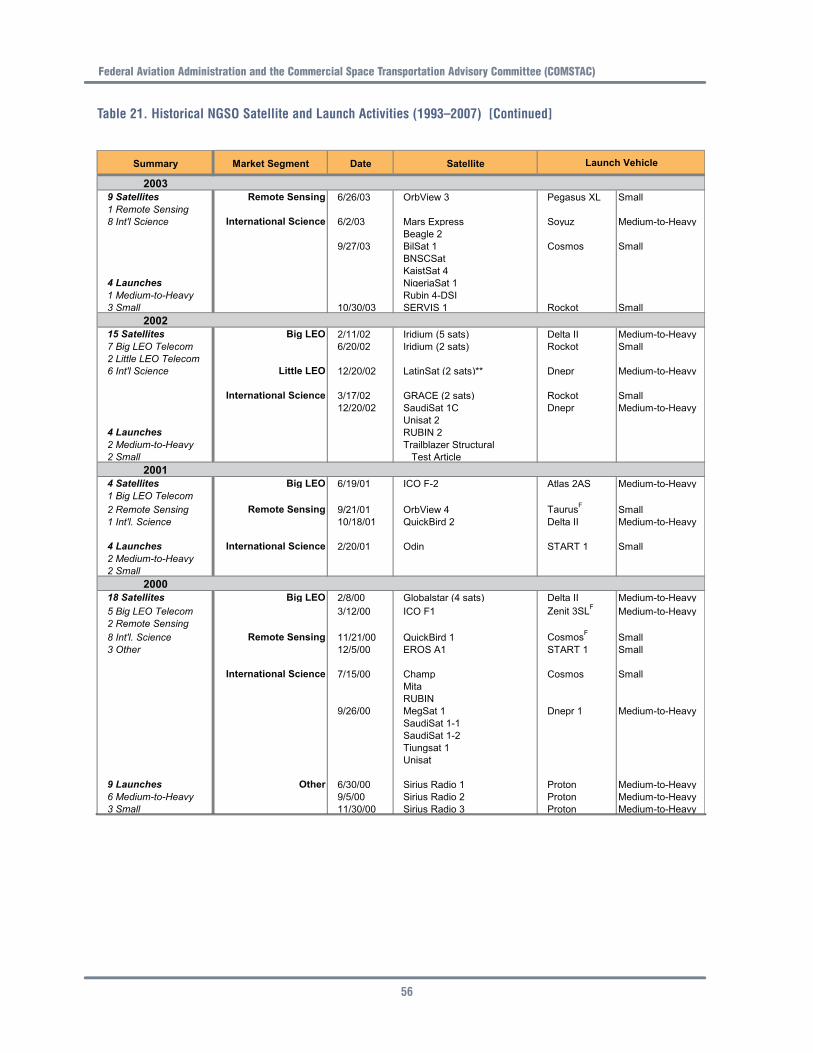
56
Federal Aviation Administration and the Commercial Space Transportation Advisory Committee (COMSTAC)
Table 21. Historical NGSO Satellite and Launch Activities (1993–2007) [Continued]
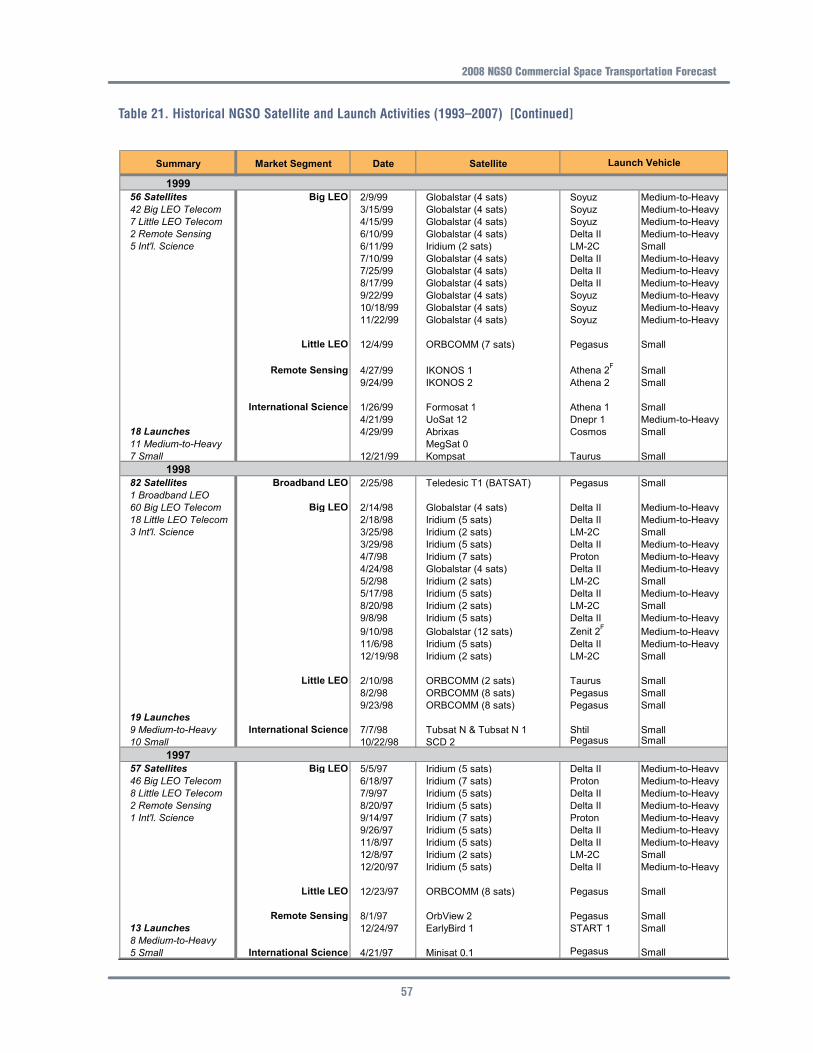
57
2008 NGSO Commercial Space Transportation Forecast
Table 21. Historical NGSO Satellite and Launch Activities (1993–2007) [Continued]

58
Federal Aviation Administration and the Commercial Space Transportation Advisory Committee (COMSTAC)
Table 21. Historical NGSO Satellite and Launch Activities (1993–2007) [Continued]