© Copyright by AA-Partners Ltd. 2012
AA-Partners Ltd. Witikonerstrasse 36
8032 Zurich/ Switzerland www.aa-partners.ch
AAP LIFE SETTLEMENT MARKET REVIEW ___
August 2011

2
AAP LS Market Review – August 2011 © Copyright by AA-Partners Ltd. 2011
TABLE OF CONTENTS
LIFE SETTLEMENT MARKETS 3
MARKET OVERVIEW 4
SECONDARY MARKET - MAIN MARKET 5
SECONDARY MARKET - TAIL MARKETS 9
TERTIARY MARKET 11
DETAILED DATA REGARDING SECONDARY MARKET – MAIN MARKET 13
SECONDARY MARKET – MAIN MARKET PROJECTED IRR LE USED FOR CLOSING 14
SECONDARY MARKET – MAIN MARKET PROJECTED IRR LE FROM AVS 15
SECONDARY MARKET – MAIN MARKET PROJECTED IRR LE FROM 21ST SERVICES 16
SECONDARY MARKET – MAIN MARKET LIFE ESTIMATES LE FROM AVS 18
SECONDARY MARKET – MAIN MARKET LIFE ESTIMATES LE FROM 21ST SERVICES 19
ANNEX & DISCLAIMER 20
ANNEX 1 ABBREVIATIONS & EXPLANATIONS 21
ANNEX 2 DATA & CALCULATIONS 22
ANNEX 3 EXCLUDED DATA 23
DISCLAIMER GLOBAL DISCLAIMER 24

3
AAP LS Market Review – August 2011 © Copyright by AA-Partners Ltd. 2011
LIFE SETTLEMENT MARKETS
Market Commentary

4
AAP LS Market Review – August 2011 © Copyright by AA-Partners Ltd. 2011
MARKET OVERVIEW SECONDARY & TERIARY MARKETS Secondary Market Tertiary Market
Numbers/Figures 3 Months 6 Months Numbers/Figures 3 Months 6 Months
Policies [Nr] 34 73 Policies [Nr] 8 61
Sum FV [USD Mio] 81.3 166.2 Sum FV [USD Mio] 20.2 167.5
Av. FV [USD Mio] 2.4 2.3 Av. FV [USD Mio] 2.5 2.8
Av. Age [Yrs] 80.0 80.7 Av. Age [Yrs] 81.8 83.0
Over the last six months secondary and tertiary market trades with cumulated face values of USD 333.7 Mio were reported (after exclusions) whereof the tertiary trades contributed about 50% of the total traded volume. The trading activity in the secondary market decreased in July if compared to June. At the same time the observed level of projected IRR remained high. The ‘AAP Life Settlement Reference Rate’ which mirrors the IRR level in the main market stands at 19% in July, which is slightly lower than the 19.8% which resulted in June. Detailed information regarding the secondary markets can be found on pages 5-10 as well as on pages 14-19.
The trading activity referring to tertiary market trades was low in July. Still the large trades in March and April dominate the picture. The average projected IRR of the tertiary market over the last six months is with 16.4%. Information regarding the tertiary market is summarized on pages 11-12.
0.0%
3.0%
6.0%
9.0%
12.0%
15.0%
18.0%
21.0%
24.0%
0
10
20
30
40
50
60
70
80
90
100
110
120
Jan-
11
Feb-
11
Mar
-11
Apr
-11
May
-11
Jun-
11
Jul-1
1
Volume Secondary Market [USD Mio; primary Y-Axis]
Volume Tertiary Market [USD Mio; primary Y-Axis]
AAP Life Settlement Reference Rate - Main Market [%; secondary Y-Axis]
Whole Life Settlement Market –
Statistics after exclusions
Traded volume FV per market & AAP
Life Settlement Reference Rate –
Main Market

5
AAP LS Market Review – August 2011 © Copyright by AA-Partners Ltd. 2011
SECONDARY MARKET
MAIN MARKET (AGE 75 TO 86)
Numbers/Figures 3 Months 6 Months Numbers/Figures 3 Months 6 Months
Transactions [Nr] 23 51 Av. Age [Yrs.] 80.8 81.1
Sum FV [USD Mio] 56.9 118.6 Av. LE used [Mt.] 101
97
% Male [%] 47.8 51.0 Av. FV [USD Mio] 2.5 2.3
% Female [%] 52.2 49.0 Av. IRR [%] 21.2 21.0
The trading activity in the main market was lower in July than in June. In July USD 17.1 Mio face value was traded. The sum face values in the last six months amount to USD 118.6 Mio, the average face value of the same time period is USD 2.3 Mio. In July the average age of insured was 78 years which is younger than the market average. On average females were 1.8 years older than male at time of closing the transactions. The gender split stands close to fifty-fifty for the six month period which is to a certain extent unusual since policies referring to male insured made roughly 60-70% of the market in the past.
The level of projected IRR remained high. The AAP Life Settlement Reference Rate – Main Market stands at 19.0% in July. This rate is slightly lower than the 19.1% which resulted in June and close to the average reference rate of 19.1% over the six months window.
0.0%
6.0%
12.0%
18.0%
24.0%
0.0
5.0
10.0
15.0
20.0
25.0
30.0
Jan-
11
Feb-
11
Mar
-11
Apr
-11
May
-11
Jun-
11
Jul-1
1
Male - Traded Volume [USD Mio; primary Y-Axis]
Female - Traded Volume [USD Mio; primary Y-Axis]
AAP Life Settlement Reference Rate - Main Market [%; secondary Y-Axis]
Secondary Market – Statistics ‘Main
Market’
AAP Life Settlement Reference Rate –
Main Market & trading activity per
gender

6
AAP LS Market Review – August 2011 © Copyright by AA-Partners Ltd. 2011
On average policies were transferred at 13.5% of face value over the last six months. In the age brackets 75-80 policies traded around 10% of face value, in the age brackets 81-86 this ratio is between roughly 15% and 22.5%. The relatively high figure with age bracket 81-82 can be explained with the lower average projected IRR which resulted from the trades in this bracket.
In general the cash surrender value of the traded policies was low. In total the cash surrender values amount to 0.7% of the face values over the six months period so the sale via the secondary market was by far the better alternative for insured than surrendering the policies.
Investors don’t ask systematically for higher or lower IRR based on gender. On average the projected IRR referring to female was with 21.7% a bit higher than for male which average to 20.4%. There is no clear trend of the projected IRR apparent regarding age of insured. Investors don’t ask for higher IRR levels for younger insured and lower for older, or vice versa.
The trading activity is similar in all age brackets over the last six months. Female insured account to a larger part of the trades with higher ages. In the age bracket 75-76 years just policies of male insured were traded. The life expectancy estimates (LE) which were used for closing the
0%
5%
10%
15%
20%
25%
30%
35%
0%
5%
10%
15%
20%
25%
30%
35%
Age
75-
76
Age
77-
78
Age
79-
80
Age
81-
82
Age
83-
84
Age
85-
86
Av Cash Surrender Value in % of FV [%, primary Y-Axis]
Av Transaction Price in % of FV [%, primary Y-Axis]
Male - Av Proj IRR [%; secondary Y-Axis]
Female - Av Proj IRR [%, secondary Y-Axis]
0
15
30
45
60
75
90
105
120
135
150
0
1
2
3
4
5
6
7
8
9
10
Age
75-
76
Age
77-
78
Age
79-
80
Age
81-
82
Age
83-
84
Age
85-
86
Male - Trades [Nr; primary Y-Axis]
Female - Trades [Nr; primary Y-Axis]
Male - Av LE used for closing [Months, secondary Y-Axis]
Female - Av LE used for closing [Months, secondary Y-Axis]
Cash Surrender Value and
Transaction Price in % of FV & Average Projected IRR per
gender
Trades per gender and respective
average LE per age brackets

7
AAP LS Market Review – August 2011 © Copyright by AA-Partners Ltd. 2011
transactions in general become shorter with increasing age of insured. In general female insured have a longer LE than male insured of same age.
For getting evidence if investors ask for higher projected IRR with decreasing financial rating of the insurance companies the trades of the main market were split following the AM Best rating of the insurance carriers which effected the policies. The majority of trades refer to insurance carrier with an A+ rating (‘superior’). With decreasing AM Best rating the average projected IRR increases. The average face value of policies referring to ‘A’ rated carriers is with USD 1.8 Mio, and for ‘A-‘ rated carriers with USD 0.6 Mio. The level of projected IRR therefore can’t be attributed to the size of the traded policies (compare also the following section).
In general trading activity was larger with small face values than with large face values, a fact which is also reflected in the average face value per trade. The largest trading activity was in the face value bracket USD 1-2 Mio. With exception of face value bracket 3-5 Mio the average projected IRR of the trades increase with increasing face value. The smallest policies traded on average at 19.6% projected IRR and the largest policies at 27.2%.
0%
5%
10%
15%
20%
25%
30%
0
3
6
9
12
15
18
21
AM Best A++ AM Best A+ AM Best A AM Best A-
Male - Trades [Nr, primary Y-Axis] vs Insurance Carrier Rating [AM Best Rating, X-Axis]
Female - Trades [Nr, primary Y-Axis] vs Insurance Carrier Rating [AM Best Rating, X-Axis]
Av Projected IRR [%, secondary Y-Axis] vs AM Best Rating [Rating, X-Axis]
0%
5%
10%
15%
20%
25%
30%
0
3
6
9
12
15
1 M
io &
le
ss
1-2
Mio
2-3
Mio
3-4
Mio
4-5
Mio
> 5
Mio
Male - Trades [Nr, primary Y-Axis] vs FV [Mio USD, X-Axis]
Female - Trades [Nr, primary Y-Axis] vs FV [Mio USD, X-Axis]
Av Proj IRR [%, secondary Y-Axis] vs FV [USD Mio, X-Axis]
Number of trades per insurance carrier rating & average
projected IRR
Number of trades per face value bracket &
average projected IRR
8
AAP LS Market Review – August 2011 © Copyright by AA-Partners Ltd. 2011
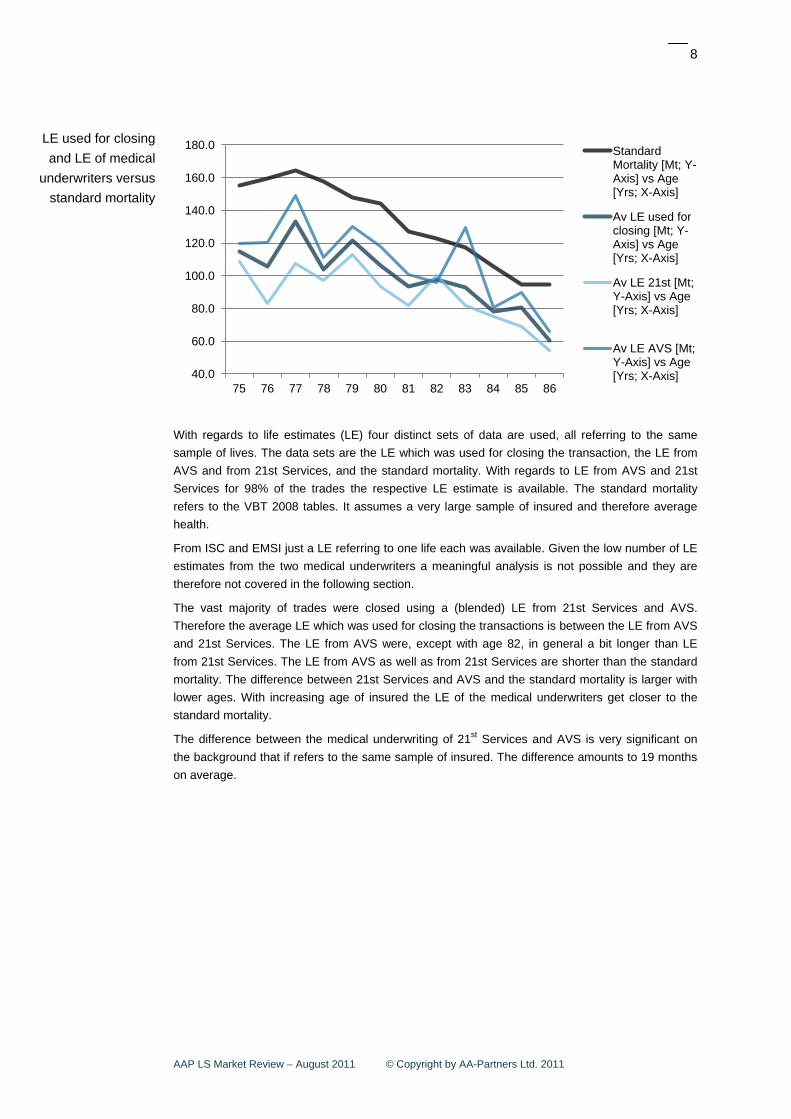
With regards to life estimates (LE) four distinct sets of data are used, all referring to the same sample of lives. The data sets are the LE which was used for closing the transaction, the LE from AVS and from 21st Services, and the standard mortality. With regards to LE from AVS and 21st Services for 98% of the trades the respective LE estimate is available. The standard mortality refers to the VBT 2008 tables. It assumes a very large sample of insured and therefore average health.
From ISC and EMSI just a LE referring to one life each was available. Given the low number of LE estimates from the two medical underwriters a meaningful analysis is not possible and they are therefore not covered in the following section.
The vast majority of trades were closed using a (blended) LE from 21st Services and AVS. Therefore the average LE which was used for closing the transactions is between the LE from AVS and 21st Services. The LE from AVS were, except with age 82, in general a bit longer than LE from 21st Services. The LE from AVS as well as from 21st Services are shorter than the standard mortality. The difference between 21st Services and AVS and the standard mortality is larger with lower ages. With increasing age of insured the LE of the medical underwriters get closer to the standard mortality.
The difference between the medical underwriting of 21st
Services and AVS is very significant on the background that if refers to the same sample of insured. The difference amounts to 19 months on average.
40.0
60.0
80.0
100.0
120.0
140.0
160.0
180.0
75 76 77 78 79 80 81 82 83 84 85 86
Standard Mortality [Mt; Y-Axis] vs Age [Yrs; X-Axis]
Av LE used for closing [Mt; Y-Axis] vs Age [Yrs; X-Axis]
Av LE 21st [Mt; Y-Axis] vs Age [Yrs; X-Axis]
Av LE AVS [Mt; Y-Axis] vs Age [Yrs; X-Axis]
LE used for closing and LE of medical
underwriters versus standard mortality

9
AAP LS Market Review – August 2011 © Copyright by AA-Partners Ltd. 2011
SECONDARY MARKET TAIL MARKETS
Numbers/Figures
Age bracket ‘Under 75 Years’ Age bracket ‘Over 86 years’ 3 Months 6 Months Numbers/Figures 3 Months 6 Months
Policies [Nr] 7 12 Policies [Nr] 4 10
Sum FV [USD Mio] 22.4 36.0 Sum FV [USD Mio] 2.1 11.6
Av. FV [USD Mio] 3.2 3.0 Av. FV [USD Mio] 0.5 1.2
% Male [%] 100.0 100.0 % Male [%] 75.0 60.0
Av. Age [Yrs] 71.8 71.7 Av. Age [Yrs] 89.7 89.8
Av. LE [Mt] 129 133 Av. LE [Mt] 43 40
Av. IRR [%] 18.6 19.3 Av. IRR [%] 24.2 38.8
The tail markets referring to ages below 75 years and over 86 years are partly significant different to the main market and the two segments therefore are shown separated from the main secondary market.
The trading activity referring to the age brackets ‘Under age 75’ and ‘Over age 86 years’ was significant in the last six months.
In the age bracket ‘Under age 75’ just policies of male insured were traded. The average face value was with USD 3.0 Mio higher than in the main market. The average LE of the sample is 133 months which is clearly shorter than the respective average standard mortality of 202 months. The level of projected IRR is with 19.3% lower than in the main market and referring to male insured. On average the policies in this sample were traded at 11.1% of face value which is a bit higher than in the age brackets ’75-76’ and ’77-78’ of the main market. The average cash surrender value is with 0.95% of face value low.
With regards to the age bracket ‘> age 86’ male insured account for 60% of the trades, the gender split of the six months sample is therefore as expected. The average face amount is with USD 1.2
0.0%
10.0%
20.0%
30.0%
40.0%
50.0%
60.0%
-
10.0
20.0
30.0
40.0
50.0
60.0
70.0
80.0
90.0
100.0
< ag
e 75
Age
75-
76
Age
77-
78
Age
79-
80
Age
81-
82
Abe
83-
84
Age
85-
86
> A
ge
86
Male - Traded Volume FV [USD Mio; primary Y-Axis]
Female - Traded Volume FV [USD Mio; primary Y-Axis]
Proj IRR - LE used for closing [%; secondary Y-Axis]
Proj IRR - LE from 21st [%; secondary Y-Axis]
Proj IRR - LE from AVS [%; secondary Y-Axis]
Secondary market – Statistics ‘Tail
Markets’
Traded volumes in the secondary
market & projected IRR referring to three
different LE

10
AAP LS Market Review – August 2011 © Copyright by AA-Partners Ltd. 2011
Mio over the last six months clearly lower than the averages in the main market or in the age bracket ‘under age 75’.
The projected IRR in the bracket ‘> age 86’ is very different to all other market segments. The average projected IRR of the whole sample is 38.8% if referring to the LE which was used for closing the transaction. The average projected IRR of male insured is 43%, trades referring to female insured average a 32.6% projected IRR. The carriers which effected the policies have AM Best ratings of ‘A+’ respective ‘A’.
The average LE for the insured in age bracket ‘>age 86’ which was used for closing the transactions is 39.2 months. The short average LE reflect the high age of the insured. On average the policies were transferred for 29.4% of the face value. The average cash surrender value is with 4% of face value. On average the policies were 13.1 years in force before they were sold.
0.0
20.0
40.0
60.0
80.0
100.0
120.0
140.0
160.0
180.0
200.0
65.0 70.0 75.0 80.0 85.0 90.0 95.0 100.0
LE used for closing [Mt., primary Y-Axis] vs age [yrs, X-Axis]
LE used for closing versus age of
insured – whole secondary market

11
AAP LS Market Review – August 2011 © Copyright by AA-Partners Ltd. 2011
TERTIARY MARKET BROAD MARKET
Numbers/Figures 3 Months 6 Months Numbers/Figures 3 Months 6 Months
Policies [Nr] 8 61 Av. FV [USD Mio] 2.5 2.8
Sum FV [USD Mio] 20.2 167.5 Av. Age [Yrs] 81.8 82.3
% Male [%] 87.5 75.8 Av. LE used [Mt] 104 100
% Female [%] 12.5 24.2 Av. IRR [%] 20.1 16.4
The trading activity with regards to tertiary market policies was similar in July as in June and May. Four trades with cumulated face values of USD 11.8 Mio were reported. This result underlines the large volatility with regards to tertiary market trades since trading is often linked to portfolios, as can be seen for example in April. In addition block trades often refer to sets of policies which are clearly different to the rest of the reported tertiary trades which should be remembered when analyzing the results.
The average face value of the July trades is USD 2.9 Mio which is in line with the average face value of the tertiary market trades if the block trade in April is included. If the block trade is not included the average face value in July is much larger than the USD 1.6 Mio of the whole sample. The average LE of the July trades of 98 months and the average age of 82.8 years is in line with the six months sample (block trade included). If the block trade in April is disregarded the average age of the insured of the sample is with 82.2 years and the 38 policies closed with an average life expectancy estimate of 100.4 months.
Over the last six months, and if the block trade is disregarded, the average female age is 85.7 years, the average face value amounts to USD 2.5 Mio and the average life expectancy is with 92.8 months. For male insured the respective averages are 81.1 years, USD 1.3 Mio and 103 months.
0
5
10
15
20
25
0
20
40
60
80
100
Jan-
11
Feb-
11
Mar
-11
Apr
-11
May
-11
Jun-
11
Jul-1
1
Male - Traded Volume Tertiary Market [USD Mio, primary Y-Axis]
Female - Traded Volume Tertiary Market [USD Mio, primary Y-Axis]
Nr of Policies - Tertiary Market [Nr, secondary Y-Axis]
Tertiary Life Settlement Market –
Statistics (please compare also Annex
2 & 3)
Traded volume in the tertiary market per
gender & number of traded policies

12
AAP LS Market Review – August 2011 © Copyright by AA-Partners Ltd. 2011
The average projected IRR of the four July transactions is 19.1%. This is much higher than the average projected IRR of 16.4% of all tertiary market trades and including the block trade. The difference of projected IRR is larger between the genders if compared to the secondary market. If the block trade is disregarded the average projected IRR referring to female is with 18.1%, male insured average to a 15.9% projected IRR.
The number of premium financed policies considering all reported policies is seven with cumulated face values of USD 48 Mio, so on average much larger policies than the non premium financed policies. There was just one policy reported with smoker status ‘yes’. The cash surrender value of the tertiary market trades was low with 0.6% of the sum face values. On average the policies were 9.5 years in force until they were traded over the last six months.
0.0 20.0 40.0 60.0 80.0
100.0 120.0 140.0 160.0 180.0 200.0
65.0 70.0 75.0 80.0 85.0 90.0 95.0 100.0
LE Used [Mts; Y-Axis] per Age [Yrs; X-Axis]
Life expectancy used for closing versus
age of insured

13
AAP LS Market Review – August 2011 © Copyright by AA-Partners Ltd. 2011
DETAILED DATA REGARDING SECONDARY MARKET – MAIN MARKET
Please refer also to the market commentary. Abbreviations and Explanations can be found in the annexes.

14
AAP LS Market Review – August 2011 © Copyright by AA-Partners Ltd. 2011
SECONDARY MARKET – MAIN MARKET PROJECTED IRR LE USED FOR CLOSING
Numbers/Figures 3 Months 6 Months Numbers/Figures 3 Months 6 Months
Transactions [Nr] 23 51 Av. Age [Yrs.] 80.8 81.1
Sum FV [USD Mio] 56.9 118.6 Av. LE used [Mt.] 101 97
% Male [%] 47.8 51.0 Av. FV [USD Mio] 2.5 2.3
% Female [%] 52.2 49.0 Av. IRR [%] 21.2 21.0
Age 75 76 77 78 79 80 81 82 83 84 85 86
Trans [Nr] 3 4 2 7 4 5 7 3 3 3 6 4
Av FV [Mio] 2.8 1.5 2.0 2.8 4.3 3.0 1.7 1.7 1.6 4.3 1.2 1.9
Av LE [Mt] 115 106 133 104 122 107 94 98 93 78 81 60
Av IRR [%] 21.2 25.5 17.2 26.3 17.3 22.3 15.1 19.7 26.0 23.6 18.4 21.1
Max [IRR] 27.5 41.5 20.9 43.0 23.2 28.4 18.0 22.0 41.6 26.4 25.6 28.9
4th 24.2 Q [IRR] 29.3 19.0 30.6 20.1 23.9 16.6 20.5 30.9 25.9 19.4 23.5
Med [ IRR] 20.9 22.2 17.2 23.1 16.5 21.6 15.2 18.9 20.2 25.5 17.6 20.6
2nd 18.0 Q [IRR] 18.3 15.3 19.1 13.7 21.2 14.1 18.5 18.2 22.2 17.0 18.2
Min [IRR] 15.2 16.1 13.4 18.7 12.9 16.3 11.0 18.0 16.1 18.8 13.1 14.4
For abbreviations and explanations compare Annex.
0%
5%
10%
15%
20%
25%
30%
35%
40%
45%
50%
75 76 77 78 79 80 81 82 83 84 85 86
Used LE - Av Proj IRR [%, Y-Axis] vs Age [Yrs, X-Axis]
Used LE - Mov 3-Years Av Proj IRR [%, Y-Axis] vs Age [Yrs, X-Axis]
Statistics
Yield Structure
Yield Structure - Statistics
Remarks & Comments

15
AAP LS Market Review – August 2011 © Copyright by AA-Partners Ltd. 2011
SECONDARY MARKET – MAIN MARKET PROJECTED IRR LE FROM AVS
Numbers/Figures 3 Months 6 Months Numbers/Figures 3 Months 6 Months
Transactions [Nr] 23 50 Av. Age [Yrs.] 80.8 81.0
Sum FV [USD Mio] 56.9
117.4 Av. LE used [Mt.] 108 106
% Male [%] 47.8 50.0 Av. FV [USD Mio] 2.5 2.3
% Female [%] 52.2 50.0 Av. IRR [%] 17.8 17.2
Age 75 76 77 78 79 80 81 82 83 84 85 86
Trans [Nr] 3 4 2 7 4 5 7 3 2 3 6 4
Av FV [Mio] 2.8 1.5 2.0 2.8 4.3 3.0 1.7 1.7 1.7 4.3 1.2 1.9
Av LE [Mt] 120 121 149 111 130 118 101 96 130 81 90 66
Av IRR [%] 19.5 17.9 12.4 22.3 14.6 17.1 12.5 23.4 13.1 23.0 14.0 16.9
Max [IRR] 25.8 28.2 14.6 30.6 20.2 20.3 15.8 30.4 14.5 25.2 19.7 21.3
4th 23.7 Q [IRR] 19.1 13.5 27.2 17.8 19.0 14.1 27.9 13.8 23.7 14.1 19.7
Med [ IRR] 21.6 15.1 12.4 21.0 14.1 17.9 12.9 25.5 13.1 22.3 13.0 16.5
2nd 16.4 Q [IRR] 13.9 11.3 17.6 10.8 15.8 11.7 19.9 12.3 21.9 12.5 13.6
Min [IRR] 11.1 13.2 10.2 15.1 9.8 12.4 7.0 14.4 11.6 21.5 11.3 13.1
For one trade a LE from AVS is missing, therefore just 50 data points. For abbreviations and explanations compare Annex.
0%
5%
10%
15%
20%
25%
30%
35%
40%
45%
50%
75 76 77 78 79 80 81 82 83 84 85 86
AVS LE - Av Proj IRR [%, Y-Axis] v Age [Yrs, X-Axis]
AVS LE - Mov 3-Years Av Proj IRR [%, Y-Axis] vs Ag [Yrs; X-Axis]
Statistics
Yield Structure
Yield Structure - Statistics
Remarks & Comments

16
AAP LS Market Review – August 2011 © Copyright by AA-Partners Ltd. 2011
SECONDARY MARKET – MAIN MARKET PROJECTED IRR LE FROM 21ST SERVICES
Numbers/Figures 3 Months 6 Months Numbers/Figures 3 Months 6 Months
Transactions [Nr] 22 50 Av. Age [Yrs.] 80.8 81.1
Sum FV [USD Mio] 53.9 115.6 Av. LE used [Mt.] 89 87
% Male [%] 52.0 50.0 Av. FV [USD Mio] 2.4 2.3
% Female [%] 48.0 50.0 Av. IRR [%] 34.1 29.4
Age 75 76 77 78 79 80 81 82 83 84 85 86
Trans [Nr] 3 4 2 7 4 5 6 3 3 3 6 4
Av FV [Mio] 2.8 1.5 2.0 2.8 4.3 3.0 1.4 1.7 1.6 4.3 1.2 1.9
Av LE [Mt] 109 83 108 97 113 94 82 100 82 75 69 55
Av IRR [%] 23.7 70.1 26.5 30.9 20.2 30.1 19.1 18.0 32.3 24.8 28.2 27.8
Max [IRR] 29.4 182 29.3 51.5 26.5 43.3 28.7 24.8 49.0 31.1 57.2 40.8
3rd 25.7 Q [IRR] 87.6 27.9 37.0 21.4 29.2 20.4 21.8 38.0 30.6 27.9 36.8
Med [ IRR] 21.9 41.1 26.5 27.0 18.9 28.9 19.4 18.7 27.0 30.1 24.5 27.6
2nd 20.9 Q [IRR] 23.7 25.1 23.0 17.7 25.0 17.1 14.6 23.9 21.7 21.7 18.6
Min [IRR] 19.8 15.8 23.7 17.8 16.5 23.9 9.8 10.5 20.8 13.4 13.1 15.0
For one trade a LE from 21st is missing, therefore just 50 data points. For abbreviations and explanations compare Annex.
0%
10%
20%
30%
40%
50%
60%
70%
75 76 77 78 79 80 81 82 83 84 85 86
21st Services LE - Av Proj IRR [%, Y-Axis] vs Age [Yrs, X-Axis]
21st LE - Mov 3-Years Av Proj IRR [%, Y-Axis] vs Age [Yrs; X-Axis]
Statistics
Yield Structure
Yield Structure - Statistics
Remarks & Comments

17
AAP LS Market Review – August 2011 © Copyright by AA-Partners Ltd. 2011
SECONDARY MARKET – MAIN MARKET LIFE ESTIMATES LE USED FOR CLOSING
Numbers/Figures 3 Months 6 Months Numbers/Figures 3 Months 6 Months
Transactions [Nr] 23 51 Av. Age [Yrs.] 80.8 81.1
Sum FV [USD Mio] 56.9 118.6 Av. LE used [Mt.] 101 97
% Male [%] 47.8 51.0 Av. FV [USD Mio] 2.5 2.3
% Female [%] 52.2 49.0 Av. IRR [%] 21.2 21.0
Age 75 76 77 78 79 80 81 82 83 84 85 86
Trans [Nr] 3 4 2 7 4 5 7 3 3 3 6 4
Av FV [Mio] 2.8 1.5 2.0 2.8 4.3 3.0 1.7 1.7 1.6 4.3 1.2 1.9
Av LE [Mt] 115 106 133 104 122 107 94 98 93 78 81 60
Av IRR [%] 21.2 25.5 17.2 26.3 17.3 22.3 15.1 19.7 26.0 23.6 18.4 21.1
Max [LE] 132 139 141 124 140 128 119 120 121 86 85 89
4th 122 Q [LE] 122 137 115 130 123 111 115 116 86 84 64
Med [LE] 112 104 133 107 121 107 92 110 110 86 82 54
2nd 107 Q [LE] 88 129 95 112 102 82 87 78 74 79 50
Min [LE] 101 76 126 77 105 74 60 64 47 62 73 45
For abbreviations and explanations compare Annex.
0.0
20.0
40.0
60.0
80.0
100.0
120.0
140.0
160.0
180.0
200.0
75 76 77 78 79 80 81 82 83 84 85 86 87
LE used for closing [Mt, primary Y-Axis] vs age [Yrs, X-Axis]
Statistics
LE Distribution
LE Distribution - Statistics
Remarks & Comments

18
AAP LS Market Review – August 2011 © Copyright by AA-Partners Ltd. 2011
SECONDARY MARKET – MAIN MARKET LIFE ESTIMATES LE FROM AVS
Numbers/Figures 3 Months 6 Months Numbers/Figures 3 Months 6 Months
Transactions [Nr] 23 50 Av. Age [Yrs.] 80.8 81.0
Sum FV [USD Mio] 56.9
117.4 Av. LE used [Mt.] 108 106
% Male [%] 47.8 50.0 Av. FV [USD Mio] 2.5 2.3
% Female [%] 52.2 50.0 Av. IRR [%] 17.8 17.2
Age 75 76 77 78 79 80 81 82 83 84 85 86
Trans [Nr] 3 4 2 7 4 5 7 3 2 3 6 4
Av FV [Mio] 2.8 1.5 2.0 2.8 4.3 3.0 1.7 1.7 1.7 4.3 1.2 1.9
Av LE [Mt] 120 121 149 111 130 118 101 96 130 81 90 66
Av IRR [%] 19.5 17.9 12.4 22.3 14.6 17.1 12.5 23.4 13.1 23.0 14.0 16.9
Max [LE] 146 154 156 142 147 139 130 122 134 93 96 90
4th 128 Q [LE] 138 153 126 136 139 116 118 132 93 95 72
Med [LE] 110 126 149 104 130 117 99 113 130 93 90 64
2nd 107 Q [LE] 109 146 100 124 108 90 83 127 75 86 58
Min [LE] 103 76 142 81 115 86 68 52 125 56 81 45
For one trade a LE from AVS is missing, therefore just 50 data points. For abbreviations and explanations compare Annex.
0.0
20.0
40.0
60.0
80.0
100.0
120.0
140.0
160.0
180.0
200.0
75 76 77 78 79 80 81 82 83 84 85 86 87
LE from AVS [Mt, primary Y-Axis] vs age [Years, X-Axis]
Statistics
LE Distribution
LE Distribution - Statistics
Remarks & Comments

19
AAP LS Market Review – August 2011 © Copyright by AA-Partners Ltd. 2011
SECONDARY MARKET – MAIN MARKET LIFE ESTIMATES LE FROM 21ST SERVICES
Numbers/Figures 3 Months 6 Months Numbers/Figures 3 Months 6 Months
Transactions [Nr] 22 50 Av. Age [Yrs.] 80.8 81.1
Sum FV [USD Mio] 53.9 115.6 Av. LE used [Mt.] 89 87
% Male [%] 52.0 50.0 Av. FV [USD Mio] 2.4 2.3
% Female [%] 48.0 50.0 Av. IRR [%] 34.1 29.4
Age 75 76 77 78 79 80 81 82 83 84 85 86
Trans [Nr] 3 4 2 7 4 5 6 3 3 3 6 4
Av FV [Mio] 2.8 1.5 2.0 2.8 4.3 3.0 1.4 1.7 1.6 4.3 1.2 1.9
Av LE [Mt] 109 83 108 97 113 94 82 100 82 75 69 55
Av IRR [%] 23.7 70.1 26.5 30.9 20.2 30.1 19.1 18.0 32.3 24.8 28.2 27.8
Max [LE] 115 100 109 115 133 116 108 127 108 79 85 88
3rd 114 Q [LE] 96 108 111 127 100 95 113 102 79 76 56
Med [LE] 113 86 108 109 113 96 89 98 95 79 68 45
2nd 106 Q [LE] 73 107 83 99 95 64 87 69 74 67 43
Min [LE] 99 61 106 68 95 61 55 75 42 68 49 41
For one trade a LE from 21st is missing, therefore just 50 data points. For abbreviations and explanations compare Annex.
0.0
20.0
40.0
60.0
80.0
100.0
120.0
140.0
160.0
180.0
200.0
75 76 77 78 79 80 81 82 83 84 85 86 87
LE from 21st Services [Mt, primary Y-Axis] vs age [Years, X-Axis]
Statistics
LE Distribution
LE Distribution - Statistics
Remarks & Comments

20
AAP LS Market Review – August 2011 © Copyright by AA-Partners Ltd. 2011
ANNEX & DISCLAIMER

21
AAP LS Market Review – August 2011 © Copyright by AA-Partners Ltd. 2011
ANNEX 1 ABBREVIATIONS & EXPLANATIONS
Av Average.
FV [Mio] Face value in Mio USD.
IRR [%] Projected internal rate of return in percent using a certain [LE].
LE [Mt] Life expectancy estimate in months.
Proj Projected [IRR].
Ref Referring to [LE from Medical Underwriter].
Max [LE/ IRR] Maximum value.
Mov Moving [Average], compare below.
4th Data point which is the lowest in the fourth quartile. Q [LE/ IRR]
Med [LE/ IRR] Median data point.
2nd Data point which is the lowest in the second quartile. Q [LE/ IRR]
Min [LE/ IRR] Minimum value.
Trans [Nr] Number of life settlement transactions.
Yrs Years.
Transparent providers Companies which provide data for the report.
AAP Life Settlement Reference Rate – Main Market
Benchmark return for the main life settlement market (ages75-86); it is calculated as average projected IRR referring to the life expectancy which was used for closing the transactions. For the reference sample policies of highly impaired insured (less than 0.5 of standard LE) are excluded. The calculation starts with all trades of the most recent month from which outliers (+/- 8% from the average) are excluded. If the number of trades is lower than nine, the data is amended with all trades of the previous month and so forth, until the number of values is at least nine.
LE used for closing LE which was the basis for the transfer of a policy. The LE which was used for closing a transaction normally is equal to a LE of a medical underwriter, or a blend of the LE of two or more medical underwriters.
Bracket/ sample Sample of data points selected following a certain criteria as age, insurance carrier rating, LE and so forth.
Standard mortality Mortality based on VBT 2008 ANB assuming average health.
Gender split Gender distribution in a given sample of transactions.
Mov 3-Years Av Averages Ages 75-77, 76-78, etc.; average leads to a smoothed curve.
Abbreviations
Explanations
22
AAP LS Market Review – August 2011 © Copyright by AA-Partners Ltd. 2011
ANNEX 2 DATA & CALCULATIONS
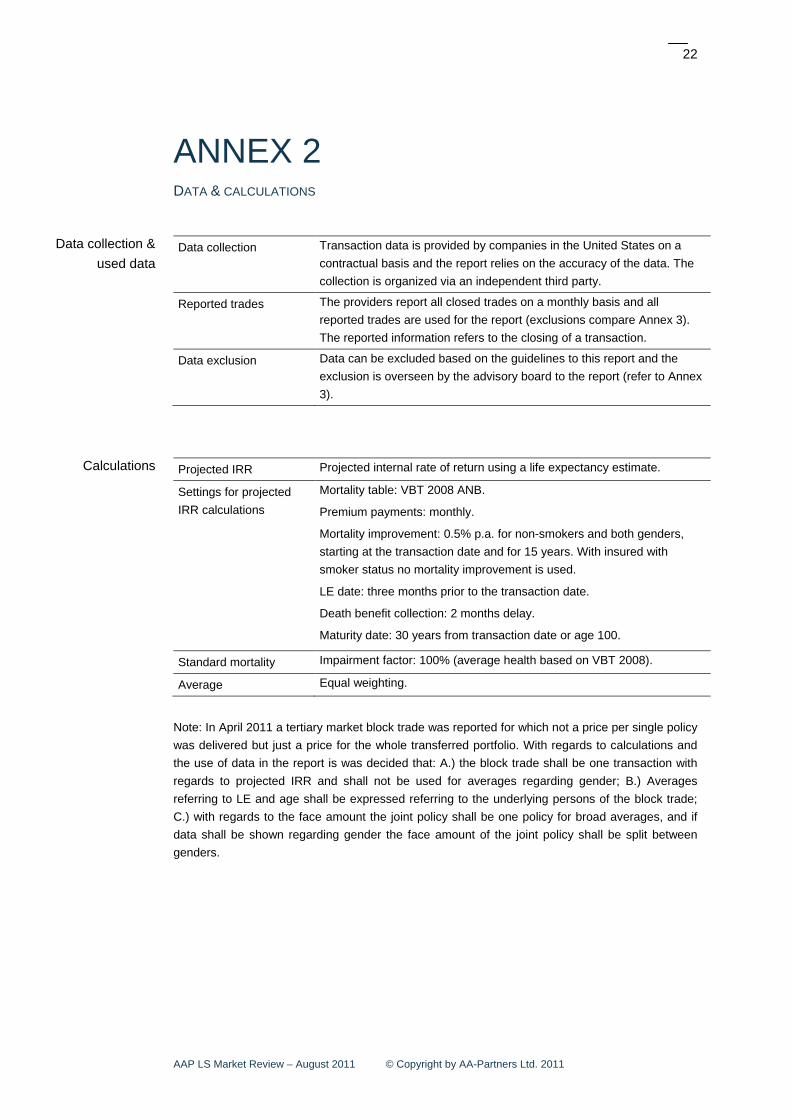
Data collection
Transaction data is provided by companies in the United States on a contractual basis and the report relies on the accuracy of the data. The collection is organized via an independent third party.
Reported trades
The providers report all closed trades on a monthly basis and all reported trades are used for the report (exclusions compare Annex 3). The reported information refers to the closing of a transaction.
Data exclusion
Data can be excluded based on the guidelines to this report and the exclusion is overseen by the advisory board to the report (refer to Annex 3).
Projected IRR Projected internal rate of return using a life expectancy estimate.
Settings for projected IRR calculations
Mortality table: VBT 2008 ANB.
Premium payments: monthly.
Mortality improvement: 0.5% p.a. for non-smokers and both genders, starting at the transaction date and for 15 years. With insured with smoker status no mortality improvement is used.
LE date: three months prior to the transaction date. Death benefit collection: 2 months delay.
Maturity date: 30 years from transaction date or age 100.
Standard mortality Impairment factor: 100% (average health based on VBT 2008).
Average Equal weighting.
Note: In April 2011 a tertiary market block trade was reported for which not a price per single policy was delivered but just a price for the whole transferred portfolio. With regards to calculations and the use of data in the report is was decided that: A.) the block trade shall be one transaction with regards to projected IRR and shall not be used for averages regarding gender; B.) Averages referring to LE and age shall be expressed referring to the underlying persons of the block trade; C.) with regards to the face amount the joint policy shall be one policy for broad averages, and if data shall be shown regarding gender the face amount of the joint policy shall be split between genders.
Data collection & used data
Calculations

23
AAP LS Market Review – August 2011 © Copyright by AA-Partners Ltd. 2011
ANNEX 3 EXCLUDED DATA
Foundation
The exclusion of data is detailed in the guidelines to the report (available on the homepage of AA-Partners Ltd. or on request).
Decision-making body
An independent advisory board to the market report decides about exclusion of data points on request of AA-Partners Ltd. The members of the advisory board can be found on the homepage of AA-Partners Ltd.
Reporting about excluded data
Excluded data is not part of the analysis of the report. Instead it is mentioned in the Annex to the report. In addition the exclusions are annually verified by an independent third party.
Policy Type Age at closing LE used for closing
Paragraph 5.1 Lit. b Universal Life 47.4 Years 32.4 Months
Paragraph 5.1 Lit. d Joint Policy 83/85 Years Av. 66.5 Months
Paragraph 5.1 Lit. f
Universal Life
Universal Life
Universal Life
72.1 Years
75.0 Years
72.4 Years
23.0 Months
11.3 Months
21.6 Months
Paragraph 5.1 Lit. g
Other
Other
Other
Other
Other
Other
Other
Other
64.2 Years
65.7 Years
45.5 Years
59.4 Years
62.0 Years
75.9 Years
68.6 Years
59.2 Years
13.9 Months
33.6 Months
25.7 Months
10.8 Months
20.2 Months
56.9 Months
84.7 Months
10.2 Months
Foundation for data exclusion and
reporting
Excluded data

24
AAP LS Market Review – August 2011 © Copyright by AA-Partners Ltd. 2011
DISCLAIMER GLOBAL DISCLAIMER
This report has been prepared by and the opinions expressed are those of AA-Partners Ltd. as of the date of writing.
This report is for distribution only under such circumstances as may be permitted by applicable law. Nothing in this report constitutes a representation that any investment strategy or recommendation contained herein is suitable or appropriate to a recipient’s individual circumstances or otherwise constitutes a personal recommendation. It is published solely for information and illustration purposes and may not be relied on in any way. It does not constitute an advertisement and is not to be construed as a solicitation or an offer to buy or sell any securities or related financial instruments in any jurisdiction. No representation or warranty, either expressed or implied, is provided in relation to the accuracy, completeness or reliability of the information contained herein, nor is it intended to be a complete statement or summary of the securities, markets or developments referred to in the report. AA-Partners Ltd. does not undertake that investors will obtain profits, nor will it share with investors any investment profits nor accept any liability for any investment losses. Investments involve risks and the report should not be regarded by recipients as a substitute for the exercise of their own judgment. Any opinions expressed in this report are subject to change without notice and may differ or be contrary to opinions expressed by other market participants as a result of using different assumptions and criteria. AA-Partners Ltd. is under no obligation to update or keep current the information contained herein.
The securities described herein may not be eligible for sale in all jurisdictions or to certain categories of investors. Any reference to past performance is not necessarily a guide to the future. Foreign currency rates of exchange may adversely affect the value, price or income of any security or related instrument mentioned in this report. Neither AA-Partners Ltd. nor any of its directors, employees or agents accepts any liability for any loss or damage arising out of the use of all or any part of this report. AA-Partners Ltd. does not provide any legal or tax advice.
Issuers of the securities referred herein or AA-Partners Ltd. may have acted upon the information and analysis contained in this publication before being made available to recipients. AA-Partners Ltd. may, to the extent permitted by law, participate or invest in other financial transactions with issuers of the securities referred herein, perform services or solicit business from such issuers, and/or have a position or effect transactions in the securities or options thereof.
The disclosures contained in research reports produced by AA-Partners Ltd. shall be governed by and construed in accordance with Swiss law. The report is assigned to the use of the subscriber to this publication. AA-Partners Ltd. prohibits the redistribution of this material in whole or in part without the written permission of AA-Partners Ltd. to any other person or company or legal entity, and AA-Partners Ltd. accepts no liability whatsoever for the actions of third parties in this respect.