Univers
ity of
Cap
e Tow
n
A STUDY OF
IRON NUTRITION AND IMMUNITY IN INFANCY
Harold Michael Power
BSc (Hons) (Wits), MB BCh (Wits), DCH (SA)
A thesis submitted for the degree of
DOCTOR OF MEDICINE
UNIVERSITY OF CAPE TOWN
JANUARY 1988
f..,,_'K..,T<il.'1'\·"'"'·' •~:· .._ .".,., f. . r,.:th ,t. , ' ; v,,-;,...-~
! Tile Ur:'.er::ity ,Jf Cr ., T,· .. :ro !1:c;; bMn c:'vrm l k H .. ,- i to ··:·.~:. -'..1-::~ (:i$ !'~e·::~ in \·/,oia ~ r or 1n part. Cc;:,·1<;iht is r,.~:;, by tho .::uthor.j f---.v~r~-~;'{.~-~-,~·~'..; ...•. -.-.,,1y.:~·~ .... ~

Univers
ity of
Cap
e Tow
n
The copyright of this thesis vests in the author. No quotation from it or information derived from it is to be published without full acknowledgement of the source. The thesis is to be used for private study or non-commercial research purposes only.
Published by the University of Cape Town (UCT) in terms of the non-exclusive license granted to UCT by the author.

M""I (o 1-6. 4 P._?::, ~ 05 fotJ
8S,C{U-D

ABSTRACT
Motivation and study design
Iron deficiency is.a common condition in infancy, particularly in lower socio-economic groups. In Cape
Town it remains a~problem in spite of public health measures taken against it: a recent survey found a
prevalence of iron deficiency anaemia of 34% in healthy 1 year old term infants who had ready access
to a municipal health clinic where iron fortified milk formula is sold at subsidized·prices.
The consequences of iron deficiency extend beyond anaemia- to involve all organ systems including. the
immune system. Since Helen Mackay's report in 1928 of a striking decrease in incide~ of infection in
infants treated with iron, clinicians have assumed that iron deficiency predisposes to infection. Despite
· a sound theoretical basis for this belief, the clinical evidence for the assumption is poor as studies to
date have displayed methodological deficiencies.
On the other hand, iron is also essential for the growth of micro-organisms. As such, supplemental
iron may predispose to infection. Indeed there is much laboratory and clinical evidence to show that
excess iron can result in the recrudescence of quiescent infections and increase the virulence of newly
acquired infections. Thus, the competition between host and parasite may sometimes hinge on the
relative availability of iron and it has been speculated that excess iron in infant milk formula may
increase susceptibility to infectious diarrhoeal disease.
The problem addressed by this thesis was to determine the utility of increasing the level of iron
fortification of infant milk formula. Three questions were posed:
Does increasing the level of iron fortification of conventional infant milk f onnula
improve the iron nutrition of 11onnal infants fed on the fonnula?
Does increased iron fortification of infant milk f onnula alter immunity as reflected by
incidence of infection and laboratory tests of immune function?
Are there any hannful effects of increasing the quantity of iron in conventional inf ant
milk fonnula?
A double blind randomized trial was carried out in 1983 and 1984 to answer these questions. A group
of 149 healthy, well nourished infants from a lower socio-economic community of so called Cape
Coloureds were followed from the age of 3 months to 1 year. Half of the infants, the Control group,
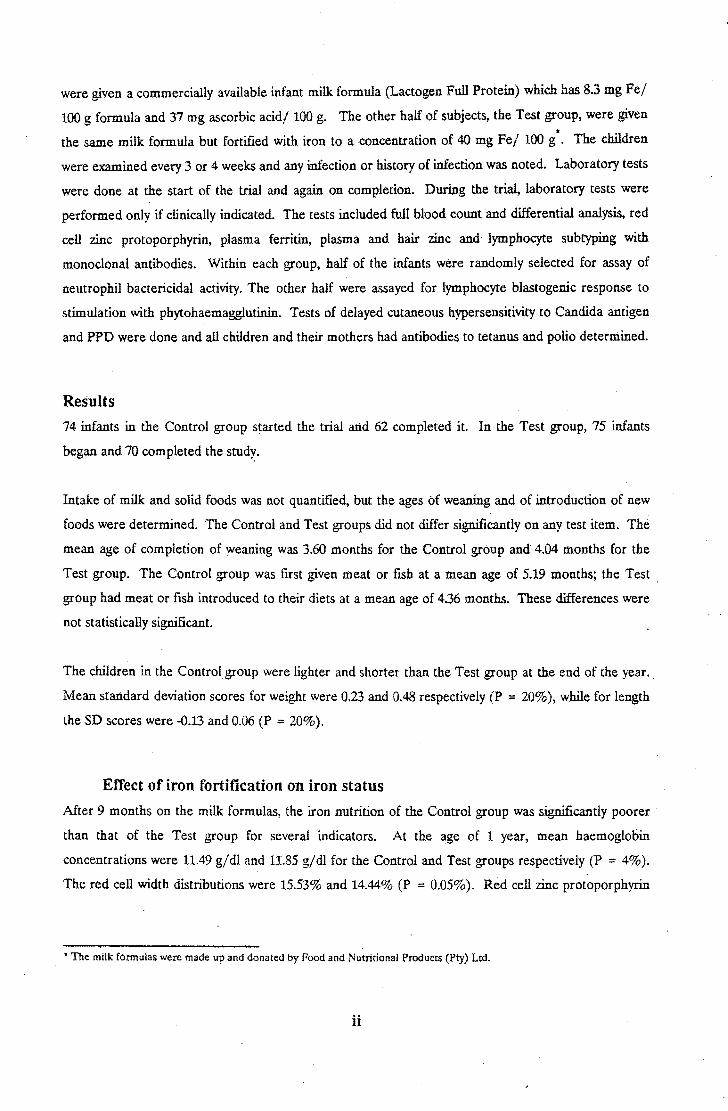
were given a commercially available infant milk formula (Lactogen Full Protein) which has 8.3 mg Fe/
100 g formula and 37 mg ascorbic acid/ 100 g. The other half of subjects, the Test group, were given
the same milk formula but fortified with iron to a concentration of 40 mg Fe/ 100 g·. The children
were examined every 3 or 4 weeks and any infection or history of infection was noted. Laboratory tests
were done at the start of the trial and again on completion. During the trial, laboratory tests were
performed only if clinically indicated. The tests included full blood count and differential analysis, red
cell zinc protoporphyrin, plasma ferritin, plasma and hair zinc and lymphocyte subtyping with
monoclonal antibodies. Within each group, half of the infants were randomly selected for assay of
neutrophil bactericidal activity. The other half were assayed for lymphocyte blastogenic response to
stimulation with phytohaemagglutinin. Tests of delayed cutaneous hypersensitivity to Candida antigen
and PPD were done and all children and their mothers had antibodies to tetanus and polio determined.
Results
74 infants in the Control group started the trial and 62 completed it. In the Test group, 75 infants
began and 70 completed the stud~.
Intake of milk and solid foods was not quantified, but the ages of weaning and of introduction of new
foods were determined. The Control and Test groups did not differ significantly on any test item. The
mean age of completion of weaning was 3.60 months for the Control group and 4.04 months for the
Test group. The Control group was first given meat or fish at a mean age of 5.19 months; the Test .
group had meat or fish introduced to their diets at a mean age of 4.36 months. These differences were
not statistically significant.
The children in the Control group were lighter and shorter than the Test group at the end of the year ..
Mean standard deviation scores for weight were 0.23 and 0.48 respectively (P = 20% ), while for length
the SD scores were -0.13 and 0.06 (P = 20% ).
Effect of iron fortification on iron status
After 9 months on the milk formulas, the iron nutrition of the Control group was significantly poorer
than that of the Test group for several indicators. At the age of 1 year, mean haemoglobin
concentrations were 11.49 g/dl and 11.85 g/dl for the Control and Test groups respectively (P = 4%).
The red cell width distributions were 15.53% and 14.44% (P = 0.05%). Red cell zinc protoporphyrin
. • The milk formulas were made up and donated by Food and Nutritional Products (Pty) Ltd.
ii

levels were 3.95 ug/dl and 3.41 ug/dl (P = 4%) and the geometric mean ferritin levels were 17.3 ug/dl
and 29.0 ug/dl for the 2 groups respectively (P = 0.04%).
Effect of iron fortification on incidence of infection and immune function
The results of the individual immune function tests did not differ significantly between the 2 groups.
Forty eight hours after the delayed cutaneous hypersensitivity tests the mean diameters of induration
were 8.05 mm and 7.03 mm (P = 43%) in the Mantoux test and 8.88 mm and 9.75 mm (P = 56%) in
the Candida test for the Control and Test groups respectively.
The geometric mean tetanus and polio antibody titres were 93 and 115 (P = 44%) and 35 and 47 (P = 16%).
Lymphocyte subtypes, ie B cells, total T cells, helper-inducer cells, suppressor-killer cells and
helper:suppressor cell ratio did not differ between the 2 groups.
The Control group responded less well than the Test group in the lymphocyte phytohaemagglutinin
stimulation test and in the bactericidal assay but the difference did not reach statistical significance. At
one year of age the PHA stimulation indices were 140% and 142% for the Control and Test groups
respectively. In the bactericidal assay, the percentage of the initial inoculum that survived at 1 hour
was 105% for the Control infants and 94% for the Test group.
The statistical power of the immune function tests was not higher than 24% and usually well below that
level.
The Control group had more infections than the Test group; an average of 6.42 infections per child per
year compared with 5.86. When incidence was considered in sub-categories, the Control infants had
more infections than the Test group for Minor, Moderate, and Severe infections as well as for
gastrointestinal infections, oral thrush, pyoderma, conjunctivitis and "other" infections. Only for
infections of the respiratory tract did the Control group have a lower incidence than the Test group.
No difference came close to reaching statistical significance and the power of the study to detect a real
difference equal to that observed was 18%. The 95% confidence interval for the difference in
incidence of all infections ranged from -1.61 infections per child per year to 0.49 infections per child per
year.
iii

Risks of iron fortification As zinc and iron compete for absorption it was expected that the Test group would have lower zinc
levels than the Control group. This was corroborated by both plasma and hair analyses. Plasma zinc
was 90.61 ug/dl in the Control group and 83.53 ug/dl in the Test group (P = 5%). Hair zinc
concentrations were 142 ug/g and 129 ug/g respectively (P = 54%).
Apart from the lower mean zinc levels in plasma and hair, the study found no evidence of possibly
harmful effects of iron supplementation. In particular, the Test group experienced a lower incidence of
diarrhoeal disease than the Control group.
Discussion and Recommendations
Possible confounding factors
The trial of the infant milk formula controlled rigorously for factors which have confounded the
interpretation of most previous studies of the role of iron in infection and immunity. The children were
selected on the grounds of good health and excellent nutrition. That they maintained this throughout
the study may be partly due to the milk formula which was granted to the families, and partly due to
the selection of children from better liome environments.
Possible confounding factors which may not have been controlled by the stratified allocation procedure
were indicated by non-significant trends in completion rate, weaning, and introduction of solid foods.
All these factors could weigh in the Test group's favour when considering indices of iron nutrition,
measures of immune function or risks of increased iron fortification.
However the weight that should be assigned to these possible confounding influences is limited by
several methodological weaknesses. In the subsidiary surveys, ages were calculated from the mother's
recollection of events and recorded in months rather than decimals of a year. Also, age of introduction
of a food item is likely to be a poor proxy for quantity of food ingested and it gives no indication
whether or not the food was consumed with milk formula.
Effect of iron fortification on iron status
The increased iron fortification was shown to improve the iron status of the Test group with statistically
significant differences for haemoglobin, red cell distribution width, plasma ferritin and red cell zinc
protoporphyrin. The absolute magnitude of the improvement in iron status was small, and the effect
may not be clinically important.
iv

Two related questions for further research arise from this aspect of the trial. Why did the Control
group not achieve an iron status equivalent to infants in similar trials overseas? And, why did the extra
iron fortification not produce a greater disparity in iron status between the 2 groups?
With regard to the first question it may be noted that nadequate intake of formula is unlikely as the
families were given generous quantities of milk and the children maintained excellent growth.
Increased loss of iron from chronic blood loss is an unlikely cause of the suboptimal iron status as
hookworm is uncommon in infants in the Western Cape and other causes of chronic blood loss are
rare. The most promising avenue for future research is the determination of the balance in the diet
between inhibitors and facilitators of iron absorption.
With regard to the second question, ie the failure of the Test group to achieve a large improvement in
iron status, one may speculate that similar factors were partly responsible. However, from previous
studies of iron absorption and the effect of ascorbic acid, it would have been expected that the
fortification program would have had a greater effect on the Test group than that observed.
Further studies are required to answer these questions and to provide quantitative data for planning
future trials. Specifically, the effect of ascorbic acid on the absorption of iron from cow's milk based
infant formula needs- to be measured at levels of iron fortification up to 40 mg Fe/100 g formula, and
measurements of percentage absorption from test meals need to be correlated in the same subjects
with response to long term programs of iron fortification.
Efforts to improve the iron status of normal infants in the community by fortification of infant formulas
should be based on results from such studies since the availability of extra iron added to conventional
infant formulas is so low. Certainly, cow's milk formulas should be fortified to a level of at least 8.3 mg
Fe/100 g and they should contain ascorbic acid in a molar ratio to iron of at least 1.4:1, and possibly as
high as 4:1.
Effect of iron fortification on incidence of infection and immune function
The results of the laboratory tests of immune function showed no statistically significant effect of the
increased quantity of iron in the milk. Correlations with iron status per se were inconclusive because of
the small difference in iron status between the Test and Control groups.
The results of the study of incidence of infection were similar. The increased iron fortification caused
no statistically significant change and correlations of iron status with infection rates were inconclusive
V

due to low statistical power. However, an intriguingly consistent pattern was apparent: children in the
Test group had fewer infections than those in the Control group in 8 of 9 categories of infections. The
Test group had almost 10% fewer infections than the Control group. This translates to a potential
saving of 56 infections per 100 infants per year.
Clearly then, trials to define the relation between iron status and immune function more precisely are
required since a possible public health benefit of this magnitude can not be ignored. The difficulties
such studies will have in attaining adequate statistical power must be noted. The present study was
designed to detect a difference in infection rates of 1 infection per child per year. The sample size
calculations yielded 65 as the minimum number required in each group, assuming that the standard
deviation of infection rate was 2.5. With the data from the present study it can be estimated that a
minimum of 230 infants would be required in each group to detect a difference of 0.59 in infection rates
with standard deviations of 2.8 and 3.3.
Besides increasing the number of subjects, steps to increase statistical power might include extending
the period of observation and increasing the disparity in iron status between control and test groups. It
will be particularly important to learn if there is a threshold level of iron status below which
susceptibility to infection is increased. The present study provides a hint that, if such a threshold exists,
it could be relatively high.
The mechanisms by which iron influences immune function require further ·clarification. It is unlikely
that stuc:lies utilizing current immune function tests and the design of the present trial can economically
reach adequate statistical power. New methods must be sought to address this question. For example,
the time course of repair of iron deficiency in moderate to severe cases could be correlated with the
change in immune function tests. But, measures to control for the confounding effects of infection and
malnutrition would need to be included.
Risks of iron fortification
The increased iron fortification was shown to be safe and, in particular, not to increase susceptibility to
diarrhoeal disease. It was associated with lower zinc levels, but there was no evidence that .this was
harmful.
Nevertheless, future studies of iron fortification should take care not to interfere with zinc absorption
since zinc deficiency has well known deleterious effects. The mo!~ ratio of iron to zinc should be
vi

maintained at about 2.8 mol Fe/mol Zn. And the effect of iron fortification on the absorption of other
divalent metallic ions should be monitored.
Conclusion
In conclusion, it may be stated that increasing the level of iron fortification of cow's milk infant milk
formula is not sufficiently effective in improving iron status to warrant a change in commercial practice.
But, the potential rewards of improved iron status are such that further studies should be undertaken
with increased fortification of iron, ascorbic acid and zinc.
vii

ACKNOWLEDGEMENTS This study was made possible by many people and institutions who assisted at various stages. I am
deeply appreciative of all the help I have been given.
Financial support for the project came from the Hilary and Dorothy Champion'Trust Fund and the
South African Medical Research Council.
Food and Nutritional Products (Pty) Ltd manufactured and donated the infant milk formula that was
used in the trial. I must thank Mr M Alcock for arranging this substantial donation and Mrs H Vidal
and Mr J Rich for their hard work in delivering the milk whenever it was required.
Prof H de V Heese, head of the DJvision of Paediatrics and Child Health of the University of Cape
Town, conceived the initial idea for the project and supervised its execution.
The Medical Superintendent of the Red Cross War Memorial Childrens Hospital, initially Dr JGL
Strauss, and now Dr RO Simpson, gave permission to conduct and publish this research.
Dr R Coogan, Cape Town's Medical Officer of Health, authorized the use of the facilities of the
municipal health clinic at Bonteheuwel. Dr NM Durcan, Deputy Medical Officer of Health, ensured
that our requirements could be met from the facilities at the clinic.
Sister M Brand and her staff at the clinic cooperated with the study team on a daily basis for almost 2
years.
The private practitioners of Bonteheuwel and nearby areas generously gave of their time to assist me in
documenting infections suffered by the study subjects.
The Medical Superintendents of the Red Cross War Memorial Childrens Hospital, Conradie Hospital,
Woodstock Hospital, New Somerset Hospital and of the Day Hospitals Organization authorized access
to medical records of the study subjects.
Professor JW Moodie and Drs GA Keen and JP McIntyre were responsible for the virological . .
investigations done in the Department of Medical Microbiology, University of Cape Town.
Bacteriological studies were performed in the Bacteriological Laboratory of the Red Cross War
Memorial Childrens Hospital with permission from Dr D Hanslo.
viii

Miss R Pearl and the Haematology Laboratory of the Red Cross War Memorial Childrens Hospital
processed the haematological analyses.
Biochemical analyses were done in the Research Laboratories of the Institute of Child Health,
University of Cape Town. Mr W Dempster, Chief Technician, and Mrs F Pocock performed the tests.
The immunological studies were done in the Research Laboratories of the Institute of Child Health.
ProfDW Beatty authorized the work which was performed under the supervision of Miss EJ Hughes.
Earlier drafts of portions of this thesis have been read and criticized by Prof DW Beatty, Prof H de V
Heese, Prof P Lanzkowsky, Prof M Mann, Dr CJ Molteno, Dr P Roux and L Vuataz. I am grateful for
their advice and suggestions. The flaws in the fmal document are, of course, my own responsibility.
The secretarial staff on the fifth floor of the Institute of Child Health have all played a willing part in
compiling the documentation for this thesis. Mrs L Makepeace ably managed the financial aspects of
the project.
In producing the final document I was able to exploit the latest desktop printing technology through the
courtesy of Dr JC Stegmann who made available the laser printer in his office.
Support on a personal and intellectual level has been provided by Prof H de V Hees~ throughout the
study. This thesis would not have been completed without the freedom I was granted to pursue my
interests, nor without the guidance that was given whenever I required it.
An especial 17iank you is due to Mrs D Phillips who was my research assistant in the first 2 years. She
shared many early mornings and late afternoons and was· a constant cheerful source of encouragement,
not only to me, but to our study subjects as well.
My colleagues at work have, for the final stages of the thesis, willingly tolerated me putting their
interests below the completion of this document. I must thank them for their patience.
Finally, I must thank Lynn, my wife, for seeing this project through with me.
ix


Dedicated to the 149 children of Bonteheuwel who were my study subjects.


-
TABLE OF CONTENTS
CHAPTER 1 INTRODUCTION Prevalence of iron deficiency Iron deficiency in the Western Cape Consequences of iron deficiency Iron and immune function Motivation for the study Aims of the study
1. Trial of increased iron fortification of infant formula 2. Infant Feeding Practices
Methods employed 1. Trial of increased iron fortification of infant formula 2. Infant Feeding Practices
Structure of the thesis
CHAPTER 2 LITERATURE REVIEW Introduction
The area surveyed The goals of the review Criteria for assessment of studies and literature review The methods used in the literature survey Evaluation of methods
Epidemiology of iron deficiency Difficulties in comparing studies
Intrinsic biological variability Variation between and within laboratory methods The method of specimen collection Developmental changes Sex Race Nutrition Infection and inflammation Socio-economic class Altitude Diagnostic criteria
Prevalence of iron deficiency - International studies Estimating iron deficiency from low haemoglobin levels
Prevalence of iron deficiency - Cape Peninsula Lanzkowsky (1960) Robertson and Sundgren (1972) Kirsten et al (1984) Summary
Physiology of iron Iron balance
Absorption Transport and storage Losses Growth Homeostasis
Biochemical functions of iron - The immune system Polyrnorphonuclear leukocytes and phagocytes Band T lymphocytes
Biochemical functions of iron - Other systems
xi
1.1 1.1 1.1 1.1 1.2 1.2 1.2 1.2 1.3 1.3 1.3 1.3
2.1 2.1 2.2 2.2 2.3 2.3 2.4 2.4 2.4 2.4 2.5 2.5 2.5 2.5 2.5, 2.5 2.5 2.6 2.6 2.6 2.6 2.9 2.9 2.9 2.9
2.10 2.11 2.11 2.11 2.11 2.12 2.12 2.12 2.13 2.13 2.14 2.14

TABLE OF CONTENTS
Iron dependency of micro-organisms Introduction Bacterial growth - Iron & iron binding products Bacterial virulence - Effect on pathogen Bacterial virulence - Effect on host Bacterial virulence - Effect on bacterial secondary metabolism Fungal requirements for iron Protozoa! requirements for iron Summary
Pathophysiology of iron deficiency Non-immunological effects
Iron deficiency - Blood and bone marrow Iron deficiency - Gastrointestinal tract Iron deficiency - Cardiovascular system Iron deficiency - Skin and mucous membranes Iron deficiency - Musculo-skeletal system Iron deficiency - Behaviour
Introduction Note on the definition of behaviour Biochemical studies Animal studies of behaviour Studies of behaviour in adults, adolescents & children Studies of behaviour in infants Summary
Iron deficiency - Other tissues Pathophysiology of iron deficiency
Immunological effects Interactions - Nutrition, infection, immunity
Nutrition and immune function Infection and immune function Infection and nutrition
Host control of available iron Iron deficiency and laboratory tests of immune function
Iron deficiency and humoral immunity Immunoglobulin production - Non-specific Immunoglobulin production - Specific B cell function The roles of T cells and mactophages in antibody production Complement Summary and conclusions
Iron deficiency and T cell function T cell absolute number & proportion of lymphocytes Lymphocyte blastogenic stimulation Lymphokine production Cytolysis Delayed cutaneous hypersensitivity Summary and conclusions
Iron deficiency and polymorphonuclear leukocyte function Opsonic activity Phagocytosis Killing activity Chemotaxis Leukocyte alkaline phosphatase Hexose monophosphate shunt activity
xii
2.16 2.16 2.17 2.17 2.18 2.18 2.18 2.18 2.18
2.19 2.19 2.20 2.21 2.21 2.21 2.21 2.21 2.21 2.22 2.23 2.23 2.23 2.25 2.29
2.29 2.29 2.29 2.30 2.30 2.30 2.31 2.31 2.31 2.32 2.32 2.33 2.33 2.33 2.34 2.34 2.35 2.36 2.36 2.37 2.37 2.39 2.39 2.40 2.40 2.41 2.41 2.42

TABLE OF CONTENTS
NBT reduction 2.42 Myeloperoxidase activity 2.43 Catalase activity 2.43 Summary and conclusions 2.44
Iron deficiency and lymphoid tissue 2.45 White blood cells 2.45 Bone marrow 2.45 Spleen 2.46 Thymus 2.46 Summary and conclusions - Lymphoid tissue in iron deficiency 2.48
Iron as a modulator of immune function 2.49 Iron status and infection - Animal studies 2.50 Iron status and infection - Clinical studies 2.58
Introduction 2.58 Iron excess and susceptibility to infection 2.60
Introduction 2.61 K washiorkor 2.61
McFarlane et al (1970) 2.61 Urinary tract infection 2.62
Briggs (1963) 2.62 Scott (1962) 2.62 Scott (1963) 2.62
Neonatal septicaemia 2.63 Barry, Reeve (1973, 1976, 1977) 2.63
Tropical infections 2.63 Byles, D'Sa (1970) 2.63 Murray et al (1975) 2.64 Murray et al (19781) 2.64 Murray et al (19782) 2.65 Oppenheimer et al (1986) 2.65
Y ersinia enterocolitica 2.65 Melby et al (1982) 2.65 Mofenson (1987) 2.66 Robins-Browne et al (1983) 2.66
Summary 2.66 Iron deficiency and susceptibility to infection 2.67
Introduction 2.67 Evidence for iron deficiency protecting against infection 2.68
Malaria and other Tropical infections 2.68 Retrospective or prevalence studies 2.68
Masawe et al (1974) 2.68 Masawe and Swai (1975) 2.68 Murray et al (1978) 2.69
Prospective, controlled studies 2.69 Murray et al (1980) 2.69 Oppenheimer et al (1986) 2.69
Evidence against the promotion of infection by iron deficiency 2.71 Candidiasis 2.71
Studies with anecdotal reports 2.71 Jacobs et al (1973) 2.71
Retrospective or prevalence studies 2.71 Walker et al (1973) 2.71
Adults 2.71 Prospective, controlled studies 2.71
Xiii·

TABLE OF CONTENTS
Vellar et al (1974) Infants
Studies with anecdotal reports Marsh et al (1959) Farquhar (1963) Malakhovsky Yu E et al (1983)
Prospective, controlled studies Burman (1972)
Evidence for the promotion of infection by iron deficiency Herpes labialis
Studies with anecdotal reports Chandra et al (1977)
Candidiasis Studies with anecdotal reports
Cawson (1963) Retrospective- or prevalence studies
Rose (1968) Higgs and Wells (1972) Davidson et al (1977) Jenkins et al (1977)
Prospective, controlled studies Fletcher (1975) Higgs and Wells (1972)
Adults Studies with anecdotal reports
Basta and Churchill (1974) Retrospective or prevalence studies
Basta et al (1979) Giles et al (1962) Abramson et al (1971) Savage et al (1967)
Prospective, controlled studies Basta et al (1979)
Infants Studies with anecdotal reports
Tonkin (1970) Howell (1972) Dallman (1981) Heimendinger and Undritz (1955) Lovric (1970) Moe (1963) Salmi et al (1963) Shaw and Robertson (1964) Stekel (1981) Werkman et al (1964)
Retrospective or prevalence studies Fortuine (1966) Fuerth (1971) Oppenheimer (1980) Reeves et al (1984) Bondestarn et al (1985)
Studies with multiple independent variables Arbeter et al (1971) Jacobs and George (1952)
xiv
2.71 · 2.73 2.73 2.73 2.74 2.74 2.74 2.74 2.76 2.76 2.76 2.76 2.77 2.77 2.77 2.77 2.77 2.77 2.77 2.78 2.78 2.78 2.78 2.79 2.79 2.79 2.79 2.79 2.80 2.80 2.80 2.81 2.81 2.84 2.84 2.84 2.85 2.85 2.85 2.85 2.85 2.85 2.86 2.86 2.86 2.86 2.86 2.87 2.87 2.87 2.88 2.89 2.89 2.89.

TABLE OF CONTENTS
Karp and Merz (1986) 2.90 Prospective, controlled studies 2.91
Mackay (1928) 2.91 James and Combes (1960) 2.93 Andelman and Sered (1965) 2.95 Cantwell (1972) 2.97
Summary and Conclusions 2.99 Classification and diagnosis of iron deficiency 2.104 Prevention of iron deficiency
Iron supplementation and fortification 2.106 Public health programs to combat iron deficiency 2.106 Technological issues in fortification of food with iron 2.106
Vehicles for iron fortification in infancy 2.106 Sources of iron for fortification 2.107
Factors influencing the absorption of iron 2.107 Chemical properties of iron that affect its bioavailability 2.107
Oxidation states 2.107 Solubility 2.107 Formation of complexes 2.108
Facilitators and inhibitors of iron absorption 2.108 Iron absorption from infant milk formulas 2.109
Measurement of food iron absorption 2.109 Studies of iron absorption from cow's milk infant formulas 2.110
Trials of iron fortified infant milk formulas 2.111 Risks of iron fortification 2.115
Risk of infection 2.115 Risk of decreased absorption of zinc and other metals 2.115 Risk of iron overload 2.116 Risk of anaemia in vitamin E deficiency 2.116 Risk of gastrointestinal symptoms 2.116
Conclusions 2.116
CHAPTER 3 STUDY DESIGN, METHODS AND1\1ATERIALS Introduction , 3.1 The problem addressed by the study 3.1 Study design • Iron fortification trial 3.2
Acknowledgements 3.2 Protocol 3.2 Eligibility criteria 3.3 Ascertainment 3.3 Control and Test group allocation and "blinding" 3.4 Exclusions and drop-outs 3.4 Study size 3.4 Reason for fortification as an intervention strategy 3.5 Reason for infant milk formula as vehicle 3.6 Reason for ferrous sulfate as fortificant 3.7 Reason for choosing 8.3 mg Fe/lOOg as the level of fortification for the Control
group 3.7 (a) Ethical considerations 3.7 (b) Considerations of ability to generalize conclusions 3.8 (c) Estimations of effect on iron status 3.8
(i) Experience in Cape Town 3.8 (ii) Similar international studies 3.8
xv

'\
TABLE OF CONTENTS
(iii) Effects of genetic, socio-economic class and cultural factors Reasons for choosing 40 mg Fe/lOOg as the level of fortification for the Test
group and not altering the concentration of ascorbic acid. (a) Optimal iron status (b) Considerations of iron absorption and ascorbic acid
(i) Recommendations of the World Health Organization (ii) Data on the association of ascorbic acid
with iron absorption (iii) Prediction of % iron absorption from regression analysis (iv) Estimation of iron absorption from
comparison with therapy (v) Calculation of% iron absorption from target iron status (vi) Consideration of effect of ferrous sulfate on milk formula (vii) Number of experimental variables and interpretation of
results Quantity of milk provided for inf ants Reasons for entry at 3 months Reasons for follow up period of 9 months Selection of laboratory tests
(i) Volume of blood (ii) Measures of iron status (iii) Measures of immune function (iv) Measures of viral carriage rate (v) Sociological characterization
Project team Study Design - Social survey of participating families
Introduction Acknowledgements Protocol
Study Design - Survey of infant feeding practices Ethical Considerations
Introduction Research and Ethics Committee approval Parental consent The promotion of breast feeding Potential side effects of iron fortification
Increased susceptibility to infection Decreased zinc absorption Gastrointestinal symptoms Anaemia Iron overload
Painful procedures and blood sampling in infants Treatment of Iron Deficient Infants
Clinical methods and data collection Age Weight
Standard deviation score for weight Length
Standard deviation score for length Skull circumference Diagnosis of infection
Ascertainment of episodes of infection Diagnosis Grading of infection
xvi
3.9
3.9 3.9 3.9 3.9
3.10 3.13 ' '
3.14 3.14 3.14
3.15 3.15 3.16 3.16 3.16 3.16 3.16 3.18 3.19 3.19 3.19 3.20 3.20 3.20 3.20 3.21 3.21 3.21 3.22 3.22 3.22 3.22 3.22 3.23 3.23 3.23 3.23 3.23 3.24 3.25 3.25 3.25 3.25 3.25 3.25 3.26 3.26 3.26 3.27 3.28

TABLE OF CONTENTS
Grouping of infection 3.28 Potential Problems in determining infection rates 3.28
Problem - Multiple doctors 3.28 Problem - Non-infectious conditions which may be confused with
infectious disease. 3.29 Problem - Multiple consultations for the same infection 3.29 Problem - Multiple simultaneous infections 3.29 Problem - Prolonged infections and recurrent infections 3.29 Problem - Parents with different care-seeking behaviour 3.29
Weaning 3.30 Laboratory methods 3.31
Specimen collection and storage 3.31 Blood 3.31 Hair 3.31 Bacterial and fungal cultures 3.31 Yiral specimens 3.31
Haematology 3.32 Full blood count 3.32 Differential count 3.32
Biochemistry 3.32 Red cell zinc protoporphyrin 3.32 Plasma ferritin 3.32 Plasma zinc 3.34 Hair zinc 3.34
. Microbiology 3.34 Bacterial and fungal characterization 3.34 Viral characterization 3.34
Immunological methods 3.34 Materials and laboratory reagents used in more than one assay. 3.34
Microtiter equipment 3.34 Reagents 3.35
Tetanus antibody titration 3.35 Materials 3.35 Tanning and coating of red cells 3.36 Titration 3.36
Polio antibody titration 3.36 Materials 3.36 Polio virus antibody titration 3.38
Lymphocyte subtyping 3.39 Lymphocyte transformation by stimulation with PHA 3.40 Neutrophil phagocytosis and killing activity 3.40
Preparation of neutrophils 3.40 Staphylococcus aureus 3.41 Controls 3.41 Phagocytosis and bactericidal assay 3.41
Skin tests of delayed hypersensitivity . 3.42 Mantoux test 3.42 Candida antigen test 3.42
Record keeping and statistical analysis 3.43 Record keeping 3.43 Data processing 3.43 Statistical analysis 3.43
Computer programs employed 3.43 Missing data 3.43
xvii

TABLE OF CONTENTS
Calculation of confidence intervals and type II errors Significance levels Reporting of results
CHAPTER 4 THE COMl\ffiNI'IY OF BONTEHEUWEL Introduction Personal impressions
Housing Measures of crowding of accommodation Measures of care of study subjects Measures of family stability and unity Measures of economic status Measures of age and educational attainments of parents
CHAPTER 5 RESULTS: INFANT FEEDING HABITS Introduction Studies made
Introduction Ascertainment and Survey Construction Acknowledgements Methodological Cautionary Note.
Results Age of weaning off breast Prevalence of breast feeding in Bonteheuwel Reasons for cessation of breast feeding
Conclusions
CHAPTER 6 RESULTS: IRON FORTIFICATION Introduction Statistical methods
Introduction Graphical representation of numerical results Comparison of changes
Validity of the Control group (Comparison of Test and Control groups at 3 months)
Rationale Methodology Statistical tests for equivalence Iron status Participation rate and gender Specimen collection rates Temporal comparisons
Age related changes (Comparison of results at 3 and 12 months)
Study children - Feeding practices Breast feeding
Results Solid foods
Introduction Results
Discussion
xviii
3.44 3.44 3.44
4.1 4.1 4.3 4.4
4.10 4.14 4.18 4.24
5.1 5.1 5.1 5.2 5.2 5.2
5.3 5.5 5.7 5.9
6.1 6.1 6.1 6.1 6.1
6.2 6.2 6.2 6.2 6.3 6.4 6.5 6.6
6.7 6.7 6.7 6.7 6.8 6.8 6.8 6.8

TABLE OF CONTENTS
Conclusions and recommendations 6.9 The effect of increased iron fortification of milk forn1ula on iron status
(Comparison of Test and Control groups at 12 months) 6.10 Introduction 6.10 Comparison with reference levels for haematological indicators of iron status 6.16 Comparison with epidemiological surveys of haematological indicators of iron
status 6.19 Comparison with other trials of iron fortification for haematological indicators of
iron status 6.21 Assessment of achievements of the trial with respect to iron nutrition 6.22
The effect of increased iron fortification of milk formula on immune function 6.24 Introduction 6.24 Delayed cutaneous hypersensitivity 6.24
Introduction 6.24 Results 6.24 Discussion 6.28 Comparison with previous studies 6.29 Summary and conclusions 6.30
Specific antibody response to immunization 6.31 Introduction 631 Statistical note 6.31 Results 6.31 Comparison with previous studies 6.33 Summary 6.34
Leukocyte counts 6.35 Results 6.35 Discussion 6.37
Lymphocyte subtypes 6.38 Introduction 6.38 Results 6.38 Discussion 6.38
Lymphocyte stimulation with phytohaemagglutinin 6.41 Introduction 6.41 Results 6.41 Discussion 6.42 Comparison with previous studies 6.42
Neutrophil bactericidal indices 6.43 Introduction 6.43 Results 6.43 Discussion 6.44 Comparison with previous studies 6.44 Conclusion 6.45
Viral survey 6.46 Introduction 6.46 Results 6.46 Discussion 6.46
Incidence of infection 6.47 Introduction 6.47 Results 6.47 Comparison with previous studies 6.53 Conclusions 6.54
Summary of results of immune function tests 6.55 The association of iron status with immune function tests
(Multivariate analyses) 6.56
xix

TABLE OF CONTENTS
Classification of iron status Introduction The method of classification Categories of iron status
Association of iron status with immune function Introduction Incidence of infection - Normal iron status Incidence of infection - Normochromic normocytic group Incidence of infection
Comparison between between categories of iron status Tests of immune function
Comparison between categories of iron status Measures of iron nutrition
Comparison between between categories of iron status Multiple linear regression Summary Discussion and conclusions
Risks of increased iron fortification of milk formula Introduction Indicators of zinc status
Results Discussion
Measures of growth and nutrition Results Discussion
Discussion and conclusions
CHAPTER 7 CONCLUSIONS AND RECOMMENDATIONS Introduction The effect of increased iron fortification on iron status The effect of increased iron fortification on immunity Risks of increased iron fortification of infant milk formula Epidemiological conclusions Summary of contributions Conclusion
APPENDICES APPENDIX 1- Dropouts from the study APPENDIX 2 - Research and Ethics Committee Approval APPENDIX 3 - Tables of Statistical analyses APPENDIX 4 - Composition of Control and Test milk formulas APPENDIX 5 - Programs APPENDIX 6 - Forms for consent and data collection
BIBLIOGRAPHY
xx
6.56 6.56
. 6.56
6.56 6.58. 6.58 6.58 6.59
6.59
6.63
6.63 6.66 6.69 6.69 6.70 6.70 6.70 6.70 6.73 6.74 6.74 6.77 6.77
7.1 7.2 7.4 7.5 7.5 7.6 7.7

INDEX OF TABLES
CHAPTER 2 LITERATURE REVIEW Table 2.1 Table 2.2 Table 2.3 Table 2.4 Table 2.5 Table 2.6
Table 2.7 Table 2.8 Table 2.9 Table 2.10 Table 2.11 Table 2.12 Table 2.13 Table 2.14 Table 2.15 Table 2.16
Surveys of anaemia in infancy Haematological reference values for infants Distribution of iron compounds in normal adult humans Function of iron compounds in normal humans Behavioural associations with iron status. Iron status.and immune function: Immunoglobulin and complement levels Response to immunization in iron deficiency T Lymphocyte stimulation tests in iron deficiency Delayed cutaneous hypersensitivity in iron deficiency Neutrophil and macrophage stimulation tests in iron deficiency Leukocyte counts and morphology in iron deficiency Biochemical and morphological studies in iron deficiency Iron status and infection - Animal Studies Iron treatment and upper respiratory infections Iron status and infection - Human Studies Studies of iron fortification of cow's milk based infant milk formula
CHAPTER 3 STUDY DESIGN, METHODS AND MATERIALS Table 3.1 Iron absorption from infant milk formulas Table 3.2 Prediction of iron absorption from regression analysis
CHAPTER 4 THE COMMUNITY OF BONTEHEUWEL Table 4.1 Table'4.2 Table 4.3 Table 4.4 Table 4.5 Table 4.6 Table 4.7 Table 4.8 Table 4.9 Table 4.10 Table 4.11 Table 4.12 Table 4.13 Table 4.14 Table 4.15
·Table 4.16 Table 4.17 Table 4.18 Table 4:19
Type of housing Living conditions Number of rooms used for sleeping Lodging arrangements Number of adults in the houses Number of siblings Caretaker Standards of hygiene employed in the homes of study families Care-seeking Marital status Changes in mothers' marital status Cohabitation Mothers' occupation Fathers' occupation Sources of income· Regularity of income Presence of television sets Age of parents Education of parents
CHAPTER 5 RESULTS: INFANT FEEDING HABITS
2.8 2.10 2.14 2.15 2.26 ·
2.33 2.34 2.38 2.39 2.44 2.47 2.48 2.52 2.72
2.101 2.114
3.11 3.13
4.3 4.5 4.6 4.7 ~ 4.8 4.9
4.11 4.12 4.13 4.15 4.16 4.17 4.19 4.20 4.21 4.22 4.23 4.24 4.25
Table 5.1 Age at which infants are first offered milk formula 5.4 Table 5.2 Prevalence of breast, formula and combined breast and formula feeding in
Bonteheuwel · 5.6 Table 5.3 Reasons for stopping breast feeding 5.8
xxi

INDEX OF TABLES
CHAPTER 6 RESULTS: IRON FORTIFICATION Table 6.1 Iron status at 3 months of age Table 6.2 Participation and Gender Table 63 Temporal variations . Table 6.4 Breast feeding Table 6.5 Age of introduction to solid foods Table 6.6 Haematological indicators of iron status at the start of the trial. Table 6.7 Haematological indicators of iron status at the end of the trial. Table 6.8 Non-haematological indicators of iron status Table 6.9 Reference standards for haematological parameters Table 6.10 Epidemiological surveys of haematological parameters Table 6.11 Haematological parameters from other trials of fortification of cow's milk
based infant formula Table 6.12 Table 6.13 Table 6.14.
Table 6.15 Table 6.16 Table 6.17 Table 6.18 Table 6.19 Table 6.20 Table 6.21 Table 6.22 Table 6.23 Table 6.24 Table 6.25 Table 6.26 Table 6.27 Table 6.28 Table 6.29
Table 6.30
Table 6.31
Table 6.32
Table 6.33
Table 6.34
Table 6.36 Table 6.37
Delayed cutaneous hypersensitivity mean diameters of reaction Delayed cutaneous hypersensitivity response rates Mantoux reaction compared between the present study groups and other studies Specific antibody responses to immunization White cell counts Lymphocyte subtypes Lymphocyte stimulation with phytohaemagglutinin Neutrophil bactericidal indices Virus isolation rates Numbers of infections Incidence of infection Statistical power Reference values used in the classification of iron status Criteria for the classification of iron status Incidence of infection by severity according to the category of iron statns Incidence of infection by type according to the category of iron status Immune function indicators compared between categories of iron status Mean values of haematologic parameters compared between the categories of iron status. Non-haematologic indicators of iron status compared between the categories of iron status. Multiple linear regression (MLR) analysis of association of iron status with incidence of infection Multiple linear regression (MLR) analysis of association of iron status with indicators of immune function Trends shown by the multiple linear regression analyses (MLR) in table 6.31 Trends shown by the multiple linear regression analyses (MLR) in table 6.32 Zinc status Nutritional status and growth
CHAPTER 7 CONCLUSIONS AND RECOMMENDATIONS Table 7.1 Absorption of iron in Control and Test groups
xxii
6.3 6.5 6.6 6.7 6.8
6.11 6.12 6.14 6.18 6.20
6.21 6.25 6.26
6.29 6.32 6.35 6.39 6.41 6.43 6.46 6.48 6.49 6.50 6.57 6.58 6.60 6.61 6.62
6.64
6.65
6.67
6.68
6.68
6.69 6.71 6.75
7.3

Figure 6.18 Figure 6.19 Figure 6.20 Figure 6.21 Figure 6.22
INDEX OF FIGURES
Difference in incidence of types of infection Plasma zinc concentrations Hair zinc concentrations Mean weight standard deviation scores Mean length standard deviation scores
xxiv
6.52 6.72 6.72 6.76 6.76

INDEX OF FIGlJRES
CHAPTER 2 LITERATURE REVIEW Figure 2.1 Mean morbidity scores and prevalence of infection in Indonesian workers 2.83
CHAPTER 3 STUDY DESIGN, METHODS AND .MATERIALS Figure 3.1 The relation between percentage iron absorptipn and molar ratio of ascorbic
acid to iron in infant rnilk formulas 3.12
CHAPTER 4 THE COMMUNITY OF BONTEHEUWEL Figure 4.1 Figure 4.2 Figure 4.3 Figure 4.4 Figure 4.5 Figure 4.6 Figure 4.7 Figure 4.8 , Figure 4.9 Figure 4.10 Figure 4.11 Figure 4.12 Figure 4.13 Figure 4.14 Figure 4.15 Figure 4.16 Figure 4.17 Figure 4.18 Figure 4.19
Type of housing Living conditions Number of rooms used for sleeping Lodging arrangements Number of adults in the house Number of siblings Caretaker Hygiene Care-seeking Marital status of mother Changes in mothers' marital status Cohabitation Mothers' occupation Fathers' occupations Sources of income Regularity of income Presence of television sets Age of parents Education of parents
CHAPTER 5 RESULTS: INFANT FEEDING HABITS Figure 5.1 Figure 5.2 Figure 5.3
Age at which infants are first offered milk formula Prevalence of exclusive breast feeding in the first year of life. Reasons for stopping breast feeding
CHAPTER 6 RESULTS: IRON FORTIFICATION Figure 6.1 Figure 6.2 Figure 6.3 Figure 6.4 Figure 6.5 Figure 6.6 Figure 6.7 Figure 6.8 Figure 6.9 Figure 6.10 Figure 6.11 Figure 6.12 Figure 6.13 Figure6.14
· Figure 6.15 Figure 6.16 Figure 6.17
Mean haemoglobin concentrations Mean red cell volume distribution widths Mean zinc protoporphyrin levels Log(ferritin) Candida test of delayed cutaneous hypersensitivity Mantoux test Log(tetanus antibody titre) Log(polio antibody titre) White cell counts Lymphocyte counts B lymphocyte counts T helper /suppressor ratios Lymphocyte responses to stimulation with phytohaemagglutinin Neutrophil bactericidal indices Incidence of grades of infection Incidence of types of infection Difference in incidence of grades of infection
xxiii
4.3 4.5 4.6 4.7 4.8 4.9
4.11 4.12 4.13 4.15 4.16 4.17 4.19 4.20 4.21 4.22 4.23 4.24 4.25.
5.4 5.7 5.8
6.13 6.13 6.15 6.15 6.27 6.27 6.32 6.33 6.36 6.36 6.40 6.40 6.42 6.44 6.51 6.51 6.52

And as a multitude of laws often only hampers justice, so
that a state is best governed when, with few laws, these are rigidly
administered; in like manner, instead of the great number of
precepts of which logic is composed, I believed that the four
following would prove perfectly sufficient for me, provided I took
the firm and unwavering resolution never in a single instance to
fail in observing them.
The first was never to accept anything for true which I did not
clearly know to be such; that is to say, carefully to avoid ~
precipitancy and prejudice, and to comprise nothing more in my
judgment than what was presented to my mind so clearly and
distinctly as to exclude all grounds of doubt.
The second, to divide each of the difficulties under
examination into as many parts as possible, and as might be
necessary for its adequate solution.
The third, to conduct my thoughts in such order that, by
commencing with objects the simplest and easiest to know, I
might ascend little by little, and as it were, step by step, to the
knowledge of the more complex; assigning in thought a certain
order even to those objects which in their own nature do not stand
in a relation of antecedence and sequence.
And the last, in every case to make enumerations so
complete, and reviews so general, that I might be assured that
nothing was omitted
Rene Descartes
A discourse on method
AD 1637


CHAPTER 1 INTRODUCTION
Prevalence of iron deficiency
Nutritional iron deficiency is common m infancy in both affluent and poor societies. Accurate
assessment of the extent of iron deficiency is difficult because diagnostic criteria often differ from study
to study. Nevertheless, it is the most common single nutrient deficiency and by far the most common
cause of anaemia in infancy.
Iron deficiency in the Western Cape
Surveys of infants in the Western Cape have shown the prevalence of iron deficiency anaemia to range
from 55% in the 1960's to 34% in the 1980's. Studies in other countries in similar communities have
not differed greatly from this order of magnitude. But the prevalence of the condition does vary from
population to population depending on a number of factors. The maximum prevalence is between 10
and 15 months of age when the child is growing most rapidly. Besides direct nutritional influences, the
most important correlate with iron deficiency in infancy is socio-economic class; race and sex are much
· less important determinants.
Consequences of iron deficiency
The consequences of iron deficiency obviously depend on the severity of the disorder and are by no
means limited to anaemia and its effects. The systemic manifestations of iron deficiency include:
anorexia, malabsorption, loss of weight, impaired physical perfonnance and, in severe anaemia (with
haemoglobin less than 4 g/dl), heart failure. Behavioral changes have been attributed to iron
deficiency - even in the absence of anaemia.
Iron and immune function
Of special interest for the present study are the observations linking iron deficiency with impaired
immune function and increased susceptibility to infection. In 1928 Helen Mackay, a leading London
paediatrician, published the first evidence implicating iron deficiency with an increased incidence of
infection. Her results were striking, but subject to criticism on methodological grounds. Although
. several clinical trials have since been made and many laboratory experiments have been performed
there is still controversy over the putative link between iron and immunity. And there is also evidence
to suggest that iron therapy may exacerbate infections, or increase susceptibility to malaria and perhaps
other infections. On balance, the case against iron therapy is not strong and no studies have shown any
increased risk of infection from the quantities of iron used to fortify infant milk formulas.

1.2 IRON NUTRITION AND IMMUNITY
Motivation for the study
In view of its high prevalence and the wide spectrum of its consequences, iron deficiency would seem to
be a key target for preventative public health measures.
An effective method of preventing nutritional iron deficiency in infancy is the fortification of infant milk
formulas with iron. Infant milk formula is a convenient vehicle for iron fortification in Cape Town
since dried milk powder is provided by the City Council at subsidized prices to families with young
children. A recent survey in Heideveld, a lower socio-economic community in Cape Town of so called
Cape Coloureds, found a prevalence of iron deficiency anaemia of 34%(267). This was in healthy 1 year
old full term infants who had ready access to the municipal clinic where milk formula fortified with iron
and ascorbic acid is sold at subsidized prices.
From the foregoing it may be seen that iron deficiency is a common problem in infants in Cape Town
and that the efficacy of current public health measures leaves substantial i:oom for improvement.
Aims of the study
1. Trial of increased iron fortification of infant formula
The problem addressed by this thesis was to determine the utility of increasing the level of iron
fortification of infant milk formula. Three specific questions were posed:
Does increasing the level of iron fortification of conventional infant milk formula
improve the iron nutrition of normal infants fed on the formula?
Does increased iron fortification of infant milk f onnula alter immunity as reflected by
incidence of infection and laboratory tests of immune function?
Are there any harmful effects of increasing the quantity of iron in conventional infant
milk formula?
2. Infant Feeding Practices
The principal study provided the opportunity for a survey to be made of feeding practices. The
purpose of the feeding survey was to compare practices before and after the trial in order to document
any effect that the trial itself may have had on the customs of mothers in the community.

CHAPTER 1 INTRODUCTION AND SUMMARY 1.3
. Methods employed
1. Trial of increased iron fortification of infant formula
A group of infants from a lower socio-economic community of so called Cape Coloureds was studied
from the age of 3 months to 1 year. Half of the children, the Control group, were given a popular
infant milk formula (Lactogen Full Protein) which contains 8.3 mg Fe per 100 g powder and 37 mg
ascorbic acid per 100 g powder. The other half, the Test group, were given, in a double blind manner,
the same formula fortified with 40 mg Fe per 100 g. At the beginning and at the end of the study tests
were made of iron status and immune function. During the study the children were examined every 3
weeks in an attempt to document every infection as accurately as possible. The children were selected·
from a lower socioeconomic community in Cape Town, and, in order to obviate the confounding
effects of malnutrition or severe illness, the infants were carefully screened to ensure that only healthy,
well nourished children participated in the trial.
2. Infant Feeding Practices
Infant feeding practices were surveyed in the community before the trial began and again 9 months
later when the trial was well under way and every mother attending the clinic was aware of it. The
feeding practices of the mothers participating in the trial were also documented for comparative
purposes.
Structure of the thesis
The preceding paragraphs have outlined the background and motivation for the study, posed the
questions addressed in this thesis and briefly described the protocols of the studies performed.
Chapter 2 briefly reviews the physiology and pathophysiology of iron metabolism in order to provide
the background necessary for the subsequent detailed and critical surveys of studies that are
particularly relevant to the present research.. The review selects from the vast literature on iron and
only in the areas related to the questions addressed in this study does it attempt to be comprehensive.
Particular emphasis is placed on studies of the role of iron in susceptibility to infection since, not only is
this of especial relevance to the present study, but also there has been no comprehensive critical review
of such work to date. Present understanding of the association between iron status and behaviour is
summarized. A synopsis of the physiology of iron absorption is given, but the issues of iron fortification
and supplementation are treated in some detail.
The design of the study is detailed in chapter 3. Ethical considerations in conducting such studies in
children are weighed. The protocols for the principal study on iron fortification and immunity and the
surveys on feeding practices are presented. This chapter also covers the planning of the project is in
detail. Attention is drawn to important features in the design of the study. Comprehensive analyses

1.4 IRON NlJTRITION AND IMMUNITY
support decisions to choose particular features in the design where there were attractive alternatives.
Chapter 3 also describes the laboratory methods and materials used and the data processing and
statistical procedures employed.
Chapter 4 relates socio-cultural data from the trial in order to portray the community within which the
study was undertaken. Much of the material is anecdotal, but it aims to provide the reader with
sufficient information to assess the validity of comparisons that he or she might wish to make with
other studies.
Results from the surveys of infant feeding habits are presented in chapter 5.
The results from the main study are reported and discussed in chapter 6.
The conclusions and recommendations for further studies are presented in chapter 7 which ends with a
summary of the contributions of the present work.
The appendices include the bibliography, as full a tabulation of results and statistics as is practical as
well as other material that might need to be referenced such as the composition of the Control and
Test infant milk formulas.

With us ther was A DOCTOUR OF PHYSIC,
In al this world ne was ther noon him lik
Wel knew he the olde Esculapius,
And Deiscorides, and eek Rufus,
Olde Ypocras, H aly and Galye;
Serapion, Razis and Avicen;
Aven-ois, Damascien and Constantin;
Bernard and Gatesden and Gilbertin.
Of his diet mesurable was he,
For it was of no superfiuitee,
But of greet norissing and digestible.
His studye was but litel on the Bible.
· The Canterbury Tales
Geoffrey Chaucer
circa AD 1386


l
CHAPTER 2 LITERATURE REVIEW
Introduction
The area surveyed
This chapter reviews iron status with particular emphasis on iron deficiency under the rubrics of
epidemiology, physiology, pathophysiology, clinical classification and prevention.
The epidemiology of iron deficiency reveals that it is an internationally widespread public health
problem in lower socio-economic communities. The Cape peninsula is no exception as iron deficiency
is common in infants seen at local health care facilities.
The physiology of iron deficiency is briefly reviewed with particular emphasis on the role of iron in the
immune system. The pathophysiology of iron deficiency is broadly sketched in order to show the wide
range of changes in this condition. The principal research project was concerned with iron nutrition
and immune function; therefore the literature describing effects· of iron deficiency on immune function
is examined in some detail. Both infection and nutrition are shown to be related to iron status in a
complex interdependency. This makes the design and interpretation of scientific studies difficult and
prone to confounding variables.
The main aim of this chapter is to review published· studies on the relationship between iron deficiency
and infection in order to provide a comprehensive bibliography up to August 1987. Each pertinent
study is critically examined for its strength and weakness in testing the hypothesis of a causal·
relationship of iron deficiency to susceptibility to infection. To place these studies in context it was ·
necessary to review the evidence from studies on laboratory animals and to survey studies on the
relationship between iron excess and susceptibility to infection.
The reason that particular emphasis is laid on this aspect of the literature is that, although there have
· been many reviews of the role of iron in immune function, there has been no comprehensive and
critical review on iron deficiency and susceptibility to infection. Also, while laboratory work has
established fairly conclusively the changes in tests of immune function in iron deficiency,. clinical studies
of susceptibility to infection in iron deficient infants have been suggestive, but inconclusive because of
methodological problems.
Studies of laboratory tests of immune function in disturbances of iron metabolism are also reviewed,
particularly with regard to studies of iron deficiency in infancy.
• Published in the scientific press, including peer review journals and proceedings or abstracts of scientific congresses. This is a
wider field than that covered by Medline, but it excludes newspapers and magazines.

2.2 IRON NUTRITION AND IMMUNITY
Clinical classification of iron status is discussed, and difficulties in diagnosis highlighted. Public health
measures to prevent iron deficiency and its consequences usually rely on the fortification of staple
foods and/ or the pharmacological supplementation of the diet with iron medications for groups at
increased risk for iron deficiency. The relevant literature is surveyed in order to ascertain the viability
of the intervention on which this study is based.
Finally, as iron is but one of a number of nutritional fa7tors that affect health, the importance and
possible confounding effects of imbalance in other elements, such as zinc, is summarized ..
The goals of the review
'this survey of the literature aims to provide the theoretical framework for understanding both the
motivation for the project and the design of the study. The literature on iron is vast. This survey
therefore relies on secondary sources, such as authoritative reviews in books and journals, for most of
the subject matter covered. Only with respect to iron deficiency and immune function is an attempt
made to review original scientific reports comprehensively. And only those articles that relate to iron
deficiency and infection in infancy are critically reviewed in detail.
Criteria for assessment of studies and literature review
A critical review of a study aims to assess the validity of the author's claims and the strength of the
conclusions. Evaluation can only be based on the reported design, methods, data and analysis.
Guidelines have been taken from two principal sourcesC137• 6). Authors should have included
information on the objective of their research and the hypotheses tested. The _eligibility criteria for
admission to the study should have been described and information given on whether the subjects were
assigned to treatment groups blindly and randomly in order to minimize selection bias. Other
procedures designed to reduce bias include the patients' blindness to treatment, lllld the investigators'
blindness when assessing outcome. The methods section of the report should have explained the
randomization procedure, and laboratory and clinical. methodologies. Treatment compliance and
complications should have been described and reasons and numbers of subjects lost to follow-up
should have been given. The statistical analyses should have been described and the power of the study
should have been estimated. Finally, potential sources of bias or confounding factors should have been
identified and controlled for, either in the design or in the analysis of the study. Few studies explicitly
identified these criteria, but in most it was possible to infer much of the information and to
discriminate between mere assertions and factual argument.

CHAPTER 2 LITERATURE REVIEW 2.3
The methods used in the literature survey
Most references were obtained from citations in other review and original articles. The Institut.e of
Child Health subscribes to the Medical Research Council's MIDS (Medical Information Dissemination
System). This service provides a computer search each month of most recent additions to the
Medlars/Medline database of medical literature. The search strategy is set to include publications on
iron and immune function, but it excludes most work performed on animals and articles not in English,
Afrikaans, Dutch or German. An additional search of the Medline/Medlars database was performed
on 4 August 1986 using the "Paperchase" system at the Beth Israel Hospital in Boston. This identified
22410 articles with the keyword "iron". Of these, 297 also included the keyword "infection". No
exclusions were made on the basis of language or because a study was performed with animals,
Evaluation of methods
The bibliography for immune function and iron status aims to be complete. It is, of course, not
possible to know what has been missed, but the results of the "Paperchase" search do give an indication
of how closely the goals are met.
It is probably safe to assume that any serious scientific work of importance before 1970 would have
been cited in one of the articles reviewed, and would therefore have been identified. Since 1970, the
Medlars/Medline database would have indexed any article of interest in this review. Although the
keywords assigned to an article may not accurately reflect its contents, the concepts of "iron", "immune
function" and "infection" are broad enough in their scope to have been included in most articles
pertinent to this research.
The "Paperchase" search was performed after an extensive period of collecting references. While it
located 297 articles of potential interest, many were irrelevant. Of these, 102 had not been identified
before, mainly because they related to studies in animals or were published in a foreign language.
(This was not unexpected as this type of reference had previously been specifically excluded.) Only one
(Russian) article(320) was of possible direct importance to the question of the relation between iron
status and immune function in infancy.
It would seem therefore, that the literature review is likely to be as complete as could be hoped for with
respect to articles published on susceptibility to infection in iron .deficient infants, and comprehensive
in respect of studies relating immune function to iron status in general. ·

2.4 IRON NUTRITION AND IMMUNI1Y.
Epidemiology of iron deficiency
Difficulties in comparing studies
A digression is here necessary to indicate a preliminary difficulty in determining the
incidence of anaemia in infancy, namely the lack of any standard of comparison.
HMM Mackay, 1928(3t4)
The difficulties that Helen Mackay recognized in 1928 are still with us today, better defined but not yet
resolved. The following list details important factors that need to be evaluated when studies of iron
status are compared.
Intrinsic biological variability
As with all biological variables, the measures of iron status have a degree of intrinsic variability so that
a level that is normal for one individual may be high or low for anotherC356). A diurnal cycle may
compound the intrinsic variability. Serum iron and transferrin saturation exhibit pronounced diurnal
variation, and even when measurements are made at the same time of day the individual variability is of
the order of 35 per cent<103).
Variation between and within laboratory methods
Modern studies often employ the Coulter counter to measure the haematological indices of iron status.
The consequent standardization of equipment, methodology and calibration techniques has made
reliable comparisons possible between studies of different Iaboratories<117,
120). Older studies have to
be interpreted in the light of the methods employed. For example, the studies of Dr Mackay in London
between 1925 and 1927 measured haemoglobin according to oxygen combining power and reported
results as a percentage<3t4), but later work showed that the laboratory calibrations resulted in
haemoglobin levels that are 7 per cent lower than they ought to be<315).
Erythrocyte protoporphyrin is sometimes measured as FEP (free erythrocyte protoporphyrin) in ug/dl
red blood cells and sometimes as ZPP (zinc protoporphyrin) in ug/g haemoglobin. FEP and ZPP
results can be compared, with a simple calculation, as there is a linear relationship between the two
measurements:
ZPP == 0.83*FEP • 3.4(324)_
The coefficient of variation of erythrocyte protoporphyrin is about 9% (between laboratories). This is
about double the coefficient of variation between laboratories for red cell indices measured on the
Coulter countei120).

CHAPTER 2 LITERATURE REVIEW 2.5
The method of specimen collection
The manner in which blood specimens are obtained (eg art~rial, capillary, or venous bleeding) can
influence laboratory test results, although if care is taken the differences are negligible(ll7)_
Developmental changes
During the first 2 years of life, developmental changes take place in the indices of iron statusC435).
Rapid growth often requires more iron than is available in the diet and iron stores are diminished, if
not depleted. The consequent difficulty in distinguishing pathological from physiological changes has
led to the concept of a physiological anaemia of infancy<162).
Sex
· Although indicators of iron status vary markedly with gender in adults, the differences are minimal in
infancy<527).
Race
Racial differences in haematological indices and other measures of iron status have often been noted.
But, when the confounding effects of genetic conditions (eg thalassemias and haemoglobinopathies),
. socio-economic class and nutrition are controlled there seems to be no intrinsic racial difference in
respect of haematologic testsC527• 531).
Nutrition
Inadequate nutrition is directly reflected in changes in haematologic variablesC314•
75).
Infection and inflammation
Acute and chronic infections and inflammatory diseases alter the metabolism of iron and hence the
indicators of iron status. Chronic infections and inflammatory diseases lead to a microcytic anaemia.
The response to any inflammatory process includes a drop in serum iron and rise in serum ferritin.
The highest levels of serum ferritin are found in hepatitis as liver cell damage releases iron stores into
the circulation(SZ4).
Socio-economic class
When differences in nutrition and exposure to infection are controlled there seems to be no significant
difference between socio-economic classes(290).

2.6 IRON NUTRITION AND IMMUNITY
Altitude
Haemoglobin concentration rises in response to the decrease in oxygen at high altitudes. Haematologic
studies conducted at a significant elevation need to be adjusted for altitude effects for meaningful
comparisons to be made. Approximate comparability of haemoglobin can be obtained by adding lg
Hb/dl per 3000 meter elevation(l35)_
Diagnostic criteria
A fundamental problem in comparing studies of iron status is that there is no universally accepted
method for grading iron status. The principles are not controversial; iron deficiency manifests itsei
with decteased haemoglobin, decreased haematocrit, decreased mean cell volume, decreased plasma
ferritin and increased plasma transferrin. The problem is that each of these indices has a wide
variability, largely independent of the other indices. Any single measure used as a test for iron status
has poor discriminatory power. Such qualitative statements ought to be quantified by data on
sensitivities, specificities and predictive values for diagnostic tests, but there are few studies that begin
to reach this basic level. Test results may be combined in classification schemes to increase
discriminatory power, but the selection of measures and choice of cut-off levels between normal and
abnormal are often arbitrary. The problem is difficult enough to be the subject of a book length
treatise itself and is further analyzed below.
Prevalence of iron. deficiency - International studies
In a recent review of iron deficiency Lanzkowsky(SZ7) concludes that the prevalence of iron deficiency
anaemia (in lower socio-economic communities) varies from 17 to 44 per cent, while that in white
middle class communities ranges from 1.4 to 6.3 per cent.
Table 2.1 below contains results from a selection of surveys of anaemia. While the table shows that
direct comparison between almost any two of the studies has to be qualified with details of
methodology, the table also demonstrates that anaemia is a common problem, particularly in poorer
communities. The following section shows that these surveys of anaemia can be taken, for practical
purposes, to indicate the extent of iron deficiency in the populations studied.
Estimating iron deficiency from low haemoglobin levels
In the absence of any better single measure, haemoglobin has often been used as a screening
instrument to estimate the extent of iron deficiency in populations·. This is justified on two accounts:
In a population of otherwise healthy infants, iron deficiency is the most common cause of anaemia, and
the prevalence of anaemia is greatly reduced by programs of iron fortification and supplementation.
• The issues of diagnosis and classification are discussed in more detail below.

CHAPTER 2 LITERATURE REVIEW 2.7
Drawbacks in using haemoglobin as an indicator of iron deficiency include those discussed above, the
fact that decreased haemoglobin levels are a late manifestation of iron deficiency and that specificity,
sensitivity and predictive value of the test have not been published for infants.
~ Factors that would cause haemoglobin to over-estimate the prevalence of iron deficiency include all the
other causes of anaemia. Factors that would cause haemoglobin to under-estimate the prevalence of
iron deficiency include cases of latent iron deficiency and cases with haemoglobin levels higher than
that chosen as the lower limit of "normal" but which would respond to extra dietary iron with a rise in
haemoglobin.
Percentile curves for haemoglobin have been published by Dallman et at<124). These were established
by excluding subjects with laboratory evidence of iron deficiency, thalassemia minor and/ or
haemoglobinopathy. The lower limit of haemoglobin in 1 year old children was found to be 11.0 g/dl.
Bird et al41) found a prev.alence of 10.4% of thalassemia and/or haemoglobinopathy in so called Cape
Coloured infants with mean cell volume less than 60 fl. It can thus be inferred that the prevalence of
thalassemia and/ or haemoglobinopathy in children selected on the basis of a haemoglobin level less
than 11.0 g/dl is likely to be well under 10% in Cape Coloured infants. For haemoglobin levels greater
than 11.0 g/dl the proportion of children with thalassemia and/or haemoglobinopathy is likely to be
even less. Use of a haemoglobin level of 11.0 g/dl to diagnose iron deficiency anaemia is thus unlikely
to include more than 10% iron replete individuals in otherwise healthy infants.
The false negative rate is difficult to estimate as no published studies address this issue. Dallman et
af-123) found that 35% of 1 year old infants with haemoglobins less than 11.5 g/ di responded to iron
treatment with a rise in haemoglobin of at least 1 g/ di. It is unlikely that as many as 35% of infants
with haemoglobins above 11.0 would respond to iron treatment so this can be taken as an upper limit,
but 10% would perhaps be a reasonable estimate.
The argument can be extended to show that at values of haemoglobin level less than 11.0 g/ di the false
positive rate in diagnosing iron deficiency anaemia is likely to remain around 10% while the false
negative rate would increase.
Population studies have used haemoglobin in 2 ways to estimate iron deficiency. Some have reported
the mean haemoglobin while others have reported the prevalence of anaemia based on a ''cutoff" level
of haemoglobin. The mean allows a more precise comparison between studies and but the prevalence
of anaemia is of more direct interest to the clinician. As there is no generally accepted diagnostic level
of low haemoglobin, different workers have used different criteria and· published prevalences of
anaemia are not directly comparable.

2.8 IRON NUTRITION AND IMMUNITY
Table 2.1 summarizes the results from a number of studies. The prevalence of anaemia has varied
from absent(387•
52) in well off communities to 60% in lower income groupi135). The mean
haemoglobin varied from 12.5 g/dl(3B7) to 11.1 g/dl(261). The noteworthy feature of table 2.1 is the
demonstration of the relation between haemoglobin and economic status. The conclusion is that iron
deficiency is a universal problem in poor societies.
Table 2.1 Surveys of anaemia in infancy
Ref. Author Date Age Mean Prevalence Comments No. (months) Hb of anaemia
(g/dl) Hb "cutoff"
185 Fuerth 1959 12 11.8 6% 10 White, middle class
1969 9 11.9 3% 10 White, middle class
162 Farquhar 1963 12 12.1 2% 10 White, well off
7 Andelman 1966 12 76% 10 Non-white, poor
302 Lovric 1970 6-36 12.2 3% 10 • All classes / no change with SEC
387 Owen 1971 12-33 11.6 14% 10 Lower-lower class
12.0 8% Upper-lower class
12.4 1% Lower-middle class
125 0% Upper-middle class
502 Vacquez-Seone 1971 9-.36 11.1 23% 9.8 Non-white, poor
1984 9-36 11.8 1% 9.8 Non-white, poor
74 Burman 1972 12 11.75 ? White, middle class
261 Katzman 1972 10-36 11.1 18% 9.8 Lower SEC
135 Derman 1978 13-24 ? 60% 11.5 Black, 1200m
53% "Coloured", 1700m
141 Drigger 1981 12 ? 22% 11.5 White, middle class
38% 11.5 Black, poor
18% 11.5 Asian
28% 11.5 Other
440 Sadowitz 1983 9-12 ? 8% 11 Lower SEC
52 Brault-Dubuc 1983 12 12.3 0% 10 White, well off
3.3% 11 316 Madanat 1984 6-12 ? 37% 10.5 •• ?lower SEC
12-18 ? 38%
KEY Ref. No. Number of reference in bibliography
Author ' First author of anicle
Date Date study was published or conducted
Mean Hb Mean haemoglobin concentration in g/dl
Prevalence of Fe def Prevalence of iron deficiency anaemia
Hb 'cutoff" Lowest level of haemoglobin regarded as nonnal
SEC Socio-economic class
1200m, 1700m Altitude at which study subjects resided
? No data published
Diagnosis on Hb, and blood smear .. Diagnosis on Hb and transferrin saturation at least 16%

CHAPTER 2 LITERATURE REVIEW 2.9
Prevalence of iron deficiency · Cape Peninsula
Lanzkowsky (1960)
The first survey of anaemia in infants in Cape Town was published in 1960 by Lanzkowskf 288). Fifty
five per cent of "Coloured" infants between 10 & 11 months and 11 & 12 months had a haemoglobin
concentration of less than 10 g/ dl. The lowest haemoglobin levels were found in inf ants between 1 and
2 years of age. As capillary blood specimens were taken with adequate precautions and haemoglobins
were measured with the oxyhaemoglobin method the results are comparable with those obtained in
present day laboratories. As was argued above, the prevalence of anaemia can be taken to indicate a
reasonable approximation of the prevalence of iron deficiency.
Robertson and Sundgren (1972)
In 1972 Robertson and Sundgren(420) reported on a survey conducted in Cape Town City child Welfare
Clinics. Apparently healthy, thriving children in the age group between 7 and 11 months had a
prevalence of 42% of anaemia defined as a haemoglobin concentration less than 10 g/ dl. For the age
group 12 to 24 months the prevalence of anaemia rose to 60%. Capillary blood was taken and a direct
reading hand-held haemoglobinometer used to make the measurements of haemoglobin. This method
is accurate to 0.5 g/dl with careful calibration. A direct quantitative comparison with other studies
would be invalid, but the extent of anaemia is readily apparent.
Kirsten et al (1984)
The most recent study, by Kirsten et aP61), examined 240 infants from a lower socio-economic Cape
Coloured community. There were 20 infants in each of 12 age groups ranging from 1 to 12 months.
This was the frrst study that attempted to classify the iron status of the children using multiple criteria
in an attempt to be more specific and sensitive. Iron deficiency anaemia was found in 34 per cent, and
haematological evidence of iron deficiency without anaemia was present in a further 19 per cent.
Ma.king the inference from low serum ferritin levels, 27 per cent had diminished iron stores.
A sophisticated classification scheme was employed to take into account developmental changes in the
first year of life. The reference values used in the diagnostic protocol are given in table 2.2 below. Iron
deficiency anaemia was diagnosed when the haemoglobin was below the reference level together with
at least one low result for mean cell volume and mean cell haemoglobin.

2.10 IRON NUTRITION AND IMMUNITY
Table 2.2 Haematological reference values for infants
Age Hb MCV MCH F erritin ( ug/ dl) (mo.) (g/dl) (fl) (pg) Low Very low
1 11.1 93 27 150-215 <150 2 95 81 27 64-98 <64 3 10.0 80 24 21-36 <21 4 10.0 74 24 13-21 <13
5-12 10 74 24 8-12 <8
Notes From Kirsten etaf-261)
A recent study of the prevalence of beta thalassaemia and abnormal haemoglobinsC41) allows the above
results to be adjusted for the possible inclusion of haemoglobinopathies in cases categorized as iron
deficient anaemia. This survey found 10 per cent of children with a mean cell volume less than 60 fl
were either carrying the beta thalassaemia gene or had an abnormal haemoglobin. The study by
Kirsten et al found 131 children with a low mean cell volume. (The reference volumes for each age
group are listed in table 2.2.) As the reference mean cell volume was never as low as 65 fl, a
conservative estimate of the number of children with a haemoglobinopathy is 10 per cent of 131, which
equals 13. Subtracting this from the 81 children diagnosed as having iron deficient anaemia, the
prevalence can be recalculated: (81-13)/240 = 28 per cent. This conservative estimate may well be
lower than the true figure as the estimated number of haemoglobinopathies surely errs on the side of
too many. The point is that iron deficiency is very common in this socio-economic group.
Venous blood was taken and full blood counts made on a Coulter Counter model S. The results are
therefore comparable with studies from most modern laboratories.
Summary
The conclusion to be drawn from these three surveys of iron deficiency is that, in lower socio-economic
Cape coloured communities, iron deficiency anaemia affects at least one quarter of infants under the
age of one year. Iron deficiency without anaemia affects about the same proportion.

CHAPTER 2 LITERATURE REVIEW 2.11
Physiology of iron
Iron balance The following paragraphs give a schematic account of the physiology of iron balance. Details on the
complex and sometimes controversial mechanisms are not given as this is beyond the scope of this
thesis.
Absorption Iron is one of the most abundant elements in the earth's crust. However, all cellular organisms find its
availability low as both the ferrous (Fe2+) and ferric (Fe3+) ions are highly insoluble at neutral pH.
Special systems are required by all forms of life to absorb and transport iron<326). Bacteria synthesize
and excrete high-affinity iron chelating agentsC368). The roots of plants secrete substances that
augment iron absorption<58). Mammals have several mechanisms for the absorption of iron: haem iron .
is absorbed intact by the intestinal mucosal cen<326) and non-haem iron is absorbed in the proximal
small intestine whose mucosal cells contain ferritin and transferrin(2Sl). The availability of dietary iron
is highly variable and dependent on the content of the diet. Non-haem iron is generally poorly
absorbed - less than 10 per cent is taken up by the subject. The absorption is inhibited (less than 5 per
cent) by tannates and phosphates found in cereals and augmented (10 to 30 per cent) by fish, meat and
ascorbic acid(356). Haem iron is highly available - between 20 and 40 per cent being absorbed in the
iron depleted subject and this fraction is not affected by the composition of the diet<164). About 50 per
cent of breast milk iron is absorbed, but only 5 to 10 per cent of iron in infant milk formulas is taken
up<438,
434), and as the iron content of food increases, the percentage of iron absorbed decreases<48>.
The amount of milk fat, the addition of carbohydrates and acidification of milk do not influence the
absorption of iron<482).
Transport and storage Iron is transported to sites of storage and utilization bound to transferrin - a 77 000 MW protein that
can bind 2 atoms of iron. Cells acquire iron by highly selective receptor-mediated endocytosis of
tr~nsferrin(lZ7). Excess iron is stored as soluble ferritin or as insoluble haemosiderin<524). In the
formation of haemosiderin part of the protein shell of ferritin is removed and the molecules are
aggregated. Ferritin has been detected in every type of human cell so examined, but particularly high
concentrations are found in liver, spleen and bone marrow where it is continually degraded and
resynthesized. The average ferritin molecule stores about 2000 iron atoms and has a life span of a few
daysC164).
The amount of ferritin circulating in the blood parallels the concentration of storage iron in the body: 1
ug of ferritin per litre of serum is equivalent to about 140 ug of storage iron per kilogram body

2.12 IRON NUTRITION AND IMMUNITY
weight(l64) Tissue ferritin differs from serum f erritin which is partly glycosylated and almost entirely
free of iron<164).
Losses
In the absence of bleeding, iron losses are very small; basal physiological losses, mainly from skin, the
gastrointestinal tract and urinary epithelium, have been calculated to be 0.014 mg/Kg body massC204)
per day for the non-menstruating adult. In infancy, the daily loss has been calculated to be between 0.4
and 1.2 mg iron/Kg body weight(529). The higher rate of loss in infancy reflects the larger epithelial
surface area (skin, gastrointestinal and urinary tracts) relative to body weight. The losses are increased
if pasteurized cow's milk is used rather than formula or breast milk and in the presence of diarrhoea.
Growth
The normal infant is born with sufficient iron stores to meet the needs of the first four to six months.
But, as the average infant triples its body weight and doubles its body iron in the first year, the
nutritional needs for iron at 0.5 - 0.8 mg iron/day are very high in relation to the energy intake<204). In .
later childhood, the daily iron requirement for growth falls to 0.2 • 0.3 mg iron/day, but rises again
during the adolescent growth spurt.
Homeostasis
Iron absorption is increased in the presence of iron depletion and decreased in the face of iron
overload.
A specific storage protein, ferritin, regulates the supply of iron in response to acute or excessive
demands for the element.
Iron is highly conserved; losses are minimal and most iron from catabolized cells is circulated for re~
utilization.
As the life of a red cell is 110 days on average, the total turnover of iron greatly exceeds the rate at
which it is absorbed and lost. Senescent red cells are trapped in the spleen and phagocytosed by
reticuloendothelial cells. Iron is released from haemoglobin, taken up by plasma transferrin and
transported to the bone marrow for incorporation into the haemoglobin of new red blood cells. About
80 per cent of internal iron exchange follows this cycle through the erythron and macrophage<164).
In the normal situation, iron balance is precarious; the dietary intake of iron in humans is 1 to 2 per
cent of that in other mammalsC164) and the diet of the poorer segment of the world's population
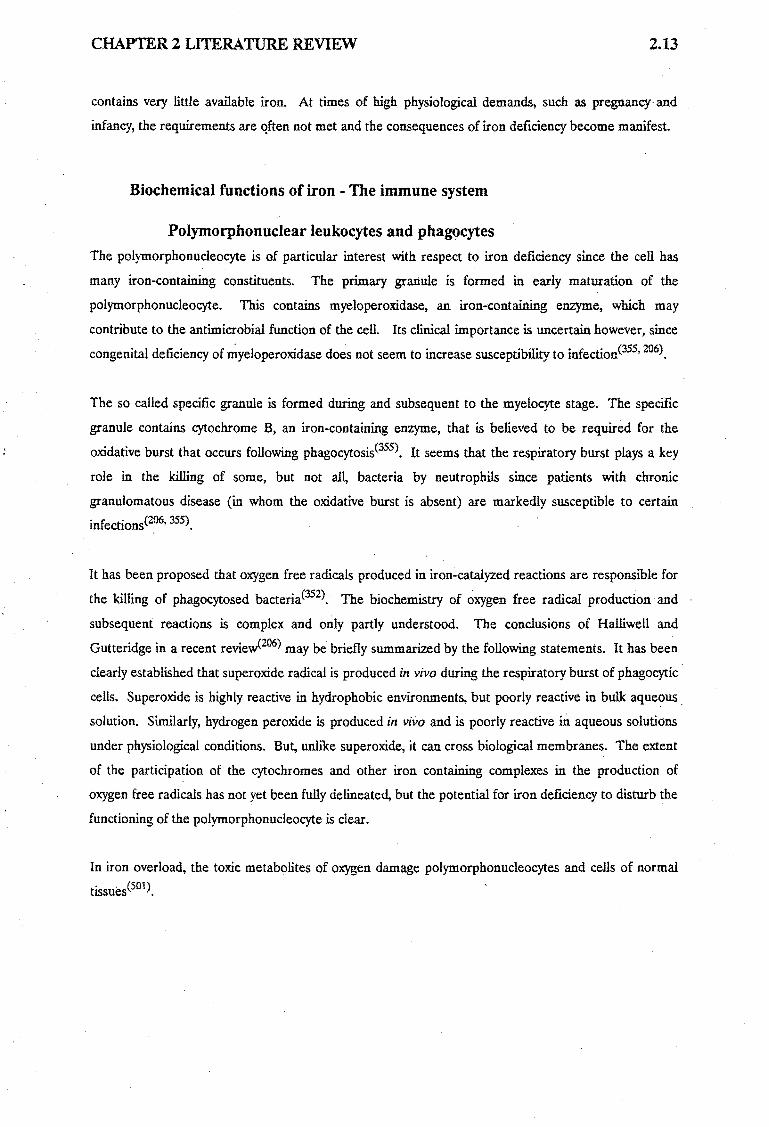
CHAPTER 2 LITERATURE REVIEW 2.13
contains very little available iron. At times of high physiological demands, such as pregnancy· and
infancy, the requirements are qften not met and the consequences of iron deficiency become manifest.
Biochemical functions of iron . The immune system
Polymorphonuclear leukocytes and phagocytes The polymorphonucleocyte is of particular interest with respect to iron deficiency since the cell has
many iron-containing constituents. The primary granule is formed in early maturation of the
polymorphonucleocyte. This contains myeloperoxidase, an iron-containing enzyme, which may
contribute to the antimicrobial function of the cell. Its clinical importance is uncertain however, since
congenital deficiency of ~yeloperoxidase does not seem to increase susceptibility to infection<355• 206>.
The so called specific granule is formed during and subsequent to the myelocyte stage. The specific
granule contains cytochrome B, an iron-containing enzyme, that is believed to be required for the
oxidative burst that occurs following phagocytosis<35s)_ It seems that the respiratory burst plays a key
role in the killing of some, but not all, bacteria by neutrophils since patients with chronic
granulomatous disease (in whom the oxidative burst is absent) are markedly susceptible to certain
infections<206, 355).
It has been proposed that oxygen free radicals produced in iron-catalyzed reactions are responsible for
the killing of phagocytosed bacteria(352). The biochemistry of oxygen free radical production and
subsequent reactions is complex and only partly understood. The conclusions of Halliwell and
Gutteridge in a recent review<206) may be briefly summarized by the following statements. It has been
clearly established that superoxide radical is produced in vivo during the respiratory burst of phagocytic ·
cells. Superoxide is highly reactive in hydrophobic environments, but poorly reactive in bulk aqueous.
solution. Similarly, hydrogen peroxide is produced in vivo and is poorly reactive in aqueous solutions
under physiological conditions. But, unlike superoxide, it. can cross biological membranes. The extent
of the participation of the cytochromes and other iron containing complexes in the production of
oxygen free radicals has not yet been fully delineated, but the potential for iron deficiency to disturb the
functioning of the polymorphonucleocyte is clear.
In iron overload, the toxic metabolites of oxygen damage polymorphonucleocytes and cells of normal
tissuesC501).

2.14 IRON NUTRITION AND IMMUNI'IY
B and T lymphocytes
B and T lymphocytes depend on iron for the normal function of many subcellular systems, but the
biochemical roles of iron compounds and enzymes have not been as clearly defined for these cells as
for phagocytic cells.
In the mouse, the response of lymphocytes to stimulation with concanavalin A has been shown to
depend on transferrin-bound iron<318). No defect was noted in the cells of iron-deficient mice in the
response to the mitogen, but the serum of the iron-deficient mice was less able to support thymidine
incorporation by stimulated lymphocytes·.
Biochemical functions of iron - Other systems
All cells require iron for their growth. (This fact has prompted the suggestion that tumour growth
might be able to be controlled by limiting the supply of iron by blocking transferrin receptorsC354>.)
Tables 2.3 and 2.4 summarize the distribution and function of iron containing compounds in the normal
human.
Table 2.3 Distribution of iron compounds in normal adult humans**
Per cent normal body iron
65% 10% 10% 9% 5% <1% <1% <1% <1% <1% <1% <1% <1%
Notes .. Modified from ( 460)
• Author's tables 2 and 4
Compound
Haemoglobin Ferritin Myoglobin Haemosiderin Unknown Transferrin Cytochrome c Cytochromes a, a3, b Peroxidase Catalase Flavoproteins Hydroxylases Oxidases
Amount of iron
(Grams)
2.600 0.400 0.400· 0.360 0.200 0.007 0004
? ? ? ? ? ?

CHAPTER 2 LITERATURE REVIEW 2.15
_Table 2.4 Function of iron compounds in normal humans *
Class Compound Primary function
1 Proteins which store a Ferritin & Iron storage & transport iron b Haemosiderin Iron storage
C Transferrin Iron transport d Lactoferrin Bactericidal/ regulation
of bone marrow cell differentiation
2 Haemoproteins which a Haemoglobin Oxygen transport to bind oxygen reversibly tissues
3 Iron and molecular a Oxygenase Controlled catalysis oxygen b Oxidase of reactions involving
molecular oxygen
4 Enzymes containing iron: a Haemoproteins which a Cytochrome l\llono-oxygenase:one
react with molecular p450 oxygen atom oxygen incorporated in the
substrate
b Tryptophan Catalyzes oxidation of oxygenase tryptophan to N-formyl-
kynurenine .
C Cytochrome Reduces molecular oxidase oxygen to water
b Haemoproteins which a Hydroper- Oxidize water molecules react with peroxides oxidase at the expense of
hydrogen peroxide
C Iron-sulfur proteins a Ferredoxins Electron transfer mediators in the more negative regions of electron transport
b Flavoproteins Liver enzymes of wide aldehyde oxidase substrate specificity sulfite oxidase xanthine oxidase xanthine dehydrogenase
C Aconitase Conversion of citric acid to cis-aconitate

2.16 IRON NlJTRITION AND IMMUNITY
Table 2.4 (continued) · * Function or iron compounds in normal humans
Class
d Non-haem oxygenases
Note • Modified from (324)
Compound
a Prolyl hydroxylase
b Lysyl hydroxy lase
c Phenyl alanine hydroxylase
d Tyrosine hydroxylase
e Tryptophan hydroxy lase
Iron dependency of micro-organisms
Introduction
Primary function
Collagen triple helix stabilization
Amino acid metabolism (pteridine dependent)
Iron i~ a nutrient required by most, if not all, living ceus<516• 155): "If life without iron exists it is probably
to be found among certain members of the lactobacilli"(36S). Pathogenic bacteria, fungi and protozoa all
have an absolute requirement for iron<368• 295). Bacteria whose virulence has been shown to be
enhanced by exogenous iron include Escherichia coli, Klebsiella Pneumoniae, Pseudomonas
aeroginosa, Listeria monocytogenes, Staphylococcus aureus, Bacillis anthracis, Yersinia pestis,
Mycobacterium tuberculosis, Neisseria gonorrhoeae, Shigella flexneri, 'and Vibrio cholerae<391•
342•
67, 70)
This requirement for iron by micro-organisms has important implications, both theoretical and
practical, on iron supplementation, fortification and therapy. This is because administration of iron
may facilitate infection by overloading the iron sequestrating capacity of the host and thereby make
iron accessible to the invading organism<102l.
Parenteral administration of iron-dextran has been associated with increased infectious morbidity and
mortalityC31• 376
• 19•
17). Oral iron therapy has been associated with recrudescence of malaria, brucellosis
and tuberculosis<361).
Macfarlane et a/313) have speculated that iron treatment in kwashiorkor may be associated with
increased mortality from infection. However, there is no evidence that iron supplementation in infant
milk formulas at the levels commonly used today has any adverse effects<47).

CHAPTER 2 LITERATURE REVIEW 2.17
The evidence linking iron administration in humans to increased bacterial virulence is comprehensively
reviewed by Stockman(434). Kochan(Z70) SUID.marizes studies in animals which have shown that the
administration of iron promotes the development of bacterial infection. In conditions of iron overload
such as haemochromatosis, siderosis and repeated blood transfusions, patients show a greatly increased
susceptibility to infectious disease(295, 512).
Bacterial growth - Iron & iron binding products The history of the discovery of the iron binding factors in tissue fluids which provide their bacteriostatic
properties is reviewed by Kochan(27o). Key observations were that the bacteriostatic nature of serUID. is
neutralized by iron or by heating to 65°C. Transferrin, · ferritin and Iactoferrin all bind iron so
effectively that most micro-organisms are not able to utilize the iron bound to these proteins. Serum
from iron deficient patients is less able to support the growth of bacteria in vitri328). · The mechanisms
by which iron binding proteins inhibit microbial growth are reviewed in greater detail by Bullen(69).
Bacterial virulence - Effect on pathogen
Pathogenic bacteria often have unusually efficient means of acquiring and utilizing iron under the
restricted conditions in physiological fluids and tissuesC457• 81).
According to their fate in serum, bacteria can be divided into serum-sensitive and serum-resistant
groups. The serum-sensitive bacteria are dependent on siderophores or exogenous iron to meet their
requirements, while the serum-resistant bacteria can use their stored iron to meet growth needs(SOO).
Bacteria are able to utilize iron bound to haemoglobin, haem and haematin except when these
molecules are bound to haptoglobin, haemopexin and/or albumin(SOS)_
Griffiths et aP98) review the ·experimental evidence implicating plasmids as the determinants for
certain virulence factors. Vibrio anguillamm is a fish pathogen whose virulence is dependent upon its
ability to sequester iron. Upon losing the plasmid that carries the genetic code for the iron
sequestering system, the bacterium loses its virulence. More pertinent for humans is the plasmid Col V
which seems to provide E. coli with a mechanism which allows it to grow significantly faster in the
presence of transferrin.
Escherichia coli acquires iron by specialized systems, including the aerobactin system which has a
markedly higher prevalence in pathogenic strains than in isolates from faeces(Bl).

2.18 IRON NUTRITION AND IMMUNITY
Bacterial virulence - Effect on host
Idiopathic haemochromatosis has been associated in a case report with Listeria monocytogenes
meningitis and reduced phagocytic activity which recovered after a course of phlebotomy to reduce iron
overload to normal(SOO). (Yersinia enterocolitica is more commonly associated with idiopathic
haemochromatosis and the evidence for this and other effects of iron overload are reviewed in more
detail below.)
Bacterial virulence • Effect on bacterial secondary metabolism
BarclayC16) tabulates and describes in some detail toxic factors produced by Pseudomonas aeruginosa,
Clostridium perfringens, Clostridium tetani, Corynebacterium diphtheriae and Shigella shigae
when they are subject to an environment with low levels of available iron. He also describes 6 outer
membrane proteins of Escherichia coli produced under limitation of iron. These are all involved in
the acquisition of iron and are potential determinants of virulence.
The iron concentration in culture medium controlled the production of two siderophores, toxin A,
proteases and membrane proteins that bind the siderophore-iron comple:i523).
"Small quantities of iron bound specifically to human transfenin were found to stimulate infection with
Neisseria meningitidis strain MlOll in mice 11<231).
Fungal requirements for iron
NeilandsC368) has reviewed the data on iron assimilation ~ystems in fungi. Siderophores supply fungi
with iron via a shuttle mechanism. Their production is increased in response to iron starvation. Iron
plays a role in germination and sporulation in some species .
. Protozoa} requirements for iron
Desferrioxamine has been shown in vitro to inhibit the growth of Plasmodium f alciparum and Murray
et af.360•
361) have found a lower prevalence of malaria infestation in iron deficient Somali nomads .
. The mechanism of immunity to malaria may be dependent upon iron containing enzymes. Allison and
Eugui(S), and Clark and Hunt<97) have proposed that asexual forms of malaria parasites may be killed
within the erythrocyte by "oxidant stress". le H20 2, 0 2- and other reactive oxygen intermediates.
Summary
In summary it can be simply stated that iron is an essential nutrient for all microbial forms of life (with
the possible exception of the non-pathogenic lactobacilli). Organisms often have specialized systems

CHAPTER 2 LITERATURE REVIEW 2.19
for procuring iron because its salts are so insoluble. Availability of the element is often rate limiting
for growth of microbes.
Pa tho physiology of iron deficiency
Non-immunological effects A number of textbooks and half a dozen recent reviews summarize the effects of iron deficiencyC241• 290•
119• 381, 484• 441• 118). When Lanzkowsky called iron deficiency a "systemic disease•{290) his words may
have been selected for their dramatic spotlighting of the non-haematological consequences, but they
were well chosen. For no physiological system is spared although the haematologic consequences are
most prominent. The following paragraphs list, in point format, the major consequences of iron
deficiency. Original references are not cited except for immunologic and behavioural effects. If more
information is required, the interested reader may use one of the previously cited review articles as a
starting point in locating more information.
Iron deficiency • Blood and bone marrow
BLOOD Haemoglobin Haematocrit Mean cell volume Mean cell haemoglobin Mean cell haemoglobin concentration Red cell distribution width Erythrocyte protoporphyrin Ferritin Transferrin/Total Iron Binding Capacity Transferrin saturation Iron Blood smear microscopy
decreased decreased decreased decreased decreased increased increased decreased increased decreased decreased hypochromia microcytosis

2.20
Red cell biochemistry Free protoporphyrin Red cell membrane stiffness
Red cell life span Autohaemolysis Susceptibility to sulfhydryl inhibitors Red cell hexokinase Globin synthesis
Glycine incorporation into haem Adenosine triphosphate (ATP) ATP stability 2,3-diphosphoglycerate (2,3-DPG) Catalase Susceptibility to H202 Glutathione peroxidase Glutamic oxaloacetic transaminase (EGOT) Glycolytic enzymes Potassium Lactate production NADH-Methaemoglobin reductase activity
Bone-marrow Stainable iron Sideroblast count Erythropoiesis DNA synthesis RNA synthesis
Response to treatment
IRON NUTRITION AND IMMUNITY
increased increased
(alpha globin monomers associated with membrane)
decreased increased increased increased decreased (alpha chain decreased more than beta)
decreased normal or decreased decreased decreased decreased increased decreased increased increased increased increased increased
decreased decreased ineffective decreased decreased
When iron deficiency is treated with adequate doses of iron, haemoglobin rises about 1 g/ dl
per week and there is a modest reticulocytosis of up to 10 per cent. This is slow compared to
the response to treatment of megaloblastic anaemia which may produce a reticulocytosis of
up to 50 per cent. The reason for this difference may be that the marrow in iron deficiency is
hypoplastic with a defect in cellular proliferation as well as a defect in cellular maturation.
Iron deficiency · Gastrointestinal tract
Symptoms and signs Anorexia Pica Failure to thrive Exudative enteropathy
Laboratory tests Gastric acidity Absorption: Xylose
Fat Vitamin A
Biopsy histology Disaccharidase activity Cytochrome oxidase activity Succinic dehydrogenase
reduced reduced reduced reduced normal reduced reduced reduced

CHAPTER 2 LITERATURE REVIEW
Iron deficiency - Cardiovascular system
Symptoms and signs Heart rate Cardiac output
with severe anaemia Cardiac development Tolerance to digitalis
Iron deficiency - Skin and mucous membranes
Laboratory tests Iron content of skin, nails, hair Cytochrome ox:idase in buccal mucosa
Iron deficiency • Musculo-skeletal system
Symptoms and signs Growth indices (weight, height) Work performance X ray bones ( notably skull) Myoglobin Cytochrome C
Iron deficiency· Behaviour
Introduction
increased increased decompensation hypertrophy increased
decreased decreased
decreased decreased "hair on end" decreased decreased
2.21
The possible importance of the behavioural effects of iron deficiency is becoming widely recognized.
Much recent research has sought evidence that irol'l deficiency may impair cognitive function, affect
and activity. Such abnormalities are clearly unfavourable at any stage of life, but in infancy they pose
the threat of permanent impairment by interfering with intellectual and emotional development.
There have recently been several comprehensive reviews(l30, 157• 292• 4o3). This section briefly
summarizes results from biochemical and animal research; original works are not cited. Human
studies are categorized according to age and only those involving the use of the Bayley Scales of Infant
Development are discussed in detail. For a full bibliography and exhaustive analysis of the strengths
and weaknesses of studies published between 1974 and 1985 the reader is referred to the authoritative
review by Lozoff and Brittenham (304)
Note on the definition of behaviour
Behaviour may be quantified by measures of physical activity, by procedures for rating non-cognitive
constructs such as affect, arousal, motivation and fearfulness, and by performance on tests of cognition
such as learning and problem solving. Although it is often convenient to treat these categories as

2.22 IRON NUTRITION AND IMMUNITY
independent they are often closely dependent on each other. For example, if arousal is impaired,
spontaneous activity and problem solving will also suffer. In the infant, the distinction between .the
cognitive, non-cognitive and motor aspects of behaviour is less clear, and, in the laboratory animal, the
distinction is even more difficult.
The Bayley Scales of Infant Development(23) (BSID) have been used in most studies of the role of iron
status in irifant behaviour. The BSID evaluate infant development using three sets of scales.
{l) The Mental Scale is designed to assess sensory-perceptual acuities, discriminations,
and the ability to respond to these; the early acquisition of "object constancy" and
memory, learning and problem solving ability; vocalizations and the beginnings of verbal
communication; and early evidence of the ability to fomz generalizations and
classifications, which is the basis for abstract thinking. Results of the administration of
the Mental Scale are expressed as a standard score, the MDI, orMental Development
Index.
(2) The Motor Scale is design.ed to provide a measure of the degree of control of the
body, coordination of the large muscles and finer manipulatory skills of the hands and
fingers. As the Motor Scale is specifically directed towards behaviours reflecting motor
coordination and skills, it is not concerned with functions that are commonly thought of
as "mental" or "intelligent" in nature. Results of the administration of the Motor Scale
are expressed as a standard score, The PD/, or Psychomotor Development Index. ...
(3) The Infant Behaviour Record is completed after the Mental and Motor Scales have
been administered. The /BR helps the clinician assess the nature of the child's social
and objective orientations towards his environment as expressed in attitudes, interests,
emotions, energy, activity, and tendencies to approach or withdraw from stimulation. (23)
The Mental and Motor Scales yield summary scores, the MDI and PDI, which are adjusted for age so
that the norm is 100 with a standard deviation of 16 for all age groups between 2 and 30 months. The
IBR consists of 30 scales on which the tester rates the infant's behaviour and, in contrast to the MDI
and PDI, generates no natural summary measure. MathenyC331) has suggested a weighted linear
combination of items of the IBR to give 7 or 8 summary factors. Matheny's method was employed in
the amilysis of results in the present research and is discussed in more detail below.
Biochemical studies
Metabolic processes which. are dependent upon iron include oxygen transport and storage
(haemoglobin, myoglobin), oxidative phosphorylation, neurotransmitter metabolism and DNA

CHAPTER 2 LITERATURE REVIEW 2.23
synthesis·. Alterations in any of these processes could have major effects on the functioning of the
nervous system but there is not much detailed information available about the metabolic role of iron in
human brain and neural tissues. In the adult, the basal ganglia have concentrations of iron comparable
to those found in the liver, spleen and bone marrow - the major storage sites for iron. Brain iron
concentrations rise gradually from birth, increasing tenfold by adulthood. Early iron depletion in the
rat leads to a depletion of iron in the brain which is not repaired by treatment even though anaemia
and liver non-haem iron are promptly restored to normal.
Defects in thermoregulation, conversion of thyroxine to thyronine and increased urinary excretion of
catecholamines have been noted.
Animal studies of behaviour
Studies· of behaviour in iron deficient rats have shown deficits in reactivity, responsiveness, level of
arousal, attentiveness to environmental stimuli and spontaneous activity··. The diurnal pattern of
spontaneous activity is also disturbed. However, no evidence has been found for derangements of basic
cognitive performance.
Studies of behaviour in adults, adolescents & children
Pica has long been recognized as a consequence of iron deficiency although the reason remains
unclearC349, 332, 287, 201, 428, 416, 29).
Iron deficiency anaemia has been clearly shown to limit peak physical performance and field work
suggests that it also limits economic productivity<146• 22). .
A number of studies have found associations between iron deficiency and measures of cognition such
as IQ tests and scholastic achiev~ment but all these studies suffer from methodologic inadequacies that ·
limit the conclusions that can be drawn.
Studies of behaviour in infants
Infancy is a particularly important period in which to study the effects of iron deficiency on behaviour.
This is because iron status reaches a nadir between 12 and 24 months of age and the effects of iron
deficiency on the brain and behaviour may be prolonged in spite of treatment. The published studies
of behaviour in infancy that have attempted to define the impact of iron deficiency are reviewed in
greater detail than the other work which does not directly relate to the present research.
• Lozoff 130> is a good staning point for a wider review and a fairly extensive bibliography.
• • Lozor/130> is also a fine source for references to original work in this field.

2.24 IRON NUTRITION AND IMMUNITY
Oski and HonigC383• 233) were the first to study the effects of treatment of iron deficiency on infant
behaviour. They administered the Bayley Scales of Infant Development to 24 iron deficient anaemic
infants whose ages ranged from 9 to 26 months. Half were treated with intramuscular iron dextran and
the other half were given placebo. The BSID-were administered a second time 5 to 10 days after
treatment. The treated group had a significant rise in the MDI score, but the change was not
significantly different from the change in the placebo treated group. There was a similar non
significant trend towards improvement in the POL While showing some intriguing tendencie~ this
study was unable to answer two critical questions: Is the behaviour of iron deficient inf ants impaired
with respect to iron sufficient controls? and, How much of the change in the second administration of the
BSID is due to a training effect rather than a specific effect of iron treatment?
At least five subsequent studies and the present project have attempted to replicate these results and
avoid at least some of the methodologic problems inherent in Oski and Honig's design.
Lozoff et at<3°5> studied the acute effects of oral iron treatment on the behaviour of iron deficient
anaemic infants aged 6 to 24 months. The MDI showed a trend towards improvement when the 15
treated iron deficient infants were compared with the 12 untreated iron deficient infants or the 40 iron
""' replete controls. The PDI showed no definite tendency in a similar comparison. Examining the pre
treatment results for the effects of anaemia revealed significantly lower MDI and PDl scores in the
iron deficient group. To assess the influence of age and iron status the MDI score was subjected to a
correlation analysis with a rating of iron status in three age groups, 6 - 12 months, 13 - -18 months and
19 - 24 monthsl306>. The MDI ·scores were normal for the two younger groups, but in the 19 - 24
months bracket the MD I scores were lower than average and correlated strikingly with iron status.
In Santiago, Chile, Walter et a/S01) tested 37 infants at the age of 15 months with the BSID before and
after an 11 day regimen of oral iron therapy. The 10 babies with iron deficiency anaemia had MDI
scores that averaged 10 points lower than those of the iron depleted and iron replete babies. The MDI
scores of the iron deficient babies improved with treatment by 10 points, whereas the iron sufficient
group improved by one point.
A second study by Oski and HonigC384) sought to defme the effects of iron treatment on non-anaemic
iron deficient infants. These workers selected 38 infants between 9 and 12 months of age, all of whom
had haemoglobin concentrations greater than 11.0 g/ di. All were treated with intramuscular iron
dextran and the Bayley scales were administered immediately before and 7 days after the injection.
The infants were placed into one of four graded categories according to their serum feiTitin,
erythrocyte protoporphyrin, and mean cell volume. The pretreatment MDI scores were lowest for the
iron deficient group, but the normal group's mean MDI fell between those of the iron depleted group
and the iron deficient group. After treatment the iron deficient group had a clear rise, .statistically

CHAPTER 2 LITERATURE REVIEW 2.25
significantly different from those of the iron replete and iron depleted groups. The authors speculated
that the reason for the similar results in the iron depleted and iron replete groups might be that neural
function is not affected by mere depletion of iron stores but is affected by tissue deficiency.
Deinard et af.1'30) and Johnson and McGowanC2Sl) in two observational studies tested 1 year old infants
with the BSID. Deinard et al used serum ferritin to categorize the iron status of their 34 subjects who
all had haemato«;rits greater than 33%. Johnson and McGowan used haemoglobin levels of 105 and
115 g/ d1 as the upper and lower limits in the selection criteria for their iron deficient and iron
sufficient groups. Neither study found remarkable differences in POI or MDI.
The non-cognitive aspects of behaviour are less easily quantified. Lozoff and Brittenham(304) have
suggested that analysis of the IBR shows abnormal ratings for iron deficient infants in two classes of
summary scores. One class characterizes affect and the other describes orientation to tasks. Iron
deficient babies also improved with treatment.
Other investigators have found isolated items on the IBR that are altered in iron deficiency and its
treatment. Oski and Honig<383) reported that infants became more alert, responsive and better
coordinated. Walter et af..5°7' noted an improvement after treatment in co-operativeness and listening·
to sounds, while Deinard et aP'30) found the iron deficient infants to be more fearful, more vocal, less
visually and auditorally attentive and less likely to mouth toys. Johnson and McGowan reported no
difference in their study(2Sl). The IBR has 30 items that are scored. No study took account of the
relatively high probability of finding "significant" differences purely by chance when making so many
comparisons.
Lozoff et a/..307) analyzed the interaction between mothers and infants at play and found that anaemic
babies were not more irritable nor more distractible but that they did maintain closer contact with their
mothers. This was interpreted as a manifestation of disturbance in affect. In a similar study Johnson
and McGowanC251) found no differences.
Summary
None of these 6 projects completely satisfied the methodologic requirements for unambiguous
demonstration of a behavioural effect of iron deficiency and the specific fmdings of one study are not
directly comparable to those of any other study due to differences in ages of the children, criteria for
iron status, treatment of iron deficiency and timing of administration of the BSID. Nonetheless, the
pattern of results clearly suggests an impairment of mental developmental test scores in iron deficiency
anaemia, especially in older infants, and that treatment with oral or intramuscular iron improves the
scores before a clinically important response in haemoglobin has taken place. Table 2.5 summarizes
the results of these studies.

I A O N A N D 8 E H A V I O U R / C O G N I T I V E f U N C T I O N
---------=-=-:----------====-=--=-=#--------=---~----=-~-~-=---===~-;-==-------=---=-~-=-=~-~==----w==--=-----=-=-==--------==------=-=--===-=--~-------~----------=•= AUTHOR
Hwood
Webb
Webb
Webb
Tucker
Sulzer
Pollitt
Pollitt
REF No.
A D U L T
154
AGE CROUP
> 20 yr
A D O L E S C E N T
513
513
514
490
C H IL D
4BB
404
3B3
12 - 14 yr
12 - 14 yr
12 - 14
Youths
4 - 5 yr
10.B y
9.5 y
...
yr
NIJYIBER IN STUDY
47
T 92 C 101
T 92 C 101
T 74 C 36 A 69
A 230
Tt 43 Tp 35 Cr 16 C:p 25
Tr 10 Tp 10 Cr 19 Cp 21
IRON STATUS
Hb < 10.5 g/dl
Hb < 11 .5 g/dl Hb > 14 .0 g/dl
Hb < 11,5 g/dl
Hb < 11.5 g/dl
Regression on Sf
Hb < 10,5 g/dl
Hb < 11, TRF < 16% II
Hb>11.9, TAF > 19% II
Hb < 11.5, etc II
Hb > 13, etc fl
PART 1
INTERVENTION
Oral iron
Observation
Observation
Observation
Observation
Observation
Oral iron, 5m Placebo Oral iron, 5m Placebo
Oral iron, 4m Placebo Oral iron, •4m Placebo
RESULTS (Test group compared with Ccntrol group)
Psychomotor performance: No significant difference
lowa·Test of Basic Skills: (T - C) worse p < 0.025
Latency of visualization of after image: Increased
Behavior Problem Checklist: Disruptive, irritable, restless
Asy!lllletric EEG, greater verbal fluency, poorer nonverbal test
Battery incl vocabulary, IQ, association: worse
School achievement test: (T1 - C1) : worse P < 0.001 Placebo treatment I no change Iron treatment: (Tr2 - Tr1) I l11proved, P < 0.001
(Tr2 - Cr2) LO\iler, P < 0.005
!llatching familiar figure test: Placebo treatment Iron treatment:
{T1 - C1): worse p < 0.05 no change
(Tr2 - Cr2); No difference (Tr2 ~ Tr1) : In-proved, P ·< 0,05

IRON AND BEHAVIOUR/COG NIT I V'E FUNCTION
======================================================================================--------------------------===--=-======-----------------------------------------AUTHOR REF
No. AGE GROUP
NLUIIBER IN STUDY
IRON STATUS
INTERVENTION RESULTS (Test group compared with Control group)
==========------===----===============-=-===---------==========-----=====-----===============-=----------=-==--=======-===---------=-====================~====--==----I N F A N T
Oski 3B3 9 - 26 m T 12 Hb < 10,5 g/dl etc IM Imferon Bayley Scales (12 - 11) - (C2 - C1): PDI = + 6.B3 C 12 Hb < 10.5 g/dl etc Placebo MDI = + 7.5
p < 5% for IBR: 15, 26, 27
Oski 384 9 - -12rn C .10 Hb >10.9, Normal IM Imferon Bayley scales (1, 2, 2-1): MDI 9D.B, 97 .o, 6.2 Ta 10 Hb >10.9, fRT < 12 II MDI 94.6, 100.2, 5.6 Tb 10 Hb >10.9, FEP > 30 ti MDI 83.9, 104.4, 20.1 Tc B Hb >10.9, MCV < 70 " MOI 85.5, 109.1, 23.6
IBR: unremarkable, no trends
Walter 507 15 m C 15 Hb > 10.9, etc Oral iron Bayley scales (l, 2, 2-1): MDI = 113, 112, Ta 12 Hb > 10.9, etc II MDI 10B, 113, -5 Tb 10 Hb < 11.0 II MDI = 98, 10B, 10
IBR: 4, 17 improved
Lozoff 305 6 - 24 m Tr 15 Hb < 10.6 g/dl etc Oral iron Bayley scales (1, 2, 2-1): MDI= 82.7, 89.B, 7 .1 Tp 12 " Placebo MDI 91.5, 97.0, 5.5 Cr 19 Hb > 12.0 9/dl Oral iron MDI= 9B.6, 104.1, 5.5 Cp 21 " Placebo PIDI = 102.0, 107 .1, 5.1
Bayley scales ( 1 • 2, 2-1 ): POI: No change Bayley scales ( 1, 2, 2-1): !BR not reported
PART 2

IRON AND BEHAVIOUR/COG NIT I V0
E FUNCTION
======~=======~==~===:===~======~=============================================~===================~=------------------------------------------------------------------AUTHOR
Lozoff
Deinard
REF No.
306
130
Cantwell BO
AGE GROUP
INFANT
6 24 m
11 13 m
6 -1Bm
NUMBER IN STUDY
(continued)
C 11 Ta 3 Tb 7
Tc 4
Ta 34 Tb 21 C 157
T C
32 29
IRON STATUS
Hb > 12.0 g/dl Hb > 12,0, FRT Hb > 12.0, etc Hb < 12, etc
( 13
HCT > 33; FRT < 10 HCT > 33, FRT 10 19 HCT > 33, FRT > 19
Hb < 9.6 Hb > 11.4
PART 3
INTERVENTION
Observation II
II
"
Observation II
II
Nil Imferon
RESULTS (Test group compared with Control group)
Bayley Scales (MDI): 120.7 91.6
MLR -> 56% Fe status, 12% for age etc
: 82 : 73.4
Bayley Scales (POI); No correlation
Bayley Scales (POI, MDI) 109.8, 103,B, 109.1,
120,e 116.3 121 .5
IBR: S, 16, 17, 24 : Increased fearfulness, Others less Uzgiris & Hunt Ordinal Scales: No differences
At 7 years of age Clumsiness increased, IQ decreased

:
CHAPTER 2 LITERATURE REVIEW 2.29
Iron deficiency • Other tissues
Tissues other than those or the immune system and systems covered above Cytochrome C (haem containing) reduced Cytochrome ox:idase (haem containing) reduced Succinic dehydrogenase (iron dependent) reduced Aconitase (iron dependent) reduced Monoamine ox:idase reduced Urinary noradrenaline increased Tyrosine hydroxylase reduced
Pa tho physiology of iron deficiency
Immunological effects
The literature review up to this point has tried to provide the background necessary for understanding
the research reported in this thesis. Review articles have been cited whenever possible although, on
occasion, original articles have been selected for their ability to document a point. The following
section attempts to be as comprehensive as possible in covering the literature on iron and immune
function in infancy.
Interactions - Nutrition, infection, immunity
Nutrition and immune function
In endeavouring to determine the effect of iron deficiency on immune function it is important to be
able to control for the effects of other nutritional deficits. If the diet is inadequate as far as iron is
concerned, it is also likely to be inadequate in trace elements, proteins, fats, vitamins and energy. Iron
deficiency itself may also lead to anorexia, malnutrition and disturbances in metabolism that result in
impaired growth<35s). In clinical studies, unless the iron deficiency is clearly due to blood loss, it is not
possible to attribute variations in immunological
tests to one specific dietary deficiency such as iron<63).
Kwashiorkor, marasmus, and deficiencies of specific nutrients impair immune responses. These
include reduced antibody response to antigenic stimulation, depressed delayed cutaneous
hypersensitivity, and impaired in vitro tests ofT lymphocytes, B lymphocytes and phagocyte5'388•
33• 112
•
407, 9, 57)
Experiments with animals control for these confounding effects by comparing animals on an iron
deficient diet with 2 sets of controls on an adequate diet. One set of controls is fed ad lib, and the
other set is pair-fed the exact quantity consumed by the iron deficient animalsC283). Inferences from
human observations, which cannot be as carefully controlled, should be appropriately qualified.

2.30 IRON NUTRITION AND IMMUNITY
Infection and immune function
Infections with a number of bacterial, viral and protozoa! agents have been shown to lead to anergy<63>. These organisms include Mycobacterium tuberculosis, measlesC112
). LA v~m, infectious mononucleosis,
influenza, hepatitis :8, polio, rubella, and chicken pox. Changes in tests of immune function include an
impairment in delayed skin reactions to tuberculin and candida antigen, and in mitogenic lymphocyte
transformation in vitroC310• 165•
321• 117). In no clinical study is it possible to exclude intercurrent
infection as a cause of immunologic abnormalitie5'63>, although certain experimental designs are better
controlled than others for such confounding factors.
Another complicating factor is that leukocytosis itself, whether accompanying infection or not, is
associated with a significant degree of anergy<216).
Infection and nutrition
The relationship between iron, nutrition and immune function is complicated by the fact that infection
may precipitate malnutrition and malnourished persons are more susceptible to infection<90>.
These effects of infection on immune function make it difficult to interpret studies of immune function
performed in iron deficient subjects who are also infected.
In addition to its effects on nutrition in general, infection may interfere with absorption, transport to
and release from storage of ironC278, 279, 280, 2'J7).
Host control of available iron
Part of the host's defense mechanism against infecting micro-organisms is control of available iron<518•
16• 197). This is accomplished by:
1 The chelation of iron, thus removing it from the environment. Chelators such as transferrin
in serum, lactoferrin in phagocytes and both transferrin and lactoferrin in breast milk and
cow's milk exhibit bacteriostatic properties'66• 102, 270). Lactoferrin-iron complexes are more
stable than transferrin~iron complexes at the low pH levels within lysozymes in phagocytes.
Lactoferrin is also found in other secretions such as semen, tears and cervical mucus.
2 The reduction of the concentration of iron in the blood(lS, 270• 149). Mechanisms include
reducing the absorption of iron from the gut<36), blocking the return of iron from the
reticuloendothelial system to transferrinC296), increasing sequestration of iron in tissue
storesC32), and accelerated removal of iron from the plasma transferrin pooiC295• 296).

CHAPTER 2 LITERATURE REVIEW 2.31
3 Raising the body temperature; bacterial siderophore production is critically sensitive to
temperature in some species. Injection of Pasteurel/a multocida into rabbits was followed
by fever and a marked fall in plasma iron; the inhibitory effect of low iron on bacterial
growth in vitro was dependent on febrile temperaturesC268). Similar results have been
obtained for Salmonella typhimurium(189) but do not seem to have been extended to in vivo
models of infection.
Possible mechanisms for the control of the hypoferraemic response are more extensively reviewed by
Beisel <32), Letendre(:31l) and Ballentyne(lS).
Iron deficiency and laboratory tests of immune function
The following sections review the evidence from laboratory tests for the role of iron deficiency in
causing immune dysfunction. The tests are grouped according to the part of the immune system that
they measure. The grouping is somewhat artificial in that few parts of the immune system can be
considered in isolation. For example, the production of antibodies by the B lymphocyte is dependent
upon a complex interaction with macrophages and T lymphocytes. The oversimplification that is
necessary for structuring the presentation of the laboratory data should not be allowed to contaminate
the interpretation of the results in terms of basic mechanisms.
Iron deficiency and humoral immunity
It is convenient to consider the function of the B lymphocyte under this heading as well as complement.
The B lymphocyte produces antibody in response to an antigenic stimulus. There is a complex
dependency of B cells on macrophages, T helper /inducer cells and T suppressor cells. Laboratory tests
of B cell function in iron deficiency have included measurement of immunoglobulin levels,
determination of isohaemagglutinin concentrations, the response to immunization with specific agents,
(in animals) the distribution of B lymphocytes in splenic tissue and the differentiation response in vitro
to stimulation with lipopolysaccharide.
Immunoglobulin production - Non-specific
Serum IgG and lgA have been reported to be normal in iron deficiency(93, 92• 88• 311• 445). Serum IgM
was reported in the same studies to be normal or increased(SS, 311). Where it was increased, there is
suspicion that this may have been due to recent infection.
Salivary lgA (3ll) and isohaemagglutininsC312) were also within normal limits in two studies.

2.32 IRON NUTRITION AND IMMUN:ITY
Secretory IgA in the gastrointestinal tract, however, has been reported to be increased in healthy
infants who had been fed iron.fortified milk for the first 8 weeks of life(274).
Immunoglobulin production . Specific
The results of tests of response .to immune function are not always consistent. ChandraC93)
documented normal responses to immunization with tetanus toxoid and typhoid O and H antigens in
children with iron deficiency anaemia. The control group used for comparison was not described.
Macdougall(Jll) found that response to immunization against diphtheria was diminished, but that
response to typhoid O and H antigens was comparable to the control group. The numbers of subjects
was small, and the iron deficient group may have been suffering from the confounding effects of
infection and/ or malnutrition.
Nalder et a!364) found a clear dose-response relation between the degree of iron deficiency and the
depression of response to immunization with tetanus toxoid in rats. However, as iron deficiency
induces malnutrition, the depressed antibody response may have been due to the effects of
malnutrition. This supposition is contradicted by the study of Kuvibidila(2Sl) who reported a
depression of response to immunization with sheep red blood cells in mice fed an iron deficient diet.
No such depression was·found in pair-fed controls.
Malakhovsky(J20) reported similar immune responses to natural infections in anaemic children and in
non-anaemic children. The micro•organisms inclu?ed staphylococcus, Shigella dysenteriae, Salmonella
typhimurium, Escherichia coli, Adenovirus and parainfluenzavirus •.
B cell function
In a study of B cell stimulation with bacterial lipopolysaccharide, KuvibidilaC283) found that cells from
iron deficient rats had a diminishe.d response. In vitro repletion by mouse transferrin, haemin or ferric
chloride did not restore responsiveness to bacterial lipopolysaccharide. The percentage of B cells in
spleen cell suspension was statistically lower and morphologic changes were noted in electron
microscopy of treated splenic cells in culture. Iron deficient mice<281) sensitized in vivo with sheep
erythrocytes generated fewer plaque forming cells per 106 spleen cells or 106 B lymphocytes.
• Evaluation of this report is difficult because it is not easy to understand the serological methods in the translation from the
Russian.
•

CHAPTER 2 LITERATURE REVIEW 2.33
The roles of T cells and macrophages in antibody production
The roles of the macrophage, T helper cell and T suppressor cell in the production of antibodies in iron
deficiency have not been studied(2Bl).
Complement Tests of complement levels in iron deficiency have shown CH50 and C4 to be normal(Jll, 92) and C3 to
be decreasei93), norm.al(92) and increasei311). In no study was malnutrition and/or infection
satisfactorily excluded. However, it would seem that complement levels are not changed in any
important way in iron deficiency.
Summary and conclusions
In summary, the best scientific evidence for an effect of iron deficiency on humoral immunity is the
work of Kuvibidila with laboratory mice. The clinical studies have involved small numbers of patients
and none excluded confounding effects of infection and malnutrition, but it would seem that antibody
response is depressed, at least to certain classes of antigens, although gross immunoglobulin and
complement levels are normal.
Table 2.6 Iron status and immune function Immunoglobulin and complement levels in iron deficiency. The table indicates the directions in which iron deficient groups differed from control groups. Non-significant trends are shown by enclosing them in parentheses. Where there is no clear trend an N is placed in the table.
=--=•::r.;11=s-eccaaa=mm==scaa:m:-==:=-mrm1::1:::::i:::e==:==r=--==-a:aaaa--==--=-===----=-ama::a=-••=-im=---=,=-: REF I Author I SERUM IMHUNOGLOBULJNS iHETEROHAEH-ilSOHAEHAGGLUTININS IS4LJVAI SERUM COMPLEMENT:
NIJ!rberl I lgG l lgH I lgA IAGGf.UTININSl ant; A I anti B I IgA I CH50 l CJ l C4 I -=-==---:====--=csc=cr=:=:aaam=:==•==:::ta=io---==m•--===r--=-act:1:---====--m:::sa=••Q-==-=oa:a-=-====-I , I
93 92
275
311 312 320
445
Notes:
!Chandra I (I) I
!Chandra N IKrantman (D)
IMacDougall N : MacOouga l l IMalakhovskyl
:sawitsky N
TEST RESULTS D Decreased
I (D) (D) (D) I
N N N N (I) (D)
(I) N N N I N N
N N N
N N
N No change I Increased

2.34 IRON NUTRITION AND. IMMUNITY
Table 2.7 Response to immunization in iron deficiency. The table indicates the directions in which iron deficient groups differed from control groups. Non-significant trends are shown by enclosing them in parentheses. Where there is no clear trend an N is placed in the table.
•111-aa::1111111---~··=--=-cn:=---aailll•-~-•mCla_ca_aa _____ alllda=_.__.__aa:m•a-aa--N-l
REF IAuthor IMMUNIZATION AGENT l B CELL STIMULATION I NuniJerl . l TETANUS lMISCELLANEOUSIDIPHTHERIAI TYPHOID l SHEEP l WITH BACTERIAL
I TOXOID I (see note) l TOXOID lO ag Hag l RSC I LIPOPOLYSACCHARIDE I aat11a-a==a-•;am=:a-•=-c:acr=:1aa=c:nsa--=---a.:i:·.r:.:mm•mD---=s=r _______ a:ar..._ ___ m•s::m1== J
93 !Chandra N
281 JKuvibidila I 283 lKuvibidila I
312 l MacDouga 11 I 320 lMalakhovskyl 364 JNalder D
NOTE Miscellaneous:
TEST RESULTS D Decreased
N N N
D
(D) (D) N
N
Staphylococcal antigen, Shfgella dySenteriae, Saloonella typhi (Wida]), Adenovirus, Parafnfluenzavirus all nonnal seroconversfon rates or titre
N No change I Increased
Iron deficiency and T cell function
Tests of T cell lymphocyte function in iron deficiency have included absolute counts and relative
proportions of T cells, cytolytic activity and blastogenic response to mitogens. The results of all such
studies found in the literature search are summarized in tables 2.8, 2.9 and 2.11 and are discussed
below.
T cell absolute number & .proportion of lymphocytes
Table 2.11 shows that 4 studies of iron deficiency have found a decrease in the percentage of T ce11sC39,
93•
275•
473) and one study has reported a normal proportion of T cell/92
). The absolute number of T
cells was only reported by one groul275) who found it to be depressed. No fundamental mechanisms
have been proposed to account for these findings but Kuvibidila et ai<283) have suggested that there
may be a block in haemopoietic cell differentiation.

·(
CHAPTER 2 LITERATURE REVIEW 2.35
Lymphocyte blastogenic stimulation
The response of T lymphocytes to stimulation with a wide variety of mitogens has been reported to be
depressed in 11 studies listed in table 2.8 •. Only two reports of unchanged or increased blastogenic
response ·of lymphocytes from iron deficient patients were located in the literature search<277•
243>. Neither report includes an estimation of the probability of not detecting a real change (ie the type II
error).
Many of the clinical studies do not allow the confounding effects of over- or under-nutrition, vitalllin or
zinc deficiency and infection to be ruled out. The most sophisticated experiments ( as is to be expected)
were performed on laboratory miceC281• 283). The test group, which was fed an iron deficient diet was
compared to:
a control group, fed ad libitum an iron sufficient diet
a pair-fed group, fed the iron sufficient diet, but limited to the quantity consumed by the iron
deficient group.
a repleted group which had been fed the iron deficient diet until they were anaemic and then
fed the iron sufficient diet (for 7 - 14 days) until their haemoglobins had been restored to
normal
The results showed a marked and consistent depression of response to PHA and to Con A in iron
deficiency with restoration to normal levels in the iron repleted mice.
The rest~ration of blastogenic responsiveness contradicts the hypothesis proposed by Joynson et a/243)
and Bhaskaram et at<39) to explain their failure to demonstrate such a return to normality. Their
theory was that response to mitogens is delayed after repletion of iron status.
KuvibidilaC281) reported that in vitro repletion by mouse transferrin (10 - 30 ug/ml) and ferric chloride
(0.25 • 1 ug/ml) partially restored responsiveness to stimulation by PHA, but not Con A and also
decreased the responsiveness in the two control groups. Haemin (05 · 5 uM) partially restored
responsiveness to PHA and Con A stimulation in T lymphocytes, and decreased the response of the
controls to both mitogens. In vivo repletion restored mitogenic response after 10 days of feeding on an
iron supplemented diet.
• Srikantia<473l reported a decreased response to PHA stimulation but the statements made in the text do not agree with the
data tabulated. I have assumed that the statements are correct and that there is a typographical error in the table.
Macdougall et al 1975<311> studied lymphocyte transformation in response to stimulation by phyto-haemagglutinin and candida
antigen in 15 iron deficient infants, 11 of whom were anaemic. Both the latent iron deficiency group and the anaemic group
had significantly lower incorporation of 3H-thymidine than the controls. Ten patients were retested two to three months
after treatment with intramuscular iron dextran. No statistical tests were published, but the published data were sufficient
to allow a paired t test to be made. This yielded significance levels of 0.002 and 0.02 for phytohaemagglutinin and candida
respectively. Unfortunately, no controls were retested so the reasons for the improvement can not be assigned with
confidence to the treatment.

2.36 IRON NUTRITION AND IMMUNITY
The results of tests of T cell response to mitogens in the face of iron deficiency are not entirely
consistent, but the best controlled study and overall impression indicate that iron deficiency is
associated with a reduction in response.
Possible mechanisms for this reduction have been suggested by Kuvibidila et af'2J>,3). They assert that
decreased mitogenic responses may be partly, but not entirely, due to decreased percentages of mature
T cells (assessed by density of anti- antigen on the cell surface). The reason for this assertion was
that they failed to reverse mitogenic responses by enriching the T cell fraction by using nylon wool to
remove null cells. These authors further hypothesize an increasing effect of iron deficiency on less
mature T cells (Con A responsive) compared to the more mature PHA responsive cells. An alternative
mechanism could be an increase in null cells resulting in interference with PHA responsiveness. More
likely alternatives are the possibility that lymphocytes from iron deficient subjects interact poorly with
mitogens and/or have a decreased survival in vitro.
Lymphokine production
MIF (migration inhibitory factor) production m response to Candida antigen and to PPD was
depressed in iron deficient patientsC255)
Cytolysis
Cytolysis· of tumour cells was depressed in iron deficient mice<277).
Several possible mechanisms for this defect in T cell function are proposed by the authors. Iron
deficiency might lead to a decrease in the proportion of mature lymphocytes which are sensitized and
become cytotoxic or respond to non-specific mitogens. Or, it might lead to a defect in the sensitization
process itself. A third possibility is that the killing capacity of ea.ch cell might be reduced. Or, ther~
may be some combination of the hypothesized mechanisms. Qualitative impressions of microscopical
examination of sensitized splenic cells incubated with tumour cells were that iron deficiency did not
impair the ability of attacker cells· to contact and adhere to target cells. This suggests that iron
deficiency is most important at the level of cell lysis.
• The experiment employed cytolytic cells harvested from the spleen and peritoneal cavity. The a1,1thors cite a previous study in
which the percentage ofT lymphocytes in spleen cell s1.1spension was found to be approximately 50, 44 and 27% in the
control, pair-fed, and iron deficient groups respectively. The authors state, witho1.1t data, that the peritoneal cells included
macrophages as well as lymphocytes. The st1.1dy is incl1.1ded in this section on the assumption that T cells would have been
central to the cytolytic fonction even for the peritoneal cells.

CHAPTER 2 LITERATURE REVIEW 2.37
Delayed cutaneous hypersensitivity
Table 2.9 summarizes the results of 10 studies of delayed cutaneous hypersensitivity in iron deficiency.
Nine authors report diminished responses to 23 tests of 9 different sensitizing agents. Two authors
report 2 tests which showed a normal response to ppo(93) and to DNFB(366). These 2 "negative" "
reports contrast with the 23 "positive" reports. The evidence for an impaired delayed cutaneous
hypersensitivity is thus fairly strong, although it must be stated again that the results of clinical studies
are open to potential confounding influences from malnutrition and infection. The one carefully
controlled study on laboratory animals confirms the clinical investigations(284).
Kuvibidila(2Bl) reported that a single injection of parenteral iron dextran 24 hours before the recall
dose of DNFB restored responsiveness to normal.
No mechanisms have been proposed to account for this effect of iron deficiency although
KuvibidilaC281) noted that iron deficiency did not impair sensitization, and both Kuvibidila et aiC284> and
Krantman et a/275) theorized that it may involve factors such as monocyte chemotaxis, local
inflammatory response by mast cells and lymphokine production. The latter perhaps due to decreased
ribonucleotide reductase activity.
Summary and conclusions
Laboratory tests of immune function are particularly sensitive to methodology. The results of
lymphocyte biastogenic stimulation depend on duration of incubation at each stage as well as culture
media and other factors. For this reason comparisons of results between different laboratories should
not be made without careful validation of the procedures employed(63>.
In summary, the clinical evidence is suggestive of a decrease in the proportion of T cells, impairment of
delayed cutaneous hypersensitivity and lymphocyte biastogenic response to mitogens including
phytohaemagglutinin, candida antigen, concanavalin A, · pokeweed mitogen, tetanus antigen and
purified protein derivative of Mycobacterium tuberculosis. The studies on laboratoi:y animals confirm
the clinical observations and show that cytolytic activity is also impaired .. In addition, the sensitization
step does not seem to be affected. Although these laboratory studies seem conclusive, they have all
been performed in one laboratory and independent confirmation by other workers would substantially
strengthen the hypothesis of iron deficiency causing a defect in T cell function.
The biochemical mechanisms for these effects of iron deficiency remain to be elucidated although
many papers note the impairment in DNA synthesis found by Hershko(223) and the inhibition of
ribonucleotide reductase found by Hoffbrani229). An interesting surmise was made by Gross et
aP99\ namely that iron deficiency may interfere with folate metabolism since folate deficiency
adversely affects cellular immunity.

2.38 IRON NUTRITION AND IMMUNl1Y
Table 2.8 T Lymphocyte stimulation tests in iron deficiency. The table indicates the directions in which iron deficient groups differed from control groups. Non-significant trends are shown by enclosing them in parentheses.
REF IAuthor Nuni:Jer:
39 !Bhaskararn I 92 !Chandra 93 !Chandra
169 !Fletcher 199 !Gross 255 !Joynson
275 lKrantman 277 lKulapongs 285 IKuvibidfla;
283 lKuvibidilal 311 I MacDouga 11 l 445 lSawitsky
473 JSrikantia
TEST RESULTS D Decreased
L YHPHOCYT£ STIMULATION HITOGEN ' I
.. MISCELLANEOUS
PHA I C4NDIDA1 CON A I PWM I PPO I TETANUS!
D D D
D (D)
(D) ( I}
D D D
D
(0)
(D)
D
' ' '
0
(0)
I Increased
I
' I , I
D
(O)
jl)'111phokine production: Decreased
,. '
!Cytolysis of t1JJOOur cells: Decreased!

CHAPTER 2 LITERATURE REVIEW 2.39
Table 2.9 Delayed cutaneous hypersensitivity in iron deficiency. The table indicates the directions in which iron deficient groups differed from control groups. Non-significant trends are shown by enclosing them in parentheses. Where there is no clear trend an N is placed in the table.
• I ••••cn1aaoa••===••••a:•:a•a•D==ew:ta•a••••:nn:n:1 .. ;&aa::::::aa.t11••i11u:s-=:s::-...--=--•a~•=•m==-•----enaaa=---=*='=a:,
I
REF : Author : AGENT 1
Nu*rl lONCB l PHA I CANOIOA l PPO l HulTf}s l Trichophytonl SK/SD 1Diphtherial Tetanus l I toxoid I toxoid I
=--=--===-••t::ss:::a=sa=-=-==-a•••==l:l••a===----c•~=---=•---=-=------.m-a::S211:••====•••a:=::1a:=-=rcs f
39 lBhaskaram: lChandra
N I t
93 92
91
:chandra
:chandra
(D) D
D
N (D)
(D)
(D) D
D
(D) D
D
D D
D
199 :Gross N 255 :Joynson D D
275 lKrantman I . I D D
284 lKuvibidilal D 311 : Macdouga 11 l D 0 D
Test results 0 Decreased N No change I Increased
Abbreviations: ONC8 01nitrochlorobenzene PHA Phytohaemagglutinin SK/SO Streptokinase/Streptodornase PPD Purified protein derivative of Hycobacterium tuberculosis
Iron deficiency and polyrnorphonuclear leukocyte function
Neutrophil and macrophage function has been measured in iron deficiency by several tests summarized
in tables 2.10 and 2.12. The tests include reduction of nitroblue tetrazolium (NBT), chemotaxis,
opsonic activity, phagocytic activity, bactericidal activity and activity of the iron containing oxidative
· enzymes NADPH-oxidase, myeloperoxidase (MPO) and catalase.
Opsonic activity
The neutrophil has surface receptors for the Fe portion of IgG and for complement C3b. If a
bacterium has been coated with either of these substances its contact with a neutrophil and subsequent
phagocytosis is facilitated. This process of rendering bacteria more "digestible" is not considered under
the, perhaps more appropriate heading of humoral immunity because it (and chemotactic activity) are,
in the literature, usually grouped together with more direct tests of polymorphonucleocyte (PMN)
function.

'
2.40 IRON NUTRITION ANil IMMUNITY
Chandra and Sarayi93) reported that opsonic activity of plasma for Candida albicans was normal in
iron deficient children. Foroozanfar et af.114) found it to be diminished in ''professional blood donors"
who were ''profoundly iron deficient, anaemic and ma/nourished", often selling up to 900 ml blood a
week.
For Staphylococcus aureus, opsonic activity of the serum or plasma from iron deficient individuals was
reported to be normal(S8).
Opsortic activity does not appear to be severely affected in iron deficiency.. This is compatible with
observations of normal levels of IgG and complement in iron deficiency.
Phag9cytosis
The phagocytic activity of PMNs has been reported to be normal in iron deficiency for Candida
albicans by Chandra and SarayaC93), for Staphylococcus aureus by Chandra(88) and for Staphylococcus
aureus, Streptococcus pneumoniae and Salmonella typhimurium by Moore and Humbert<352).
Moore and Humbert also report a decreased phagocytic activity for Candida a/bicans which returned
to normal on restoration of iron status.
The latter authors speculated that there might be a reversible, Candida-specific membrane defect in .
PMNs in iron deficiency.
These studies lead to the conclusion that there may be a minor impairment of phagocytosis in iron
deficiency.
Killing activity Polymorphonuclear leukocytes contain lactoferrin which appears to play an essential role in killing
phagocytosed bacteria. If the intra-cellular iron-binding protein is saturated with iron, by exposing the . \
cell to ferritin-antibody complex for example, the bactericidal power of the cell is greatly reduced(65).
The reason may be that lactoferrin withholds iron from intra-cellular micro-organisms
Rohrer et a/<424) reported that macrophage mediated tumouricidal activity is decreased in iron deficient
mice compared to both pair-fed and ad iibitum fed mice.
Bactericidal activity has been found to be decreased for Staphylococcus aureus in 8 stuq.ies (see table
2.10). It has also been reported to be decreased for Candida albicans in 2 studies and Escherichia
coli in 2. In one study each it has been normal for Escherichia coli, Streptococcus pneumoniae and
Salmonella typhimurium •

CHAPTER 2 LITERATURE REVIEW 2.41
Staphylococcus aureus, Candida albicans, Escherichia coli and Salmonella typhimurium are catalase
positive organisms, while Streptococcus pneumoniae is catalase negative. Catalase negative organisms
lack the protective effects of catalase and thus can be killed after phagocytosis by self-generated ~02•
In contrast, catalase positive organisms, once ingested by the phagocyte must be attacked by the ~02
originating from the PMN in conjunction with the peroxidase-halide system<352).
Moore and Humbert<352) point out that if neutrophil oxidation is defective in iron deficiency then there
would be a defect analogous to that in chronic granulomatous disease. The normal killing of
Streptococcus pneumoniae and decreased killing of Staphylococcus aureus, Candida albicans and
Escherichia coli in iron deficiency are consistent with this hypothesis. Salmonella typhimurium is
catalase positive, and it might have been expected that it too would not be killed efficiently in iron
deficiency. Moore and Humbert propound the hypothesis of Okamura and Spitznagd374) that
Salmonella typhimurium (which has a peculiarly long intra-cellular sutvival) is normally killed by non
oxidative mechanisms dependent on the bacterium's lipopolysaccharide structure ..
In summary, iron deficiency seems to produce a microbicidal defect similar to, but less severe than,
that of chronic granulomatous disease. The defect manifests itself towards catalase positive micro
organisms such as Staphylococcus aureus and Candida albicans. The possible biochemical
mechanisms are discussed in detail below.
Chemotaxis
Macdougalf311) reported normal chemotactic activity of Escherichia coli endotox:in activated serum in
iron deficient children. The chemotaxis of their PMNs was also within normal limits. Foroozanfar et
aP74) in "professional blood donors" found that chemotactic activity and chemotaxis were reduced.
Their subjects were malnourished as well as iron deficient. The evidence for a depression in
chemotactic activity and chemotaxis is thus no more than suggestive.
No mechanism was proposed to explain the defect in chemotaxis and chemotactic activity.
Leukocyte al~aline phosphatase
Celada et aJC85) found a direct relationship of haemoglobin to leukocyte alkaline phosphatase in
neutrophils as iron status was manipulated in rabbits by bleeding them and then treating them with
iron dextran .
. The authors noted that leukocyte alkaline phosphatase may have different functions in the rabbit and in
man as it is located in different sub-cellular structures. They also noted that the enzyme bas no known
role in bactericidal activity, but that it is elevated in response to bacterial infection. The authors cite a

2.42 IRON NUTRITION AND IMMUNITY
case report of a patient with selective leukocyte alkaline phosphatase deficiency who presented with
recurrent infections and was found to have granulocytes with reduced bactericidal activitf 86).
Hexose monophosphate shunt activity Latex particle· hexose monophosphate (HMP) shunt activity was measured in granulocytes by Yetgin et
al(SZ6). The iron deficient group had a mean stimulation index significantly lower than that of the
healthy control group. The patients were malnourished as well as suffering from iron deficiency
anaemia. The authors did not hypothesize a cause for the reduction in HMP shunt activity, but did
discuss its significance.
The authors imply that it may play a similar role in the polymorphonucleocyte to its function in the
erythrocyte. In the red cell, the hexose monophosphate shunt provides NADPH for the reduction of
oxidized glutathione (G-S-S-G) to reduced glutathione (2G-SH}'326). This reaction is aitalyzed by
glutathione reductase. In turn, reduced glutathione removes I:S02
from the erythrocyte in a reaction
catalyzed by glutathione peroxidase:
2G-SH + H20 2 ---- > G-S-SG + 2l:SO
The authors did not explain how this might affect the bactericidal capacity of the granulocyte. As I:S02
is important in killing bacteria it would seem that if its degradation was decreased, bactericidal capacity
might be increased (if the polymorphonudeocyte was not damaged itself). Also, in favism where
glutathione peroxidase is deficient, the affected individuals do not suffer from increased susceptibility
to infection<239) as might be expected if decreased degradation of I:S02 impaired the phagocyte.
A second function of the hexose monophosphate shunt, but not discussed by these authors, is the
provision of pentoses for nucleotide and nucleic acid synthesis<326). It is tempting to speculate that it
may be the depressed hexose monophosphate shunt activity that is responsible for the decreased
synthesis of DNA that has been observed in iron deficiency. Or, perhaps, the situation is vice versa, as
the enzymes of the hexose monophosphate shunt have not been reported to be dependent on iron.
NBT reduction
Table 2.10 shows that nitroblue tetrazolium reduction has been found to be diminished in 4 studies and
within normal limits in 4 other studies. NBT dye is reduced to a visible blue colour by superoxide
produced by NADPH-oxidase in the PMN during the phagocytic-induced metabolic burst. Infection
increases NBT reduction activity and may be the reason for the normal test reported in 4 of the clinical
studies. In one of the studiel226), the NBT reduction test was used only as a qualitative screen to
exclude patients with chronic granulomatous disease.

CHAPTER 2 LITERATIJRE REVIEW 2.43
The qualitative nature of the NBT test is unfortunate because it allows no more than a crude estimate
of oxidative activity to be made. NADPH-oxidase includes a moiety of cytochrome b which contains
iron. Iron deficiency might decrease the quantity or activity of cytochrome b(352).
Myeloperoxidase activity
In the search for metabolic mechanisms for the defect in killing activity noted in iron deficiency, intra
cellular myeloperoxidase has been measured in tissue macrophages and circulating neutrophils. Table
2.12 summarizes these studies (and others). Myeloperoxidase was reduced according to 6 reports.
(Higgs and ~ ells used a qualitative screen of myeloperoxidase activity to exclude its deficiency in their
study of iron deficiency in chronic muco-cutaneous candidiasis<226) .)
The defect in bactericidal activity found in iron deficiency would seem to be, at least in part, due to
myeloperoxidase deficiency.
Catalase activity
Sagone et d 441) found a trend towards decreased levels of catalase activity ( and myeloperoxidase) in
granulocytes from iron deficient patients. These authors noted that catalase contains iron and plays an
important role in oxidative killing by phagocytes.

2.44 IRON NUTRITION AND IMMUNI'IY
Table 2.10 Neutrophil and macrophage stimulation tests in iron deficiency. The table indicates the directions in which iron deficient groups differed from control groups. Non-significant trends are shown by enclosing them in parentheses. Where there is no cleat trend an N is placed in the table.
REF I Author f Opsonic IPhagocyticlBactericidall ChenKJtaxis: I NBT I Hyelo- I HHP :catalasel
l l PLASMA l CELLS I Nunberl lActivityl Activity: Activity JClass. Alt.IC/ass. Alt. lReduct.:peroxfdase: aoaa ____ mlD:J:U1tc:n::==a==i=:s====----==------aaamma ____ ~---=--=--m•-••oaas-.==.a=t._;a,
9 lArbeter 11 :eaggs 85 :celacta
93 lChandra 88 lChandra 92 !Chandra
IN: Ca IN: Sa
174 lforoozanfar:o: Ca 259 lKatsushima. 226 lHiggs
225 lHigashi 277 IKulapongs 311 . l Macdouga 11
328 352
lMasawe lMoore
424 !Rohrer 441 lSagone 473 :srikantia
506 :waiter 526 JYetgin
Notes:
IN: Sa
IN: Ca IN: Sa
l(D): Sa JN:St
ID: Sa ID: Sa lD: Sa
lO :Ca
I I •
IN: Ee 10: Sa
l l (D): Sa IN:Sa,Sp,StlN: Sp, St ID:Ca
IN: Sa
:o: Sa, ca
10: tUIOOUr
ID: Ee
ID: Sa ID: Sa
I • I
D 0 D
N
D
D D
N
N
N
0
N
D D
(0) N
0
0
(O)
N
Sa Staphylococcus aureus Sp Streptococcus pneunr:miae St SalnKJnella typhilfl.lrium Ee Escherichia coli Ca Candida albfcans
0 Decreased N Nonnal I Increased
(O)
0
Cherootaxis was ireasured using either the subject's plasma or cells, and employed either the classical or the alternate pathway for activation (with Ag/Ab complex or endotoxin).
Summary and conclusions
The work reviewed above provides fairly strong evidence for reduced phagocyte killing in iron
deficiency, similar to, but less severe than the defect in chronic granulomatous disease. The source of
the defect seems not to reside to any important degree in chemotaxis, opsonic activity or phagocytosis,

CHAPTER 2 LITERATURE REVIEW 2.45
but to stem from decreased activity of iron contammg oxidative enzymes viz myeloperoxidase,
NADPH-oxidase and catalase. The hexose monophosphate shunt may also be ineffective in
polymorphonucleocytes in iron deficiency, but the significance of this is not clear.
Iron deficiency and lymphoid tissue
White blood cells
Table 2.11 summarizes the results reported from microscopic studies of white blood cells in iron
deficiency and table 2.12 summarizes results from biochemical studies.
The results from clinical studies may include confounding effects of infection and/ or malnutrition.
Giving more weight therefore to the laboratory animal studies leads to the conclusion that total white
blood cell count, lymphocyte count, neutrophil count and T and B lymphocyte number and proportion
may all be decreased in iron deficiency. KuvibidilaC281) reported that null lymphocytes were increased
in iron deficient mice.
Monocytes, basophils and eosinophii counts seen to be unaffected by iron deficiency.
Morphological abnormalities have been reported by Beard et a1(2S) and Cbanarin et at<86) for
neutrophils, by Jarvis et af-249) and KuvibidilaC281) for lymphocytes in iron deficiency.
Bone marrow Chronic iron deficiency often results in hypercellularity of the bone marrow. The studies on bone
marrow changes in iron deficiency that are discussed below did not characterize the cellular
distribution. It would be interesting to know how the erythroid and myeloid lines are affected. Is there
a delay at a specific stage in development, or are all stages from the common stem cell equally
affected?
.Kuvibidila(28l) has presented evidence that iron deficiency results in a delay in the maturation of
monocytes in mice. Tavasom(493) described delayed marrow regeneration following correction of iron
deficiency in chronic iron deficiency in rats.
Sawitsky( 445) report~d that granulocyte proliferation m 1 of 5 patients with iron deficiency was
depressed in in vitro bone marrow culture as measured by tritiated thymidine labelling.

2.46 IRON NUTRITION AND IMMUNITY
DNA synthesis in bone marrow has been noted to be diminished in iron deficiency by Hoffbrand et
a/..229), Hershko et af-223) and Kuvibidila<281>. The rate of RNA synthesis was not affected although the
total content of RNA/109 nucleated cells was decreased(223).
Spleen
The changes to splenic histology induced by iron deficiency in rabbits were described by Rodvien et
af..423). The white pulp was enlarged and the red pulp congested with red cells. Ultrastructural
changes to macrophages, lymphocytes and reticular cells included abnormalities in mitochondria,
endoplasmic reticulum and membrane structure.
Rothenbacher et af-430) studied histopathological changes induced by chronic severe iron deficiency in
rats. Both the white pulp and the red pulp were markedly decreased. The spleens were half the size of
those of the controls and constituted a smaller percentage of body weight. Although it was cited, The
authors did not discuss the discrepancies from the study of Rodvien et al.
Kuvibidila and co-workersC282• 281• 43o) reported a decreased percentage of T and B lymphocytes in
splenic tissue. The same laboratory also observed that the weight of the spleen in relation to the total
body weight increased in laboratory mice.
No reports have been published of studies in human of the pathophysiology of the spleen in iron
deficiency.
Thymus
The weight of the thymus was decreased in iron deficient miceC281) and ratsC430>. The T lymphocyte
component was greatly decreased in the iron deficient rats, while the epithelial cell component was
relatively increasei 430).

· CHAPTER 2 LITERATURE REVIEW 2.47
Table 2.11 Leukocyte counts and morphology in iron deficiencr. The table indicates the directions in which iron deficient groups differed from control groups. Non-significant trends are shown by enclosing them in parentheses. Where there is no clear trend an N is placed in the table.
REF I Author : WBC llyrrphocytelMonocytelBasaphillEosinophfllPolyrrvrphl Nucleated I T Cells 18 cells! NuntJerl ;109/1 I 109/1 I Count l Count I Count l Count !Spleen cellsl No. % I SMlg : ••••---•1=1:=••===-=a-•zcn==-•-==-•===-•••a---=-m=------ISalll---••m•-••--=•••c----aaa:sCh:J_aa:_-=r••i
39 IBhaskaram 93 !Chandra 92 !Chandra
169 I fletcher 275 !Krantman 11.5 283 IKuvibidi la 7.8
473 1Sr1kantia
/
>1.89 3.0
D
If N (D)
N
N N D
D D N ff
(1) (D) (I)
D

2.48 IRON NUTRITION AND IMMUNITY
Table 2.12 Biochemical and morphological studies in iron deficiency. The table indicates the directions in which iron deficient groups differed from control groups.
REF l Author Numberl
12 :Baggs 11 :Baggs 25 !Beard
85 !Celada 86 :chanarin
223 :Hershko
225 !Higashi 226 !Higgs 229 IHoffbrand
249 !Jarvis 259 lKatsushima 283 IKuvibidila
282 IKuvibidila n
n n
354 !Munn n I tt
I
352 !Moore 423 JRodvien
n tt
STUDY ANO RESULTS OF IRON DEFICIENCY
:oecreased ff\Yeloperoxidase in macrophages & neutrophils :Decreased 111Yeloperoxidase positive cells in lamina propria & submucosa !Neutrophil nuclei hypersegrrented, giant metaff\Yelocytes
!Leukocyte alka.line phosphatase decreased and rose with hael!llglobin !Increased segmentation of neutrophils :Decreased nucleic acid synthesis in bone marrow
jMyeloperoxidase reduced in l!Klnocytes and neutrophils IMyeloperoxidase normal in chronic mucocutaneous candidiasis with iron deficiency :oesferrioxamine inhibited DNA synthesis(? inhibited ribonucleotide reductase)
!Lymphocyte mitochondria were swollen, and vacuolated !Decreased leukocyte peroxidase in a case of hypochromic anaemia !Decreased nucleated cells in spleen
:oecreased T lymphocytes in spleen :weight of spleen/lOOg body weight increased: Ratio of dry to wet weight incr;eased !Weight of thymus and liver decreased
:oecreased ONA synthesis in lymphocytes :Decreased plaque fanning cells (B lymphocytes) after sensitization by sheep red blood celli
lMyeloperoxidase reduced in granulocytes !Spleen: enlarged white pulp and congested red pulp. Splenic macrophages, lymphocytes&. :reticular cells: changes in mitochondria, endoplasmic reticulum and membrane structure
430 :Rothenbacher!Impaired T & B cell lymphopoiesis 441 :sagone !Trend towards decreased granulocyte catalase & myeloperoxidase 445 1Sawitsky . !Labelling index of granulocyte proliferative compartment of bone marrow depressed
493 ITavasolli !Impaired regeneration of marrow tissue
Summary and conclusions - Lymphoid tissue in iron deficiency
Total white cell count, lymphocyte count, neutrophil count, and T and B lymphocyte number and
proportion seem to be depressed in iron deficiency. The spleen and thymus may be both relatively and
absolutely diminished in weight, and their histology indicates disturbed production of lymphocytes.
Bone marrow growth and metabolic activity are diminished with decreased nucleic acid content and
DNA synthesis. The evidence is stronger for some effects than others and is broadly consistent.
I

CHAPTER 2 LITERATURE REVIEW 2.49
Iron as a modulator of immune function
The regulation of the immune system is pivotal in understanding the defense against infection and the
role of iron and associated molecules ( citrate, lactoferrin, isoferritins ( acidic and basic), and other
uncharacterized factors) is gradually being worked out. There is a growing body of literature in this
complex area and this section does not attempt to review this comprehensively. The aim is rather to
highlight'a few studies in order to emphasize the importance of the concept of regulation.
The role of iron as a possible modulator of the immune system was investigated by Munn<354) • In
vitro assays of human lymphocyte function were made where the concentration of ferric citrate,
transferrin, lactoferrin, ferritin or haemin was varied at differing stages of the response to various
mitogens. Iron modulated the immune response of B cells, enhancing or depressing the assay
depending on the concentration. Munn did not attempt to relate the findings to the physiological
response in vivo other than to speculate that iron may play a regulatory role in modulating immune
function.
The uptake of tritiated thymidine and uridine was increased in PHA stimulated lymphocytes by iron
transferrin in serum free medium, and not by iron or apoferritin<396). Similar results were obtained for
concanavalin A stimulated lymphocytes<318).
Iron bound to transferrin enhances lymphocyte response to stimulation with PHA(396). Interleukin-2
stimulates T lymphocyte production, at least in part, by induction of transferrin receptors on these
cells(367).
Ferric citrate enhanced the proliferative response of peripheral blood lymphocytes to PWM and
suppressed the response to PHA and Con A. Ferritin (iron content not stated) had no effect on PWM
stimulation, but suppressed the response to PHA and Con A stimulation<61).
Ferric citrate significantly suppressed the expression of the OKT3 and OKT4 molecules in PWM
stimulated lymphocytes. The helper/suppressor ratio was decreased and the transferrin receptor
(OKT9) was significantly enhanced. Three other activation-associated markers were not changed by
iron, viz OKia, OKTlO and the receptor that forms thermostable erythrocyte-rosettes<62).
Transferrin, in the absence of serum, augmented proliferation of human lymphocytes to
phytohaemagglutinin, concanavalin A and pokeweed mitogen<8). The response appeared to be
independent of the metal content.
It has been suggested that lactoferrin, transferrin and acidic. iso-ferritins may act as regulatory
molecules in suppressing myelopoiesis, the production of granulocytes and macrophages by controlling

2.50 IRON NUTRITION AND IMMUNITY
the availability of iron to specific target cell5'59). This hypothesis is very controversial and the
interested reader is referred to Broxmayer et af-.59), Munn(354) and to Nishiya et af.369) for detailed
discussion on the apparently conflicting nature of experiments in this area and more extensive guides to
the literature than Olli be provided here.
Iron status and infection - Animal studies
The intention in this thesis is to concentrate on clinical studies of the relationship between iron status
and infection. Animal studies could not be ignored, however, as they allow more precise testing of
hypotheses in experiments that could not be conducted in humans.
Table 2.13 summarizes a representative, but incomplete, selection of such studies .. As all the studies
involved intentional infection of the experimental animal with a specific organism it seemed logical to
classify the reports according to the type of organism. To allow this body of work to be placed in
perspective, the table also shows classes of organism which have not been studied. Some major gaps in
our knowledge are thus made evident.
The investigation with the broadest spectrum seems to be that of Payne<39l) who examined the
dependency on iron of various strains of several species of gram-negative bacteria. The results are
summarized in table 2.13 part 6. From this work, Payne derived a classification scheme that reflects
the efficiency of iron acquisition by bacteria and the clinical consequences.
Bacteria were categorized according to their virulence in the face of altered iron status in the chick
embryo.
Class I bacteria remained equally virulent in spite of increased iron or the presence of iron binding
proteins. These organisms have particularly effective iron acquisition systems that are not limite~ by
physiological concentrations of iron or by iron binding proteins such as conalbumin.
Class II bacteria are normally virulent, but cannot obtain iron from iron binding proteins which thus
render them avirulent.
Class III bacteria are normally relatively avirulent but are enhanced in the presence of available iron.
These organisms have less eff ec:tive systems for the acquisition of iron.
Class IV bacteria are avirulent irrespective of iron status.

CHAPTER 2 LITERATURE REVIEW 2.51
Classes I, II, and III have iron acquisition systems of decreasing efficiency. The summary in Table 2.13
does not show that the iron acquisition systems may be strain specific. A particular species may have
strains of differing Payne classes.
These notions are useful in interpreting the studies listed in Table 2.13. They concentrate attention on
the effects of iron on the pathogen. But, the virulence of an organism depends on its invasiveness in
relation to the host's immunity. In Payne's model the host's immune function was held constant (apart
from acute changes in iron status). Many of the studies in Table 2.13 do not do this and hence Payne's
scheme could be misleading if applied without due consideration of the above factors.
The pattern shown by the results of the tabulated studies is that many bacteria, fungi and protozoa are
reduced in virulence by iron restriction in the host and enhanced by readily available iron.
One study that allows effects of iron status to be estimated for both host and pathogen is that of
HartC209> who found in the rat that moderate iron deficiency protected against induced pyelonephritis
but that severe iron deficiency reduced resistance. The numbers of test animals in this experiment
were small, and it would have enabled much more confidence to be placed in the results if 4 or 5
different degrees of iron deficiency had been employed and had shown the U-shaped trend expected
from the conclusion drawn by the author.
The studies on nematode helminths are interesting. All showed increased virulence with iron
deficiency. The most likely reason for this is that the parasites are able to obtain sufficient iron for
their needs from the host irrespective of the host's iron status and that iron deficiency renders immune
function less effective.
The studies on the effects of iron status on resistance to viral infection should be interpreted cautiously.
The most likely reason for ferric ammonium citrate enhancing virulence of mouse hepatitis virus is that
it is directly toxic to the live/510>. Not much confidence can be placed in the "negative" results of the
study. on the effects of iron deficiency on viral infection since this had only 4 calves in the test and
control groups and employed an attenuated strain of parainfluenza virusC350>. Clearly, larger studies
with virulent viruses from the entire spectrum of types of viruses are required.

TABLE 2.13
Ref Number
Author
IRON STATUS AND INfECtION: ANIMAL STUDIES: EFFECTS OF IRON DEFICIENCY
DATE ANIMAL PATHOGEN RESULTS Effects of iron deficiency/chelation
==----------------------------------------------------------------------------------------------------------------------------~-~-====~======================~=====-=======
BACTERIA: gram-positive cocci
BACTERIA: gram-negative cocci 392 Payne 1978 Chick embryo 390 Payne 1975 Chick embryo 231 Holbein 1981 Mouse 298 Letendre 1984 Mouse
BACTERIA; enteric gram-negative·bacilli 66 Bullen 1972 Guinea pig 65 Bullen 1979 Guinea-pig 64 Bullen 1975 Guinea-pig
209 Hart 1982 Rat 257 Kampschmidt 1974 Rat 12 Baggs 1974 Rat 11 Baggs 1973 Rat
254 Jones 1977 l\'louse 271 Kochan 1978 ll'louse 296 Puschmann 1977 Mouse 448 Schade 1944 Mouse 268 Kluger 1979 Rabbit
BACTERIA: other aerobic bacteria 490 Sword 1966 l\'louse
Neisseria gonorrhoeae Neisseria gonorrhoeae Neisseria rneningitidis Neisseria meningitidis
Escherichia coli Escherichia coli Escherichia coli Proteus mirabilis Salmonella species Salmonella typhimurium Salmonella typhimurium Salmonella typhimurium Salmonella t yphimuriurn Salmonella t yphimurium Shigella dysenteriae, Yersinia nultocida
Listeria 110nocytogenes
Part 1
Staphylococcus
Strains from disseminated infections not inhibited by conalbumin Relatively avirulent strains were inhibited by conalbumin Iron bound to transferrin enhanced infection Increased resistance to infection
Lactoferrin ~ transferrin were bacteriostatic Unsaturated oral lactoferrin reduced gut colony counts Less bacterial growth with G.-pig milk (lactoferrin, transferrin) Moderate iron deficiency protected against pyelonephritis LEM induced hypoferraemia and protected against infection Less resistant to challenge Increased susceptibility to infection Desferrioxamine decreased survival with wild type infection Less resistant to challenge Increased resistance to intraperitoneal infection Increased susceptibility to infection Growth inhibited by fever & hypoferraemia
Desferrioxamine increased·resistance
~ w O' kt ;-hi t.. w
.... a = Cl>
ii -= Cl>
Col Cl p.
s· ;> r:, C; Q
= ~ a· fl; -00 -= -e: ·~ ti> Cl> 0 z
~ ...;_i -0 z ~ t:1 -i ; -~

TABLE 2.13 IRON STATUS ANO INFECTION: ANIMAL STUDIES: EFFECTS OF IRON DEFICIENCY
===============;===========================·~===========--==================================---------=-=-~-=====================--------------=------~--------------------' Ref Author- DATE ANIMAL PATHOGEN RESULTS
Number Effects of iron deficiency/chelation ============================================~========-·=======================================------------~~==================---------------------------------------------
BACTERIA: anaerobic bacteria 228 Hill 1918 Mouse
PAYNE'S CLASSIFICATION OF GRAM NEGATIVE BACTERIA
391 Payne
KEY Class I: Virulent: Class II: Virulence Class III: Virulence Class IV: Avirulent
1911 Chick embryo
unaffected by iron status inhibited by iron-binding proteins enhanced by added ii-on even with iron supplementation
"anaerobes"
Neisseria gonorrhoeae Shigella flexneri Shigella dysenteriae Vibrio cholerae Neisseria rneningitidis Escherichia coli
NB Classification is strain specific, but is not 1ndicated in the tabulation
BACTERIA: Mycobacteria, Spirochetes, higher bacterial actin01nyces, nocardia
FUNGI 153 468
Elin Sofaer
1914 1982
Mouse Mouse
Candida albicans Candida albicans
Part 2
CLASS II ,III 11,III II ,Ill II ,III Ill III
Increased susceptibility to infection
Positive correlation between infection and transferrin sat. Anaemic mice tended to have increased infection & colonization
~ (j to)
! a ;" w ~ w
~ N - t-4
"'I -0 ;l = "' S"
I -= ,.,, s:.,
= "' er ii'
~ !") .... ;s· =
~. ~ a· s:., -CJl -= e: n, ,.,,

TABLE 2.13 IRON STATUS AND INFECTION: ANIMAL STUDIES: EFFECTS OF IRON DEFICIENCY
===========~==============~~===================;~===~=-----=-=-------======-=-=--------·-------------------------------------------------------------------=~=====-===~-==== Ref NlJITlber
Author DATE ANIMAL
RICKETTSIACEAE, MYCOPLASMA, CHLAMYDIA
PROTOZOA 144 286
Duncombe Lalonde
HELMINTHS: intestinal 179 Foster 116 Cutm1ins 142 Duncombe 143 Duncombe 405 Porter
1980 1984
nematodes 1936 1976 1977 1979 1935
Mouse Mouse
Dog, Rat Rat Rat Rat
cat
HELMINTHS: tissue nematodes, cestodes, trematodes
VIRUSES 350 l'lollerberg 1975 Calf
PATHOGEN
Giardia muris Trypanosoma cruzi
AncylostOl!la caninum Nippostrongylus brasiliensis Nippostrongylus brasiliensis Nippostrongylus brasiliensis Nippostrongylus 11K.Jris
Parainfluenza-3 virus
Part 3
.• "l:,,J! (. ! , 1 t • '~
RESULTS Effects of iron deficiency/chelation
Decreased infestation Desferrioxamine and iron deficiency decreased mortality
Increased infestation Delayed worm expulsion due to block in lyaphocyte function Decreased efficacy of mebendazole and ferbendazole Decreased efficacy of mebendazole Increased infestation
No difference in infection rate or virulence in B calves
~ N &. e: .i.. I'll
w t... w
.... .., Q = c,,
S' a-c,, i;.,
= =-;· ;, n Q'; Q
= t" ~r "' -00 .... = -e:
~ !'I) c,,
z
~ ~ -0 z ~ t:, -!
-~

TABLE 2,13 IRON STATUS AND INFECTION: ANIMAL STUDIES1 EFFECT OF IRON EXCESS/SUPPLEJYIENTATION
Ref Nurrtier
Author DATE ANIMAL PATHOGEN RESULTS Effects of iron excess/supplementation
==============================-==-=-===============---===.===================================--------------------=-==========-------------- .
BACTERIA: gram-positive cocci 186 Fusillo 1974 131 de Maria 1978
BACTERIA: gram-negative cocci 392 Payne 1978 39D Payne 1975
78 Calver 1976 145 Dupuy 1983 230 Holbein 1980 231 Holbein 1981 298 Letendre 1984
BACTERIA: enteric gram-negative 197 Greiger 1973 509 Ward 1983
45 Bornside 1970 66 Bullen 1972 65 Bullen 1979 64 Bullen 1975
168 Fletcher 1969 256 Kadis 1984 380 Osborne 1968 399 Polk 1971 400 Polk 1973
53 Brewer 1982 325 Martin 1963
Mouse
Chick embryo Chick embryo Mouse Mouse Mouse Mouse Mouse
bacilli Iguana Mouse Mouse Guinea pig Guinea-pig Guinea-pig Rat, Mouse Pig Pig Mouse Guinea-pig Mouse Mouse & rat
Staphylococcus aureus Staphylococcus aureus
Neisseria gonorrhoeae Neisseria gonorrhoeae Neisseria meningitidis Neisseria meningitidis Neisseria meningi ti dis Neisseria meningitidis Neisseria meningitidis
Aeromonas hydrophila Bacteroides fragilis + E. coli Escherichia coli Escherichia coli Escherichia coli Escherichia coli Escherichia coli Escherichia coli Escherichia coli Escherichia coli Escherichia coli Klebsiella pneunoniae Klebsiella pneumoniae
Part 4
Enhanced infection FAC & iron-dextran had no effect on pulmonary infection
Mortality of relatively avirulent strains was enhanced Iron increased mortality to challenge dose of bacteria Mucin plus iron abrogated resistance to infection Iron dextran increased virulence of pathogenic strains High serum, but not tissue, iron-dextran promoted infection Iron dextran injection increased infection rate
Increased mortality from Fe ·injection Ferric ammonium citrate decreased survival Virulence promoted by ferric ammonium citrate & haemoglobin Iron & haematin abolished bacteriostasis
Guinea-pig milk+ haematin enhanced bacterial growth Parenteral iron salts enhanced renal abscess formation Mortality to oral challenge enhanced by oral but hot IM iron Enhanced virulence Ferric ammonium citrate enhanced virulence Enhanced infection Ferric ammonium citrate (FAC) increased mortality Intraperitoneal ferrous ammonium citrate enhanced virulence
~ (i s:.i
! C" ii" N ;... ~
~ N ... t"'I
"I -0
~ :I
"' Ei
I .... = "' Ill :I j:l.
:I ;,
~ r') .... o· :I
~ ~ §' a VJ .... = ~ n,
"'

TABLE 2.13 IRON STATUS ANO INFECTION: ANIMAL STUDIES: EFFECT OF IRON EXCESS/SUPPLEMENTATION
-===-===·=============================~==============~===================~=-==-----------------------------------------------------------------------------------=-Ref Number
Author DATE ANlfllAL PATHOGEN RESULTS Effects of iron excess/supplementation
-===================================~=====================~=========--·------------------------------------------------=-----------=--------------------------------
BACTERIA: enteric gram-negative bacilli (continued) 264 Khimji 197B Guinea-pig 343 Miles 1976 Guinea-pig
67 Chandlee 1965 Mouse, g.-pig 209 Hart 1962 Rat
67 Chandlee 71 Bullen 1974 Mouse, Rabbit
175 Forsberg 1972 325 l'lartin 1963 227 Hill . 1979 Chicken 466 Smith 1977 Chicken 373 O'Brien 1962 Mouse 254 Jones 1977 Mouse 271 Kochan 1976 Mouse 406 Puschmann 1977 Mouse 446 Sawatzki 1963 Mouse 422 Robins-Browne 1979 Mouse 421 Robins-Browne 1965 Mouse 240 Jackson 1956 Mouse 66 Bullen 1967 Guinea-pig 72 Bullen 1966
BACTERIA: other aerobic bacteria 96 Clark 1905 Chicken egg
490 Sword 1966 Mouse 173 Ford 1976 525 Wright 1961 Mouse
Klebsiella species Klebsiella species K. pneumoniae, S. typhimurium Proteus mirabilis Ps aeruginosa, S typhi, str~ptococci Pseudanonas aeruginosa Pseudomonas aeruginosa Pseudanonas aeruginosa Salmonella gallinarum Salmonella gallinarum Salmonella typhi Salmonella typhimurium Salmonella typhimurium Salmonella typhimurium Salmonella typhimurium Yersinia enterocolitica Yersinia enterocolitica Yersinia pestis Yersinia septica Yersinia septica
Campylobacter jejuni Listeria monocytogenes Vibrio cholerae Vibrio vulnificans
Part 5
.: ,.c; .'.'I'.'··, l 't :.' ,1
Iron chelators enhanced skin infectivity Ferric iron enhanced infection by 11 of 16 bacterial strains Enhanced virulence
Virulence not enhanced FAC, haemoglobin & haematin increased mortality Enhanced infection lntraperitoneal ferrous ammonium citrate had no ill effect Oral parenteral iron decreased morta'lity and morbidity Fe-EDTA, but not Fe sulfate or chlorid~, reduced mortality Ferric ammonium chloride increased virulence Iron overload decreased survival after ,infection FAC and desferrioxamine increased virulence Decreased resistance to intraperitoneal infection Parenteral iron chelates abolished.resistance to infection Parenteral iron increased mortality lron-dextran & desferrioxamine increased virulence Ferrous sulfate enhanced virulence Haematin & FAC abolished passive immunity Enhanced infection
Iron increased rate of infection Ferric and ferrous salts increased virulence Enhanced infection Virulence was increased by desferrioxamine, FAC & CCl
~ N
e:: o, "
<:I\ N ~ w
-., <:) =· V, s--= ctl
~ = i:.i. s· , -s· :,
~ §' a Vl i3' -e: \ ::,.:, m 0 z
~ ,.., -0 z
~ -I -~

TABLE 2.13 IRON STATUS AND INFECTION: ANIMAL STUDIES: EFFECT OF IRON EXCESS/SUPPLEIYENTATION
=====-======---==============================;=======~----=====================·=====--------=----=-=-;-=======~============--=------------------------------------Ref Number
Author DATE
BACTERIA: anaerobic bacteria 68 Bullen 1967
ANil'lAL PATHOGEN RESULTS Effects of iron excess/supplementation
Guinea-pig Clostridium welchii Haematin & FAC abolished passive irmiunity
BACTERIA: fllycobacteria, Spirochetes, higher bacteria: actinomyces, nocardia
FUNGI 153 Elin 1974 i'buse
RICKETTSIACEAE, fllYCOPLASl'IA, CH...AMYDIA
PROTOZOA 362 Murray 286 Lalonde
1975 1984
HELMINTHS: intestinal nematodes 452 Scott 1970
Rat fllouse
Sheep
HELMINTHS: tissue nematodes, cestodes, trematodes
VIRUSES 510 Warren 1968 i'buse
Candida albicans
Plasmodium berghei Trypanosoma cruzi
Haemonchus contortus
lllouse hepatitis virus
Part 6
FAC reversed non-specific protection induced by endotoxin
Virulence increased with iron-dextran Virulence increased with iron-dextran
Oral iron protected lambs
Ferric ammonium citrate (FAC) enhanced virulence
~ (i Q" ~ ii' N
~ b ~ N
.... r ., -Q
~ = "' S'
I = "' m = c::i.. 5;-;;,
~ t') .... ... Q = ~ ~ a· m -en .... = c::i.. ;;;· fl>

. 2.58 IRON NUTRITION AND IMMUNITY
Iron status and infection - Clinical studies
Introduction
The research conducted by Dr Helen Mackay between 1925 and 1927 provided the first evidence for a
causal relationship between iron deficiency and susceptibility to infectioaC74). In spite of methodologic
difficulties, her report<3t4) still remains the.best evidence for a deleterious effect of iron deficiency on
propensity to infection.
Many of the subsequent positive reports in the literature are anecdotal and have little scientific weight,
and the negative reports do not, as a rule, give enough information to enable the studies to be
evaluated. In addition, some of the observations have been made as a "by-producttt of studies with aims
other than to clarify the relationship between iron status and infection·.
The following sections analyze the published evidence relating iron status and propensity to infection in
humans. Iron excess ( or increased iron availability) and its role in promoting infection is examined.
Iron deficiency and its role in either promoting or preventing infection is then explored. Research
reports are classified and discussed according to the manner in which their studies are presented since
this corresponds with the confidence that can be placed in their results.
Most reports on the relation of iron deficiency to infection can be classified as anecdotal as they do not
present details of methods and data. These studies are reviewed, principally because they have often
been quoted in support of the hypothesis that iron deficiency lowers resistance to infection. While such
observations may be allowed to raise one's curiosity, no weight should be attached to their implications
until their methods and data have been subjected to the scientific review process.
Helpful, but inconclusive are the studies of prevalence of infection which are covered in the next
section of the review. The studies which employ multiple dietary interventions, including iron, are of
the same methodologic standing as prevalence studies and are included in the same section.
Lastly reviewed are those studies whose reports contain enough detail about the methods and results to
enable the reader to evaluate the conclusions. Prospective studies of incidence of infection provide a
study design which effectively tests the hypothesis that iron deficiency predisposes to infection. The
greatest weight should be attached to the conclusions drawn from these studies.
This system for categorizing studies is convenient for classifying their results and assessing the
importance of their conclusions. However, an inconvenience manifests itself when a research project
involves the testing of several hypotheses. While these hypotheses may be closely related conceptually,
• An intent expressed by the investigator before the study can add to its strength<13>,

CHAPTER 2 LITERATURE REVIEW 2.59
the sub-projects often involve radically different research designs. It is thus sometimes necessary to
consider one report from the literature under several headings. While this detracts from the evaluation
of such studies in themselves, it facilitates the synthesis of results from the entire body of literature in
what it is now fashionable to call a meta-analysi/439).
The following two sections group reports according .to the relation of infection to iron excess or iron
deficiency. This dichotomy is sometimes difficult to apply. In such cases the decision on where to
place the study has been made on the likely availability of iron to the micro-organism. The case report
that begins the next section illustrates this rule as well as adding an historical dimension to the survey.

2.60 IRON NUTRITION AND IMMUNITY
Iron excess and susceptibility to infection
When a very young physician, I was called to see the wife of an architect suffering from
neuralgia, a pale woman, presenting every appearance of chlorosis: I prescribed large
preparations of iron, according to Hutchinson's method of treating neuralgia. In less
than a fortnight, there was a complete change: the young woman acquired a ravenous
appetite, and an unwonted vivacity: but her gratitude and my delight did not last long.
The excitement soon became fever: and the restored color of the cheek became every
evening more.ardent than it had been when she was in good health. A short cough
supervened; and in less than a month from the commencement of the treatment, there
appeared signs of phthisis which nothing could impede ...
I do not blame the iron for having caused this calamity; but I do blame myself for having
cured a condition, perhaps, favorable to the maintenance of the tuberculous affection in
a latent state.
A Trousseau 1868
Lectures on Clinical Medicine
Translated by Sir John Rose Cormack
New Sydenham Society 1872, Vol 5 p 97"
• l am grateful to Murray er aP61l for drawing my attention to Armand Trousseau's illuminating lecture on True and false
chlorosis.

CHAPTER 2 LITERATURE REVIEW . 2.61
Introduction
In conditions associated with systemic overload or increased intravascular availability of iron, such as
haemochromatosis, sickle cell anaemiaC262), thalassaemia major, siderosis, malaria, bartonellosis,
hepatitis, louse-borne relapsing fever and multiple blood transfusions, patients show an increased
susceptibility to infectious disease. Pearson and Robinson review this body of work critically(394>. There are so many potentially confounding factors in these observations that a causative role for iron
status in the susceptibility to infection can remain no more than an attractive hypothesis. For· this
reason only clinical studies of the effects of iron excess (principally through administration of iron
treatments) are individually reviewed in any detail in this section.
Kwashiorkor
McFarlane et al (1970)
McFarlane et at<313) studied 40 patients with kwashiorkor. Of the 13 patients who were known to have
died, only 2 had serum transferrin greater than 0.4 mg/ml. The initial mean serum transferrin level
was three times as high in the 16 patients who were known to have survived at least two weeks. And,
two weeks after hospitalization the difference between the 2 groups was even greater • 1.30 mg/ di
compared to 0.33 mg/dl.
The authors state that the patients were treated with oral ferrous sulfate or intramuscular iron-dextran
but give no details of doses or time relationships with respect to treatments, test measurements and
death. No details of infections in these patients are presented.
The authors calculated that by day 4 the serum ttansferrin level in survivors was sufficient to bind a
total of 3.4 ug of iron which "far exceeds the concentration of iron found in their serum". The serum
transferrin in those who died was sufficient to bind only 0.55 ug of iron and this would "leave an
appreciable concentration of free iron in the plasma".
The study suggests that serum transferrin may be, an accurate prognostic factor for death in
kwashiorkor. It also suggests that it would be unwise to overwhelm iron transport mechanisms in
severely malnourished children. But in this retrospective study the evidence to implicate iron overload
as a causative factor in susceptibility to infection is too incomplete to warrant the certainty attribu,ted to
it by some authors·
Ethical considerations aside, a scientific study of the efficacy and side effects of iron in severe
kwashiorkor would employ a clinical trial to compare outcomes in groups of children treated ·
• For example 32

2.62 IRON NUTRITION AND IMMUNITY
identically, except for iron therapy. This would not be possible in the clinical situation, but it should be
possible to test this conclusion with an animal model.
Urinacy tract infection
Briggs (1963)
Iron-sorbitol-citric acid complex was used as a pyrogen in 10 healthy subjects, 9 patients with chronic
urinary tract infection and 5 patients with structural disorders of the kidney(SS). No change in pyuria
was found in subjects without infection, but in 7 of the 9 patients with renal tract infection 25 mg of
iron-sorbitol produced more than 100% rise in white cell excretion. No patient suffered a clinical
exacerbation of disease.
The authors conclude by stating that, although there was no proof of iron·sorbitol provoking infection,
"it may be a wise precaution to avoid the use of iron-sorbitol in patients with an active infection of the
urinary tract".
Scott (1962)
Scott< 453), in a case report, described the development of a urinary tract infection in a patient being
treated with both oral iron and parenteral iron-sorbitol-citric acid complex for iron deficiency anaemia
of pregnancy.
Scqtt (1963)
Iron-sorbitokitric acid complex was used to treat 80 antenatal patients for anaemiaC457). Pyelitis
developed in 5 of 62 patients with simple iron deficiency anaemia and in 7 of 18 patients who had
concomitant folic acid deficiency.
· The author speculated that the urinary tract infections were caused by increased iron levels in the urine
- 30% of the injection being excreted by the kidneysC55). In the face of concomitant folic acid
deficiency, patients are less able to utilize the iron and more will be available to pathogens.
This study provides a caveat for physicians, but the scientist would have preferred a control group for
comparison.

CHAPTER 2 LITERATURE REVIEW 2.63
Neonatal septicaemia
Barry,Reeve(1973,1976,1977) · · · · d f al · · B d R (ZO, 19• 17• 18) observed a s'1gnifi1cant In an ep1dem10Iogical stu y o neonat sepsis, arry an eeve
increase in the incidence of Gram-negative sepsis in Polynesian infants given iron-dextran within the
first seven days of life. Comparisons could be made to the rate of infection in untreated European
infants born at the same time and to untreated Polynesian infants born at a later date.
This evidence that iron-dextran increases susceptibility to severe Gram-negative infection in the
neonatal period is corroborated by the results of Becraft, Dix and Farmer(3l) in studies on the
phagocytic and antibacterial functions of blood from 7 neonates, median age 5 days, before and after
intramuscular iron-dextran. Bacteriostasis of serum was lost post treatment, and leukocyte chemotaxis
was inhibited by post-treatment serum. The bactericidal capacity of neutrophils, opsonizing capacity of
serum and generation of chemotactic stimulus showed no change with treatment.
Because it has been reported that iron-dextran does not bind with transferrin<218), Barry and Reeve
suggested that Escherichia coli may be capable of utilizing the iron bound to dextran(ZO).
Anecdotal reports of observations in the United StatesC293), South Africa<212) and ScandinaviaC442
) have
not associated iron-dextran injections in infants with increased infections. This may be because the
practice outside New Zealand was to administer the iron later in life when transferrin levels and
production are higher or because of other differences such as dose or exposure to infection.
Tropical infections
Byles, D'Sa (1970)
The response to total dose infusion of iron-dextran was studied in 1000 women who were pregnant or
in the puerperium<77). The iron dextran was administered in 4 regimes with and without promethazine
and/or chloroquine. In comparison with the other regimes, treatment including chloroquine was
associated with Teductions in:
Local phlebitic reactions (as might be consistent with an anti-inflammatory effect).
Plasm odium f alcipamm in blood films of those with generalized reactions.
Non-allergic generalized reactions.
The results are compatible with iron-dextran aggravating subclinical malaria infection. It would have
enabled more weight to have been put on this conclusion if blood films had been screened for malaria
before as well as after treatment with iron dextran. The conclusions presented by the authors require
the assumption that the reduction in generalized reaction in the chloroquine treated group was due to

2.64 IRON NUTRITION AND IMMUNITY
an anti-plasmodium effect and not the anti-inflammatory effect (which it displays in rheumatoid
arthritis and discoid lupus erythematosus).
Murray et al (1975)
Murray et af.-36
'2) observed the attack rate for malaria in patients and their relatives (who, in accordanc~
with local custom, had accompanied them to hospital). The study took place during the Sahelian
drought in the early 1970-s and all subjects were underweight. Patients and their relatives were given
skim milk, grains and multivitamins without iron.
Mean transferrin saturations on arrival, on day 2 and on day 5 were 54%, 96% and 76%. Mean serum
iron levels were 143 ug/dl, 250 ug/dl and 222 ug/dl on the same days. Attacks of malaria occurred in
74 of 181 subjects, with a peak on the fifth day after arrival.
The authors speculated that the food supplements may have caused the abnormal rise. in serum iron
and saturation of _transferrin and that this made iron more readily available for plasmodia.
To test this hypothesis the authors infected 40 rats with Plasmodium berghei. Half of the rats had
been injected with iron-dextran two weeks previously in order to increase their iron stores. The treated
rats had higher percentage saturation of transferrin, higher serum iron and shorter latencies to peak
parasitaemia and death than the control rats.
Murray et al (1978 1)
The MurraysC361• 360) observed a group of 137 iron deficient Somali nomads who were being treated
for starvation. The 66 nomads in the control group had 7 episodes of infection, while the 77 individuals
in the test group who were given 900 mg ferrous sulfate daily as well as the food supplement had 36
episodes of ittl'ection. The infections included malaria, tuberculosis, brucellosis, schistosomiasis, and
pyogenic skin infections. The absence of mosquitoes and milk products make it likely that these
infections were the result of recrudescence of suppressed disease(361). However, as Keusch and
Farthing(263) note: ''It is somewhat strange that schistosoma ova were found in 11 of 71 untreated
individuals compared to only 2 of 66 placebo-treated subjects*. Since it is biologically impossible for this
to reflect new infection during the 30-day observation period, the findings raise the question of some
hidden sample selection. At the very least, these data are in need of independent confinnation and careful
reinterpretation" •
• Chi square analysis with Yates continuity correction yields P < 0.05. This was not noted by the authors.
'

CHAPTER 2 LITERATURE REVIEW 2.65
Murray et al (19782 )
Murray et af:363) reported on the attack rates for cerebral malaria in 99 children admitted with a
diagnosis of malaria. The children came from an area in Niger where all were suffering from famine
malnutrition. The 23 children who were treated for cerebral malaria had higher serum iron levels,
greater saturation of transferrin and lower serum folate levels than those who did not. The cerebral
malaria was restricted to children being re-fed on grain. The milk diet of nomads seemed to protect
them against cerebral malaria.
The attacks of malaria were almost certainly due to a recrudescence of the disease as there had been
no rain or mosquitoes for eight months.
The authors discuss a number of possible mechanisms for this phenomenon... Of interest in the
present context is their remark that the changes in iron metabolism were most marked in the children
with cerebral malaria, but that their experimental design did not allow cause to be distinguished from
effect.
Oppenheimer et al ( 19 a 6 )
Oppenheimer et aP76) in a placebo controlled trial of prophylaxis of iron deficiency in infancy found
that infants who had been treated with iron dextran had a higher incidence of malaria. This rigorous
study provides sound evidence for iron dextran promoting malarial infestation. Because of its
importance this work is discussed in detail below in the section where the role of iron deficiency in
protecting against or promoting infection is examined.
Y ersinia enterocolitica
Melby et al (1982)
Melby et aP37) reported two cases of Yersinia enterocolitica septicaemia in young children who had
accidentally ingested excessive amounts of iron medication. Both children were treated with oral and
parenteral desferrioxamine and at least one child had evidence of pre-existing colonization by Yersinia
enterocolitica.
The authors theorized that iron utilization by the Yersinia may have been facilitated by the iron and
desferrioxamine since desferrioxamine is a siderophore (produced by Streptomyces griseus) and has
been shown to enhance growth of Yersinia enterocolitica in vivoC491).
• See also 359

2.66 IRON NUTRITION AND IMMUNITY
This kind of case report serves as a clearwarning to clinicians, but provides little scientific evidence for
a causal relationship without conjunction with evidence from the laboratory where the critical variables
can be manipulated independently.
Mofenson (1987)
In a letter to the New England Journal of Medicine, Mof enson et af-348) report on a case of Yersinia
enterocolitica septicaemia in a 15 month old boy who presented to hospital with bloody diarrhoea 10
hours after ingestion of approximately 30 tablets of ferrous sulfate. He was treated with syrup of ipecac
and intramuscular desferrioxamine. His twin sister, who did not ingest ferrous sulfate, had mild
diarrhoea and Y. enterocolitica was isolated from her stools.
The authors drew attention to the experimental situations in which desferrioxamine enhances the
virulence of Y. enterocolitica.
Robins-Browne et al (1983)
Robins-Browne et a1<422•
76) found marked deposits of haemosiderin in the viscera of 3 patients who
died from Yersinia enterocolitica infection. Although the patients had "an underlying illness, the
presence of which may have predisposed to infection", the authors felt 'that the siderosis was "evidence
that iron overload increases susceptibility to infection". The clinical evidence is circumstantial and based
upon a series of three patients. On its own, this evidence would carry little weight, but the authors
corroborated it with observations on the effect of intra-peritoneal ferric ammonium citrate on
susceptibility to infection by Y. enterocolitica in mice. Six of nine mice that received 109 organisms and
200 ug of iron died, but only 3 of 32 mice died when they were given the same number of bacteria and
100 ug or less of iron.
Summacy
Indirect evidence of the effect of excess iron on host defense mechanism has been adduced from
clinical observations of associations of infection with intravascular haemolysis. Systemic salmonellosis
is associated with malaria and bartonellosisC518).
Host Associated Iron Transfer Factor (HAITF) is a low molecular weight iron binding protein found in
many tissues including normal serum. In vitro HAITF is capable of increasing iron uptake and
multiplication of Gram negative bacteria and capable of increasing the virulence of Salmonella
typhimurium. The serum levels of HAITF are increased by a factor of approximately 3 in
thalassaemia and it has been suggested that this may be the reason for the increased susceptibility of
these patients to infection<253). Studies of iron absorption have shown that transferrin is a passive
. '

CHAPTER 2 LITERATURE REVIEW 2.67
recipient of released iron and that intracellular events control the release of iron. Intestinal absorption
of iron is not suppressed in normal human volunteers whose transferrin has been completely saturated
by infusion of ferric ammonium citrate and in patients with thalassaemia major it is increased despite
very high transferrin saturation(224). Iron bound to transferrin is protected from forming harmful
oxygen free radicals and is. generally unavailable to micro-organisms. Non-transferrin plasma iron may
thus escape the protective mechanism afforded by transferrin<224}.
Iron overload in haemodialysis seems to impair phagocytic activity of neutrophill512). Sound
theoretical reasons and circumstantial clinical evidence point to iron as a causative factor in the
infections to which patients with kwashiorkor so often succumb. Clinical evidence also implicates iron
dextran treatment as a factor in neonatal sepsis, urinary tract infection and malaria. Oral iron
preparations have been associated with Yer:sinia enterocolitica and "tropical" diseases such as malaria,
tuberculosis, brucellosis, and pyogenic skin infections.
Although most studies suffer from methodological inadequacies, the sum of the evidence is strongly
suggestive of a deleterious effect of iron on susceptibility to sepsis in neonates treated with .iron dextran
and· to malaria and perhaps other infections in all age groups treated with either oral or parenteral
iron.
Before prescribing iron the clinician would do well to follow Trousseau and distinguish true from false .
chlorosis!
Iron· deficiency and susceptibility to infection
Introduction
The literature on iron deficiency and its role in infection is reviewed in 4 sections. The anecdotal
reports in the first section are scientifically unimportant, but have been uncritically cited in the
literature·. The second and thitd sections discuss studies with confounding factors and retrospective
studies. Such research designs may suggest an association ( or lack of association) but cannot
distinguish cause and effect. The fourth section reviews prospective· controlled studies. The results
from these studies deserve to be taken seriously.
• A citation analysis was not made but a number of instances of such citations are documented in order to validate this statement.

2.68 IRON NUTRITION AND IMMUNITY
Evidence for iron deficiency protectint: ai:ainst infection
Malaria and other Tropical infections
Retrospective or prevalence studies
Masawe et al (197 4)
Purpose: The study aimed to determine the prevalence of infection in adult patients with various
anaemia5'330).
Ascertainment: Consecutive admissions to an adult medical ward with haemoglobin less than 10 g/ dl.
Laboratory methods: Haematologic profiles were obtained with a Coulter counter model~S.
Study grouping and design: Patients were dassified into 5 classes of anaemia and were screened for
the presence of infection, viral, bacterial and protozoal.
Results: Most of the protozoal and helminthic infestations occurred in the iron deficient group and
. most of the bacterial infections were in the megaloblastic, haemolytic and refractory anaemias.
Interpretation of results: An observational study such as this can draw no conclusions about causal
relationships. In addition, with no information as to the prevalence of infections and anaemias in the
general population, no valid inferences can be drawn from the association of certain anaemias.
The causes of admission to hospital may determine the patterns of association of one factor with.
another without one factor being causally dependent on the other; they might have . a common source.
SteinC478) exemplified this fallacy by pointing out that the reasons for admission to a medical ward in a
general hospital in Milwaukee were such that iron deficiency anaemia would be associated with a lower
prevalence of infection because the cause was often occult bleeding, ·whereas other anaemias were
associated with debilitating disease and infections.
Conclusion: The study shows that, in Dar es Salaam, iron deficiency is often associated with malaria
and helminthic infestations while bacterial infections are associated with other anaemiasC147).
Although. this association is strong, no conclusions about the causal influence of iron deficiency on
susceptibility to infection can be drawn.
Masawe and Swai (1975)
In a letter to the Lancet, Masawe and Swai<329) report on results of a survey of anaemia and infection
in 42 children and young adults. The study was an extension of that discussed in the previous section.

'
CHAPTER 2 LITERATURE REVIEW 2.69
The-prevalence of bacterial infection was 10% in the group with no iron stores shown on bone marrow
examination and 50% in those with positive iron stores. For malaria, the prevalences were 30% and
50% respectively. The caveats on conclusions apply as for the previous study.
Murray et al (1978)
The Murrays(J6l), in a pilot study·, observed 19 infections in 64 Somali nomads who had normal iron
status but O infections in 26 nomads who were iron deficient.
This kind of clinical anecdote would certainly justify further epidemiological studies, but, in itself
cannot carry much weight as a scientific argument for the hypothesis that iron deficiency is protective
against infections in general. The two groups may not have been comparable in terms of ascertainment
and exposure to infection. Future studies should have at least a case-control design if they are not
prospective in nature.
Prospective, controlled studies
Murray et al (1980)
A group of 35 Maasai"* given one 300 mg tablet of ferrous sulfate weekly for one year had significantly
more cysts, amoebae and sera positive for Entamoeba histolytica than 75 tribesmen not given the
ironC358). Six of the iron-treated group had attacks of malaria, but none of the 35 control group were
affected. These findings are suggestive of a protective effect of iron deficiency and a deleterious effect
of oral iron-treatment on resistance to infection by Entamoeba histolytica and malaria. I
Oppenheimer et al (1986)
Purpose: The object of the study by Oppenheimer et af.377•
379,
378•
376) was to examine the
effects of iron therapy on infectious morbidity.
Ascertainment: The subjects were healthy infants recruited at birth from infants born in hospital to
mothers resident nearby.
Grouping: The infants were paired according to sex, domicile and birth weight.
Iron intake: At two months of age 3 ml of either iron-dextran or placebo was given intra-muscularly in
a double blind fashion.
Laboratory methods: Haemoglobin was measured by the cyanmethaemoglobin method with a
Corning colorimeter. Thin and thick blood films were examined for malaria.
• See study 2 above, under the section on iron excess and susceptibility to infection
• • The authors use this spelling

2.70 IRON NUTRITION AND IMMUNITY
Study design: The infants were followed up 1 week after the injection and then at the ages of 6 and 12
months. At the follow·up visits a history of infections during the previous two weeks was taken. The
infants were weighed and examined for signs of infection.
An increased prevalence of malaria was found in the iron treated group. This difference was
statistically significant for parasitaemia at both 6 months and 12 months. It was also statistically
significant for splenomegally at 12 months (and almost significant at 6 months). The iron treated group
had a higher prevalence of Plasmodium falcipamm , P. vivax and P. malariae.
Mala!ia could not be incriminated in any of the 12 deaths that occurred. There were five deaths in the
iron group and 7 in the placebo group; no further details on the auses of death are given, but it is
likely that most of them were due to infections.
Interpretation of results: 1 exposure to infection: By matching infants for domicile and following the
two groups simultaneously the experimental design minimized unequal exposure to infection in the two
groups.
Interpretation of results: 2 blinding: The study was double blind.
Interpretation of results: 3 haematology: No haematological results were given, but it seems
reasonable to assume that the markers of iron status were "better" in the group treated with iron
dextran.
Conclusion This is probably the best designed study in the literature to test the hypothesis that
iron status is associated with susceptibility to infection. The one drawback is that the incidence of
infection could not be obtained as follow-up took place at 6 and 12 months. This allowed a point
prevalence of infection to be determined at these two ages.
This might not be a serious drawback in determining susceptibility to chronic infections such as
malaria, but it would lead to an important loss of discriminatory power in determining the difference in
morbidity caused by acute illnesses of short duration such as the common respiratory and diarrhoe.al
infections of infancy.
Ethical considerations will prevent similar studies being undertaken to corroborate the effect of iron
dextran in infancy on susceptibility to malaria. It would however be useful to repeat this sort of study
outside the tropics where protozoa! diseases are not a problem as resistance to such diseases differs in
many important ways from resistance to viral, bacterial, fungal and helminthic infections.
I
CHAPTER 2 LITERATURE REVIEW 2.71
In short, the administration of intra·muscular iron-dextran in early infancy seems to increase
susceptibility to malaria. No conclusions are possible about the risk of other infections, although the
mortality data would argue against a similar increased risk for other k:in,ds of infection.
Evidence against the promotion of infection by iron deficiency
Candidiasis
Studies with anecdotal reports
Jacobs et al (1973)
In a brief abstract, Jacobs et af.242) reported that oral candida counts were not increased in patients
with iron deficiency anaemia and did not change with treatment. The one patient who had oral
candidiasis did not respond to iron therapy either. If they had stated the number of patients with
lesions of the oral mucosa it would have facilitated comparison with the paper by Higgs and WellsC226).
Retrospective or prevalence studies
Walker et al (1973)
Walker et af..505) compared the prevalence of oral candidiasis in 12 iron deficient anaemic individuals
with that in 12 matched controls. This was done before and after iron treatment. Mycological
examinations were not significantly different from the controls and did not alter with iron treatment.
Clinical candidiasis was present in 1 iron deficient patient and did respond to iron treatment whereas 4
controls had clinical infection with Candida. The authors did not calculate the probability of not
detecting a difference between the iron deficient group and the controls. This study offers weak
evidence against iron deficiency predisposing to candidiasis.
Adults
Prospective, controlled studies
Vellar et al (1974)
Purpose: The object of the study by Vellar et al5°3) was "to examine if iron in therapeutic doses
might have an effect on the prevalence of upper respiratory tract infections in healthy young adult men and
women".
Ascertainment: The subjects were 97 physical education students in generally healthy condition. No
further details of selection or exclusion criteria are given.

2.72 IRON NUTRITION AND IMMUNITY
Grouping and icon intake: The 81 students with normal haemoglobin concentrations were allocated to
one of two groups by an undocumented method. One group was treated with a placebo while the other
group was treated· with ferrofumarate to provide 60 mg elemental iron per day. The 5 males with
haemoglobin levels less than 14 mg/dl and 11 females with haemoglobin concentrations less than 12.5
mg/dl were allocated to the group to receive iron. At the completion of the study the actual
consumption of iron and placebo tablets was recorded but not reported.
Laboratory methods: The methods by which the haematologic parameters were measured were not
reported.
Study design: A history of upper respiratory tract symptoms was taken, a physical examination
performed and blood tests made on six occasions about eight weeks apart. The number of upper
respiratory infections thus diagnosed was recorded for the 5 follow-up examinations.
Results: After 2 months there was no difference in the mean haemoglobin levels of the iron and
treatment groups.·
The authors present their data in enough detail for the following table to be compiled.
Table 2.14 Iron treatment and upper respiratory infections. Number of upper respiratory infections diagnosed in S examinations of 97 healthy young men and women over a period of about 40 weeks.
INFECTION NO INFECTION TOTAL
IRON 93
137
230 ====
PLACEBO 77 95
172 ====
TOTAL 170 232 402 -===
The proportion of infections in the placebo group averaged 44% per examination, while the
corresponding figure for the iron treated group was 40%. This difference is not significant ( chi square
equal 0.59, p>O.l).
Interpretation of results: 1 exposurt to infection: There seems little possibility of any bias in exposure
to infection with this experimental design.
Interpretation of results: 2 blinding: The study was certainly blinded for the subjects, but no mention
is made of b~nding for the investigators.

CHAPTER 2 LITERATURE REVIEW 2.73
Interpretation of results: 3 haematology: Inclusion of the subjects with low haemoglobin
concentrations in the iron-treatment group may have led to a small bias towards incorporating subjects
more susceptible to infection. Since there was no difference in the mean haemoglobins of the iron and
placebo groups from the time of the first re-examination, this bias is likely to be small.
There was little difference between the haematological parameters of individuals with a history of
infection and those without. This mitigates against acute upper respiratory infections as being a
significant cause of anaemia.
Conclusion: "It is necessary to be cautious in the interpretation of the iron/placebo comparison with
regard to the prevalence of infection: the iron-treated group was not strictly comparable at the start of the
experiment"". If the infections are counted from the second re-examination period, the iron-group had
an average of 32% infections at each point while the placebo-group had a mean of 40% infections.
This trend in favour of the iron-treated group was not significant and is not consistent when the
infections are analyzed according to sex or for individual examination periods. The authors conclude
that "iron medication has no particular phannacological effect" on the resistance to acute upper
respiratory infections in otherwise healthy young adults.
The study does not warrant so strong a conclusion, particularly without an analysis of the type II error.
It would have been helpful if the authors had calculated confidence limits for the effect of iron
treatment.
The conclusion that may be validly drawn from this study is that iron supplementation may have a small
effect in reducing susceptibility to acute infection of the upper respiratory tract in healthy young adults.
Infants
Studies with anecdotal reports
Marsh et al (1959)
Marsh et al-323) in a study involving 74 infants, followed three groups of children from birth to 9
months of age. One group was given an iron-fortified milk formula and the other two groups were
given different formulas without extra iron. Mean haemoglobin levels in the three groups at 9 months
of age were 12.69, 10.46 and 9.67 g/dl. No data on infection were presented, but the authors stated
"While this study was not designed to measure accurately differences in growth or relative susceptibility to
illness, gross observation revealed no significant diff erences110
•
• page m
.. page 409
These conclusions can have little

2.74 IRON NUTRITION AND IMMUNITY
weight in refuting the existence of an association of iron deficiency with susceptibility to infection, but
they may be taken to indicate tnat such an association can not be large.
Farquhar (1963)
Farquhar<162) studied 44 infants who were given either a daily supplement of multi-vitamins or multi
vitamins with iron from the age of one month to one year*. _ The author stated that the "iron
supplement prod1'ced a statistically significant incre~e in haemoglobin and haematocrit levels at three,
six, and nine months of age, but the difference w~ not statistically significant at one year. This difference
did not reflect in the height and weight measurements or in the general well-being of these well-nourished,
healthy inf ants."
No further descriptions of illness or data are given to support this anecdotal conclusion.
Malakhovsky Yu E et al (1983)
Malakhovsky et az<320) followed 103 infants for 9 to 12 months. The children were examined weekly
and 79 of them were given an iron tonic in a double blind fashion. The study has been included
together with the anecdotal reports because many critical issues were not defined in the report. The
critical factors include details of the ages at which children entered and completed the study, from what
age and for how long the iron supplement was administered, the ages at which iron status was
determined and the periods over which infections were monitored. The difficulty in ascertaining these
facts from the report may be partly due to the problems inherent in working with a translation; the
original is in Russian.
The authors stated that susceptibility to infe~tion was not related to haemoglobin status. Importantly,
they qualified this statement by saying that it might not be true for severe iron deficiency ( defined by
haemoglobin concentrations below 9.0 g/dl).
The authors also stated, somewhat at variance with their first conclusion, that repeated infections were
associated with the development of anaemia.
This study can be taken as suggestive evidence against a large effect of iron deficiency on the
.susceptibility to infection.
Prospective, controlled studies
Burman (1972)
Purpose: The purpose of this study<74) was to determine the normal range for haemoglobin in healthy
infants during the first 2 years of life and to observe the effects of iron supplementation.
• Cited as evidence that iron status does not relate to susceptibility to infection (Ul9).

· CHAPTER 2 LITERATURE REVIEW 2.75
Ascertainment: Parents living within a prescribed area of Northwest Bristol whose children were born
between June 1965 and February 1966 were invited to participate in the survey. Reasons for exclusion
included illegitimacy and low birth-weight, but many parents refused to co-operate.
Nutrition: Only well nourished infants were entered into the study.
Socio-economic class: The "numbers in social classes IV and V were low" and as a whole the group
was relatively affluent.
Feeding and iron intake: No feeding intervention was made, but, from the age of 3 months, children
were given either placebo or 10 mg elemental iron daily as ferric hydroxide.
Laboratory methods: Toe or finger prick capillary blood samples were taken and analyzed for
haemoglobin with the cyanmethaemoglobin technique.
Study grouping and design: Children were allocated alternately by birth order to receive either
placebo or iron tonic. Blood samples were made at intervals of three months. In the intervening
months a health visitor went to the home to collect data about illnesses and checked on the supply of
medicine.
Results: "Tize administration of iron made no difference to the incidence of infection in this study".
Interpretation of results: 1 diagnosis of infection: Infections were diagnosed on history at a monthly
follow up by health visitors. The author acknowledged that recall of illnesses is unreliable, even from
conscientious parents. The statistics of morbidity can therefore not lay claim to much accuracy or
precision, and in fact, no statistics are given.
Interpretation or results: 2 exposure to infection: The two groups seem comparable with respect to
exposure to infection, although only qualitative comments on socio-economic class supplement the
statement which implies that the two groups were studied contemporaneously.
Interpretation or results: 3 blinding: The study was possibly blinded with respect to the subjects, but
the study team would surely have known the difference between mist. mbra and mist. nigra.
Interpretation or results: 4 haematology: Standard laboratory methods were used. The author states
that the haemoglobin vs age curves for the "iron" and "no-iron" group differ at the 5% significance level,
and that most of the difference occurred during the second year of life, particularly towards the end.
...

2.76 IRON NUTRITION AND IMMUNITY
Two comments may be made on the author's observations. Firstly, the haemoglobin level of the "iron"
group was higher at the start of the study than that of the "no-iron" group. This was a constant trend -
as might be expected. The author's unusual statistical method may merely be confirming that this
initial bias was maintained at each subsequent test of haemoglobin. The analysis would have been
more meaningful had the initial haemoglobin been controlled for. The interpretation of the effect of
the iron supplementation should take this imbalance between the two groups into account.
At 12 months of age, the mean increase in haemoglobin was 0.68 g/dl for the "iron" group and 0.46 g/dl
for the "no-iron" group. An optimistic estimate of the result of a t test gives p = 13%. The reason for
the iron supplementation making so little difference to the haemoglobin is probably due to the poor
absorption of iron in the form of ferric hydroxide<134).
Conclusion: The author concludes that iron supplementation had no effect on morbidity. As the
regime employed had little effect on haemoglobin it is hardly surprising that no reduction in morbidity
was observed. Furthermore, while the author states that there was no difference in observed
morbidity, he does not calculate (he probability of a type II error<210). In other words, the chance of
the study missing a real difference in infection rate is not given. In addition, with the questionable
precision in diagnosis by history up to 4 weeks after an illness, there is no doubt that little weight
should be put on the author's conclusions with regard to morbidity and iron status. Unfortunately this
study is often uncritically cited in review articles to refute the hypothesis that iron deficiency
predisposes towards infection·.
Evidence for the promotion of infection by iron deficiency
Herpes Jabialis
Studies with anecdotal reports
Chandra et al (1977)
In a conference report Chandra et azC91) observed that patients with recurrent herpes labialis had lower
percentage saturations of transferrin than healthy controls; no data were given.
• See for example, 241, 290, 308, 275, 485, 102, 89, 91

CHAPTER 2 LITERATURE RE .. \llEW
Candidiasis
Studies with anecdotal reports
Cawson (1963)
2.77
Two cases with oral candidiasis were reported by Cawson to have responded to treatment with ferrous
gluconate for their iron deficiency anaemia<84).
Retrospective or prevalence studies
Rose (1968)
Rose(426) studied 25 consecutively referred .patients with angular cheilitis and 25 controls matched for
age, sex and use of dentures. The premise for the study was that Candida albicans is an important
aetiological agent", but ''since candida infections are regarded as 'diseases of the diseased', a search for
other factors capable either of assisting the ftmgus or acting 'in their own right' to produce the disease
suggests itself'.
The group with cheilitis had lower mean haemoglobin levels, lower plasma iron, increased total iron
binding capacity and decreased saturation of transferrin and more cases of iron deficiency anaemia.
Taken in conjunction with previous evidence that Candida albicans is implicated in angular cheilitis
this study provides evidence for an association between iron deficiency and fungal infection of the oral
mucosa. In this design cause and effect are impossible to separate.
Higgs and WeIJs (1972)
In a survey of 31 patients with chronic mucocutaneous candidiasis Higgs and Wens<226) fo~d 23 with
iron deficiency anaemia. The criteria for diagnosis of anaemia were not presented and there was no
control group against which comparisons could be made··.
Davidson et al (1977)
Haemoglobin, serum ferritin and serum iron were measured in 43 patients with recurrent genital
thrush, 31 patients with non·recurrent candidiasis and in 26 controls by Davidson et aP29). The mean
haemoglobin level was significantly lower in the first group, but the authors comment that this result
was biased by two "outliers". Serum ferritin levels were greatest in group 1 and serum iron levels were
lowest in that group. The differences were small and not statistically significant.
• The author cites several studies to support this assertion
• • The second part of their report deals with the effects of iron treatment and is discussed below.

2.78 IRON NUTRITION AND IMMUNI1Y
Jenkins et al (1977)
Oral candidiasis was studied in 108 patients by Jenkins et af'2SO). The lesions were classified as either
chronic hyperplastic (21 patients) or atrophic candidiasis (87 patients) according to clinical,
microbiological and histological criteria. Patients and healthy controls were classified as iron deficient
if the percentage saturation of transferrin was less than 16%.
Iron deficiency was found in 33% of patients with hyperplastic lesions, in 14% of patients with atrophic
lesions and 14% of controls. The association was significant at the 10% level for hyperplasia. The
authors discuss the pathogenesis of the two types of lesions and speculate on the differing roles that
iron deficiency might play. Of note is their recognition that cause and effect relationships would be .
elucidated if treatment with iron could be shown to effect a cure. As this was a retrospective study
they were not able to do this.
Prospective, controlled studies
Fletcher (1975)
Fletcher et a/169> studied 29 adult patients with chronic iron deficiency anaemia caused by blood loss.
Matched· controls were found in the same hospital practice. Mouth lesions were present in 16 of the
anaemic patients and Candida albicans was cultured from the saliva of all patients with mouth lesions
and 8 of the 13 without lesions. None of the controls had mouth lesions and 13 of the 29 patients had
Candida albicans isolated from saliva. The mouth lesions and candida counts improved within a
month of starting 200 mg ferrous sulfate bd. The authors comment that the susceptibility to candidiasis
may be due to alterations in the oral mucosa. They noted a decreased lymphocyte count and a
depressed response of lymphocytes to stimulation with PHA. On treatment with oral .iron, the lesions,
candida infection and lymphocyte count returned to normal as the haemoglobin level was restored, but
before iron stores ( as measured by serum iron and total iron binding capacity) had been repleted. The
response to PHA stimulation did not return to norm~ until iron stores were replenished.
Conclusion This study supports the hypothesis of a ddect in cell mediated immunity in iron
deficiency predisposing to candidiasis, but the weight that can be attached to this conclusion is limited
by the small numbers involved.
Higgs and Wells (1972)
Purpose: The purpose of this study<226) was to characterize chronic mucocutaneous candidiasis and to
investigate its association with iron status.
Ascertainment: The 46 patients were located as the result of an "extensive search" and 31 were
investigated for iron status.

CHAPTER 2 LITERATURE REVIEW 2.79
Study grouping and design: Eight patients had reduced or absent bone marrow iron stores and
haemoglobin concentration greater than 11.7 g/dl. Four of these were randomly assigned to receive a
total dose infusion of iron-dextran and 4 were given placebo tablets for 2 months.
Results: Three test patients improved but none of the patients on placebo improved.
The authors remark that it was possible to assess 11 patients in total who had been treated with iron
and that 9 had responded to treatment.
Interpretation: The numbers are small and details of ascertainment and selection are not reported.
Although the results support the hypothesis that iron deficiency impairs immune function, the
mechanism proposed, viz an epithelial defect, may not account for the hypothesized susceptibility to
other infections with other classes of organisms. It may be that a different mechanism is operative in
these patients.
A second difficulty in interpretation arises in determining the cause of iron deficiency. Did the chronic
mucocutaneous candidiasis perhaps cause the iron deficiency? Or was there ~other factor that was
responsible for both the candidiasis and the difficulty in maintaining normal iron stores in these ·
patients?
Conclusion: This small study is relevant to a specific and unusual infection but it would be difficult to
justify extrapolation from the results to the thesis of a generalized susceptibility to infection in iron
deficiency.
Adults
Studies with anecdotal reports
Basta and Churchill (1974)
Chandra et af.91 ) state that Basta and Churchill(2l) "reported a higher prevalence of acute and chronic
infections in the iron-deficient anaemic group compared with the non-anaemic group". Assessment is not
possible since the inter-library loan service was not able to retrieve this report.
Retrospective or prevalence studies Basta et al (1979)
Basta et ai<22) compared morbidity scores and period prevalence of infection between anaemic
(haematocrit < 38%) and non-anaemic workers on an Indonesian rubber plantation.

2.80 IRON NUTRITION AND IMMUNITY
"Period prevalence of systemic or local infection was almost twice as high in the anaemic men as in the ·
non-anaemic". The differences in bronchitis, influenza and diarrhoea were notable. "Disease
morbidity was scored and showed a significant correlation (P < 0.01) with haemoglobin".
Apart from the usual difficulties in interpreting retrospective and prevalence studies, evaluation is
hampered by the lack of control for nutritional status. This particular group were severely nutritionally
restricted and it is possible that the anaemic members were suffering from deficiencies other than iron
that would have confounded interpretation of the results. Nutritional indices were not compared
between the two groups.
It seems strange that the anaemic group had a higher: period prevalence of reported infections than the
non-anaemic group but had a lower morbidity score. The authors state that the morbidity score was
significantly correlated with haemoglobin levels. One wonders whether the correlation was positive. ie
whether lower morbidity scores tended to be associated with lower haemoglobins. The authors stated
that episodes of illness were scored from O to 3 according to duration and severity but did not state
whether the higher scores were assigned to longer and more severe illnesses. If this was not the case,
the apparently contradictory results would be resolved.
It is difficult to draw a conclusion from the conflicting results of this study.
Giles et al (1962)
Giles and Brown<193) found an association between the prevalence of bacteriuria and haemoglobin
concentration in pregnant women; urinary infection was less than half as common in 447 non-anaemic
pregnant controls as in 463 anaemic pregnant women. The authors argued that it was more likely that
the anaemia was the result of urinary tract infection, partly because the haemoglobin responded to
antibacterial treatment in some patients and partly because no plausible mechanism has been proposed
by which iron deficiency might predispose to infection.
Abramson et al (1971)
In a survey of 652 women attending an antenatal clinic Abramson et af.2) found haemoglobin levels of
12.10 g/dl and 12.48 g/dl in patients with and without bacteriuria in the first and second trimesters. In
the third trimesters the haemoglobin levels were 11.70 and 12.22 respectively. The authors failed to
find an association with age, parity, social class, date of immigration or diet. This makes it more-likely
that the low haemoglobin concentration was a result of infection than of primary iron deficiency which
would correlate with several of the above variables.
Savage et al (1967)
Savage et ai(444) surveyed more than 5000 pregnant women and found no association between
haemoglobin level and bacteriuria.

CHAPTER 2 LITERATURE REVIEW
Prospective, controlled studies
Basta et al (1979)
2.81
Purpose: The purpose of the study of Basta et af.22) was "to determine: ( 1) whether anemia in low
income workers affected physical endurance, their actual productivity, and their resistance to infection, and
(2) whether iron supplementation could diminish iron deficiency anemia and raise work output in this
population".
Ascertainment: ttA total of 302 male plantation workers, 16 to 40 years old, [were] selected randomly
from a list of 400 workers".
Nutrition and diet: The workers ate a restricted diet. Rice was rationed and extra income was spent
on edible leaves and fruits. Mean height for the sample was 157.4 cm and mean weight was 46.9 kg.
These are both less than the third centile for 18 year old males on the NCHS growth charts. The
authors remark that the bench height of the Harvard Step Test was reduced in order to make it more
suitable for Indonesians.
Iron intake: The Iron group took, under supervision, 100 mg of ferrous sulfate daily.
Laboratory methods: Blood samples were obtained by finger prick for determination of haematocrit
and haemoglobin and for microscopical examination for malarial parasites and red cell morphology.
Haemoglobin was measured with the cyanmethaemoglobin method.
Study grouping and design: The trial consisted of 2 groups: a Placebo group who received a daily
placebo tablet and a small income supplement to encourage them to continue to participate for the 60
days of intervention and an Iron group who received a daily ferrous sulfate table and the income
supplement. (A third group who received neither placebo tablet nor financial inducement was tested
haematologically but· data on infectious morbidity in this group were not given). Examinations were
conducted before and immediately after the intervention study. Diseases reported to have occurred in
the 4 weeks preceding the first examination were recorded.
Results: Pre-intervention: These are discussed in the section above where studies of prevalence are
reviewed.
Results: Post-intervention: "Morbidity scores decreased in both anaemic groups, but more significantly in
that receiving iron and payment (P < 0.001) than in that receiving placebo and payment (P < 0.02) ...
There was a dramatic decrease in the pr.evaience of infections in both the anemic and non-anaemic iron
payment groups, whereas little change was observed in placebo-payment groups".

2.82 IRON NUTRITION AND IMMUNITY
Interpretation of results: 1 nutrition: The subjects in this study were nutritionally deprived. It is
possible that deficiencies other than iron were also present in the anaemic group. It is thus not
legitimate to assume that iron. treatment was the only factor in decreasing morbidity.
Interpretation of results: 2 analysis: The authors' statement of their results is potentially misleading
and does not agree with the tabulated data .
.It is tempting to conclude that the iron supplement was efficacious because the decrease in morbidity
score was more significant (P < 0.001) for the iron treated anaemic group than for the placebo treated
anaemic group (P < 0.02) •. The comparison should not be between the P values but between the
changes in morbidity scores (0.48 and 0.41) and a statistical test of significance should be made on this.
Figure 2.1 (which was compiled from the authors' table 5) should illustrate the fallacy and that there
was, for practical purposes, no difference between the changes in the placebo and iron treated anaemic
groups.
• At least one reviewer seems to have fallen into this trap<108l.

CHAPTER 2 LITERATURE REVIEW
• Anaemic, Iron
tv!EAN MORBIDITY SCORE
PREVALENCE OF INFECTIOI\J
0
Anaemic, Placebo
4
Non-anaemic, Iron
t:.
Non-anaemic, Placebo
2.83
Figure 2.1 Mean morbidity scores and prevalence of infection in Indonesian workers before and after treatment with placebo or 100 mg ferrous sulfate daily for 60 days.

2.84. IRON NUTRITION AND IMMUNITY
The decrease in infection rate experienced by the anaemic group was 0.51 while for the non-anaemic
group it was 0.09. The corresponding figures for the iron treated and placebo treated groups are 0.38
and 0.21. It would have been interesting to have seen an analysis of covariance to estimate the relative
contribution of temporal effects and iron treatment. From the above analysis one might estimate that
the iron had about half the influence of the other, undefined interventions.
Conclusion: figure 2.1 is a nice demonstration of the Hawthorne effect. ie that the study itself had an
impressive result on the morbidity of the workers (assuming that the exposure to infection remained
constant). The interventions responsible may have been the extra attention given to the workers, their
improved nutrition as a consequence of the higher wages they received, or other factors. The study
does show a small, ( and probably non .. significant) trend supporting the hypothesis that iron deficiency
predisposes to infection.
Infants
Studies with anecdotal reports
Tonkin (1970)
Tonkin(496•
497) conducted a trial of intramuscular iron-dextran in the prevention of iron deficiency
anaemia of infancy in which full term., appropriate for gestational age, babies.were either offered oral
iron supplementation for one year or given two injections; each equivalenr to 50 mg elemental iron.
The intramuscular iron prevented the development of anaemia and at one year the mean haemoglobin
levels in the two groups were 11.96 mg/dl and 10.98 mg/di respectively.
The author stated that the "two groups, test and control, did not show any marked differences in
morbidity either of reported illnesses or of defects found at examination."
The author then presents the results of an analysis of the association of haemoglobin level with
morbidity. Respiratory tract illness found on examination was significantly more common in the
groups with lower haemoglobin. The results for reported respiratory tract conditions and for other
infections, both on examination and by history, were variable in trend.
The conclusion drawri from this is that "the advantages of an improved haemoglobin became evident".
This inference is invalid. If iron treatment improves iron status and, concomitantly, resistance to
. infection, then one would have expected the test group to have had fewer infections than the control
group. The numbers of children were small and they were examined only at intervals of three months
during the year they were followed. This would be adequate reason for missing a protective effect of
iron treatment, and it would have been helpful if the author had calculated the probability of doing so.
More importantly, if infection depresses haemoglobin levels {as we know it doesC270)), then it would be

CHAPTER 2 LITERATURE REVIE\\T 2.85
expected that lower haemoglobin levels would be associated with increased numbers of infections. The
author's results can validly support this latter, weaker, hypothesis.
Howell (1972)
This study has been cited by several authors(308• 9l) in favour of iron deficiency increasing susceptibility
to infection. The inter-library loan service was unable to provide me with a copy of Howell's report.
Dallman (1981)
It was reported in a conferenceC126) that the US Public Health Service had in the 1960-s conducted a
study in which iron-dextran or placebo was given to about 200 new born infants; The incidence of
infections was "about equal" in the two groups but more deaths occurred in the placebo group. No.data
were given.
Heimendinger and Undritz (19S5)
In a study of the effects of ferrous gluconate supplementation in children in institutions, Heimendinger
and UndritzC215) remarked that infections were less frequent in children with improved haemoglobin
levels·. No data were given to support this assertion.
Lovric (1970)
Lovric(302) stated that 458 children in hospital had a mean haemoglobin level of 10.6 g/ dl while a
matched°* control group of healthy children had a mean of 12.0 g/dl. Although he stated that there
was a higher prevalence of infection in the hospitalized children than in the controls, no data were
given and no association was sought with infection and haemoglobin level. Little weight can be
attached to this study in testing the hypothesis of a causal relationship of iron deficiency with
susceptibility to infection.
Moe (1963)
In support of the contention that iron deficiency predisposes to infection, Moe(347) offered the
observation that 5 of 7 infants admitted to hospital with anaemia (Hb < 8 g/ dl) developed signs of
infection during their stay. No mention is made of. the reasons for admission, and no control cases
were used as a comparison.
Salmi et al (1963)
Salmi et af 442) stated in an abstract that a group of about 30 premature infants had twice the "incidence
of infections" experienced by a group of about 60 infants who were given iron supplementation. No
further data are given#.
• Cited in 503
•• Unstated, but presumably matched for age and sex
# Cited in support of the hypothesis that iron deficiency predisposes to infection(484• !OZ)_

2.86 IRON NUTRITION AND IMMUNITY
Shaw and Robertson (1964)
In a retrospective survey of 797 admission to Columbus Children's Hospital in Ohio, Shaw and
Robertson<459) found "a lower percentage of infants admitted to the surgical service were anaemic than of
those admitted to the medical service". Two thirds of the 194 admissions with Hb < 10.0 g/dl were
prompted by an infectious process.
This study's results may be added to the body of circumstantial evidence in favour of an increased
susceptibility to infection in iron deficiency ..
Stekel (1981)
A similar anecdote reported in a conferenceC126) relates that infants ~nan iron fortified milk formula,
acidified with ascorbic acid, had a lower incidence of diarrhoea than the controls. No data are given.
an.dlit seems that the two groups may not have been subject to the same exposure to infection as the
report could be taken to indicate that they were in separate parts of the city of Santiago. No weight can
be attached to the conclusions made from these observations without a full report on the methods,
materials and results of the study.
Werk.man et al (1964)
This study(S20) has been (mis)used to support the assertion that iron deficiency is associated with
increased susceptibility to infection·. The authors interviewed 28 mothers at least 1 year after their
children had been treated in hospital for iron deficiency anaemia and compared them with the mothers
of 28 control children. Little data is offered by the authors, but they do state that on follow~up the
previously iron deficient children had a mean haemoglobin of 11.52 g/ dl and that they had more
illnesses than the control group. The mean haemoglobin level of the control group is not sta.ted nor is
the nature and number of illnesses further defined. There is. nothing t~ support ( or to reject) an
association of iron deficiency with susceptibility to infection.
Retrospective or prevalence studies
Fortuine (1966)
Fortuine075) studied the association between outcome in acute purulent meningitis and initial
haemoglobin levels in 69 Alaskan natives. A fatal outcome was more likely the lower the initial
haemoglobin. The author recommended that preventive measures include treatment of anaemia.
The cautions detailed in the section above apply equally well to the implied conclusion that iron
deficiency predisposed to infection.
•• Cited by89
• "a group of infants and toddlers with iron deficiency anemia incurred more illness, among other behavioural manifestations,
than a control group of non-deficient children'm.

CHAPTER 2 LITERATURE REVIEW 2.87
Fuerth (1971)
In a brief report published in 1971, Fuerth(lSS) reported on a study undertaken in 1959 in which the
haemoglobin levels of 1 year old children were analyzed for correlation with the number of illnesses
per child during the first two years of life. No statistically significant correlation was found although
there was a trend in favour of the children with higher haemoglobin levels.
No analysis of the types of anaemia or illnesses was reported, but iron deficiency would be the most
common cause of anaemia and infection the most common cause of illness. These uncertainties make
it difficult to conclude from this study that iron deficiency either does or does not have an association
with susceptibility to infection·.
Oppenheimer (1980)
A retrospective study<375) of the prevalence of anaemia in infants admitted with bacterial meningitis or ..
pneumonia found mean haemoglobins well below the local normal values .
The author contends that, since the weight for age of the children indicated normal nutrition, there was
no increased susceptibility to infection caused by generalized malnutrition and that it was more likely
that pre-existing anaemia was an aetiological factor in the infections than vice versa. The facts that
most patients were seen within 36 hours of development of symptoms and that there was a significant
variation in haemoglobin between the aetiological groups were offered as further reasons for the
putative role of iron deficiency in the infections.
This study provides circumstantial evidence for the theory of increased susceptibility to infection in iron
deficiency and suffers from the defects of retrospective studies. As the author concludes: "These
questions could be answered only by a controlled prospective trial of iron administration to inf ants in this
community"
Reeves et al (1984)
Most of the authors reviewed in this chapter argue either for or against a causal role for iron deficiency
in increasing susceptibility to infection. In contrast, Reeves, Yip, Kiley and Dallman<412) concluded
from an interesting study of unique design that "upper respiratory and other mild antecedent infections
commonly predispose to iron deficiency (probably because of a decrease in iron absorption)".
These authors estimated the rate of infection retrospectively in a group of 291 well one year old infants
attending a routine health maintenance clinic by questioning the parents of the children. Half the
• This has been cited as evidence against such an association(-189)
.. Necessary because of altitude greater than 1500 m for 1 hospital.

2.88 IRON NUTRITION AND IMMUNITY
children were treated for three months with an iron supplement providing 3 mg iron/kg/ day while the
remainder were given. a placebo.
Prior infection was significantly associated with lower initial haemoglobin levels.
Children who did not have a history of prior infection did not respond (haematologically) to treatment
with iron or placebo. Children who did have a history of prior infection showed a. haemoglobin
response to treatment with placebo or with iron. The response was greater in those who had more
infections and was greater in the iron treated group than in the placebo group.
The authors speculate that iron absorption is sufficiently depressed during infection to affect
haematological and other indicators of iron status. In addition they hypothesize that the higher
haemoglobin response in infants with prior infections "suggests that both iron deficiency and
inflammatory disease played interactive roles".
This seems the most parsimonious explanation for these results. It would have been interesting to
know the response of the other measures of iron status to the treatments. More interesting would have
been the test of this theory by performing a similar analysis of the relationship of rates of infection
between the ages of 12 and 15 months and haemoglobin levels. One would have expected a similar
relationship to have been found with little or no effect by treatment with placebo or iron. This seems
such an obvious observation to make that one wonders if the result was not perhaps negative.
Bondestam et al (1985)
Serum iron and other trace elements were measured in 28 children, median age 3.5 years, admitted to
hospital for investigation of recurrent infections(44)_ Thirteen healthy children, median age 15.5 years
served as controls. Statistically significant decreases were found for serum iron and zinc, but not for
copper and magnesium. Mean serum transferrin and caeruloplasmin levels were almost identical in
the two groups. Ferritin and red cell indices were not reported.
The authors · postulated that "the changes in the trace element status observed in this study are the
combined effects of infection and malnutrition", and remarked that "the possible role of trace element
deficiency in predisposing to or perpetuating undue susceptibility to infections in children remains to be
elucidated". Their proper caution in interpretation is not matched by reviewers who find in this study
evidence for a causal role of iron deficiency in infection or evidence for a lack of protection of iron
deficiency against infection·. The data do not contradict this hypothesis, but they are equally consistent
with the converse interpretation of a causal influence of infection on iron deficiency.
• See for example 152
;

CHAPTER 2 LITERATURE REVIEW
Studies with multiple independent variables
Arbeter. et al (1971)
2.89
This study(9) is mentioned only because it has been cited by reviewers in support of the hypothesis that
iron deficiency predisposes to infection: ''Arbeter et al found that malnourished Colombian children
showed a remarkable decrease in infections (particularly gastro-enteritis) following con-ection of their iron
deficiency and, incidentally, of their malnutrition as wel/'{235)*.
In fact, the report by Arbeter et al is difficult to interpret and does not support the conclusions cited
above. Families in a remote Colombian village were provided with free medical care for their children.
In addition, panela, the local staple of unrefmed sugar, was sold in two forms: either unmodified, or
fortified with protein, vitamins and minerals, including iron and calcium. The group receiving the
fortified panela showed no difference in height or weight from the control group, but did have a
decreased incidence of clinically overt malnutrition and of infectious diseases. No haematological data
are presented. The tabulation of infections diagnosed omits the period of observation and (for most
age groups) omits the number of children observed. It is therefore not possible to calculate rates of
infection ... Thus it would not be valid to attribute any changes to the fortification program, let alone to
any single constituent such as iron.
Jacobs and George (1952)
Purpose: "The purpose of the stlldy was the careful clinical evaluation of a group of young inf ants, half of
whom, were to be fed the standard hospital diet, the other half to be fed the same diet to which strained
meat was added as a supplement, in such a quantity as to increase the daily protein intake approximately
25%'{244).
Ascertainment: Healthy children were alternately assigned to the test and control groups.
Nutrition: Birth weight was greater than 2.3 kg for all infants.
Socio-economic class: The children were housed in an institution and most were awaiting adoption or
foster home care.
Feeding and iron intake: Strained meat was added to the milk of test infants until spoon feeding was
possible at about three months of age.
Laboratory methods: Blood samples were obtained from heel pricks and haemoglobin concentrations
were determined with an Evelyn photoelectric colorimeter.
• Other reviewers have also misquoted this report, eg 152, 91
.. For example, per year per 100 children

2.90 IRON NUTRITION AND IMMUNI1Y
Study grouping and design: Infants were admitted alternately to the test and control groups. The ·-·
examining physician and laboratory staff were not informed of the allocation. Examinations were
performed monthly.
Results: The only illnesses which occurred during the period of study were upper respiratory infections
and gastrointestinal disturbances. Results are presented as a comparison of morbidity rates between
the test and control group, with the test group having 60% of the morbidity rate of the control group in
aggregate. When compared in age groupings, the test group had lower morbidity rates in 8 of 9 age
categories.
Interpretation of results: 1 diagnosis of infection: This is not discussed, but presumably, children in an
institution would not have had a significant illness without the study team being notified. One would
assume that recording of infections was therefore reasonably complete and accurate.
Interpretation of results: 2 exposure to infection: "Analysis of morbidity rates according to ward was not
possible because of the regular, periodic change in ward assignments with increasing age. No major
outbreaks of infection occun-ed during the study and minor seasonal outbreaks in the respective wards
offered equal exposure to both groups, since alternate bed assignment was maintained within the wards".
Interpretation of results: 3 blinding: The study was blinded to investigators.
Interpretation of results: 4 Nutrition: Weight gain in the meat fed group was significantly increased.
Interpretation of results: 5 haematology! The test group had higher median haemoglobin levels with
less variation than the control group.
Conclusion: This study suggests that meat favorably influences resistance to infection. The intention of
the study was to increase the protein intake of the infants by a adding meat to the diet. It is not
possible to ascribe the results of the intervention to a single nutrient, such as iron, in the face of so
many other associated nutritional differences.
Karp and Merz (1986)
Karp and Meri258) have documented from a study of 70 adults that chemotherapy for acute leukemia
is associated with increased serum iron levels and decreased total iron binding capacity ( and thus also
increased percentage saturation of transferrin) as compared with pre-treatment values. Fungal
infections occurred in those patients with the earliest and/or greatest reduction in total iron binding
. capacity. Effective anti.fungal therapy was associated with a return to normal of total iron binding
capacity.

~.
'
CHAPTER 2 LITERATURE REVIEW 2.91
The alteration in iron metabolism may contribute to the susceptibility to fungal infections or, less
probably, may merely be a marker of such vulnerability. The study design does not allow the
determination of the relative contributions to altered resistance to infection by leukemia, chemotherapy
and altered iron metabolism.
Prospective, controlled studies
Mackay (1928)
Purpose: The purpose of Dr Mackay's studf314) was to define the prevalence of anaemia in infancy, to
observe its ill-effects and to test prophylactic and therapeutic regimens.
Ascertainment: Infants were referred to the Queen's hospital for Children, London, :'for consultation or
light treatment"•. All infants were less than or equal to 18 months of age on admission.
Nutrition: "The great majority were under nonna/ weight as judged for instance by Griffith's standard
weight curve."
Socio-economic class: The infants came from "a poor and overcrowded district in the East end of
London".
Feeding: All infants were given full cream dried milk sweetened with cane sugar, sufficient to provide
about half a litre a day to a baby weighing 5Kg. Cod-liver oil and either orange or tomato juice were
ordered as a regular supplement. Weaning off milk began from the age of 8 months.
Iron intake: The infants admitted to the study in 1926 and 1927 were given iron in the form of "iron and
ammonium citrate" • either as a sweetened syrup or as a fortification to the dried milk .. The daily dose
was adjusted to between 4.5 and 9 grains. Since 1 grain of ammonium ferric citrate contains 80 mg of
iron, the daily iron intake can be calculated to be between 360 and 720 mg.
Laboratory methods: Blood samples were obtained by heel or finger prick. Haemoglobin was
measured with Haldane's haemoglobinometer which gives results expressed as a percentage of 13.8 g
Hb/dl. In a subsequent report it was stated that the haemoglobin results were consistently
underestimated by 7%(315>.
Study grouping and design: The Control group consisted of infants admitted to the study in 1925/1926
and the Test group consisted of infants who were admitted in 1926/1927 and given iron
• One of the therapies being evaluated was the mercury vapour quartz lamp which had been found useful for the management
of rickets. Needless to say, it had no effect on haemoglobin level.

2.92 IRON NUTRITION AND IMMUNITY
supplementation, Attendance at the follow up clinic varied from several times a week to once a month.
The period of observation varied from 1 to 12 months and averaged 2.98 months for the Control group
and 3.31 months for the Test group.
Results: The Control group experienced about twice as many infections as the Test group in both
summer and winter. When the diseases were grouped into "specific fevers", diseases of the respiratory • tract, diseases of the digestive tract and other infections, a similar relation held .
Interpretation of results: 1 exposure to infection: Dr Mackay recognized the occurrence of an
epidemic of diarrhoeal disease in the Control period and, taking this into account, disclaimed the
validity of inferences drawn from comparison of the statistics of digestive tract disease. As the average
weekly mortality in London for respiratory disease was comparable for the two groups, in
contradistinction to that for diarrhoeal disease··, she claimed that the incidence statistics for
respiratory illness and specific fevers could be used to inf er a causal relationship between iron
deficiency and infection. '
Equal mortality rates from one period to another do not imply equal morbidity rates, ( although they
would be compatible). To compare two groups of infants for infection rates, both groups should be of
similar age distribution, and exposed to the same opportunities for infection; the groups should be
studied over the same period, in the same location, and their social contacts should be similar in
frequency and type.
Interpretation of results: 2 demographic comparability: The report does not give precise age details or
compare variables such as number of siblings and socio-economic class which might act as a proxy for
exposure to infection. Few details of ascertainment are given; it is possible that children with infections
were selected for the Control part of the study and that healthier children were referred during the
Test part of the study.
Interpretation of results.: 3 blinding: The study was open to both investigator and subject and this may
have led to (unintentional) bias in ascertainment of subjects, in collection of data, or in interpretation
of results.
Interpretation of results: 4 nutrition: The average weights at the beginning and at the end of
observation of a group of Control cases are compared with a _group of Test cases. The numbers in
these groups, 176 and 62, are very different from the numbers of infants whose morbidity was observed,
235 and 87. As no explanation is given of the derivation of these groups, extrapolation to the morbidity
• Author's tables D and E and Chart XVI
•• Author's table C

CHAPTER 2 LITERATURE REVIEW 2.93
study groups may not be valid. The Test cases seemed to start the study with age and weight very
similar to the Control cases but complete the trial with an improved weight gain·. However, in both
the full morbidity study and in the smaller weight study, the Test cases were observed for longer than
the Control cases (3.31 cf 2.98 months and 21.7 cf 14.4 weeks). The sources of these differences would
be expected to bias the groups with respect to both nutrition and morbidity and, as Dr Mackay
recognized, this "makes a fair comparison difficult" ...
Interpretation of results: 5 haematology: The graphically presented data show a striking difference in
cases given iron, prophylactically or therapeutically, compared to Control infants. Reading from the
graphs, converting from the units employed (100% = 13.8g Hb/dl blood), and multiplying by 1.07 to
correct for calibration ertors<74) one may estimate that the averaged haemoglobin of the Test cases was
11.3 g/dl and that of the Controls was 10 g/dl on completion of the trial.
Conclusion: No statistical tests were made, and the data presented is not complete enough to enable
such analyses to be made now. However, formal statistics would not be necessary to convince of the
effectiveness of iron therapy and they would not obviate the methodological problems in interpreting
the morbidity study.
Taking all these objections into consideration one is still left with a strong impression that the iron
fortification may have increased the resistance to infection of the Test group infants.
James and Combes (1960)
Purpose: The purpose of the study of James and Combes<247) was to "study the health record of
a group of prematu~e infants maintained in a state of abundant iron nutrition".
Ascertainment, Grouping, Nutrition: Two hundred and five consecutive prematurely born babies, who
weighed 2000g or less and had survived at least 24 hours were allocated by random selection to either a
test group to receive iron-dextran or to a control group who received standard care. Of the 181 who
survived the neonatal period, 84 received iron-dextran and 97 did not.
Socio-economic class: The socio-economic class of the families was not reported.
Feeding: The feeding practices were not discussed other than that mothers were advised on
milk formula usage and introduction of solids.
• Author's table F
•• page 140

2.94 IRON NUTRITION AND IMMUNITY
Iron intake: When infants in the test group reached 2000g weight they were given 1ml of iron-dextran
daily for 5 days to provide a total of 250 mg of elemental iron. Babies in the control group received
supplemental oral iron preparations if their haemoglobin declined below 7 g/ dl.
Laboratory methods: Haemoglobin was determined by the oxyhaemoglobin method.
Study design: After discharge from the nursery, babies were seen monthly. ''Additional data covering
morbidity and mortality in both groups of inf ants were obtained from study of the hospital records and
from the vital statistics of the Dallas City and County Health Departments."
Results: The test group had, on average, 1.14 respiratory and diarrhoeal infections in the first year, and
1.83 illnesses per infant attending the outpatient department. The corresponding figures for the control
group were 1.20 and 1.85. The differences were not statistically significant.
Interpretation of results: 1 exposure to infection: Random allocation of infants to the study groups
would have tended to minimize bias in exposure to infection that might be caused by geographic or
demographic bias. The method of randomization is not explained however, and it may itself have been
open to (unconscious) bias.
The groups were studied simultaneously, but follow-up was better in the control group. The longer
period of observation and the suggestion that there was "a greater maternal desire to provide good care",
may have tended to increase the number of infections recorded for the control group.
Interpretation of results: 2 demographic comparability: Apart from the caveat noted in the previous
paragraph, demographic comparability is not discussed.
Interpretation of results: 3 blinding: Presumably the study was not blinded as blinding was not
reported.
Interpretation of results: 4 nutrition: The weight gain in the two groups of infants was very similar
over the first year. A difficulty in accepting this statement at face value is that the evidence for this
conclusion is a comparison between two smaller sub-groups whose selection (or exclusion) criteria are
not reported°.
Interpretation of results: haematology: An unstated number of the test group had a mean
haemoglobin of 11.5 g/dl at one year of age and none had "significant anaemia". The mean
haemoglobin of the control group was not stated; but of 48 infants, "only 5 inf ants reached the age of
• Authors' figure 1

CHAPTER 2 LITERATURE REVIEW 2.95
011e year with a haemoglobin level greater than 9.5 g/dl without having supplemental iron, and almost all
developed a significant degree of anaemia during the first year of life".
Conclusion: Although the intervention employed ensured a large difference in iron nutrition between
the two groups, the results are difficult to interpret as:·
1 The drop-out rate was more than 50%, with a large difference between the two groups.
2 The number of infections was not related to the precise number of infants followed or to the
precise period for which they were followed.
The first problem is a potentially important source of bias and the second is an important source of
error in calculating morbidity rates.
Taking these two factors into account, one may note the trend in favour of the group who had iron
dextran. There is no justification in using this study as unqualified evidence against a relationship
between iron status and susceptibility to infection·.
Andelman and Sered (1965)
Purpose: The study was "designed to determine the effects of feeding an iron-containing milk formula for
aperiod of 6 to 9 months to an inf ant population manifesting a high incidence of iron-deficiency anaemia
and a high rate of infectious morbidity'~7).
Ascertainment: Term infants under 4 weeks of age whose birth weight had been greater than 2.5 Kg
were randomly selected from those destined to attend Child Welfare Stations in the Eighth Health
District of Chicago. The method of randomization is not explained nor is the allocation to Test and
Control groups discussed. Some bias may have been present in the selection as 37% of the Test group
were enrolled on discharge from hospital, while all the Control infants were enrolled at the Welfare
Station.
Nutrition: The mean birth weights of the two groups of infants were 7.1 lb and 7.0 lb.
Socio-economic class: The study population was considered to be the lowest socio-economic of the
city.
Feeding and iron intake: The Control group received an evaporated milk formula with separate
vitamin supplementation but no extra iron. The Test group were given a milk formula containing all
essential vitamins and 12 mg of iron per quart of reconstituted formula. Strained foods were initiated
* As for example in 308

2.96 IRON NUTRITION AND IMMUNITY
at 3 months of age and by the time the infants were 6 months old, full diets of formula, cereal, egg,
meat, vegetable, and fruit had been prescribed.
Laboratory methods: Blood samples were obtained by heel prick. Haemoglobin values were
determined by the cyanmethaemoglobin method.
Study grouping and design: A Test group of603 infants and a Control group of 445 infants were given
their respective formulas from entry till the age of 6 to 9 months and periodically examined till they
were 18 months old. The frequency varied from every 4 weeks for the first 6 months (the paper is not
clear on this point) to every U weeks for the last 6 months. The overall dropout rate was 30% by one
year of age and 95% by 18 months of age. Infants for whorn the haemoglobin fell below 10 g/dl were
removed from further observation. This criterion resulted in 76% of the Control children and 9% of
the Test infants being prematurely excluded from the study.
Results: The Test group had significantly fewer respiratory infections than the Control group during
the period of iron supplementation and the six months thereafter·.
Interpretation of results: 1 diagnosis of infection: No information is given on how infections were
diagnosed0
, nor on the incidence of infections other than those of the respiratory tract. The intervals
between visits were longer than the period for reliable recall of illnessC74).
Interpretation of results: 2 exposure to infection: While the Test and Control groups came from
similar families, mean .maternal parity being 3.3 and 3.2 respectively*, no information is given as to
whether the two groups were followed simultaneously.
Interpretation of results: 3 blinding: The study was not blinded and no reason is given for the
discrepancy in the numbers allocated to the two groups.
Interpretation of results: 4 Nutrition: No difference in weights or lengths was apparent during the
study*#. At 12 months the average weight was 9.71 Kg for both groups. This is 96% of the expected
weight at that age; presumably therefore, both groups were well nourished.
• Author's figure 10
•• Although Pearson (:!94) states that this was by questioning the parents
# Author's table 1
## Author's tables 2 and 3

CHAPTER 2 LITERATURE REVIEW. 2.97
Interpretation of results: 5 haematology: Differences in haemoglobin concentration became
statistically significant at 9 to 12 weeks and at one year the average haemoglobin concentrations were
11.9 g/dl and 10.4 g/dl in the Test and Control groups respectively.
Conclusion: The pronounced difference in respiratory tract infections may have been due to the
difference in iron status but the problems in evaluating ascertainment, allocation, blinding, and
diagnosis make this inference uncertain. It would have lent strength to the study if the incidence of
other infections had been discussed.
Cantwell (1972)
Purpose: The purpose of Cantwell's studyC79) was to test the efficacy of iron-dextran in preventing
anaemia in late infancy.
Ascertainment: All Maori mothers who delivered in Hawkes Bay Hospital in 1965 were invited to join
the study.
Exclusions: Neither criteria for exclusion nor numbers of children excluded were specifically discussed.
It can be inferred from the report that infants were excluded from the trial if their parents declined to
participate or if they were premature. Children in the control group who became severely anaemic
were treated with parenteral iron. The author states that they "then ceased to be controls". Other
reasons for dropping out of the trial were not mentioned.
Socio-economic class: "The majority of Maori families in the Hawkes Bay area belong to the lower socio
economic groups".
Feeding: The justification for employing parenteral iron-dextran as the source of iron in this study was
that the ''Maori mother tends to prolong bottle feeding with her infant until the age of two years. She is
slow in introducing foods rich in iron".
. Iron intake: Iron-dextran injections were begun on the second day of life and continued daily for a total
of 5 injections. The total dose of elemental iron was 250 mg. The author calculated the total
requirement for iron in the first year of life to be 284 mg in a typical infant growing from 3.5 kg at birth
to 10.5 kg at one year.
Laboratory methods: Blood samples were obtained by finger prick. Haemoglobin was measured with
a standardized photocolorimeter using the cyanmethaemoglobin method.

2.98 IRON NUTRITION AND IMMUNITY
Study grouping and design: Babies born on the odd days of the month were treated. Haemoglobins
and haematocrits were measured serially at approximately three month intervals·. The rate of
hospitalization for the infants was calculated for the two year period of observation.
Results: The Control group experienced about 35% more admissions to hospital for infections than the
Test group. When acute wheezy bronchitis and asthma are excluded from the calculations, the Control
group had twice the admission rate of the Test group.
Interpretation of results: 1 exposure to infection: The criterion of admission on alternate days would
have ensured equal temporal exposure to infection.
Interpretation of results: 2 demographic comparability: The infants were all resident in the Hawkes
bay area, so the two groups were probably demographically similar. It would have been useful if the
report had tested some measure of expected similarity between groups such as birth order or gender.
Interpretation of results: 3 blinding: The study was open to both investigator and subject and this may
have led to (unintentional) bias in collection of data, or in interpretation of results.
Interpretation of results: 4 nutrition: Measures of nutrition such as weight and height were not
reported.
Interpretation of results: S haematology: The iron-treated group had statistically significantly higher
haemoglobin levels than the untreated controls for all the age groupings from the age of 3 months to 27
months. In contrast to the Test group, the control group had a striking decline in haemoglobin to a
nadir of 8.9 mg/ ell at 15 to 18 months.
Interpretation of results: 6 calculation of admission rates: The author does not elaborate on the
definition of admission. It would seem that it refers to both attendance. at an outpatient clinic and to
admission to a hospital ward since infections include impetigo and meningitis and the admission rate is
extraordinarily high.
In general, the calculation of admission rates is subject to several potential errors. Whert comparing
rates for two groups, both the denominator and the numerator should be comparable.
The data on which the calculations of admission rate are made are not described in this study with
sufficient clarity to enable the validity of the admission rate to be confirmed. But unclear details in
• Not stated by the author, but inferred from his 3.

CHAPTER 2 LITERATURE REVIEW 2.99
determination of the admission rate arouse the suspicion that the rates may not be strictly comparable
as the following analysis de;111onstrates.
The size of the control and test groups on admission to the study is 144 and 94 respectively. The author
states that 21 children were removed from the control group after treatment for severe anaemia. Yet
the admission rate is calculated from 61 admissions in 144 children over two years. The admission rate
should be calculated for those children who were followed for the full two year period.
The author does not discuss the reasons for excluding treated children, but there is an argument
against such exclusions. If the study is regarded as a trial of the efficacy of iron-dextran in the neonatal
period in preventing infections in the first two years of life, the approach should be that all children
ought to be included, regardless of treatment for medical reasons after allocation to their study
grouping. It is difficult to estimate the size of the potential error, but it is probably not large.
In a second type of test of the effects of iron-dextran, the author compares total hospital admissions for
Maori infants under the age of two years in the Hawkes bay and Gisborne area for the years 1964 to
1967. Admissions declined in the Hawkes bay area, but not the Gisborne area in 1965 and 1966. In
1967 there was an epidemic of viral respiratory infections in Hawkes Bay, but not in Gisborne.
On inspection it would appear that the iron-dextran might have been responsible for the decline. The
author implies that the children in Hawkes Bay had an increased exposure to infection in 1%7 and that
this year was not strictly comparable. The argument could equally well be applied to the results for
Gisbome in the two previous years.
No details on population size, growth and economy are given. It would have made direct comparison
simpler if rates rather than admissions had been given.
Conclusion: This study provides fairly strongly suggestive evidence for a loss of resistance to infection
in iron deficiency in infancy. One wonders why it seems to have been ignored in review articles on the
subject 0.
Summary and Conclusions
The above review shows that, although much has been written about the relation of iron status to
infection, there have been few controlled trials, and no study has been free of methodologic defects in
design or omissions in reporting.
• As for example in 235

' 2.100 IRON NUTRITION AND IMMUN11Y
The body of evidence is strong enough to warrant clinical zeal in treating and preventing iron
deficiency, but with due caution to risks of increasing susceptibility to (new or recrudescent) infection.
The risks are especially great in patients who might become hyperferraemic ( as for example 1n
kwashiorkor or in neonates) or in those living in tropical areas where malaria is endemic.
There is reason to believe that iron deficiency is causally related to increased susceptibility to infection,
but this association has not been properly established. It is important that this be done since iron
deficiency is common and easily treated.

1Ml'I !l IJH Lk, ift'L 1fft! t.t. llutl
CLASSIFICATION Of REPIJlTS ANO STUDIES ON HYPOTHESES THAT REL.ATE IRON STATUS TO A PREOISPOSITON TO INFECTION
-------------------------------------------~---------------------------------------------=----------------------------=----------------------------------------------------REF AUTHOR NUYJBER (first)
TEST OF HYPOTHESIS
INTERVENTION
HYPOTHESIS 1 : IRON EXCESS INCREASES SUSCEPTIBILITY TO INFECTION
19 Barry Support Iron-dextran 346 l'lofenson Support Oral iron overdose+ desferrioxamine 453 Scott ? Support Iron-sorbitol-citrate 55 Briggs ? Support Iron-sorbitol-citrate
454 Scott ? Support Iron-sorbitol-citrate + oral iron 313 l'lacFarlane ? Support Iron-dextran + refeeding in kwashiorkor 422 Robins-Browne ? Support Observation: histology at post mortem 76 Butzler ? Support Observation: case report
337 Melby ? Support Oral iron overdose+ desferrioxamine
HYPOTHESIS 2: IRON DEFICIENCY INCREASES SUSCEPTIBILITY TO INFECTION
Prospective controlled trials 314 i'lackay Support Fortification of milk formula
7 Andelman Support Fortification of milk formula 226 Higgs Support Iron-dextran plus oral iron fumarate 79 Cantwell Support Iron-dextran
169 Fletcher Suppoi:t Ferrous sulfate 247 James ? Support Iron-dextran 503 Vellar ? Support Ferrofumai:ate (60mg Fe)
22 Basta ? Support Ferrous su,l fate 74 Bui:man ? No support Fortification of milk formula
242 Jacobs ? No support "Iron therapy"
Part 1
RESULTS effect of intervention on infection
Increased incidence of Gram-negative septicaemia Yersinia enterocolitica septicaemia Urinary tract infection precipitated in 1 patient with IOA Increased pyuria in patients with chronic renal tract infection Urinary tract infection precipitated Death was associated with low initial transferrin 3 patients dying from Yersinia entercolitica septicaemia had siderosis Child with thalassemia had Yersinia enterocolitica septicaemia Yersinia enterocolitica septicaemia
Decreased infections: Respiratory, gastrointestinal, "specific", other Decreased respiratory infections Chronic mucocutaneous candidiasis improved in 3 of 4 pts & O of 4 ctls Fewer actnissions to hospital Oral candida counts fell and ll'Outh lesions improved Trend towards fewer respiratory and diarrhoeal infections Trend towards fewer respiratory infections (4oi vs 44i) Decreased infections and morbidity score No difference in infections (but, also little change in Hb) Oral Candida albicans colony counts were unchanged after treatment
;1 (") c:r
! ;-N ~ (A
~ N
"C:I - r4 i:;
.., """' ::I. C)
~ = .... U)
S'
I 8' U)
i:;
= =-=· Ii"
~ n ::t; C)
= ::c ~ = a i:;
= Cl) ..... = =-;· U)

TABLE 2.15 IRON STATUS AND INFECTION CLASSIFICATION Of REPCRTS ANO STUOIES ON HYPOTHESES THAT RELATE IRON STATUS TO A PREOI5PD5ITON TO INFECTION
REF' AUTHOR Nlfl1BE R ( first )
Studies of prevalence 176 fortuine Support Observation 226 Higgs Support Observation 169 fletcher Support Observation 426 Rose ? Support Observation 185 fuerth ? Support Observation
91 Chandra ? Support Observation: serun transferrin saturation 250 Jenkins ? Support Observation 3?S Oppenheimer ? Support Observation 44 Bondestam ? Support Observation: serum iron, transferrin
232 Jacobs ? No support Observation 320 fl1alakhovsky ? No support Observation 412 Reeves ? No support Oral iron supplement
Prospective, controlled studies. Multiple variables including iron status 244 Jacobs ? Support Strained meat · 258 Karp ? Support Observation: serun iron, transferrin sat.
Part 2
. ,,·'
Low Hb associated with a poor prognosis in purulent meningitis IDA in 23 of 31 chronic mucocutaneous candidiasis Oral.mucosal lesions and candida colony counts increased Plean SI in patients with angular cheilitis decreased Trend: number of illnesses negatively correlated with Hb Patients with recurrent herpes labialis had lower J Sat Hyperplastxc oral candidosis more common in ID Prevalance of ID increased in infants with meningitis or pneunonia SI, but not Tf, depressed in children with recurrent infections Oral Candida albicans colony counts same as controls Incidence of infection not increased in IDA Haemoglobin response associated with rt1mber of previous infections
Significantly fewer respiratory and gastrointestinal infections Patients with AML & fungal infection had reduced transferrin saturation -~ z
I 0 z i

TABLE 2.15 IRON STATUS AND INtECTION CLASSIFICATION OF REPORTS AND STUDIES ON HYPOTHESES THAT RELATE IRON STATUS TO A PREDISPOSITON TO INFECTION
----------------------=-----------~-----------------------------------------------=========~==========-===================~==========-----======:=====~------------;======= REF AUTHOR NI.PIBER (first)
TEST OF HYPOTHESIS
INTERVENTION RESULTS effect of intervention on infection
==== -====~==~~----------------------------=~==========-=-===========================---------------------------------------------------=--------------======~~=------------Anecdotal Reports 215 Heimendinger 442 Salmi
84 Cawson 347 Moe 459 Shaw 126 Dallman 302 Lovric
21 Basta 126 Stekel 323 l'larsh 162 Farquar 520 Werkman 497 Tonkin
? Support ? Support ? Support ? Support ? Support ? Support ? Support ? Support ? Support ? No support ? No support ? No support ? No support
Ferrous gluconate Observation: infection rate Iron replacement therapy Observation:incidence of infection Observation Iron dextran Observation: haemoglobin Observation Fortification of infant milk formula fortification of infant milk formula Supplementation with oral iron Observation: post treatment for ID Iron dextran
HYPOTHESIS 3: IRON DEFICIENCY PROTECTS AGAINST INFECTION
361 f'lurray Support Observation 356 f'lurray Support Ferrous sulfate 300 mg weekly 376 Oppenheimer Support Iron-dextran 361 Murray Support Refeeding after famine+ FeS04 77 Byles Support Iron-dextran
330 fllasawe ? Support Observation II II II II
362 fflurray ? Support Refeeding after famine 329 fllasawe ? Support Observation 332 fflurray ? Support feeding: grain or milk
Abbreviations: Hb Haemoglobin 10 Iron Deficiency % Sat IDA Iron Deficiency Anemia
Part 3
Children in institutions had fewer infections Decreased rate of infection experienced by test group Two patients with oral candiasis were cured S Of 7 children with Hb < Bg/dl developed infection in hospital
Hb < 10g/dl present in 29% medical and 15% surgical adnissions Treatment associated with fewer deaths, but equal infection rate Children in hospital had lower Hb and nore infections Acute and chronic infections nore prevalent in IDA Decreased infantile diarrhoea 30 children in test group had no nore infections than 44 controls No difference in "well being" Children continued to have nore infections AFTER treatment No marked difference in norbidity between Test·& Control groups
Malaria, brucellosis, tuberculosis & other infections decreased in ID Increased attack rate of Entamoeba histolytica Increased incidence of malaria and splenomegaly Recrudescence of malaria, brucellosis, tuberculosis, other infections Chloroquine prevented recrudescence of malaria Protozoal and helminthic infections less prevalent in IDA Bacterial infections nore common in IDA Transferrin saturation, serum iron & plasmodial parasitaemia increased Malaria and bacterial infections less common in iron deficiency Cerebral malaria in grain-fed children, but not in milk fed children
SI Serum Iron Percentage saturation of transferrin Tf Transferrin
=;- ~ (j Q Cl"
! = -Cl> t!I
Et t4 2' j.ol
fll °' r.il ~ s. ::I. N sr w
~ ni' ~ t")
~ .... s· =
I = C 51 t.)
= en
§ .... C e: t!I fll
~

2.104 IRON NUTRITION AND IMMUNITY
Classification and diagnosis of iron deficiency The effects of iron deficiency are well described and include decreases in haemoglobin, haematocrit,
mean cell volume, mean cell haemoglobin, red cell distribution width, serum iron, serum ferritin,
percentage saturation of serum transferrin and increased red cell protoporphyrin. The accepted patho
physiological model of the consequences of decreasing iron status is attractively clear and explanatory:
As an iron sufficient individual becomes iron deficient the first manifestation is a reduction in iron
stores. After depletion of iron stores, haematopoiesis is affected, the red cells become smaller and
hypochromic and erythrocyte protoporphyrin rises. Finally, the haemoglobin falls. The "natural"
grouping, according to this model, would be into the following classes with the associated test results*:
IRON STATUS
Replete Depletion of stores Impaired haematopoiesis
Iron deficiency anaemia
TEST RESULT
All normal Decreased serum ferritin Increased red cell ZPP Decreased MCV and MCH Decreased Hb, HCT
These principles of classification are clear and widely accepted. But, their application to determine an
individual's iron status is problematic. Hence there is an extensive literature on the practical problems
of diagnosis and classification··. The problems arise because the above classification scheme does not
allow each individual to be put into one and .only one class. The reason for this is that each class above
has different tests constituting the decision criteria, and the test results are not simply dependent on
each other as assumed in the pathophysiological model. For example, a particular individual may have
· a low haemoglobin level, but the serum ferritin could be within the normal range. There are three
reasons for this uncomfortable state of affairs.
Firstly, the pathophysiological model represents a trend rather than absolute constraints on behaviour.
The model "expects" each test to behave as well as the proverbial "gold standard" in measuring the
condition with which it has been associated. In actuality, each test is a rather indirect measure of the
particular level of iron status with which it is associated.
Secondly, the biological range of "normal" values is wide, and often age and sex specific. This makes
the setting of upper or lower limits difficult and arbitrary even when a particular multiple of the
standard deviation is taken from the mean or a specific percentile range is calculated from the
distribution of results.
• The selection of tests is for illustrative purposes and far from complete
.. See for example 29, 34, 46, 56, 75, 94, 103, 105, 106, 120, 123, 124, 125, 135, 141, 148, 163, 200, 213, 222, 245, 260, 269, 272,
273,316,322,351,397,408,417,435,436,440,527,430,531

CHAPTER 2 LITERATURE REVIEW 2.105
And thirdly, the results .of tests are often affected by confounding factors. For example, infection can
increase serum ferritin and decrease haemoglobin concentration resulting in the awkward case used as
an illustration above. The classification scheme assumes the absence of disease or variations from
normal. Clinical judgement is required to apply the classification rules for individuals with
inflammation, haemoglobinopathies etc. Studies of populations either exclude such cases or assume
that their effect is negligible.
The literature on classification and diagnosis contains didactic and instructional articles, assessment of
new tests or refinement of established tests (for populations or for individuals), and review articles.
The only article that is reviewed here is chosen because it describes the classification scheme used in
the work reported in this thesis, and because it is practical and used in the Department of Paediatrics
and Child Health, University of Cape Town. The reader who is interested in other practical aspects of
this fascinating and frustrating problem is referred to the articles cited above. The theoretical aspects
are discussed by BloisC43), Kraupel-Tayloi276) and MurphyC357).
Kirsten et a/.267) used haemoglobin concentration, mean cell volume, mean cell haemoglobin and
ferritin to classify infants between the ages of 1 and 12 months. A table of limiting values dividing the
normal from the abnormal for each test and for 6 different age groups was derived from published
data·. These reference values were then used in the decision criteria for their classification of iron
status. A child is nonnal if all tests have normal results. Diminished iron stores was diagnosed if the
ferritin was low. Haematological iron deficiency categorizes those children with low mean cell
haemoglobin and mean cell volume. The criterion for diagnosis of iron deficiency anaemia is a low
haemoglobin together with at least one of mean cell haemoglobin and mean cell volume below the
normal limit.
Like other classification schemes of iron deficiency, this does not unambiguously assign all possible
combinations of test values into one diagnostic class. The example of the child with normal ferritin and
low haemoglobin illustrates this.
Like other classification schemes, it has tried to improve specificity and sensitivity by including multiple
criteria using the inclusive or to conjoin potential sub-categories. The price to be paid for this is the
(unlikely) confusion in classifying a case with low haemoglobin, but normal mean cell volume and
normal mean cell haemoglobin. The nosologist usually will establish a catch-all category of other to
tidy away this sort of non-conforming case.
• The table is reproduced as 2 above.

2.106 IRON NUTRITION AND IMMUNITY
Prevention of iron deficiency
Iron supplementation and fortification
Public health programs to combat iron deficiency With iron deficiency being the most common single nutrient deficiency much effort has been devoted
to combating this disorder. This section discusses strategies for developing public health programs to
reduce the prevalence of iron deficiency in a population. The following sections review the technology
of food fortification with particular reference to infant milk formulas, factors influencing the absorption
of iron, studies on iron absorption, trials of iron fortified infant milk formulas and risks of iron
fortification.
The World Health Organization has published a useful model of the development of national public
health programs aimed at nutritional anaemiasC415). The first step is to define the problem of iron
deficiency ie its extent and severity. This is done by determining the status of the population,
identifying areas and groups at risk and by setting goals for acceptable levels of indicators of iron status
such as mean haemoglobin.
The second step entails a pilot trial of iron supplementation or fortification, depending on the
prevalence and severity of iron deficiency. In areas with a moderate prevalence of iron deficiency, food
fortification may be the best approach in increasing dietary intake since programs may be directed at
whole communities or at particular vulnerable groups such as infants.
With the experience gained from the pilot trial, large field trials may be implemented to test the
feasibility of national programs.
Technological issues in fortification of food with iron
In implementing a program of iron fortification the food and the additive must satisfy certain
requirements to be acceptable. The food must be widely consumed in adequate amounts and must be
processed with strict attention to quality control. A suitable additive must be compatible with its food
vehicle, readily assimilated and stable under locally available storage conditions.
Vehicles for iron fortification in infancy
Selection of a food for fortification with iron is a relatively simple task for infants. In fact most infant
cereals and milk powders are routinely fortified with iron in various formsC310).

CHAPTER 2 LITERATURE REVIEW 2.107
Sources of iron for fortification
Hurrell has provided a thorough overview of the technology of iron fortification<237). The most
common form of iron added to infant milk formulas is ferrous sulfate, although ferrous ammonium
citrate, ferrous citrate, ferrous gluconate and ferrous lactate are sometimes employed. The iron in
ferrous sulfate is as least as well absorbed as iron in the other salts.
Sources of iron commonly used for cereals are elemental iron, ferric pyrophosphate an4 ferric
orthophosphate. These sources of iron are considerably less bioavailable than iron from ferrous
sulfate, but the ferrous salts reduce product quality and shelf life unless it is kept in an airtight
container.
Factors influencing the absorption of iron
Factors influencing the bioavailability of iron include its chemical properties and the presence of
inhibitors and/ or facilitators of iron absorption.
Chemical properties of iron that affect its bioavailability
Oxidation states
Iron is added to food as elemental iron or as ferrous (Fe2+) or ferric (Fe3+) salts. Ferrous iron is
rapidly oxidized to ferric iron in the presence of oxygen. In a suitable chemical environment, ferrous
iron may be formed by the oxidation of elemental iron or the reduction of ferric iron.
Solubility
The solubilities of ferrous iron at pH 7 and pH 8 are 10·1 M and 10·3 M. Ferric iron has a solubility of
10·3 M at pH 2, but only 10·18 at pH 7. Thus, although both ferric and ferrous ions are readily soluble
in the acid condition of the stomach, the ferric ion is insoluble in the slightly alkaline conditions of the
small bowel where iron absorption occurs. In alkaline solution both ferric and ferrous iron tend to
form their respective hydroxides which are insoluble.
With few exceptions (eg ferric hydroxide, ferric orthophosphate and ferritin) all non-haem iron in a
meal exchange with a common pool of ionized iron, and it is from this pool that absorption takes place.
Haem is absorbed intact and the iron freed after it has been taken up from the lumen into the mucosal
cell.

2.108 IRON NUTRITION AND IMMUNl'IY
Formation of complexes Iron can react to form up to 6 coordinate bonds with ligands. Such a complex is termed monodentate
if 6 ligands each form 1 bond with an iron atom; bidentate if 3 ligands each form 2 bonds with an iron
atom and so on. A ligand is called a chelate when 2 or more atoms from the same ligand participate in
the bonding of a complex. Different ligands may bond with the same atom to form mixed complexes.
Binding to complexes is often highly pH dependent.
In the acid conditions of the stomach most iron is released from complexes into a common pool and
ferric iron is ~educed to ferrous iron in the presence of reducing agents such as ascorbic acid. In the
small intestine the pH rises and this favours the reformation of complexes. Bioavailability of iron is
determined by the solubility of the complexes, their affinity for iron and the extent to which insoluble
hydroxides form. In general, ferric iron binds more strongly with ligands than ferrous iron. Ligands
that chelate iron to form. insoluble complexes or complexes with very high affinity for iron inhibit its
absorption. Examples include phosphates, oxalates, dietary fiber, tannins and phytate. Ligands that
form soluble chelates with iron enhance its absorption. Amino acids, citrate and ascorbate are in this
category.
Haem iron is not susceptible to binding by ligands.
The single most important determinant of bioavailability of iron is the quantity of animal tissue in the
meal. The factors responsible have not been conclusively identified, but certain amino acids may act as
ligands and cysteine certainly is important.
In summary, the effect of a given ligand on iron availability depends on its concentration, its chelating
efficiency (which is often highly pH dependent) and the types and ·concentrations of competing ligands.
· The interaction of the factors that influence the bioavailabilty of iron is so complex that it is not yet
possible from chemical properties to · predict quantitatively either the percentage· absorption or the
effect on iron status. Such effects must be determined by direct measurement.
Facilitators and inhibitors of iron absorption
Factors that enhance the absorption of iron from a meal have been reviewed by Charlton and
Bothweu<97). · Animal tissue, ascorbic acid and other organic acids such as lactic, citric, malic and
tartaric acids promote iron absorption.
Absorption of iron is inhibited by cereals, soya bean and bran; the responsible agents include
polyphenols, tannins (present in tea, coffee and other foodstuffs) and phytates<97). A common
preservative, EDTA, may decrease the availability of iron, depending on the presence of other ligands,

CHAPTER 2 LITERATURE REVIEW 2.109
but it has been used to fortify refined sugar with iron. The major components of an infants diet that
may contain inhibitors are cereals and soya bean based infant formulas.
Rios et a/419) found similar values for the absorption of iron from cow's milk based formula and soya
bean based formula, 3.9% and 3.4% compared with 5.4%. Interpretation of this study is difficult
because they did not report the levels of ascorbic acid in the formulas. Other workers have reported a
markedly lower bioavailability of iron in soya based infant formulas(133). Gillooly et a/194) found that
the geometric mean absorption of iron from soya based formulas rose from 1.8% with no ascorbic acid
to 7.7% with a molar ratio of ascorbic acid to iron of approximately 8:1. A direct comparison was
made with a similar cow's milk formula at two concentrations of ascorbic acid. At a molar ratio of
ascorbic acid to iron of approximately 2 the geometric mean absorption from the soya formula was
2.4% and from the cow's milk formula 5.3%. Doubling the ascorbic acid content raised the respective
absorptions to 7.2% and 19.5%. When the individual measurements were adjusted to a reference
absorption of 40% the difference between the cow's milk and soya formulas was even more striking.
Cook and Bothwen(l04) review a number of other studies on iron absorption from soya products and
conclude that most recent studies suggest that soya impairs the absorption of non-haem iron. Varied
explanations have been offered for the conflicting results, but these require confirmation.
Iron absorption from breast milk is considerably more efficient than that from cow's milk or infant
formulas. The reason for this is unknown but may be due to increased concentrations of ascorbic acid,
cysteine, ,inosine and taurosine or decreased levels of phosphate(l04).
In summary, the bioavailability of iron in a meal depends on the form of the iron and the presence of
inhibitors and facilitators of absorption. The presence of meat in a meal or a glass of orange juice after
the meal can greatly increase the absorption of iron, while a cup of tea after the meal can largely
. suppress its assimilation.
Iron absorption from infant milk formulas
This section considers firstly some technical issues in the measurement of absorption of iron from food
and then reviews studies of iron assimilation from infant milk formulas. The following section
considers reports on the efficacy of programs of fortification of infant milk formulas in improving iron
status.
Measurement of food iron absorption
Iron absorption from foods has been measured in several different ways(l04). It can be estimated from
the change in iron status after introduction of a particular dietary regime. It may be calculated from
2.110 IRON NUTRITION AND IMMUNITY
metabolic balance studies using chemical measurements of iron intake, excretion and losses. Or it may
be deduced from the retention of radioactive iron ingested in a test meal.
The first method, while being the "bottom line" in measuring the efficacy of a food fortification
program, is a crude and ineffective method of determining the availability of iron from a particular
compound in a particular food. The reasons for the unsuitability of this method include the
assumptions that must be made in calculating total body iron and total iron intake and, more
importantly, the fact that assimilation of iron is regulated according to iron status.
Chemical methods of quantifying metabolic balance studies of iron are too imprecise for use in infancy.
The most accurate method of measuring iron absorption in infancy has been to determine the
incorporation of radioiron in circulating blood 10 to 14 days after a test meal. This method has been
validated in adults by comparison with measurements of total body radio-activity. The method depends
upon the existence of 2 common pools of iron in the gut viz haem iron and non-haem ir~n. le the
proportion of iron absorbed from a test meal can be equated to the proportion of added radioiron that
is absorbed (with a few exceptions that were noted above).
A major methodologic problem in iron absorption studies is the enormous variation in percentage
absorption which makes it difficult to compare results. The effect of the large day-to-day variation in
absorption for any particular subject has been reduced by administering the test dose of iron over
several days. The variability in biological response may be reduced by expressing absorption of iron as
a percentage of the absorption from a "reference" dose of ferrous sulfate and ascorbic acid given in the
fasting state. In studies designed to assess iron bioavailability the optimal approach has been to
administer 2 ( or more in adults) meals to the same individual. The best statistical summary measure of
absorption is the geometric mean since this is less affected by "outliers" than the arithmetic mean. The
geometric mean is lower than the arithmetic mean (with data in the range obtained in absorption
studies).
Studies of iron availability in infant foods are often performed in iron replete adults. Extrapolation of
the results to infants depends on a number of assumptions which have not yet been validated, but are
probably methodologically sound(l04).
Studies of iron absorption from cow's milk infant formulas
The bioavailability of iron in infant milk formulas is highly dependent on the presence of ascorbic acid.
This was shown by Derman et at'136) who conducted studies iii adult women of iron absorption from
cow's milk based infant formula. When the molar ratio of ascorbic acid to iron was increased from O to

CHAPTER 2 LITERATURE REVIEW 2.111
2 and from 2 to 6.3 the (arithmetic) mean percentage absorption rose from 7.2% to 19.6% and from
21.9% to 35.7%.
In a series of similar studies.conducted in infants aged between 5 and 18 months Stekel et af..482•
125)
found geometric mean absorption of iron from formulas without added ascorbic acid to range from
2.9% to 5.1 %. Higher mean absorption values, 5.9% to 11.3% were obtained from formulas with
supplementary ascorbic acid.
Gillooly et af..194) reported geometric mean absorption of iron by adult women from cow's milk based
infant formula. These workers found that doubling the ascorbic acid content raised the percentage
absorption of iron from 5.3% to 19.5%.
The percentage absorption of iron from cow's milk based formulas that have not had added ascorbic
acid has ranged from 2.9% to 19%(125• 136• 334• 418• 434• 438• 482). In view of these findings it has been
accepted that, while cow's milk formulas do not promote the absorption of iron, they have substantially
less inhibitory effects than infant cereals or solid foodsC104). ..
These studies are analyzed in more detail in the following chapter.
Trials of iron fortified infant milk formulas
The effectiveness of iron fortification of infant foods in improving the iron status of a population has
been shown in a number of studiesC7• 125• 323• 346• 347• 432• SOZ). These studies are summarized in table
2.16 and discussed below.
Marsh et af..323) compared a cow's milk based formula containing 12 mg Fe per litre and 55 mg ascorbic
acid per litre with the same formula without iron and with evaporated milk. The milks were given to 3
small groups of term and preterm infants from birth to 9 months of age. The group receiving the iron
fortified milk had a mean haemoglobin of 12.69 g/dl at 9 months compared with 10.46 g/dl and 9.67
g/ dl in the other 2 groups.
Andelman and Sered(7) compared the same iron fortified milk with evaporated milk in infants from a
low socio-economic population. The milk was given from discharge or the first clinic visit until 6 to 9
months of age. At 1 year of age the mean haemoglobin level in the group receiving the iron fortified
formula was 11.9 g/ dl, while the control group had a mean haemoglobin of 10.4 g/ dl and about 76% of
these infants were considered to be anaemic at some stage during the study. in contrast, only 15% of
the infants receiving iron fortification were considered anaemic at 1 year.
"'t

2.112 IRON NUTRITION AND IMMUNITY
In a small study Saarinen compared the haemoglobin, mean cell volume, percentage saturation of
transferrin and serum ferritin levels in infants who received 1 of 3 different milks. The mean
haemoglobin level at 1 year of age in the group who were fed an iron fortified cow's milk formula was
12.9.· and none were classified as iron deficient. In the group who received an unfortified infant milk
formula the haemoglobin level was 12.7 g/dl and 4% were diagnosed as iron deficient. The group
whose source of milk was the breast had a mean haemoglobin level of 12.4 g/ dl and 7% were classed as
iron deficient. Table 2.16 gives the criteria for classification of iron deficiency employed in this report.
Dallman et af..l2S) and Steke1<479) reported on similar trials conducted in a low socio-economic group in
Chile. In a pilot study, cow's milk formula fortified with iron was compared to the same milk without
iron. At 9 months of age 14.8% of the infants on the fortified milk had haemoglobin levels below 11
g/dl. The prevalence of anaemia among infants fed the unfortified formula 27.7%. In an effort to
improve the bioavailability of the iron in the milk a second pilot study was performed with a group of
infants who were given cow's milk formula with 15 mg Fe and 100 mg ascorbic per litre. This group
had mean haemoglobin levels· of 12.2 g/dl and 12.5 g/dl at 9 and 15 months of age compared with 11.1
g/ di and 11.4 g/ di in the control group who received unfortified formula·. The prevalence of anaemia
at 9 months of age was about 7.5% and 34.7% in the respective groups. A large field trial was then
implemented and reduced the prevalence of anaemia at 15 months of age to 5.5% from 29.9%. Mean
haemoglobin levels improved to 12.2 g/dl from 11.2 g/dl at 15 months.
These results are summarized in table 2.16 below. It is important to note that the results are directly
comparable for neither the mean haemoglobin levels nor the proportion of children classed as iron
deficient. Since each study used different criteria to diagnose iron deficiency, the diagnosis rate of iron
deficiency differs. Also, since the studies removed children from further observation who turned out to
be iron deficient during the study, both the mean haemoglobin levels and the prevalence of iron
deficiency will be improved in the remaining infants. This effect is largest for the groups with poorest
iron nutrition ~nd thus tends to diminish the difference between test and control groups. Nevertheless,
the table does provide a clear indication of important trends.
It should also be noted that none of these trials reported the methods of ascertainment and group
assignment and that none of the studies were blinded. This leaves open the possibility that subjective
factors may have introduced a bias into the composition of the groups.
With these caveats in mind, comparison of the studies leads to some interesting conclusions.
• The haemoglobin levels were read from figure 1 in the author's paper
• The values for mean haemoglobin were obtained from the graphs in figure 2 of Steket's papei479). The same pa'P!:r
contains the ascorbic acid concentrations of the milk formulas used by Marsh et a/(323) and Andelman and Serel?).

CHAPTER 2 LITERATURE REVIEW 2.113
The infants in the study of Saarinen who were given cow's milk formula without added iron in fact
achieved a higher mean haemoglobin and a lower prevalence of iron deficiency than infants in the
other studies who received milk with iron, and in some cases, ascorbic acid as well. The same milk
formula fortified with both iron and ascorbic acid was associated with mean haemoglobin levels of
12.69 g/dl and 11.9 g/dl in the studies of Marsh et al and Andelman and Sered. It thus seems that
excellent iron status may be achieved in infants who are fed an adequate solid diet, irrespective of the
composition of the milk formula. It also seems that iron in a formula is of most benefit to those infants
who have the least adequate solid diet.
A corollary to this conclusion is that infants in a lower socio-economic community may benefit from
infant milk formulas with more bioavailable iron than has been provided in the studies cited.

Table 2.16 Trials of irou forlilied infant milk formula
STUDY Marsb1 Marsb1 Andelman2 Saarinen3
CHARACTERISTIC Term Premature
Criteria for iron deficiency 8 g/dl6 8 g/dl6
11 g/dl7 Haemoglobin below 10 g/dl
Beikost Nil Nil Advised Vits + advice MILKS COMPARED 1 Type Formula Formula Formula Formula
Fe (mg/di) 12 · 12 12 n Vit C (mg/di) 55 55 55
2 Type Formula Formula Evaporated Formula Fe (mg/di) 1 1 1 1 Vit C (mg/di) 55 55
3 Type Evaporated Evaporated Breast milk Fe (mg/di) 1 1 1 Vit C (mg/di)
RESULTS: Mean Haemoglobin (mg/di) [Age (months))8
Group 1 12.69 [9} 12.49 [9] 11.9 [9] 12.9 [12] Group2 10.46 9.40 10.4 12.7 Group] 9.67 8.55 12.4
RESULTS: Proportion Iron Deficient Group 1 N/A N/A N/A 0% Group2 N/A N/A N/A 4% Group3 7%
NOTES: N/A Not Available .
Dallman4
Pilol 1
11 g/dl
Advised
Formula 15
Formula 1
N/A[9] N/A
14.8% 27.7%
Dallman4
Pilot 2
11 g/dl
Advised
Formula 15
100
Formula 1
12.3 [9] 11.3
7.5% approx 34.7%
Stekel5
Field
11 g/dl
Advised
Formula 15
100
Formula 1
12.2 [15] 11.2
5.5% 29.9%
>-3 ff
>i:, I»
~ '"I G Ci> G
~ G Q...
8" '"I .... I» er co" N ~ 0\
1 Marsh A, Long H, Stierwalt RN. Comparative hematologic response to iron fortification of a milk formula for infants. Pediatrics 1959; 24: 404 ... 41i(3Z3)
2 Andelman MB, Sered BR Utilization of dietary iron by term infants. A study of 1048 infants from a low socioeconomic population. American Journal of Diseases of Children 1966; 111: 45.5s(7)
3 Saarinen UM. Need for iron supplementation in infants on prolonged breast feeding. Journal of Pediatrics 1978; 93: 177-I80(43Z)
4 Dallman PR, Siimes MA, Stekel A. Iron deficiency in infancy and childhood. American Journal of Clinical Nutrition 1980; JJ: 86-118(l2S)
5 Stekel A. Prevention of iron deficiency. in: Iron nutrition in infancy and childhood. ed Stekel A. Raven Press. New York 1984: 179-194(479)
6 Criteria for iron deficiency also include serum iron < SO ug/dl
7 Criteria for iron deficiency are at least 2 of the following criteria: haemoglobin < 11 g/dl, mean cell volume < 70 fl, percentage saturation < 10%, serum ferritin < 10 ug/1.
8 Haemo!!!obin levels were read from immhs in the Qllllerf ()f SJl.llriqi>n OaJhnari 'Ill.Ii St,..kt'I
~ 1:1" tii' ~
~ Q\
CIJ .... = =-ij' Q .... ::;· Q
= =' :l .... =i g ... .... Q = Q .... n
\ Cl>
e. ~ i Cl> ni Cl,.
=· ;, = .... e. ~
·~
s = ;-

CHAPTER 2 LITERATURE REVIEW 2.115
Risks of iron fortification
Risk of infection Hegenauer and Saltman<214) and Fomon et al Pl) reviewed the literature and concluded that the
clinical and experimental evidence suggests that oral iron supplements and iron fortification present a
minimal public health risk of increased susceptibility to infection. However, the European Society of
Paediatric Gastroenterology and Nutrition (ESPGAN) in their guidelines on infant nutrition<156
)
warned that iron in infant formula which exceeded the binding capacity of lacfoferrin might increase
the susceptibility of infants to infection with Escherichia coli. The source of their concern was the study
by Bullen et a/66) which measured the effect of haematin on bacterial colonization after challenge with
Escherichia coli in new born, suckled guinea pigs. This was found to increase bacterial counts. In the
same report it was noted that the bacteriostatic effect of human milk on Escherichia coli was abolished
by the addition of sufficient ferric ammonium citrate to saturate iron binding. The ESPGAN paper
noted that the clinical relevance of these findings was questionable for milk formula stored and
prepared under hygienic conditions.
Risk of decreased absorption of zinc and other metals
Dietary iron ( organic and inorganic) has been shown in many stUdies to inhibit the absorption of
zinc(499, 470, 98, 418, 438, 317, 236, 150, 114, 529, 183, 211, 238, 335). However, at least one study has not
confirmed the competition for absorption between iron and zincC443), Most studies have used isotope
studies to determine absorption and plasma zinc to determine zinc status but hair zinc levels were
shown to be lower in malnourished infants than in normal children<139).
The evidence for a competitive interaction between iron and zinc in the diet is reviewed by
S0lomonsC469) who also considers the consequences for human nutrition and nutritional programs. He
concludes that "conscious adjustment of the Fe/Zn ratio in human diets, foods and therapeutic nu(:ients
should become a priority".
The reason for this concern is that zinc deficiency includes amongst its many manifestations growth
retardation<195) and impairment of the immune system<211• 33• 32>.
Hurley et atC236) in a review of trace metal interactions state that, as for iron and zinc, there is a similar
inverse relationship between the absorption of iron and manganese and their concentrations in the diet
but that the dependency of copper absorption on iron concentration in the diet was unimportant.
Other interactions were not discussed.

2.116 IRON NUTRITION AND IMMUNITY
Risk of iron overload Bothwell and Charlton<47) have suggested that the risk of increasing the prevalence of iron overload in
the population does not outweigh the benefits offered by programs of fortification of infant foods. The
group at particular risk for early iron overload from fortification programs are idiopathic
haemochromatosis homozygotes. The overall prevalence of this 'disorder is not known, but there are
areas in North America and Europe where it is as high as 1 in 300 to 500 of the population<47).
Risk of anaemia in vitamin E deficiency Williams et af.522) have suggested that in small . premature infants the development of vitamin E
deficiency may lead to anaemia if they are given iron fortified milk formulas. The mechanism. is
postulated by the authors to be loss of protection by vitamin E against lipid peroxidation.
Risk of gastrointestinal symptoms In a summary of feeding recommendations for normal infants Fomon et af171
) observed that: Some
physicians are opposed to the use of iron{ortified formulas because of the belief that such feeding results
in fussiness, colic, spitting-up, diarrhea, or constipation. Other physicians, including the authors, use iron
! ortified formulas regularly and consider such manifestations relatively uncommon. Unfortunately, no
study that satisfactorily resolves this controversy has been reported in the literature.
Conclusions The literature review revealed some useful guidelines for planning a fortification program and outlined
factors influencing the bioavailability of iron. With reference to infant milk formulas it was noted that
ascorbic acid is an important facilitator of iron absorption and that iron is less available from formulas
based on soya bean. It was shown that iron status in infants depends on both the source of milk and
additional foods taken. In upper socio-economic communities the level of iron fortification in infant
milk formula is less important than it is in lower socio-economic communities where the beikost. is of a
poorer quality. In lower socio-economic communities optimal iron nutrition has not been achieved
with infant milk formulas fortified at levels employed in studies reported to date.

That we must examine, not the final, but the efficient, causes
of created things.
Likewise, finally, we will not seek reasons of natural things
from the end which God or nature proposed to himself in their
creation (i.e. final causes), for we ought not to presume so far as
to think that we are sharers in the counsels of Deity, but,
considering him as the efficient cause of all things, let us
endeavour to discover by the natural light which he has planted in
us, applied to those of his attributes of which he has been willing
we should have some knowledge, what must be concluded
regarding those effects we perceil!e by our senses; bearing in mind,
however, what has been already said, that we must only confide in
this natural light so long as nothing contrary to its dictates is
revealed by God himself.
Rene Descartes
The principles of philosophy
AD 1646


CHAPTER 3 STUDY DESIGN, METHODS AND MATERIALS
Introduction
This chapter describes the problem addressed by the thesis, outlines the design and protocol, details
the planning of the trial and documents the methods and materials employed.
The problem addressed by the study
In Cape Town the municipal health clinics provide at subsidized prices cow's milk formula fortified
with iron and ascorbic acid to families with young children. Yet surveys such as that of Kirsten et
af.267) have found a disturbingly high prevalence of iron deficiency in otherwise normal infants. The
review of the literature in chapter 2 showed that infants in lower socio-economic communities certainly
benefit from the fortification of infant milk formulas with iron but that this often does not achieve
optimal iron nutrition in the population. From 5 to 10 percent c:if the infants may still be considered
iron deficient in spite of being fed with a formula containing 25% more iron and 100% more ascorbic
acid. than that employed in a popular commercial product.
The primary aim of the study thus was to see if increased iron fortification of a conventional infant milk
formula would result in improved iron nutrition in healthy full term infants.
The literature review in chapter 2 showed that iron deficiency impairs a number of laboratory tests of
immune function and that it may increase susceptibility to infection. The second aim of the study thus
was to document any changes in immune function tests and susceptibility to infection that might follow
from increasing the quantity of iron in the milk formula.
The third aim of the study was to determine if the additional iron in the milk formula was associated
with any risks. In chapter 2 a number of potential risks of iron fortification were identified and
discussed. It was noted that authorities considered the risks to be minimal but that data establishing
the safety of high levels of iron fortification of infant milk formula have not been published. The risks
include an increased susceptibility to infection, particularly infectious diarrhoeal disease, decreased zinc
absorption and gastrointestinal upsets.
The following section describes the design of the clinical trial that was made of an infant milk formula
with the concentration of iron substantially increased. Advantage was taken of the study infrastructure
to conduct surveys of the infant feeding habits in the community and of the socio-economic
characteristics of the participating families. These surveys not only provided independently valuable
descriptive data but allow the main study to be placed in its social and economic context. Their
protocols are described at the end of this chapter.

3.2
Study design - Iron fortification trial
Acknowledgements
IRON NUTRITION AND IMMUNITY.
The protocol for this study was drawn up with the assistance of Prof H de V Heese and in consultation
with Prof DW Beatty.
Protocol
The study employed a prospective, stratified, double blind, controlled trial of iron fortified milk
formula in which a group of infants were studied .from the age of 3 months to 1 year. Half of the
children, the Control group, were given a standard milk formula (Lactogen Full Protein) which
contains 8.3 mg Fe/100 g formula and 37 mg ascorbic acid/100g formula. The other half of the
subjects, ie the Test group, were given the same milk powder supplemented with extra iron to give 40
mg Fe/ 100g formula. Mothers were provided with sufficient milk formula to give their child the lesser
of 180 ml/kg/day or 1.5 liters/day.
The data. collected on entry to and exit from the study included biographical details, the weight, length
and skull circumference, evidence for possible infection (if any), full blood count with differential
enumeration, either leukocyte phytohaemagglutinin stimulation response or neutrophil bactericidal
index, lymphocyte subtyping and estimation of T and B cell numbers and proportions, delayed
cutaneous hypersensitivity to PPD and candida antigen, and plasma antibody levels to polio and
tetanus. Plasma antibody levels to polio and tetanus were also determined in the mother when the
child was 3 months old. On entry, a sample of faeces was cultured for pathogenic viruses, and on exit
each child had swabs for viral culture taken from the nasopharynx and rectum. Zinc concentrations
were determined in plasma and hair at the start and on completion of the trial.
Each child was seen every 3 or 4 weeks and subjected to a clinical examination with. recording of
weight, length, head circumference and any features suggestive of infection. The child's caretaker was
specifically asked if the child had had symptoms of infection or had been taken to a doctor, hospital or
clinic since the previous examination.
The data collection form is reproduced in appendix 6.
Children excluded for reasons of iron deficiency and infants found to be iron deficient at the end of the
study were treated with oral iron supplementation for 3 months.
Care was taken to avoid ethical problems that might have arisen from using an inf ant milk formula in a
setting where breast feeding is actively encouraged.

CHAPTER 3 STUDY DESIGN, METHODS AND MATERIALS 3.3
Important design features and the reasons for the decisions and choices that were made in designing
this experiment are detailed in the following sections.
Eligibility criteria
As ill-health and malnutrition adversely affect the immune system the eligibility criteria were designed
to select a group of healthy, well-nourished children in order to avoid co~founding factors. The
. selection criteria included the following:
Birth weight at least 3000 g
Weight at 3 months at least 5000 g for girls and 5500 g for boys
No serious illness before entry to the study
No blood transfusions before entry to study
The prospective controlled trial is such a well accepted paradigm that it does not in itself require
explanation. It is however worthwhile elaborating briefly on the care with which the Control group was
designed to be comparable to the Test group at the start of the trial and to be exposed to equivalent
environmental influences. For these epidemiological reasons as well as logistic constraints the children
had to come from a circumscribed area in a relatively homogeneous lower socio- economic group.
Bonteheuwel, a city council housing estate, was chosen because it fulfilled these criteria, was close to
the Red Cross War Memorial Childrens Hospital, and had Cape Town City Health Department clinic
facilities within easy walking distance of all residents.
If children from disparate social backgrounds and residential areas had been studied, their exposure to
sources of infection and perhaps their susceptibility to infection would have been heterogeneous. It
was hoped that the choice of Bonteheuwel would minimize the differences in susceptibility and
exposure to infection between children in the study.
Although enrollment took place over an extended period, approximately equal numbers of infants from
each group were entered into the study each month. The intention was to avoid the bias that
differential enrollment would have had on the exposure to infection experienced by the two gtoups.
Ascertainment
Mpthers in Cape Town use a number of hospitals and maternity units to deliver their children. These
facilities mail notification of birth to the primary health clinic serving the the area in which the mother
· resides. In Bonteheuwel, virtually all mothers deliver their children in one of the recognized health
care facilities. Since the notification system works efficiently, the Bonteheuwel municipal health clinic
has an accurate record of births in the area it serves. These notifications of birth were used to
ascertain the children in the study.

3.4 IRON NUTRITION.AND IMMUNI1Y
Control and Test group allocation and "blinding"
Each month, from April 1983 to August 1983, the birth notifications for the previous month were
obtained for Bonteheuwel and the name and address of the mother, her parity, any complications
during pregnancy, the date of birth and sex and weight of the child were extracted.
Children were admitted monthly to the study and were allocated to their group, Test or Control, by a
computer program that discarded children with a birth weight less than 3000 g and then performed a
stratified match on two_ potentially confounding variables. These were the number of previous ·
pregnancies of the mother, and birth weight. The reason for stratifying the infants according to their
weight and the parity of the mother was that it was hoped that this would control, in the best available
way, for susceptibility and exposure to infection. Weight was used as a proxy for nutritional and socio
economic status and parity as a proxy for number of possible infectious contacts.
The allocations were made before the children had been seen or the parents contacted. The parents,
the study team and the laboratory staff were unaware of the group allocations until the end of the study
and all laboratory investigations had been completed. Each child was allocated a unique code number
by a computer program. The list of names, code numbers and Test/Control group assignment was
kept by staff of Food and Nutritional Products so they could label the correct tins of milk formula for
each child with his or her name.
Exclusions and drop-outs
Of the first 157 children allocated to the study, 2 were excluded because their haemoglobin was less
than 9.0 g/dl and 6 parents declined the offer to participate. No children had medical reasons for
exclusion such as a blood transfusion or serious illness. Of the 149 children that began in the trial, 10
mothers withdrew for personal and domestic reasons and 7 families moved away from the study area;
132 children completed the study. Details of the children that dropped out are tabulated in appendix 1
and completion rates for the Test and Control Groups are presented with the other results for the
study.
Study size
Estimation of the number of subjects required to reach a meaningful conclusion from the study proved
a difficult task. As will be shown below it was expected that a conclusive difference in iron status would
be shown with a relatively small number of subjects. The possible benefits and risks of increas~d iron
fortification that the study aimed to determine centered on immune function and susceptibility to
infection. Since infection is the important factor from the point of view of the child, parent and health
care system, the number of subjects was established so that a clinically important difference in infection
rate would be detected with a high degree of probability.

CHAPTER 3 STUDY DESIGN, METHODS AND MATERIALS 3.S
There was little assistance to be gained from the literature in estimating the "normal" number of
infections experienced by a group of normal infarits. This is partly because there are few published
studiesC354• 472• 475
) with adequate data, and partly because infectious morbidity is so dependent on
social, economic and geographic factors that generalization from one community to another is often
not valid.
The study with the best data for our planning purposes was found in the study of MackayC314) made in
the nineteen twenties. From the data given in her report it is possible to calculate that the incidence of
infection in the control group was 4.16 per child per year and in the iron group it was 1.99 cases per
year, the difference being 2.17 infections per child per annum. No study was found where the standard
deviation of incidence of infection of normal infants could be estimated.
As a rough guide the following calculation was performed:
If the trial intervention resulted in a "saving" of one infection per child per year, and the
standard deviation· of the incidence of infection was 2.5, the number required in each group
to reach a statistical significance level of 5% with a type II error of 10% is:
N = ((1.96 + l.28)*2.5/1)2 = 65.6
le the total sample size should be at least 132 subjects. It was decided to attempt to enroll 150
subjects, 75 in each group, as the errors in the above calculation could not be estimated. Given the rate
at which subjects could be enrolled (10 per week), the duration over which the study could be held (2
years), and the capacities of the laboratories and study team, the target of 150 subjects was. the practical
limit within these resources.
Reason for fortification as an intervention strategy
The intervention strategies that were considered in the design of the study were:
1 The use of intra-muscular iron dextran to prevent iron deficiency from occurring in a group
of children
ii The use of supplementation with oral iron preparations
m The use of fortification of a common food
The first strategy was rejected because intra-muscular iron dextran has not found general favour as an
agent in preventing the development of iron deficiency in groups at risk. The reason for this general
reluctance may be due to the nature of administration (it is a painful injection) and to fears about
possible untoward side-effects of the drug. These include lingering doubts about the danger of .
inducing sarcomas, concern about the risk of increasing susceptibility to infection and concern about
the possibility of idiosyncratic reactions<529). The risks are small and these concerns are not sufficient
to inhibit the use of intra~muscular iron dextran in treating established iron deficiency, but, where the
3.6 IRON NUTRITION AND IMMUNITY
alternative exists of a painless, safe, effective and "transparent" method of prophylaxis of iron
deficiency, the latter must be chosen(l4),
The second strategy considered was that of iron supplementation. Oral iron supplementation is
effective in. preventing iron deficiency but poor compliance with prescribed drug regimes is a
ubiquitous problem in medical practice. In view of previous experience in Cape Town it was
considered that compliance with a prophylactic medicine would be low in spite of steps that could be
taken to persuade mothers to administer the iron preparation as advisel.
The final strategy considered for the experiment was to fortify a common infant food with iron. This
has the advantages of safety, ease of delivery and increased compliance<479),
One doubt that remained was of the efficacy of the intervention. The analysis that provided the
decision in favour of this strategy is given in the following three sections.
It may be asked why, given the not inconsiderable problems involved in conducting this sort of field
trial, an animal model was not used instead. There are 2 principal reasons. Firstly, since the
effectiveness of a food fortification program depends on the delivery system, acceptability of the
product and other cultural and logistic factors, such programs will always require verification by means
of field trials. Secondly, experiments on animals have provided convincing evidence for disturbances of
laboratory tests of immune function in severely iron deficient rats<281•
121). It has not been possible
however, to develop a suitable animal model for the incidence of common infections in infancy.
Reason for infant milk formula as vehicle
Various foods have been used as vehicles for fortification of iron and infant cereals and milk powders
are routinely fortified. Extensive reviews of the subject have been published eg references (14, 94).
Criteria identified by the World Health Organization for practical vehicles for iron fortification are that
"The vehicle should be one that is already consumed in adequate amounts by the people in need; one that
is available for fortification in relatively few centres so that quality can be adequately controlled and
monitored; one that is suitable for f ortijication on a large scale; and one that results in a product which is
stable under e.1:treme conditions of storage and does not alter the palatability of the food"(4lS).
Infant milk formula meets these conditions since the health clinics of the City of Cape Town provide a
milk powder at subsidized prices to families with infants and young children at a time when milk forms
a major part of their diet
• Kirsten G and Heese H de V, personal communication. Also see the comments of Stekel on page 189 of reference 479

CHAPTER 3 STUDY DESIGN, METHODS AND MATERIALS 3.7
Lactogen Full Protein was used for the trial as Food and Nutritional Products (Nesti) offered to
supply standard and modified formulas free of charge and to assist in implementing the double blind
protocol. The one important criterion in selecting the milk formula was that it should be based on
cow's milk protein and not soya bean since such such preparations may have decreased iron
absorption(l04).
The commercial infant milk formula employed in the study for the Control group contains 37 mg of
ascorbic acid per 100 g formula and 8.3 mg Fe (as ferrous sulfate) per 100 g of powder. The
reconstituted formula contained 12 mg Fe/land 53 mg ascorbic acid /I. The molar ratio of ascorbic
acid to iron is 1.41.
With 40 mg Fe/ 100 g, the Test formula contained 58 mg Fe /1 of reconstituted milk and the molar
ratio of ascorbic acid to iron was 0.29.
The reasons for using ferrous sulfate as fortificant, for choosing the fortification levels of 8.3 and 40 mg
Fe/100 g, and for not increasing the ascorbic acid fortification in the Test formula are given in the
following paragraphs.
Reason for ferrous sulfate as fortificant
Forms of iron employed for fortification of infant milk formula include ferrous sulfate, ferrous
fumarate, ferrous gluconate and ferrous lactate. Ferrous sulfate is cheap and relatively easily absorbed
(compared to other non-haem iron products), but is quite chemically reactive and can impair storage of ·
formula which is not in a sealed container(237). However, ferrous sulfate is successfully used in many
commercially available infant milk formulas and most studies of absorption of iron from infant milk
formulas have employed it. The decision to employ it in the trial was not difficult.
Reason for choosing 8.3 mg Fe/lOOg as the level of fortification for the
Control group
(a) Ethical considerations
Having decided on the structure of the experiment, the levels of iron in the milk offered to the Control
and Test Groups had to be set. The statistical power of the study to detect differences in iron status,
immune function and incidence of infection would have been improved if a (third) group had been
given unfortified formula, but this would not have been ethical in view of the known risks of iron
deficiency.

3.8 IRON NUTRITION AND IMMUNITY
(b) Considerations of ability to generalize conclusions
To assess the relative risks and benefits of increasing the concentration of iron in the Test group, the
Control group had to have a conventional formula.· The milk offered to the Control group therefore
was fortified with the amount of iron present in commercially available Lactogen Full Protein. An
additional reason for using a commercially available milk formula for the Control group was that such
formulas are sold at subsidized prices at municipal health clinics. The results of the study would
therefore be readily generalizable to the community.
(c) Estimations of effect on iron status
(i) Experience in Cape Town
In Heideveld, a similar community to that chosen for the present study, Kirsten et a/241 found a mean
haemoglobin level of 10.5 g/dl in 1 year old infants. These were all healthy infants who regularly
attended a municipal primary health care clinic where infant milk formula (fortified with iron and
ascorbic acid) was available at a subsidized price. With the present study's protocol it was expected
that the selection criteria would exclude a certain proportion of children at higher risk for developing
iron deficiency. In addition, making fortified milk freely available would tend to raise the average level
of iron nutrition in the Control group from what it would have. been with no intervention. These 2
effects could not be quantified, but it was expected that the mean haemoglobin of the Control group
would be about 1 g/ dl higher than that found in Heideveld by Kirsten et al.
In effect, a "target" level of haemoglobin for the Control group at 1 year was set at 11.5 g/ dl. Some
uncertainties in predicting this target are discussed in the following 2 sections.
(ii) Similar international studies
The results of several studies of iron fortification are discussed in chapter 2 and summarized in table
2.16. This shows that infants fed on similar milk formulas had mean haemoglobin levels that varied
from 11.9 g/ di to about 12.9 g/ dl. Infants from Finland had higher mean haemoglobin levels and a
lower incidence of iron deficiency even when the group given unfortified formula is compared with
other groups given the formula with the largest amount of iron and highest ratio of ascorbic acid to
iron·. Prediction of the results of a program of iron fortification may thus be made in qualitative rather
than quantitative terms. It was further concluded in chapter 2 that infants in lower socio-economic
communities might benefit from increases in the iron fortification of infant milk formula.
• This statement assumes the qualifications expressed in the review in chapter 2. Some mean haemoglobin levels were
obtained from graphs rather than from text in the papers cited and criteria for defining iron deficiency <liffer. These
reservations notwithstanding, the data are adequate to make the point that iron nutrition depends on the total diet rather than just on~ component.

CHAPTER 3 STUDY DESIGN, METHODS AND MATERIALS 3.9
(iii) Effects of genetic, socio-economic class and cultural factors
The effect of the prevalence of individuals with thalassemia or an haemoglobinopathy on the means of
measures of iron status in populations is likely to be small and can be disregarded in the calculations
used in planning studies of iron fortification. Justification for this assertion rests on studies of patients
at the Red Cross War Memorial Childrens Hospital by Bird et af41). These workers found that 10.4%
of "coloured" children with a mean cell volume less than 60% had a haemoglobinopathy or a
thalassemia._ The order of magnitude of the effect that such conditions might have on measures of iron
status in the population may be estimated. If 1 % of 1 year old children have a mean cell volume less
than 60 fl, then 1 in 10 of these infants might be misdiagnosed as iron deficient. Ie about 0.1 % might
have either a thalassaemia syndrome or an haemoglobinopathy but be misclassified as iron deficient. It
can thus be concluded that measures of the iron status of a population should not be affected to a
significant extent by such conditions.
Reasons for choosing 40 mg Fe/lOOg as the level of fortification for the Test
group and not altering the concentration of ascorbic acid.
(a) Optimal iron status
The mean haemoglobin level of a well nourished group of Canadian infants was 12.2 g/dl(SZ) and the
mean haemoglobin level of one year old infants who do not have evidence of iron deficiency has been
reported to be 12.5 g/dl by Dallman et a1'124) and 12.7 g/dl by Saarinen and Siimes<435). These results
indicate the mean haemoglobin level in communities with optimal iron status. It was felt that, with
excellent iron fortification, the Test group could achieve a mean haemoglobin concentration of 12.0 to
12.5 g/dl.
(b) Considerations of iron absorption and ascorbic acid
(i) Recommendations of the World Health Organization
The decision to set the level of fortification of iron at 40 mg Fe/100 formula was made on the basis of
an "educated guess" since the literature had no specific guidelines. Dallman et ai025) have shown that
the percentage absorption of iron from infant milk formula decreases as the dose increases, but that
total absorption continues to increase, albeit at a diminisliing rate. It was also known that iron
absorption is enhanced by ascorbic acid and that the World Health Organization had recommended
that "it would seem advisable for infant formulas to include both an absorbable iron salt and ascorbic
acid with an iron:ascorbic acid ratio of at least J:10"<415). Assuming this ratio is mass:mass it is
equivalent to a molar ratio of ascorbic acid to iron of 3.17. The WHO recommendation was based on
data from absorption studies on cereals which have inhibitory effects on iron absorption. The
recommended ratio of ascorbic acid to iron is therefore probably excessive for cow's milk based
formulas.

3.10 IRON NUTRITION AND IMMUNITY
(ii) Data on the association of ascorbic acid with iron absorption Chapter 2 reviewed several studies which have shown that ascorbic acid improves the absorption of
iron from infant milk formula. In 3 studies of a formula with 15 mg iron per litre Dallman et af125)
found that 100 mg ascorbic acid improved the absorption of iron from 5.5%, 4.0% and 4.9% to 12.0%,
10.7% and 11.3% (geometric means). Subsequent work has confirmed this and their results are
summarized in table 3.1 and figure 3.1. (This does not include the data from Dallman et al since it
seems that Stekel included it in his report.) The table and figure show the relationship between the
molar ratjo of ascorbic acid to iron and percentage absorption of iron. Each study confirms the
increase in iron absorption with increased ascorbicacid:iron ratio.
The next section presents an analysis of an attempt to predict the percentage iron absorption from lines
fitted by the least squares technique to the published data.

CHAPTER 3 STUDY DESIGN, METHODS AND :MATERIALS 3.11
Table 3.l Iron absorption from infant milk formulas
\
STUDY IRON ASCORBIC ACID [Fe]/[AA] ABSORPTION (mg/I) (mg/I) mol/mol % Std Dev N
2 15.0 0 0.00 · 2.9 4.3 23 2 15.0 0 0.00 2.9 3.6 12 2 15.0 0 0.00 2.9 3.2 12 2 15.0 0 0.00 3.0 4.7 10 2 10.0 0 0.00 3.1 5.3 23 2 15.0 0 0.00 3.4 3.4 13 2 15.0 0 0.00 3.6 3.8 13 2 10.0 0 0.00 3.7 6.9 35 2 10.0 0 0.00 4.0 6.7 15 2 15.0 0 0.00 4.4 5.2 13 2 15.0 0 0.00 4.4 5.7 39 2 15.0 0 0.00 4.7 45 11 2 15.0 0 0.00 4.7 4.3 12 2 10.0 0 0.00 5.1 6.2 16 2 12.7 0 0.00 7.2 9.4 12 2 19.0 10 0.17 3.4 4.2 19 2 15.0 25 0.53 3.4 3.9 12 2 19.0 40 0.67 8.8 8.1 12 2 15.0 50 1.06 5.5 6.3 12 2 12.0 55 1.45 10.3 12.2 22 2 15.0 75 1.59 8.3 6.1 20 2 12.7 80 2.00 19.6 14.5 12 2 12.7 80 2.00 21.9 28.9 10 2 20.0 133 2.11 5.3 8.25 12 2 20.0 133 2.11 6.9 13.6 13 2 15.0 100 2.11 7.9 8.8 13 2 15.0 100 2.11 10.2 10.1 39 2 15.0 100 2.11 11.3 9.1 13 2 10.0 100 3.17 5.9 12.7 14 2 15.0 200 4.23 7.9 9.7 12 2 20.0 267 4.23 19.5 27.9 7 2 12.7 254 6.34 55.7 30.9 10 2 15.0 400 8.45 6.1 5.9 10 2 15.0 800 16.91 11.8 11.8 11
NOTES l; Derman DP, Bothwell TII, Torrance JD, Bezwoda WR, Charlton RW, Mayet FGH. Importance of ascorbic acid
in the absotption of iron from infant foods. Scandinavian Journal of Haematology 1980; 25: 193-201
Arithmetic means and standard deviations reported
2: Stekel A, Olivares M, Pizarro F, Chadud P, Lopez I, Amar M. Absotption of fortification iron from milk formulas
in infants. American Journal of Clinical Nutrition 1986; 43: 917-922
Geometric means and standard deviations reported
3: Gillooly M, Torrance JD, MacPhail AP, Mills W, Mayet F. The relative effect of ascorbic acid on iron absotption
from soy-based and milk based infant formulas. American Journal of Oinical Nutrition 1984; 40: 522-527
Geometric means and ranges reported; the mean of the range is tabulated in the Std Dev column

3.12
z ,:, Q~ I- C) CL·-a:~ 0 () en~ m ....... <CO .. z () Q.! a:W -
C • E ... CD C
-j CD ... u:,
t -0 0 --a
• + *
0
'° 0 ..,.
- 'v
-ERON NUTRITION AND IMMUNIT
'C CD C :a E 0 0
0 . (')
0 N
+
0 ..-
0 N
U) - (I) u.. .. <( <(
0 o; -as
U)
0 0
a:
Figure 3.1 The relation between percentage iron absorption and molar ratio of ascorbic acid to iron in infant milk formulas from the studies of Derman et al, Stekel et al and Gillooly et al.
;

CHAPTER 3 STUDY DESIGN, METHODS AND MATERIALS 3.13.
(iii) Prediction of% iron absorption from regression analysis Linear regression analysis was performed on the data in table 3.1 in order to estimate the
bioavailability of iron in the infant milk formulas employed in the present study. The results are
summarized in table 3.2 and figure 3.1. Figure 3.1 shows the regression lines that were fitted by least
squares to the 3 sets of investigations. To facilitate relating this analysis to the present study vertical
lines in figure 3.1 indicate the ratio of ascorbic acid to iron in the Control and Test formulas.
For example, from the data of Derman et al it was calculated by this technique that the Control group
would absorb 17% of the iron present in the milk and the Test group would absorb 8.37%. If the
infants ingested on average 500 ml of formula per day ( a conservative amount), they would be receiving
5.98 mg and 28.83 mg iron respectively. The predicted amounts absorbed are 1.02 mg per day and 2.41
mg per day.
This analysis applied to the data from the other studies gave estimates of total iron absorption varying
from an impossible -1.57 mg/day to 1.94 mg/day for all studies combined. It may be concluded that
this technique does not allow an accurate prediction to be made of the amount of available iron in the
Test formula. This is not surprising since the simple linear regression analysis ignores factors such as
the iron status and age of the subjects, the presence or absence of other facilitators and inhibitors of
iron absorption and the size of the meal. Linear regression also implies a simple ( and improbable)
chemical relationship between ascorbic acid and bioavailable iron in a complex environment.
. Table 3.2 Prediction of iron absorption from regression analysis
ABSORPTION ABSORPTION Percentage from 500 ml formula ( mg)
STUDY Const coeff control Test control Test
Derman 6.09 7.74 17.00 8.37 1. 02 2.41 stekel 4.92 0.46 5.58 5.06 0.33 1. 46 Gillooly -7.30 6.34 1. 63 -5.44 0.10 -1.57 Combined 6.40 1.14 8 •. oo 6.74 o. 48. 1.94
NOTE Least squares analysis was applied to data in the published studies (see text for references). Percentage
absorption of iron was modeled as a linear function of the molar ratio of ascorbic acid to iron. The linear
regression coefficients were then used to predict the percentage and actual amounts of iron absorbed from 500 ml
of the Test and Control infant milk formulas. The Control formula had a molar ratio of ascorbic acid tQ iron of
1.41 and contained 11.96 mg Fe per liter when reconstituted. The values for the Test formula were 0.29 and 57.66
respectively.

3.14 IRON NUTRITION AND IMMUNITY
(iv) Estimation of iron absorption from comparison with therapy
The quantity of iron offered to the Test group was therefore assessed in a different way. The accepted
dose for therapeutic administration of ferrous sulfate in clinical iron deficiency is 6 mg/kg/ day at the
Red Cross War Memorial Childrens Hospita1<111). Since the Test milk had 40 mg Fe /100 g, an infant
would be provided with 5.8 mg/100 ml of r~constituted formula. If the infant ingests 100 ml
formula/kg body mass, he or she is provided with 100% of the therapeutic dose of iron, Md with an
intake of 50 ml/kg, 50% of the therapeutic dose of iron is provided. Thus, a conservative estimate of
the amount of iron provided by the Test formula was at least 50% of the therapeutic dose.
From these considerations it was felt that infants in the Test group would have sufficient absorbable
iron to ensure that their iron status would be replete even if they were taking less than half the formula
prescribed.
(v) Calculation of% iron absorption from target iron status
A third way of assessing the suitability of the level of 40mg of Fe/100 g is to estimate the extra iron
required by the Test group to increase their average haemoglobin by 1 g/dl but maintain equal iron
stores. Assuming that the average well nourished infant weighs 10 kg at the age of 1 year, has a blood
volume of 80 ml/kg and has a haemoglobin level 1 g/ dl greater than a similar control infant, then he or
she will have an additional 30 mg of iron in haemoglobin. Averaged over 9 months the extra daily
absorption is 0.11 mg Fe/day. If the child is taking (a conservative estimate of) 500 ml formula pet day
this extra iron should come from the 58/2 = 28.5 mg Fe/day in the milk formula. The increase in total
absorption required is therefore 0.11/28.5 = 0.38%. It seemed not unreasonable to expect a 382%
increase in iron fortification to cause at least a 0.4% increase in absorption·.
A similar calculation may be made for changes in total body iron by using plasma ferritin to estimate
iron stores. This would confirm the point that a small increase in iron absorption was expected from a
very large increase in iron fortification. The method is based on such controversial assumptions about
the quantitative relationship of plasma ferritin to iron stores in infancy that the exercise is not not
worth repeating here.
(vi) Consideration of effect of ferrous sulfate on milk formula
It may be asked why the level of fortification was set at 40 mg Fe/100 g and not 30 mg Fe/100 g or 50
mg/100 g. The decision was essentially arbitrary, but was based on discussions with the manufacturer
and was as high as was felt possible without compromising the quality of the milk with respect to
colour, taste and shelf life. It is of interest to note that a survey of 53 infant milk formulas in the USA,
• Calculated from: 100*(40-8.3)/8.3 = 382.

j
CHAPTER 3 STUDY DESIGN, METHODS AND MATERIALS 3.15
Japan and Europe found the iron content to range from 0.06 mg Fe/I to 58.5 mg Fe/1(310). The latter
- concentration was found in 6 formulas for sale in the USA and is essentially equivalent to the 57.7 mg
Fe/I in the Test formula.
(vii) Number of experimental variables and interpretation of
results
A final remark on the decision not to increase ascorbic acid is necessary. The analysis above provided
grounds for expecting that manipulation of the level of .-iron in the milk formula would result in a
sufficiently large differentiation between the iron status of the Control and Test groups.
An additional factor that argued against the simultaneous manipulation of iron and ascorbic acid was
the desire for a clear interpretation of results. It was felt that interpretation of results from the
experiment would be clearer if the only experimental variable was the level of iron fortification. If the
Test milk had differed from the Control formula with respect to both iron and ascorbic &cid there
would have been 2 experimental variables and it would have been difficult to assign outcome effects to
the one or the other.
Quantity of milk provided for infants
In order to ensure that all infants ingested their full milk dietary requirements from the age of three
months to one year, parents were given a generous supply of the milk formula viz 180 ml/kg/day or a
maximum of 1.5 ml per day. To discourage family members from consuming infant formula some
studies have used acidified milk powder<479). The feasibility of this strategy was explored with the help
of health care workers familiar with the community. The common consensus was that acidified' milk
would be unpopular with mothers. Consequently, a conventional infant milk formula was selected and
mothers were given more than the average infant could have ingested.
The milk was issued at the regular examination that each child underwent every 3 weeks. Mothers who
were breast feeding (partly or wholly) were encouraged to continue nursing their infants, but were
given the appropriate milk formula if they asked for it.
The study team attempted to promote the practice of breast feeding in the community and it was felt
that, if breast feeding mothers were not issued with the milk formula, this might discourage mothers
from nursing and correctly reporting their infant's feeding habits. Similar reasoning led to the decision
not to disqualify breast fed infants from participation in the study.
3.16 IRON NUTRITION AND IMMUNITY
Reasons for entry at 3 months
The greatest demand for iron is between 3 and 24 months and the highest prevalence of iron deficiency
anaemia in term infants is in the second year of life. Many programs of iron supplementation or
fortification for normal infants begin around the third month and continue until 9 to 15 months of age.
Three months was a convenient time for entry into the study since simple criteria could be employed to
select the healthy, well nourished infants required for the study and this time marked the start of
increased iron requirements.
Reasons for follow up period of 9 months
The period between 3 and 12 months is a time when infant milk formula provides the bulk of many
childrens' diets and thus provides an excellent opportunity for food fortification programs. A. prime
requirement of the study was that children be followed for a sufficient length of time for the incidence
of infection to be determined with confidence. Follow up to the age of 1 year satisfied the
requirements of being able to determine the effect of the increased iron on both iron status and
incidence of infection.
Selection of laboratory tests
(i) Volume of blood For ethical reasons it was decided that not more than 10 ml of blood would be taken from the children
on each of the 2 occasions they were to be tested. This constrained the number of laboratory tests that
could be performed on each sample and the reasons for excluding certain desirable tests are discussed
in the following sections.
(ii) Measures of iron status
The study employed the full blood count (with differential count), plasma ferritin • and red cell zinc
protoporphyrin as indicators of iron status. Since micro methods were not available at the time, it was
decided that plasma iron, total iron binding capacity and percentage saturation of transf errin would not
be measured. Characterization of the iron status of the subjects in the study would have been more
complete had these variables been measured. Cook and Finch(lOS) have recommended that the iron
status of populations be assessed by means of the haemoglobin, percentage saturation of transferrin,
free erythrocyte protoporphyrin and serum ferritin. However, plasma iron,'total iron binding capacity
and percentage saturation of transferrin have not proved to be very useful diagnostic tools in i:L,uants •.
• For teasons explained below blood was collected into heparinized tubes and measurements were thus made on plasma rather
than serum.
• Heese H de V.: personal communication'
I

CHAPTER 3 STUDY DESIGN, METHODS Al~ MATERIALS 3.17
Both transferrin and serum iron have wide normal ranges in 1 year old infants with no other evidence
of iron deficiency<124, 527). Dallman(l20) has discussed the analytical and biological variations of
laboratory tests and the implications for diagnosis of anaemia and iron deficiency. Conceptually, the
transferrin saturation would seem to be a most useful indicator of iron deficiency. However, since it is
calculated by dividing the concentration of serum iron by total iron binding capacity and multiplying by
100, it will reflect the laboratory and biological variations of both serum iron and total iron binding
capacity. (Unfortunately, Dallman did not report the coefficient of variation for transferrin saturation.)
According to Dallman, serum iron has a biological coefficient of variation of about 28% while the
coefficient of variation for total iron binding capacity is from 5 to 14%. The analytic and biological
variations are generally lower for the other indicators of iron status.
Dallman et af.-1'25) advised that haemoglobin, mean cell volume and serum ferritin or free erythrocyte
protoporphyrin be used in population surveys of iron status. The relative utility of percentage
saturation of transfetrin was not discussed in this paper but presumably was felt to be lower than that
of serum ferritin or free erythrocyte protoporphyrin.
Cook et al1°7) studied 326 adults to establish normal ranges for serum ferritin. They· found the within
subject variation in serum iron and percentage saturation of transferrin to be as great as the variation
within the group. The total iron binding capacity and serum ferritin were more <:onsistent.
Derman et af.-135) studied children between the age of 1 and 6 years of age and reported statistically
significant correlations of serum ferritin with age, haemoglobin, percentage saturation of transferrin
and serum iron. The low correlation coefficients for serum iron and percentage saturation of
transferrin ( all were less than 45%) indicate that these measure are largely independent of serum
ferritin. The authors concluded that "the accuracy of detection of individuals with Fe-deficiency anaemia
in a population is substantially improved if two independent measures of Fe deficiency are used in
combination".
Hershko et af.-197) assessed the iron status of a group of rural children and reported the sensitivities of
serum ferritin and percentage saturation of transferrin in detecting individuals with iron deficiency
anaemia defined as haemoglobin less than 11.0 g/ dl and red cell protoporphyrin greater than 40 ug/ di.
Of 23 · individuals with iron deficiency anaemia, serum ferritin was less than 16 g/1 in 19 (83%) and
saturation of transferrin was less than 16% in 20 (91%). It would have been useful if the sensitivity of
serum ferritin combined with percentage saturation of transferrin had been reported. It would then ·
have been possible to assess if the 2 tests are equivalent or complementary in diagnosing iron
deficiency anaemia.

3.18 IRON NUTRlTION AND IMMUNITY
Dallman et af..11:J) studied the ability of several tests to predict a response of at least lg/dl in the
haemoglobin level of 1 year old infants after. a therapeutic trial of iron. The tests were the mean cell
volume, percentage saturation of transferrin, free erythrocyte protoporphyrin and serum ferritin. None
could reliably predict a response in haemoglobin levels and the tests were partly complementary. (It is
of interest that about 10% of the responders were not identified by any test.) The authors did not
compare the relative utility of the tests with each other or discuss what would have been lost if 1 test
had been omitted.
Cook and Finch(lOS) have stated that the percentage saturation of transferrin is roughly equivalent to
the free erythrocyte protoporphyrin in assessing iron status.
It thus seemed that there would be a minimal opportunity cost in foregoing the iron, total iron binding
capacity and transferrin saturation tests in the present study and that iron status would be fairly well
characterized by the use of the full blood count, plasma ferritin and red cell zinc protoporphyrin.
(iii) Measures of immune function
In order to characterize the immune status of the subjects a battery of immune function tests were
applied.
The numbers and proportions of B lymphocytes and subtypes of T lymphocytes were determined with
antibody techniques. An incidental benefit of the study was the ability to determine normal ranges for
the laboratory.
Leukocyte function was measured in half of the children with the response of lymphocytes to
stimulation with phytohaemaglutinin. Samples from the other children were subjected to a neutrophil
bactericidal assay. Each child had the same test at both 3 months and 12 months in order to minimize
the effects of inter-subject variation. A side benefit again of the study was the ability to describe
normal ranges for these tests in infants.
The response to immunization with polio and tetanus was determined. These measured different.arms
of the immune system since the polio vaccine was live virus administered orally and the tetanus vaccine
was a toxiod administered intramuscularly.
Delayed cutaneous hypersensitivity was measured with the Mantoux test and candida antigen test.
These tests indicate both exposure to the agent inducing immunity and the ability of cell mediated
immunity to respond to a challenge.

CHAPTER 3 STUDY DESIGN, METHODS AND MATERIALS 3.19
(iv) Measures of viral carriage rate
If iron status influences immune function or if iron fortification affects bowel flora it might be expected
that the carriage rate of viruses might differ between the 2 study groups. For this reason fecal material
was tested at both 3 and 12 months and nasopharyngeal swabs were tested at 12 months. An incidental
benefit was the ability to describe the pattern of viral infection in healthy infants in the community; an
opportunity that does not present itself often to laboratories which receive most of their specimens
from hospital patients.
(v) Sociological characterization
Data was collected to define certain social and economic characteristics of the families in order to
place the study into its social context. This included information on age, education marital status and
occupation of parents, living conditions and numbers of children in the family.
Project team
The project was conducted by myself, then a registrar in the Department of Paediatrics and Child
Health. I was fortunate to have the assistance of Mrs D Phillips, a health educator, as my assistant for
the duration· of the trial. Mrs Phillips traced subjects, coordinated the project with the operations of
the Bonteheuwel Health Clinic, ensured that subjects kept their appointments, assisted in the
examination room, made innumerable home visits to participating families, helped trace patient ftles in
hospital record departments, administered the questionnaires, and assisted in the entry of data and its
preliminary analysis.
The entire project was directed by Professor H de V Heese who initiated the study. Professor DW
Beatty provided guidance and advice at all stages. Where I have been especially indebted to others for
particular parts of this undertaking I have acknowledged this in the text. The assistance of many other
. individuals and institutions is acknowledged at the beginning of this thesisa

3.20 IRON NUTRITION AND IMMUNITY
Study Design - Social survey of participating families
Introduction
In order to place the main study in its social context, a survey was made of the participating families to
supplement the limited demographic data gathered· at the examinations of each child. Restricted
resources did not allow the detailed investigation that a sociologist would have recommended, but the
survey did allow the community of Bonteheuwel to be described with a measure of objectivity.
Acknowledgements
The questionnaire was designed in consultation with Mrs D Lynch, social worker.
Protocol
Each family was visited by the research assistant and asked to complete a questionnaire. The visits
took place after the family had been participating for at least 3 months. The data collected was:
Date of each immunization
Result of WR test on mother during pregnancy
Place of birth
The names of all hospitals and doctors from whom health care had been sought
The caretaker of the child during the day and at night
The names of all siblings
The type of housing: council house or shack
Whether the house belonged to the family or was rented
Whether the family was lodging with in~laws, or with others
The mother's religion
Whether there was a television set in the house
The ages of the child's parents
The names of any household members with pica
The names of household members with tuberculosis
The data that was collected on entry to the study included:
The marital status of the mother
The educational attainments of the mother and of the father
The occupations of the parents
The principal source of income for the family and whether this was regular or irregular

CHAPTER 3 STUDY DESIGN, METHODS AND MATERIALS
Whether the family was living alone or with others·
Whether the child was cared for by one or both parents
The number of adults in the house
The number of siblings
The number of rooms used for sleeping
Study Design • Survey of infant feeding practices
3.21
Mothers attending the immunization clinic at Bonteheuwel were questioned on their infant feeding
practices. The survey was performed over three weeks on two occasions; in April 1983 before the
principal study commenced and again in October 1983 when the study was well under way. The data
collection sheets are shown in appendix 6. The study design and results are given in chapter 5.
Ethical Considerations
Introduction
Research involving children and infants often poses difficult ethical problems of consent, risk versus
benefit, rights of the individual and society, review and approval by independent committees, and the
distinction between and specific difficulties of therapeutic and non-therapeutic research. As medical
ethics has become a topical subject in recent years, the researcher can fmd in .the literature much of the
guidance required (393, 248, 294, 178, 4, 10, 303, 1, 82,411, 467, 464,495).
The Medical Research Council stipulates that any research worker who receives its support should
adhere to its document ''The Ethical Code and Practice for Clinical Investigations on Human
Beings'l..471>. The University of Cape Town has requirements for review of projects as described in the
next section.
The non-therapeutic aspects of the research reported in this thesis involved no risk or discomfort to
subjects or their families. The research that involved injections and blood sampling was justified by the
therapeutic benefits obtained in comparison with the minimal risks and minor procedures involved.
Written consent was obtained from parents before admission to the trial, but parents were free to
withdraw at any stage from the study. Two did in fact do so shortly before their children were due for
their second blood sample and delayed hypersensitivity skin test. Bonteheuwel is a small community
and every family in the trial was friendly with several other participants. One may speculate that if
there had been general dissatisfaction with the study methods, the dropout rate would have been much
greater.
• This question was poorly worded in the entry examination and was rephrased for the social survey

3.22 IRON NUTRITION AND IMMUNITY
The project thus complied with the formal ethical requirements and attempted to meet the informal
ethical requirements of professional peers and the local community.
Research and Ethics Committee approval
A requirement of the University of Cape Town for all studies under its auspices which involve human
subjects is that the protocols should be approved by the independent Ethical Review and Research
Committee in accordance with the Helsinki and Tokyo Declarations of the World Medical Assembly.
One requirement of the committee is that fully informed consent be obtained from the subjects, or, as
in this case, from their legal guardians. The present study adhered to these requirements.
Copies of the authorizations from the Ethics and Research Committee are included in appendix 2.
Parental consent
Signed consent was obtained from the mother or father of each child. There was one exception in the
case of an orphan where consent was obtained from the legal guardian and foster mother. The form
that parents were asked to sign is included in appendix 6
The promotion of breast feeding
It was recognized that there was a possibility that the design of the study might create the impression in
the community that formula feeding was to be preferred to breast feeding. The precautions that were
taken to avoid this are detailed in the section on the design of the main study.
It was considered important to document possible effects of the study on infant feeding practices in the
community. The surveys that were made in order to do this are described in chapter 5.
Potential side effects of iron fortification
Increased susceptibility to infection
The literature review in chapter 2 cited a number of studies that have suggested a role for excess iron
in promoting infection. The conclusion was that, although there was a theoretical risk, there is no
clinical or experimental evidence to implicate iron fortification of infant milk formula in increasing
susceptibility to infection. However, no studies have conclusively documented the safety of such
formulas. It was hoped that the study would provide such evidence. The steps taken to accomplish are
described in the clinical methods section below.

CHAPTER 3 STUDY DESIGN, METHODS AND MATERIALS 3.23
Decreased zinc absorption
The zinc status of the infants was determined because iron has been reported to interfere with zinc
absorptionC469) and zinc deficiency can impair growth(lS3) and immune function(33).
Gastrointestinal symptoms
It was noted in chapter 2 that there was a lingering concern that iron fortification might be a cause of
diarrhoea, constipation, colic and fussiness. For this reason, the caretakers of the infants were
specifically asked at their first 3 or 4 visits if they had noticed any such symptoms.
Anaemia
Iron fortified milk has been thought to lead to anaemia in small premature infants who are deficient in
vitamin E(SZ2). The postulated mechanism is promotion of lipid peroxidation by iron in the face of
diminished protection of cell membranes by vitamin E leading to increased haemolysis. This
phenomenon has not been described in full term infants.
As premature infants are particularly at risk for vitamin E deficiency for the first few weeks of life, it
was considered unlikely that the levels of iron fortification used in the present trial would constitute any
risk of haemolysis in well nourished infants at the age of three months.
Iron overload
The risk of increasing the prevalence of iron overload was reviewed in chapter 2. The consensus in the
literature is that iron fortification poses little or no risk to infants.
Painful procedures and blood sampling in infants
The main study involved the taking of a blood specimen and the administration of two intracutaneous
injections to healthy infants at the ages of 3 and 12 months. It was decided on ethical grounds to limit
attempts at venesection to 2 skin punctures.
In the main study, the tests that were made, particularly the full blood count, were judged to be
beneficial to the infants in that they provided a screening for disease. In an ideal situation with
unlimited resources it would not be unreasonable to do such screening routinely.

3.24 IRON NUTRITION AND lMMUNITY
Useful guidelines were found in a statement by the Medical Research Council of Great Britain(393).
The authors state:
" ... it is clearly within the competence of a parent or guardian of a child to give
pennission for procedures intended to benefit that child when he is not old or intelligent
enough to be able himself to give a valid consent. . .. preventives are given to people who
are not, at the moment, suffering from the relevant illness. But the ethical and legal
considerations are the same as those that govern the introduction of a new treatment."
Treatment of Iron Deficient Infants
Infants discovered to be iron deficient on entry to the study (2 infants), incidentally during the study (2
infants) and on discharge from the study (57 infants) were treated with oral iron supplementation for 3
months.

CHAPTER 3 STUDY DESIGN, METHODS AND l\1ATERIALS 3.25
Clinical methods and data collection
The data coUection forms used during the study'are shown in appendix 6. These and the full tabulation
of statistical analyses list the clinical and laboratory variables studied for each child. The sections
below· note methods used where this is important to establish the validity, accuracy or precision of the
variable concerned.
Age
At each examination the age of each child was recorded in decimals of a year as recommended by
Tanner et al491>, using their table to calculate the ages. For analysis of ages at entry to and exit from
the study the age was calculated from the appropriate dates with an accuracy of one day. These dates
were also used to determine the precise duration each child was under observation, and hence, an
accurate measure of the incidence of infection.
Weight
Each occasion an infant was examined he or she was weighed on an Seca infant scale. The same scale
was employed throughout the study and it was periodically checked with a standard weight. For
analytic purposes the first and last recordings were used to establish weight gain during the study
period.
Standard deviation score for weight
A computer program performed a linear interpolation for both weight and age to estimate the standard
deviation score for weight (SD-W score) from the NCHS growth tables.
Length
The length of an infant was measured on an "infantometer", a board with a fixed foot-stop and a ,
headboard that moved along a scale marked in centimeters and millimeters. To obtain a reproducible
result it was necessary for both team members together to position the infant and adjust the
headboard.
Standard deviation score for length
The standard deviation score for length (SD-L score) was measured from the NCHS tables by a
method similar to that used for SD-W score.

3.26 IRON NUTRITION AND IMMUNITY
Skull circumference
Skull circumference was measured with a tape measur~ around the forehead and over the inion.
Diagnosis of infection
The incidence of infection in the children was probably the most important information to be acquired
by the study. Hence, a special effort was made to determine the infection rate as precisely as possible.
In order to do this, and to facilitate comparison with other studies an operational definition was
adopted for infection. A set of criteria were specified from which all diagnostic decisions were made as
objectively as possible. For purposes of analysis, infections were graded according to severity and
classed in one of eight groups according to organ system affected viz conjunctivitis, gastro-enteritis,
respiratory tract infection, pyoderma, oral thrush and "other'.
This section describes first how episodes of illness were ascertained and then describes the sequence of
decisions that had to be reached in order to:
1) Diagnose the reason for a visit to a medical practitioner as an infection.
2) Count the infection as a discrete episode of morbidity.
3) Grade the severity of the infection.
4) Group the infection by organ system.
This section then concludes with a discussion of the difficulties in determining infection rates precisely,
accurately and in a manner which facilitates comparison with other studies of incidence of infection.
Ascertainment of episodes of infection
Each child was examined and a pertinent history was taken every three weeks throughout the study
period. Any infection discovered was noted in the child's research folder.
A member of the study team was available for consultation by the study families every weekday
morning at the Bonteheuwel Health Clinic in addition to their regular three weekly appointment.
Parents were also encouraged to use other available health care facilities if they so wished. Some
mothers and fathers thus consulted private practitioners, municipal health clinics or provincial hospitals
when their child was ill. Parents were encouraged to report each episode of illness as soon as possible
after consultation with another source of health care and the details were noted.
The diagnosis of these events was not made from the history obtained from parents but from the
original records of the private practitioner, clinic or hospital. At the end of the study, I drew up a list of
all clinics, hospitals and private practitioners that had been used as a source of medical care for any
subject. At each clinic and hospital thus indentified, the patient index was searched to see if any

CHAPTER 3 STUDY DESIGN, METHODS AND MATERIALS 3.27
subject* had been registered as a patient. I then scrutinized the medical records for all registered
subjects and noted any infections. All general practitioners that had treated any subject were contacted
by post and by telephone and asked to assist in tracing episodes of infections in all the study patients. I
requested that I be given the date, diagnosis and treatment prescribed for all infections suffered by
study subjects. From these sources and my own files a single consolidated record of episodes of
infection was constructed for each subject.
Diagnosis
Diagnosis of an infection, whether by myself or by another doctor, involved "clinical judgment" applied
to the textbook criteria of history and physical examination. When it seemed clinically indicated, I ( and
some hospital based doctors) sought confirmation of the infection by bacteriological and fungal culture.
Infections were counted according to the following criteria:
Pyoderma (including impetigo, folliculitis and abscesses) was the only type of skin infection counted.
Prolonged infections may have been counted more than once, but only if diagnosed on consultations at
least 15 days apart.
Recurrent wheezing was counted as one respiratory tract infection for every 10 episodes of lower
airways obstruction.
Concurrent symptoms were counted as multiple infections, except:
Diarrhea with systemic and/or respiratory symptoms was enumerated as one gastro·
intestinal infection.
Conjunctivitis with respiratory symptoms was counted as one respiratory tract infection.
Respiratory tract symptoms together with otitis media was counted as one respiratory tract
infection.
When there was more than one pathogenic organism isolated from one specimen, each organism was
counted separately. The episode was counted as one infection.
In cases of otorrhoea where multiple bacterial species were isolated, and each was considered to be
probably non-pathogenic, the organism was coded as "mixed" but the incident was counted as 1
infection.
• Including those who had NOT volunteered that they had been there. This was necessary because parents sometimes omitted
to tell us that they had consulted other sources of health care.

3.28 IRON NUTRITION AND· IMMUNITY
Grading of infection
Grading of infection was made on "clinical judgn1entn.
Grade 1 Minimal disease; no treatment indicated.
Grade 2 Moderate disease; treatment warranted.
Grade 3 Severe disease; hospital treatment required.
Grouping of infection
Infections were grouped according to the organ systems for final analysis. Only grade 2 and 3
infections were grouped.
Oral candidiasis was the only infection grouped on pathogen. Aphthous ulcers were grouped under
respiratory tract infections.
Eye infections were limited to bacterial <!onjunctivitis. Pharyngoconjunctivitis was included with the
respiratory tract infections.
Diarrhoea (with or without vomiting, respiratory symptoms or systemic symptoms) was grouped as
gastro-enteritis.
Respiratory tract infections were the most heterogeneous group. This included any combination of
signs and symptoms that indicated the presence of an infection of the lower or upper respiratory tract
or the middle ear.
Skin infections grouped all forms of pyoderma, bllt excluded fungal infections.
All other infections were classed as nother" diseases.
Potential Problems in determining infection rates
Several factors may lead to over- or underestimation of the rates of infections. The most important
and problematic were controlled in the operational nature of the definition of infection. The rules for
diagnosis were chosen to minimize the possibilities of counting the same infection more than once and
of including non-infectious diseases as infections.
Problem - Multiple doctors
Although most episodes of infectious disease were observed by myself personally at some stage in each
illness, many were observed only by other doctors. Som'etimes a diagnosis had to be made from the

CHAPTER 3 STUDY DESIGN, METHODS AND MATERIALS 3.29
records of doctors who were not aware that they were to be used for the purposes of this study. Care
had to be taken to use consistent criteria for diagnosing an infection. And, for those infants who were
treated by multiple doctors, care had to be taken to count each individual episode exactly once.
Problem · Non-infectious conditions which may be confused with
infectious disease. Conditions such as wheezing may have an infectious aetiology, or (perhaps more commonly) have
some other cause. This could lead to a bias towards the over-diagnosis of infection. The operational
definition's rules attempted to avoid this. Diarrhoeal disease was assumed to be infectious in aetiology.
Problem · Multiple consultations for the same infection Mothers with a sick child would often seek help more than once during the course of an infection, and
often from more than one source of health care. Care was taken in analyzing the records to count such
episodes as one infectious incident.
Problem - Multiple simultaneous infections
Concurrent infections are sometimes difficult to differentiate from one infection with multiple
symptoms and signs. The criteria for diagnosis of infection were designed to err on the conservative
side and hence may have slightly underestimated the true rates of infection.
Problem - Prolonged infections and recurrent infections
Diarrhoeal disease sometimes presented a diagnostic challenge in this category as did the child with a
wheezing chest. Somewhat arbitrary criteria· were used to separate multiple diagnoses of prolonged
infections from multiple diagnoses of recurrent infections. An incident was counted as an infection if it
was at least 15 days after a similar infection. And one in ten episodes of wheezing were counted as
infections.· The error is unlikely to be large ...
Problem - Parents with different care-seeking behaviour
Some parents frequently sought help for many trivial conditions, while other parents had a higher
threshold for seeking care for their child. "Clinical judgment" was used to temper decision making, but
it is likely that a few infectious episodes were not detected in children of the few less caring mothers.
• I could find little assistance in the literature
0 The most important "outlier• was a child who had recurrent otorrhoea. These episodes were analyzed as both one and many
infections, but did not materially affect the results.

3.30 IRON NUTRITION AND IMMUNITY
Weaning
Weaning was measured with two variables called ''first bottle" and "last breast" in the tables of results.
The variables give the age in months attained at which the child was first given milk formula and last
offered the breast. (There were a number of working mothers whose infants were breast-fed at night
and bottle-fed during the day.)

CHAPTER 3 STUDY DESIGN, METHODS AND MATERIALS 3.31
Laboratory methods
Specimen collection and storage
Blood
Blood was sampled from a vein in the arm; eight ml was. taken into a sterile plastic syringe that had
been moistened with preservative-free heparin (Pularin, Evans). · A further 2 ml was then taken into a
new sterile plastic syringe. This portion was decanted into a tube containing K-EDTA as an
anticoagulant, and used for the full blood count. The heparinized blood was transported in a plastic
tube on ice. In the laboratory the specimens were centrifuged at 400 g for 10 minutes to separate cells
from plasma. Plasma that was not used immediately for analysis was stored at -80°C. All blood
specimens were collected between 8h00 and 9h30.
Precautions were taken to prevent bacteriological or trace elemental contamination. The skin was
swabbed with gauze soaked in 70% alcohol. All needles, syringes and tubes were sterile and
disposable. Previously, quality control measures in the laboratory had shown that significant amounts
of zinc contaminate specimens if proprietary alcohol swabs are used, but that needles, tubes, syringes
and 70% ethanol on gauze do not interfere with zinc analysis·.
Hair
Hair for zinc analysis was taken dose to the scalp over the occiput.
Bacterial and fungal cultures
Material for bacterial and fungal cultures was taken on dry sterile cotton swabs and transported in
sterile containers to the laboratory.
Viral specimens
Throat and rectal swabs were transported in Hepes buffered Hank's Lactalbumin hydrolysate medium.
Faecal specimens were not specifically preserved. Processing of the specimens began within 24 hours
of collection.
• Personal communication, Dempster W, Institute of Child Health, University of Cape Town

3.32 IRON NUTRITION AND IMMUNITY
Haematology .. ,. These tests were performed by the laboratories and staff of the haematology department of the Red
Cross War Memorial Childrens Hospital under the direction of Ms R Pearl.
Full blood count
Full blood counts were made on a Coulter Counter model S plus II. The performance of the
instrument was monitored for all parameters by frequent regular assays of 4C PLUS cell controls
supplied by Coulter Diagnostics.
Differential count
Differential counts were performed manually on blood smears stained with May, Grunewald, Giemsa
stain, while reticulocytes were counted from smears stained with brilliant cresyl blue.
Biochemistry
The biochemical measurements were made in the laboratory of the Institute of Child Health of the
University of Cape Town under the direction of Mr WB Dempster and supervision of Mrs F Pocock.
Red cell zinc protoporphyrin
Blood zinc ptotoporphyrin was measured with a haematofluorometer • calibrated in units of ug/ g
Hb(324>. Standardization of the Aviv haematofluorometer was accomplished by using a calibration
slide supplied with the instrument. The slides were impregnated with rhodium B dye and correspond
to readings of 15.5 and 3.1 ug of zinc protoporphyrin per gram of haemoglobin. The calibration is set
at the factory and any deviation greater than 5% requires the instrument to be returned to factory for
adjustment. This has occurred 3 times in 6 years.
· Measurements of red cell zinc protoporphyrin in our laboratory have been compared with values of
free erythrocyte protoporphyrin measured by the extraction procedure of Piomelli<398>. A correlation
coefficient of 0.93 was obtained in 90 paired samples.
Plasma ferritin
The method employed in the assay of plasma ferritin has been described in detail by Dempster et
at<132>. The immunoradio-metric assay employed anti-human ferritin antibody .. labelled with 1251 in
• supplied by Aviv, 810 Towbin Avenue, Lakewood, New Jersey 08701, USA
"* Made in the laboratories of the Institute of Child Health(l32)

CHAPTER 3 STUDY DESIGN, METHODS AND MATERIALS 3.33
the laboratory(lS4) and ferritin prepared from human splenic tissue as an antigen and standard(SO). The
assay was performed in three stages following the method of Miles et aP44).
Stage 1. Polystyrene tubes (Falcon Plastics 2052)* were coated with anti-human ferritin antibody by
addition of 500 ul of rabbit anti-serum at a dilution of 1:10 000 in 0.2 M sodium hydrogen carbonate
buffer /sodium carbonate buffer pH 9.2 and incubated for 24 hours at 4°C. The contents of the tubes
were aspirated and washed twice with 2 ml of 0.1 % BSA buffer pH 8.0 and twice with 2 ml distilled
water. The anti-human ferritin antibody remains adsorbed to the interior wall of the test tube.
Stage 2. Two hundred ul of a known concentration of ferritin or of plasma with an unknown
concentration was added to the coated tubes and incubated for 24 hours at 4°C. The ferritin forms an
antigen-antibody complex with the anti-human ferritin on the tube wall.
Stage 3. The contents of the tubes were aspirated and washed once with 2 ml 0.1 % BSA buffer.
Thereafter 200 ul of 125I-labelled anti-human ferritin antibody (approximately 20 000 counts per minute
(CPM)) were added to the tubes and incubated for 48 hours at 4°C; the antibody attached itself to the
free antigen binding sites of the f erritin. Excess labelled antigen was removed by aspiration and
washing the tubes twice with 2 ml of 0.04 M phosphate buffer pH 7.4. The radioactivity of the
remaining antigen/antibody complex was measured in a gamma counter and was proportional to the
amount of ferritin present. Standard concentrations of ferritin, ranging from 100 to 0.159 ug/1
prepared in 4% BSA buffer pH 8.0 were measured in triplicate. Plasma from subjects was routinely
diluted 1:30 in 4% BSA buff er and assayed in triplicate,
Calculation of Results. A standard dose-response curve was constructed by plotting the logarithm of
the concentration of ferritin against the logit transformation of the count of radioactivity. le log(ferritin
concentration) was plotted on the X-axis with log(y/(1-y)) on the Y-axis, where y is the radioactivi,ty
count. The infinite dose response was estimated by a computerized iterative technique which finds that
value which gives the best fit (minimum residual sum of squares) to the straight line fitted to the
observed points and the estimated infinite dose response. The final estimate of the infinite dose
response was made by quadratic interpolation from the last three sets of observations. For routine
analysis, counts in triplicate were observed for each test sample. These were then rescaled and
converted to logits. Interpolation on the standard curve then estimated the ferritin concentration in the
serum.
#. Falcon Plastics (Div. Becton Dick.son & Co.), 1950 Williams Drive, Omard, California 93030, U.SA.

3.34 IRON NUTRITION AND IMMUNITY
Plasma zinc
The plasma zinc concentration was measured according to the method of Henry, Cannon and
Winkelman<220>. The plasma was deproteinized with trichloroacetic acid, and the supernatent analyzed
for zinc by atomic absorption at 214 nm on a Beckman model 1272M spectrophotometer.
Hair zinc
Hair zinc ·was analyzed according to a method adapted from that of V Yuzbarsiyan, Department of
Paediatrics, Istanbul University, Turkey (personal communication). The hair was sequentially washed
in hexane, in ethanol, then at least three times in deionized distilled water. It was then dried, weighed
and digested in nitric acid before aspiration into a Beckman model 1272m atomic absorption
spectrophotometer. (On a practical note, one may remark that the method is labour intensive; one
technician was able to perform about 20 analyses per week.)
Microbiology
Bacterial and fungal characte.rization
Specimens for bacterial and fungal characterization were processed in the microbiology laboratory of
the Red Cross War Memorial Childrens Hospital under the direction of Dr D Hanslo.
Viral characterization
These studies were performed by the staff and virology laboratories of the Department of Medical
Microbiology of the University of Cape Town under the direction of Professor JW Moodie and
supervision of Drs JP MacIntyre and GA Keen.
Immunological methods
The immunological tests were made in the laboratory of the Institute of Child Health of the University
of Cape Town under the direction of Professor DW Beatty and supervision of Ms J Hughes. These
tests are more fully described than most others in this thesis because immunological methods have not
reached the state of standardization that exists in biochemistry and haematology and results may vary
greatly with seemingly minor variations in laboratory procedures.
j..
Materials and laboratory reagents used in more than one assay.
Microtiter equipment
U-bottomed microtiter plates were manufactured by Greiner and by Nunc and supplied by Laboratory
and Scientific and by the Weil Organization (Distr.) respectively.

CHAPTER 3 STUDY DESIGN, METHODS AND MATERIALS 3.35
Automatic pipettes were manufactured by Gilson, and supplied by Miles Seravac.
Multiple pipettes were manufactured by Flow Titertek, and supplied by Miles Seravac.
Pipette tips were supplied by Laboratory and Scientific.
Reagents
Saline: The salt solution used as a diluent was 0.9% NaCl.
PBS pH 7.2: Phosphate buffered saline at pH 7.2 was prepared from 100 ml saline plus 23.9 ml 0.15M
KH2P04 and 76 ml 0.15M N3:zHP04•
PBS pH 6.4: Phosphate buffered saline at pH 6.4 was prepared from 100 ml saline plus 67.7 ml 0.15M ;
I<HzP04 and 32.2 ml 0.15M N3iHP04•
EDTA-PBS: The composition of this was: NaCl 8.0 g, KCl 0.2 g, N3iHP04 1.15 g, KH2P04 0.2 g made
up to I litre. Then 0.2 ml EDTA (55.836 g/1) was added to 100 ml of the PBS.
Tris-NH4CI buffer: This was made from one part tris ((hydroxy methyl)-aminomethane (Merck)), 20.6
g/1 at pH 7.3 and 9 parts NH4Cl 8.3 g/1.
RPMI-Hepes consisted of RPMI-1640 medium (Gibco, USA) buffered with 25 mM Hepes (Schwarz
Mann).
RPMI-Hepes-bicarb was prepared as above with the addition of 2 g NaHCOiL.
Lymphocytes: Blood mononuclear cells were isolated from freshly drawn heparinized blood by the
Ficoll-Isopaque technique of Byum<50) and resuspended in RPMI-HEPES-bicarb at 2x10⁶ cells/ml as
described by Beatty and Dowdle(27).
Tetanus antibody titration The procedure for tetanus antibody determination followed that of Stavitsky<476
) and Sewer<456).
Materials Erythrocytes: Fresh human group O blood (Rh positive or negative) was stored with 1 mg Na EDTA/
1 ml blood.

3.36 IRON NUTRITION AND IMMUNITY
Tannie acid: The stock solution was prepared from O.l g tannic acid and 10 ml 0.9% NaCL It was
stored at 4°C. The 0.006% tannic acid working solution was made fresh for use from 0.3 ml of the
stock solution and 49.7 ml 0.9% saline.
Tanning and coating of red cells
Erythrocytes were washed 3 times in saline and then 0.25 ml red cells were suspended in 10 ml PBS
pH 7.2. Storage was at 4°C for up to 7 days. The red cells were tanned after re-washing and re
suspension to 2.5% in PBS pH 7.2. One volume of cell suspension with one volume of 0.006% tannic
acid solution was incubated at 37°C for 15 minutes in an agitating water-bath. The suspension was then
centrifuged, the supernatent discarded, and the cells washed twice in PBS pH 7.2. To coat tanned cells
with tetanus toxoid, they were washed twice and resuspended to 2.5% concentration in PBS pH 6.4.
One volume of tanned red cell suspension. 4 volumes of 1/3 dilution tetanus toxoid ( obtained from the
South African Institute of Medical Research) and 4 volumes of PBS pH 6.4 were incubated for 10
minutes in a water bath at 37°C. The erythrocytes were kept in suspension by shaking the tubes every
30 seconds. After centrifuging, the supernatent was removed and the red cells washed and
resuspended to 1 % dilution in 1/100 heat inactivated normal rabbit serum.
Titration
Tetanus antibody titration was carried out in U-type microtiter plates. Wells 2 to 12 had 0.025 ml
diluent placed in them. The test serum was diluted 1/10 with 1/100 heat inactivated rabbit serum and
0.05 ml placed into well 1. Serial dilutions of serum were made by transferring 0.025 ml from well 1 to
well 2, thoroughly mixing the contents of well 2 and then transferring 0.025 ml from well 2 to well 3.
The procedure was then repeated for wells 3 to 12 to ·produce dilutions of the test serum of 1/10, 1/20,
1/40, ... , 1/20480 in wells 1, 2, 3, ... , 12. To the serum was added 0.025 ml of the coated tanned red
cells. The plate was read after 3 to 12 hours incubation. Two controls were used on each plate: 1)
uncoated tanned cells with serum (to test for non-specific binding factors in the serum), and 2) coated
tanned cells with diluent (to provide a negative control). The titre of anti-tetanus antibody present in a
serum was-the reciprocal of the highest dilution that produced hemagglutination.
Polio antibody titration
The procedure followed that recommended by the Institute Virion for the performance of complement
fixation.
Materials
Virion reagents were obtained from Combined Medical Specialities. These were:
Virion 1127 Polio virus complement fixing antigen

CHAPTER 3 STUDY DESIGN, METHODS AND MATERIALS
Virion 2127
Virion 3127
Virion 4127
Control antigen for complement fixation
Human antiserum, positive control
Human antiserum, negative control
3.37
Haemolytic serum: Wellcome UDIS haemolytic serum was obtained from Wellcome Laboratories.
Veronal-buffered saline (VBS) stock solution was prepared from 5.75 g diethylbarbituric acid
dissolved in 500 ml hot distilled water. To this 3.75 g sodium diethylbarbituric acid and 85.0 g NaCl
was added and the volume made up to 2000 ml with distilled water. Finally, 1.68 g MnC1i.6HzO and
0.28 g CaC1i wer.e added and the stock solution autoclaved at 115°C. It was stored at 4°C. The
working solution was prepared by diluting the stock solution 1 : 5 with distilled water just before use.
Haemolysin or haemolytic serum stock solution was prepared from 94 ml VBS thoroughly mixed with 1
ml of haemolytic serum (titre 1 in 6000) and 1 ml glycerol AR. to which 4 ml of 0.85% NaCl solution
containing 5% phenol was added. The stock solution was stored at 4°C and diluted optimally 1 in 25
with VBS just before use.
Sheep Erythrocytes were obtained from the animal unit of the Cape Provincial Administration and
stored for up to 6 weeks in Alseever's solution. A working suspension of erythrocytes was prepared by
diluting the stock 1 in 10 with VBS and centrifuging for 7 minutes at 600 g. This was repeated 4 times,
but centrifuging the cells for 10 minutes on the last occasion. The supernatent was carefully removed
and the sedimented cells diluted to 2% in VBS. The erythrocyte concentration was measured with a
photometer. The erythrocyte suspension was divided into aliquots and stored for up to 5 days.
Guinea pig serum was obtained from the animal unit of the Cape Provincial Administration and used
for its Complement. It was stored at -20°C and diluted optimally 1 in 20 with VBS immediately before
use. For each new batch, complement activity was determined by titration according to the following
scheme for microtitre plates.
Complement titration ===================================================-=-------Step 1: complement dilution Stabilized C' ml 0.1 0.1 0.1 0.1 0.1 0.1 0.1 0.1 o.1b.1 ( diluted 1 in 2 with VBS) VBS ml 1. 9 2.4 2.9 3.4 3.9 4.4 4.9 5.4 5.96.4
Step 2: complement titration Diluted C' ul 25 25 25 25 25 25 25 25 25 25 Diluted antigen ul 25 25 25 25 25 25 25 25 25 25 VBS ul 25 25 25 25 25 25 25 25 25 25 ===================================================---------

3.38 .· IRON NUTRITION AND IMMUNITY
The microtitre plates were covered with moistened filter paper and incubated overnight at 4°C and
read the following day. The highest dilution causing complete haemolysis was used as the working
dilution of complement. (This provided a 100% reserve as the complement was diluted 1 in 2 just
before performing the titration.)
Polio virus antibody titration
Specimens: 20 ul of patients plasma or control serum were diluted with 180 ul VBS and inactivated for
30 minutes at 56°C in a water-bath. Paired specimens from the same patient at the ages of 3 and 12
months were tested simultaneously on the same plate.
Antigens: Polio virus antigen (Virion 1127) and control antigen (Virion 2127) were restored
with 1 ml distilled water and stored for up to one week in tightly stoppered tubes at 4°C. Working
dilutions were 1 : 2 and 1 : 8 respectively, and were prepared on the day of use.
Test: The test was performed in microtitre plates with 96 wells arranged in 12 columns numbered 1 to
12 and 8 rows labelled A to H. The titration of a specimen was made in the wells of one row. As each ·
test employed one positive control serum (Virion 3127) and one negative control serum (Virion 4127),
up to 6 specimens could be titrated on one plate. The method was as follows:
1 25 ul of VBS were pipetted into wells 3 to 6 of a row.
2 25 ul of specimen dilution 1 in 10 were pipetted into wells 1, 2, 3 and 8
3 Serial dilutions were made with a 25 ul diluter from well 3 to well 6. This resulted in
dilutions from 1 in 10 to 1 in 160 with reciprocal titres of 10, 20, 40, 80 and 160 in wells 2 to 6.
4 25 ul of the working dilution of antigen were pipetted into wells 2 to 6.
5 25 ul VBS were pipetted into well 1 as a negative control of antigen.
6 25 ul of the working dilution of complement were pipetted into wells 1 to 6.
7 Complement controls were prepared according to the following scheme:
=======================================-====::!::========· ====· Tube No. l. 2 3 4 =============== ======-==·====·=== ·===~=-=================== Working dilution of complement 1.2 ml 0.9 ml 0.6 ml 0.3 ml VBS o.o ml 0.3 ml 0.6 ml 0.9 ml
Resulting complement units 2 1.5 1 0.5 ---=====================-===================================

CHAPTER 3 STUDY DESIGN, METHODS AND MATERIALS 3.39
The complement controls were then pipetted as follows:
----======================================================== Complement units 2 1.5 1 o.s ---==============~========================================== Complement 25 ul 25 ul 25 ul 25 ul Polio virus antigen 25 ul 25 ul 25 ul 25 ul VBS 25 ul 25 ul 25 ul 25 ul ============================================================
8 A polio virus antigen/SRBC control was made by pipetting 25 ul polio virus antigen, 25 ul 1
in 10 dilution of SRBC, and 25 ul VBS into a well.
Haemolytic system: The haemolytic system to visualize the complement fixation was prepared daily.
To 1 ml of haemolysin stock solution 24 ml VBS was added and the working solution prewarmed in a
water-bath at 3'7°C for 10 minutes. The haemolysin was added dropwise to· an equal volume of
prewarmed 2% erythrocyte suspension and mixed with a magnetic stirrer. Sensitization of the SRBC
was accomplished by incubation at room temperature for 15 minutes. In the meanwhile, the microtitre
plates were warmed in the incubator at 3'f)c for 15 minutes.
50 ul of the freshly prepared haemolytic system was pipetted into all wells, including control wells. The
microtiter plates were gently shaken and returned to the incubator for a further 20 to 30 minutes until
the complement controls showed complete haemolysis in the wells with 2 and 1.5 units and traces of
inhibition of haemolysis in the well with 1 unit of complement.
The plates were then centrifuged at 400 rpm for 5 minutes and read within 2 hours. A well was
considered positive if it showed from 50 to 100% inhibition of haemolysis.
Lymphocyte subtyping
T cells were counted by rosette formation with AET treated sheep red blood cells(34l).
T cells and T cell subsets were enumerated using murine monoclonal antibodies; OKT3 for total T cell
count, OKT4 for helper/inducer cells and OKT8 for suppressor/cytotoxic cells (Ortho Diagnostic
Systems) as follows: 1xl06 mononuclear cells resuspended in 200 ml of phosphate buffered saline
(PBS) were incubated for 30 minutes in an ice bath with 10 ul (0.05 ug) of monoclonal antibody. The
cells were washed at 4°C, and 20 ul of 1/40 fluorescent labelled rabbit anti-mouse IgG (Miles-Yeda)
was added; they were incubated on ice for 30 minutes, washed, resuspended in 30% glycerol in PBS
and counted using fluorescent microscopy.

3.40 IRON NUTRITION AND IMMUNITY
B lymphocytes were counted using a FITC (fluorescein isothiocyanate) conjugated F(ab')2 rabbit anti
human IgG (Miles-Yeda) was employed. This enabled the number of cells with surface membrane
immunoglobulin (SMIG) to be counted using fluorescent microscopy.
Lymphocyte transformation by stimulation with PHA PHA stimulated lymphocyte transformation was performed in triplicate in microplates as described by
Beatty and Dowdfe(28) and Beatty(26). 2x1<>5 mononuclear cells, 25 u1 of PHA (25 ug/ml final
concentration) (Wellcome) and 25 ul of serum in a final volume of 200 u1 of RPMI-HEPES were
placed in a well of a microtitre plate. In order to distinguish between cell and serum factors, the
patient's cells were incubated in both autologous and normal sera, and normal cells in normal and
patients' sera. The plates were incubated at 37°C for 72 hours in an humid atmosphere of 5% carbon
dioxide and 95% air in a Hotpak incubator. Twenty four hours before completion of the incubation
period 0.07 uCi 14C-thymidine (Radiochemical centre, Amersham, England, specific activity 60
mCi/mmole) was added to each well. Radioactive lymphocytes were harvested onto glass fiber filter
paper sheets (Skatron) using a multiple automatic sample harvester designed and built in· the
laboratories of the University of Cape Town Medical SchooiC26). The glass fiber disks were dried,
placed in 3 ml of scintillator solution (Instagel, Packard Instrument Co.) and·the radioactivity taken up
by transformed lymphocytes counted in a Tricarb scintillation counter spectrophotometer (Packard
Instrument Co.). The results were expressed as the arithmetic mean of the disintegrations per minute
(dpm) of the triplicate cultures after the sample readings had been corrected for background
radioactivity and counting efficiency.
Neutrophil phagocytosis and killing activity
The method for determining the phagocytic plus bactericidal efficiency of neutrophils has been
described by Haddad, Beatty and Dowdle(ZOZ). Minor modifications were made to accommodate the
smaller volume of blood obtainable from inf ants.
Preparation of neutrophils
All procedures were performed with aseptic techniques at room temperature. Two aliquots of 4 ml of
heparinized blood was mixed in 15 ml Falcon tubes (Laboratory and Scientific) with 0.67 ml of 6%
dextr<!,n (MW 200 000 to 275 000, BDH Biochemicals) in 0.85% NaCl. The cells were allowed to
sediment for 30 minutes with the tubes held at a 45 degree angle. The plasma/leukocyte layer was
aspirated with a pasteur pipette and centrifuged at 180 g for 10 minutes. After discarding the
supernatent fluid, the button of cells was resuspended in 8 ml of Tris-NH4Cl buffer (to lyse
contaminating red cells). The cells were kept in suspension for ten minutes in tlie buffer. After
centrifugation for 10 minutes at 180 g, the pellets of cells were resuspended in 1 ml EDTA-PBS and

CHAPTER 3 STUDY DESIGN, METHODS AND MATERIALS 3.41
pooled in one tube with the volume made up to 8 ml. Centrifugation at 180 g for ten minutes, .
aspiration of supernatent and re-suspension of the cells was repeated 3 times. The final pellet was
resuspended in RPMI-Hepes. Standard methods were used to perform total leukocyte and ~erential
counts, and the number of neutrophils were adjusted to 107 /ml with medium. The percentage of
neutrophils harvested was computed.
The viability of the cells was determined by the vital dye exclusion methoi140). Equal volumes of NaCl
(1.8%) and trypan blue (2% in distilled water) were mixed immediately before the test. Equal volumes
of this mixture and the cell suspension were then incubated for 10 minutes at room temperature.
Staphylococcus aureus
A strain of S. aureus (Oxford) was obtained from the Department of Bacteriology at the University of
Cape Town Medical School. After overnight growth in tryptic soy broth (Difeo), 0.5 ml of culture
material was added to 4.5 ml of fresh warm broth and incubated for 4 hours in a shaking water-bath at
37°c. It had previously been established that the bacteria would now be in the late exponential log
growth phase. After centrifugation of 2 ml of this culture at 1300 g for 20 minutes, the pellet was
resuspended in 4 ml of RPMI-Hepes medium. The absorbance at 620 nm was measured and the
corresponding viable count determined from a calibration curve established for this organism. This
was adjusted to 108 organisms per ml with medium.
Controls
Neutrophils were prepared from a normal adult. Normal serum was obtained either from the normal
cell donor or from a pool of normal human group AB serum.
Phagocytosis and bactericidal assay
The bactericidal assay was modified from the methods of Steibigel et a/477)_ The following were added
to 12 x 75 mm plastic test tubes (Falcon 2054): 250 ul PMN suspension, 50 ul serum, 150 ul RPMI
HEPES medium and 50 ul bacterial suspension, giving a neutrophil to bacteria ratio of 1 : 2. Control
tubes without PMNs were also prepared. The tubes were incubated on a tilting mixer at 3-fJC and 100
ul samples were removed at 0, 60, and 120 minutes. These were added to 900 ul sterile distilled water.
The neutrophils were then further disrupted to release live ingested bacteria. This was achieved by
sonication for 15 seconds at an amplitude of 6 um with an MSE ultrasonic disintegrator. It had
previously been shown that sonication of this intensity and duration disrupted all leukocytes without
affecting the viable count of S. aureus. The total remaining viable bacterial count was then determined
by standard dilution techniques and plating. Samples from control tubes were treated in an identical
manner. Colonies growing on blood-agar base were counted the day following plating.

3.42 IRON NUTRITION AND IMMUNITY
Results at 1 and 2 hours were expressed as:
(i) the bacterial count as a percentage of the initial inoculum
&
(ii) the bacterial count as a percentage of that for control cells
lOO*Cswf Cc60 & lOO*Cs12o/Cc120
(ill) the bacterial count as a pereentage of that for control AB serum
&
(iv) the ratio of the percentage change in colony counts for the subject to the percent~e change
for the adult control.
&
Where C indicates the colony count, the suffix indicates the subject (s), the control cells (c) or the
control AB serum (ab) and the subscript indicates the time at the start (o), at 1 hour (60) or at 2 hours
(120). Although these methods are conceptually dissimilar, the results turned out to be equivalent. For
this reason, the results are presented in chapter 6 in using method 1.
Skin tests of delayed hypersensitivity
The skin tests of delayed hypersensitivity were performed according to the recommendations of the
WHO Committee on Primary Immunodeficiency(l84)_ 100 uI of the appropriate antigen was injected
intradermally into the volar aspect of the forearm and the degree of induration read at 48 hours. The
transv7rse diameter was measured and recorded as the response to the antigen. The reagents used
were:
Mantoux test
Purified tuberculin, (PPD) 5 T.U./0.1 ml, was obtained from Evans Medical Ltd.
Candida antigen test
Candida albicans 1/10 w/v in 50% glycerin was obtained from Hollister Stier Laboratories. This was
further diluted 1:10 in sterile buffered saline to give an antigen concentration of 1/100. The 1/100
dilution is stable for 3 months when kept at 4°c(26).

CHAPTER 3 STUDY DESIGN, METHODS AND MATERIALS 3.43
Record keeping and statistical analysis
Record keeping
Each child in the study had a folder and a card, both of which were stored in numerical sequence
according to the number allocated to the child on entry. The folder was used to store the data
collection forms and laboratory test results. The card was used to record the milk issued to the child's
caretaker and to note any incidents of morbidity.
Data processing
At the conclusion of the principal study, the data of interest were extracted from the records and
entered into a Tektronix micro-computer. After checking twice against the manual record for clerical
accuracy, the data were transferred to a Sperry mainframe computer for the statistical analysis.
Sociological data of anecdotal interest were analyzed manually.
Data from the subsidiary studies were stored and processed on a personal computer.
Statistical analysis
Computer programs employed
For the principal study the BMDP suite of statistical programs were employed for analysisC138). The
programs included P2D, for basic data description, P4F for frequency tables and chi square analysis,
P6D for bivariate plots and linear regression, P7D for t tests with Bonferroni adjustment for multiple
comparisons when appropriate, Pl V for analysis of variance and PlR for multiple linear regression.
Some of the analyses for the smaller studies were made on a personal computer using Lotus 123 and
included descriptive statistics, chi square analysis and t tests, both paired and two-sample. In these
calculations P values were obtained from statistical tables. Since the values obtained are limits rather
than. exact quantities, these P values are reported as being greater or smaller than some number,
typically 5%.
Missing data
When a subject dropped out of the study or a test was not performed for a technical reason, the data
collection for that subject would be incomplete. If the data for a subject were missing for one variable
then that subject was omitted from all analyses involving that variable; other data from that subject was
included in other analyses.

3.44 IRON NUTRITION AND IMMUNITY
The numbers of subjects who did not complete the study and the reasons for their failure to do so are
reported in chapter 6.
Calculation of confidence intervals and type II errors
The programs that were used to calculate the confidence intervals and probability of type II errors are
listed in appendix 7. Chapter 6 contains an additional note on the application of confidence intervals
and their relation to statistical significance,
Significance levels
The convention is adopted that a P value of 5% is "significant". However, when results are discussed,
the actual P value is given in the text.
Two-sided tests are used throughout. There is a case to be made for using one-sided tests in certain
instances, but as the conversion is so simple ( division by 2 of the stated P value) and almost all the
literature uses two#sided tests this convention has been adopted.
Reporting of results
Results are reported as arithmetic means unless otherwise noted in the text. The number of significant
figures given is generally to 1 more decimal place than that used in the individual measurements. This
convention should not be taken to imply a greater degree of accuracy in the measurements than .that
afforded by the techniques employed.

CHAPTER 4 THE COMMUNITY OF BONTEHEUWEL
Introduction
This chapter describes the social setting of the principal study. In extrapolating the findings to other
groups of children it is necessary to be aware of potentially confounding factors which may invalidate
predictions and comparisons. Such factors include unambiguously measured variables such as age, sex,
place and time, as well as "soft" data that attempt to quantify concepts such as socio-economic class,
overcrowding and standard of home care. This chapter presents the "soft" data that provides the
background information necessary for the reader to place the main study in its social context and to
judge the validity of comparisons with other studies that he or she may wish to make. Where possible,
statements are supported by data collected according to the protocols described in chapter 3. In
contrast to the rest of this thesis however, it has sometimes been necessary to make subjective
statements based on personal impressions. The personal impressions are based on eighteen months
spent in the community, during which time each infant in the trial was examined on 15 to 20 twenty
occasions and several visits were paid to each child's home. By the end of the study the families and
the study teams knew each other fairly intimately.
I shall begin with some personal impressions and observations that may help the reader to attain an
understanding of the community of Bonteheuwel. These impressions try to convey some feeling for the
culture and living conditions of the group under study. They may, however, not be applicable to the
population of Bonteheuwel as a whole since the selection criteria would have tended to exclude the
poorer sections.
Personal impressions
Bonteheuwel is the site of a Cape Town City Council subsidized housing scheme. Most of the
dwellings are about 25 years old and consist of rows of semi-detached houses, usually with a single
floor, but some are double storied. The houses have 2 or 3 living rooms plus kitchen, bathroom and
inside toilet. The council leases the houses, but has little control over subletting by tenants. The
shortage of housing has encouraged some people to build shacks in the few hundred square meters of
garden behind their house. A typical "hokkie" is a single room with sand floor, no window, walls of old
packing cases and roof of corrugated iron. It may house a family of four, who often could afford better
quarters if they were available.
The population of Bonteheuwel was 47 060 according to the 1980 population census with a population
density of 141.78 persons per hectare·. The community is served by a civic center which has shops, post
office, general practitioners in private practice, a cinema and the inevitable liquor store. The nearby
• Technical Management Services Data Report No. 1 of 1984, City Engineer's Department, City of Cape Town.

4.2 IRON NUTRITION AND IMMUNITY
municipal clinic offers preventative services targeted at children and selected adult groups. The only
curative services are for tuberculosis and sexually transmitted diseases. The clinic is within walking
distance for all residents. Cars are scarce and most people use the buses, taxis or trains for transport
beyond their suburb.
The people with whom I cart1e in contact were friendly and helpful. Alcohol abuse is a long standing
problem, particularly amongst the men, and "recreational" drugs are now widely used. Marijuana and
Mandrax: were in fashion; opiates and cocaine did not seem to be readily available. Litter is
everywhere, so it was surprising to see how clean, neat and tidy it was inside homes even in the face of
gross overcrowding.
Several observations deserve a full social•anthropological study to probe their deeper significance.
Windows and curtains were rarely opened; is this to shut the uncontrollable world out? There is a
general deficiency in quantitive reasoning of any kind. Times, dates, frequencies, weights, volumes
often seem to have no meaning. Is this a manifestation of a similar culturally felt inability to control
destiny? Perhaps these questions are better answered by the poet and novelist.

CHAPTER 4 THE COMMUNI1Y OF BONTEHEUWEL 4.3
Survey results
Housing
Table 4.1 and figure 4.1 show that 95% of the families lived in council houses and 5% lived in lean-to
shacks built in the yards of the council houses.
Table 4.1 Type of housing used by study families. Numbers living in council built houses and owner or lessee constructed shacks or "hokkies".
TYPE
Council
Hokkie
TOTAL
No.
123
6
%
95%
5% ----------------------129 100%
----------------------
TYPE OF HOUSl~JG Figure 4. 1
110% ,-------------------------'-------.
100%
90%
80%
70%
60%
50%
40% J 30% J 20% I
I
123
10% 1 0% ~--------__.......,__.....,....._._...___._,__,_~'"'--------------'
Councii Hokkie

4.4 IRON NUTRITION AND IMMUNITY
Measures of crowding of accommodation
The type of housing available in Bonteheuwel is in itself an indication of the chronic shortage of
accommodation. Table 4.2 and figure 4.2 show the number of families considered by the project team
to have poor, adequate and good housing. More objective criteria are given in tables 4.3, 4.4, 4.5, 4.6
and figures 4.3, 4.4, 4.5, and 4.6. which show that as many as 75% of study families lived with others.
The survey counted those living in "hokkies" as living alone if they did not share the shack with others.
As the shack dwellers had to use the kitchen, bathroom and toilet facilities of the main house, a more
realistic estimation of the extent of overcrowdi,ng might be obtained by adding 5% to the percentage of
families sharing accommodation.
The houses are small; only 17% have 3 living rooms and 61 % have two rooms used for sleeping as
demonstrated in table 4.2 and figure 4.2. In many houses occupants had to sleep on mattresses in the
sitting room/ dining room and it was often necessary for the beds to be shared.
Tables and figures 4.5 and 4.6 show that the mean number of occupants was at least 7.6 persons per
house*. This underestimates the true number because the survey did not count the number of non
sibling children present in the house. At the time the survey was drawn up it was not realized that
there would often be more than one mother and her children living in the same abode. A second
difficulty in estimating the average occupancy of the houses arose from the large number of
"transients~. Most houses would have a significant number of people, often young men, who stayed
temporarily. The interviewee would often not consider these persons as living in the house and they
would therefore not be counted.
In retrospect, ambiguities in the questionnaires introduce an element of uncertainty in the data. For
example, the questionnaires should not have attempted an immediate reduction to concepts such as
"sibling" and "lodger", but instead should have taken a census of the persons who slept in the house
during the previous 24 hours. In any event, the data do show how crowded the houses were and thus
allow a qualitative estimate of the exposure of the study children to potential sources. of infection (ie
siblings and adults) in the same dwelling.
• 5.8 adults + 0.6 siblings + 1 study infant.

CHAPTER 4 THE COMMUNI1Y OF BONTEHEUWEL 4.5
Table 4.2 Living conditions of study families: Numbers of families with poor, barely adequate and good living conditions in terms of crowding in the home. The measure of crowding was made on subjective grounds by the study team after several home visits.
CONDITIONS No. %
Poor 73 47%
Adequate 31 11%
Good 14 42% ----------.
TOTAL 144 100%
===========
LIVI i'~G CONDITIONS Figure .i..2
so~ 68 I I !
45;: ~ 60
40% ~ I
35% l 30% 1
l
I 25% 1 20,: 1
i 15% -1
I 10% -l
I I I
5% -,
I O:!:
?oor Sorely Ada,:;uate Good

4.6 IRON NUTRITION AND IMMUNITY
Table 4 .. 3 Number of rooms used for sleeping by study families·.
ROOMS No .. %
1 29 21%
2 83 61%
3 23 17% -------------.--------
TOTAL 135 100%
============ Note • Rounding is the cause of the failure to add to 100%
ROOMS USED FOR s EPlNG Figure 4 . .3
i0%
I 83 I
I
::: 1 ,0% I
i
;;o,:; 1 I 29
20% ~ ~ I I
i ' ii!- ! ~~ .,. 1 I /// I 0:i~ I
0% I
One Two Three

CHAPTER 4 THE COMMUNITY OF BONTEHEUWEL 4.7
Table 4.4 Lodging arrangements of study families: Numbers lodging with family, or living in their own house (including rented or leased properties) or renting accommodation to tenants.
TYPE No. %
Family 72 56%
own 43 34%
Tenant 13 10% ----------------------
TOTAL 128 100%
----------------------
Lr)n,,'"''N,,...., I.,., '-' ''-' ! "-' ARR,~i'.JGE~1E~JTS
Figura 4.J.
607.
I 72
I I 50% 1 I
I
40,: I ' J.3 I I
JO% 1 I r
207. ~
I 13 I I
~ 10% -t
I I
0% Own Family Tenant

4.8 IRON NUTRITION AND IMMUNITY
. Table 4.S Number of adults in the houses of the study families .
ADULTS .No .. %
1 1 1% 2 9 7% 3 10 7% 4 23 17% 5 28 20% 6 20 15% 7 15 11% 8 8 6% 9 11 8%
10 8 6% 11 1 1% 12 2 1% 13 1 1%
-========== TOTAL 137 100% MEAN = 5.8
----------------------Note • Rounding is the cause of the failure to add to 100%
No. OF ADULTS IN THE HOUSE Figura 4-.5
2s,:;
24-%
22%
20• 1 28
18%
16%
''" j 12%
,~ ~ 8%
6%
4-% -l
2% ~ 1
0~ I
2 ,3 4- 5 13 7 8 9 10 11 12 13

CHAPTER 4 THE COMMUNITY OF BONTEHEUWEL
Table4.6 Number of siblings of the study infants .
Sil:>s No. %
0 69 51% 1 32 24% 2 18 13% 3 11 8% 4 2 1% 5 2 1%
=======-== 134 100% ===========
Note * Rounding is the cause of the failure to add to 100%
No. OF SIBLINGS F'igure 4.6
69
a 2 J
MEAN=l.8
2 (%///!
'
4.9
5

4.10 IRON NUTRITION AND IMMUNITY
Measures of care of study subjects
Table 4.7 shows that 65% of babies were cared for by mothers by day and by night and 11 % were
entirely in the care of others~ Most children were well cared for physically and emotionally. In an
attempt to quantify the subjective measure of care, the study team assigned a rating of 1 (poor), 2
(adequate) or 3 (good) to each study child for the standard of hygiene employed in the home. The
results are tabulated and graphically displayed in table 4.8 and figure 4.8 from which it can be seen that
87% of the families employed good standards of personal hygiene and 13% tended to neglect their
child's health.
As some families tended to under~ or over-utilize health care facilities, their care-seeking behaviour
was also rated on a scale of 1 to 3 for inadequate, adequate and over-protective care-seeking. These
estimates are given in table 4.9 and figure 4.9 which show that 4% of mothers tended to seek
professional advice later than appropriate and 3% of mothers were over-protective of their children.

CHAPTER 4 THE COMMUNITY OF BONTEHEUWEL
Table 4.7 Caretaker of the study children by day and by night.
DAY NIGHT
No. % No. % MOTHER 87 65% 119 89%
GRANDMOTHER 22 17% 7 5%
AUNT 8 6% 5 4%
OTHER 16 12% 2 2% ========== ==========
TOTAL 133 100% 133 100%
========== ==========
C.A_R ETi\K ER F'igura 4..7
100~ ......--------------------------
90% J 1.30% l 70~ -1
SO% ~ 50% ~
! '1.0% -i
i i
30~-!
I 20% -1
I 10% 1
I
'
119
:~
~ 16
MOTHC:R GRM,CMOT,..£R AIJNT OTHE?
L/ /1 by coy cs:::si oy ,,;ght
4.11

4.12 IRON NUTRITION AND IMMUNITY
Table 4.8 Standards of hygiene employed in the homes of study families estimated subjectively by the study team after several home visits.
STANDARD No. %
Poor 19 13%
Adequate 10 7%
Good 115 80% -----------
TOTAL 144 100%
============
HYGIENE 100%
Figure 4-.8
I 90> i
115 80%
70% l 50% 1 50%-;
I I
40% ! 30% -l
i
I 20% -j
I 19 I I
~ 10% -j I
0%
Poor 8creiy odequcle Good

CHAPTER 4 THE COMMUNI'IY OF BONTEHEUWEL 4.13
Table 4.9 Care-seeking behaviour of families subjectively ranked as poor, good or over-protective after 9 months of obsenation ••
RANK No. %
Poor 6 4%
Good 133 92%
Over-protective 5 3% --------------------
TOTAL 144 100%
========== Note • Rounding is the cause of the failure to add to 100%
CARE-SEEKl~JG BEHAVIOUR Figure 4.9
100% -----------------------------,,
! 1J3 1 ·
90% ~
,0% ~ 70% 4
I 60% ~
l
I 50% -i
40% j I
JO% I 20:: -1
1C% ~ 0% Jl_-,-__ ___:_£_..::.,....:::....:;:.J.__.....J.....;....~:...L...L--J.....£.-~--',..~--,-------:-~
I 6 @/ 5 / y / ,,
Poor Good Over-protec:tive
4.14 IRON NUfRITION AND IMMUNITY
Measures of family stability and unity
Tables 4.10 and 4.11 and figures 4.10 and 4.11 show that 52% of mothers were married to the father of
their child at the start of the study, but, by the end of the trial, a further 9% had remarried. Table 4.12
shows that at the start of the trial, 51% of the mothers were actually living with the father of their child.
The inference is easy to make that the ratio of unstable to stable families is uncomfortably high. The
figures do not portray the scope of the extended family that we came to know during the study.
However, tables 4.4 and 4.16 do hint at a wider role of the family in accommodation and fmance than
might be found in white middle class South African families.

CHAPTER 4 THE COMMUNITY OF BONTEHEUWEL
Table 4.10 Marital status of mothers on entry to the study·
status No. %
MARRIED 72 52%
SINGLE 58 42%
SEPARATED 3 2%
COHABITING 3 2%
DIVORCED 2 1% ----------------------
TOTAL 138 100%
----------------------Note • Rounding is the cause of the failure to add to HK)%
MARITAL STATUS OF MOTHER Figura 4-. 10 607. __________ __::__ ________ -,-------,
I 72
''"~/
•0% ~ 307. /, ~
58
,::I MARRIED SINGLE
,j 3
PZ4 //I f/4/ZI SEPARATED COHABITING
2 (////1
I
D~/ORCED
4.15

4.16 IRON NUTRITION AND IMMUNITY
Table 4.11 Changes in mothers' marital status during the study period.
Status No., %
NO CHANGE 125 91%
MARRIED 12 9%
DIVORCED 1 1% ===========
TOTAL 138 100%
===========
CHANGES I~~ MOTHERS' IVIARITAL STATUS Figure 4-. 11
100:t I i
1 ""'· 90% ~
~ I
80% ~ i
707. ~ I I
60% J 50%
I
4.0% ~ ::10% ~
l
::: j 12
I ~ 07. !
NO CHANGE MARRIED DIVORCED

CHAPTER 4 THE COMMUNITY OF BONTEHEUWEL 4.17
Table 4.12 Cohabitation • Numbers of mothers (married or sing)e) of study infants who were living with the fathers of their child or were living separately.
SC% I I
Cohabitation
COHABITING
SEPARATED
TOTAL
No.
70
67
%
51%
49% =========== 137 100%
----------------------
CO HA 8 Ii A Tl O I\J ,igure 4.12
70
""I ~ ~ --' ~
20%~ w ,// ~ I
1()%~,; %a ~ r:w ~:~ 0% _1 _____ ..,..... _____ ....._.._,,,........._..___._......._,...., -'-----,------
COHA8171NG SE?APATED

4.18 IRON NUTRITION AND IMMUNITY
Measures of economic status
At the start of the study, 3 months post partum, 70% of mothers were housewives. When the survey
was conducted, about 6 months post partum, 35% of mothers were in part-time or temporary
employment and 20% were in full-time jobs. Tables 4.14 and 4.15 show that 88% of fathers were
employed, but that only in only 58% of families did fathers provide the principal source of income.
Table 4.16 shows that only 69% of families had a regular source of earnings. In spite of this evidence
of restricted fmancial circumstances, 89% of households had a television set*. Many homes also had a
video recorder.
• It would be interesting to know how the television sets were funded, but unfortunately the interview was not structured to
obtain this information. For many families the television set was regarded as an absolute necessity, and a few hao the attitude
that it certainly 'Was not to be relinquished in favour of money to pay rent, water or even electricity accounts! ·

CHAPTER 4 THE COMMUNITY OF BONTEHEUWEL 4.19
Table 4.13 Mothers' occupation 3 months post partum.
Occupation No. %
HOUSEWIFE 72 52%
PART-TIME 47 34%
FULL-TIME 20 14% ~======= . =
TOTAL 139 100%
----------
MOTHERS 1 OCCUPATION Figure 4. 13
507. ..,.)-------------------------,
I
,o: ~ 72
4J% ~
I 30%
20%
10%
HOUSEWIFE PART TIM€ F'ULL TIME

4.20 IRON NUTRITION AND IMMUNITY
Table 4.14 · Fathers' occupation on entry to the study
Occupation No. %
TEACHER 1 1%
SKILLED 32 24%
SEMI.-SI<ILLED 32 24%
UNSKILLED 52 39%
UNEMPLOYED 16 12% ===========
TOTAL 133 100% -===========
FATHERS' OCCUPATION Figure 4. 14
I '
52
.30~
32 32
' 20% -;
I I I iS
,a~ 1 I I i I /~
!)%
TEACHER SKILLED SEMI-SKILLED IJNSKiLL.~D UNE~1PLOYED

CHAPTER 4 THE COMMUNITY OF BONTEHEUWEL 4.21
Table 4.15 " . Sources of income for the study families .
source No. %
FATHER 81 58%
MOTHER 34 24%
FAMILY 8 6%
COMBINATION 6 4%
OTHER 6 4%
STATE GRANT 4 3% ----------------------
TOTAL 139 100%
----------------------Note * Rounding is the cause of the failure to add to 100%
SOURCES OF INCOME Figure 4. 15
70% --------------------------
SO% 81
FATHER MOTH:'.? COMBINATION OTH£R STATE GR;.NT

4.22 IRON NUTRITION AND IMMUNITY
Table 4.16 Regularity of income for the study families estimated subjectively by the study team after 9 months observation. The criterion for assigning a subject to the category irregular was that money for food seemed to be a recurring problem.
Regulari.ty
REGULAR
IRREGULAR
TOTAL
No.
89
40
%
69%
31% ---------------------129 100%
===========
REGUL.ARITY OF li\JCOME. Figure 4.15
80% .,.------------------------------.
10• l 89
60% 1 so,: 1
I
::: l 20,: j
I 10% 1
I
REGUL'\R IRREGULAR

CHAPTER 4 THE COMMUNITY OF BONTEHEUWEL
Table 4.17 Presence of television sets in the homes of families of study infants.
Television
PRESENT
ABSENT
TOTAL
No.
118
14
%
89%
11% =========== 132 100%
===========
PRESEl'ICE OF TELEVISIOi\l Figure 4. i 7
100% ...... ------------------------------, I
90% ~-
eo:t ~ 70% J
I l
50% 1 507. ~ J.0% ~ 30% ~
118
:::j .~ WJ 0% ..... '--.------,.--...................... , .......... .....__._.._._,..., ....._ __ ___,_...,....,. ___ ....,......~
PRESENT ABSENT
4.23

4.24 IRON NUTRITION AND IMMUNITY
Measures of age and educational attainments of parents
Table 4.18 shows that the mean age of fathers of children in the study was 26 years while that of
mothers was 24 years. The-youngest mother was aged 16, and 27% were under the age of 21 years.
Table 4.18 Age of parents of study infants when the child was about 6 months of age.
MOTHER FATHER
AGE No. % ?,lo. %
15-20 yrs 37 27% 13 10% 21-25 yrs 42 31% 51 39% 26-30 yrs 36 26% 41 31% 31-35 yrs 16. 12% 18 14% 36-40 yrs ·4 3% 7 5% 41-45 yrs 1 1% 1 1%
========== ----------. TOTAL 136 100% 131 100%
========== -· ------------------MEAN AGE = 24. MEAN AGE = 26.
AGE OF PARENTS Figure 4-. 18
21-25 26-,30 31-JS 41-?5.
k2 Motr.ers cs:sJ F" others

CHAPTER 4 THE COMMUNITY OF BONTEHEUWEL 4.25
Table 4.19 shows that only one parent had had tertiary education and that 3% of the mothers and 8% of the fathers had had no formal schooling at all. The average educational attainment was standard 5
for both men and women.
Table 4.19 Education of parents measured in years of formal schooling; from 1 to 6 is junior school, from 7 to 10 is high school and 13 is tertiary education·.
Years MOTHER FATHER Education No. % No. %
0 5 3% 9 8% 1-2 12 8% 9 8% 3-4 31 22% 18 15% 5-6 54 38% 42 36% 7-8 36 25% 31 26%
9-10 5 3% 8 7% 13 0 0% 1 1%
========== ========== TOTAL 143 100% 118 100%
---------- -------------------- ----------MEAN = 5.1 MEAN = 5.3
Note • Rounding is the cause of the failure to add to 100%
EDUC/lT!Oi\l OF PARENTS F"igure 4-. 19
0 1-2 5-6 7-a 9-iO 13
IZZ] Mothers IS:SJ Fathers


Now have I toold you shortly in a clause
The staat, th 'array, the nombre and eek the cause
Why that assembled was this compaignye
Also I prey you to foryeve it me
Al have I nat set folk in hir degree,
Heere in this tale, as that they sholde stonde.
My wit is short, ye may wel understonde.
The Canterbury Tales
Geoffrey Chaucer
Circa AD 1386


'


CHAPTERS RESULTS: INFANT FEEDING HABITS
Introduction Infant feeding practices were of interest in the present research for two reasons. Firstly, as the main
project was concerned with a trial of a milk formula with increased iron concentration, it would have
been useful to have documented the actual quantities of formula ( and other foods) ingested. If the diet
had been determined it would have been possible to estimate the total intake of iron and its availability.
A second source of interest in feeding practices arose from ethical concerns about a possible conflict
between the community's perception of the value of breast feeding and the influence of the trial of the
infant milk formula. As was explained in chapter 2, mothers who were breast feeding were included in
the trial and were encouraged to continue nursing their infants for as long as they wished. These
mothers were also provided with milk formula, if they asked for it, in order to encourage their
continued participation and continued breast feeding. The intention was that no mother should feel
pressured to remove her child from the breast.
Studies made
Introduction Studies were made of the age at which children in the trial and children in the community were weaned
from the breast; of the prevalence of breast feeding in the community before, during and after the trial;
and of the reasons· for stopping breast feeding in trial children as well as in children from the
community. In addition, a survey was made of the age at which various solid foods were introduced to
infants in the trial.
In the planning stages of the project it was imagined that, if each child was to be examined every 3
weeks, it would be possible to gather an accurate history of the changes in the child's diet throughout
the study. Two unforeseen factors rendered this plan unworkable. In the first place, if the child was
well, he or she was often brought to the examination by a relative or friend of the mother who would
not know what feeds the child was taking. With many mothers working, it was often the case that
different people cared for the child during the day and during the night.
A second and greater problem was cultural in nature. There was a widespread inability of people in
the community to think quantitatively. Even intelligent, caring and cooperative mothers found it
impossible to recall with accuracy how much milk the child had taken in the previous 24 hours.
However, part of the problem in communicating may also, it seems with hindsight, have been due to a
fear on the mother's part that she was being monitored in her use of the milk and that the supply of
milk might be reduced if she was not "performing". Obtaining full dietary data would have entailed

5.2 IRON NUTRITION AND IMMUNI'IY
several additional time-consuming visits by the study team to each child's home. As these resources
were unavailable this part of the project was reluctantly abandoned.
Ascertainment and Survey Construction Data for the children in the main trial was gathered throughout the study. At every contact, the
parents or caretakers were asked the appropriate questions about feeding.
Data for children in the community was acquired during three surveys conducted in the Bonteheuwel
Health Clinic during April 1983, September/October 1983 and September/October 1984. The first
survey was carried out shortly before the main study commenced, the second survey was made
immediately after the last infant had been emolled in the trial, and the third was performed shortly
after the trial had concluded.
The Bonteheuwel Health Clinic provides immunization and other primary health care services. Most
of the children attending the clinic are well, but some are brought for the treatment of minor ailments.
Infants are weighed before being seen by the clinic staff, and mothers in this queue, with children of 12
months of age or younger, were asked the age, sex. weight, age of first bottle feed, age of last breast
feed and, if appropriate, the reason for weaning the child from the breast.
Similar information was gathered in an ongoing fashion from mothers of children in the main study. In
addition, they were also asked the age at which they introduced cereal, egg, fruit, vegetables and fish
and meat to the child's regular diet.
Acknowledgements The questionnaires were administered by Mrs D Phillips.
Methodological Cautionary Note. Some methodological problems inherent in the study need to be borne in mind in evaluating these
results.
The body of data from the trial infants constitutes a longitudinal study from a well defined,
homogeneous group whereas the surveys at the clinic are cross-sectional studies from an
inhomogeneous and poorly defined group. Data from the two sets are not directly comparable. Even
within the community group comparisons of one time period with another may be misleading because
of the unselective nature of the surveys.

CHAPTERS RESULTS: INFANT FEEDING HABITS 5.3
A further problem is that with the intention of improving the precision in collecting the data a small
change was made to the form used for the third survey·. In retrospect it is now clear that this imposes
an unknown change on the data which reduces the validity of comparisons made with the 2 surveys in
1983.
A third methodologic weakness in the study is the lack of a control group. If the surveys had also been
conducted in a similar clinic in a community not subjected to the influences of the trial this would have
provided a yardstick against which to evaluate the effects of the trial against the effects of changing
customs. Lack of resources prohibited control surveys from being made.
The age of the children was recorded as months attained. The surveys would have been more precise
and accurate had the ages been recorded in decimals of a year.
The prime reasons for mothers bringing their children to the clinic are for routine postnatal follow up
and for immunization. The common age brackets of infants attending the clinic are thus less than 2
months and between 3 and 6 months. Age groups that are uncommon at the clinic are 2 months and
between 7 and 12 months.
Results:
The results of the surveys are shown in tables 5.1, 5.2 and 5.3 and in figures 5.1, 5.2. and 5.3. The data
for children over the age of 6 months is not shown because the numbers are small and the results may
be confusing.
Age of weaning off breast
Table 5.1 shows the age (in months) at which children were first offered a bottle of milk. The results
for the study children are similar to those for the ~fants from the community. About 15% of babies
were first offered milk in the first month of life. A third of infants begin drinking milk in each of the
second and third months of life and by the end of the fourth month only 5% were exclusively breast
fed.
Because of the early introduction of milk feeds, the cross-sectional studies provide a relatively unbiased
view and comparison with the trial children is valid. Weaning from the breast is often completed much
later. A cross-sectional study with children at different ages will have many in various stages of the
weaning process and it is thus not possible to compare the ages at which children are last given the
breast.
• The forms are included in appendix 6

5.4 IRON NUTRITIONAND IMMUNITY
Table 5.1 Age at which infants are first offered milk formula. Comparison between the infants in the trial and infants from the community of Bonteheuwel surveyed April 1983, September/October 1983 and September/October 1984.
Notes.
AGE TRIAL MAR 1 83 SEPT 1 83 OCT 1 84 (months)
0 26 17% 37 15% 18 16% 27 18% 1 49 33% 56 23% 7 6% 38 26% 2 51 34% 55 23% 21 19% 26 17% 3 22 15% 58 24% 57 51% 44 30% 4 1 1% 12 5% 7 6% 7 5% 5 0 0% 15 6% 0 0% 5 3% 6 0 0% 6 3% 1 1% 2 1%
TOTAL 149 239 111 149
MEAN AGE 1. 5 2.1 2.3 2.0
The survey methods differ for the infants from the Trial and the Community. The results are riot strictly
comparable. Details are given in the text.
Rounding causes some of the columns of percentages not to total 100%.
AGE OF FIRST WEANING Sonteh euwe! Heolth Clinic Survey
so,;
407.
20%
1oz
0 2 5 6 >c
IZ2J Triol cs::::sJ Mor 8.3 ACE: (month!l) ~ Sept 8.3 ~ Oct 84

CHAPTERS RESULTS: INFANT FEEDING HABITS s.s
Prevalence of breast feeding in Bonteheuwel
Table 5.2 shows, for children in their first year of life, the prevalences of breast feeding, formula
feeding and combined formula and breast feeding. The data are from surveys made in April 1983,
September /October 1983 and September /October 1984.
Figure 5.2 shows a linear trend for the prevalence of breast feeding to fall from around 80% in the first
month of life to about 10% by 4 months of age.
The figure shows a tendency for the prevalence of breast feeding to fall with time. As explained in the
methods section, interpretation of this is hampered by lack of a control group for comparison and the
slightly different data collection procedure adopted for the last survey. The difference between the
April 1983 and September/October 1984 surveys (ie before and after the trial) is not statistically
significant·.
In view of the ethically sensitive nature of trials involving infant feeding formulas, studies similar to the
main project should in future include well controlled and standardized surveys of breast feeding
practices.
• Regression analysis of prevalence of breast feeding (y) on age for the first 5 months (x) yielded:
For the April 1983 group y = -16.14x + 83.0
For the Sept/Oct 1984 group y = -14.57x + 73.76
The F values for the slopes and intercepts are 0.3 and 1.35 respectively. The P values for significance tests of parallel slopes
and equal intercepts are greater than 0.05.

5.6 IRON NUTRITION AND IMMUNITY
Table 5.2 Prevalence of breast, formula and combined breast and formula feeding in Bonteheuwel in April 1983, September/October 1983 and September/October 1984 •
AGE Formula Breast . Breast TOTALS (months) ' Formula
APRIL 198~ 0 l 1% 4 5% 72 94% 77 1 2 13% 4 25% 10 63% 16 2 1 20% 2 40% 2 40% 5 3 33 35% 29 31% 32 34% 94 4 33 37% 34 38% 22 25% 89 5 35 83% 5 12% 2 5% 42 6 35 47% 33 44% 7 9% 75
SEPTEMBER 12S3 0 3 8% 2 6% 31 86% 36 l 3 .33% 0 0% 6 67% 9 2 0 0% 0 0% 4 100% 4 3 18 44% 7 17% 16 39% 41 4 17 63% 4 15% 6 22% 27 5 16 100% 0 0% 0 0% 16 6 15 68% 3 14% 4 18% 22
OCTOBER 1984 0 2 9% .4 18% 16 73% 22 l 8 36% 2 9% 12 55% 22 2 10 50% 3 15% 7 35% 20 3. 18 60% 4 13% 8 27% 30 4 30 88% 2 6% 2 6% 34 5 15 65% 3 13% 5 22% 23 6 20 83% 2 8% 2 8% 24

CHAPTERS RESULTS: INFANT FEEDING HABITS
90%
80%
70%
60~
50%
40%
30%
20%
10%
Figure 5.2
PREVALENCE OF BREAST FEEDING Bonteheuwe! Heolth Clinic Survey
0 2 3 4 5
lZZJ Apr 83 AGE (months)
ISSJ Sept 83 ~ Oct 84
Prevalence of exclusive breast feeding in the first year of life.
Reasons for cessation of breast feeding
5.7
6
Table 5.3 and figure 5.3 summarize the replies of mothers to the question 'Why did you stop breast
feeding? No striking difference is apparent between the Trial group and the three Community surveys.
The most common answers were the demands of employment and that the child was not getting
enough milk from the breast.

5.8 IRON NUTRITION AND IMMUNITY
Table 5.3 Reasons for stopping breast feeding given by mothers of the infants In the main trial and mothers In the community of Bonteheuwel.
REASONS FOR WEANING
REASON TRIAL MAR 1 83 SEPT 1 83 OCT 1 84
Working 35 23% 96 40% 49 45% 57 36% Social 20 13% 6 2% 3 3% 5 3%
No milk 80 54% 87 36% 45 42% 58 37% Breast disease 3 2% 15 6% 3 3% 11 7%
Baby refused 5 3% 30 12% 3 3% 13 8% Other 6 4% 9 4% 5 5% 14 9%
TOTALS 149 243 108 158 = = = -Note Rounding causes some of the columns of percentages not to total 100%.
REASONS FOR WEANING
Working Socicil No milk Brecst disease 8ciby refused Other
[SSJ Mer 83 REASON
f2.'2Za Sept 63 ~ Oct 84
Figure 5.3 Reasons for stopping breast feeding offered by mothers in the main study and by mothers in the community of Bonteheuwel

CHAPTERS RESULTS: INFANT FEEDING HABITS S.9
Conclusions
The results of the feeding surveys suggest that the prevalence of breast feeding in Bonteheuwel may
have declined during the period of the main study although this was not statistically significant. It is not
possible to attribute the change in feeding practices to the influence of the trial itself for various
reasons that are detailed above.
Having noted these problems in interpretation, it should also be noted that .the present study has gone
further than similar previous studies which have not reported their influence on breast feeding(314• 1•
323•
298>. Previous investigators, one may speculate, have operated in times when there was less
awareness of the need to protect mothers, particularly in underdeveloped areas, from excessive
promotion of infant formulas to the detriment of the health of their children.
Future trials of infant milk formulas should include well controlled surveys of breast feeding practices
so that more substantive conclusions can be drawn about their effects on infant feeding practices.


CHAPTER 6 RESULTS: IRON FORTIFICATION
Introduction
The results from the principal study are reported and discussed in this chapter. Appendix 3 contains a
more detailed tabulation of the statistical analyses that were made. Results of interest are extracted from
the schedules in the appendix and presented in more easily read tables and graphs.
The analysis is presented in three main sections. In the first, the validity of the Control group is
established. In the second, the Test group is compared with the Control group in order to define the effects
of the increased iron fortification in the milk formula offered to the Test group. In the third section of the
analysis, an association is sought between iron status and immune function. Finally, evidence from the trial
for the safety of iron fortification is reviewed.
Statistical methods
Introduction
The statistical methods employed are described in chapter 3. This section explains the graphical
representations used and some applications of the statistics.
Graphical representation of numerical results
The figures in this chapter use the same graphical conventions to compare results for the Test and Control
groups, show the difference between the 2 groups, the confidence limits of the means and statistical
significance from a t test. The mean value of a variable is represented by a bar and the 95% confidence
interval is depicted by a vertical line. The difference between the two groups is shown by the difference in
height between the bars. The difference is also shown graphically by a separate bar with a line representing
the 95% confidence interval through it. If this confidence interval line does !!.Q.t. cross the x-axis the
difference between the two groups is significant at the 5% level. These concepts are illustrated in figure 6.2
which shows a significant difference and in figure 6.22 which shows a non-significant difference.
Comparison of changes
The results of the intervention employed in the trial are often expressed in terms of the values of variables
measured at the end of the trial. In many instances however, the effect of the intervention is most
rigorously measured by the change in that variable over the course of the study. This takes account of small
differences that exist at the start of the trial. For example, the· difference in haemoglobin concentrations
between the two groups was 0.35 g/ dl at the end of the trial. But the difference in the change in
haemoglobins was 0.49 g/dl. The figures have all employed absolute values as these result in clear graphs

6.2 IRON NUTRITION AND IMMUNITY
and the conclusions drawn from them are consistent with those drawn from a comparison of chan,ges. For . . . .
precision, the tables and text, where appropriate, give the change. increase or decrease as well as the
absolute magnitude of results. The paired t test was used to compute P values when changes were
compared.
Validity of the Control group
(Comparison of Test and Control groups at 3 months)
Rationale
A key factor in determining the strength of inferences drawn from a controlled trial is the comparability of
the control group with the test group. At the start of the trial the two groups should be identical with
respect to all the variables to be compared. The care taken in the present study to construct control and
test groups without bias was described in chapter 3. An important question remains to be answered: Were
the Control and Test groups actually comparable?
Methodology
This question is answered by comparing the results of the various tests and measurements made at the age
of 3 months. If the selection procedures worked as intended there should be no difference between the test
results for the two groups. For this reason, the tables of results in the following sections show the results of
tests made at 3 months of age although the discussion is focused on the differences found at 12 months.
The statistical tests show that the groups may be· assumed to be equivalent at the start of the trial. And,
apart from the evaluation below of the results for two classes of variable of particular interest, no further
comment is made on the validity of the control group.
Statistical tests for equivalence
Before commenting on the results, a few remarks need to be made on statistical procedures used but not
mentioned in the chapter on methods and materials. The appropriate statistical test is a test for equivalence
rather than the usual test for a difference. The test for a difference often results in "P value" of statistical
significance. If the P value is not significant, it does not follow that the two groups are necessarily
equivalent<411). The reason for this is that a real difference might be missed by an inappropriate test.
An additional complication in the search for evidence for equivalence is that when many variables are
compared, it is to be expected that about 5% will appear to be significantly different purely by chance<70>. Interpretation of the statistical tests therefore involves consideration of factors other than the absolute level
of the P value.

CHAPTER 6 RESULTS: IRON FORTIFICATION 6.3
The approach to equivalence testing taken in this section is to see if the 95% confidence interval of the
difference between the variable under consideration in the Control and Test groups contains a clinically or
physiologically important disparity. The determination of what differences are important is necessarily
arbitrary and subjective to a certain degree. But this should not be seen as a move from the "objective"
concept of statistical significance to the subjective concept of importance, but as a step towards the
quantification of what was actually determined by the study(l70).
Iron status
As iron status was the variable to be manipulated in the study (ie the independent or input variable) it is
important to confirm the equivalence of the Control and Test groups at the start of the experiment. Table
6.1 lists the major indices of iron status for the Control and Test groups . (Appendix 3 contains a full
tabulation of all statistical analyses.)
Table 6.1 Iron status at 3 months of age compared in the Control and Test groups in order to establish equivalence of the two groups.
Index of Control Test p 95% CI of diff. Smallest Iron Status Mean Mean Value of means Important
Diff.
Haemoglobin 11. 28 11. 38 51% -0.19 0.37 +o.s (g/dl)
Haematocrit 32.89 33.27 34% -0.41 1,17 +l.O ( % )
Mean cell volume 82.06 82.10 97% -1.80 1. 87 +1.0 (ul)
Red cell ZPP 2.92 2.82 63% -a.so 0.30 +1. (ug/g Hb)
ferritin 1 117 120 91% +10 (ug/1)
Notes P values were calculated from student's t test. 95% CI= 95% confidence intervals.
l The geometric means are shown for ferritin. 95% confidence limits were calculated for log(ferritin) and are shown in appendix 3.
It may be seen from the table that no variable differs significantly between the Control and Test groups; the
lowest P value is 34%. The 95% confidence interval includes zero difference for all the measures of iron
status. The smallest clinical or physiologically important difference is greater than the measured difference
for all the variables and is inside (by a narrow margin) the 95% confidence interval only for haematocrit
and mean cell volume.

6.4 IRON NUTRITION AND IMMUNITY
All the measures of iron status shown in table 6.1 show a slight tendency in favour of the Test group. This
trend is far from reaching statistical significance and the differences are all minor. For the purposes of the
present research it can thus be concluded that the Control and Test groups had comparable iron status at
the start of the trial.
Future studies of a similar nature should consider stratification of the subjects according to their iron status
in order to ensure deterministically rather than stochastically that the two groups have equivalent iron
nutrition-.
Participation rate and gender Table 6.2 compares the Test and Control groups with respect to completion rate and gender. The table
shows that the two groups are equivalent as far as the later two variables are concerned. The proportion of
subjects who completed the trial differs between the Test and Control groups and a chi square test of
significance yields a P value of 7%.
This poses a question about the equivalence of the two groups: If the dropout rates are different between the
Test and Contro/groups are the groups still equivalent with respect to other variables?
One may speculate that the families who dropped out were indeed different in many other respects from
the families who remained in the study. The consequence of this would be to reduce inhom?geneities in
the remainder and thus the differences between the two· groups would be diminished. (With respect to
completion rate the differences disappear entirely.) With such small numbers and incomplete data it is not
possible to test this hypothesis. Although it seems unlikely that the disparity in completion rates is
important, the possibility of some bias should be borne in mind when interpreting the effects of the
experiment.
\

CHAPTER 6 RESULTS: IRON FORTIFICATION 6.5
Table 6.2 Participation and Gender compared between the Control and Test groups.
Control Test p
Participation Number at start 74 75
at completion 62 70 7%
Sex Male 38 39
Female 36 36 94%
Notes P values are calculated from the chi square test.
Specimen collection rates
The failure to collect specimens was an unimportant problem, except for the initial full blood counts which
were obtained from 122 of 149 subjects. Initial indices were missing in18 of 74 infants in the Control group
and 9 of 75 in the Test group. Chi square analysis of this distribution yields a value of 3.81 which is very
close to the value (3.84) for statistical significance at the 5% level. This raises the question whether there
may have been some bias in assembling the 2 groups.
This fear is dispelled by similar analyses of the distribution of missing specimens for other parameters. For
example, a total of 9 specimens were not obtained for plasma ferritin and 15 for red cell zinc
protoporphyrin at 3 months and chi square analysis yielded values of 0.45 and 0.08 which are very far from
the value (3.84) denoting statistical significance at the 5% level.
The uneven distribution of full blood counts at 3 months also raises the question of a possible bias in
comparisons involving these parameters. Comparisons of changes over the trial period in haemoglobin,
mean cell volume and red cell distribution width were made using paired samples from the same child at
both 3 and 12 months. These gave essentially equivalent results as when group means were compared. The
data are given in table 6.6 and 6.7.
It may therefore be concluded that the uneven distribution in missing specimens neither indicates a bias in
assembling the groups, nor affects interpretation of the results of the study.
A number of factors accounted for the missing specimens. Since the infants were to receive 2 painful
injections for the delayed cutaneous hypersensitivity tests, it was decided on ethical grounds not to attempt
venesection more than twice. There were 9 complete failures to obtain blood specimens at the start of the

6.6 IRON NUTRITION AND IMMUNITY
trial and 5 at the end. The first portion of blood was decanted into heparinized tubes for the plasma
measurements and immune function tests. The latet portion of blood was placed into EDT A tubes for the
full blopd count. In retrospect it seems that it may have been wiser to have collected the full blood counts
first since they were more easily invalidated by minor degrees of platelet clumping and clotting than the
other tests.
Temporal comparisons
Differences were sought, but were not found, for temporal disparity between the Control and Test groups.
The variables that were available for examination were the ages of the children and the dates of entry to
and exit from the study. The two groups did not differ significantly with respect to any of the 4 measures
and the only trend that might have biased the study was the slightly longer participation period for the Test
group viz 8.96 months compared with 8.85 months for the Control group. This would have tended to
increase the number of infections observed in the Test group·.
Table 6.3 Temporal variations compared between the Test and Control groups, Dates of birth, entry to the study and. exit from the trial are compared for the two groups as well as the ages of the subjects on entry and exit.
Variable Control Test p 95% CI of diff. Power
Mean Mean
OATES (decimals of a year) Date of birth 83.30' 83.32
Date of entry 83.54 83.56
Date of exit 84.27 84.30
AGES (months) Age on entry ,2. 96 2. 9-0
Age at exit 11. 81 11.86
Notes P values were calculated from student's t test. 95% CI= 95% confidence intervals.
Value of means Obs 10%
29% -0.02 0.06 19 100
33% -0.02 0.05 17 100
14% -0.01 0.07 31 100
14% -0.15 0.02 31 99
41% -0.06 0.15 13 100
The statistical power of the study was detennined for both the observed difference (Obs) and a 10% difference (Wt) from the combined mean for a type I error probability of 5%. Oates are given as the decade plus decimal of a year. for example, 83.30 is 20 April 1983.
• Calculation of the rate of infection adjusts for differences in periods of observation.

CHAPTER 6 RESULTS: IRON FORTIFICATION 6.7
Age related changes
(Comparison of results at 3 and 12 months)
Between the age of 3 and 12 months, major developmental changes are taking place and the reader will
observe differences in many variables comparing the two age groups. It was not the purpose of this study to
investigate such changes, and no further remarks will be made on this subject.
Study children · Feeding practices
Before considering the effects of the increased iron fortification it is of interest to examine the feeding
practices of the study mothers.
Breast feeding
Results
Table 6.4 compares the extent of breast feeding in the two groups. Mothers in the Control group began
bottle feeding their infants at an average age of 1.53 months. This was not significantly different from the
mean age of 1.49 months for the Test group. Mothers in the Control and Test groups completed the
weaning process when their infants were 3.60 and 4.04 months of age respectively. The difference. is far
from statistical significance with the 95% confidence interval ranging from -0.94 to 1.83 months.
Table 6.4 Breast feeding compared between the Control and Test groups. The extent of breast feeding is measured by two estimates: the mean age at which milk formula was first given and the mean age at which the breast was last offered to the infant.
Variable Cont:rol Test:.
Mean Mean
Age weaned( in months) First given formula 1.53 1.49
Last given breast 3.60 4.04
p
Value
83%
52%
95% CI of diff. Power
of means Obs 10%
-0.36
-0.94
0.29
1. 83
0% 16%
0% · 0%
Notes p values were calculated from student's t test. 95% CI 2 95% confidence interval. lhe statistical power of the study was detennined for both the observed difference (Obs} and a 10% · difference (10%} from the combined.mean for a type I error probability of 5%.

6.8 IRON NUTRITION AND IMMUNITY
Solid foods
Introduction At every encounter with each child in the main study (ie at approximately tl;iree week intervals) the mother
or caretaker was asked at what age cereal, egg. fruits, vegetables and fish/meat were added to the child's
regular diet.
Results
The results are shown in table 6.5. The first solid foods to be given are cereals and vegetables which are
introduced from the first to third month. Eggs and fruit are added about a month later and fish and meat
are included slightly later still. There is no significant difference between the 2 groups. Interesting trends
ar~ the earlier ages at which the Test group were offered egg. meat and fish in comparison with the Control
group. The smallest P value, 6.4%, was for meat and fish.
Table 6.5 Age of introduction to solid foods for the Control and Test groups.
Food Cont.rol Test. p 95% CI of dift. Power
.Mean .Mean Value o:f means Obs 10% Age Age
Meat/Fish 5.19 4.36 6.4% -1.04 0.02 46% 44%
Cereal 2.06 1 .. 93 >10% -0.21 0.31 0% 35%
Egg 4.24 3.49 >10% -0.95 0.15 29% 30%
Fruit 4.16 4.16 100% -0.48 Q.48 0% 40%
vegetable 3.40 2.96 >10% -0.60 0.20 17% 36%
Notes P values were calculated from student's t test. 95% CI" 95% confidence interval. The statistical power of the study was determined for both the observed difference (Obs} and a 10% difference (10%} from the combined iooan for· a type I error probability of 5%.
Discussion
The survey of breast feeding practices and of the ages at which solid foods were introduced, showed trends
that would have favoured the Test group, as far as iron nutrition is concerned since meat and fish not only
contain readily available haem iron, but also promote the absorption of non-haem iron(l04, 237). The trends
were not statistically significant.

CHAPTER 6 RESULTS: IRON FORTIFICATION 6.9
The date at which a certain feeding practice is initiated, eg bottle feeding, provides a crude measure of
nutrient intake. A complete dietary survey at various points in the trial would have provided answers to
questions about quantity and frequency that the present surveys could not. Cook and Reusse/104)
recommend that the development of a strategy for iron fortification include determination of iron intake
from dietary surveys as the step following ascertainment of the prevalence of iron deficiency. The present
project did not have the resources to attempt such a large project, but, as the present study demonstrates,
lack of dietary information can hinder interpretation. None of the trials on which the present study was
modeled have reported detailed dietary studies'7• 71• 77, 221• 285,294).
A weakness in the methodology is that the ages at which events occurred were recorded as months attained.
The precision and accuracy of the data would have been improved if decimals of a year had been
employed(447).
A weakness in the gathering of the data is that the information was obtained from the caretaker of the
infants. If the mother was working, the information provided by the day-time caretaker may not have been
as accurate as could have been provided by the mother.
Conclusions and recommendations The trends shown in the feeding practices may indicate a confounding factor, both in terms of iron nutrition
and in terms of immune function. This possible bias in favour of the Test group should be borne in mind in
interpreting the results of the trial.
It would be useful if future trials of iron fortification of infant foods include dietary surveys of ingestion of
the food vehicle and inhibitors and facilitators of iron absorption<125). The aim should be to determine
both the composition of the diet and the temporal relationship of ingestion of facilitators and/ or inhibitors
of iron absorption to ingestion of the food vehicle.

6.10 IRON NUTRITION AND IMMUNITY
The effect of increased iron fortification of milk formula on iron status
(Comparison of Test and Control groups at 12 months)
Introduction
The first question to be asked of the trial is whether the increased iron fortification had the desired effect
on the iron status of the groups. It was shown above that the Control and Test groups had essentially the
same iron status at the start of the trial. Tables 6.7 and 6.8 show that at the end of the trial the Test group
had statistically significantly better iron nutrition than the Control group as indicated by mean levels of
haemoglobin (11.85 cf 11.49 g/dl, P = 4% ), red cell distribution width (14.44% cf 15.53%, P = 0.05% ), red
cell zinc protoporphyrin (3.41 cf 3.95 ug/g Hb, P = 4%) and plasma ferritin (29.0 cf 17.3 ug/1, P. = 0.04% ).
This pattern was expected but the magnitude of the changes were smaller than expected. To evaluate the
results the following 3 sections compare the present study with (a) reference standards, (b)
epidemiological surveys of populations, and (c) similar trials of iron fortification. The achievements of the
trial are then ass_essed in terms of its aims,

CHAPTER 6 RESULTS: IRON FORTIFICATION 6 • .11
Table 6.6 Haematological indicators of iron status at the start of the trial.
Indicator of
Iron Sta 'tus
Control
Hean
Test;
Hean
P 95i CI of diff. Power
AT 3 MONTHS OF AGE Red cell count
{ 1012/ 1)
Haemoglobin {g/dl)
Haematocrit ( % )
Mean cell volume (fl)
Mean cell Hb (pg)
4.01 4.06
11.28 11.38
32.89 33.27
82.06 82.10
28.12 28.11
Mean cell Hb cone. 34.28 34.21 (ug/dl)
RBC width distr. ( % )
Reticulocytes ( % )
13.35 13.69
2.01 2.28
Notes· P values were calculated from student's t test. 95% CI• 95% confidence interval.
Value of means Obs lOi
42%
51%
34%
97%
98%
69%
19%
22%
-0.07
-0.19
0.38
-1.80
-0.71
-0.43
-0.17
-0.16
0.17
0.37
1.17
1.87
0.69
0.28
0.84
0.70
13 99
0 99
16 99
0 99
0 99
0 100
'26 99
23 17
The statistical power of the study was detennined for both the observed difference (Obs) and a 10% · difference (10%) from the contiined mean for a type I error probability of 5% •
. ·--·---------

·---- --·---·-··-· ·---····-------- ------------
6.14 IRON NUTRITION AND IMMUNITY
Table 6.8 Non-haematological indicators of iron status compared for the Control and Test groups at the start and end of the trial.
Indicat:or of
Iron St.at.us
AT 3 MONTHS OF AGE Red cell ZPP
Cont:rol . Test;
(ug/g Hb)
Ferritin (ug/1)
Log ( f erri tin) 1
(log(ug/1))
AT 1 YEAR OF AGE Red Cell ZPP
Change in ZPP (ug/g Hb)
.Mean Mean
2.92 2.82
155.61'157.20
2.07 2.08
3.95 3.41
1.18 0.51
Ferritin 23.80 37.70
Change Ferritin -137.93-111.42 ·. (ug/1)
Log ( ferri tin) 2
Chng Log(ferritin) (log(ug/1))
1. 24
-0.86
1. 46
-0.59
Notes P values were calculated from student's t test. 95% CI= 95% confidence intervals.
P 95-t CI of di££. Power
Value or .means Obs 10%
63%
94%
91%
4%
2%
1%
24%
0.04%
0.10%
-0.50 0.30 0 29
-38.34 41.53 o 12
-0.11 0.12 o 93
-1.04 -0.04 56 30
-1.23 -0.10· 63 0
3,95 23.84
-17.70 70.71
0.10
0.11
0.35
0.44
78
22
95
91
0
0
58
14
Changes are reported as the mean of the variable at 12 nx:inths minus the mean value at 3 months. The statistical power of the study was detennined for both the observed d.ifference (Obs) and a 10% difference (10%) from the combined mean for a type I error probability of 5%.
1 Geometric mean ferritin levels for Control and Test groups are 117 and 120 ug/1 respectively 2 Geometric mean ferritin levels for Control and Test groups are 17.3 and 29.0 ug/1 respectively

CHAPTER 6 RESULTS: IRON FORTIFICATION 6.15
ZINC P R O T O P O R P H Y R I N
5
4
3 u
9 I 2 9
H b .
0
-I
-2
CONTROL TEST DIFFERENCE
Figure 6.3 Mean zinc protoporphyrin levels for the Test and Control groups at U months of age·
Figure 6.4
0
g
1.5
u 9 / 0.5 I
L o g ( F E R R I T I N )
CONTROL TEST DIFFERENCE
Log(ferritin) for the Test and Control groups at 12 months of age·
• The bars represent the means and the vertical lines through the bars represent the 95% confidence intervals

6.16 IRON NUTRITION AND IMMUNITY
Comparison with reference levels for haematological indicators of iron status The haemoglobin levels achieved by the Control and Test groups compare favourably with "normal" levels
established by early workers, eg Guest and Brown(lSl) (Source 1 in table 6.9) and Smith(423) (Source 2), but
are slightly lower than that in the later textbook by Dacie and Lewis(llO) (Source 3).
More recently, efforts have been made to defme reference levels for haematological parameters by
excluding subjects with evidence of iron deficiency. Employing this principle, Saarinen and SiimesC396)
(Source 4) proposed ideal iron nutritional objectives for haematological variables. With the exception of
the red cell count, all parameters are substantially higher than those found in the trial groups. The ideal
haemoglobin according to these standards is 1.2 g/dl greater than that of the Control group and 0.8 g/dl.
greater than that of the Test group. The ideal mean cell volume at 77 fl is substantially higher than the
mean cell volumes of 72 fl and 73 fl in the Control and Test groups.
Reference levels for haematological parameters were published in the form of percentile curves by
Dallman and SiimesC116) (Source 5). In establishing the reference curves Dallman and Slimes excluded
subjects with evidence of iron deficiency in one or more laboratory tests. For haemoglobin in 1 year old
· children these criteria were serum ferritin less than 10 ng/ml, serum transferrin saturation less than 16%
and mean cell volume less than 70 fl. Centiles for mean cell volume were computed after excluding those
subjects whose haemoglobin values were more than 2 standard deviations below the mean determined as
above or who had serum ferritin below 10 ng/ml, transferrin saturation less than 16% or abnormal
haemoglobin electrophoresis. This ensured that only iron sufficient subjects were included, but the authors
caution that iron sufficient subjects with lower test values may have been excluded. The standards set by
the 50th centiles are similar to those of Saarinen and Siimes.
Yip et a/478) (Source 5) published similar reference levels for haematological parameters by combining
results from several surveys.
While these "reference" centile curves provide useful standards for clinical decisions they are less useful
norms for population comparisons since they may be based on data that excluded iron sufficient subjects
with parameters in the low range of normal. In addition, the proportions of the various
haemoglobinopathies in the reference and study populations differs because of the exclusion criteria and
differences in genetic composition of the American and Cape Town populations.
From the foregoing it may be seen that neither of the study groups reached the levels of iron sufficiency
indicated by ideal reference standards.
The parameter that deviated most from the ideal was the mean cell volume. It is possible that this may be
due to a large proportion of infants in the study with thalassaemia trait or heterozygotes for a

CHAPTER 6 RESULTS: IRON FORTIFICATION 6.17
haemoglobinopathy. This is unlikely since Bird et af.39) found such conditions in 10.4% of "coloured"
infants presenting to the Red Cross War Memorial Childrens Hospital with a mean cell volume less than 60
f(. The prevalence is likely to be very much less in children with mean cell volumes greater than 60 fl.
It is possible that the laboratory results are systematically low for the mean cellvolume but this is unlikely
because the laboratory makes regular, frequent quality control assays with an internationally accepted
standard.
A more likely reason for the relatively low mean cell volumes in the study children is that their iron status
was sub-optimal in spite of the iron fortification.
If so, this might imply that mean cell volume is a more sensitive indicator of minor degrees of suboptimal
iron status in a population than haemoglobin. Unfortunately, this parameter was not reported in the
studies of Marsh et af.-323), Andelman and Sered(7) and Steke1<479
) so it is not possible to test this hypothesis
by reference to the literature.
Since the red cell distribution width showed the smallest P values when the haematological parameters of
the Control and Test groups were compared, it will be interesting to relate the results in the present study
to reference levels when these are established. It seems that red cell distribution width is a sensitive
indicator of suboptimal iron nutrition.
A further conclusion is that the present study may reflect the community's position in a "secular trend" in
haematological parameters analogous to the well known secular trend in stature. This speculation arises
from the historical comparisons made in table 6.9 and is further confirmed in the next section.
• There was 1 such child in the present study and he turned out on further investigation to have thalassaemia trait.

6.18 IRON NUTRITION AND IMMUNITY
Table 6.9 groups.
Reference standards for haematological parameters compared with the Control and Test
Source- Age R/5 month
Con:trol 12 Test 12
1 12 2 12 3 12 4 12 S 6-24 6 12-24
* Source
Hb g/dl
11.49 11.85
11.3 11.6 12 12.7 12.5 12.3
HC'P RBC i lG12 /l
34.85 4.85 35.80 4.90
34.4 4.78 35.2 4.6 40 4.4 37 4.7
35.9 4.34
MCV MCH MCHC RDW% :fl pg g/dl
71.96 23.78 32.98 15.53 73.20 24 .. 29 33ol4 14.44
73 23.7 32.4 77 25 33 78 27 32.S 77.7 26.8 34.3 70 79 27.4 34.4
1 Guest GM, Brown EW. ·Erythrocytes and he!ooglobin of the blood in infancy and childhood. AMA Journal of Diseases of Children 1957; 93: 486-509<200 >
2 Smith CH. Blood diseases of infancy and childhood. 3rd ed Mosby, St Louis 1972<423> 3 Dacie JV, Lewis SM. Practica 1 Haematology 6th ed. Church11 l Livingstone, Edinburgh, 1984<110> 4 Saarinen UM, Siimes MA. Developmental changes in red blood cell counts and indices after exclusion
of iron deficiency by laboratory criteria and continuous iron supplementation. Pediatrics 1978: 92: 412-416(435>
5 Dallman PR, Siimes MA. Percentile curves for haenK>globin and red cell volume in infancy and childhood. Pediatrics 1979; 94: 26-31 <124>
6 Yip R, Johnson C, Dallman PR. Age related changes in laboratory values used in the diagnosis of anaemia and iron deficiency. Am J Clin Nutr 1984; 39: 427-436<527 >

CHAPTER 6 RESULTS: IRON FORTIFICATION 6.19
Comparison with epidemiological surveys of haematological indicators of iron
status
Interesting comparisons may be made with values found in an affluent community (Source 1 in table 6.10),
with values found in a population survey in the USA (Source 4) and with values found in surveys in the
Western Cape (Sources 2 and 3).
In an affluent community in Canada, children at the age of one year had a mean haemoglobin 0.4 g/dl
greater than the Test group and 0.8 g/dl greater than the Control groupC49).
In Cape Town, Lanz.kowsky<262) showed in 1960 that the mean haemoglobin level was 11.2 g/dl for one year
old white children, and 9.57 and 9.84 g/dl for »coloured" and black children. In 1984 Kirsten et af241)
showed that the iron nutrition of "coloured" children had improved since the mean haemoglobin level was
10.5 g/ di. His study was conducted in Heideveld, a community similar to that of Bonteheuwel.
The effects of the extra iron employed in the present trial can be compared to the effects of the trial itself
by contrasting the difference between the Control and Test groups with the difference between the Control
group and the children in Kirsten's study. The Test group had a mean haemoglobin 0.36 g/dl greater than
the Control group. In contrast, the Control group had a mean haemoglobin 1 g/ dl greater than infants in
Kirsten's study.
It may thus be inferred that the present study was effective in ensuring that the iron status of the both
groups of children was substantially better than that of similar peers who did not participate in the trial:
Yip et af482) studied haematocrits in white and black American children and found essentially equal mean
levels. These are 1.5 and 0.5 percentage points greater than those in the Control and Test groups at 12
months of age.

6.20 IRON NUTRITION AND IMMUNITY
Table 6.10 Test groups.
Epidemiological surveys of haematological parameters compared with the Control and
Sourcem Age R/S month
Control 12 Test 12
1 12
2 12
3 4
12 11-23
* Source
F M w C B
w B
Hb g/dl
11.49 11.85
12.29 12.24 11.2
9.57 9.84
10.S
HCT %
34.85 35.80
36.9 36.7
36.54 36.33
RBC 1012/l
4.85 4.90
MCV fl
71.96 73.20
67.2
MCH pg
23.78 24.29
23
HCHC g/dl
32.98 33.14
RDW%
15.53 14.44
1 Brault-Dubuc M, Nadeau M, Dickie J, Iron status of French Canadian children: a 3 year follow-up study. Hum Nutr: Appl Nutr 1983; 37A: 210-221<52>
2 Lanzkowsky P. Mean haematological values in healthy infants and pre-school children in Cape Town. S Afr Med J 1960; 34: 469-471< 288>
3 Kirsten GF, Heese H de V, de Villiers S, Den;>ster WS, Varkevisser HE, Hoffman M. The prevalence of iron deficiency in apparently healthy Cape Coloured infants. S Afr Med J 1984; 65: 378-380< 241 >
4 Yip R, Schwartz S, Deinach AS. Haematocrit values in white, black and American Indian children with comparable iron status. Am J Dis Child 1984; 138: 824-827<531 >

CHAPTER 6 RESULTS: IRON FORTIFICATION 6.21
Comparison with other trials of iron fortification for haematological indicators·of
iron status
Table 6.11 below ( extracted from table 2.16) lists the mean haemoglobins attained by infants in 3 clinical
trials similar to the present study. It also shows that the iron and ascorbic acid levels in those trials was
similar to that employed in the present study for the Control group.
In all 3 studies children fed on the iron fortified milk had substantially higher mean haemoglobins than
those on unfortified milks. It may be noted that these children's haemoglobin levels were also higher than
those in even the Test group of the present study. The lowest was 11.9 g/dl and the highest 12.69g/dl, the
Control and Test group's haemoglobins were 11.49 g/dl and 11.85 g/dl.
Table 6.11 Haematological parameters from other trials of fortification of cow's milk based infant formula compared with those of the Test and Control groups .
. Source AGE [IRON] [ASCORBIC ACID] MEANHb
months mgFe/1 mgAA/1 g/dl
Control 12 11.96 53 11.49 Test 12 57.66 53 11.85
Marsh1 9 12 55 12.69 Unfortified milk ? ? 10.46 Evaporated milk ? ? 9.67
Artdelman2 12 12 55 11.9 Evaporated milk ? ? 10.4
StekeI3 9 15 100 12.2 Unfortified milk ? ? 11.1
Notes
• Source 1 Marsh A, Long H, Stierwalt RN. Comparative haematologic response to iron fortification of a milk fonnula for infants.
Pediatrics 1959; 24: 404-412
2 Andelman.MB, Sered BR Utilization of dietary iron by tenn infants. Am J Dis Child 1966; 111: 45-55(7)
3 The ascorbic acid levels in the fonnulas used by Marsh et al and Andelman and Sered were not published. by these
authors but are given in the article by Stekel on pages 181 and 182 of "Prevention of iron deficiency", Stekel A, 179-194
in Iron nutrition in Infancy and Childhood. Edited by Stekel A, Nesti, Vevey/R.2J.ven Press, New York 1984. The
haemoglobin levels from Stekel's study are read from figure 2 on page 184.

6.22 IRON NUTRITION AND_IMMUN11Y
Assessment of achievements of the trial with respect to iron nutrition The first question addressed by the trial was:
•'
Does increasing the level of iron fortification of conventional infant milk f orrnula improve the
iron nutrition of normal infants fed on the formula?
The results presented above provide an affirmative answer to the question. but show that increasing iron
alone, even in substantial quantities, is unlikely to make a clinically important difference. It is likely that the
availability of iron added to milk formula is more dependent on the quantity of ascorbic acid than the
quantity of ironC134•
133•
176• 519
). The present study thus indirectly confirms the importance of ascorbic acid
in facilitating the assimilation of iron.
The study suggests that the mean cell volume may be a more sensitive indicator of sub-optimal iron status,
since this was the haematological parameter which showed the greatest difference from reference levels.
Table 6.7 shows that the red cell distribution width (RDW%) was the variable with the most statistically
significant difference between the Test and Control groups. For the Test group the RDW% was 14.44%
while for the Control group it was 15.53% with a P value of 0.05% for a 2 sample t test of the difference.
The extra iron was associated with a smaller range of red cell sizes. Recent work(3S, 383) shows that the
RDW% is a sensitive indicator of the iron status of the population and the present study bears this out.
The study also raises the question of why the iron fortified milk formula was less successful in promoting
optimal iron nutrition than similar formulas in similar trials. It is possible that the children ingested small
quantities of the milk. Although it was not possible to gather data on this, it was the impression of the
study team th·at the children received adequate amounts in almost all cases, Since the children grew
adequately (mean standard deviation scores for weight were above O for both groups) their general
nutrition was surely good.
It is also possible, but unlikely, that the mothers relied too much on the formula and. did not give their
children other haematinic foods in sufficient quantities.
More likely is the possibility of a relative increase in inhibitors of iron absorption or the relative decrease in
facilitators of iron assimilation with respect to the diets of children in the studies listed in table 6.11.
Another possibility is that the children suffered from increa_sed iron losses. Diet is an unlikely cause and, as
hookworm is rare in Cape Town·, it seems that increased iron losses are not probable.
* Househam, KC. Epidemiology, clinical features, aetiology and course of acute infectious diarrhoea in infants. MD thesis. Univel"Sity of Cape Town 1985.

CHAPTER 6 RESULTS: IRON FORTIFICATION. 6.23
These results lead to the conclusion, articulated by Dallman et af.125), that more studies are needed "to
detennine the overall influence on iron absorption of various types of fortified and unfortified transitional
infant foods".

6.24 IRON NUTRITION AND IMMUNITY
The effect of increased iron fortification of milk formula on immune function
Introduction
The second question addressed by the trial was:
Does increased iron fortification of inf ant milk formula alter immunity as reflected by
incidence of infection and laboratory tests of immune function?
This section then, compares the Control and Test groups firstly for laboratory tests of immune function and
secondly for incidence of infection in order to determine the effect of the increased iron fortification. The
following 2 sections use classification and multivariate analysis to seek evidence for a relationship of iron
status per se with immune function.
Delayed cutaneous hypersensitivity
Introduction
Delayed cutaneous hypersensitivity is tested by the delayed reaction to an antigen injected intracutaneously.
Such a reaction can only occur if the child has been sensitized by natural infection or by immunization.
Two antigens were used in this study: PPD (purified protein derivative of Mycobacterium tuberculosis), and
Candida antigen in the Mantoux and Candida tests. All the results tabulated are for children who had been
immunized with BCG shortly after birth.
In healthy children who have been immunized with BCG at birth the Mantoux test would be expected to be
reactive (diameter of induration from 6 to 14 mm) or strongly reactive (diameter of induration > 14 mm)
in 90% at 3 months and 72% at 18 monthl162. 207)_ The Mantoux test would also be expected to be
reactive in a child infected with tuberculosis, but there was no reason to suspect this in any subject in this
study.
Healthy children develop an immunity to Candida at an early age and by the age of 1 year 80% of children
would be expected to react to the delayed cutaneous hypersensitivity test(4l7)_
Results
Tables 6.12 and 6.13 show that at one year of age the Test group responded more strongly than the Control
group to Candida antigen, but showed lower reactivity in the Mantoux test. The differences were small and
far from statistical significance.
The data were also analyzed in order to determine reactivity of those children from whom Candida albicans
had been isolated from a swab of a clinically suspicious lesion. In this group and in the group from whom

CHAPTER 6 RESULTS: IRON FORTIFICATION 6.25
Candida albicans had not been isolated, the mean diameters of induration were 10.1 mm and 9 .2 mm
respectively and a t test yielded a P value of 70% for the difference between the two groups.
Table 6.13 shows that, at the age of one year, the Candida test elicited 5 mm or more of induration in 55%
of Control infants and 63% of the Test group. For the Mantoux test the response rates were 58% and 52%
respectively.
Table 6.12 Delayed cutaneous hypersensitivity mean diameters of reaction compared in the Test and Control groups.
Antigen Control
Mean
Test
Mean
p
Value
95% CI of diff.
of means
Power
Obs 10%
AT 3 MONTHS OF AGE Mantoux 5.96
(mm induration)
Candida 4.35 (mm induration)
AT 1 YEAR OF AGE Mantoux 8.05
Change in Mantoux 2.25 (mm induration)
Candida 8.88
Change in Candida 4.87 (mm induration)
4.32
7.03 1. 47
9.75
5.18
Notes P values were calculated from student's t test. 95% CI = 95% confidence intervals.
53%
97%
43% 62%
56%
84%
-2.50
-2.03
-3.60 -3.86
-2.10
-2.78
1.30
1.95
1.56
2.30
3.83
3.40
0
0
12
0
0
0
0
0
0
a
a 0
The statistical power of the study was detennined for both the observed difference (Obs) and a 10% difference (10%) from the combined mean for a type I error probability of 5%. Changes are reported as the nean of the variable at 12 m::inths minus the nean value at 3 m::inths. Antigen, purified tuberculin 5 T.U./0.1 ml for the Mantoux test and 0.1 ml 1/100 Candida antigen, was injected intracutaneously on the volar aspect of the foreanns. The.transverse width of induration was neasured 48 hours later.

6.26 IRON NUTRITION AND IMMUNITY
Table 6.13 Delayed cutaneous hypersensitivity response rates compared in the Test and Control groups.
REACTION 0-4mm 5-9mm 10-30 mm
Group No % No % No % Chi2
AT 3 MONTHS OF AGE
~andida .Control 46 65% 19 27% 6 8%
Test 50 68% 17 23% 6 8% 0.25
Mantoux Control 33 49% 31 46% 4 6%
Test 39 56% ·27 39% 4 6% 0.74
AT 1 YEAR OF AGE
Candida Control 27 45% 14 23% 19 32%
Test 26 39% 18 27% 24 36% 0.60
Mantoux Control 25 42% 21 35% 14 23%
Test 32 48% 22 33% 13 19% 0.53
Notes P values were calculated from Chi square test; all were more than 10%.
Antigen, purified tuberculin .5 T.U./0.1 ml for the Mantoux test and 0.1 ml 1/100 Candida antigen, was injected
intracutaneously on the volar aspect of. the forearms. The transverse width of induration was measured 48 hours later.

CHAPTER 6 RESULTS: IRON FORTIFICATION
C A N D I D A D E L A Y E D H Y P E R S E N S I T I V I T Y
Ill
Ill
CONTROL TEST DIFFERENCE
6.27
Figure 6.5 Candida test of delayed cutaneous hypersensitivity for the Test and Control groups at U * months of age
Figure 6.6
Ill
Ill
M A N T O U X T E S T
CONTROL TEST DIFFERENCE
Mantoux test compared for the Test and Control groups at 12 months of age·
• The bars represent the means and the vertical lines through the bars represent the 95% confidence intervals

6.28 IRON NUTRITION AND IMMUNITY
Discussion
Although microbiological swabs were takeri only when Candida infection was clinically expected (there was
no survey of all the children), it is to be expected that normal children who had yielded swabs positive for
Candida albicans would have shown a greater reaction on average than the other children who would
presumably include both a subgroup who had experienced subclinical infection and a subgroup who had not
yet been exposed to Candida. The small difference that was found between the group who had proven
exposure to Candida and the group whose exposure was unknown raises the suspicion that the test has poor
discriminatory power for small variations in immune function.
In the present study the Mantoux test was being used in an attempt to detect a difference in immune
function between the Test and Control groups. It is also of interest to compare the results in the present
study with surveys of reactivity to the Mantoux test in healthy children. This is done in table 6.14 where the
present study is contrasted with a study designed to evaluate the effectiveness of locally produced PPD and
to determine the "conversion rate• following immunization with BCG. At 3 months of age, the present
study yielded a smaller mean diameter of reaction, but at 12 months of age the results are comparable to
those from the studies of Fourie and Kibel<162• 207). The differences between studies are greater than the
differences within studies for both the means and the standard deviations. The inference to be drawn from
this is that the Mantoux test is more reliable for comparisons within a particular study than for comparisons
between studies.

CHAPTER 6 RESULTS: IRON FORTIFICATION 6.29
Table 6.14 Mantoux reaction compal"ed between the present study gr-oups and other studies. The reaction was the transverse diameter measured in mm 48 hours after intracutaneous injection of STU of PPD (purified protein derivative of Mycobacterium tuberculosis) on the volar aspect of the forearm.
Study Mean Std N (mm) Dev
AT 3 MONTHS OF AGE
Contl"Ol1 5.96 S.48 68 Test2 5.36 S.11 71
Kibel3 7.3 4.0 21 Kibel4 9.8 4.3 11
AT 6 MONTHS OF AGE
Kibel3 8.1 4.1 16 Kibel4 1.7 2.4 3
AT 12 MONTHS OF AGE
Control1 8.05 7.48 60 Test2 7.03 7.18 67
AT 18 MONTHS OF AGE
Kibel4 8.1 5.4 13
Notes 1. The Control group in the present study, tested with British PPD
2. The Test group in the present study, tested with British PPD
3. Cape Coloured children tested with South African PP0(162• 207)
4. Cape Coloured children tested with Japanese ppoC162, 207)
Comparison with previous studies
Gross et a/180) report that the dinitrochlorobenzene test in 5 iron deficient adults (mean haemoglobin 6.8
g/ di) was similar to that of normal controls and did not change with iron therapy.
Bhaskaram and Reddy(37) reported that the delayed cutaneous hypersensitivity test was positive in 4 of 9
iron deficient children before iron replacement therapy. In 1 child it became positive after treatment.
Haemoglobin levels ranged from 4 to 7 g/dl before treatment; responses to treatment were not stated.
Joynson et af.229• 217• 216) report that the candida delayed cutaneous hypersensitivity test was positive in all
U adult controls (mean haemoglobin 14.2 g/dl) but in only 3 of 12 iron deficient adults (mean haemoglobin
9.0 g/dl). For PPD the results were positive in 10 and 5 subjects respectively.
Chandra and and Saraya<91) reported trends towards decreased delayed cutaneous hypersensitivity
responses in 20 iron deficient children to candida, PPD, mumps and trichophyton. For
streptokinase/streptodornase the response of the iron deficient group was significantly depressed. Mean
6.30 IRON NUTRITION AND IMMUNITY
ages and haemoglobins were not reported, so comparison with the present study is difficult. In addition,
differences between the two groups in prevalence of infection and malnutrition can not be ruled out.
In 28 obese children Chandra and Kutty<90) reported an impairment of iron nutrition as measured by serum
ferritin. The obese children had lower serum zinc and significantly fewer individuals with positive delayed
cutaneous hypersensitivity test with candida, mumps, trichophyton and streptokinase/streptodornase.
Mean ages and haemoglobins were not reported.
Similar results were reported by Chandra, Woodford and Hyam<89) but no details of iron status, ages or
selection of their subjects were given.
Kuvibidili258), in a carefully controlled study showed a significant impairment to dinitrochlorobenzene in
mice with severe iron deficient anaemia.
Krantman et af-249) tested 5 iron deficient infants and found positive responses to candida and tetanus in 2
and 3 respectively. After treatment the mean haemoglobin rose from 8.36 to 12.04 g/dl and all responded
to the delayed cutaneous hypersensitivity tests. Infection could not be entirely discounted as a possible
confounding factor as the children had raised IgM concentrations.
Macdougall et a/22.2) tested delayed .cutaneous hypersensitivity with diphtheria, candida and streptococcal
antigen in 14 control children (Hb=12.8), 7 with latent iron deficiency (Hb=l0.8) and 11 with iron
deficiency anaemia (Hb=8.1). Compared to controls, the iron deficient patients had significantly fewer
positive tests; and after iron therapy they responded normally to the delayed cutaneous hypersensitivity
tests. As the iron deficient children were selected from hospital patients, infection is a confounding factor
whose influence cannot be evaluated.
Summacy and conclusions
In summary, the results of the delayed cutaneous hypersensitivity tests are inconclusive and do not suggest
that the Test group had altered immune function. However the statistical power of the Mantoux and
Candida tests was low and the difference in iron status was small so it is unlikely that a real difference
would have been detected.
Comparison with studies in the literature is difficult since the reported studies have compared groups with
much greater differences in iron status. In contrast to the present study, many clinical studies could not
rule out the confounding effects of malnutrition and infection as their subjects were hospitalized patients.
A further problem that inhibits comparison is that clinical studies have followed clinical practice and
reported their results in terms of the numbers of "positive" or ''negative" tests. This is, in a sense, discarding
data; a more accurate and precise summary measure is the mean diameter of induration.
CHAPTER 6 RESULTS: IRON FORTIFICATION 6.31
Specific antibody response to immunization
Introduction
The responses to immunization with live trivalent polio virus vaccine administered orally and tetanus toxoid
administered intramuscularly are compared in table 6.15 for the Test and Control groups. The two tests
measure specific antibody titre. Although the tests use the same outcome measure they evaluate different
parts of the immune system since the antibodies are produced in response to different types of stimulation.
Statistical note
There is a theoretical difficulty in using the t test on data such as antibody titres which are far from
normally distributed. The results shown in table 6.15 are from non-parametric stati_stical tests which avoid
this sort of problem.
The non-parametric tests do not readily lend themselves to graphical representation or to the calculation of
confidence intervals. Logarithmic transformation of skewed data often brings the data close enough to
Gaussian distribution · for parametric analysis. This was done for the titres and the analysis, shown in
appendix 3, gave similar P values and trends to those obtained from the non-parametric statistics. Since the
validity of the log transformation was thus confirmed, figures 6.7 and 6.8 compare the two groups for
log(antibody titre).
Results
The Test group had a greater response to immunization than the Control group for polio but a smaller
response for tetanus. The differences were far from statistical significance.
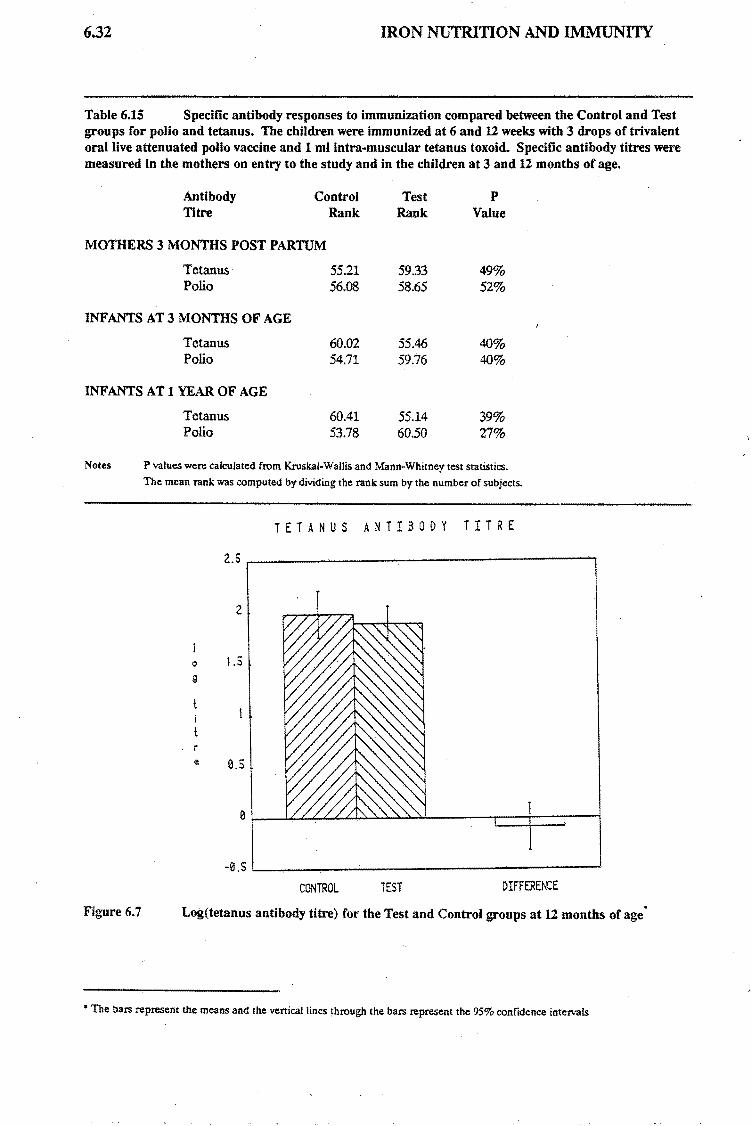
6.32 IRON NUTRITION AND IMMUNITY
Table 6.15 Specific antibody responses to immunization compared between the Control and Test groups for polio and tetanus. The children were immunized at 6 and U weeks with 3 drops of trivalent oral live attenuated polio vaccine and 1 ml intra-muscular tetanus toxoid. Specific antibody titres were measured in the mothers on entry to the study and in the children at 3 and U months of age.
Antibody Control Titre Rank
MOTHERS 3 MONTHS POSTPARTUM
Tetanus Polio
INF ANTS AT 3 MONTHS OF AGE
Tetanus Polio
INFANTS AT I YEAR OF AGE
Tetanus Polio
55.21 56.08
60.02 54.71
60.41 53.78
Test Rank
59.33 58.65
55.46 59.76
55.14 60.50
p Value
49% 52%
40% 40%
39% 27%
Notes P values were calculated from Kruskal-Wallis and Mann-Whitney test statistics.
The mean rank was computed by dividing the rank sum by the number of subjects.
T E T A N U S A N T I B O D Y T I T R E
2
0 1.5 g
r e 0.5
-0.S L----,-------------------" CONTROL TEST DIFFERENCE
Figure 6.7 Log(tetanus antibody titre) for the Test and Control groups at 12 months of age·
• The bars represent the means and the vertical lines through the bars represent the 95% confidence intervals

CHAPTER 6 RESULTS: IRON FORTIFICATION 6.33
Figure 6.8 . age
0
9
r e
P O L I O A N T I B O D Y T I T R E
CONTROL TEST DIFFERENCE
Log(polio antibody titre) compared for the rest and Contro- groups at u months of
Comparison with previous studies
Chandra and Saraya<91) indicated that there was no difference in response to immunization with tetanus
toxoid and Salmonella typhi vaccine in iron deficient children and controls. Mean ages and haemoglobins
were not reported.
KuvibidilaC255) found that antibody production against sheep red blood cells was severely depressed in iron
deficient anaemic mice but not in pair-fed controls. In a related study, Kuvibidila and her colleagu~s(2S7)
reported that the blastogenic response of B cells to bacterial lipopolysaccharide was significantly impaired
in iron deficient mice.
Macdougall and J acobi283) found non-significant tendencies for iron deficient children to respond less
efficiently to immunization with diphtheria toxoid and Salmonella typhi vaccine. Both infection and
nutritional factors were poorly controlled and their control group was probably also mildly iron deficient as
their mean haemoglobin level was 10.95 g/dl. The test group's haemoglobins ranged from 4.6 to 7.4 g/dl.
Malakhovsky et ai<291) also reported tendencies for decreased immune responses in iron deficient infants.
Their paper does not provide sufficient data to evaluate the methods and results.

6.34 IRON NUTRITION AND IMMUNITY
The clearest results are from the study of Nalder<333> who found a decreased response to immunization
with tetanus toxoid in rats. There was a striking dose/response relationship between the level of iron in the •
diet and antibody titre. As there was no pair-fed control group, however, the effects may be due to
concomitant nutritional deficiencies.
Summary In summary, the results of the ana.body analyses are inconclusive. The differences are not statistically
significant and the power of the statistical analysis to detect a real difference is less than 50%. Previous
studies have compared groups with much larger differences in iron status than that obtained in the present
trial and have often not excluded malnutrition or infection.

CHAPTER 6RESULTS: IRON FORTIFICATION 6.35
Leukocyte counts
Results
The white cell counts for the Test and Control groups are compared in table 6.16. At three months of age
there was no difference between the two groups. At 1 year of age the total white cell count was minimally
lower in the Test group. The Test group had significantly more monocytes and fewer lymphocytes than the
Control group. Smaller differences were manifest in the other classes of lymphocytes.
Table 6.16 White cell counts compared at the start and end of the trial.
Leukocytes Cont:rol Test: p 95% CI of diff. Power
Mean Mean Value of means Obs 10%
AT 3 MONTHS OF AGE Total Leukocytes 11.25 11.12 25% -0.46 1.76 21 53
Polymorphs ( % ) 26.98 27.53 80% -3.78 4.88 0 24
Lymphocytes ( % ) 64.78 65.06 90% -4.25 4.81 0 80
Monocytes ( % ) 5.13 5.02 83% -1.13 0.90 0 17
Eosinophils ( % ) 2.89 2.26 14% -1.48 0.22 31 0
Basophils ( % ) 0.18 0.14 60% -0.21 0.12 0 0
AT 1 YEAR OF AGE Total leukocytes 10.95 10.35 87% -0.97 1.15 0 53
Polymorphs ( % ) 31. 32 34.79 11% -0.74 7.68 35 34
Lymphocytes ( % ) 60.75 56.39 5% -8.66 -0.08 51 76
Monocytes ( % ) 4.63 5.92 3% 0.13 2.45 59 15
Eosinophils ( % ) 3.22 2.74 40% -1. 59 0.63 14 0
Basophils ( % ) 0.10 0.11 88% -0.12 0.14 0 0
Notes P values were calculated from student's t test. 95% CI " 95% confidence intervals. The statistical power of the study was determined for both the observed difference (Obs) and a 10% difference {10%) from the combined mean for a type I error probability of 5%.

6.36
Figure 6.9
Figure 6.10
p e r
f l
IRON NUTRITION AND IMMUNITY
WHITE CELL COUNT
CONTROL TEST DIFFERENCE
White cell counts for the Test and Control groups at 12 months of age·
L Y H P H O C Y T E S
CONTROL TEST DIFFERENCE
Lymphocyte counts compared for the Test and Control groups at 12 months of age
• The bars represent the means and the vertical lines through the bars represent the 95% confidence intervals
•

CHAPTER 6 RESULTS: IRON FORTIFICATION 6.37
Discussion
The interpretation of the differences is not clear but the results would be consistent with the Control group
having had more infections than the Test group, particularly if the infections were predominantly viral.
The review of the literature in chapter 2 (see table 2.11) found no study that reported a depression of
leukocytes or granulocytes in iron deficiency although their subjects had much greater degrees of iron
depletion than those in the present study.

6.38 IRON NUTRITION AND IMMUNITY
Lymphocyte subtypes
· Introduction
The many different functions of the immune system are carried out by specialized cells. Prominent among
these are the T lymphocytes. These have been characterized by surface antigens which are "recognized" by
specific monoclonal antibodies. Virtually all T lymphocytes are identified by the OKT3 antibody. OKT4
and OK.TS antibodies "recognize" helper/inducer and suppressor/killer T cells respectively. Table 6.17
displays the results of lymphocyte subtyping applied to the Test and Control groups at 3 and 12 months of
age.
Changes in these markers have been documented in severe immune deficiencies. In the present
population, where subtle changes in immune function were hypothesized it was difficult to predict the
direction of changes.
Results
The results in table 6.17 show that there was little difference between the Test and Control groups at both 3
and 12 months of age. The statistical power of the test to detect a 10% difference between the Test and
Control groups was low.
Discussion
The literature review found no previous study that reported on lymphocyte subtypes in relation to iron
nutrition. Decreased proportions of T cells have been reported by Bhaskaram and Reddy(37), Chandra and
SarayaC91), Srikantia et a/C431
) and Krantman et a/249). Nutrition and infection were likely confounding
factors in the first three investigations. Chandra and Kutty(90) found normal proportions of T cells in obese
children with iron deficiency.

CHAPTER 6 RESULTS: IRON FORTIFICATION 6.39
Table 6.17 Lymph- btyp · I
. v .. .r-e su es compared m the Control and Test groups at the start and comp et10n of the trial Lymph yt b · · ofT cells and with • . I oc e.s were su ~ed with commercial monoclonal antibodies in the case
commerc1a multivalent anti-gammaglobuJin to count B cells.
Lymphocyte control Test p 95% CI of diff. Power
Subtype Mean Mean Value of means of Test
AT 3 MONTHS OF AGE Total T cells 69.47 67.98 39% -4.87 1.90 14 97
OKT3
Helper-inducer 50.42 51.60 59% -3.11 5.48 0 64
OKT4 Suppressor-killer 16.42 15.84 66% -3.16 2.00 0 24
OKT8 Helper/suppressor 3.60 4.16 16% -0.21 1.33 29 17
OKT4/0KT8 ratio
B cells 19.61 17.40 7% -4.58 0.16 45 33
SMIG
AT 1 YEAR OF AGE Total T cells 74.14 72.59 44% -5.49 2.40 12 95
OKT3 Helper-inducer 46.90 46.83 98% -4.87 4.73" 0 48
OKT4 Suppressor-killer 22.53 22.94 81% -3.06 3.90 0 . 25
OKT8 Helper/suppressor 2.53 2.41 62% -0.59 0.35 0 18
OKT4/0KT8 ratio
Change OKT4/0KT8 -0.97 -1. 62 10% -1.44 0.13 38 0
OKT4/0KT8 ratio
B cells 18.60 19.19 66% -2.10 3.28 0 28
SMIG
Notes P values were calculated from student's t test. 95% CI~ 95% confidence intervals. " Changes are reported as the mean of the variable at 12 !T()nths minus the mean value at 3 !T()nths. SMIG = surface membrane immunoglobulin positive cells. The statistical power of the study was detennined for both the observed difference (Obs) and a 10%
difference (10%) from the combined mean for a type I error probability of 5%.

6.40 IRON NUTRITION AND IMMUNITY
Figure 6.11
Fig~re 6.12 age
I f I
B L Y M P H O C Y T E S
CONTROL TEST DIFFERENCE
B lymphocyte counts for the Test and Control groups at 12 months of age
HELPER/SUPPRESS O ·R RAT I 0
CONTROL TEST DIFFERENCE
T helper/suppressor ratios compared for the Test and Control groups at 12 months of
• The bars represent the means and the vertical lines through the bars represent the 95% confidence intervals

CHAPTER 6 RESULTS: IRON FORTIFICATION
Lymphocyte stimulation with phytohaemagglutinin
Introduction
6Al
The phytohaemagglutinin transformation test is a laboratory measure of the ability of lymphocytes to
respond to foreign material.
Results
Table 6.18 shows that the Test group, with a mean stimulation index of 140%, responded marginally better
than the Control group with a mean index of 142%.
Table 6.18 Lymphocyte stimulation with phytohaemagglutinin (PHA) compared between the Control and Test groups. The infant's lymphocyte response is reported as a percentage of the response of an adult control. In order to distinguish cellular and serum effects the tests were performed with the infant's cells and serum, the infant's cells and serum from an adult control, and adult control .cells with serum from the infant.
FHA Test
Cells Serum
AT 3 MONTHS OF AGE Infant Infant
Infant
Adult
Adult
Adult
Infant
Adult
AT 1 YEAR OF AGE Infant Infant
Infant Adult
Adult Infant
Adult Adult
Control
Hean
Test
Hean
133.74 137.48
138.78 143.11
97.97 103.80
100.00 100.00
140.40 142.06
142.83 143.39
102.14 101.54
100.00 10-0.00
Change in Inf-Inf 15.03 -1.27
Notes P values were calculated from student's t test. 95% CI= 95% confidence intervals.
p
Value
77%
72%
14%
N/A
92%
96%
90%.
N/A
37%
. 95% CI of diff.
of means
-21.35
-19.36
-1.88
-29.81
-23.25
-9.87
28.83
28.02
13.53
33.13
24.35
8.69
-52.40 19.80
Power
Obs 10%
14 29
15. 32
42 83
12
11
12
15
25
32
68
0
Changes are reported as the mean of the test with cells and serum from the infants at 12 months minus the mean value at 3 months. The control results are 100% by definition. The statistical power of the study was determined for both the observed difference (Obs) and a 10%. difference (10%) from the combined mean for a type I error probability of 5%.

6.42 IRON NUTRITION AND IMMUNITY
P H A S T I M U L A T I O N
150
CONTROL TEST DIFFERENCE
Figure 6.13 Lymphocyte responses to stimulation with phytohaemagglutinin for the Test and Control groups at 12 months of age· ·
Discussion
The results show that the increased iron fortification had essentially no effect on iron status.
Comparison with previous studies
Table 2.8 in chapter 2 summarizes the results of studies found in the literature survey that reported on
lymphocyte stimulation tests in iron deficiency. Of these, 8 documented significantly impaired responses to
phytohaemagglutinin, 2 showed similar but non-significant trends and in 1 there was no change in iron
deficiency.
In the study with the anomalous resuitsC251>, all the children were severely iron deficient (the mean
haemoglobin was 3.5 g/ dl) and 7 of the 8 had hookworm ova or parasites in the stools.
The other clinical studies derived their subjects from hospital populations where confounding factors of
nutrition and infection are prevalent. The only laboratory experiment(2S7) used pair-fed rats to control for
nutritional deficiencies other than iron. These investigations all compared groups with greater differences •
in iron status than existed in the present project.
• The bars represent the means and the vertical lines through the bars represent the 95% confidence intervals

CHAPTER 6 RESULTS: IRON FORTIFICATION.
Neutrophil bactericidal indices
· Introduction
6.43
The bactericidal test is an in vitro test of the ability of cells and serum to kill bacteria (in this case
Staphylococcus aureus ).
Results
Table 6.19 shows that the bactericidal indices at 12 months were slightly better in the Test group than in the
Control group; for instance, 105% compared with 94% at one hour. The Test group also manifested a
greater improvement in killing ability from that at 3 months to that at 12 months of age. The 95%
confidence intervals are relatively wide and the statistical power of the test is low so no definite conclusion
can be drawn with respect to the effect of extra iron supplementation on the bactericidal index.
Table 6.19 Neutrophil bactericidal indices compared between the Test and Control groups. The bactericidal index is expressed as the percentage of the initial inoculum of Staphylococcus aureus surviving after culture with neutrophils from the subject.
Incubar.ion Conr.rol Tesr.
Period Mean Mean
AT 3 MONTHS OF AGE 1 hour 108.84 102.52 2 hours 124.41 111.00
AT 1 YEAR OF AGE 1 hour 105.14 94.00 Change in index 15.05 -11.72 2 hours 126.75 113.31 Change in index 23.71 2.36
Notes P values were calculated from student's t test. 95% er= 95% confidence intervals.
p
Value
58%
43%
44% 21%
57% 52%
95% CI of diff. Power
of means Obs 10%
-29.+8 16.52 0 0
-47.13 20.31 0 0
-40.10 17.81 22 20 -69.05 15.52 24 24
-60.53 33.65 18 17 -88.51 45.80 0 0
Changes are reported as the ~an of the variable at 12 rronths minus the ~an value at 3 !1¥)nths. The statistical power of the study was detennined for both the observed difference (Obs) and a 10% difference (10%) from the combined ~an for a type I error probability of 5%.

6.44 IRON NUTRITION AND IMMUNITY
B A C T E R I C I D A L I N D E X
150
-50
-100 '--------------------CONTROL . TEST DIFFERENCE
Figure 6.14 Neutrophil bactericidal indices for the Test and Control groups at U months of age·
Discussion
In appendix 3 the bactericidal indices are reported in several different ways. As the computational methods
are fundamentally different some comment is indicated. Table 6.19 gives the percentage of the initial
bacterial inoculum surviving after 1 and 2 hours. In appendix 3 the subjects are compared to the adult
controls by computing the ratio of the colony counts in subject's test to. those of the control test at 1 and 2
hours. In a more complex calculation the subjects were compared to the positive and negative controls
( adult cells and pooled AB serum). As the various methods produced similar results only the simplest
index is. reported here.
Comparison with previous studies
Decreased bactericidal activity has been reported in catalase positive organisms in 12 of 13 studies found in
the literature survey. Their results are summarized in table 2.10, chapter 2. All these studies compared
groups with much larger differences in iron status than in the present study··. With the exception of the
• The bars represent the means and the vertical lines through the bars represent the 95% confidence intervals
•• This can be inferred even if it was not explicitly stated as, for example, in 91, 86, 156.

CHAPTER 6 RESULTS: IRON FORTIFICATION 6.45
report of Walter et azC459>, the design of the studies makes it difficult to discriminate between the effects of
iron deficiency and coexisting infection or malnutrition or both·.
Walter et al conducted an elegant study of the changes in bactericidal activity as iron status was restored to
normal. But, even this design does not completely rule out the possibility of infection precipitating the
seeking of medical help and thus inclusion in the study. On. referral, the mean haemoglobin of 10 infants
was 7.9 g/dl. By day 15 it had improved to 9.6 g/dl in response to treatment with oral ferrous sulfate and
the bactericidal capacity had risen from 59% to 91% (approximately equivalent to 41% and 9% in terms of
the bactericidal index used in this report). From day 15 there was no further improvement in bactericidal
capacity.
Conclusion
The bactericidal assay in the present study showed trends that paralleled results from other studies, but the
statistical power of the study was low and no effect can be conclusively assigned to the extra iron
fortification.
• To be precise, one should also exclude from this judgment the experiment of Arbeter et af9> in which 2 rabbits were made iron
deficient by bleeding. And, also, it should be noted that Masawe et af.7$) tested the bactericidal activity of whole blood.

6.46 IRON NUTRITION AND IMMUNITY
Viral survey
Introduction A survey of virus carriage rat.e was made on entry to the study and on exit. On entry, when the infants were
3 months old, a faecal specimen was sent for viral culture. On exit, at 1 year of age, swabs from the rectum
and from the nasopharynx were sent for viral analysis.
Results
The virus isolation rates are given in table 6.20. At 3 months of age, 18% of Control infants were excreting
virus in the stool compared with 20% of Test infants. At 1 year of age, the isolation rates from rectal swabs
were 36% and 38% respectively, while from nasopharyngeal swabs the rates were 14% for both groups.
The types of viruses isolated are described in appendix 3.
Table 6.20 Virus isolation rates compared for the Control and Test groups. At 3 months of age faecal specimens were cultured for viruses. At 12 months of age swabs were sent for viral culture from the rectum and from the nasopharynx.
Group 3 Months 1 Year 1 year Faeces Rectal Swab Throat Swab No. % No. % ·No. %
Control 11 18 23 36 9 14 (No.) (61) (64) (64)
Test 12 20 25 38 9 14 (No.) (60) (66) (66)
Notes P values calculated from the Chi square test were far from significant.
Discussion
The virus carriage rate was essentially equal in the Control and Test groups. This can be taken as evidence
against the increased iron fortification having an adverse.effect on the bowel and nasopharyngeal viral flora.

CHAPTER 6 RESULTS: IRON FORTIFICATION 6.47
Incidence of infection
Introduction
The rate of infection experienced by children in the Test and Control groups is analyzed in tables 6.21 and
6.22. The first table compares the mean numbers of infections experienced in the two groups during the
trial period while the second compares the mean incidence rates of infection. The incidence rates are
expressed in numbers of infections per child per year and therefore remove the small bias introduced by a
slightly longer mean period of observation for children in the Test group - 8.96 months compared with 8.85
months for the Control group.
· Analysis of numbers and of rates of infection leads to similar conclusions. Discussion is therefore confrned
to table 6.22.
Infections were graded according to severity and classed according to clinical type. Grade 1 illne.sses were
of minor importance and did not warrant treatment. Grade 2 infections were of moderate importance and
required treatment as an outpatient. Infections severe enough to require hospitalization were recorded as
grade 3.
Infections of grade 2 or 3 were also classed according to their clinical type, viz conjunctivitis, pyoderma,
thrush, gastroenteritis and infections of the upper or lower respiratory tract (including otitis media). These
classes were chosen after the study because they included sufficient numbers for meaningful analysis.
Morbidity in infancy is not defined well enough to allow such classes to be defined in the planning stages of
this study. Infections that did not fall into one of the above classes are tabulated as "other". Details of the
operational definition of infection and the precautions taken to avoid counting infections more than once or
missing infections are given in the Methods and Materials section of chapter 3.
Results
Table 6.22 shows that the Test group had fewer infections than the Control group for each grade of severity
and for 5 of the 6 classes of infection. The Test group also had fewer infections in total than the Control
group. No difference is statistically significant and the 95% confidence intervals are relatively wide.
In the interests of planning future studies, a power analysis for each category of infection is presented in
table 6.23. The statistical power of the trial to detect a 10% difference in infectious morbidity is less than
25%, to detect a 25% difference in morbidity 81 %, and to detect a 50% difference in incidence rates the
power is 99%. The difference actually observed between the two groups is 9.12%.

6.48 IRON NUTRITION AND IMMUNITY
Table 6.21 Numbers or infections compared between the Test and Control groups. The infants were observed from the age of 3 months to 1 year.
Infect;ion Cont;rol Test; p 95% CI of diff. Power
Category Mean Hean Value of means Obs 101
Severity of infection Minor 1.26 1.16 0.64 -0.52 0.32 0 0
Important 3.34 3.13 0.58 -0.96 0.54 0 14
Severe 0 .16. 0.11 0.44 -0.17 0.07 12 0
TOTAL Infections 4.76 4.40 0.37 -1.15 0.43 15 21
TYPE OF INFECTION Conjunctivitis 0.24 0.21 0.72 -0.18 0.12 0 0
Other 0.27 0.14 0.12 -0.30 0.04 35 0
Pyoderma 0.39 0.33 0.70 -0.35 0.24 0 0
Thrush 0.40 0.36 0.72 -0.30 0.21 0 0
Gastroenteritis 0.79 0.71• 0.64 -0.40 0.24 0 0 Respiratory 1. 43 1.49 0.71 -0.39 a.so 0 0 TOTAL Infections 4.76 4.40 0.37 -1.15 0.43 15 0
Notes P values were calculated from student's t test. 95% CI= 95% confidence intervals. The statistical power of the study was determined for both the observed difference (Obs) and a 10% difference (10%) from the combined ID!an for a type I error probability of 5%.

CHAPTER 6 RESULTS: IRON FORTIFICATION 6.49
Table 6.22 Incidence of infection compared between the Test and Control groups. The incidence is expressed as the average number of infections per infant per year. It was determined by dividing the number of infections each infant experienced by the number or days he or she participated in the trial and then calculating the mean rate or infection.
Infection Control Test p 95% CI of di:f:f. Power
Category Hean Hean Value of means Obs 101
Severity of infection Minor 1.69 1.55 62% -0.70 0.42 0 0
Important 4.51 4.16 48% -1.35 0.65 10 14
Severe 0.22 0.15 43% -0.23 0.10 12 0
TOTAL Infections 6.42 5.86 30% -1.61 0.49 18 21
TYPE OF INFECTION Conjunctivitis 0.32 0.29 72% -0.24 0.17 0 0
Other 0.37 0.19 11% -0.41 0.04 33 0
Pyoderma 0.52 0.44 66% -0.49 0.31 0 0
Thrush 0.54 0.48 68% -0.40 0.27 0 0
Gastroenteritis 1. 07 0.95 59% -0.55 0.31 0 0
Respiratory Infect. 1.90 1.98 80% -0.52 68 0 0
TOTAL Infections 6.42 5.86 30% -1.61 0.49 18 21
Notes P values were calculated from student's t test. 95% CI = 95% confidence intervals. The statistical power of the study was detennined for both the observed difference (Obs) and a 10% difference (10%) from the combined nean for a type I error probability of 5%.

6,,50 IRON NUTRITION AND IMMUNITY
Table 6.23 Statistical power of the present study to.de.tect a difference in infection rate between the Test and Control groups with a 5% significance level.
Variable DIFFERENCE.: Actual 10% 25% 50%
SEVERI1Y OF INFECTION
Minor 0 0 29 80
Important 10 14 56 99
Severe 12 0 0 20
TOT AL Infections 18 21 81 99
TYPE OF INFECTION
Conjunctivitis 0 0 11 31
Other 2J 0 0 2J
Pyoderma. 0 0 0 22
Thrush 0 0 12. 32
Gastroenteritis 0 0 21 63
Respiratory Infect. 0 O· 36 89
TOT AL Infections 18 21 81 99
Notes The differences for which the statistical power was calculated are that difference actually obsexved between the means
and 10%, 25% and 50% of the mean for both groups combined.

CHAPTER 6 RESULTS: IRON FORTIFICATION
p e r
C
h i I d
p e r
8
6
4
y 2 e 0
r
0
I N C I D E N C E 0 F · I N F E C T I O N
Total Minor Moderate Severe
6.51
Figure 6.15 of age"
Incidence of md.§ of infection compared for the Test and Control groups at 12 mon.its
p e r
C
h f I d
p e r
8
6
4
y 2 e 0
r
0
Tot.al
k:4~::~rol
I N C I D E N C E 0 F I N F E C T I O N
RTI G/E Thrush Pyodermo Other Eye Inf
Figure 6.16 of age·
Incidence of~ of infection compared for the Test and Control groups at 12 months
• The bars represent the means and the vertical lines through the bars represent the 95% confidence intervals

6.52
p
• 0.5 r
C:
h 0 i I
d -0.5
p e
r -I
y e a -1 . 5 r
IRON NUTRITION AND IMMUNITY
D I F F t R E N C E I N I N r E C T I O N R A T E
Total Minor Hoderat.4ll SeverQ
Figure 6.17 Difference in incidence of grades of infection at 12 months of age·. (Test group mean· Control group mean)
p
e 0.5 r
C:
h 0 I I
d -0.5
p e
r -1
y e a -1 .5 r
-2
D I F F E R E N C E I N I N F E C T I O N R A T E
Total RTI G/E Thrush Pyoderma Oth0r Eye Inf
Figure 6.18 Difference in incidence of~ of infection at 12 months of age·. (Test group mean · Control group mean)
• The bars represent the means and the vertical lines through the bars represent the 95% confidence intervals

CHAPTER 6 RESULTS: IRON FORTIFICATION 6.53
Comparison with previous studies
Chapter 2 contains a detailed analytical review of previous studies that have attempted to define the
putative association of iron status with susceptibility to infection. Five studies in infants have been reported
in sufficient detail for comparison to be made with the present study.
Burman(7t) followed a group of infants from the age of 3 months to the age of 18 months. Children were
allocated alternately to receive either placebo or an oral iron preparation to be taken daily. At one year of
age the mean haemoglobins of the two groups were 11.75 and 11.76 g/dl. There was no difference in
incidence of reported infection. The power of the study was not reported, but it is surely small.
In a similar trial to the present one Andelman and Sered(7) compared the effect of fortification of an inf ant
· milk formula with 12mg Fe/quart with unfortified formula. At one year of age, the mean haemoglobins of
the two groups of infants were 11.9 and 10.4 g/dl respectively and the control group had had significantly
more respiratory infection than the test group. Little information is given on how infections were
diagnosed and no data are provided for other classes of infection.
Cantwell(77) studied the effects of iron dextran in premature infants. The regimen resulted in the control
group having a mean haemoglobin of 9.0 g/dl at 1 year while the iron treated group had a mean
haemoglobin of 11.3 g/ dl. The control group had 39% more admissions than the test group over a 2 year
period of observation. When acute wheezy bronchitis and asthma are excluded, the control group had twice
the number of infection of the test group. Some methodologic problems are noted in chapter 2, but the
study does suggest an aetiological role for iron deficiency in susceptibility to infection.
Mackal285) compared infection rates in iron deficient infants treated with an oral iron preparation to
infection rates in an untreated control group. The control group's mean haemoglobin at 1 year of age was
10.0 g/dl while the treated group attained a mean haemoglobin of 11.3 g/dl. There was a remarkable
relationship between infection rate and iron treatment. In both winter and in summer the test group had
about half the number of infections that the controls experienced .. The relationship continued to hold when ·
the infections were classed as "specific fevers", respiratory infections, gastro-intestinal infections and "other".
A major problem in interpretation was discussed at length by the author viz that the two groups were
studied over different time periods. Even though she presented evidence that, in London, the infant death
rate from infections did not change over that period, this retrospective open study leaves many confounding
factors uncontrolled.
The utility of iron dextran in preventing iron deficiency anaemia in the first year of life was studied by
Oppenheimer et aP43) in Papua New Guinea. The iron-treated infants experienced a significantly
increased incidence of malaria in the first year of life. The incidence of other infections was not discussed.

6.54 IRON NUTRITION AND IMMUNITY
Conclusions
The studies in temperate climates have suggested that iron deficiency predisposes to infection and the
present study, while not reaching statistical significance, shows remarkable ·consistency in the parallel trends
revealed. The sole study from the tropics indicates that iron dextran in young infants increases
susceptibility to malaria.
Figure 6.18 shows the difference in infection rates between the Control and Test groups. For "total
infections" the difference amounts to 56 infections per 100 children per year. These are clinically important
differences with substantial implications for public health. It is important that further studies be made in
order to determine whether this is a chance association or the consequence of improved iron nutrition.
The difficulties such studies will have in attaining adequate statistical power must be noted. The present
study was designed to detect a difference in infection rates of 1 infection per child per year. The sample
size calculations yielded 65 as the minimum number required in each group, assuming that the standard
deviation of infection rate was 2.5. With the . data from the present study it can be estimated that a
minimum of 230 infants would be required in each group to detect a difference of 0.59 in infection rates '
with standard deviations of 2.8 and 3.3.
Besides increasing the number of s_ubjects, steps that future studies could take to increase statistical power
are to follow the subjects for a longer period or to increase the disparity in iron nutrition between the two
groups or use a combination of these manoeuvres in order to improve the statistical power of the trial. The
third option is limited by ethical considerations since gross iron deficiency should be treated and gross iron
excess may be dangerous and should be avoided. The first and second options are limited only by
availability of resources. In tropical areas a special consideration is the increased risk of malaria in iron
sufficient children.

CHAPTER 6 RESULTS: IRON FO~TIFICATION 6.55
Summary of results of'immune function tests
Laboratory and clinical tests of immune function were made in the Test and Control groups. These were
delayed cutaneous hypersensitivity with Candida antigen and PPD, specific antibody response to
immunization with oral polio vaccine and intramuscular tetanus toxoid, leukocyte counts, lymphocyte
subtyping with monoclonal antibodies, lymphocyte stimulation with phytohaemagglutinin, and neutrophil
bactericidal index and incidence of infection. The Test and Control groups had similar results with a clear
trend emerging only for the incidence of infection; in 9 of 10 categories of infection the Test group had a
lower incidence than the Control group.
Each measure of immune function had a relatively wide 95% confidence interval and a low statistical
power. However, the study is definitive in the confidence limits set for the means of the various indices of
immune function and their differences between the two groups. From this analysis it is possible to state, for
example, that the extra iron fortification is unlikely to have reduced the incidence of infection by more than
25% or to have increased it by more than 8%.
In all the immune function tests there is no evidence to suggest that the extra iron was harmful.
The most intriguing results are the rates of infection which consistently favoured the Test group. One may
calculate using the binomial function the probability of obtaining by chance this sort of distribution; it is
· 3.5% *. Although it is tempting to do so, this value of 3.5% may not be taken as equivalent to the "P value"
obtained from a significance test because the calculations rely on the assumption that the various categories
of infection are statistically independent. Current medical knowledge would contradict this assumption.
Defining an association between multiple variables is properly the function of multivariate analysis. The
following section reports the multivariate analyses that were made in seeking an association of iron status
with immune function.
• Of the 10 categories of infection, 8 are statistically independent. The probability of at least 7 of 8 independent categories
favouring the Test group is 11z8 + (8!/7!)*(1/28) = 9/256 = 3.52%

6.56 IRON NUTRITION AND IMMUNITY
The association of iron status with immune function tests
(Multivariate analyses)
Classification of iron status
Introduction
The section above examined the results of the study in relation to the hypothesis that additional iron
supplementation of infant milk formula would lead to improved immune function. The analysis therefore
compared the Control group of infants with the Test group for incidence of infection (in several different
categories of infection) and for performance in a variety of different laboratory measures of immune
function.
This section presents an analysis of immune function tests and the incidence rates of infection when the
study subjects are categorized according to iron status. If iron deficiency depresses immune function and
predisposes to infection then children classed as "iron deficient" should experience more infections and
should have poorer immune function tests than children classed as "iron sufficient".
The statistical procedures involved computing the mean and standard deviation for each variable within
each category of iron status and then calculating the significance level for each pair-wise comparison. The
Bonferroni procedure was used to adjust the significance level for the multiple comparisons made in this
analysis.
The method of classification
There is no scheme of classification of iron status that simply and unambiguously measures the amount
(relative to requirements) of iron available to the tissues, cells and enzymes that need it to perform their
functions. This study made 10 tests that directly reflect the status of iron nutrition·. Five of these were
used to classify (by computer) the status of iron nutrition of each child. The scheme is detailed in the
following section.
Categories of iron status
Most children can be categorized with respect to iron status along the spectrum:- iron replete (Normal),
depletion of iron stores (Depleted), biochemical evidence of iron deficiency (Deficient), and iron deficiency
with anaemia (Deficient and anaemic). With this model of iron metabolism in mind, a classification
system has been drawn up for use in the Department of Paediatrics and Child Health of the University of
Cape Town and is described in tables 6.24 and 6.25. Table 6.24 gives reference values for the variables
employed in allocating a set of results to a particular category of iron status. Table 6.25 gives the decision
• These are: RBC, Hb, HCT, MCV, MCH, MCHC, RDW%, Reticulocyte count, plasma ferritin, and red cell ZPP.

CHAPTER 6 RESULTS: IRON FORTIFICATION 6.57
criteria to be satisfied for each category. For example, a childdassi.fied as Normal will have a haemoglobin
greater than 11.0 g/dl, plasma ferritin more than U ug/dJ and at least two of the following criteria true:
mean cell volume greater than 70 fl, mean cell haemoglobin greater than 23 pg, and red cell zinc
protoporphyrin less than 3.5 ug/ di.
Some children do not fit into the categories of iron status defmed above and must be classed as
Normochromic normocytic anaemic or placed in the Unclassified category. This may be because of normal
biological variation or because of some abnormal condition affecting the variables used for categorization.
For example, a number of infants with normal levels of ferritin have a normochromic normocytic anaemia
(one of the causes of which may be the effects of infection(439). Their iron stores are probably normal, but
they need to be kept in a separate group when associations of iron status with immune function tests are
sought. A substantial number of children have tests of ·iron status with conflicting interpretations. There
are several reasons for this, for example thalassaemia and haemoglobinopathies that occur in 10% of Cape
Coloured children with a mean cell volume less than 65 n<39), and these will not be further mentioned. This
group of children also needs to be kept separate when seeking relationships with iron status.
Table 6.24
TEST
Reference values used in the classification of iron status of 1 year old infants.
Haemoglobin(Hb)
Ferritin(FRTN)
Mean cell volume (MCV)
Mean cell haemoglobin (MCH)
Zinc protoporphyrin (ZPP)
REFERENCE VALUE
>11.0 g/dl
>12.0 ug/1
>70.0 fl
>23.0 pg
<3.5 ug/g

6.58 IRON NUTRITION AND IMMUNITY
Table 6.25 Criteria for the classification of iron status in 1 year old infants. Reference values for the application of these decision criteria are given in table 6.24.
IRON STATUS CRITERIA FOR CLASSIFICATION Hb FRTN > 1 of: MCV, MCH & ZPP
Normal
Depleted
. Deficient
Deficient and anaemic
Unclassified 1
Unclassified 2
Unclassified 3
Normochromic normocytic Anaemia
y
y
y
N
y
N
N
N
y
N
N
N
y
y
N
y
y
y
N
N
N
y
y
y
Notes Yin the table indicates that the criterion in that column has to be satisfied for the category named in that row. N in the table indicates that the criterion in that column has to be NOT attained for the category named in that row. For example, a child with normal iron status has an Hb at least 11 g/dl, plasma ferritin at least 12 ug/1 and at least 2 of
MCV, MCH and ZPP satisfying their respective criteria.
Association of iron status with immune function
Introduction
Table 6.26 summarizes the results from computing the mean for each group of the infants according to iron
status. Statistical tests included the t test. As none of the tests were significant (less than 5%) the P values
are not included in the table. The results become difficult to interpret in this type of analysis because the
number within a group becomes small. However, trends are apparent that are in keeping with the analysis
in the main body of the report and that lend support to the hypothesis that deficient iron status is causally
related to poor immune function.
Incidence of infection - Normal iron status
. Within the Normal group, in 9 of 10 categories of incidence of infection the infants in the Test group had
lower rates of infection that those in the Control group - see tables 6.26 and 6.27. Tables 6.29 and 6.30
show that of 10 measures of iron status, all except mean cell haemoglobin and mean cell haemoglobin
concentration indicated better iron nutrition in the Test group.

CHAPTER 6 RESULTS: IRON FORTIFICATION 6.59
Incidence of infection • Normochromic normocytic group
In 7 of the ten categories of infection, the group categorized as Normochromic normocytic anaemic had
more infections than the Normal group. This group presumably had normal body iron stores as their
mean plasma ferritin was (by definition) at least 12 ug/I. The results are consistent with previous
observations(439) that chronic infection blocks the transport of iron to erythrocytes·.
Incidence of infection
Comparison between between categories of iron status
The trend of fewer infections with better iron nutrition is best shown when the Total number of infections is
considered. For Test and Control groups combined, the class with Normal iron status had a lower
incidence of infection than each of the categories of iron deficiency. 'A suggestion of a trend to more
infections with increasing iron deficiency is also apparent. The numbers of children classified as Depleted,
Deficient and Deficient and anaemic are small, 8, 7 and 8 respectively, compared to the 69 iron sufficient
children.
* The results are also consistent with other hypotheses, eg that anaemia per se predisposes to infection. But it is not the intention
here to become in the philosopher's problem of induction so other theories are not discussed.

6.60 IRON NUTRITION AND IMMUNITY
Table 6.26 Incidence of infection by severity according to the category of iron status. Incidence is tabulated as the number of infections per infant per year. The number of infants in each sub-group is shown in parentheses.
IRON STAT/JS: NORMAL DEPLETED DEFICIEN'l' DEFICIENT UNCLASSI NORHO-
& ANAEllIC -FIED CHR./CYT
SEVERITY OF INFECTION
MINOR Control 2.09 4.76 1.02 1.73 2.65 1.38
(25) (6) (7) (6) (13) (4) Test 1.82. 1.84 0 2.20 3.63
(44) (2) (O) (2) (13) .(4) All 1.92 4.03 1.02 1.30 2.42 2.51
MOOERATE Control 6.02 3.31 10.0 · 6.01 5.87 8.63
(25) (6) (7) (6) (13) (4) Test 5.26 6.32 7.72 5.18 7.22
(44) (2) (O) (2) (13) (4) All 5.54 4.06 10.00 6.43 5.52 7.90
SEVERE Control 0.15 0.30 0.26 0.58 0.29 1.35
(25) (6) (7) (6) (13) (4) Test 0.12 0.92 0 0.28 0.91
( 44) (2) (O) (2) (13) (4) All 0.13 0.45 0.26 0.43 0.28 1.13
TOTAL INFECTIONS Control 8.26 8.37 11.27 8.31 8.81 11.36
(25) (6) (7) (6) (13) (4) Test 7.20 9.0 7,72 7.66 11.77
( 44) (2) (O) (2) (13) (4) All 7.58 8.55 11.27 8.16 8.23 11.56
Notes The t tests for statistical significance employed the 8onferroni adjustment for nult1ple comparisons. No P values were as small as 5%.

CHAPTER 6 RESULTS: IRON FORTIFICATION 6.61
Table 6.27 Incidence of infection by type according to the category of iron status. Incidence is tabulat.ed as the number of infections per infant per year. The number of infants in each sub-group is shown m parentheses.
IRON STATUS: NORMAL DEPLETED DEFICIENT DEFICIENT UNCLASSI NORH.0-
ANAEK!C -FIED CHR/CYT TYPE Of INFECTION
CONJUNCTIVITIS Control 0.43 0.30 1.03 0.29 0.27 0.46
(25) (6) (7) (6) (13) (4) Test 0.29 0.92 1.73 0.55 o.o
( 44) (2) (O) (2) (13) (4) All 0.34 0.46 1.03 0.65 0.41 0.23
OTHER INFECT! ONS Control 0.22 0.58 0.60 0.29 0.42 1.35
(25) (6) {7) (6) (13) (4) Test 0.20 0 0 0.27 0.43
( 44) (2) (O) (2) (13) ' (4) All 0.21 0.44 0.60 0.22 0.34 0.89
PYODERMA Control 0.40 o.o 2.01 o.o 1.16 1.35
{25) (6) (7) (6) (13) (4) Test 0.73 o.o 0.85 0.135 0
( 44) (2) (O) (2) (13) (4) All 0.59 0 2.01 0.21 0.65 0.68
THRUSH Control 0.80 0.60 1.76 · 0.58 0.29 · 0.46
(25) (6) (7) (6) {13) ( 4) Test 0.56 4.50 0.85 0.28 0.0
( 44) (2) (0) (2) (13) (4) All 0.65 1.58 1.76 0.65 0.28 0.23
GASTROENTERITIS Control 1.52 0.59 0.51 1.46 1.67 3.2
(25) (6) (7) (6) (13) (4) Test 1.21 0.89 2.56 0.95 3.12
(44) (2) (O) (2) (13) (4) A 11 . 1.33 0.67 1.73 1.31 3.16 0.60
RESPIRATORY TRACT INFECTION Control 2.76 1.52 1.79 3.96 2.36 3.62
(25) (6) (7) (6) (13) (4) Test 2.27 0.92 1.73 3.0 4.58
(44) (2) (0) (2) (13) (4) All 2.45 1.37 1.79 3.4 2.68 4.1

6.62 IRON NUTRITION AND IMMUNITY
Table 6.28 Immune function indicators compared between categories of iron status. The number of infants in each sub-group is shown in parentheses
IRON STATUS: NORMAL DEPLETED DEFICIENT DEFICIENT UNCLASSI NOR.MO-
ANAEMIC -FIED CBR./CY'r
OKT4/0KT8 RATIO Control 2.25 3.71 2.56 2.13 2.66 2.45
(22) (6) (7) (6) (11) (4) Test 2.52 1.06 3.20 2.23 2.07
(44) (2) {O) (2) (13) (4) All 2.43 3.05 2.56 2.40 2A2 2.26
PHA STIMULATION (Percentage of adult control) Control 61 94 162 84 122 106
(11) (2) (3) (1) (4) (2) Test 153 119 110 117
(25) (2) (0) (0) (7) (2) All 155 107 162 84 114 111
BACTERICIDAL INDEX (Percentage of initial inoculum surviving at 1 hour) Control 103 115 67 118 100 185
(9) (4) (3) (4) (7) (1)
iest 90 63 70 98 (18) (0) (O) (1) (5) (2)
All 94 115 67 107 87 127
CANDIDA SKIN TEST (nm induration) Control 5.96 11.37 13.0 13.5 10.00 0.25
(23) (6) (7) (6) (13) {4)
Test 13.5 13.50 19.0 7.70 4.5 (42) (2) (0) (2) (13) (4)
All 8.45 11.88 13.0 14.88 8.85 2.38
MANTOUX TEST (nm induration) Control 6.48 6.67 11.57 6.33 9.46 9.25
(23) (6) (7) (6) (13) (4) Test 7 .81 11.50 LOO 3.83 8.25
· (42) (2) (0) (2) (12) (4) All 7.34 7 .87 11.57 5,00 6.76 8.75
TETANUS ANTIBODY TITRE (titre) Control 2.03 l.87 1.86 2.06 2.05 1.66
(25) (6) (7) (6) (11) (4) Test 1.98 1.61 0.95 1.89 1.54
(44) (2) (O) (2) (13) (4) All 2.00 1.80 1.86 1.80 1.96 1.60
POLIO ANTIBODY TITRE (titre) Control 1.62 0.98 1.66 1.40 L60 1.71
(21) (6) (7) (6) (1) (3) Test 1.69 1.61 1.76 1.68 1.62
(40) (1) . (O) (2) (12) (4) All 1.66 1.07 1.66 LSO 1.64 1.66

CHAPTER 6 RESULTS: IRON FORTIFICATION 6.63
Tests of immune function
Comparison between categories of iron status
Results of the laboratory tests of immune function are summarized in table 6.28 for each category of iron
status. The tests of leukocyte function, PHA stimulation and bactericidal assay, both show a trend towards
"better" (i.e. more active) performance in the classes with better iron nutrition. The opposite trend is
evident in the delayed hypersensitivity test with Candida antigen. The Mantoux test shows no clear trend.
The ratio of Helper cells to Suppressor cells (OKT4/0KT8 ratio) does not vary much between the various
categories. The specific antibody levels to polio and to tetanus both showed a trend to a ''better" (higher)
response to immunization in the infants with more satisfactory iron nutrition. Although the trends are not
statistically significant, these results not only tend to support the hypotheses of the study, but offer no
evidence of harmful effects from iron supplementation of infant milk formulas.
These trends should be interpreted even more cautiously than for the trends indentified in the comparison
between the Test and Control groups for not only was no difference statistically significant according to the
t test, but the confidence limits are wider and statistical power less than for the corresponding comparison
reported in the previous section.
Measures of iron nutrition
Comparison between between categories of iron status
Tables 6.29 and 6.30 give the mean values of those tests that reflect iron status. The results are shown to
facilitate comparison with other studies and to illustrate the claims implied by the classification scheme.
For example, from the description of the way in which the classification scheme was employed it may not be
immediately apparent that the infants falling into the group called Nonnochromic nonnocytic were indeed
normochromic-normocytic anaemic children. Inspection of table 6.29 and comparison with the Nonna/
group for MCH, MCV and Hb will confirm this.
From a clinical point of view it is interesting to note the proportions in the various categories of iron status.
Table 6.29 shows that only 25% of the Control group were iron replete but that 68% of the Test group fell
into this category. The proportions classed as Nonnochromic nonnocytic or Unclassified were similar for
the two groups; about 7% and 21 % respectively. This analysis clearly demonstrates the efficacy of the
extra iron fortification in preventing iron deficiency.

6.64 IRON NUTRITION AND IMMUNI1Y
Table 6.29 Mean values of haematologic parameters compared between the categories of.iron status.
IRON STATUS: NOR.HAL DEPLETED DEFICIENT DEFICIENT UNCLASSI NOR.HO-
·ANAEMIC -FIED cBR/CYT
RED CELL COUNT (1012/1) Control 4. 73 5.01 5.23 4.72 4.98 4.42 Test 4.86 4.59 4.90 s~2a 4.28 All 4.8 4.91 5.23 4.76 5.13 4.35
HAEMOGLOBIN (g/dl) Control 11.92 12.70 11.34 10.13 11.04 10.70 Test 12.23 U.85 10.85 11.12 10.64
· A11 12.12 12.49 11 •. 40 10,31 11.08 10.67
HAEMATOCRIT (%) Control. 35.68 38.43 35.03 31.68 33 • .70 32.45 Test 36.72 36.10 32.80 34.43 31.42 All 36.34 37.85 35.03 31.96 34.07 31.94
MEAN CELL VOLUME (fl) Control 75.38 76.52 67.09 67.12 67.73 73.35 Test 75.59 78.56 66.90 65.23 73.30 All ·75.52 77.02 67.09 67.06 66.48 73.32
MEAN CELL HAEMOGLOBIN (pg) Control 25.22 25.35 21.86 21.48 22.24 24.17 Test 25,20 25.85 22.23 21.12 24,82 All 25.21 25.47 21.86 21.67 21.68 24.50
MEAN CELL HAEMOGLOBIN CONCENTRATION (ug/dl) Control 33.41 33.13 32.54 31.98 32.80 32.95 Test 33.32 32.95 33.20 32.37 33.85 All 33.35 33.09 32.54 32.29 32.58 33.40
RED CELL DISTRIBUTION WIDTH(%) Control 14.50 14.13 16.59 17.18 16.48 16.67 Test 13.87 14.30 14. 70 16.20 14.90 All 14.10 14.17 16.59 16,56 16.34 .15.79
RETICULOCYTE COUNT(%) Control 2.06 1.38 1.30 1.38 1.79 0.72 Test 1.79 1.55 1.55 2.09 1.37 A 11 1.89 1.42 1.30 1.42 1.94 1.05
NUMBER{%) Control 25 (41) 6 (10) 7 (ll) 6 (10) 13 (21) 4 (7)
Test 44 (68) 2 ( 3) 0 ( 0) 2 ( 3) 13 (20) 4 (6) All 69 (55) 8 ( 6) 7 ( 6) 8 ( 6) 26 (21) 8 (6)

CHAPTER 6 RESULTS: IRON FORTIFICATION 6.65
Table 6.30 status.
Non-haematologic indicators of iron status compared between the categories of iron
IRON STATUS: . NORMAL DEPLETED DEFICIENT DEFICIENT UNCLASsI· NORNO-
ANAEMIC -FIED CHR./CYT FERRITIN1 (ug/dl) Control 28.2 7.6 4.5 6.8 23.4 37.2 Test 31.6 8.5 2.63 30.2 41.1 All 30.9 7.8 4.5 6.0 26.9 39.8
RED CELL ZINC PROTOPORPHYRIN (ug/g Hb) Control 3.43 3.30 4.69 5.60 4.23 3.45 Test 3.11 2.80 4.00 4.35 3.35 All 3.22 3.17 4.69 5.37 4.30 3.40
NUMBER Control 25 6 7 6 13 4 Test 44 2 0 2 13 4 All 69 8 7 8 26 8
1 Log(ferritin) was used in the calculations.

6.66 IRON NUTRITION AND IMMUNITY
Multiple linear regression The relation of iron status to immune function was analyzed by multiple linear regression (MLR). Multiple
linear regression is a mathematical technique for quantifying the "contribution" one variable makes to its
association with another parameter. "Input" or predictor parameters are known as independent variables
and "output" or predicted variables are called dependent variables. The multiple linear regression technique
allows for more than one input variable and/or more than one dependent variable. The result of an
analysis includes a set of coefficients of the dependent variables, a constant and a set of P values from
significance tests of the coefficients. The analyses were all made with the BMDP suite of programi126).
Many analyses were made and two sets were chosen to illustrate the kind of results that were obtained.
Table 6.31 shows the coefficients when the independent variables were incidences of the various categories
of infection. The dependent variables were study group, haemoglobin and iron status. Each dependent
variable was subject to a separate investigation. Haemoglobin was chosen as an indicator of iron status for
obvious reasons.
Study group was selected in order to quantify the association with infection. To _perform the multiple linear
regression a numerical value must be given to categorical variables such as group. The value of O was
assigned to the Control group and 1 to the Test group. The values are arbitrary and unimportant except in
their relation to one another. These values were chosen so that a positive coefficient would indicate that its
variable is likely to have higher values for the Test group.
For similar reasons, values of 1, 2, 3, and 4 were given to the categories of iron status Nomial, Depleted,
Deficient, and Deficient and anaemic. Again, variables with positive coefficients are more likely to have
higher values with iron deficiency. ·
Table 6.31 is difficult to interpret as the numerical values have no immediate intuitive interpretation. The P
values are not shown since no coefficient was statistically significant. To aid in the interpretation of the
table the trends shown by the multiple linear regression analyses are summarized in table 6.33. If a variable
supports the hypothesis that iron deficiency is associated with increased susceptibility to infection an entry
of Y is found in the table. If the variable does not support the hypothesis an entry of N is made.
A slight tendency for infections to be increased in iron deficiency and decreased with extra iron fortification
of infant milk formula is thus revealed by table 6.33.
A similar set of analyses was made for the laboratory indicators of immune function and infection rates as
predictors of iron status·. The results are tabulated in table 6.32 and the trends analyzed in table 6.34. No
• These analyses omit PHA and bactericidal indices because they were made for separate halves of the study population. No child
had both tests made. It is therefore not possible to include both together in an multiple linear regression analysis.

CHAPTER 6 RESULTS: IRON FORTIFICATION 6.67
variable was statistically significantly associated with iron status. Overall, there is a slight tendency for the
study's hypotheses to be supported.
Table 6.31 Multiple linear regression (MLR) analysis of association of iron status with incidence of infection. The regression coefficients are tabulated for three separate analyses with incidences of infection as independent variables and with the dependent variables being the group code1, haemoglobin concentration and code for iron status2•
INDEPENDENT DEPENDENT VARIABLES VARIABLES GROUP HAEMOGLOBIN FE STATUS
Grade 1 -0.05 0.02 -0.02 Grade 2 -0.05 Grade 3 -0.09 -0.21 0.45 Thrush -0.63 -0.09 0.08 Conjunctivitis · -0.004 -0.15 0.20 Gastroenteritis 0.03 -0.01 Respiratory Infection -0.04 -0.003 0.03 Pyoderma 0.005 0.06 0.01 Other -0.035 0.001 -0.03
Notes 1 Group codes were: 0 = Control, 1 = Test
2 Iron status codes were: 0 = Normal, 1 = Depleted, 2 = Deficient, 4 = Deficient anaemic 3 A blank entry in the table is made for variables whose contribution to the MLR was minimal
4 No coefficient reached statistical significance (P < 5%)

6.68 IRON NUTRITION AND IMMUNITY
Table 6.32 Multiple linear regression (MLR) analysis of association of iron status with indicators of immune function. The regression coefficients are tabulated for three separate analyses with indicators of immune function as independent variables and with the dependent variables being the group code1
,
haemoglobin concentration and code for iron status2.
INDEPENDENT DEPENDENT VARIABLES VARIABLES GROUP HAEMOGLOBIN FE.STATUS
B Cells 0.01 ·0.002 .0.001 Mantoux -0.001 -0.01 0.001 Candida test 0.002 -0.005 0.03 Grade 1 -0.03 0.04 -0.02 Grade 2 -0.07 0.03 Grade 3 -0.08 -0.23 0.43 Thrush -0.06 -0.07 Conjunctivitis -0.01 -0.13 0.10 Gastroenteritis 0.04 0.01 -0;05 Respiratory Infection -0.03 0.03 0.008 Pyoderma 0.02 0.09 -0.0005 Other -0.08 -0.07 Tetanus titre 0.0001 -0.0001 .Q.0001 Polio titre 0.002 0.002 -0.0008 T4/T8 ratio 0.03 -0.02 0.03
Notes 1 Group codes were: 0 = Control, 1 = Test
2 Iron status codes were: 0 = Normal, 1 = Depleted, 2 = Deficient, 4 = Deficient anaemic
3 A blank entry in the table is made for variables whose contribution to the MLR was minimal
4 No coefficient reached statistical significance (P < 5%)
Table 6.33 Trends shown by the multiple linear regression analyses (MLR) in table 6.31. The trend shown by the coefficient of the independent variables is indicated by a Y if it supports the hypothesis of iron deficiency increasing susceptibility to infection. An N indicates that the MLR does not support the hypothesis.
INDEPENDENT DEPENDENT VARIABLES VARIABLES GROUP HAEMOGLOBIN FE STATUS
Grade 1 y N Grade 2 y Grade 3 y y y Thrush y y y Conjunctivitis y y y Gastroenteritis N Respiratory Infection y y y Pyoderma N N y Other y N TOTALS Q i 2 .l 2
Notes 1 Group codes were: 0 = Control, 1 = Test
2 Iron status codes were: 0 = Normal, 1 = Depleted,.2 = Deficient, 4 = f)eficient anaemic
3 A blank entry in the table is made for variables whose contribution to the MLR wai; minimal
4 No coefficient reached statistical significance (P < 5%)
N
N
N .l

CHAPTER 6 RESULTS: IRON FORTIFICATION 6.69
Table 6.34 Trends shown by the multiple linear regression analyses (MLR) in table 6.32. The trend shown by the coefficient of the independent variables in indicated by a Y if it supports the hypothesis of iron deficiency depressing immune function. An N indicates that the MLR does not support the hypothesis.
INDEPENDENT DEPENDENT VARIABLES VARIABLES GROUP HAEMOGLOBIN FE STATUS
B Cells y N y Mantowi: N N Candida y N y Grade 1 y N Grade 2 y y Grade 3 y y y Thrush y y Conjunctivitis y y y Gastroenteritis N N Respiratory Infection y N y Pyoderma N N Other y Tetanus titre y N y Polio titre y y y T4/T8 ratio y N TOTAL 11 z ~ 2 ~
Notes 1 Group codes were: 0 = Control, 1 = Test
2 Iron status codes were: 0 = Normal, 1 = Depleted, 2 = Deficient, 4 = Deficient anaemic
3 A blank entry in the table is made for variables whose contribution to the MLR was minimal
4 No coefficient reached statistical significance (P < 5%)
Summary
N-
N
N
N N
N Q
One hypothesis that motivated the present study was that iron deficiency depresses immune function.
Confirmation of this was sought by comparing tests of immune function in infants categorized with respect
to iron status as Normal, Depleted, Deficient and Deficient with anaemia. Confirmation of the hypothesis
was also sought by multiple linear regression analysis. Both analyses identified weak trends that supported
the theory.
Discussion and conclusions
The literature review failed to reveal any similar analyses in comparable trials. The design of the study
created a relatively homogeneous set of subjects. This ensured that the confounding influences of
malnutrition and serious illness were eliminated. It also resulted in most infants having better iron status
than their peers as documented by Kirsten et al241) and discussed above. The trial could therefore only
test the hypothesis for mild degrees of iron deficiencies. It may be concluded that mild iron deficiency does
not have a major detrimental effect on immune function and resistance to infection.

6.70 IRON NUTRITION AND IMMUNITY
Risks of increased iron fortification of milk formula
Introduction
The third · question addressed by the trial was the safety of increased iron fortification of infant milk
formula. The evidence for and opinion on untoward effects of iron fortification were reviewed in chapter 2.
Although unlikely, the risk most feared is of increasing susceptibility to infection by upsetting the host
parasite competition for iron. It was shown above that the Test group had fewer infections than the Control
group in all categories except respiratory illness for which the difference was minimal. In particular, the
Test group had fewer episodes of diarrhoeal disease.
It may thus be concluded that increased iron fortification is safe and poses no significant risk of increasing
susceptibility to infection.
At the start of the trial mothers were closely questioned about the acceptability of the formula. No mother
noticed any abnormal colour or taste in the milk and no mother attributed colic., fussiness or change in
bowel habits to the formula. The control and test formulas were indistinguishable by both mothers and the
research team.
The increased iron fortification was, it may be concluded, acceptable from the consumer's point of view.
More important effects of iron fortification are on zinc absorption and growth. These are discussed in the
following 2 sections.
Indicators of zinc status
Results
The zinc status of the Test and Control groups is compared in table 6.36. Plasma zinc concentration is
significantly lower in the Test group than in the Control group at the end of the trial. Hair zinc follows the
same trend, but the difference is far from being statistically significant.

CHAPTER 6 RESULTS: IRON FORTIFICATION
Table 6.36 Zinc status compared in the Control and Test groups
Specimen
AT 3 MONTHS ·oF AGE Plasma
(ug/1)
Hair (ug/g)
AT 1 YEAR OF AGE Plasma
Change in plasma (ug/1)
Hair
Change in hair (ug/g)
Cont:rol
Hean
Test;
Hean
91.16 85.64
224. 02 261. 31
90.61 83.53
-0.90 -3.32
142.30 129.21
-93.94-161.39
Notes P values were calculated from student's t test. 95% CI~ 95% confidence intervals.
p
Value
15%
32%
5%
64%
54%
27%
95i CI of diff.
of means
-13.03 1.99
-37.61 112.19
-14.27
-12.50
0.12
7.68
..:.s4.92 20.14
-187.81 52.90
6.71
Power
Obs 10%
30 64
0 0
49 66
0 0
0
30
0
0
Changes are reported as the mean of the variable at 12 months minus the mean value at 3 months. The statistical power of the study was detennined for both the observed difference (Obs) and a 10% difference (10%) from the combined mean for a type I error probability of 5%.

6.72
Figure 6.19
Figure 6.20
u 9 I I
CONTROL
IRON NUTRITION AND IMMUNITY
P L A S M A Z I N C
TEST DIFFERENCE
Plasma zinc concentrations for the Test and Control groups at 12 months or age·
u 9 I g
CONTROL
HAIR ZINC
TEST DIFFERENCE
Hair zinc concentrations for the Test and Control groups at 12 months of age
• The bars represent the means and the vertical lines through the bats represent the 95% confidence intervals
CHAPTER 6 RESULTS: IRON FORTIFICATION 6.73
Discussion
These results were anticipated since similar associations with iron fortification have been found in other
studiesC138>, although others have failed to confirm the competition between iron and zinc for
absorption< 480).
The trend shown by the hair results concurs. with the conclusion drawn by Hambidge that hair analyses are
of limited worth<186>. It may not be clinically worthwhile to use hair zinc content as an index of body zinc
status, but for population studies where blood samples are impractical it might yet prove to be a useful tool
to measure long term effects.
A note of caution should be added to the above inferences since the Test group had a substantially lower
mean serum zinc at the start of the trial. This may indicate some imbalance in selection of the two groups,
but the difference in zinc concentration widened during the study. As similar studies have shown that iron
interferes with the absorption of zinc, the likelihood is increased that the initial difference was spurious.
In view of these results, future studies of increased iron fortification should maintain the molar ratio of iron
to zinc at the level commonly used in commercial milk formulas, ie 2.8 mol Fe/mol Zn.

6.74 IRON NUTRITION AND IMMUNI1Y
Measures of growth and nutrition
Results
At 1 year of age the infants of the Test group were taller and heavier than those of the Control group.
Table 6.37 shows that this trend is followed by other measures of growth, viz increase in weight, increase in
length, standard deviation scores for weight and length and the increases in the standard deviation scores.
Head circumference alone does not favour the Test group. No differences are statistically significant, but
the increase in weight has a P value of 7%.

.CHAPTER 6 RESULTS: IRON FORTIFICATION 6.75
Table 6.37 Nutritional status and growth compared in the Control and Test groups.
Nut:ri t:ional Control Test; p 95% CI of di.ff. Power
Vari.able Hean Hean Value of means Obs 10%
AT BIRTH Weight 3.41 3.37 40% -0.14 0.06 14 99
(Kg) SD score weight 0.36 0.28 51% -0.31 0.16 0 0
AT 3 MONTHS OF AGE Weight 6.06 6.04 82% -0.23 0.18 0 99
(kg) . Length 59.13 59.12 97% -0.67 0.64 0 100
(Cm) Head circumference 40.71 40.36 10% -0.75 0.07 37 100
(Cm) SD score weight 0.48 0.51 75% -0.18 0.25 0 0
SD score length -0.42 -0.31 31% -0.11 0.33 18 0
AT 1 YEAR OF AGE Weight 10.09 10.33 24% -0.16 0.64 22 99
Increase in weight 4.00 4.29 7% -0.03 0.62 43 71 (Kg)
Length 74.74 75.23 27% -0.38 1.37 20 100
Increase in length 15.45 16.01 17% -0.24 1.36 28 96 (Cm)
Head circumference 46.71 46.54 44% -0.60 0.26 12 100 (Cm)
SD score weight 0.23 0.48 20% -0.13 0.63 26 0
Change in SD score -0.25 -0.03 16% -0.09 Q;53 29 0
SD score length -0.13 0.06 20% -0.11 a.so 25 0
Change in SD score 0.25 0.32 58% -0.18 0.31 0 0
Notes P values were calculated from student's t test. 95% CI= 95% confidence intervals. Changes are reported as the mean of the variable at 12 11Dnths minus the mean value at 3 months. The SD score is the mean of standard deviation scores calculated from NCHS tables The statistical power of the study was detennined for both the observed difference (Obs) and a 10% difference (10%) from the combined mean for a type I error probability of 5%.

6.76
Figure 6.21 . age
Fig1.,1re 6.22 age
IRON NUTRITION AND IMMUNITY
U E I G H T S D S C O R E
CONTROL TEST DIFFERENCE
Mean weight standard deviation scores for the Test and Control groups at 12 months of
L E N G T H S D S C O R E
CONTROL TEST DIFFERENCE
Mean length standard deviation scores for the Test and Control groups at 12 months of
• The bars represent the means and the vertical lines through the bars represent the 95% confidence intervals

CHAPTER 6 RESULTS: IRON FORTIFICATION 6.77
Discussion
Head growth in infants is preserved in severe malnutrition and is a poor indicator of general nutrition. It is
also difficult to measure head circumference as accurately as weight and length. This is reflected in the
relatively larger standard deviation, larger P value and lower power of the head measurements compared
with those of the other growth indices.
In summary, the administration of extra iron to the Test group was associated with improved growth as
measured by length and weight and this almost reached statistical significance.
Discussion and conclusions
The foregoing sections showed that the increased iron fortification was safe and acceptable, but that it was
associated with decreased zinc levels in plasma and hair. Future trials of iron fortification should maintain
the Fe:Zn molar ratio at about 2.8 and should monitor the effect on the absorption of other divalent metals.


Lessons should be drawn from · our experience of what
diets are best for men in health
Hippocrates
Regimen in Acute Disease
Circa 400 BC


CHAPTER 7 CONCLUSIONS AND RECOMMENDATIONS
Introduction
This thesis describes a clinical trial of an infant milk formula with 40 mg iron per 100 g which was
compared with a conventional formula which had 8.3 mg iron per 100 g. The problem addressed by
this study was articulated as 3 questions in the introductory chapter:
Does increasing the level of iron fortification of conventional infant milk formula
improve the iron nutrition of normal infants fed on the formula?
Does increased iron fortification of infant milk formula alter immunity as reflected by
incidence of infection and laboratory tests of immune function?
Are there any harmful effects of increasing the quantity of iron in conventional inf ant
milk formula?
In short, the present study suggests that the answers to these questions are:
1 Increasing the level of iron fortification does improve the iron nutrition of normal inf ants fed
on the formula. But, this is to such a small amount that increased iron fortification on its
own is not a practical method of combating iron.deficiency.
2 Increased jron fortification of infant milk formula does not alter immunity. However, this is
not surprising in view of the small difference in iron status created by the manipulation of
iron fortification.
3 The increased quantity of iron in the milk formula has no harmful effects. In particular,
there was no suggestion of an increased susceptibility to infection or to diarrhoeal disease.
However, a depression of zinc status was observed in the infants who conswned the milk
with increased iron and this is potentially harmful.
These conclusions are amplified in the following sections and a number of recommendations are made
for further investigations.
Possible confounding factors
The trial of the infant milk formula controlled rigorously for factors which have confounded the
interpretation of most previous studies of the role of iron in infection and immunity. The children were
selected on the grounds of good health and excellent nutrition. That they maintained this throughout

7.2 IRON NUTRITION AND IMMUNITY
the study may be partly due to the milk formula which was granted to the families, and partly due to
the selection of children from better home environments.
Possible confounding factors which may not have been controlled by the stratified allocation procedure
were indicated by non-significant trends in completion rate, weaning, and introduction of solid foods.
All these factors could weigh in the Test group's favour when considering indices of iron nutrition,
measures of immune function or risks of increased iron fortification.
However the weight that should be assigned to these possible confounding influences is limited by
several methodological weaknesses. In the subsidiary surveys, ages were calculated from the mother's
recollection of events and recorded in months rather than decimals of a year. Also, age of introduction
of a food item is likely to be a poor proxy for quantity of food ingested and it gives no indication
whether or not the food was consumed with milk formula.
The effect of increased iron fortification on iron status
In the planning stage of this project, it seemed from the results of other studies of fortification of infant
milk formula that an increase of iron by a factor of almost 5 would have a marked effect on iron status
of infants offered the formula. It was known that ascorbic acid was an important factor in enhancing
the bioavailability of iron in milk formulas, but it was not suspected that the eventual availability of iron
in the Test formula would be of the order of magnitude of 1 %. Or, to express this finding more
dramatically, the bioavailability of the extra iron in the Test formula was about 0.02%.
The derivation of these estimates of iron absorption is outlined in Table 7.1. Because of the difficulty
in estimating storage iron from serum ferritin ( or body weight) in infancy these calculations assume
that storage iron is constant. This should not, however, alter the conclusions which are drawn about
the unexpectedly low bioavailability of iron in the Test formula.

CHAPTER 7 CONCLUSIONS AND RECOMMENDATIONS 7.3
Table 7.1 Absorption of iron in Control and Test groups calculated from the changes in weight and haemoglobin levels at the start and end of the trial. Storage iron is assumed constant.
CONTROL
3MONTHS Age (months) 2.96
Hb (g/dl) 11.28 Wt (kg) 6.06
Fe in Hb (mg) 18735 12 MONTHS
Age (months) 11.81 Hb (g/dl) 11.49
Wt (kg) 10.09 Fe inHb (mg) 317.86
Change in Hb Fe (mg) 130.52 Fe absorbed (mg/day) 0.291
Fe in 500 ml formula ( mg) 5.98 % Fe absorbed 4.87
% extra Fe absorbed
TEST
·2.90 11.38 6.04
188.13
11.86 11.85 10.34
335.81
147.69 0.295
28.83 1.02 0.02
CONVERSION FACTORS 80 ml blood/kg body weight 0.03425 mg Fe/g Hb
100*(0.295-0.291)/(28.83--5.98)
The present study indirectly confirms the importance of the ratio of ascorbic acid to iron in assuring
that iron in infant milk formula is available for assimilation. Until further work allows more definitive
recommendations to be made it would seem advisable to set the molar ratio of ascorbic acid to iron in
cow's milk based infant formulas to at least 1.4:1 (the ratio in the Control formula in the present
study), and perhaps as high as 4:1 as recommended by Gillooly et aP94).
The low bioavailability of the iron in the fortified milk was a surprising fmding in view of previous
measurements of absorption of iron from cow's milk formulas without added ascorbic acid. These
have ranged from 2.9% to 19%<125•
136• 334
• 418
• 434
• 438
• 482
). Until now it has been generally accepted as
Cook and Bothwell state that, while milk does not promote iron absorption, it has significantly less
inhibitory effects than infant cereals or solid foods(l04).
The present study did not make a direct measurement of the absorption of iron from the infant milk
formulas and it did not determine the quantities of milk and supplementary foods in the diet. These
are two investigations that should be made in order to learn the availability of iron in fairly large
concentrations in infant milk formula and to determine the effect of supplementary foods on the
bioavailability of iron in infant milk formula and eventual iron status. This is particularly important in
view of the contrast between the eventual iron status of the infants in the present study with those in
similar studies elsewhere. For example, on the one hand, infants in a study in Helsinki who were fed
on unfortified infant milk formula attained an excellent state of iron nutriture<432). While on the other

7.4 IRON NUTRITION AND IMMUNITY
hand, although the Control infants in the present study were given a formula fortified with both iron
and ascorbic acid, they reached substantially lower levels of iron nutrition than infants in the USA who
were offered a similar formulaC7• 323).
In categorizing the iron status of the infants in the present study it was noted that at the age of 1 year
they had unusually low levels of mean red cell volume in comparison with reference standards. It
would have been useful in assessing the likely reasons for · this discrepancy if the prevalences of
thalassaemia, thalassaemia trait and the various haemoglobinopathies had been determined for the
community studied. A study has been made of the prevalence of such genetic disorders in patients at
the Red Cross War Memorial Childrens Hospital who have a mean cell volume less than 60 fl. This
work needs to be extended to an unselected population.-
The relative utility of the several indicators of iron status has not been clearly determined. A useful
study would be to determine these indicators before and after a therapeutic trial ( as Dailman et ai<123)
have done) and then compare the predictive value of each indicator with the predictive value of every
other indicator.
The effect of increased iron fortification on immunity
The results of the study on the effect of increased iron fortification on immunity (as measured by
several laboratory tests and incidence of infection) was inconclusive because of the small increase in
iron status in the Test group.
Although not statistically significant, an intriguing finding was that the infants in the Test group had
fewer infections than those in the Control group. This relationship held for 7 of 8 independent
categories of infection, and in the sole exception the incidence was essentially equal. This finding has
important implications for public health since it implies a "saving" of 56 infections per 100 infants per
year.
Clearly then, trials to define the relation between iron status and immune function more precisely are
required since a possible public health benefit of this magnitude can not be ignored. The difficulties
· such studies will have in attaining adequate statistical power must be noted. The present study was
designed to detect a difference in infection rates of 1 infection per child per year. The sample size
calculations yielded 65 as the minimum number required in each group and assumed that the standard
deviation of infection rate was 2.5. With the data from the present study it can be estimated that a
minimum of 230 infants would be required in each group to detect a difference of 0.59 in infection rates
with standard deviations of 2.8 and 3.3.

CHAPTER 7 CONCLUSIONS AND RECOMMENDATIONS 7.5
Besides increasing the number of subjects, steps to increase statistical power might include extending
the period of observation and increasing the disparity in iron status between control and test groups. It
will be particularly important to learn if there is a threshold level of iron status below which
susceptibility to infection is increased. The present study provides a hint that, if such a threshold exists,
it could be relatively high.
The. laboratory tests of immune function in themselves give little indication of the direction future
research should take. But, taken in conjunction with previous work in the literature, they suggest a
need for well designed and reported clinical studies. Such studies should control for confounding
factors of infection and malnutrition and report in detail the method of .ascertainment of the subjects
and their iron status. The time course to restoration of iron status to normal in patients with iron
deficiency anaemia should be studied along with parameters of immune function. Careful selection of
iron deficient subjects and comparison with the use of a placebo treatment for 1 or 2 weeks would
enable the effects of infection and malnutrition to be controlled.
Risks of increased iron fortification of infant milk formula
The study found no evidence that increased iron fortification of infant milk formula was poorly
tolerated or associated with increased susceptibility to infection. In particular, the incidence of
diarrhoeal disease was not increased. The Test formula was indistinguishable from the Control
formula as far as the infants, parents and study team were concerned.
Previous work that has suggested that iron interferes with the absorption of zinc was confirmed. No
symptoms or harmful effects could be attributed to the lower plasma and hair zinc levels found in the
Test group, but two recommendations can made for future studies of iron fortification of infant milk
formula.
Firstly, such studies should maintain the molar ratio of iron to zinc at about 2.8:1. Secondly, since iron
may also inhibit the absorption of other divalent metals, such studies should monitor their levels in the
subjects.
Epidemiological conclusions
In the course of the study a number of incidental but independently valuable contributions were made
in the field of epidemiology.
The data on infectious morbidity in inf ants between the ages· of 3 and 12 months are valuable not only
as a characterization of a particular community at a particular point in time, but also as a baseline for

7.6 IRON NUTRITION AND IMMUNI1Y
planning health services and for comparing morbidity in other communities or in the same community
in the future.
The social data on the study families and the surveys on infant feeding practices are valuable for similar
reasons.
A hospital laboratory receives most of its specimens from ill subjects. Assessment of the pathogenicity
of a particular isolate requires the carriage rate in normal subjects to be known. The survey of viral
carriage rate in faecal specimens from healthy 3 and 12 month old infants and in nasopharyngeal swabs
from 12 month old subjects thus provided useful information for the virology laboratory. Such a survey
had not been previously made in Cape Town.
The immunology laboratory which also receives most of its specimens from hospital patients has a
similar problem in determining normal ranges. The present study helped to establish normal ranges in
3 and 12 month old infants for several tests viz OKT3, OKT4, OKT8, surface membrane
immunoglobulin, lymphocyte response to stimulation with phytohaemaglutinin and neutrophil
bactericidal index.
Valuable epidemiological information with respect to immunization programs was obtained with the
surveys of polio and tetanus antibody levels. When the infants were 3 months of age the antibody levels
were measured in both mother and child. They were measured again in the infants at the age of 12 ,
months. This confirmed the efficacy of the immunization service (and vaccines) an_d will be a useful
baseline for future surveillance efforts.
Summary of contributions
The contributions made by the present work may be briefly summarized.
Infant milk formula fortified with milk and iron was shown to be less effective than similar formulas
overseas .. (Future studies will probably find differences in supplementary foods and dietary habits to
explain this fmding.) Fortification with extra iron resulted in minimally improved iron status and was
surprisingly ineffectual. The increased iron fortification was not associated with altered immune
function tests nor with changes in the incidence of infection. A relationship was sought between iron
status and immune function tests and incidence of infection but the results were inconclusive because
of low statistical power. However, concerns that have been raised in the literature about the safety and
acceptability of large quantities of ir.on in infant milk formulas were shown to be unfounded. Reports
of laboratory experiments showing that iron interferes with zinc absorption have been extended to the
field and confirmed. Finally, a number of independently valuable epidemiological studies were made.
These included determination of infectious morbidity, immunization responses and viral carriage rates

CHAPTER 7 CONCLUSIONS AND RECOMMENDATIONS 7.7
in infants, description of infant feeding practices and social characteristics of families in Bonteheuwe~
and normal ranges in infancy for a number of immunological tests.
Conclusion
In conclusion, it may be stated that increasing the level of iron fortification of cow's milk infant milk
formula is not sufficiently effective in improving iron status to warrant a change in commercial practice.
But, the potential rewards of improved iron status are such that further studies should be undertaken
with increased fortification of iron, ascorbic acid and zinc.


APPENDICES
APPENDIX 1 - Dropouts from the study
APPENDIX 2 - Research and Ethics Committee Approval
APPENDIX 3 - Tables of Statistical analyses
APPENDIX 4 - Composition of Control and Test milk formulas
APPENDIX 5 • Programs
Program to Stratify Subjects
Program to Calculate 95% Confidence Limits and 11 NS%11
dBase Ill Program to Calculate Beta (type II error)
APPENDIX 6 .. Forms for consent and data collection
Consent to participate
Iron and immune function
Infant Feeding Survey


APPENDICES
APPENDIX 1 · Dropouts from the study
STUDY NAME REASON
No.
1 Cynthia Davids Mother declined participation+
9 Yusuf Jamodien Mother scared of second blood test
15 Redewaan Benjamin Mother declined participation •
16 Lee-Ann Windvogel Mother scared of second blood test
24 Carmelita Fredericks Moved away from Bonteheuwel . 32 Mogamat Hendricks Mother declined participation
54 Elroy Snyman Moved away from Bonteheuwel
56 Ryan Greef .
Mother declined participation
59 Rishana Abrahams Mother declined participation+
82 Adele Henry Mother declined participation+
87 Donovan Wessels Moved away from Bonteheuwel
89 Rosaline Manuel Mother declined participation·
94 Shireen Jonathan Moved away from Bonteheuwel
97 Quanita Jacobs Moved away from Bonteheuwel
101 Nadeem Abrahams Moved away from Bonteheuwel
120 Badronesa Hendricks Moved away from Bonteheuwel
131 Feroza Mohammed Mother declined participation .
+ Mother declined out of concern for her child * Mother declined out of lack of concern for her child


A.2 IRON NUTRITION AND IMMUNI'IY
APPENDIX 2 · Research and Ethics Committee Approval
UNIVERSITY OF CAPE TOWN !WITH WHICH !S INCORPORATED THE SOUTH AFRICAN COLLEGE!
DEAN & PROFESSOR OF MEDICAL EDU CA TiON
PROFESSOR D McKENZIE M.8 .. Ch.S .. M.Med.(Path I !Cape Town). D,p. Bact. 1Londl.
TELEPHONE 47-1250
17 May 1983
Dr M Power et al Institute of Child Health Red Cross Childrens Hospital
Dear Dr Power
THE DEAN OF THE FACULTY OF MEDICINE
MEDICAL SCHOOL
OBSERVATORY
7925
Effects of iron deficiency on immune function and development of infants.
I am pleased to inform you that the Ethics and Research Committee has raised no objections to your proposed study.
Yours sincerely
~:-Prof JP deV van Niekerk CHAIRMAN


APPENDICES A.3
APPENDIX 3 - Tables of Statistical analyses
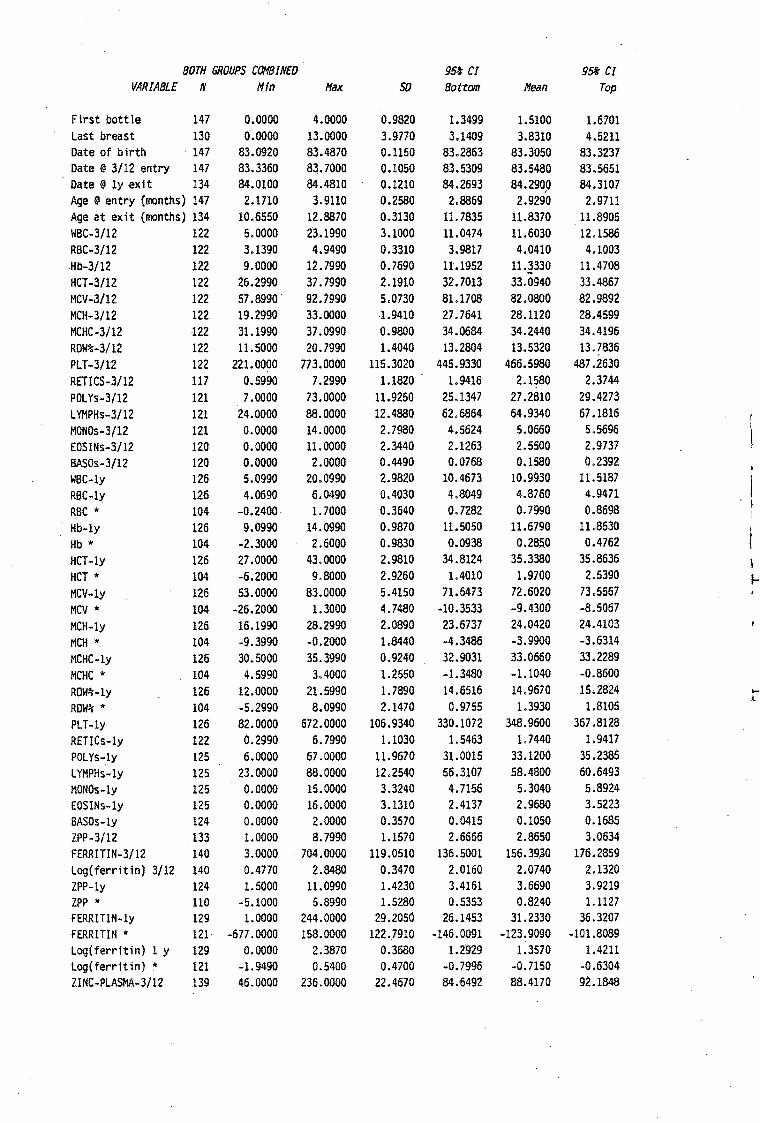
BOTH GROUPS COMBINED 95ft CI 9St CI VARIABLE N Hfn Hax so Bottom Hean Top
First bottle 147 0.0000 4.0000 0.9820 1.3499 1.5100 1.6701 Last breast 130 0.0000 13.0000 3.9770 3.1409 3.8310 4.5211 Date of birth 147 83.0920 83.4870 0.1150 83.2863 83.3050 83.3237 Date@ 3/12 entry 147 83.3360 83.7000 0.1050 83.5309 83.5480 83.5651 Date@ ly exit 134 84.0100 84.4810 0.1210 84.2693 84.2900 84.3107
/
Age@ entry {months) 147 2.1710 3.9110 0.2580 2.8869 2.9290 2.9711 Age at exit {months) 134 10.6550 12.8870 0.3130 11.7835 11.8370 11.8905 WBC-3/12 122 5.0000 23.1990 3.1000 11.0474 11.6030 12.1586 RBC-3/12 122 3.1390 4.9490 0.3310 3.9817 4.0410 4.1003 .Hb-3/12 122 9.0000 12. 7990 0.7690 11.1952 11.3330 11.4708 HCT-3/12 122 26.2990 37.7990 2.1910 32.7013 33.0940 33.4867 MCV-3/12 122 57 .8990 92.7990 5.0730 81.1708 82.0800 82.9892 MCH-3/12 122 19.2990 33.0000 -1.9410 27.7641 28.1120 28.4599 MCHC-3/12 122 31.1990 37.0990 0.9800 34.0684 34.2440 34.4196 ROW%-3/12 122 11.5000 20.7990 1.4040 13.2804 13.5320 13.7836 PLT-3/12 122 221.0000 773.0000 115.3020 445.9330 466.5980 487 .2630 RETICS-3/12 117 0.5990 7.2990 1.1820 1. 9416 2.1580 2.3744 POLYs-3/12 121 7.0000 73.0000 11.9250 25.1347 27.2810 29.4273 LYMPHs-3/12 121 24.0000 88.0000 12.4880 62.6864 64.9340 67.1816 MONOs-3/12 121 0.0000 14.0000 2.7980 4.5624 5.0660 5.5696 EOSINs-3/12 120 0.0000 11.0000 2.3440 2.1263 2.5500 2.9737 BASOs-3/12 120 0.0000 2.0000 0.4490 0.0768 0.1580 0.2392 WBC-ly 126 5.0990 20.0990 2.9820 10.4673 10.9930 11.5187 RBC-ly 126 4.0690 6.0490 0.4030 4.8049 4.8760 4.9471 RBC * 104 -0.2400 1.7000 0.3640 0.7282 0.7990 0.8698 Hb-ly 126 9.0990 14.0990 0.9870 11.5050 11.6790 11.8530 Hb * 104 -2.3000 2.6000 0.9830 0.0938 0.285.0 0.4762 HCT-ly 126 27.0000 43.0000 2.9810 34.8124 35.3380 35.8636 I HCT * 104 -6.2000 9.8000 2.9260 1.4010 1.9700 2.5390 ... MCV-ly 126 53.0000 83.0000 5.4150 71.6473 72.6020 73.5567 MCV * 104 -26.2000 1.3000 4.7480 -10.3533 -9.4300 -8.5067 MCH-ly 126 16.1990 28.2990 2.0890 23.6737 24.0420 24.4103 ·t
MCH * 104 -9.3990 -0.2000 1.8440 -4.3486 -3.9900 -3.6314 MCHC-ly 126 30.5000 35.3990 0.9240 32.9031 33.0660 33.2289 MCHC * 104 4.5990 3.4000 1.2550 -1.3480 -1.1040 -0.8600 ROW%-ly 126 12.0000 21.5990 1.7890 14.6516 14.9670 15,2824 ....
L ROW%* 104 -5.2990 8.0990 2.1470 0.9755 1.3930 1.8105 PLT-ly 126 82.0000 672.0000 106.9340 330.1072 348.9600 367.8128 RETICs-ly 122 0.2990 6.7990 1.1030 1.5463 1.7440 1.9417 POLYs-ly 125 6.0000 67.0000 ll.9670 31.0015 33.1200 35.2385 LYMPHs-ly 125 23.0000 88.0000 12.2540 56.3107 58.4800 60.6493 MONOs-ly 125 0.0000 15.0000 3.3240 4.7156 5.3040 5.8924 EOSINs-ly 125 0.0000 16.0000 3.1310 2.4137 2.9680 3.5223 BASOs-ly 124 0.0000 2.0000 0.3570 0.0415 0.1050 0.1685 ZPP-3/12 133 1.0000 8.7990 1.1570 2.6666 2.8650 3.0634 FERRITIN-3/12 140 3.0000 704.0000 119.0510 136.5001 156.39,30 176.2859 Log(ferritin) 3/12 140 0.4770 2.8480 0.3470 2.0160 2.0740 2.1320 ZPP-ly 124 1.5000 ll.0990 1.4230 3.4161 3.6690 3.9219 ZPP * 110 -5.1000 5.8990 1.5280 0.5353 0.8240 1.1127 FERRITIN-ly 129 1.0000 244.0000 29.2050 26.1453 31.2330 36.3207 FERRITIN " 121 -677 .0000 158,0000 122 .. 7910 -146.0091 -123.9090 -101.8089 Log(ferritin) 1 y 129 0.0000 2.3870 0.3680 1.2929 1.3570 1.4211 Log(ferritin) " 121 -1.9490 0.5400 0.4700 -0.7996 -0.7150 -0.6304 ZINC-PLASMA-3/12 139 46.0000 236.0000 22.4670 84.6492 88.4170 92.1848

BOTH GROUPS COMBINED 95t Cl 95* Cl
VARIABLE N Hin /1ax so Bottom Hean Top
ZINC-HAIR-3/12 78 54.5990 759.7990 164.6700 207.9373 245.0580 282.1787 ZINC-PLASMA-ly 124 54.0000 204.0000 20.3730 83.1048 86.7260 90.3472 ZINC-PLASMA* 115 -62.0000 62.0000 27.0900 -7.2298 -2.2260 2.7778 ZINC-HAIR-ly 101 16.5990 536.5990 105.5560 114.7217 135.5580 156.3943 ZINC-HAIR 11 52 -703.7990 253.1000 215.9730 -190.3598 -130.2590 -70.1582 II Infect:grade 1+2+3 132 0.0000 12.0000 2.2890 4.1739 4.5680 4.9621 #Infect.grade 1 132 0.0000 5.0000 1.2220 0.9946 1.2050 1.4154 II Infect •. grade 2 132 0.0000 10.0000 2.1640 2.8544 3.2270 3.5996 II Infect. grade 3 132 0.0000 1.0000 0.3440 0.0768 0.1360 0.1952 II Infect. resp tract 132 0.0000 6.0000 1.2800 1.2266 1.4470 1.6674 I Infect. diarrhoea 132 0.0000 4.0000 0.9280 0.5902 0.7500 0.9098 # Infect. pyodenna 132 0.0000 5.0000 0.8570 0.2084 0.3560 0.5036 #Infect.thrush 132 0.0000 3.0000 0.7260 0.2540 0.3790 0.5040 II Infect other(-max) 131 0.0000 2.0000 0.4260 0.1094 0.1830 0.2566 ff infect: other 132 0.0000 4.1450 0.6600 0.1610 6.2746 0.3882 II Infect. other 132 0.0000 3.0000 0.4900 0.1206 0.2050 0.2894 # Infect. conjunct. 132 0.0000 2.0000 0.4380 0.1516 0.2270 0.3024 ff Infect:grade 1+2+3 132 0.0000 15.7740 3.0490 5.5950 6.1200 6.6450 # Infect:grade 1 132 0.0000 6.5380 1.6180 1.3344 1.6130 1.8916 # Infect:grade 2 132 0.0000 13.1450 2.8880 3.8268 4.3240 4.8212 # Infect:grade 3 132 0.0000 1.4410 0.4660 0.1038 0.1840 0.2642 II Infect: resp tract 132 0.0000 8.2330 1.7280 1.6455 1.9430 2.2405 I Infect: diarrhoea 132 0.0000 5.4520 1.2410 0.7893 1.0030 1.2167 I Infect: pyodenna 132 0.0000 6.5730 1.1470 0.2795 0.4770 0.6745 I Infect: thrush 132 0.0000 3.9960 0.9700 0.3400 0.5070 0.6740 # Infect:other(-max) 131 0.0000 2.7370 0.5680 0.1458 0.2440 0.3422 II Infect: conjunct 132 0.0000 . 2.6460 0.5860 0.2031 0.3040 0.4049 Mantoux 3/12 138 0.0000 21.0000 5.6200 4.7060 5.6520 15.5980 Candida 3/12 144 0.0000 20.0000 6.0200 3.3414 4.3330 5.3246 Mantoux l y 127 0.0000 26.0000 7.3130 6.2278 7.5120 8.7962 Mantoux 11 121 · -20.0000 26.0000 8.5130 0.3028 1.8350 3.3672 Candida 1 y 128 0.0000 28.0000 8.4350 7.8688 9.3440 10.8192 Candida* 127 -17.0000 26.0000 8.7500- 3.4945 5.0310 6.5675 Antibody tetanus ma 130 0.0000 5120.0000 478.1460 36.1875 119.1540 202.1205 Antibody polio ma 138 0.0000 20.0000 4.7260 1.0885 1.8840 2.6795
. log(Tetanus] ma 130 0.0000 3.7090 0.9950 0.9314 1.1040 1.2766 log[Polio] ma 138 0.0000 1.3220 0.3980 0.1150 0.1820 0.2490 Antibody tetanus 3m 139 0.0000 320.0000 35.0160 6.3577 12.2300 18.1023 Antibody polio 3/12 129 0.0000 160.0000 39.5840' 30.0032 36.8990 43.7948 log[Tetanus] 3/12 139 0.0000 2.5070 0.6800 0.3830 0.4970 0.6110 log(Po 1 io] 3/ 12 129 0.0000 2.2070 0.6380 1.1669 1.2780 1.3891 Antibody tetanus ly 130 0.0000 10240.0000 1025.6580 121.0307 299.0000 476.9693 Antibody tetanus* 122 -280.0000 10230.0000 1059.3630 103.5791 293.4430 483.3069 Antibody polio 1 y 128 0.0000 160.0000 52.7810 55.7689 65.0000 74.2311 Antibody po 1 io 11 1,15 -160.0000 160.0000 66.7620 19.2334 31.5650 43.8966 log[Tetanus] 1 yr 130 0.0000 4.0100 0.6590 1.8177 1.9320 2.0463 log[Tetanus] 1 y • 122 -1.6130 3.7090 1.0550 1.2289 1.4180 1.6071 log[[Polio] 1 yr 128 0.0000 2.2070 O.S330 1.5228 1.6160 1. 7092 log[Polio] 1 yr* 115 -2.2070 2.2070 0.8400 0.2208 0.3760 0.5312 OKT3 3/12 127 47.0000 88.0000 9.6260 67.0417 68.7320 70.4223 OKT4 3/12 127 19.0000 87.0000 12.1920 48.8671 51.0080 53.1489 OKT8 3/12 127 5.0000 42.0000 7.3290 14.8470 16.1340 17.4210 SMIG 3/12 127 5.0000 43.0000 6.8030 17.3174 18.5120 19.7066 OKT4/0KT8 3/12 127 0.7620 12.4290 2.2120 3.4916 3.8800 4.2684

BOTH GROUPS COHBINED 95t CI 95t CI VARIABLE N Hin Hax SD Bottom Hean. Top
OKT3 ly 126 40.0000 95.0000 11.1110 71.3351 73.2940 75.2529 OKT4 ly 126 0.0000 75.0000 13.5010 44.4767 46.8570 49.2373 OKTS ly 126 5.0000 67.0000 9.7870 21.0285 22,7540 24.4795 SHIG ly 126 4.0000 46.0000 7.5760 · 17.5853 18.9210 20.2567 OKT4/0KT8 ly 126 0.0000 8.1430 ·1.3140 2.2323 2.4640 2.6957 OKT4/0KT8 * 109 -9.5270 3.4550 2.0670 -1.7184 -1.3260 -0.9336 pha-pcps-3/12 56 0.0690 285.5790 46.4040 123.2555 135.6780 148.1005 pha-pccs-3/12 56 · 0.1190 280.1690 43.8440 129.2819 141.0190 152.7561 pha-ccps-3/12 56 62.3790 133.0490 14.5410 97.0973 100.9900 104.8827 pha-pcps-ly 62 43.2190 360.0790 59.8510 126.2204 141.4150 156.6096 pha-pccs-ly 62 63.8590 299.7090 45.2580 131.6822 143.1720 154.6618 pha-ccps-ly 61 50.8290· 147.0890 17.4160 95.0780 101.7670 108.4560 pha-pcps * 50 -161.8200 196.6400 62.5530 -12.1907 5.5780 23.3467 Birth weight 147 3.0000 4.3690 0.3060 3.3401 3.3900 3.4399 SO score weight brth 147 -0.7500 2.7500 0.7220 0.1983 0.3160 0.4337 Weight@ 3/12 147 4.8490 8.1590 0.6320 5.9450 6.0480 6.1510 Length@ 3/12 147 52.3990 65.8990 2.0060 58.7990 59.1260 59.4530 Head circ @ 3/12 147 37.5990 44.6990 1.2630 40.3251 40.5310 40.7369 SD score weight 3/12 147 -0.9040 2.6770 0.6650 0.3856 0.4940 0.6024 SO score length 3/12.146 -2.0840 1.6840 0.6660 -0.4719 -0.3630 -0.2541 Weight/(length)**3 3 146 23.4940 36.5870 2.1000 28.7955 29.1390 29.4825 Weight@ ly 133 7.6590 13.6590 1.1740 10.0186 10.2200 10.4214 Weight * 133 2.0000 6.5300 0.9470 3.9906 4.1530 4.3154 Length @ ly · 134 68.3990 82.0000 2.5500 74.5613 74.9970 75.4327 Length* 1.34 7 • .7000 25.9000 2.2349 15.3622 15.7440 16.1258 Head circ@ ly 134 43.5990 50.5000 1.2650 46.4009 46.6170 46.8331 SD score weight 1 y 133 -2.0990 3.0900 1.1130 0.1721 0.3630 0.5539 SO score length 1 y 134 -2.0370 2.2750 0.8940 -0.1807 -0.0280 0.1247 SD score length* 133 -2.4080 2.4330 0.7130 0.1687 0.2910 0.4133 Weight/(length)**3y 133 19.9290 33.9580 2.0650 23.8208 24.1750 24.5292 Bact % init 1hr 3/12 65 32.0000 224.0000 45.8430 94.2747 105.6310 116.9873 Bact % init 2hr 3/12 65 27.0000 378.0000 67.8150 100.8007 117 .6000 134.3993 Bact % ctl 1hr 3/12 65 30.2290 481.8090 101.6010 158.5412 183.7100 208.8788 Bact % ctl 2hr 3/12 65 63.0690 2400.0000 378.7230 267. 6379 361.4560 455.2741 Bact % AB 1 hr 3/12 65 13.0490 109.3190 19.5870 43.9939 48.8460 53.6981 Bact % A8 2 hr 3/12 65 8.5190 105.5790 18.3790 28.5761 33.1290 37.6819 SD score weight* 133 -2.0510 2.0630 0.9030 -0.2899 -0.1350 0.0199 Bact nonn 1 hr 3/12 65 -142.8600 112.1590 39.3730 12.3734 22 .1270 31.8806 Bact nonn 2 hr 3/12 65 -6.8600 106.4690 21.1110 17.4763 22.7060 27.9357 Bact % init 1hr ly 57 20.0000 · 227.0000 54.3310 85.0634 99.4740 113.8846 Bact % init 1hr * 46 -149.0000 172.0000 71.3750 -20.6831 0.5000 21.6831 Bact % init 2hr ly 57 14.0000 347.0000 88.1520 96.5308 119.9120 143.2932 Bact % init 2hr * 46 -193.0000 213.0000 111.8260 -21.0794 12.1090 45.2974 Bact % ctl 1 hr ly 49 28.2290 487.1690 76.2880 107.9688 129.8700 151.7712 Bact % ctl 1 hr* 39 -319.7800 341.7200 110.0500 -87.9522 -52.3080 -16.6638 Bact% ctl 2 hr ly 57 32.4890 1446.1490 235.5080 142.1944 204.6600 267.1256 Bact % AB 1 hr ly 50 8.0590 114.1890 27.6950 37.1440 45.0110 52.8780 Bact % AB 2 hr ly 54 2.6290 91.4790 24.6650 25.8759 32.6050 39.3341 Bact nonn 1 hr 1 y 46 -360.0000 142.5890 90.9340 -27.8309 -0.8430 26.1449 Bact nonn 2 hr l y 54 -63.0900 83.8290 31.2870 3.3253 11.8610 20.3961 hygiene 144 1.0000 3.0000 0.7000 2.5517 2.6670 2.7823 daycare 144 1.0000 3.0000 0.3860 2. 7764 2.8400 2.9036 crowding 144 1.0000 3.0000 0.9440 1.7885 1.9440 2.0995 finance 144 1.0000 3.0000 0.7080 2.5084 2.6250 2.7416

BOTH GROUPS COMBINED 95~ CI 95t CI VARIABLE N Min Max SD Bottom Mean Top
careseeking 144 1.0000 3.0000 0.2640 1.9425 1.9860 2.0295 MDI-pre 31 0.0000 0.0000 POI-pre 31 0.0000 0.0000 MDI-diff (Post) 22 0.0000 0.0000 PDI-diff (Post) 22 o~oooo 0.0000 Meat/Fish 142 2.0000 10.0000 1.6200 4.6513 4.9200 5.1887 Cereal 146 0.0000 5.0000 0.7900 1.9508 2.0800 2.2092 Egg 142 0.0000 9.0000 1.6800 3.7513 4.0300 4.3087 Fruit 137 1.0000 9.0000 1.4200 3.9201 4.1600 4.3999 Vegetable 147 1.0000 8.0000 1.2400 3.0979 3.3000 3.5021

CONTROL GROUP 95% Cl 95-t Cl VARIABLE N Min Max so Bottom Mean Top
First bottle 72 0.0000 4.0000 1.0210 1.2881 1.5280 1. 7679 Last breast 62 . 0,0000 13.0000 3.7610 2.6422 3.5970 4.5518 Date of birth 72 83.0950 83.4890 0.1180 83.2673 83.2950 83.3227 Date@ 3/12 entry 72 83.3360 83.7000 0.1080 83.5146 83.5400 83.5654 Date@ ly exit 63 84.0100 84.4810 0.1230 84.2420 84,2730 84.3040 Age@ entry (months) 72 2.5070 3.9110 0.2570 2.9016 2.9620 3.0224 Age at exit (months) 63 10.6550 12.8870 0.3510 11.7246 11.8130 11.9014 WBC-3/12 56 5.0000 18.8000 2.9700 10.4559 11.2510 12.0461 RBC-3/12 56 3.1390 4.6990 0.2990 3.9340 4.0140 4.0940 Hb-3/12 56 9.0000 12.5990 0.7230 11.0895 11.2830 11.4765 HCT-3/12 56 26.2990 36.7990 2.0090 32.3492 32.8870 33.4248 MCV-3/12 56 71.1990 92.7990 4.6550 80.8158 82.0620 83.3082 MCH-3/12 56 23.2990 30.8990 1.8080 27.6330 28.1170 28.6010 MCHC-3/12 56 32.0990 37 .0990 1.0290 34.0075 34.2830 34.5585 RDW%-3/12 56 11.6990 20.7990 1.4400 12.9635 13.3490 13.7345 PLT-3/12 56 244.0000 704.0000 111.8390 428.9535 458.8930. 488.8325 RETICS-3/12 53 · 0.5990 7.2990 1.1720 1.6881 2.0110 2.3339 POLYs-3/12 55 8.0000 53.0000 10.7520 24.0765 26.9820 29.8875 LYMPHs-3/12 55 42.0000 87.0000 11.2510 61.7416 64.7820 67.8224 MONOs-3/12 55 0.0000 14.0000 2.9760 4.3228 5.1270 5.9312 EOSINs-3/12 55 0.0000 ll.0000 2.8520 2.1203 2.8910 3.6617 BASOs-3/12 55 0.0000 2.0000 0.5120 0.0436 0.1820 0.3204 WBC-ly 61 5.0990 20.0990 3.2020 9. 7172 10.9470 12.1768 RBC-ly 61 4.0690 5.6390 0.3920 4.6994 4.8500 5.0006
RBC * 46 0.1100 1.7000 0.3840 0.6610 0.7750 0.8890 Hb-ly 61 9.3990 13.6990 0.9380 11.1337 11.4940 11.8543
Hb * 46 -2.3000 2.6000 1.0380 -0.2951 0.0130 0.3211 HCT-ly 61 29.8990 41.7990 2.8080 33.7695 34.8480 35.9265 HCT * 46 -6.2000 9.8000 3.1120 0.4984 1.4220 2.3456 MCV-ly 61 61.2990 81.3990 5.1020 70.0035 71.9630 73.9225 MCV * 46 -26.2000 -2.0990 5.1370 -11.7636 -10.2390 -8. 7144 MCH-ly 61 19.7990 27.0990 1.9670 23.0195 23.7750 24.5305 MCH * 46 -9.3990 -0.2000 2.0020 -5.0242 -4.4300 -3.8358 MCHC-ly 61 31.0000 34.7990 0.9060 32.6350 32.9830 33.3310 MCHC * 46 -4.5990 1.2000 1.2780 -1.7443 -1.3650 -0.9857 RDW%-1y 61 12.5990 21.5990 1.8090 14.8352 15.5300 16.2248 ROW%* 46 -5.2990 8.0990 2.2020 1.6035 2.2570 2.9105 PLT-ly 61 142.0000 672.0000 102. 7590 315.2381 354.7050 394.1719 RETICs-ly 58 0.2990 . 6. 7990 1.2540 1.3494 1.6790 2.0086 POLYs-ly 60 7.0000 60.0000 10.8370 28.5185 31.3170 34.1155 LYMPHs-ly 60 37.0000 88.0000 11.0690 57.8916 60.7500 63.6084 MONOs-ly 60 0.0000 14.0000 3.1350 3.8234 4.6330 5.4426 EOSINs-ly 60 0.0000 16.0000 3.6920 2.2636 3.2170 4.1704 BASOs-ly 60 0.0000 2.0000 0.3540 0.0086 0.1000 0.1914 ZPP-3/12 65 1.0000 8.7990 1.2370 2.6086 2.9150 3.2214 FERRITIN-3/12 71 3.0000 704.0000 120.6420 127.0568 155.6060 184.1552 Log(ferritin) 3/12 71 0.4770 2.8480 0.3590 1.9850 2.0700 2.1550 ZPP-ly 59 2.0990 8.3990 1.4890 3.5621 3.9500 4.3379 ZPP * 51 -5.1000 5.8990 1.7970 0.6748 1.1800 1.6852 FERRITIN-ly 60 1.0000 106.0000 19.3290 18.8085 23.8000 28. 7915 FERRITIN * 57 -677.0000 3.0000 122.8240 -170.5075 -137.9300 -105.3525 Log(ferritin) 1 y 60 0.0000 2.0250 0.3760 1.1399 1.2370 1.3341 log(ferritin) * 57 -1.9490 0.3010 0.4430 -0.9795 -0.8620 -0.7445 ZINC-PLASMA-3/12 70 46.0000 263.0000 26.0030 84.9582 91.1570 97.3558

CONTROL GROUP 9St CI 95Js CI VARIABLE N Min Max SD Bottom Mean Top
ZINC-HAIR-3/12 34 72.0990 661.5990 129.7440 178.8025 224.0230 269.2435 ZINC-PLASMA-ly 56 54.0000 204.0000 23.4890 84.3189 90.6070 96.8951 ZINC-PLASMA* 52 -61.0000 53.0000 28.3830 ...a.8024 -0.9040 6.9944 ZINC-HAIR-ly 49 16.5990 536.5990 114.9890 109.2853 142.2970 175.3087 ZINC-HAIR * 24 -588.3000 227.2990 173.4560 -167.0126 -93.9370 -20.8614 # Infect:grade 1+2+3 62 0.0000 12.0000 2.4610 4.1332 4.7580 5.3828 #Infect.grade 1 62 0.0000 5.0000 1.2270 0.9465 1.2580 1.5695 #Infect.grade 2 62 0.0000 10.0000 2.3040 2.7541 3.3390 3.9239 # Infect. grade 3 62 0.0000 1.0000 0.3710 0.0668 0.1610 0.2552 #Infect.resp tract 62 0.0000 5.0000 1.2860 1.1035 1.4300 1.7565 # Infect. diarrhoea 62 0.0000 4.0000 0.9600 0.5463 0.7900 1.0337 # Infect. pyodenna 62 0.0000 5.0000 0.9300 0.1509 0.3870 0.6231 #Infect.thrush 62 0.0000 3.0000 0.7350 0.2164 0.4030 0.5896 # Infect other(-max) 51 0.0000 2 .. 0000 0.4620 0.0526 0.2300 0.4074 # infect: other 62 0.0000 4.1450 0.7870 0.1712 0.3710 0.5708 #Infect.other 62 0.0000 3.0000 0.5770 0.1275 0.2740 0.4205 #Infect.conjunct. 52 0.0000 2.0000 0.4680 0.1232 0.2420 0.3608 # Infect:grade 1+2+3 62 0.0000 15.7740 3.3040 5.5782 6.4170 7.2558 # Infect:grade 1 62 0.0000 6.5380 1.6190 1.2760 1.6870 2.0980 # Infect:grade 2 62 0.0000 13.1450 3.1050 3.7227 4.5110 5.2993 # Infect:grade 3 62 0.0000 1.4410 0.5020 0.0906 0.2180 0.3454 # Infect: resp tract 62 0.0000 7.3560 1.7630 1.4534 1.9010 2.3486 # Infect: diarrhoea 62 0.0000 5.4520 1.2950 0.7362 1.0650 1.3938 # Infect: pyodenna 62 0.0000 6.5730 1.2600 0.2041 0.5240 0.8439 # Infect: thrush 62 0.0000 3.9280 0.9860 0.2937 0.5440 0.7943 # Infect:other(-max) 61 0.0000 2.7370 0.6230 0.0697 0.3090 0.5483 # Infect: conjunct 62 0.0000 2.6460 0,6260 0.1651 0.3240 0.4829 Mantoux 3/12 68 0.0000 18.0000 5.4840 4.6289 5.9560 7.2831 Candida 3/12 71 0.0000 20.0000 6.1440 2.8981 4,3520 5.8059 Mantoux 1 y 60 0.0000 26.0000 7.4840 6.1173 8.0500 9.9827 Mantoux * 57 -13.0000 26.0000 8.6030 -0.0358 2.2460 4.5278 Candida 1 y 60 0.0000 28.0000 8.5910 6.6645 8.8830 11.1015 Candida* 60 -10.0000 26.0000 8.0920 2.7773 4.8670 6.9567 Antibody tetanus ma 62 0.0000 320.0000 99.3110 41.2396 66.4520 91.6644 Antibody polio ma 69 0.0000 20.0000 5.1680 0.7878 2.0290 3.2702 log[Tetanus] ma 62 0.0000 2.5070 0.9870 0.8134 1.0640 1.3146 log[Pol io] ma 69 0.0000 1.3220 0.4110 0.0833 0.1820 0.2807 Antibody tetanus 3m 70 0.0000 160.0000 23.3390 5.7223 11.2860 16.8497 Antibody polio 3/12 60 0.0000 160.0000 41.0080 25.5772 36.1670 46.7568 log[Tetanus] 3/12 70 0.0000 2.2070 0.6810 0.3977 0.5600 0.7223 log(Polio] 3/12 60 0.0000 2.2070 0.6680 1.0655 1.2380 1.4105 Antibody tetanus ly 61 0.0000 1280.0000· 233.3070 102.8523 192.4590 282.0657 Antibody tetanus* 58 -140.0000 1280.0000 243.3600 117 .5882 181.5520 245.5158 Antibody polio 1 y 61 0.0000 160.0000 49.9060 39.1935 58.3610 77 .5285 Antibody polio* 52 -160.0000 160.0000 62.9960 12.0845 29.6150 47 .1455 log(Tetanus] 1 yr 61 0.0000 3.1080 0.5890 1.7528 1.9790 2.4052 log(Tetanus] 1 y * 58 -1.3220 3.1080 1.0150 1.1392 1.4060 1.6728 log[[Polio] 1 yr 61 0.0000 2.2070 0.5710 1.3267 1.5460 1.7653 log[Polio] 1 yr* 52 -2.2070 2.2070 0.8750 0.1485 0.3920 0.6355 OKT3 3/12 64 54.0000 87 .0000 9.1940 67.1731 69.4690 71. 7649 OKT4 3/12 64 24.0000 80.0000 11.6000 47.5253 50.4220 53.3187 OKT8 3/12 64 5.0000 42.0000 6.9390. 14.6892 16.4220 18.1548 SMIG 3/12 64 7.0000 33.0000 5.9700 18.1182 19.6090 21.0998 OKT4/0KT8 3/12 64 1.3330 12.0000 1.8160 3.1485 3.6020 4.0555

CONTROL GROUP 95t Cl 9~ Cl
VARIABLE N Min Max 50 Bottom Mean Top
OKT3 ly 57 43.0000 95.0GOO 10.9270 71.2417 74.1400 77 .0383 OKT4 ly 57 0.0000 70.0000 14.8960 42.9440 46.8950 50.8460
0KT8 ly 57 5.0000 55.0000 10.2330 19.8118 22.5260 25.2402 SMIG ly 57 8.0000 44.0000 7.4470 16.6208 18.5960 20.5712 OKT4/0KT8 ly 57 0.0000 8.1430 1.4440 2.1460 2.5290 2.9120 OKT4/0KT8 * 49 -3.9610 3.4550 1.5630 -1.4137 -0.9650 -0.5163 pha-pcps-3/12 27 0.0690 221.3990 53.5480 112.5975 133.7420 154.8865
pha-pccs-3/12 27 0.1190 255.3990 46.3090 120.4910 138.7770 157.0630
pha-ccps-3/12 27 62.3790 120.5490 14.0440 92.4255 97 .9710 103.5165
pha-pcps-ly 24 81.6590 316.0790 53.6140 117 .8109 140.3980 162.9851
pha-pccs-ly 24 75.9390 299.7090 47.1900 122.9522 142.8330 162. 7138
pha-ccps-ly 23 75.6490 129.6390 12.9770 96.5373 102.1350 107.7327 pha-pcps * 21 -114.9100 196.6400 75.7950 -19.3642 15.0320 . 49.4282 Birth weight 72 3.0000 4.3690 0.3060 3.3401 3.4120 3.4839 SO score weight brth 72 -0.6250 2.7500 0.6990 0.1918 0.3560 0.5202 Weight@ 3/12 72 4.9590 8.1490 0.6510 5.907i 6.0600 6.2129 Length@ 3/12 72 54.6990 63.1990 1.8710 58.6924 59.1320 59.5716 Head circ@ 3/12 72 38.3990 44.6990 1.3710 40.3829 40.7050 41.0271 SD score weight 3/12 72 -0.9040 2.6770 0.7030 0.3108 0.4760 0.6412 SD score length 3/12 72 -2.0840 1.1250 0.6470 -0.5710 -0.4190 -0.2670 Weight/(length)**3 3 72 24.2430 33.7040 1.8770 28.8120 29.2530 29.6940 Weight@ ly 63 7.6590 13.5590 1.1890 9.7936 10.0930 10.3924 Weight* 63 2.0000 5.9500 0.9180 3.7659 3.9970 4.2281 Length@ ly 63 68.3990 78.7990 2.5380 74.0970 74.7360 75.3750 Length* 63 11.8990 20.8000 2.1150 14.9165 15.4490 15.9815 Head circ @ ly 63 44.1990 50.5000 1.2500 46.3923 46.7070 47.0217 SD score weight 1 y 63 -2.0990 3.0900 1.1510 -0.0598 0.2300 0.5198 SD score length 1 y 63 -2.0090 1.5560 0.8420 -0.3450 -0.1330 0.0790 SO score length* 63 -1.4320 2.0050 0.6830 0.0830 0.2550 0.4270 Weight/(length)**3y 63 20.1160 28.3550 1.6870 23.6943 24.1190 24.5437 Bact % init 1hr 3/12 32 47.0000 224.0000 47.2770 91.8198 108.8440 125.8682 Bact % init 2hr 3/12 32 41.0000 378.0000 80.2400 95.5120 124.4060 153.3000 Bact % ctl 1hr 3/12 32 30.2290 481.8090 117.5690 150.3601 192.6960 235.0319 Bact % ctl 2hr 3/12 32 63.0690 1618.1790 332.0210 257.2392 376. 7980 496.3568 Bact % AB 1 hr 3/12 32 13.0490 109.3190 21.9410 42.7622 50.6630 58.5638 Bact % AB 2 hr 3/12 32 8.5190 105.5790 22.0670 27.2258 35.1720 43.1182 SO score weight* 63 -2.0510 1.5320 0.8820 -0.4751 -0.2530 -0.0309 Bact norm 1 hr 3/12 32 -142.8600 112.1590 49.8930 2.9068 20.8730 38.8392 Bact norm 2 hr 3/12 32 -6.8600 106.4690. 25.7090 15,8383 25.0960 34.3537 Bact % init 1hr ly 28 25.0000 222.0000 51.4820 85.2137 105.1430 125.0723 Bact % init 1hr * 21 -80.0000 118.0000 63.3790 -13.7138 15.0480 43.8098 Bact % init 2hr ly 28 25.0000 291.0000 80.6920 95.5132 126.7500 157.9868 Bact % init 2hr * 21 -193.0000 194.0000 104.8590 -23.8716 23.7140 71.2996 Bact % ctl 1 hr ly 25 41.6590 315.3790 59.2130 106.3632 130.7530 155.1428 Bact % ctl 1 hr* 18 -319.7800 66.1900 95.9220 -98.1023 -50.6030 -3.1037 Bact % ctl 2 hr ly 28 32.4890 638.4590 138.3580 146.4691 200.0290 253:5889 Bact % AB 1 hr ly 22 16.0190 114.1890 27.9830 35.9581 48.3310 60.7039 Bact % AB 2 hr ly 25 4.1490 81.4390 21.3020 25.0247 33.7990 42.5733 Bact norm 1 hr 1 y 22 -360.0000 142.5890 91.9240 -37.1348 3.5100 44.1548 Bact norm 2 hr 1 y 25 -63.0900 64.9490 27.4270 1.0148 12.3120 23.6092 hygiene 71 1.0000 3.0000 0.6800 2.5571 2.7180 2.8789 daycare 71 2.0000 3.0000 0.4010 2.7091 2.8040 2.8989 crowding 71 1.0000 3.0000 0.9490 1.7894 2.0140 2.2386 finance 71 1.0000 3.0000 0.6750 2.5023 2.6620 2.8217

CONTROL GROUP 9~ CI 95!t CI VARIABLE N Hin Max SD Bottom Hean Top
careseeking 71 1.0000 3.0000 0.3160 1.9112 1.9860 2.0608 MDI-pre 9 5.0000 109.2297 113.0000 116.7703 POI-pre 9 7.2000 98.9707 104.4000 109.8293 MDI-diff (Post) 14 7.5000 -0.2992 4.0000 8.2992 PDI-diff (Post) 14 2.9000 -2.1623 -0.5000 1.1623 Meat/Fish 68 2.0000 10.0000 1.8200 4.7496 5.1900 5.6304 Cereal 71 0.0000 5.0000 0.7900 1.8731 2.0600 2.2469 Egg 68 1.0000 9.0000 1.8200 3.7996 4.2400 4.6804 -Fruit 67 2.0000 9.0000 1.4200 3.8137 4.1600 4.5063 Vegetable 72 1.0000 8.0000 1.3900 3.0734 3.4000 3. 7266

TESTGROlJP 95* CI 95ft CI
VARIABLE N Min Max so Bottom Mean Top
First bottle 75 0.0000 3.0000 0.9500 1.2745 1.4930 1.7115
Last breast 68 0.0000 13.0000 4.1800 3.0325 4.0440 5.0555
Date of birth 75 83.0920 83.4890 0.1120 83.2892 83.3150 83.3408
Date@ 3/12 entry 75 83.3500 83.7000 0.1020 83.5335 83.5570 83.5805
Date@ ly exit 71 84.0880 84.4790 0.1180 84.2761 84.3040 84.3319
Age@ entry (months) 75 2.1710 3.4790 0.2580 2.8396 2.8990 2.9584
Age at exit (months) 71 11.0750 12.5270 0.2760 11.7927 11.8580 11.9233
WBC-3/12 66 6.2990 23.1990 3.1980 11.1160 11.9020 12.6880
RBC-3/12 66 3.3090 4.9490 0.3560 3.9755 4.0630 4.1505
Hb-3/12 66 9.5990 12.7990 0.8090 11.1762 11.3750 11.5738
HCT-3/12 66 28.1990 37.7990 2.3350 32.6961 33.2700 33.8439
MCV-3/12 66 57 .8990 90.8990 5.4380 80.7595 82.0960 83.4325
MCH-3/12 66 19,2990 33.0000 2.0620 27.6012 28.1080 28.6148
MCHC-3/12 66 31.1990 36.3990 0.9440 33.9790 34.2110 34.4430
RDW%-3/12 66 11.5000 17.3990 1.3640 13.3518 13.6870 14.0222
PlT-3/12 66 221.0000 773.0000 118.6180 443.9839 473.1360 502.2881
RETICS-3/12 64 0.6990 5.7990 1.1850 1.9841 2.2800 2.5759
POLYs-3/12 66 7.0000 73.0000 12.8970 24.3604 27.5300 30.6996 LYMPHs-3/12 66 24.0000 88.0000 13.5170 61.7390 65.0610 68.3830
. MONOs-3/12 66 1.0000 14.0000 2.6630 4.3605 5.0150 5.6695 EOSINs-3/12 65 0.0000 7 .0000 1.7190 1.8213 2.2620 2.7027 BASOs-3/12 65 0.0000 2.0000 0.3900 0.0414 0.1380 0.2346 WBC-ly 65 5.5000 17.2990 2.7840 10.3463 11.0360 11. 7257 RBC-ly 65 4.1490 6.0490 0.4150 4.7972 4.9000 5.0028 RBC * 58 -0.2400 1.4900 0.3490 0.7253 0.8170 0.9087 Hb-ly 65 9.0990 14.0990 1.0080 U,6033 11.8530 12.1027 Hb * 58 -1.6000 2.3990 0.8890 0.2663 0.5000 0.7337 HCT-ly 65 27.0000 43.0000 3.0860 35.0335 35.7980 36.5625 HCT * 58 -5.1990 8.9000 2. 7180 1.6906 2.4050 3.1194 MCV-ly 65 53.0000 83.0000 5.6680 71. 7979 73.2020 74.6061 MCV * 58 -19.6000 1.3000 4.3530 -9.9321 -8.7880 -7.6439 MCH-ly 65 16.1990 28.2990 2.1830 23.7522 24 .• 2930 24.8338 MCH * 58 -8.3010 -0.2000 1.6430 -4.0728 -3.6410 -3.2092 MCHC-ly 65 30.5000 35.3990 0.9410 32.9109 33.1440 33.3771 MCHC * 58 -2.8990 3.4000 1.2070 -1.2132 -0.8960 -0.5788 RDW%-ly 65 12.0000 21.5000 1.6120 14.0397 14.4390 14.8383 ROW%* 58 -2.5000 5.4000 1.8510 0,2225 0.7090 1.1955 PlT-ly 65 82.0000 623.0000 111.2360 316.0134 343.5690 371.1246 RETICs-ly 64 0.2990 5.3990 . 0.9520 1.5643 1.8020 2.0397 POLYs-ly 65 6.0000 67.0000 12.7800 31.6191 34.7850 37.9509 LYMPHs-ly 65 23.0000 82.0000 12.9880 53.1676 56.3850 59.6024
·MONOs-ly 65 1.0000 15.0000 3.3970 5.0815 5.9230 6.7645 EOSINs-ly 65 0.0000 11.0000 2.5140 2.1152 2.7380 3.3608 BASOs-ly 64 0.0000 2.0000 0.3620 0.0186 0.1090 0.1994 ZPP-3/12 68 1.0990 7.1990 1.0830 2.5559 2.8180 3.0801 FERRITIN-3/12 69 20.0000 565.0000 118.2690 128.7984 157.2030 185.6076 Log(ferritin} 3/12 69 1.3010 2.7520 0.3370 1.9961 2.0770 2.1579 ZPP-ly 65 1.5000 11.0990 1.3220 3.0855 3.4130 3.7405 ZPP * 59 -2.4010 3.9000 1.1810 0.2073 0.5150 0.8227 FERRITIN-ly 69 1.0000 244.0000 34.5000 29.4101 37.6960 45.9819 FERRITIN " 64 -538.0000 158.0000 122.3670 -141.9786 -111.4220 -80.8654 Log(ferritin) ·1 y 69 0.0000 2.3870 0.3290 1.3830 1.4620 1.5410 Log(ferritin) " 64 -1.6230 0.5400 0.4570 -0.6991 -0.5850 -0.4709 ZINC-PLASMA-3/12 69 55.0000 134.0000 17.9640 81.3236 85.6380 89.9524

TEST GROUP 95* CI 95t CI VARIABLE N Hin Hax SD Bottom Hean Top
ZINC-HAIR-3/12 44 54.5990 759.7990 187.1310 204.4564 261.3130 318.1696 ZINC-PLASMA-ly 68 54.0000 142.0000 16.9150 79.4357 83.5290 87.6223 ZINC-PLASMA* 63 -62.0000 62.0000 26.1530 -9.9017 -3.3170 3.2677 ZHIC-HAIR-ly 52 18.0000 457.0000 96.5280 102.3453 129.2070 156.0687 ZINC-HAIR * 28 -703.7990 253.1000 245.5570 -256.4509 -161.3930 -66.3351 # Infect:grade 1+2+3 70 0.0000 9.0000 2.1290 3.8925 4.4000 4.9075 I Infect. grade 1 70 0.0000 5.0000 1.2230 0.8655 1.1570 1.4485 # Infect. grade 2 70 0.0000 9.0000 2,0420 2.6422 3.1290 3.6158 #Infect.grade 3 70 0.0000 1.0000 0.3200 0.0377 0.1140 0.1903 #Infect.resp tract 70 0.0000 6.0000 1.2820 1.1804 1.4860 1.7916 #Infect.diarrhoea 70 0.0000 3.0000 0.9030 0.4987 0.7140 0.9293 I Infect. pyodenna 70 0.0000 4.0000 0. 7930 0.1400 0.3290 o. 5180 # Infect. thrush 70 0.0000 3.0000 0.7230 0.1846 0.3570 0.5294 I Infect other(-max) 70 0.0000 2.0000 0.3910 0.0498 0.1430 0.2362 # infect: other 70 0.0000 2.5520 0.5130 0.0657 0.1880 0.3103 I# Infect. other 70 0.0000 2.0000 0.3910 0.0498 0.1430 0.2362 #Infect.conjunct. 70 0.0000 1.0000 0.4130 0.1155 0.2140 0.3125 I Infect:grade 1+2+3 70 0.0000 11.8930 2.8030 5.1918. 5.8600 6.5282 # Infect:grade 1 70 0.0000 6.5380 1.6260 1.1604 1.5480 1.9356 # Infect:grade 2 70 0.0000 11.8930 2.6920 3.5163 4.1580 4. 7997 I# Infect:grade 3 70 0.0000 1.3480 0.4330 0.0508 0.1540 0.2572 # Infect: resp tract 70 0.0000 8.2330 1.7080 1.5718 1.9790 2.3862 # Infect: diarrhoea 70 0.0000 4.1340 1.1980 0.6624 0.9480 1.2336 # Infect: pyodenna 70 0.0000 5.2860 1.0450 0.1859 0.4350 0.6841 I Infect: thrush 70 0.0000 3.9960 0.9610 0.2459 0.4750 0.7041 # Infect:other(-max) 70 0.0000 2.5520 0.5130 0.0657 0.1880 0.3103 # Infect: conjunct 70 0.0000 1.4090 0.5530 0.1542 0.2860 0.4178 Mantoux 3/12 70 0.0000 21.0000 5. 7740 3.9805 5.3570 6.7335 Candida 3/12 73 0.0000 20.0000 5.9390 2.9296 4.3150 5.7004 Mantoux 1 y 67 0.0000 22.0000 7 .1770 5.2798 7.0300 8.7802 Mantoux * 64 -20.0000 22.0000 8.4830 -0.6493 1.4690 3.5873 Candida 1 y 68 0.0000 27 .0000 8.3390 7.7320 9.7500 11. 7680 Candida * 67 -17.0000 25.0000 9.3580 2.8969 5.1790 7 .4611 Antibody tetanus ma 68 0.0000 5120.0000 652.9100 9.2084 167.2060 325.2036 Antibody polio ma 69 0.0000 20.0000 4.2730 0.7128 1.7390 2. 7652 log[Tetanus] ma 68 0.0000 3.7090 1.0080 0.8971 1.1410 1.3849 log[Polio] ma 69 0.0000 1.3220 0.3890 0.0876 0.1810 0.2744 Antibody tetanus 3m 69 0.0000 320.0000 43.9750 2.6265 13.1880 23.7495 Antibody polio 3/12 69 0.0000 160.0000 38.5930 28.2671 37.5360 46.8049 log(Tetanus] 3/12 69 0.0000 2.5070 0.6780 0.2692 0.4320 0.5948 log[Pol io] 3/12 69 0.0000 2.2070 0.6140 1.1665 1.3140 1.4615 Antibody tetanus ly 69 0.0000 10240.0000 1388.6840 59.6681 393.1880 726. 7079 Antibody tetanus* 64 -280.0000 10230.0000 1442.1780 34.7141 394.8440 754.9739 Antibody polio 1 y. 67 0.0000 160.0000 54.9420 57 .6467 71.0450 84.4433 · Antibody polio* 63 -140.0000 160.0000 70.1800 15.5054 33.1750 50.8446 log(Tetanus] 1 yr 69 0.0000 4.0100 o. 7170 1.7178 1.8900 2.0622 log(Tetanus] 1 y * 64 -1.6130 3.7090 1.0980 1.1558 1.4300 1.7042 log[[Polio] 1 yr 67 0.0000 2.2070 0.4920 · 1.5590 1.6790 1.7990 log[Polio] 1 yr* 63 -1.6130 2.2070 0.8180 0.1570 0.3630 0.5690 OKT3 3/12 63 47.0000 88.0000 10.0630 65.4504 67 .9840 70.5176 OKT4 3/12 63 19.0000 87 .0000 12.8310 48.3725 51.6030 54.8335 OKT8 3/12 63 5.0000 42.0000 7.7510 13.8895 15.8410 17.7925 SMIG 3/12 63 5.0000 43.0000 7.4390 15.5240 17 .3970 19.2700 OKT4/0KT8 3/12 63 0.7620 12.4290 2.5370 3.5232 4.1620 4.8008

TEST GROUP 95% CI 95% Cl
VARIABLE N Hin Hax so Bottom Hean Top
OKT3 ly 69 40.0000 93.0000 11.2920 69.8820 72.5940 75.3060
OKT4 ly 69 16.0000 75.0000 12.3430 43.8616 46.8260 49.7904
OKT8 ly 69 7.0000 67.0000 9.4740 20.6666 22.9420 25.2174
SMIG ly 69 4.0000 46.0000 7.7260 17.3324 19.1880 21.0436
OKT4/0KT8 ly 69 0.3580 5.9000 1.2040 2.1208 2.4100 2.6992
OKT4/0KT8 * 60 -9.5270 1.6920 2.3750 -2.2343 -1.6210 -1.0077
pha-pcps-3/12 29 89.7990 285 .• 5790 39.4990 122.4799 137.4810 152.4821
pha-pccs-3/12 29 78.4190 280,1690 42.1350 127.1048 143.1070 159.1092
pha-ccps-3/12 29 66.9090 133.0490 14.6710 98.2282 103.8000 109.3718
pha-pcps-ly 38 43.2190 360.0790 64.UOO 120.9845 142.0580 163.1315
pha-pccs-ly 38 . 63.8590 298.2690 44.6370 128.7272 143.3860 158.0448
pha-ccps-ly 38 50.8290 147.0890 19.7890 95.0453 101.5440 108.0427
pha-pcps * 29 -161.8200 108.5100 51.2680 -20.7388 -1.2680 18.2028 Birth weight 75 3.0000 4.2090 0.3060 3.2986 3.3690 3.4394 SO score weight brth 75 -0.7500 2.5240 o. 7470 0.1062 0.2780 0.4498 Weight@ 3/12 75 4.8490 8.1590 0.6180 5.8938 6.0360 6.1782 length@ 3/12 75 52.3990 65.8990 2.1410 58.6275 59.1200 59.6125 Head circ@ 3/12 75 37.5990 43.0990 1.1340 40.1041 40.3650 40.6259 SO score weight 3/12 75 -0.5670 2.4530 0.6300 0.3671 0.5120 0.6569 SO score length 3/12 74 -1.8850 1.68,40 0.6850 -0.4657 -0.3070 -0.1483 Weight/(1ength)**3 3 74 23.4940 36.5870 2.3040 28.4953 29.0290 29.5627 Weight@ ly 70 8.0090 12.9190 1.1570 10.0582 10.3340 10.6098 Weight* 70 2.5400 6.5300 0.9580 4.0646 4.2930 4.5214 Length@ ly 71 69.8990 82.0000 2.5560 74.6241 75.2290 75.8339 Length* 71 7.7000 25.9000 2.5250 15.4085 16.0060 16.6035 Head circ@ ly 71 43.5990 50.0000 1.2820 46.2336 46.5370 46.8404 SO score weight 1 y 70 -1.4610 2.5570 1.0720 0.2254 0.4810 0,7366 SD·score length 1 y 71 -2.0370 2.2750 0.9340 -0.1560 0.0650 0.2860 SD score length* 70 -2.4080 2.4330 0.7430 0.1469 0.3240 0.5011 Weight/( length)**3y 70 19.9290 33.9580 2.3630 23.6627 24.2260 24. 7893 Bact % init 1hr 3/12 33 32.0000 224.0000 44.9180 86,6068. 102.5150 118.4232 Bact % lnit 2hr 3/12 33 27.0000 237.0000 53.5660 92.0290 111.0000 129.9710 Bact % ctl 1hr 3/12 33 52.9390 427.2690 84.2370 145.1625 174.9960 204.8295 Bact % ctl 2hr 3/12 33 86.4790 2400.0000 423.8000 196.4856 346.5790 496.6724 Bact % AB 1 hr 3/12 33 16.1590 93.3290 17.1590 41.0070 47.0840 53.1610 Bact % AB 2 hr 3/12 33 8.7390 69.4090 13.9850 26.1961 31.1490 36.1019 SD score weight* 70 -1.8290 2.0630 0.9150 -0.2481 -0.0300 0.1881 Bact norm 1 hr 3/12 33 -34.7900 88.3990 26.1900 14.0685 23.3440 32.6195 Bact norm 2 hr 3/12 33 -2.3400 .64.9590
' 15.4850 14.9048 20.3890 25.8732
Bact % init 1hr ly 29 20.0000 227.0000 57.3120 72.2338 94.0000 115. 7662 Bact % init 1hr * 25 -149.0000 172.0000 76.5750 -43.2612 -11. 7200 19.8212 Bact % init 2hr ly 29 14.0000 347.0000 95.7650 76.9400 113.3100 149.6800 Bact % init 2hr * 25 -160.0000 213.0000 118.6110 -46.4959 2.3600 51.2159 Bact % ct I 1 hr ly 24 28.2290 487 .1690 92.1160 90.14.23 128.9500 167.7577 Bact % ctl 1 hr* 21 -247.2300 341.7200 123.2280 -109.7096 -53.7880 2.1336 Bact % ctl 2 hr ly 29 42.5490 1446.1490 304.0170 93.6702 209.1310 324.5918 Bact % AB 1 hr ly 28 8.0590 100.6090 27.6920 31.6821 42.4020 53.1219 Bact % AB 2 hr ly 29 2.6290 91.4790 27.5720 21.1036 31.5750 42.0464 Bact nonn 1 hr 1 y 24 -,,286.6700 101.8490 91.8060 -43.5101 -4.8330 33.8441 Bact nonn 2 hr 1 y 29 -54.3700 83.8290 34.7530 -1. 7266 11.4720 24.6706 hygiene 73 1.0000 3.0000 0.7190 2.4483 2.6160 2.7837 daycare 73 1.0000 3.0000 0.3710 2.7905 2.8770 2.9635 crowding 73 1.0000 3.0000 0.9420 1.6573 1.8770 2.0967 finance 73 1.0000 3.0000 0.7420 2.4159 2.5890 2.7621

TEST GROUP 9St CI 95-t CI VARIABLE N Hin Hex so Bottom Hean Top
careseeking 73 1.0000 3.0000 0.2040 1.9384 1.9860 2.0336 MDI-pre 22 10.7000 105.5689 110.3000 115.0311 POI-pre 22 7.9000 94.0070 97.5000 100.9930 MDI-diff (Post} 8 5.0000 -7.6765 -3.6000 0.4765 PDI-diff (Post} 8 8.9000 -5.4561 1.8000 9.0561 Meat/Fish 74 2.0000 9.0000 1.3800 4.3603 4.6800 4.9997 Cereal 75 0.0000 4.0000 0.7900 1.9283 2.1100 2.2917 Egg 74 0.0000 7.0000 1.5200 3.4879 3.8400 4.1921 Fruit 70 1.0000 9.0000 1.4100 3.8239 4.1600 4.4961 Vegetable 75 1.0000 6.0000 1.0600 2.9562 3.2000 3.4438

9~ CI of DIFFERENCE of MEANS POWER for alpha .. St, & dfff:
VARIABLE Bottom Hean Top p N_S_PCT BETA Observ 10% 25ft 501;
First bottle -0.0350 -0.3563 0.2863 0.8325 6090 0.9999 0.0001 0.1565 0.6328 0.9902
Last breast 0.4470 -0.9379 1.8319 0.5239 611 0.9999 0.0001 0.0001 0.2753 0.7709
Date of birth 0.0200 -0.0175 0.0575 0.2945 254 0.8149 0.1851 1.0000 1.0000 1.0000 · Date @ 3/12 entry 0.0170 -0.0172 0.0512 0.3306 293 0.8315 0.1685 1.0000 1.0000 1.0000 Date @ ly exit 0.0310 -0.0102 0.0722 0.1359 116 0.6865 0.3135 1.0000 1.0000 1.0000
Age@ entry (months) -0.0630 -0.1470 0.0210 0.1402 128 0.6883 0.3117 0.9916 0.9982 1.0000
Age at exit (months) 0.0450 -0.0623 0.1523 0.4086 373 0.8660 0.1340 1.0000 1.0000 1.0000
WBC-3/12 0.6510 -0.4625 1.7645 0.2492 174 0.7886 0.2114 0.5332 0.9905 0.9938
RBC-3/12 0.0490 -0.0701 0.1681 0.4184 351 0.8694 0.1306 0.9915 0.9980 1.0000
Hb.;.3/12 0.0920 '."0.1853 0.3693 0.5131 539 0.9999 0.0001 0.9924 1.0000 1.0000
HCT-3/12 0.3830 -0.4054 1.1714 0.3373 252 0.8359 0.1641 0.9925 1.0000 1.0000
MCV-3/12 0.0340 -1.7984 1.8664 0.9703 172471 0.9999 0.0001 0.9929 1.0000 1.0000
MCH-3/12 -0.0090 -0.7103 0.6923 0.9804 360571 0.9999 0.0001 0.9923 0.9999 1.0000
MCHC-3/12 -0.0720 -0.4259 0.2819 0.6883 1435 0.9999 0.0001 0.9995 1.0000 1.0000
RDW%-3/12 0.3380 -0.1654 0.8414 0.1864 132 0.7365 0.2635 0.9906 0.9957 1.0000
PLT-3/12 14.2430 -27.3257 55.8117 0.4988 506 0.9999 0.0001 0.5970 0.9908 0.9943
RETICS-3/12 0.2690 -0.1648 0.7028 0.2204 148 0.7672 0.2328 0.1694 0.6834 0.9904
POLYs-3/12 0.5480 -3.7798 4.8758 0.8023 3667 0.9999 0.0001 0.2388 0.8660 0.9912
LYMPHs-3/12 0.2790 -4.2542 4.8122 0.9033 15520 0.9999 0.0001 0.8014 0.9918 0.9963
MONOs-3/12 -0.1120 -1.1276 0.9036 0.8273 4834 0.9999 0.0001 . 0.1699 0.6854 0.9904
EOSINs-3/12 -0.6290 -1.4751 0.2171 0.1435 106 0.6921 0.3079 0.0001 0.3150 0.8350
BASOs-3/12 -0.0440 -0.2072 0.1192 0.6003 803 0.9999 0.0001 0.0001 0.0001 0.1633 WBC-ly 0.0890 -0.9672 1.1452 0.8673 8692 0.9999 0.0001 0.5320 0.9905 0.9938 RBC-ly 0.0500 -0.0926 0.1926 0.4892 502 0.8968 0.1032 0.9916 0.9980 1.0000 RBC * 0.0420 -0.1009 0.1849 0.5578 580 0.9999 0.0001 0.1975 0.7822 0.9908 Hb-ly 0.3590 0.0151 o. 7029 0.0410 57 0.4656 0.5344 0.9915 0.9980 1.0000 Hb * 0.4870 0.1120 0.8620 0.0114 30 0.2794 0.7206 0.0001 0.0001 0.1168 HCT-ly . 0.9500 -0.0925 1.9925 0.0739 74 0.5706 0.4294 0.9915 0.9979 1.0000 HCT * 0.9830 -0.1521 2.1181 0.0886 67 0.6044 0.3956 0.0001 0.1411 0.3969 MCV-ly 1.2390 -0.6669 3.1449 0.2005 146 0.7495 0.2505 0.9920 0.9993 1.0000 MCV * 1.4510 -0.3954 3.2974 0.1221 81 0.6612 0.3388 0.1757 0.7070 0.9905 MCH-ly 0.5180 -0.2164 1.2524 0.1649 124 0 .7163 0.2837 0.9914 0.9976 1.0000 MCH * 0.7890 0.0801 1.4979 0.0295 40 0.4089 0.5911 0.1992 0.7878 0.9908 MCHC-ly 0.1610 -0.1651 0.4871 0.3305 253 0.8325 0.1675 1.0000 1.0000 1.0000 MCHC * 0.4690 -0.0161 0.9541 0.0581 54 0.5250 0.4750 0;0001 0.2026 0.6096 ROW%-ly -1.0910 -1.6944 -0.4876 0.0005 19 0.0583 0.9417 0.9904 0.9951 1.0000 ROW%* -1.5480 -2.3365 -0.7595 0.0002 13 0.0353 0.9647 0.0001 0.1446 0.4089 PLT-ly -11.1360 -48.9666 26.6946 0.5612 712 0.9999 0.0001 0.4383 0.9901 0.9931 RETICs-ly 0.1230 -0.2739 0.5199 0.5381 621 0.9999 0.0001 0.1432 0.5780 0.9900 POLYs-ly 3.4680 -0.7448 7 .6808 0.1058 90 0.6359 0.3641 0.3379 0.9645 0.9922 LYMPHs-ly -4.3650 -8,6550 -0.0750 0.0462 59 0.4864 0.5136 0. 7589 0.9915 0.9958 MONOs-ly 1.2900 0.1298 2.4502 0.0297 49 0.4116 0.5884 0.1511 0.6115 0.9901 EOSINs-iy -0.4790 -1.5899 0.6319 0.3958 329 0.8606 0.1394 0.0001 0.2612 0.7420 BASOs-ly 0.0090 -0.1184 0.1364 0.8844 12167 0.9999 0.0001 0.0001 0.0001 0.1308 ZPP-3/12 -0.0970 -0.4953 0.3013 0.6336 llOO 0.9999 0.0001 0.2918 0.9388 0.9918 FERRITIN-3/12 1.5970 -38.3398 41.5338 0.9371 43004 0.9999 0.0001 0.1214 0.4823 0.9634 Log(ferritin) 3/12 0.0070 -0.1094 0.1234 0.9053 19025 0.9999 0.0001 0.9341 0.9929 0.9985 ZPP-ly -0.5370 -1.0367 -0.0373 0.0353 53 0.4411 0.5589 0.3012 0.9491 0.9919 ZPP * -0.6650 -1.2327 -0.0973 0.0220 39 0.3672 0.6328 0.0001 0.1089 0.2965 FERRITIN-ly 13.8960 3.9490 23.8430 0.0066 32 0.2205 o. 7795 0.0001 0.3369 0.8629 FERRITIN * 26.5080 -17.6979 70.7139 0.2374 164 0.7796 0.2204 0.0001 0.2811 0.7828 Log(ferritin) 1 y 0.2250 0.1022 0.3478 0.0004 19 0.0520 0.9480 0.5825 0.9907 0.9942 Log{ferritin) * 0.2770 0.1146 0.4394 0.0010 20 0.0856 0.9144 0.1435 0.5795 0.9900 ZINC-PLASMA-3/12 -5.5190 -13.0257 l.9877 0.1482 126 0.6986 0.3014 0.6354 0.9910 0.9947

95t CI of DIFFERENCE of MEANS POWER for alpha • St, & diff :
VARIABLE Bottom Mean Top p N_S_PCT BETA Observ 10% 25J; 50%
ZINC-HAIR-3/12 37.2900 -37.6075 112 .1875 0.3245 150 0.9999 0.0001 0.0001 0.0001 0.0001 ZINC-PLASMA-ly -7.0780 -14.2746 0.1186 0.0538 62 0.5132 0.4868 0.6556 0.9910 0.9948 ZINC-PLASMA * -2.4130 -12.5029 7.6769 0.6365 975 0.9999 0.0001 0.0001 0.0001 0.0001 ZINC-HAIR-ly -13.0900 -54.9201 28.7401 0.5361 503 0.9999 0.0001 0.0001 0.0001 0.0001 ZINC-HAIR * -67.4560 -187.8139 52.9019 0.2657 78 0.7032 0.2968 0.1315 0.1788 0.2882 # Infect:grade 1+2+3 -0.3580 -1.1484 0.4324 0.3718 315 0.8509 0.1491 0.2071 0.8065 0.9909 #Infect.grade 1 -0.1010 -0.5236 0.3216 0.6375 1130 0.9999 0.0001 0.0001 0.2880 o. 7970 # Infect. grade 2 -0.2100 -0.9583 0.5383 0.5795 820 0.9999 0.0001 0.1394 0.5611 0.9863 #Infect.grade 3 -0.0470 -0.1660 0.0720 0.4361 414 0.8769 0.1231 0.0001 0.0001 0.2032 #Infect.resp tract 0.0560 -0.3870 0.4990 0.7132 4038 0.9999 0.0001 0.0001 0.3592 0.8912 #Infect.diarrhoea -0.0760 -0.3969 0.2449 0.6402 1151 0.9999 0.0001 0.0001 0.2109 0.6292 # Infect. pyodenna -0.0580 -0.3547 0.2387 0.6970 1689 0.9999 0.0001 0.0001 0.0001 0.2202 # Infect. thrush -0.0460 -0.2974 0.2054 0.7174 1928 0.9999 0.0001 0.0001 0.1149 0.3147
I Infect other(-max) -0.0870 -0.2345 0.0605 0.2471 184 0.7857 0.2143 0.0001 0.0001 0.2326 ii infect: other -0.1830 -0.4093 0.0433 0.1136 99 0.6466 0.3534 0.0001 0.0001 0.2243
I Infect. other -0.1310 -0.2991 0.0371 0.1249 106 0.6672 0.3328 0.0001 0.0001 0.2262
#Infect.conjunct. -0.0280 -0.1797 0.1237 0. 7191 1894 0.9999 0.0001 0.0001 0.1137 0.3108
I Infect:grade 1+2+3 -0.5570 -1.6088 0.4948 0.2971 230 0.8164 0.1836 0.2094 0.8109 0.9909
ii Infect:grade 1 -0.1390 -0.6989 0.4209 0.6240 1047 0.9999 0.0001· 0.0001 0.2924 0.8045
# Infect:grade 2 -0.3530 -1.3512 0.6452 0.4848 516 0.8955 0.1045 0.1402 0.5650 0.9874
# Infect:grade 3 -0.0640 -0.2250 0.0970 0.4339 408 0.8758 0.1242 0.0001 0.0001 0.2032
# Infect: resp tract 0.0780 -0.5203 0.6763 0.7961 3797 0.9999 0.0001 0.0001 0.3558 0.8869
· # Infect: diarrhoea -0.1170 -0.5464 0.3124 0.5906 869 0.9999 0.0001 0.0001 0.2107 0.6288
# Infect: pyodenna -0.0890 -0.4861 0.3081 0.6568 1285 0.9999 0.0001 0.0001 0.0001 0.2207
# Infect: thrush -0.0690 -0.4046 0.2666 0.6828 1527 0.9999 0.0001 0.0001 0.1152 0.3158
# Infect:other(-max) -0.1210 -0.3174 0.0754 0.2277 169 0.7701 0.2299 0.0001 0.0001 0.2330
# Infect: conjunct -0.0380 -0.2410 0.1650 0.7151 1842 0.9999 0.0001 0.0001 0.1138 0.3112
Mantoux 3/12 -0.5990 -2.4958 1.2978 0.5335 679 0.9999 0.0001 0.0001 0.3083 0.8265 Candida 3/12 -0. 0370 -2.0275 1.9535 0.9707 204807 0.9999 0.0001 0.0001 0.1900 0.5686 Mantoux 1 y -1.0200 -3.5963 1.5563 0.4347 396 0.8765 0.1235 0.0001 0.2978 0.8126 Mantoux * -0.7770 -3.8566 2.3026 0.6184 928 0.9999 0.0001 0.0001 0.0001 0.0001 Candida 1 y 0.8670 -2.0977 3.8317 0.5639 731 0.9999 0.0001 0.0001 0.3390 0.8656 Candida* 0.3120 -2.7778 3.4018 0.8417 6089 0.9999 0.0001 0.0001 0.1286 0.3576 Antibody tetanus ma 100.7540 -65.0953 266.6033 0.2316 172 0:7751 0.2249 0.0001 0.0001 0.1070 Antibody polio ma -0.2900 -1.8865 1.3065 0. 7201 2054 0.9999 0.0001 0.0001 0.0001 0.2142
log[Tetanus] ma 0.0770 -0.2698 0.4238 0.6580 1291 0.9999 0.0001 0.0001 0.3446 0.8727 log[Polio] ma -0.0010 -0.1357 0.1337 0.9921 999999 0.9999 0.0001 0.0001 0.0001 0.2654 Antibody tetanus 3m 1.9020 -9.8833 13.6873 0.7500 2621 0.9999 0.0001 0.0001 0.0001 0.1786 Antibody polio 3/12 1.3690 -12.5104 15.2484 0.8455 6472 0.9999 0.0001 0.0001 0.2592 0.7377 log[Tetanus] 3/12 -0.1280 -0.3560 0.1000 0.2675 217 0.8022 0.1978 0.0001 0.1904 0.5703 log[Polio] 3/12 0.0760 -0.1474 0.2994 0.5015 544 0.9999 0.0001 0.2036 0.7999 0.9908 Antibody tetanus ly 200.7290 -155.6047 557.0627 0.2671 200 0.8012 0.1988 0.0001 0.0001 0.1341 Antibody tetanus* 213.2920 -166.5834 593.1674 0.2685 189 0.8019 0.1981 0.0001 0.0001 0.1193 Antibody polio 1 y 12.6840 -5.7393 31.1073 0.1755 132 0.7265 0.2735 0.1041 0.4062 0.9299 Antibody polio * 3.5600 -21.3225 28.4425 0.7774 2724 0.9999 0.0001 0.0001 0.0001 0.2414 log[Tetanus] 1 yr -0.0890 -0.3185 0.1405 0.4436 423 0.8802 0.1198 0.3769 0.9803 0.9926 log[Tetanus] 1 y * 0.0240 -0.3563 0.4043 0.9004 14970 0.9999 0.0001 0.1133 0.4463 0.9530 log[[Polio] 1 yr 0.1330 -0.0530 0.3190 0.1589 123 0.7106 0.2894 0.3962 0.9882 0.9927 log[Polio] 1 yr* -0.0290 -0.3424 0.2844 0.8570 6511 0.9999 0.0001 0.0001 0.0001 0.2208
OKT3 3/12 -1.4850 -4.8693 1.8993 0.3870 323 0.8572 0.1428 0.9720 0.9936 1.0000 OKT4 3/12 1.1810 -3.1136 5.4756 0.5871 823 0.9999 0.0001 0.6431 0.9910 0.9947 OKT8 3/12 -0.5810 -3.1638 2.0018 0.6571 1231 0.9999 0.0001 0.2353 0.8593 0.9912
SMIG 3/12 -2.2120 -4.5791 0.1551 0.0667 71 0.5522 0.4478 0.3349 0.9633 0.9922 OKT4/0KT8 3/12 0.5600 -0.2139 1.3339 0.1553 119 0.7054 0.2946 0.1710 0.6895 0.9904

95t CI of DIFFERENCE of MEANS POWER for alpha "' St, & diff :
VARIABLE Bottom Hean Top p N_S_PCT BETA Observ lat 25% SOis
OKT3 ly -1.5460 -5.4885 2.3965 0.4391 398 0.8781 0.1219 0.9523 0.9931 0.9990 OKT4 ly .:.0.0690 -4.8714 4.7334 0.9775 296540 0.9999 0.0001 0.4805 0.9903 0.9934 OKT8 ly 0.4160 -3.0644 3.8964 0.8135 4285 0.9999 0.0001 0.2527 0.8921 0.9914 SMIG ly 0.5920 -2.1009 3.2849 0.6643 1267 0.9999 0.0001 0.2820 0.9279 0.9917 OKT4/0KT8 ly -0.1190 -0.5859 0.3479 0.6156 942 0.9999 0.0001 0.1829 0.7317 0.9906
OKT4/0KT8" -0.6560 -1.4388 0.1268 0.1000 75 0.6246 0.3754 0.0001 0.1362 0.3818
pha-pcps-3/12 3.7390 -21.3489 28.8269 0.7663 1203 0.8567 0.1433 0.2876 0.8564 1.0000
pha-pccs-3/12 4.3300 -19.3645 28.0245 0.7155 800 0.8469 0.1531 0.3166 0.9151 1.0000 pha-ccps-3/12 5.8290 -1.8768 13.5348 0.1352 47 0.5791 0.4209 0.8304 1.0000 1.0000 pha-pcps-ly 1.6600 -29.8113 33.1313 0.9163 10152 0.8847 0.1153 0.2464 0.6989 1.0000 pha-pccs-ly 0.5530 -23.2465 24.3525 0.9631 52317 0.8933 0.1067 0.3198 0.9180 1.0000 pha-ccps-ly -0.5910 -9.8742 8.6922 0.8990 6783 0.8815 0.1185 0.6783 1.0000 1.0000 pha-pcps * -16.3000 -52.4018 19.8018 0.3685 114 0.8527 0.1473 0.0001 0.0001 0.0001 Birth weight -0.0430 -0.1428 0.0568 0.3995 389 0.8610 0.1390 0.9915 0.9979 1.0000 SO score weight brth -0.0780 -0.3141 0.1581 0.5132 662 0.9999 0.0001 0.0001 0.0001 0.2615 Weight@ 3/12 -0.0240 -0.2309 0.1829 0.8211 5368 0.9999 0.0001 0.9909 0.9965 1.0000 Length@ 3/12 -0.0120 -0.6686 0.6446 0.9711 216275 0.9999 0.0001 0.9986 1.0000 1.0000 Head circ@ 3/12 -0.3400 -0.7495 0.0695 0.1027 105 0.6317 0.3683 0.9997 1.0000 1.0000 SD score weight 3/12 0.0360 -0.1814 0.2534 0.7453 2635 0.9999 0.0001 0.0001 0.2008 0.6055 SD score length 3/12 0.1120 -0.1061 0.3301 0.3122 272 0.8238 0.1762 0.0001 0.1324 0.3696 Weight/(1ength)**3 3 -0.2240 -0.9125 0.4645 0.5211 678 0.9999 0.0001 0.9926 1.0000 1.0000 Weight@ ly 0.2410 -0.1617 0.6437 0.2391 182 0.7807 0.2193 0.9904 0.9952 LOOOO Weight* 0.2960 -0.0267 0.6187 0.0719 77 0.5661 0.4339 0.7113 0.9913 0.9954 Length@ ly 0.4930 -0.3792 1.3652 0.2655 205 0.8004 0.1996 0.9981 1.0000 1.0000 Length* 0.5570 -0.2446 1.3586 0.1721 136 0.7229 0.2771 0.9642 0.9934 0.9996 Head circ@ ly -0.1700 -0.6038 0.2638 0.4397 427 0.8784 0.1216 1.0000 1.0000 1.0000 SO score weight 1 y 0.2510 -0.1304 0.6324 0.1951 150 0.7449 0.2551 0.0001 0.0001 0.1594 SD score length 1 y 0.1980 -0.1074 0.5034 0.2021 156 0,7508 0.2492 0.0001 0.0001 0.0001 SD score length* 0.0690 -0.1767 0.3147 0.5776 826 0.9999 0.0001 0.0001 0.0001 0.2156 Weight/(1ength)**3y 0.1070 -0.6044 0.8184 0.7665 2878 0.9999 0.0001 0.9915 0.9980 1.0000 Bact % init 1hr 3/12 -6.3290 -29.1824 16.5244 0.5819 408 0.9999 0.0001 0.0001 0.0001 0.0001 Bact % init 2hr 3/12 -13.4060 -47.1261 20.3141 0.4299 198 0.9999 0.0001 0.0001 0.0001 0.0001 Bact % ctl 1hr 3/12 -17.7000 -68.2760 32.8760 0.4869 255 0.9999 0.0001 0.0001 0.0001 0.0001 Bact % ctl 2hr 3/12 -30.2190 -219.3218 158.8838 0.7505 1224 0.9999 0.0001 0.0001 0.0001 0.0001 Bact % AB 1 hr 3/12 -3.5790 -13.3254 6.1674 0.4658 232 0.9999 0.0001 0.0001 0.0001 0.0001 Bact % AB 2 hr 3/12 -4.0230 -13.1510 5.1050 0.3818 161 0.9999 0.0001 0.0001 0.0001 0.0001 SD score weight* 0.2230 -0.0860 0.5320 0.1550 125 0.7068 0.2932 0.0001 0.0001 0.0001 Bact nonn 1 hr 3/12 2.4710 -17.1949 22.1369 0.8026 1980 0.9999 0.0001 0.0001 0.0001 0.0001 Bact nonn 2 hr 3/12 . -4.7070 -15.1897 5. 7757 0.3730 155 0.9999 0.0001 0.0001 0.0001 0.0001 Bact % init 1hr ly -11.1430 -40.0963 17.8103 0.4438 184 0.7819 0.2181 0.1998 0.4968 0.9665 Bact % init 1hr • -26.7680 -69.0540 15.5180 0.2087 54 0.7607 0.2393 0.0001 0.0001 0.0001 Bact % init 2hr ly -13~4400 -60.5307 33.6507 0.5697 335 0.8171 0.1829 0.1740 0.3424 0.8068 Bact % init 2hr * -21.3540 -88.5089 45.8009 0.5249 214 0.9999 0.0001 0.0001 0.0001 0.0001 Bact % ct1 1 hr ly -1.8030 -46.1233 42.5173 0.9351 14046 0.9999 0.0001 0.0001 0.3013 0.8172 Bact % ctl 1 hr* -3.1850 -75.7628 69.3928 0.9296 9419 0.9999 0.0001 0.0001 0.0001 0.1087 Bact % ctl 2 hr ly 9.1020 -117 .0558 135.2598 0.8856 5235 0.8790 0.1210 0.1471 0.2273 0.4613 Bact % AB 1 hr ly -5.9290 -21.8648 10.0068 0.4581 169 0.8874 0.1126 0.0001 0.2843 0.7905 Bact % AB 2 hr ly -2.2240 -15 .8472 11.3992 0.7445 961 0.8525 0.1475 0.1696 0.3190 0.7541 Bact nonn l hr 1 y -8.3430 -62.9893 46.3033 0.7598 931 0.9999 0.0001 0.0001 0.0001 0.0001 Bact nonn 2 hr 1 y -0.8400 -18.1371 16.4571 0.9228 10862 0.8859 0.1141 0.1199 0.1499 0.1997 hygiene -0.1020 -0.3327 0.1287 0.3842 362 0.8559 0.1441 0.6199 0.9909 0.9945 daycare 0.0730 -0.0542 0.2002 0.2524 215 0.7956 0.2044 0.9901 0.9943 1.0000 crowding -0.1370 -0.4485 0.1745 0.3847 366 0.8570 0.1430 0.2344 0.8577 0.9912 finance -0.0730 -0.3069 0.1609 0.5386 726 0.9999 0.0001 0.5955 0.9908 0.9943

95% CI of DIFFERENCE of MEANS POWER for alpha ,. 5%", & diff : VARIABLE Bottom Hean Top p N 5 PCT BETA Observ l()J; 25% SOJ;
careseeking 0.0000 -0.0874 0.0874 0.9930 999999 0.9999 0.0001 0.9901 0.9944 1.0000 MDI-pre -2.7000 -10.3688 4.9688 1.0000 95 0.8956 0.1044 0.0001 0.0001 0.0001 POI-pre -6.9000 -13.1420 -0.6580 0.0500 10 0.4112 0.5888 0.0001 0.0001 0.0001 MDI-diff (Post) -7. 6000 -13.8234 -1.3766 0.0200 6 0.3223 0.6777 0.0001 0.0001 0.0001 PDI-diff (Post) 2.3000 -3.0262 7.6262 1.0000 48 0.8585 0.1415 0.0001 0.0001 0.0001 Meat/Fish -0.5100 -1.0433 0.0233 0.0000 76 0.5357 0.4643 0.4376 0.9901 0.9931 Cereal 0.0500 -0.2086 0.3086 0.0000 1918 0.9999 0.0001 0.3500 0.9694 0.9923 Egg -0.4000 -0.9548 0.1548 0.0000 134 0.7074 0.2926 0.2958 0.9433 0.9918 Fruit 0.0000 -0.4783 0.4783 0.0000 999999 0.9999 0.0001 0.3965 0.9883 0.9927 Vegetable -0.2000 -0.6020 0.2020 0.0000 292 0.8311 0.1689 0.3616 0.9741 0.9924


A.4 IRON NUTRITION AND IMMUNITY
APPENDIX 4 - Composition of Control and Test milk formulas
COMPOSITION OF LACTOGEN FULL PROTEIN
According to the manufacturer's label, Lactogen full protein is made from partially skimmed milk, sucrose,
maltodextrin, com oil, lactose, vitamins, ferrous sulfate, zinc sulfate and copper sulfate. Its average
composition is Fat: 19.0% (including 3.8% com oil, rich in unsaturated fatty acids), Protein: 21.6%,
Lactose: 31.6%: Sucrose: 12.0%: Maltodextrin: 8.0%, Ash: 4.8%: Moisture: 3.0%. Energy per 100 g
powder = 1940 kj.

APPENDICES A.S
Vitamin and mineral content of LACTOGENFULLPROTEIN
Nutrient
Vitamin A
Vitamin 03
Vitamin E
Vitamin C
Vitamin Bl
Vitamin B2
Vitamin B4
Vitamin B12
Niacin
Pantothenic acid
Vitamin K
Folic acid
Biotin
Choline
Inositol
Iron for Control group
for Test group
Copper
Zinc
Manganese
Calcium
Phosphorus
Sodium
Magnesium
Chloride
Potassium
per 100 g
1390 IU
280 IU
5.5 IU
37 mg
0.28 mg
0.4 mg
0.35 mg
lug
3.5 mg
2 mg
38 ug
42 ug
10 ug
35 mg
21 mg 8.3 mg
40 mg
0.28 mg
3.5 mg
24 ug
770 mg
600 mg
320 mg
70 mg
725 mg
970 mg
per litre
2003 IU
403 IU
7.9 IU
53 mg
0.40 mg
0.58 mg
0.50 mg
1.4 ug
5.1 mg
2.9 mg
54.8 ug
60.5 ug
14.4 ug
50.5 mg
30. 3 mg
11.96 mg
57.66 mg
O. 40 mg
5.1 mg
34 .. 6 ug
1109.9 mg
865 mg
461 mg
101 mg
1045 mg
1398 mg
Note The concentrations of nutrients per 100 g formula are the manufacturer's specifications. The concentrations of
nutrients per litre were calculated according to the manufacturer's recommendation for reconstitution: 8 measures of 4
g for 200 ml water. When reconstituted, the fluid volume was 222 ml. The values in the left hand column were
multiplied by 320/222 to obtain the right hand set of figures.

A.6
APPENDIX S - Programs
Program to Stratify Subjects
IRONNUTRITION AND IMMUNITY
This program was written for the Tektronix microcomputer
lREM STRATIFY 2 REM Program to stratify subjects according to number of siblings and weight 3REM 5 GOTO 100 100 INIT 110 P=41 120 DIM A0(2), A$(72), Z$(132) 130PAGE 140 PRINT "STRATIFY ROUTINE" 150 PRINT "J _J _Enter number of file containing the data" 160 INPUT IO 170FIND IO 180 READ @33:AO 190 DIM C$(90 + 8* AO(l) ),BO(A0(2),A0(1)),A(30,8),B(30,8),N(8) 200 DIM Al(8),B1(8) 210 READ @33:C$ 220 READ @33:BO,ZO 230 N(l) = (IO-INT(I0/2)*2)"'2 + 1 240 FOR l=l TO 8 250 IF I= 1 THEN 290 260 N(I)=3 270 IF N(I-1)=1 THEN 290 280 N(I)=l 290A(I)=O 300 Bl(I)=O 310 FOR J = 1 TO 30 320 A(J ,I)= 0 330 B(J,I) =0 340NEXT J 350NEXTI 360 Nl=A0(2) 370 FOR 1=1 TO Nl 380 IF BO(l,3) < 3000 0 R BO(I,3) > 4999 THEN 520 390 J = BO(I,5) 400 PRINT BO(I,3),J 410 IF J>15 OR J<l THEN 520 420J=8MINJ 430 IF N(J)=2 OR N(J) =3 THEN 470 440 Al(J) =Al(J) + 1 450 A(Al(J),J) =BO(I,l) 460 GOTO 490 470 Bl(J) = Bl(J) + 1 480 B(Bl(J),J) =BO(I,1) 490 N(J) = N(J) + 1 500 IF N(J)<5 THEN 520 510 N(J)=l 520NEXTI 530 A$=SEG(C$,1,72) 540 PRINT @P: USING "P, 4X,72A":A$

APPENDICES
550 PRINT @P: USING "/ / /": 560 PRINT @P: USING "/14A'':"Number of sibs" 570 FOR l=l TO 8 580 PRINT @P: USING 590:1,1; 590 IMAGE 4D,4D,2X,S 600NEXTI 610 PRINT @P: 620 FOR I=l TO 8 630 PRINT @P: USING "lOA,S":" TST CTL " 640NEXTI 650 PRINT @P: USING N / j": 660 FOR J = 1 TO 30 670 IF A(J,l)+B(J,1)=0 THEN 820 680 FOR l=l TO 8 690 IF A(J,l)=O THEN 730 700 PRINT @P: USING 710:A(J,I); 710 IMAGE 40,S 720GOT0750 730 PRINT @P: USING 740: 740 IMAGE 4X,S 750 IF B(J,I) =0 THEN 780 760 PRINT @P: USING 710:B(J,1); 770GOTO 790 780 PRINT @P: USING 740: 790 PRINT @P: USING "2X,S": 800NEXTI 810 PRINT @P: 820 NEXT J 830 PRINT @P: USING "P,4X,72A":A$ 840 PRINT @P: USING "//4A,36X,7A":"TEST","CONTROL" 850 FOR 1=8 TO 1 STEP -1 860 PRINT@P:USING "//15A,1D":"Number of sibs=",I 870 FOR J = 1 TO 30 880 IF A(J,l)=O AND B(J,l)=O THEN 970 890 IF A(J ,I)= 0 THEN 920. 900 PRINT @P: USING "4D,36X,S":A(J,I); 910GOT0940 920 PRINT @P: USING "40X,40,S":B(J,I); 930 GOTO 960 940 IF B(J,I) =0 THEN 960 950 PRINT @P: USING "40,S":B(J,I); 960 PRINT @P: USING"//": 970NEXT J 980NEXTI 990PAGE 1000 PRINT "THE END" 1010END
A.7

A.8 IRON NUTRITION AND IMMUNITY
Program to Calculate 95% Confidence Limits and "NS%"
This program was written in dBase Ill and runs on an IBM compatable PC.
Note/* Note/*
PROGRAM TO CALCULATE 95% CONFIDENCE LIMITS OF MEANS
Note/* REFERENCES: Note/* Colton T. Statistics in Medicine. Little Brown & Co. Boston 1974 Note/*. Note/* Note/* Note/* Note/*
Gardner MJ, Altman DG. Confidence limits rather than P values: estimation rather than hypothesis testing. British Medical Journal 1986: 292; 746-750
Note/* INPUT VARIABLES: Note/* Variable Name (ie Lotus Lable) of the variable Note/* N ALL, N CTL, N TST Numbers in All, Control and Test Groups Note/* Mean ALL, Mean CTL, Mean TST Note/* - Means-in All, Control and Test Groups Note/* SD _ALL, SD_ CTL, SD_ TST1 . Note/* Standard Deviations in All, Control and Test Note/* Groups
Note/* CALCULATED VARIABLES: Note/* MAF, MCF, MTF Lower bound (Floor) of 95% confidence limit Note/* MAC, MCC, MTC Upper bound (Ceiling) of 95% confidence limit Note/* MD Difference of Test and Control Means Note/* MDF, MDC 95% confidence limits of the Difference
Number required to reach 5% significance given beta = 100%
Note/* N_5_PCT Note/* Note/* FILES: Note/* STATS.dbf Contains the statistics
NB Must have above the fields Note/* Note/* Note/* Note/*
T95TAB.dbf Table of Significance limits of the t
Note/* Note/* Note/* .Note/* Note/* clear set echo off set talk off
N.ndx
set default to c za=l.96 zb=O select 1 use t95tab index n select 2 use stats go top rl=O do while .not. eof () clear rl=rl+l @1,1 say 'record '
distribution from Documenta Geigy, Ciba-Geigy Scientific Tables 7th edition pp 32-35
*"'*** NB t for alpha = 0.025 *****
Index for above table
&& 5% alpha for N 5% && use·l.645 for 10% beta for N 5%

APPENDICES
? r1 @3,1 say variable na=n all if na<l
na=l endif
if na>200 na=200 endif
nc=n ctl if nc<-1
nc=l endif
if nc>200 nc=200 endif.
nt=n tst if nt<l
nt=l endif
if nt>200 nt=200 endif
nd=n all-2 if nd<l
nd=l endif
if nd>200 nd=200 endif
select 1 seek na ta=t95 seek nc tc=t95 seek nt tt=t95 seek nd td=t95 select2 replace maf with (mean _all - ta*sd _ all/sqrt(n_ all)) replace mac with (mean_all + ta*sd_all/sqrt(n_all)) replace mcf with ( mean ctl - tc*sd ctl/ sqrt( n ctl)) replace mcc with (mean-ctl + tc*sd ctl/sqrt(n ctl)) replace mtf with (meanjst - tt*sd _t;/sqrt(n_t~°t)) replace mtc with (mean_ tst + tt*sd _tst/sqrt(n _tst)) replace md with (mean tst - mean ctl) sd _pooled=sqrt(((n_tst=i.)*sd _ tst**2 + (n _ ctl-l)*sd _ ctl**2)/(n_tst + n _ ctl-2)) se _ diff=sd _pooled*sqrt(l/n _tst + 1/n _ ctl) replace mdf with (md-td*se diff) replace mdc with (md + td*se diff) if mean ctl < > mean tst -
replace N 5 PCT with min(999999,2*(;d _pooled*(za + zb)/(mean _ ctl-mean _tst))"2)
else replace N _ 5 _ PCT with 999999
endif
A..9

A.10
skip enddo @ 15,15 say 'd on e'
IRON NUTRITION AND IMMUNITY

APPENDICES
dBase III Program to Calculate Beta (type II error)
The following program was written in dBase III and runs on an IBM compatible PC.
Note/* This program calculates Beta given the numbers, means and Note/* standard deviations of Control and Tests sets of data. Note/* Beta is the type II error and is calculated for alph,a = 0.025 for a oneNote/* sided significance test from tables for the noncentral t distribution No~/* . Note/* Note/* Note/* Note/* Note/* Note/*
REFERENCE: Statistical principles in experimental design Winer BJ, McGraw-Hill, 1971 Tokyo table C.13 page 884, and pages 33-35.
Note/* VARIABLES: Note/* Variable Name (eg Lotus Lable) of the variable Note/* N crL, N TST Numbers in Control and Test Groups Note/* M~an cr:C, Mean TST Means in Control and Test Groups Note/* Mean -ALL, N ALL Mean and Number for both groups combined Note/* SD CTL, SD TST Standard Deviations in Control and Test Groups Note/* Bet"'i -Type II error for Alpha = 5%, observed cliff. Note/* Power 1. - beta Note/* BetalOpc Type II error for Alpha = 5%, cliff = 10% mean Note/* PowerlOpc 1. • betalOpc Note/* Power25pc Power for 25% difference Note/* Power50% Power for 50% difference Note/* Note/* Note/* FILES: Note/* STATS.db£ Contains the statistics Note/* NB Must have above the fields Note/* NONCENTR.dbf Contains the areas for calculating Beta from Note/* the noncentral t distribution. Note/* F.ndx Index for,NONCENTR Note/* Note/* Note/* Note/* Note/*
BETAPROC.PRG Procedur~ file for interpolating Beta
Note/* Note/* CLEAR set default to c set console on set talk off set echo off
from the tables
SET PROCEDURE TO BETAPROC bell = chr(7) b=O
. select 1 use noncentr index f select 2 use stats
A.11

A.U
go top clear rl=O DO WHILE .not. eofO
clear • rl=rl+l
@ 1,1 say 'record # ' ??.rl ? variable @ 4,1 say mean_ all IF MEAN ctl < mean TST - -Vl=MEAN CTL
V2== MEAN TST Sl=SD_CTL S2=SD TST Nl=N CTL N2=N-TST ELSE
Vl=MEAN TST V2= MEAN-CTL Sl=SD TST S2=SD CTL Nl=N TST N2=N-CTL
ENDIF FF= Nl + N2-2 VAR = ((Nl-l)*Sl *Sl + (N2-l)*S2*S2)/FF D = (V2-Vl)/SQRT(VAR/Nl + VAR/N2) DO TYPEII WITH FF,D,B SELECT2 replace beta with b REPLACE POWER WITH 1. • B
. IRON NUTRITION AND IMMUNITY
NOTE/* CALCULATE BETA & POWER FOR 10% DIFFERENCE D = abs((O.l*mean_all)/SQRT(VAR/Nl + VAR/N2)) DO TYPEII WITH FF,D,B SELECT2 replace betalOpc with b REPLACE POWERlOpc WITH 1. - B
Note/* calculate power for a 25% difference D = abs((0.25*mean_all)/sqrt(var/nl + var/n2)) do typeii with ff,d,b select 2 replace power25pc with 1. - b
Note/* calculate power for a 50% difference d = abs((05*mean all)/sqrt(var/nl + var/n2)) do typeii with ff, d, b select 2 replace power50pc with 1. • b SKIP ENDDO
set console on . LIST OFF V ARIABLE,BETA
CLEAR dose all @ 1,1 SAY 'DONE' RETURN

APPENDICES A,,13
NOTE/* THIS PROCEDURE FILE 'BETAPROC.PRG' CONTAINS ROUTINES TO CALCULATE NOTE/* THE TYPE II OR BETA ERROR NOTE/* IT IS CALLED FROM THE PROGRAM 'BETA.PRG' NOTE/" THE FILES AND VARIABLES USED ARE DOCUMENTED IN THAT FILE NOTE/* NOTE/* NOTE/"' PROCEDURE TYPEII PARAMETERS FF,D,B b=O IF FF>30 AND. FF<40
FF= 30 + INT(FF /34.5)*10 ENDIF
IF FF>40 AND. FF<60 FF=INT(40 + INT(FF/49.5)*20 + 0.01) ENDIF
IF FF>lOO FF=INT(lOO + INT(FF/149)*100 +.01) FF=MIN(200,FF) ENDIF
SELECT 1 SEEK FF DO FINDBETA WITH D,B B=MAX(O, MIN(0.9999, B)) RETURN NOTE/* NOTE/* NOTE/* PROCEDURE FINDBETA PARAMETERS D,B IF D > = BETAOl
B = 0.01 + (0.01- O.OO)*(BETAOl • D)/(BETAOO • BETAOl) RETURN ENDIF
*
IF D > = BETA05 B = 0.05 + (0.05 - O.Ol)*(BETA05 - D)/(BETAOl • BETA05) RETURN ENDIF
* IF D > = BETAlO
B = 0.10 + (0.10 - 0.05)*(BETA10 - D)/(BETA05 • BETAlO) RETURN ENDIF
* IF D > = BETA20
B = 0.20 + (0.20 - 0.10)*(BETA20 - D)/(BETA10 • BETA20) RETURN ENDIF
* IF D > = BETA30
B = 0.30 + (0.30 - 0.20)*(BETA30 - D)/(BETA20 • BETA30) RETURN . ENDIF
* IF D >; BETA40
B = 0.40 + (0.40. 0.30)*(BETA40 - D)/(BETA30 • BETA40)

A.14
*
RETURN ENDIF
IF D > = BETASO
IRON NUTRITION AND IMMUNITY
B = 0.50 + (0.50 - 0.40)*(BETA50 - D)/(BETA40 • BETASO) RETURN ENDIF
* IF D > = BETA60
*
B = 0.60 + (0.60 - 0.50)*(BETA60 - D)/(BETASO • BETA60) RETURN ENDIF
IFD >= BETA70
*
B = 0.70 + (0.70 - 0.60)"'(BETA70 • D)/(BETA60 - BETA70) RETURN ENDIF
IF D > = BETA80
*
B = 0.80 + (0.80 • 0.70)*(BETA80 - D)/(BETA70 - BETA80) RETURN ENDIF
IF D > = BETA90
*
B = 0.90 + (0.90 - 0.80)*(BETA90 - D)/(BETA80 - BETA90) RETURN ENDIF
IF D > = BETA999
*
B = 1 + (1 - 0.90)*(BETA999 - D)/(BETA999 - BETAlO) RETURN ENDIF
If D < beta999 b=.9999
? bell ? 'DELTA= ', D, ', but should be> O!!!!!!!!!!!!' ? bell ? bell ? bell ·1 bell . return

APPENDICES A.15
'APPENDIX 6 • Forms for consent and data collection

NMM:
HOP.DER VAN:
UNIVERSiTEIT Vl\fI KMPSTI\D
Dtl'I\R'l'EHENT VAN PED1A1'RIE EN KINDERG!sSONDIIEID
Dl\l'UH:
Ek gee my toesteinming dat my kind deur D1iddel van bloed en veltoetae onder•ock "ord. Ek besef dat my kind nie noodweudig direk baat sal vind by hierdie toetse nie, maar dat sulke ondersoeke mag hydra tot o~s kennis van antler klnders se siektes.
Oie aard en gevare van die toetse is deur, die betrokke dokter aan my verduidelik.
CE'J'EKEN:
GETUIES: I. (Dokter)
2.
NAflE:
HOTIIER OF:
UNIVf,RS11"i OF CAPE TOWN
DEPARTHEll'f OF PAEDIATRICS AND CHILD IIEALl'II
~:
1 hereby consent to my child being investigated by means of blood and skin tests.
I realise these tests will not necessarily benefit my child directly, but that they may lea<! to a better understanding of other chUdren' s illnesses.
The nature and risks of the test have been explained to me by the doctor concerned.
~:
WITNESSES: I. (Doctor)
2.
(') g ~ = --0
"d
~ ..... r.> .....
"d ~ -(I)

APPENDICES A.17
Iron and immune function

IRON AND IMMUNITY - DATA PROFORMA - FIRST EXAMINATION
NUMilER: --------DATE:
GROUP: (Control
NAME OF MOTHER:
NAME OF CHILD:
DATE OF BIRTH:
AGE:
SEX: Male
ADDRESS:
l, Test
Female
ANTE NATAL: Normal
BIRTH: NVD
BIRTHWEIGIIT:
2
Ahnormal
Assisted
2
2 C/S 3
POST NATAL: Well = I Neonatal .Jaondice (Not treated)
Other, specify= 3
2
ANY HOSPITAL TREATMENT STNCE lllRTH? YES= l
CURRENT FEEDING: Breast Breast & bottle
Bottle 3
NO= 2
2
Brand of milk if on formula------------
(Klim, Nespray = l; SMA, S26 = 2; Lactogen, Nan J; Pelargon
lnfosoy, lsomll = 5; Skim = 6; Other = 7)
,,
SOCIAL DATA:
MARITAL:
CHILDREN:
FINANC I.AL/ EMPLOYMENT:
HOUSING:
LEGAL:
ALCOHOL:
HEALTH:
OTIIER:

(TO l:IE COMl'LE'J'Efl IHIR [NG STUDY)
Age fJ.rst given bottle (mc,nths)
Age last given breast
Reason for weaning: \forking Other Social.
Not enough m.i.Lk J Urerist nLsease
Other, spec.i.fy 5 Refused llreast 6
i\ge at introduction
Age at introduction
Age at introduction
Age at introduction
Age ar. introduction
SOCIAL.DATA
Marital Status
o( cereals
of eggs
of vegetables
of fruit
of meat
Marr led
Widowed
Single
.ind fish
Living together
J Separated
5 Divorced
4
6
Education of Mother: Standard passed--------------
Post-School qualifications: Degree
(Mo.cher) Ni.l
Education of Father: Standard passed
Post-School qualifications: Degree
(Father) Nll
4
4
Diploma 2 Other
Diploma 2 Other
Occupation of of Mother------·---------------
Occupation of Breadwinner:
Source of income: Mother
State Grant 4
Father
Other
2
5
ls financial support regular? Yes = J No = 2
Family living: Alone
Friends )
Extended Family
With other;;
2
4
Extended family
Combination
N/A = J
)
)
)
6
Baby lives with: Both parents
Neither pa rent
Number of Adults:
J
4
One parent
Number of Siblings: ---------------
Number of Children less than 10 years:
Number of rooms used for sleeping:
Social Stability Score
Weight: ___ kg Height: cm
Head Circumference: cm
EVIDtNCE OF INFECTION:
Fever
Skin rash, l.mpet igo,
Ears: otitis externa, otltis media
Nose: coryza, purulent
l~roat: tonsillitis, pharyngitis
Mouth:
Resp:
Other:
gum sepsis, herpes, candida
croup, lower airway infection
diarrhoea, worms
specify
Clinical impression: Well g O Viral
Swabs sent: specify site(s)
I Bacterial
Skin
ll. R. T. I.
L. R.1'. I.
G.f.Inf.
Systemic:
2 Other
bacterial pathogens---~-~--
viral pathogens
Viral Sur:vey:
Stool Virus Isolates
Haternal Antihody Titers:
Tetanus
u .... 1-1 .....
)

Study Number:
Mantoux
Candida
WBC
RBC
lib
HCT
MCV
MCI!
MCllC
PLT
% ·reties
% neut rophil s
;; lymphs
% monocytes
% eosinoph1ls
% basophils
Ferritin
FEP
IgG
lgM
IgA
Sm lg
OKT3
OKT4
OKT8
PllA Stim
Dactericidol Index
Antitetanus-toxoid
Anti-polio
lNTERMEllll\TE FOLL01~-ur
fix No ln(ect Mx
V S No Oate Feeds Sx R (: S 0 0 H Etc Rx Wdght Length !le-;,l
03
04
05
06
07
08 I 09
10
II
12
l3
14
15
16
17
18
l 9
20
21
22
23
24
25

')
rnoN AND IMMUNITY DATA l'llOFORMA -· FINAL EXAMINATlON
~:
(Fill in intermediate follow-up sheet)
Viral Survey:
Isolates throat
Isolates stool
Speciill lnvestlgat l.olis:
Mantoux
Candida
wnc
1rnc
Hb
IICT
NCV
MCH
MCHC
PL'I'
,: reties
% neutrophils
,: lymphs
,: tuonocytes
% eosinophils
% basophtls
Ferri tin.
IgC
lgt·l
lg A
Sm lg
OKTJ
OKTI,
0KT8
I'll/\ St im
Bactericidal Index
Antitetanus-toxoid
Anti-polio
Autologous rosettes
RBC C]b-rcceptors
No Infects on Ex
C u L G s nn:
!N'fEllMEIHATE FOLl.OW-UP
SWAB
SlTE
llx
Vi Ila Fu Pc Ile
GRAlllNG
llx Ex RxO RxH

DATE:
APPENDIX A
DATA COLLECTION PROFORMA
AGE OFF BREAST AND REASON MONTHS
AGE AT INTRODUCTION OF SOLIDS
(MONTHS) AGE SEX WEIGHT FEEDING
(MONTHS)
CODES: ~: Male= l
Feeding: Breast
Female" 2
l · ' Breast & Bottle= 2;
CEREAL EGG VEG & FISH &
FRUIT MEAT
Bottle"' 3; No milk = 4;
(Cow's milk• 3.1; SMA, S26 = 3.2; Lactogen, Nespray • 3.3; Pelargon = 3.4 Infasoy, Isomil 3.5;
Skim milk= 3.6; Other= 3.7)
Reasons for stopping breast feeding: Working• l; Other social reasons• 2; "Too little milk"" 3; Breast disease= 4; Other • 5
INFANT FEEDING SURVEY
/ /1984
Number Age th
Sex Weight Feeding 1
Age off Breast Reason for weaning mon s Formu a Measures I First bottle Last breast
25ml l
2
3
4-
5
6
7
8
9
i-10
11
12
13
14
15 ...
16

A.18 IRON NUTRITION AND IMMUNITY
Infant Feeding Survey

BIBLIOGRAPHY
1 Abram MB, WoU SM Public involvement in medical ethics New England Journal of Medicine 1984; 310: 627-632
2 Abramson m, Sacks TC, Flug A, Elishkovsky R, Cohen R Bacteriuria and haemoglobin levels in pregnancy Journal of the American Medical Association 1971; 21S: 1631-1637
3 Aisen P Current concepts in iron ·metabolism Clinics in Haematology 1982; 11: 241-257
4 Allen PA, Waters WE Development of an ethical committee and its effect on research design Lancet 1982; i: 1233-1236
5 Allison AC, Eugui EM A radical interpretation of immunity to malaria parasites Lancet 1982; ii: 1431-1433
6 Altman DG, Gore SM,' Gardner MJ, Pocock SJ Statistical guidelines for contributors to medical journals British Medical Journal 1983; 286: 1480-1493
7 Andelman MB, Sered BR
B.1
Utilization of dietary iron by term infants. A study of 1048 infants from a low socioeconomic population American Journal of Diseases of Children 1966; 111: 45-55
8 Anderson WL, Chase CG, Tomasi TB Transferrin support of stimulated lymphocytes In Vitro 1982; 18: 766~ 774
9 Arbeter A, Echeverri L, Franco D, Munson D, Velez H, Vitale JJ Nutrition and infection Federation Proceedings 1971; 30: 1421-1428
10 Australian College of Paediatrics Council Report on the ethics of research in children Australian Paediatrician 1981; 17: 162
11 Baggs RB, Miller SA Nutritional iron deficiency as a determinant of host resistance in the rat Journal of Nutrition 1973; 103: 1554-1560
12 Baggs RB, Miller SA Defect in resistance to Salmonella typhimurium in iron deficient rats Journal oflnfectious Diseases 1974; 130: 409-411
13 Bailar JC, Louis TA, Lavori PW, Polansky M Studies without internal controls New England Journal of Medicine 1984; 311: 156-162
14 Baker, de Meyer EM · Nutritional anaemia: its understanding and control with special reference to the work of the
World Health Organisation American Journal of Clinical Nutrition 1979; 32: 368-417

B.2
15
IRON NUTRITION AND IMMUNITY
Ballantyne GH Rapid drop.in serum iron con(:entration as a host defense mechanism. A review of experimental and clinical evidence American Surgeon 1984; 50: 405-411
16 BarclayR The role of iron in infection Medical Laboratory Science 1985; 42: 166-177
17 BarryDMJ, ReeveAW Iron injections and serious gram negative infections in Polynesian newborns New 2ealand Medical Journal 1973; 78: 376
18 Barty DMJ, Reeve AW Iron and infection in the newborn [Letter] Lancet 1974; ii: 185-186
19 Barry DMJ, Reeve AW Iron and neonatal infection: the Hawkes Bay experience New 2ealand Medical Journal 1976; 84: '2B7
20 BartyDMJ, Reeve AW . Increased incidence of gram negative neonatal sepsis with intramuscular iron administration Pediatrics 1977; 60: 908·912
21 Basta SS, Churchill H Iron deficiency anaemia and the productivity of adult males inlndonesia World Bank Staff Working Paper 1974; 175: 1-49
22 Basta SS, Soekirman MS, Karyadi D, Scrimshaw NS Iron deficiency anaemia and the productivity of adult males in Indonesia American Journal of Clinical Nutrition 1979; 32: 916-925
23 Bayley N Manual for the Bayley Scales of Infant Development New York: The Psychological Corporation, 1969
24 Baynes RD, Bothwell TH, Bezwoda WR, MacPhailAP, Derman DP Relationship between absorption of inorganic and food iron in field studies Annals of Nutrition and Metabolism 1987; 31: 109-116
25· Beard MET, Weintraub LR Hypersegmented neutrophilic granulocytes in iron deficiency anemia British Journal of Haematology 1969; 16: 161-163
26 BeattyDW Immunity in kwashiorkor Cape Town, South Africa: University of Cape Town, 1980. Dissertation
27 Beatty DW, Dowdle EB The effects of kwashiorkor serum on lymphocyte transformation in vitro Clinical and Experimental Immunology 1978; 32: 134-143
'2B Beatty DW, Dowdle EB Deficiency in kwashiorkor serum of factors required for optimal lymphocyte transformation in vitro Clinical and Experimental Immunology 1979; 35: 433-442

BIBLIOGRAPHY
29 Beck JR Quantitative logic and new diagnostic tests Archives of Internal Medicine 1982; 142: 681-682
30 Beck JR, Cornwell GG, French EE, Meier FA, Brinck-Johnsen T, Rawnsley HM The "iron screen'': Modification of standard laboratory practice with data analysis Human Pathology 1981; 12: 118-126
31 Becroft DM, Dix MR, Farmer K Intramuscular iron dextran and susceptibility of neonates to bacterial infections Archives of Disease in Childhood 1977; 52: 778-781
32 Beisel WR Trace elements in infectious processes Medical Clinics of North America 1976; 60: 831-849
33 Beisel WR Single nutrients and immunity American Journal of Clinical Nutrition 1982; 35: 442-448
34 Beldjord K, Benlatrache K, Colonna P
B.3
Adequacy of serum ferritin concentration for the diagnosis of uncomplicated iron deficiency Acta Haematologica 1983; 69: 61-62
35 Bently DP Anaemia and chronic disease Clinics in Haematology 1982; 11: 465-479
36 Beresford CH, Neale RJ, Brooks OG Iron absorption and pyrexia Lancet 1971; i: 568
37 Bessman JD, Gilmer PR, Gardner FH Improved classification of anemias by MCV and RDW American Journal of Clinical Pathology 1983; 80: 322-326
38 Bezwoda WR, Bothwell TH, Torrance JD, MacPhail AP, Charlton RW, Kay G, Levin J The relationship between marrow iron stores, plasma ferritin concentrations and iron absorption Scandinavian Journal of Haematology 1979; 22: 113-119
39 Bhaskaram C, Reddy V Cell mediated immunity in iron and vitamin deficient children British Medical Journal 1975; 3: 522
40 Biemond P, van Eijk HG, Swaak AJG, Koster JF Iron mobilization from ferritin by superoxide derived from stimulated polymorphonuclear leukocytes Journal of Clinical Investigation 1984; 73: 1576-1579
41 Bird AR, Karabus CD, Hartley PS Microcytic anaemia and haemoglobinopathy in Cape Town children South African Medical Journal 1982; 62: 429-430

B.4 IRON NUTRITION AND IMMUNI1Y
42 Bird AR, Wood K, Leisegang F, Mathew CG, Ellis P, Hartley PS, Karabus CD Haemoglobin E variants: a clinical, haematological and biosynthetic study of 4 South African families Acta Haematologica 1984; 72: 135-137
43 BloisM Information and medicine. The nature of medical descriptions Berkeley: University of California Press, 1983
44 Bondestam M, Foucard T, Gebre-Medhin M Subclinical trace element deficiency in children with undue susceptibility to infections Acta Paediatrica Scandinavica 1985; 74: 515-520
45 Bornside GH, Bouis PJ, Cohn I Enhancement of Escherichia coli infection and endotoxic activity by hemoglobin and ferric ammonium citrate Surgery 1970; 68: 350-355
46 Bothwell TH Key diagrams in iron metabolism Class notes, Department of Medicine, University of the Witwatersrand, 1980: 1-11
47 Bothwell TH, Charlton RW A general approach to the problems of iron deficiency and iron overload in the population at large Seminars in Hematology 1982; 19: 54-67
48 . Bothwell TH, Finch CA Iron metabolism Boston: Little, Brown & Co., 1962
49 Bowden DK, Higgs DR, Hill A VS, Weatherall DJ, Clegg IB Relative roles of genetic factors, dietary deficiency, and infection in anaemia in Vanuatu, South-West Pacific Lancet 1985; ii: 1025-1028
50 Boyum,A Separation of blood leukocytes, granulocytes and lymphocytes Tissue Antigens 1974; 4: 269-274 ·
51 Brain P, Buckle GC, Jamieson M Haematological differences in three population groups South African Medical Journal 1979; 55: 635-636
52 Brault-Dubuc M, Nadeau M, Dickie J Iron status of French-Canadian children: a three year follow-up study Human Nutrition: Applied Nutrition 1983; 37A: 210-221
53 Brewer RJ, Galland RB, Polk HC Amelioration by muramyl dipeptide of the effect of induced hyperferremia upon Klebsiella infection in mice Infection·and Immunity 1982; 38: 175-178
54 Brigety RE, Pearson HA Effects of dietary and iron supplementation on hematocrit levels of preschool children Journal of Pediatrics 1970; 76: 757-760

BIBLIOGRAPHY
55 Briggs JD, Kennedy AC, Goldberg A Urinary white cell excretion after iron-sorbitol-citric acid British Medical Journal 1963; 2: 352-354
56 Brink S, van Schalkwyk DJ Serum ferritin and mean corpuscular volume as predictors of bone marrow iron stores South African Medical Journal 1982; 61: 432-434
57 Brock JH, Mainou-Fowler T The role of iron and transferrin in lymphocyte transf orm.ation Immunology Today 1983; 4: 347-351
58 Brown JC Iron and plants. In: Subcommittee on iron. Iron. ed Baltimore: University Park Press, 1979: 57-78
59 Broxmeyer HE, Gentile P, Bognacki J, Ralph P Lactoferrin, transferrin, and acidic isoferritins: regulatory molecules with potential therapeutic value in leukemia Blood Cells 1983; 9: 83-105
60 Brozovic B, Burland WL, Simpson K, Lord J Iron status of preterm low birthweight infants and their response to oral iron Archives of Disease in Childhood 1974; 49: 386-389
61 Bryan CF, Leech SH The immunoregulatory nature of iron. I. Lymphocyte proliferation Cellular Immunology 1983; 75: 71-79
62 Bryan CF, Leech SH, Bozelka B The immunoregulatory nature of iron. II. Lymphocyte surface marker expression Journal of Leukocyte Biology 1986; 40: 589-600
63 Buckley RH Iron deficiency anaemia: its relationship to infection susceptibility and host defense· Journal of Pediatrics 1975; 86: 993-995
64 Bullen JJ Iron-binding proteins in milk and resistance to Escherichia coli infection in infants Postgraduate Me.dical Journal 1975; 51 sup: 67-70
65 Bullen JJ; Armstrong JA The role of lactoferrin in the bactericidal function of polymorphonudear leukocytes Immunology 1979; 36: 781-791
66 Bullen JJ, Rodgers HJ, Leigh L Iron binding proteins in milk and resistance to Escherichia coli infection in infants British Medical J oumal 1972; 1: 69-75
67 Bullen JJ, Rogers HJ Bacterial iron metabolism and immunity in Pasteurella septica and Escherichia coli Nature 1969; 224: 380-382
68 Bullen JJ, Rogers HJ, Cushnie GH Abolition of passive ill'!munity to bacterial infections by iron Nature 1967; 214: 515-516
B.S

B.6 IRON NUTRITION AND IMMUNITY
69 Bullen JJ, Rogers HJ, Griffiths E Iron binding proteins and infection British Journal of Haematology 1973; 23: 389-391
70 Bullen JJ, Rogers HJ, Griffiths E Role of iron in bacterial infection Current Topics in Microbiology and Immunology 1978; 80: 1-35
71 Bullen JJ, Ward CG, Wallis SN Vifulence and the role of iron in Pseudomonas aeroginosa infection Infection and Immw:,.ity 1974; 10! 443~450
72 Bullen JJ, Wilson AB, Cushnie GH, Rogers HJ The abolition of the protective effect of Pasteurella septica antiserum by iron compounds Immunology 1968; 14: 889-898 ·
73 Bulpitt CJ Confidence intervals Lancet 1987; i: 494-497
74 BurmanD Haemoglobin levels in normal infants aged 3 to 24 months, and the effect of iron Archives of Disease in Childhood 1972; 47: 261-271
75 BurmanD Iron deficiency in infancy and childhood Clinics in Haematology 1982; 11: 339-351
76 Butzler JP, Alexander M, Segers A, Cremer N, Wauters G Enteritis, abscess and septicaemia by Yersinia enterocolitica in a thalassaemic child Contnbutions to Microbiology and Immunology 1979; 5: 292-297
77 Byles AB, D'Sa A Malaria and iron British Medical Journal 1970; 3: 625-627
78 Calver GA, Kenney CP, Lavergne G lron as a replacement for mucin in the establishment of meningococcal infection in mice Canadian Journal of Microbiology 1976; 22: 832-838
79 Cantwell RJ Iron deficiency anemia of infancy. Some clinical principles illustrated by the response of Maori infants to neonatal parenteral iron administration Clinical Pediatrics 1972; 11: 443-449
80 Cantwell RJ The long term neurological sequelae of anemia in infancy Pediatric Researeh 1974; 8: 342
81 Carbonetti NH, Boonchai S, Parry SH, Vaisanen-Rhen V, Korbohen TK, Williams PH Aerobactin-mediated iron uptake by Escherichia coli isolates from human extraintestinal infections Infection and Immunity 1986; 51: 966-968
82 Cardon PV, Dommel FW, Trumble RR Injuries to research subjects New Engl~d Journal of Medicine 1976; 295: 650-654

BIBLIOGRAPHY
83 Cavill I Diagnostic methods Clinics in Haematology 1982; 11: 257-273
84 CawsonRA Denture sore mouth and angular cheilitis British Dental Journal 1963; 11S: 441-449
85 Celada A, Herreras V, Pugin P, Rudolf M Reduced leukocyte alkaline phosphatase activity and decreased NBT reduction test in induced iron deficiency anaemia in rabbits British Journal of Haematology 1979; 43: 457
86 Chanarin L, Rothman D, Berry V
B.7
Iron deficiency and its relation to folic-acid status in pregnancy: the results of a clinical trial British Medical Journal 1965; 1: 480
87 Chandlee GC, Fukui GM The role of iron in endotoxin induced non-specific protection Bacteriological Proceedings 1965; 33: 45
88 Chandra RK Reduced bactericidal capacity of polymorpbs in iron deficiency anaemia Archives of Disease in Childhood 1973; 48: 864-866
89 Chandra RK Iron and immunocompetence Nutrition Reviews 1976; 34: 129-132
90 Chandra RK Nutrition, immunity and infection: present knowledge and future directions Lancet 1983; i: 688-691
91 Chandra RK, Au B, Woodford G, Hyam P Iron status, immune response and susceptibility to infection Ciba Foundation Symposium 1976; Sl: 249-268
92 Chandra RK, Kutty KM Immunocompetence in obesity Acta Paediatrica Scandinavica 1980; 69: 25-30
93 Chandra RK, Saraya AK Impaired immunocompetence associated with iron deficiency Journal of Pediatrics 1975; 86: 899-902
94 Charlton RW, Bothwell TH Definition, prevalence and prevention of iron deficiency Clinics in Haematology 1982; 11: 309-327
95 Charlton R W, Bothwell TH Iron absorption Annual Review of Medicine 1983; 34: 55-68
96 Clark AG, Bueschkens DH Laboratory infection of chicken eggs with Campylobacter jejuni by using temperature or pressure differentials Applied and Environmental Microbiology 1985; 49: 1467-1471

B.8 IRON NUTRITION AND IMMUNITY
97 Clark IA, Hunt NH Evidence for reactive oxygen intermediates causing hemolysis and parasite death in malaria Infection and Immunity 1983; 39: 1-6
98 Collipp PJ, Kuo B, Castro-Magana M, Chen SY, Salvatore S Hair zinc levels in inf ants Clinical Pediatrics 1983; 22: 512-513
99 Coltman CA Jr Pagophagia and iron lack Journal of the American Medical Association 1969; 207: 513-516
100 Colton T Statistics in medicine Boston: Little, Brown, 1974
101 Committee on nutrition Iron supplementation for infants Pediatrics 1976; 58: 765-768
102 Committee on Nutrition Relationship between iron status and incidence of infection in infancy Pediatrics 1978; 62: 246-250
103 Cook JD Clinical evaluation of iron deficiency Seminars in Hematology 1982; 19: 6-18
104 Cook JD, Bothwell TH Availability of iron from infant foods in: Iron nutrition in infancy and childhood. ed Stekel A. Raven Press. New York 1984: 119-146
105 Cook JD, Finch CA Assessing iron status of a population American Journal of Clinical Nutrition 1979; 32: 2115-2119
106 Cook JD, finch CA, Smith NJ Evaluation of the iron status of a population Blood 1976; 48: 449-455
107 Cook JD, Lipschitz DA, Miles LEM, Finch CA . Serum Ferritin as a measure of iron stores in normal infants
American Journal of Clinical Nutrition 1974; 27: 681-687
108 Cook JD, Lynch SR The liabilities of iron deficiency Blood 1986; 68: 803-809
109 Cook JD, Monsen ER Vitamin C, the common cold, and iron absorption American Journal of Clinical Nutrition 1977; 30: 235-241
110 Cook JD, Reusser ME Iron fortification: an update American Journal of Clinical Nutrition 1983; 38: 648-659

BIBLIOGRAPHY
111 Cooke R (Editor) Paediatric Handbook. Haum Educational Publishers. Pretoria: 1987
B.9
112 Coovadia HM, Parent MA, Loening WEK, Wesley A, Burgess B, Hallett F, Brain P, Grace J, Naidoo J, Smythe PN, Vos GH An evaluation of the factors associated with the depression of immunity in malnutrition and measles American Journal of Clinical Nutrition 1974; 27: 665
113 Cox JSG, Moss GF, Bremmer I, Reason J Intravenous iron-dextran: studies on unsaturated iron binding capacity Journal of Clinical Pathology 1968; 21: 611-615
114 Craig WJ, Balbach L, Harris S, Vyhmeister N Plasma zinc and copper levels of infants fed different milk formulas Journal of American College of Nutrition 1984; 93: 183-186
115 Crosby WH, O'Neil-Cutting MA A small dose iron tolerance test as an indicator of mild iron deficiency Journal of the American Medical Association; 251: 1986-1987
116 Cummins AG, Duncombe VM, Bolin TDL, Davis AE, Kelly JD Suppression of rejection of Nippostrongylus brasiliensis in iron and protein deficient rats: Effect of syngeneic lymphocyte transfer Gut 1978; 19: 823-826
117 Dacie JV, Lewis SM Practical haematology, 6th edition Edinburgh: Churchill Livingstone, 1984
118 Dallman PR Tissue effects of iron deficiency. In: Iron in biochemistry and medicine. Jacobs A, Worwood M (eds) London: Academic Press, 1974
119 Dallman PR Manifestations of iron deficiency Seminars in Hematology 1982; 19: 19-30
120 Dallman PR Diagnosis of anemia and iron deficiency: analytic and biologic variations of laboratory tests American Journal of Clinical Nutrition 1984; 39: 937-941
121 Dallman PR Iron deficiency and the immune response American Journal of Clinical Nutrition 1987; 46: 329-334
122 Dallman PR, Reeves JD Laboratory diagnosis of iron deficiency in: Iron nutrition in infancy and childhood. ed Stekel A. Raven Press. New York 1984: 11-44
123 Dallman PR, Reeves JD, Driggers DA, Lo EYT Diagnosis of iron deficiency: the limitations of laboratory tests in predicting response to iron treatment in 1-year-old infants Journal of Pediatrics 1981; 98: 376-381

B.10 IRON NUTRITION AND IMMUNITY
124 Dallman PR, Siimes MA Percentile curves for hemoglobin and red cell volume in infancy and childhood Journal of Pediatrics 1979; 94: 26-31
125 Dallman PR, Siimes MA, Stekel A Iron deficiency in infancy and childhood American Journal of Clinical Nutrition 1980; 33: 86-118
126 Dallman PR, Stekel A Discussion in: Iron nutrition revisited - Infancy, Childhood, Adolescence. The eighty second Ross Conference on Pediatric Research, 1980: 71-74
127 Dautry-V arsat A, Ciechanover A, Lodish HF pH and the recycling of transferrin during receptor-mediated endocytosis Proceedings of the National Academy of Sciences of the USA 1983; 80: 2258-2262
128 Dautry-V arsat A, Lodish HF How receptors bring proteins and particles into cells Scientific American 1984; 2SO: 48-54
129 Davidson F, Hayes JP, Hussein S Recurrent genital candidosis and iron metabolism British Journal of Venereal Disease 1977; 53: 123-125
130 Deinard A, Gilbert A, Dodds M, Egeland B Iron deficiency and behavioral deficits Pediatrics 1981; 68: 828-833
131 DeMaria TF, Kapral FA Pulmonary infection of mice with Staphylococcal aureus Infection and Immunity 1978; 21: 114-123
132 Dempster WS, Steyn DL, Knight GJ, Heese H de V Immunoradiometric assay of serum ferritin as a practical method for evaluating iron stores in infants and children Medical Laboratory Sciences 1977; 34: 337-344
133 Derman DP, Ballot D, Bothwell TH, Macfarlane BJ, Baynes RD, MacPhail AP, Gillooly M, Bothwell JE, Bezwoda R, Mayet F Factors influencing the absorption of iron from soya-bean protein products British Journal of Nutrition 1987; 57: 345-353 ·
134 Derman DP, Bothwell TH, Torrance JD, MacPhail AP, Bezwoda WR, Charlton RW, Mayet FGH Iron absorption from ferritin and ferric hydroxide Scandinavian Journal of Haematology 1982; 29: 18~24
135 . Derman DP, Lynch SR, Bothwell TH, Charlton RW, Torrance JD, Brink BA, Margo GM, MetzJ Serum ferritin as an index of iron nutrition in rural and urban South African children British Journal of Nutrition 1978; 39: 383-389
136 Derman, Bothwell TH, MacPhail AP, Torrance JD, Bezwoda WR, Charlton R W, Mayet FGH Importance of ascorbic acid in the absorption of iron from infant foods Scandinavian Journal of Haematology 1980; 25: 193-201

BIBLIOGRAPHY.
137 DerSimonian R, Charette Ll, McPeck B, Mosteller F Reporting on methods in clinical trials New England Journal of Medicine 1982; 306: 1332-1337
138 Dixon WJ BMDP statistical software Berkley: University of California Press, 1981
139 Dorea JG, Albuquerque ZP, Borgo LA Hair zinc levels in normal and malnourished infants Journal of Tropical Pediatrics 1983; 29: 58-60
140 Douglas SD, Davis WC, Fudenberg HH Granulocytopathies: pleomorphism of neutrophil dysfunction American Journal of Medicine 1969; 46: 901-909
141 Driggers DA, Reeves JD, Lo EYT, Dallman PR
B.11
Iron deficiency in one-year old infants: comparison of results of a therapeutic trial in infants with anemia or low-normal hemoglobin values Journal of Pediatrics 1981; 98: 753· 758
142 Duncombe VM, Bolin TD, Davis AE, Fagan MR, Kelly JD Nippostrongylus brasiliensis infection in the rat: effect of iron and protein deficiency on the anthelmintic efficacy of mebendazole, pyrantel, piperazine and levamisole Gut 1979; 20: 305-308
143 Duncombe VM, Bolin TD, Davis AE, Kelly JD Nippostrongylus brasiliensis infection in the rat: effect of iron and protein deficiency and dexamethasone on the efficacy of benzimidazole anthelmintics Gut 1m; 18: 892-896
144 Duncombe VM, Bolin TD, Davis M, Fagan MR, Davis AE The effect of iron deficiency, protein deficiency and dexamethasone on infection, re-infection . and treatment of Giardia muris in the mouse _Australian Journal of Experimental Biology and Medical Science 1980; S8: 19-26
145 Dupuy JM, Sparkes BG, Desrosiers M, Skamene, Micusan VV Prevention of the enhancing effect of mucin and iron in mouse meningococcal antigen infection Canadian Journal of Microbiology 1983; 29: 1671-1674
146 Edgerton VR, Gardner GW, Ohira Y, Gunwardena KA, Senewiratne B Iron deficiency anaemia and its effect on worker productivity and activity patterns British Medical Journal 1979; 2: 1546-1549
147 Editorial Iron and resistance to infection Lancet 1974; ii: 325
148 Editorial Population screening for iron deficiency Nutrition Reviews 1977; 35: 271-274
149 Editorial Complementary effect of fever and low iron on defense against bacterial infection Nutrition Reviews 1979; 37: 260-261

B.12 IRON NUTRITION AND IMMUNITY
150 Editorial Inhibition of zinc absorption by inorganic iron Nutrition Reviews 1982; 40: 76-n
151 Edwards CQ, Dadone MM, Skolnick MH, Kushner JP Hereditary haemochromatosis Clinics in Haematology 1982; 11: 409-435
152 Ehrhardt P Iron deficiency in young Bradford children from d.iff erent ethnic groups British Medical Journal 1986; 292: 90-93
153 Elin RJ, Wolff SM The role of iron in nonspecific resistance to infection induced by endotoxin Journal oflmmunology 1974; 112: 737-745
154 Elwood PC, Hughes D Clinical trial of iron therapy of psychomotor function in anaemic women British Medical Journal 1970; 3: 254-255
155 EmeryT Iron metabolism in humans and plants American Scientist 1982; 70: 626-632
156 ESPGAN committee on nutrition . Guidelines on infant nutrition Acta Paediatrica Scandinavica 19n; S 262: 1-20
157 Evans DIK Cerebral function in iron deficiency: a review Child Care, Health and Development 1985; II: 105-112
158 Expert Scientific Working Group Summary of a report on assessment of the iron nutritional status of the United States population American Journal of Clinical Nutrition 1985; 42: 1318-1330
159 Fairweather-Tait SJ Iron availability- th.e implications of short-term regulation British Journal of Nutrition 1987; 57: 175-180
160 FAO/WHO Requirements of ascorbic acid, vitamin D, vitamin Bl2, folate and iron Geneva: F AO /WHO Technical Report Series No. 450; 1970
161 Farmer K, Becraft DMO Administration of parenteral iron to newborn infants [Letter] Archives of Disease in Childhood 1976; 51: 486
162 Farquhar JD Iron supplementation during the first year of life American Journal of Diseases of Children 1963; 106: 115·120
163 Finch CA, Cook JD Iron deficiency American Journal of Clinical Nutrition 1984; 39: 471-4n

BIBLIOGRAPHY
164 Finch CA, Huebers H Perspectives in iron metabolism New England Journal of Medicine 1982; 306: 1520-1528
165 Finkel A, Dent PB Abnormalities in lymphocyte proliferation in classical and atypical measles infection Cellular Immunology 1973; 6: 41
166 Fleming AF Iton deficiency in the tropics Clinics in Haematology 1982; 11: 365-388
167 Fleming L W, Stewart WK Serum ferritin concentrations after intravenous iron-dextran Lancet 1982; i: 1017-1018
168 Fletcher J, Goldstein E
B.13
Effect of parenteral iron preparations on renal infection due to Escherichia coli in rats and mice Antimicrobial Agents and Chemotherapy 1969; 9: 454-457
169 Fletcher J, Mather J, Lewis MJ, Whiting G Mouth lesions in iron deficient anemia: relationship to Candida albicans in saliva and impairment of lymphocyte response Journal of Infectious Diseases 1975; 131: 44-50
170 Florentino RF, Guirriec M Prevalence of nutritional anaemia in infancy and childhood with emphasis on developing countries in: Iron nutrition in infancy and childhood. ed StekelA. Raven Press. New York 1984: 61-74
171 Fomon SJ, Filer U, Anderson TA, Ziegler EE Recommendations for feeding normal infants Journal of Pediatrics 1979; 63: 52-59
172 Fomon SJ, Strauss RG, Nutrient deficiencies in breast-fed infants New England Journal of Medicine 1978; 299: 355-357
173 Ford A, Hayhoe JPV An investigation of alternative to hog gastric mucin as virulence-enhancing agents in the cholera vaccine potency assay · Journal of Biological Standardization 1976; 4: 353-366
174 Foroozanfar N, Nejad A, Harbour C, Ala F Cellular and plasma-associated phagocytic defects amongst Iranian blood donors Vox Sanguinis 1978; 34: 92-97
175 Forsberg CM, Bullen JJ The effect of passage and iron on the virulence of Pseudomonas aeruginosa Journal of Clinical Pathology 1972; 25: 65-68
176 Fortuine R Acute purulent meningitis in Alaska natives: epidemiology, diagnosis, prognosis Canadian Medical Association Journal 1966; 94: 19-22

B.14 IRON NUTRITION AND IMMUNITY
177 Fost N Risks of research on children Journal of Pediatrics 1982; 100: 166~ 167
178 Fost N Parental control over children Journal of Pediatrics 1983; 103: 571-572
179 Foster AO On a probable relationship between anemia and susceptibility to hookworm infection American Journal of Hygiene 1936; 24: 109-12.8
180 Fourie PB, Kioel MA Skin reactivity to tuberculin following BCG vaccination Interpretation of the tuberculin skin test in the young child. Seminar of the Medical Research Council, Johannesburg, March 1987
181 Fox JP, Hall CE Viruses in families Littleton, Ma: PSG Publishing Co Inc, 1980
182 Freiman JA, Chalmers TC, Smith H, Knebler RR The importance of beta, the type II error and sample size in the design and interpretation of the randomized control trial. A survey of 71 New England Medical Journal 1978; 299: 690-694
183 Friel JK, Gibson RS, Kawash GF, Watts J Dietary zinc intake and growth during infancy Journal of Pediatric Gastroenterology and Nutrition 1985; 4: 746-751
184 Fudenberg H, Good RA, Goodman HC, Hitzig W, Kunkel HG, Roitt IM, Rosen FS, Rowe DS, Seligman M, Soothill JR Primary immunodeficiencies. Report of W.H.O. Committee Pediatrics 1971; 47: 927-946
185 Fuerth JH Incidence of anemia in full term infants seen in private practice Journal of Pediatrics 1971; 79: 560-562
186 Fusillo MH, Smith JC, Reednick JA Iron and the mystique of niucin Seventy fourth Annual Meeting of the American Society of Microbiology (M44) 1974: 73
187 Gaisford W, Jennison RF Intramuscular iron in infancy British Medical Journal 1955; 2: 700-704
188 Gardner MJ, Altman DG Confidence intervals rather than P values: estimation rather than hypothesis testing British Medical Journal 1986; 292: 746-750
189 Garibaldi JA Influence of temperature on the biosynthesis of iron transport compounds by Salmonella typhimurium Journal of Bacteriology 1972; 110: 262-265

BIBLIOGRAPHY
190 Garry PJ, Owen GM, Hooper EM, Gilbert BA Iron absorption from human milk and formula with and without iron supplementation Pediatric Research 1981; 15: 822-828
191 Gear J The enteric viruses as causes of disease in the tropics
B.15
Proceedings of the Sixth International Congress on Tropical Medicine and Malaria 1959: 228-244
192 Gear J Alimentary viruses The Leech 1959; 29: 173-184
193 Giles C, Brown JAH Urinary infection and anaemia in pregnancy British Medical Journal 1962; 2: 10-13
194 Gillooly M, Torrance JD, Bothwell TH, MacPhail AP, Derman DE, Mills W, Mayet F The relative effect of ascorbic acid on iron absorption from soy based and milk based infant formulas American Journal of Clinical Nutrition 1984; 40: 522-527
195 Golden MHN Trace elements in human nutrition Human Nutrition: Clinical Nutrition 1982; 36C: 185-202
196 Goodill JJ, Abuelo JG Murcomycosis ·anew risk ofdeferoxamine therapy in dialysis patients with aluminium or iron overload? New England Journal of Medicine 1987; 302: 54
197 Grieger TA, Kluger MJ Fever and survival: the role of serum iron Journal of Physiology 1973; 279: 187-196
198 Griffiths E, Rogers HJ, Bullen JJ Iron, plasmids and infection Nature 1980; 284: 508-509
199 Gross RL, Reid JVO, Newberne PM, Burgess B, Marston R, Hift W Depressed cell-mediated immunity in myeloblastic anemia due to folic acid deficiency American Journal ofClinical Nutrition 1975; 28: 225-232
200 Guest GM, Brown EW Erythrocytes and hemoglobin of the blood in infancy and childhood. III. Factors in variability: statistical studies American Journal of Diseases of Children 1957; 93: 486-509
201 Gutelius MF, Millican FK, Layman EM, Cohen GJ, Dublin CC Nutritional studies of children with pica. II Treatment of pica with iron given intramuscularly Pediatrics 1962; 29: 1018-1023
202 Haddad HL, Beatty DW, Dowdle EB Chronic granulomatous disease of childhood South African Medical Journal 1976; SO: 2068-2072

B.16
203
204
205
206
207
208
209
210
211
212
213
214
215
IRON NUTRITION AND IMMUNITY
HallbergL Wheat fiber, phytates and iron absorption in man Scandinavian Journal of Gastroenterology [Supplement] 1987; 129: 73-79
HallbergL Iron absorption and iron deficiency Human Nutrition: Clinical Nutrition 1982; 36C: 259-278
Hallberg L Iron nutrition and food. iron fortification Seminars in Haematology 1982; 19: 31-41
Halliwell B, Gutteridge JMC Oxygen free radicals and iron in relation to biology and medicine: some problems and concepts Archives of Biochemistry and Biophysics 1986; 246: 501-514
Hambidge KM Hair analyses: worthless for vitamins, limited for minerals American Journal of Clinical Nutrition 1982; 36: 943-949
Hamstra RD, Block MH, Schocket AL Intravenous iron dextran in clinical medicine Journal of the American Medical Association 1980; 243: 1726--1731
Hart RC, Kadis S, Chapman WL Nutritional status and susceptibility to Proteus mirabilis pyelonephritis in the rat Canadian Journal of Microbiology 1982; 28: 713~717
Hauck WW A proposal for interpreting and reporting negative studies Statistics in Medicine 1986; S: 203-209 ·
Haynes DC, Gershwin ME, Golub MS, Cheung A TW, Hurley LS, Hendrickx AG Studies of marginal zinc deprivation in rhesus monkeys: VI. Influence on the immunohematology of infants in the first year American Journal of Clinical Nutrition 1985; 42: 252-262
Heese H de V Iron status in South African mothers and infants: perceptions, random thoughts and studies Iron nutrition: revisited - Infancy, Childhood, Adolescence. Eighty second Ross.Conference on Pediatric Research, 1980: 15-25
Heese H de V, Dempster WS, Pocock F Free erythrocyte protoporphyrin levels in the first year of life South African Medical Journal 1983; 64: 237-239
Hegenauer J, Saltman P Iron and susceptibility to infectious disease Science 1975; 188: 1038-1039
Heimendinger H, Undritz E Is das tiefe Absinken der Hamoglobinwerte im Kindesalte physiologisch oder Ausdruck eines Eisenmangels? · Schweizerische Medizinische Wochenschrift 1955; ·85: 919-936

BIBLIOGRAPHY
216 Heiss LI, Palmer DL Anergy in patients with leukocytosis American Journal of Medicine 1974; 56: 323-332
217 Helyar L, Sherman AR Iron deficiency and interleukin 1 production by rat leukocytes American Journal of Clinical Nutrition 1987; 46: 346-352
218 Henderson PA, Hillman RS Characteristics of iron dex:tran utilization in man Blood 1969; 39: 357
219 Hengeveld P, Znyderhoudt FM Iron mobilization with chelating agents during acute viral hepatitis Hepatogastroenterology 1982; 2S: 191-194
220 Henry RJ, Cannon DC, Winkelman JW Clinical Chemistry (second edition) principles and technics Hagerstown, Maryland: Harper and Row, 1974
221 Herbert V Recommended dietary intakes (RDI) of iron in humans American Journal of Clinical Nutrition 1987; 4S: 679-686
B.17
222 Hershko C, Bar-Or D, Gaziel Y, Naparstek E, Konijn AN, Grossowicz N, Kaufman N, Izak . G Diagnosis of iron deficiency anemia in a rural population of children. Relative usefulness of serum ferritin, red cell protoporphyrin, red cell indices, and transferrin saturation determination · American Journal of Clinical Nutrition 1981; 34: 1600-1610
223 Hershko C, Karsai A, Eylon L, Izak G The effect of chronic iron deficiency on some biochemical functions of the human hematopoietic tissue Blood 1970; 36: 321-329
224 Hershko C, Peto TEA Non-transferrin plasma iron
225
British Journal of Haematology 1987; 66: 149-151
Higashi 0, Sato Y, Takamatsu H, Ogama M Mean cellular peroxidase of lymphocytes in iron deficiency anemia Tohoku Journal of Experimental Medicine 1967; 93: 105
226 Higgs JM, Wells RS Chronic muco-cutaneous candidiasis: associated abnormalities of iron metabolism British Journal of Dermatology 1972; 86 sup: 88
227 Hill CH Dietary influences on resistance to salmonella infection in chicks Federation Proceedings 1979; 38: 2129-2133
228 Hill GB Enhancement of experimental anaerobic infections by blood, hemoglobin and hemostatic agents Infection and Immunology 1978; 19: 443-449

B.18 IRON NUTRITION AND.IMMUNITY
229 Hoftbrand AV, Ganeshagu.ru K, Tattersall MHN, Tripp E Effect of iron deficiency anemia on DNA synthesis Clinical Science and Molecular Medicine 1974; 46: 12
230 Holbein BE Iron-controlled infection with Neisseria meningitidis in mice Infection and Immunity 1980; 29: 886-891
231 Holbein BE Enhancement of Neisseria meningitidis infection in mice by addition of iron bound to transferrin Infection and Immunity 1981; 34: 120-125
232 Hollister-Stier Laboratories Bibliography of references on the use of Monilia and Trichophyton antigens in assessment of delayed or precipitin mediated hypersensitivity 1973
233 Honig AS, Oski FA Developmental scores of iron deficient inf ants and the effects of therapy Infant Behavior and Development 1978; 1: 168-176
234 Honig AS, Oski FA Solemnity in the iron deficient inf ant Pediatric Research 1982; 16: 87A
235 Humbert JA, Moore LL Iron deficiency and infection: a dilemma Journal of Pediatric Gastroenterology and Nutrition 1983; 2: 403-406
236 Hurley LS, Keen CL, Lonnerdal B Aspects of trace element interaction during development Federation Proceedings 1983; 42: 1735-1739
237 Hurrell RF Bioavailability of different iron compounds used to fortify formulas and cereals: technological problems in: Iron nutrition in infancy and childhood. ed Stekel A. Raven Press. New York 1984: 147-178 .
238 Iolascon A, Perrone L Erythrocyte zinc content during childhood Acta Haematologica 1985; 73: 114-116
239 Isselbacher K.J, Adams RD, Braunwald E, Petersdorf RG, Wilson JD . Harrison's principles of internal medicine (ninth edition) New York: McGraw-Hill Book Company, 1980
240 Jackson S, Burrows TW The virulence-enhancing effect of iron on non-pigmented mutants of virulent strains of Pasteurella pestis British Journal of Experimental Pathology 1956; 37: 577-583
241 Jacobs A Non-haematological effects of iron deficiency Clinics in Haematology 1982; 11: 355-364

BIBLIOGRAPHY
242 Jacobs A, Bently DP, Joynson D, Jones P Immunological abnormalities in iron deficiency anaemia British Journal of Haematology 1973; 25: 283
243 Jacobs A, Joynson DHM Lymphocyte function and iron deficiency anaemia [Letter] Lancet 1974; ii: 844
244 Jacobs HM, George GS Evaluation of meat in the infant diet Pediatrics 1952; 10: 463-473
245 Jacobs P Diagnosis and treatment of iron deficiency anaemia South African Medical Journal 1979; 56: 123-125
246 Jain SK, Yip R, Roesch RM, Pramanik AK. Dallman PR, Shohet SB Evidence of peroxidative damage.to the erythrocyte membrane in iron deficiency American Journal of Clinical Nutrition 1983; 37: 26-30
247 James JA, Combes M
B.19
Iron deficiency in the premature infant: Significance and prevention by the intramuscular administration of iron dextran Pediatrics 1960; 26: 368-374
248 Janofsky J, Starfield B Assessment of risk in research on children Journal of Pediatrics 1981; 98: 842-846
249 Jarvis JH, Jacobs A Morphological abnormalities in lymphocyte mitochondria associated with iron deficiency anaemia Journal of Clinical Pathology 1974; 27: 973
250 Jenkins WMM, MacFarlane TW, Ferguson MM, Mason DK Nutritional deficiency in oral candidosis International Journal of Oral Surgery 1977; 6: 204-210
251 Johnson DL, McGowan RJ Anemia and infant behavior
· · -~· Nutrition and Behavior 1983; 1: 185-192
252 Johnson G, Jacobs P, Purves LR Iron binding protein of iron-absorbing rat intestinal mucosa Journal of Clinical Investigation 1983; 71: 1467-1476
253 · Jones RL, Cerami A, Peterson CM Host associated iron transfer factor - levels of bioactivity in transfusion siderosis Clinical Research 1981; 29: 388A
254 Jones RL, Peterson CM, Grady RW, Kumbaraci T, Cerami A, Graziano JH Effects of iron chelators and iron overload on salmonella infection Nature 1977; 267: 63-65
255 Joynson DHM, Jacobs A, Murray Walker D, Dolby AE Defect of cell mediated immunity in patients with iron deficiency anemia Lancet 1972; ii: 1058-1059

B.20 IRON NUTRITION AND IMMUNI'IY
256 Kadis S, Udeze FA, Polanco J, Dreesen DW Relationship of iron administration to susceptibility of newborn pigs to enterotoxic colibacillosis American Journal of Veterinary Research 1984; 45: 255-259
257 Kampschmidt RF Effects of leukocyte endogenous mediator on metabolism and infection Annals of Oklahoma Academy of Science 1974; 4: 62-67
258 Karp JE, Merz WG Association of reduced total iron binding capacity and fungal infections in leukemic granulocytopenic patients Journal of Clinical Oncology 1986; 4: 216~220
259 Katsushima N Peroxidase content in a single myeloid line and in plasma - Its clinical significance in pediatrics Tohoku Journal of Experimental Medicine 1963; 79: 250-266
260 Kattamis C Prospects, inabilities and achievements in epidemiologic studies on iron deficiency and iron deficiency anemia Paediatrician 1982; 11: 121-135
261 Katzman R, Novae A, :Pearson H Nutritional anemia in an inner-city community: relationship to age and ethnic group Journal of the American Medical Association 1972; 222: 670-673
262 Kaye D, Gill FA, Hook EW Factors influencing host resistance to salmonella infections: the effects of hemolysis and erythrophagocytosis · American Journal of the Medical Sciences 1967; 254: 205-215
263 Keusch GT, Farthing MJG Nutrition and infection Annual Reviews of Nutrition 1986; 6: 131-154
264 Khimji PL, Miles AA Microbial iron-chelators and their action on klebsiella infections in the skin of guinea-pigs British Journal of Experimental Pathology 1978; 59: 137-147
265 Kibel MA The tuberculin test following BCG vaccination Interpretation of the tuberculin skin test in the young child. Seminar of the Medical Research Council, Johannesburg, March 1987
266 Kim I, Pollitt E, Leibel RL, Viteri FE, Alvarez E Application of receiver-operator analysis to diagnostic tests of iron deficiency in man Pediatric Research 1984; 18: 916-920
267 Kirsten GP, Heese H de V, de Villiers S, Dempster WS, Varkevisser HE, Hoffman M The prevalence of iron deficiency in apparently healthy Cape Coloured infants South African Medical Journal 1984; 65: 378-340
268 Kluger MJ, Rothenburg BA Fever and reduced iron: their interaction as a host defense mechanism Science 1979; 203: 374-376
;

BIBLIOGRAPHY B.21
269 Knight GJ, Heese H de V, Dempster WS, Kirsten G Diagnosis of iron deficiency: mean corpuscular hemoglobin (MCH) as a predictor of iron deficiency in infants Pediatric Research 1982; 16: 168-170
270 Kochan I The role of iron in bacterial infections, with special consideration of host-tubercle interactions , Current Topics in Microbiology and Immunology 1973; 60: 1-29
271 Kochan I, Wasynczuk J, McCabe MA· , Effects of injected iron and siderophores on infections in normal and immune mice
Infection and Immunity 1978; 22: 560-567
272 Koerper MD, Dallman PR Serum iron concentration and transferrin saturation in the diagnosis of iron deficiency in children: Normal developmental changes Journal of Pediatrics 1977; 91: 871-874
273 Koller ME, Romslo I, Finne PH, Brockmeier F, Tyssebotn I The diagnosis of iron deficiency by erythrocyte protoporphyrin and serum ferritin analyses Acta Paediatrica Scandinavica 1978; 67: 361-366
274 Koutras AK, Vigorita VJ, Quiroz E Effect of iron-fortified formula on SigA of gastrointestinal tract in early infancy Journal of Pediatric Gastroenterology and Nutrition 1986; 5:. 926-930
275 Krantman HJ, Young SR, Ank BJ, O'Donnell CM, Rachelefsky GS, Stiehm E Immune function in pure iron deficiency American Journal of Diseases of Children 1982; 136: 840-844
276 K:raupl-Taylor F The concepts of illness, disease and morbus Cambridge: Caxnbridge University Press, 1979
277 Kulapongs R, Suskind RM, Vithayasai V, Olson RE Cell mediated immunity and phagocytosis and killing function in children with iron deficiency anemia Lancet 1974; ii: 689;691
278 KumarR . Mechanism of the anaemia of chronic infection: a re-examination of the role of functional iron deficiency in its causation Indian Journal of Medical Research 1976; 64: 1046-1056
279 Kumar R, Arora BB, Singh U, Mehrotra GC Storage iron in acute and chronic infection: mechanism of hypoferraemia of infection Indian Journal of Medical Research 1978; 68: 503-507
280 Kumar R, Singh U, Mehrotra GC Mechanism of hypoferraemia in acute and chronic infections Indian Journal of Medical Research 1978; 68: 508-514
281 Kuvibidila S Effect of iron deficiency anemia on the immune functions Boston:Massachusetts Institute of Technology, 1980. Dissertation

B.22 IRON NUTRITION AND IMMUNI'IY
282 Kuvibidila S, Baliga BS, Suskind RM Decreased generation of plaque forming cells in iron deficiency anemia in mice Nutrition Reports International 1982; 26: 861-872
283 Kuvibidila S, Nauss KM, Suskind RM Impairment of blastogenic response of splenic lymphocytes from iron-deficient mice: in vivo repletion American Journal of Clinical Nutrition 1983; 37: 15-25
284 Kuvibidila SR, Baliga BS, Suskind RM Effects of iron deficiency anemia on delayed cutaneous hypersensitivity in mice American Journal of Clinical Nutrition 1981; 34: 2635-2640
285 Kuvibidila SR, Baliga BS, Suskind RM The effect of iron-deficiency anemia on cytolytic activity of mice spleen and peritoneal cells against allogeneic tumor cells American Journal of Clinical Nutrition 1983; 38: 238-244
286 Lalonde RG, Holbein BE Role of iron in T,ypanosoma cruzi infection of mice Journal of Clinical Investigation 1984; 73: 470-476
287 Lanzkowsky P Investigation into the aetiology and treatment of pica Archives of Disease of Children 1959; 34: 140-148
288 Lanzkowsky P Mean haematological values in healthy infants and pre-school children in Cape Town
. South African Medical Journal 1960; 34: 469-471
289 Lanzkowsky P Iron deficiency: a public health problem Symposium on haematologic disease in children for the city of New York, Department of Health, 1975: 1-34
290 Lanzkowsky P Iron deficiency anaemia: a systemic disease Transactions of the College of Medicine of South Africa 1982; 26: 67-113
291 Larrick JW, Hyman ES Acquired iron-deficiency anemia caused by an antibody against the transferrin receptor New England Journal of Medicine 1984; 311: 214-218
292 Leibel R, Greenfield D, Pollitt E-Biochemical and behavioral aspects of sideropenia British Journal of Haematology 1979; 41: 145-150
293 Leikin SL The use of intramuscular iron in the prophylaxis of the iron deficiency anemia of prematurity American Journal of Diseases of Children 1960; 99: 739-745
294 Leikin SL Risks of research on children Journal of Pediatrics 1~2; 100: 166

BIBLIOGRAPHY
295 Letendre ED The importance of iron in the pathogenesis of infection and neoplasia Trends in biochemical sciences 1985; 10: 166-166
296 Letendre ED, Holbein BE Turnover in the transferrin iron pool during the hypoferremic phase of experimental Neisseria meningitidis infection in mice Infection and Immunity 1983; 39: 50-59
297 Letendre ED, Holbein BE
B.23
Ceruloplasmin and regulation of transferrin iron during Neisseria meningitidis infection in mice Infection and Immunity 1984; 45: 133-138
298 Letendre ED, Holbein BE Mechanism of impaired iron release by the reticuloendothelial system during the hypoferremic phase of experimental Neisseria meningitidis infection in mice Infection and Immunity 1984; 44: 320-325
299 Levander DA, Cheng L (Editors) Micronutrient interactions: vitamins, minerals, and hazardous elements Annals of the New York Academy of Sciences 1980; 355: 62-75
300 Lingam S Severe nutritional iron deficiency and behaviour disorder in an infant Journal of Human Nutrition 1980; 34: 41-42
301 Lonnerdal B Iron and breast milk in: Iron nutrition in infancy and childhood. ed Stekel A. Raven Press. New York 1984: 95-118
302 Lovric VA Normal haemoglobin values in children aged 6 to 36 months and socio-medical implications Medical Journal of Australia 1970; 2: 366
303 Lowe CU, Alexander D, Mishkin B Non-therapeutic research on children: an ethical dilemma Journal of Pediatrics 1974; 84: 468-473
304 Lozoff B, Brittenham GM Behavioral aspects of iron deficiency Progress in hematology 1986; 14: 23-53
305 Lozoff B, Brittenham GM, Viteri FE, Wolf AW, Urrutia JJ The effects of short-term oral iron therapy on developmental deficits in iron-deficient anemic infants Journal of Pediatrics 1982; 100: 351-357
306 Lozoff B, Brittenham GM, Viteri FE, Wolf AW, Urrutia JJ Developmental deficits in iron-deficient infants: effects of age and severity of iron lack Journal of Pediatrics 1982; 101: 948-952
307 Lozoff B, Wolff AW Abnormal behavior and low developmental test scores in iron-deficient anemic infants Journal of Developmental and Behavioral Pediatrics 1985; 6: 69-75

B.24 IRON NUTRITION AND IMMUNITY
308 Lukens JN Iron deficiency and infection: fact or fable? American Journal of Diseases of Children 1975; 129: 160-162
309 Lonnerdal B, Keen CL, Franssoti G, Hambraeus L, Hurley LS New perspectives on iron supplementation of milk Journal of Pediatrics 1980; 96: 242
310 Lonnerdal B, Keen CL, Ohtake M, Tamura T Iron, zinc, copper and manganese in infant formulas
. Journal of Pediatrics 1983; 137: 43).437 ·
311 Macdougall LG, Anderson R, McNab GM, Katz J The immune response in iron deficient.children: impaired cellular defense mechanisms with altered humoral components Journal of Pediatrics 1975; 86: 833-843
312 Macdougall LG, Jacobs MR The immune response in iron deficient children - isohemagglutinin titres and antibody response to immunization South African Medical Journal 1978; S3: 405
313 MacFarlane H, Reddy S, Adcock KI Immunity, transferrin and survival in kwashiorkor British Medical Journal 1970; 4: 268-270
314 Mackay HMM Anaemia in infancy: its prevalence and prevention Archives of Disease in Childhood 1928; 3: 117-144
315 Mackay HMM The normal haemoglobin level during the first year of life: revised figures Archives of Disease in Childhood 1933; 8: 221-225 ·
316 Madanat F, El-Khateeb M, Tarawaneh M, Hijazi S Serum ferritin in evaluation of iron status in children Acta Haematologica 1984; 71: 111-115
317 Mahloudji M, Reinhold JG, Haghshenass M, Ronaghy HA, Spivey-Fox MR Combined zinc and iron compared with iron supplementation of diets of 6 to 12 year old village school children in Southern Iran American Journal of Clinical Nutrition 1975; 28: 721-725
318 Mainou-Fowler T, Brock JH Effect of iron deficiency on the response of mouse lymphocytes to concanavalin A: the importance of transferrin bound iron Immunology 1985; 54: 325-332
319 Malacaman EE, Abbousy FK, Crooke D, Nauyok G Effect of protein source and iron content of infant formula on stool characteristics Journal of Pediatric Gastroenterology and Nutrition 1985; 4: 771-773
320 Malakhovsky Yu E, Manerov FK, Chernov OM, Davyderiko OI, Livshits VV, Zobina VA, GavrisEA · [Immune response and susceptibility to infection in children with iron deficiency anaemia} Pediatriia 1983; 8: 28-31
I

BIBLIOGRAPHY
321 . Mangi RJ, Niedennan JC, Kelleher JE, Dwyer JM, Evans AS, Kantor FS Depression of cell-mediated immunity during infectious mononucleosis New England Journal of Medicine 1974; 291: 1149-1153
322 Margolis HS, Hardison HH, Bender TR, Dallman PR Iron deficiency in children: the relationship between pretreatment laboratory tests and subsequent hemoglobin response to iron therapy American Journal of Clinical Nutrition 1981; 34: 2158-2168
323 Marsh A, Long H, Stierwalt RN Comparative hematologic response to iron fortification of a milk formula for infants Pediatrics 1959; 24: 404-412
324 Marsh WL, Nelson DP, Koenig HM
B.25
Free erythrocyte protoporphyrin (FEP) I. Normal values for adults and evaluation of the hematofluorometer American Journal of Clinical Pathology 1983; 79: 655-660
325 Martin CM, J andle JH, Fmland M Enhancement of acute bacterial infection in rats and mice by iron and their inhibition by human transferrin Journal of Infectious Disease 1963; 112: 158-163
326 Martin DW, Mayes PA, Rodwell VW Harper's review of biochemistry 18th edition Los Altos, California: Lange Medical Publications, 1981
327 Martin W Do we get too much iron? Medical Hypotheses 1984; 14: 131-133
328 Masawe A, Nsunzumukive H Growth of bacteria in blood in vitro from patients with severe iron deficiency anemia and from patients with sickle cell disease American Journal of Clinical Pathology 1973; 59: 706
329 Masawe AE, Swai G Iron deficiency and infection [Letter] Lancet 1975; i: 1241
. 330 Masawe AEJ, Mwindi JM, Swai GBR Infections in iron deficiency and other types of anaemia in the tropics Lancet 1974; ii: 314-317
331 Matheny AP Jr Bayley's Infant Behavior Record: Behavioral components and twin analyses Child Development 1980; 51: 1157-1167
332 McDonald R, Marshall SR The value of iron therapy in pica Pediatrics 1964; 34: 558-562
333 McLaren DS, Read WWC Weight/length classification of nutritional status Lancet 1975; ii: 219-221

B.26
334
335
336
337
338
339
340
341
IRON NUTRITION AND IMMUNITY
McMillan JA, Landaw SA, Oski FA . . Iron sufficiency in breast-fed infants and the availability of iron from human milk Pediatrics 1976; 58: 687-691
Meadows NJ, Grainger SL, Ruse W, Keeling PWN, Thompson RPH Oral iron and the bioavailability of milk British Medical Journal 1983; 287: 1013-1014
Medical Research Council Responsibility in the use of personal medical information for research: principles and guide to practice British Medical J oumal 1985; 290: 1120-1124
Melby K, Slordahl S, Gutteberg TJ, Nordbo SA Septicaemia due to Yersinia enterocolitica after oral overdoses of iron British Medical Joumal 1982; 285: 467-468
Melhorn DK, Gross S Vitamin E dependent anemia in the premature infant: I Effects of large doses of medicinal iron ' Journal of Pediatrics 1971; 79: 569-580
Mellencamp MW, McCabe MA, Kochan I The growth-promoting effect of bacterial iron for serum-exposed bacteria Immunology 1981; 43: 483-491
MelnickJL in Viral Infection of humans: Epidemiology and control Evans AS ( ed) Enteroviruses New York and London: Plenum, 1982
Melvin SL Comparison of techniques for detecting T-cell acute lymphocytic leukemia Blood 1979; 54: 210-215
342 Michelson PA, Sparling PF Ability of Neisseria gonorrhoeae, Neisseria meningitidis and commensal neisseria species to obtain iron from transferrin and iron compounds Infection and Immunity 1981; 33: 555-564
343 Miles AA, Pillow J, Khimji PL The action of iron on local klebsiella infection on the skin of the guinea-pig and its relation to the decisive period in primary infective lesions British Journal of Experimental Pathology 1976; 57: 217-242
344 Miles LEM, Lipschitz DA, Bieber CP, Cooke JD Measurement of serum ferritin by a 2-site immunoradiometric assay Analytical Biochemistry 1974; 61: 209-224
345 Miller FJW Childhood morbidity and mortality in Newcastle-upon-Tyne: Further report on the thousand family study New England Journal of Medicine 1966; 275: 683-690
346 Miller V, Swaney S, Deinard A Impact of the WIC program on the iron status of infants Pediatrics 1985; 75: 100-105

I
BIBLIOGRAPHY B.27
347 MoePJ
348
Iron requirements in infancy Acta Paediatrica (supplement) 1963; 1SO: 1-65
Mofenson HC, Caraccio TR, Sharieff N Iron sepsis: Yersinia enterocolitica septicemia possibly caused by an overdose of iron [letter] New England Journal of Medicine 1987; 316: 1092-1093
349 Mokhobo KP Iron deficiency anaemia and pica South African Medical Journal 1986; 70: 473-475
350 Mollerberg L, Moreno-Lopez J · The response of normal and iron anaemic calves to nasal infection with an attenuated strain of parainfluenza-3 virus Acta Veterinaria Scandinavica 1975; 16: 186-1%
351 Monzon CM Anemia in infancy and childhood. A systematic approach to evaluation Postgraduate Medicine 1985; 78: 275-292
352 Moore LL, Humbert JR Neutrophil bactericidal dysfunction towards oxidant radical-sensitive microorganisms during experimental iron deficiency Pediatric Research 1984; 18: 684-687
353 Morris ER An overview of current information on bioavailability of dietary iron to humans Federation Proceedings 1983; 42: 1716-1723
354 Munn CG Iron and immunological function: effects on lymphocyte activation and differentiation in man New York:New York University, 1982. Dissertation
355 Murakawa H, Bland CE, Willis WT, Dallman PR Iron deficiency and oxidative function: different rates of correction of the depressions in oxidative burst and myeloperoxidase activity after iron treatment Blood 1987; 69: 1464-1468
356 Murphy EA The normal and the perils of the sylleptic argument Perspectives in Biology and Medicine 1972; 1S: 566-581
357 Murphy EA The logic of medicine Baltimore, Maryland: The Johns Hopkins University Press, 1976
358 Murray MJ, Murray A, Murray 0 The salutary effect of milk on amoebiasis and its reversal by iron British Medical Journal 1980; 280: 1351-1352
359 Murray MJ, Murray AB Starvation suppression and refeeding reactivation of infection. An ecological necessity ? Lancet 1977; i: 123

B.28
360
361
362
363
364
365
IRON NUTRITION AND IMMUNITY
Murray MJ, Murray AB Adverse effect of iron repletion on infection American Journal of Clinical Nutrition 1978; 31: 700
Murray MJ, Murray AB, Murray MB, Murray CJ . The adverse effect of iron repletion on the course of certain infections British Medical Journal 1978; 2: 1113,·1115
Murray MJ, Murray AB; Murray NJ, Murray MB Refeeding-malaria and hyperferraemia Lancet 1975; i: 653-654
Murray MJ, Murray AB, Murray NJ, Murray MB Diet and cerebral malaria: the effect of famine and re feeding American Journal of Clinical Nutrition 1978; 31: 57-61
Nalder BM, Mahoney AW, Ramakrishnan R, Hendricks DG Sensitivity of the immunological response to nutritional status of rats Journal of Nutrition 1972; 102: 535-542
Nathanson MH, McLaren GD Computer simulation of iron absorption: regulation of mucosal and systemic iron kinetics in dogs Zeitschrift fur Ernahrunuingswissenschaft 1987; 26: 21-42
366 Nathanson,MH, Saidel GM Multiple objective criteria for optimal experimental design: application to ferrokinetics American Journal of Physiology 1985; 248(R): R378-R386
367 Neckers LM, Cossman J Transferrin receptor induction in mitogen-stimulated human T lymphocytes is required for DNA synthesis and cell division and is regulated by interleukin 2 Proceedings of the National Academy of Sciences of the USA 1983; 80: 3494-3498
368 Neilands JB Iron absorption and transport in microorganisms Annual review of nutrition 1981; 1: 27-46
'369 Nishiya K, Horwitz DA Contrasting effects of lactoferrin on human lymphocytes and monocyte natural.killer activity and antibody-dependent cell mediate cytotoxicity Journal oflmmunology 1982; 129: 2519-2523
370 Notkins Al, Mergenhagen SE, Howard RJ Effect of. virus infections on the function of the immune system Annual Review of Microbiology 1970; 24: 525-538
371 NovakRW Red blood cell distribution width in paediatric microcytic anaemias Paediatrics 1987; 80: 252-254
372 Nurse GT Iron, the thalassemias and malaria Lancet 1979; ii: 314-317

BIBLIOGRAPHY
373 O'Brien AD Innate resistance of mice to Salmonella typhi infection Infection and Immunity 1982; 38:· 948-952
374 Okamura N, Spitznagel J Outer membrane mutants of Salmonella typhimurium LT2 have lipopolysaccharidedependent resistance to the tumoricidal activity of anaerobic human neutrophils Infection and Immunity 1982; 36: 1086-1095
375 Oppenheimer SJ Anaemia of infancy and bacterial infections in Papua New Guinea Annals of Tropical Medicine and Parasitology 1980; 74: 69-72
B.29
376 Oppenheimer SJ, Gibson FD, MacFarlane SB, Moody JB, Harrison C, Spencer A, Bunari 0 Iron supplementation increases prevalence and effects of malaria: report of clinical studies in Papua New Guinea Transactions of the Royal Society of Tropical Medicine and Hygiene 1986; 80: 603-612
377 Oppenheimer SJ, Gibson FD, Macfarlane SB, Moody JB, Hendrickse RG Iron supplementation and malaria [Letter] Lancet 1984; i: 389-390
378 Oppenheimer SJ, Hendrickse RG, MacFarlane SBJ, Moody JB, Harrison C, Alpers M, Heywood P, Vrbova H Iron and infection in infancy - Report on field studies.in Papua New Guinea: II. Protocol and description of study cohort Annals of Tropical Paediatrics 1984; 4: 145-153
379 Oppenheimer SJ, MacFarlane SBJ, Moody JB, Bunari 0, Williams TE, Harrison C, Hendrickse RG Iron and infection in infancy - report on field studies in Papua New Guinea: L Demographic description . Annals of Tropical Paediatrics 1984; 4: 135-143
380 Osborne JC, Davis JW Increased susceptibility to bacterial endotoxin of pigs with iron-deficiency anemia Journal of the American Veterinary Medical Association 1968; 152: 1630-1632
381 OskiFA The non-hematological manifestations of iron deficiency American Journal of Diseases of Children 1979; 133: 315-322
382 OskiFA Iron supplementation and the breast-fed infant Journal of Pediatric Gastroenterology and Nutrition 1985; 4: 344-345
383 Oski FA, Honig AS The effects of therapy on the developmental.scores of iron-deficient infants Journal of Pediatrics 1978; 92: 21-25
384 Oski FA, Honig AS, Helu B, Howanitz P Effect of iron therapy on behavior performance in nonanemic, iron-deficient infants Pediatrics 1983; 71: 877-880
385 Oski FA, Stockman JA Anemia due to inadequate iron sources or poor iron utilization Pediatric Clinics of North America 1980; 27: 237-252

B.30
386
387
388
389
390
391
392
393
394
395
396
397
398
IRON NUTRITION AND IMMUNITY
Owen GM, Hooper EM, Gilbert BA, Pathak D Iron nutriture of infants exclusively breast-fed the first five months Journal of Paediatrics 1981; 99: 237-240
Owen GM, Lubin All, Garry PJ Preschool children in the United States: Who has iron deficiency? Journal of Pediatrics 1971; 79: 563-568
Page Faulk W, Demaeyer EM, Davies AJS Some effects of malnutrition on the inunune response in man American Journal of Clinical Nutrition 1974; 27: 638-646
ParrattD Nutrition and Immunity Proceedings of the Nutrition Society 1980; 39: 133-140
Payne SM; Finkelstein RA Pathogenesis and immunology of experimental gonococcal infection: role of iron in virulence Infection and Immunity 1975; 12: 1313-1318
Payne SM, Finkelstein RA The critical role of iron in host-bacterial interactions Journal of Clinical Investigation 1978; 61: 1428-1440
Payne SM, Holmes KK, Finkelstein RA Role of iron in disseminated gonococcal infections Infection and Immunity 1978; 20: 573-574
PearnJH The child and clinicaf research Lancet 1984; ii: 510-512
Pearson HA, Robinson JE The role of iron in host resistance
. Advances in Pediatrics 1976; 23: 1-33
Perkki Mv, Jansson I.T, Dallman PR, Siimes MA, Savilahti E sigA- IgM- containing cells in the intestinal mucosa of iron deficient rats American Journal of Clinical Nutrition 1987; 46: 341-345
Phillips JL, Azari P The effect of iron transferrin on nucleic acid synthesis in phytohemaglutinin stimulated human lymphocytes Cellular Immunology 1975; 15: 94
Pintar J, Skikne BS, Cook JD A screening test for assessing iron status Blood 1982; 59: 110-113
Piomelli S A micro method for free erythrocyte porphyrin. The FEP test. Journal of Laboratory and Clinical Medicine 1972; 81: 932-940
399 Polk HC, Miles AA Enhancement of bacterial infection by ferric iron: kinetics, mechanisms, and surgical significance Surgery 1971; 70: 71-77

BIBLIOGRAPHY
400 Polle HC, Miles AA The decisive period in the primary infection of muscle by Escherichia coli British Journal of Experimental Pathology 1973; 54: 99-109
401 Pollack S Malaria and iron ( editorial) British Journal of Haematology 1983; 53: 181-183
402 Pollack S, Fleming J Plasmodium falciparom takes up iron from transferrin British Journal of Haematology 1984; 58: 289-293
403 Pollitt E, Leibel RL Iron deficiency and behaviour Journal of Pediatrics 1976; 88: 372-381
. 404 Pollitt E, Soemastri AG, Yunis F, Scrimshaw NS Cognitive effects of iron deficiency.anaemia [letter] Lancet 1985; i: 158
405 Porter DA Studies on the effect of milk diet on the resistance of rats to Nippostrongylus muris American Journal of Hygiene 1935; 22: 467
406 Puschmann M, Ganzooi AM Increased resistance of iron-deficient mice to salmonella infection Infection and Immunity 1977; 17: 663-664
407 Qazzaz ST, Mamattah JHK, Ashcroft T, McFarlane H The development and nature of immune deficits in primates in response to malnutrition British Journal of Experimental Pathology 1981; 62: 452-459
408 Rajantie J, Siimes MA
B.31
Why concentration of serum ferritin does not in all circumstances reflect storage iron but is still of value in its estimation . Scandanavian Journal of Haematology 1983; 31: 20-22
409 Ramos-Alvarez M, Sabin AB Intestinal viral flora of healthy children demonstrable by monkey kidney tissue culture American Journal of Public Health 1956; 46: 295-299
410 Rarentos-Suary C, Pollack S, Nagel RL Plasmodium f alciparom inhibition of in vitro growth by desferrioxamine American Journal of Tropical Medicine and Hygiene 1982; 31: 919-922
411 Redmon RB How children can be respected as 'ends' yet still be used as subjects in non-therapeutic research Journal of Medical Ethics 1986; 12: 77-82
412 Reeves, Yip R, Kiley VA, Dallman PR Iron deficiency in infants: the influence of mild antecedent infection Journal of Pediatrics 1984; 105: 874-879
413 Reimann F, Koptagel G Geophagia in iron deficiency disease New Istanbul Contributions to Clinical Science 1980; 13: 63-79

B.32
414
415
416
417
418
419
420
421
422
423
424
425
426
IRON NUTRITION AND IMMUNITY
Repine JE, Clawson CC, Brunning RD . . . . Primary leucocyte alkaline phosphatase deficiency m an adult with repeated infect10ns British Journal of Haematology 1976; 34: 87-94
Report of an IAEA/USAID /WHO Joint Meeting Control of nutritional anaemia with special reference to iron deficiency World Health Organization Technical Report Series 1975; No S80: 1·71
Reynolds RD, Binder HJ, Miller MB, Chaug WWY, Horan S Pagophagia and iron deficiency anemia Annals of Internal Medicine 1968; 69: 435440
Richards J, Jacobs P The classification, investigation and treatment of the anaemic patient South African Medical Journal 1980; S8: 511-515
Rios E, Hunter RE, Cook JD, Smith NJ, F'mch CA The absorption of iron as supplements in infant cereal and infant formula Pediatrics 1975; SS: 686-693
Roberts GT, El Badawi SB Red blood cell distribution width inde;ic in some hematologic diseases American Journal of Clinical Pathology 1985; 83: 222-226
Robertson I, Sundgren KB Anaemia in pre-school children in an urban area South African Medical Journal 1972; 11: 1117~1122
Robins-Browne RM, Prpic JK Effects of iron and desferrioxamine on infections with Yersinia enterocolitica Infection and Immunity 1985; 47: 774-779
Robins-Browne RM, Rabson AR, Koorohof ID· Generalized infection with Yersinia enteroco/itica and the role of iron Contributions to Microbiology and Immunology 1979; S: 277-282
Rodvien R, Tavassoli M, Crosby WH The structure of the spleen in experimentally induced iron deficiency anemia American Journal of Pathology 1974; 75: 242-254
Rohrer SD, Baliga BS, Suskind RM Decreased macrophage mediated tumoricidal activity in iron deficiency anemia Federation Proceedings 1982; 41: 341 (424)
Ronnlund RD, Rohrer SD, Baliga BS, Suskind RM Natural cytotox:icity of spleen cells from iron-deficient mice Federation Proceedings 1982; 41: 341. ( 422)
RoseJA Aetiology of angular cheilosis. Iron Metabolism British Dental Journal 1968; 12S: 67-72
427 Rose NR, Friedman H (eds) Manual of clinical im1nunology Washington DC: American Society for Microbiology, 1980

BIBLIOGRAPHY
428 Roselle HA Association of laundry starch and clay ingestion with anemia in New York City Archives of Internal Medicine 1970; 125: 57-61
429 Rossander L Effect of dietary fibre on iron absorption in man Scandinavian Journal of Gastroenterology 1987; 129: 68-72
430 Rothenbacher H, Sherman AR Target organ pathology in iron-deficient suckling rats Journal of Nutrition 1980; 110: 1648-1654
431 Ruiz S, Walter T, Perez H, Stekel A, Hernandez.A, Soto-Moyano R Effect of early iron deficiency on reactivity of the rat parietal association cortex International Journal of Neuroscience 1984; 23: 161-168
432 Saarinen UM Need for iron supplementation in infants on prolonged breast feeding Journal of Pediatrics 1978; 93: 177-180
433 Saarinen UM, Sfunes M
B.33
Developmental changes in serum iron, total iron binding capacity, and transferrin saturation in infancy Journal of Pediatrics 1977; 91: 875-877
434 Saarinen UM, Sfunes MA Iron absorption from infant milk formula and the optimal level of iron supplementation Acta Paediatrica Scandinavica 1977; 66: 719-722
435 Saarinen UM, Siimes MA Developmental changes in red blood cell counts and indices of infants after exclusion of iron deficiency by laboratory criteria and continuous iron supplementation Journal of Pediatrics 1978; 93: 412-416
436 Saarinen UM, Siimes MA Serum ferritin in assessment of iron nutrition in healthy infants Acta Paediatrica Scandinavica 1978; 67: 745-751
437 Saarinen UM, Siimes MA Iron absorption from breast milk, cow's milk, and iron supplemented formula: an opportunistic use of changes in total body iron determined by hemoglobin, ferritin and body weight in 132 infants · Pediatric Research 1979; 13: 143-147
438 Saarinen UM, Siimes MA, Dallman PR Iron absorption in infants: High bioavailability of breast milk as indicated by the extrinsic tag method of iron absorption and by the concentration of serum ferritin Journal of Pediatrics 1977; 91: 36-39
439 Sacks HS, Berrier J, Reitman D, Ancona-Berk VA, Chalmers TC Meta-analyses of randomized controlled trials New England Journal of Medicine 1987; 316: 450-455
440 Sadowitz PD, Oski FA Iron status and infant feeding practices in an urban ambulatory center Pediatrics 1983; 72: 33-36

/
B.34
441
442
443
444
445
446
447
448
449
450
451
452
453
IRON NUTRITION AND IMMUNITY
Sagone AL, Balcerzak SP . . . . Activity of iron-containing enzymes in erythrocytes and granulocytes m thalassem1a and iron-deficiency American Journal of Medical Science 1970; 259: 350
Salmi T, Hanninen P, Peltonen T Applicability of chelated iron in the care of prematures Acta Paediatrica Scandinavica 1963; 140(s): 114
Salvioli GP, Faldella G, Alessandtoni R, Lanari M, Benfenati I Plasma zinc concentrations in iron supplemented low birthweight infants Archives of Disease in Childhood 1986; 61: 346-348
Savage WE, Hajj SN, Kass EH Demographic and prognostic characteristics of bacteriuria in pregnancy Medicine 1967; 46: 385-407
Sawitsky B, Kanter R, Sawitsky A Lymphocyte response to phytomitogens in iron deficiency American Journal of the Medical Sciences 1976; 272: 153-160
Sawitsky G, Hoffmann FA, Kubanek B Acute iron overload in mice: pathogenesis of Salmonella typhimurium infection Infection and Immunity 1983; 39: 659-665
Sbarra AJ, Selvaraj RJ, Paul BB, Strauss RR, Mitchell GW Bactericidal activities of phagocytes in health and disease American Journal of Clinical Nutrition 1974; 27: 629-637
Schade AL, Caroline L Raw hen egg white and the role of iron in growth inhibitions of Shige/la dysenteriae, Staphylococcal aureus, Escherichia coli, and Saccaromyces cerivisiae Science 1944; 100: 14-·15
Schiff R, Buckley R, Gilbertsen R, Metzgar RS Membrane receptors and in vitro responsiveness of lymphocytes in human immunodeficiency Journal of Immunology 1974; 112: 376e386
Schulz-Lell G, Buss R, Oldigs HD,Domer K, Schaub J Iron balances in infant nutrition Acta Paediatrica Scandinavica 1987; 76: 585-591
Schwartz D, Lellouch J Explanatory and pragmatic attitudes in therapeutic trials Journal of Chronic Disease 1967; 20: 637-648
Scott HL, Silverman PH, Mansfield ME, Levine HS Haemonchus contortus infection in sheep: active and passive inununity in sheep given oral iron supplement· American Journal of Veterinary Research 1971; 32: 249-262
Scott JM Toxicity of iron sorbitol citrate (letter] British Medical Journal 1962; 2: 480-481

BIBLIOGRAPHY
454 Scott JM Iron-sorbitol-citrate in pregnancy anaemia British Medical Journal 1963; 2: 354-357
455 Seeley JR, Humphrey GB, Matter BJ Copper deficiency in a premature infant fed an iron-fortified formula [letter] New England Journal of Medicine 1972; 286: 109-110
456 Sever JL Application of a microtechnique to _viral serological investigations Journal of Immunology 1962; 88: 320-329
457 Shand GH, Anwar H, Kadurugamuwa J, Brown MR, Silverman SH, Melling J
B.35
In vivo evidence that bacteria in urinary tract infection grow under iron-restricted conditions Infection and Immunity 1985; 48: 35-39
458 Shannon DC, Johnson G, Rosen FS, Austen KF Cellular reactivity to Candida a/bicans antigen New England Journal of Medicine 1966; 275: 690-693
459 Shaw R, Robertson WO Anemia among hospitalized infants Ohio Medical Journal 1964; 60: 45-47
460 Siegel I Aut0Iog0J.1S thymocyte-red cell adherence [Letter] Journal of Allergy and Clinical Immunology 1974; 54: 255
461 Siimes M Iron nutrition in low-birth-weight infants in: Iron nutrition in infancy and childhood. ed Stekel A. Raven Press. New York 1984: 75-94
462 Siimes MA, Saarinen UM What critical value of transferrin saturation identifies iron deficiency in nonanemic breastfed infants? [Letter] Journal of Pediatrics 1978; 91: 1027
463 Siimes MA, U nori E, Knitunen P Breast milk iron · a declining concentration during the course of lactation Acta Paediatrica Scandinavica 1979; 68: 29
464 Smit PC Clinical Trials, Children and the Law South African Medical Journal 1977; 51: 155-156
4Q5 Smith CH, Miller DR Blood diseases of infancy and childhood Saint Louis: The CV Mosby Co., 1972
466 Smith IM, Hill R, Licence ST Increased survival from acute Salmonella gallinarnm infection in chicks given diets with high levels of some forms of iron Research in Veterinary Science 1977; 23: 263-268
467 Smith M Taking blood from children causes no more than minimal harm Journal of Medical Ethics 1985; 11: 127-131

B.36
468
469
470
471
472
473
474
IRON NUTRITION AND IMMUNITY
Sofaer JA, Holbrook WP, Southam JC Experimental oral infection with the yeast Candida albicans in mice with or without inherited iron-deficiency anaemia (sla) .Archives of Oral Biology 1982; 27: 497-503
Solomons NW Competitive interaction of iron and zinc in the diet: consequences for human nutrition Journal of Nutrition 1986; 116: 927-935
Solomons NW, Jacob RA Studies on the bioavailability of zinc in humans. Effects of heme and non-heme iron on the absorption of zinc American Journal of. Clinical Nutrition 1981; 34: 475-482
Special Report: The ethical code and practice for clinical investigations on human beings Cape Town, Undated: The South African Medical Research Council
Spence JC, Walton WS, Miller FJ, Court SDM A thousand families in Newcastle-upon-Tyne: An approach to the study of health and illness in children Fairlawn, New Jersey and Oxford: Nuffield Foundation and Nuffield Provincial Trust, 1954
Srikantia SG, Siva PrasadJ, Bhaskaram C, Krishnamachari KA VR Anemia and. the immune response Lancet 1976; i: 1307-]309
Starfield B Chapter 5. Iron-Deficiency anemia. in: Harvard Child Health Project. Children's medical care needs and treatments Boston: Ballinger, 1977
475 Starfield B, Katz H, Gabriel A, Livingston G, Benson P, Hankin J, Hom S, Steinwachs D Morbidity in childhood - a longitudinal view New England Journal of Medicine 1984; 310: 824-829
476 Stavitsky AB Micromethods for the study of proteins and antibodies I. Procedure and general applications of hemagglutination and hemagglutination-inhibition reactions with t Journal of Immunology 1954; 72: 360-367
477 Steigbigel RT, Lambert LH, Remington JS Phagocytic and bactericidal properties of normal human monocytes Journal of Clinical Investigation 1974; 53: 131-142
478 Stein RS Iron deficiency and infection {Letter J Lancet 1974; ii: 1567
479 StekelA Prevention of iron deficiency in: Iron nutrition in infancy and childhood. ed StekelA. Raven Press. New York 1984: 179-194
480 StekelA Iron requirements in infancy and Childhood in: Iron nutrition in infancy and childhood. ed Stekel A. Raven Press. New York 1984; 1-10

BIBLIOGRAPHY
481 Stekel A, Olivares M, Amar M, Pizzaro F Effect of ascorbic acid on the absorption of supplementary iron in milk· 16th International Congress of Hematology. Abst 3-12, Kyoto, Japan
482 Stekel A, Olivares M, Pizarro F, Chadud P, Lopez I, Amar M Absorption of fortification iron from milk formulas in infants American Journal of Clinical Nutrition 1986; 43: 917-922
483 Stockman JA Hematologic manifestations of systemic disease In: Haematology in infancy and childhood Nathan DG, Oski FA (eds)
484 Stockman JA Infections and iron: too much of a good thing? [ editorial] American Journal of Diseases of Children 1981; 135: 18-20
485 Strauss R Iron deficiency, infections and immune function: reassessment American Journal of Clinical Nutrition 1978; 31: 660-661
486 Sturgeon P
B.37
Studies of iron requirements in infants and children I. Normal values for serum iron, copper and free erythrocyte protoporphyrin Pediatrics 1954; 13: 107-125
487 Sturgeon P Studies of iron requirements in infants and children II. The influence on normal infants of oral iron in therapeutic doses Pediatrics 1956; 17: 341-347
488 Sulzer JL, Wesley HH, Leonig F Nutrition and behaviour in head start children: results from the Tulane Study in Nutrition, Development and Social Behaviour ed Kallen DJ Washington, DC: DHEW Publications, 1973
489 Suskind RM ( ed) Malnutrition and the immune response New York: Raven Press, 1977
490 Sword CP Mechanisms of pathogenesis in Listeria monocytogenes infection. I. Influence of iron Journal of Bacteriology 1966; 92: 536-542
491 Tanner JM, Whitehouse RH, Takaishi M Standards from birth to maturity for height, weight, height velocity, and weight velocity: British children, 1965 Part II Archives of Disease in Childhood 1966; 41: 613-635
492 Tanner JM, Whitehouse RH, Takaishi M Standards from birth to maturity for height, weight, height velocity, and weight velocity: British children, 1965 Part I Archives of Disease in Childhood 1966; 41: 454-471, ·
493 Tavassoli M, Durocher JR, Crosby WH Regeneration of marrow tissue in chronic iron deficiency in postweanling rats Blood 1972; 40: 129-135

B.38
494
495
496
497
498
499
500
501
502
IRON NUTRITION AND IMMUNITY
Thomas WJ, Loening HM, Lightsey AL, Green R Free erythrocyte porphyrin haemoglobin ratio, serum ferritin and transferrin saturation levels during treatment of infants with iron deficiency anaemia Blood 1977; 49: 455-465
Tindal G What research on children may be permitted? Report of meeting of the Open se·ction 10 February 1986 Royal Society of Medicine 1987; 80: 321-323
Tonkin S Maori Infant Health: 2. Study of morbidity and medico-social aspects New Zealand Medical Journal 1970; 72: 229-238
TonkinS Maori infant health: Trial of intramuscular iron to prevent anaemia in Maori babies New Zealand Medical Journal 1970; 71: 129-135
Tucker DM, Sandstead HH, Penland JG, Dawson SL, Milne DB Iron status and brain function: serum ferritin levels associated with asymmetries of cortical electrophysiology and cognitive performance American Journal of Clinical Nutrition 1984; 39: 105-113
V alberg LS, Flanagan PR, Chamberlain MJ Effects of iron, tin and copper on zinc absorption in humans American Journal of Clinical Nutrition 1984; 40: 536-541
van Asbeck S, Vetbrugh HA, van Oost BA, Marx JJM, lmhofHW, Verhoef J Listeria monocytogenes meningitis and decreased phagocytosis associated with iron overload British Medical Journal 1982; 284: 542-544
van Asbeck SB, Marx JJM, Struyvenberg A, van Kats m, Verhoef J Effect of iron(ffi) in the presence of various ligands on the phagocytic and metabolic activity of human polymorphonuclear leukocytes · Journal of Immunology 1984; 132: 851-856
Vazquez-Seoane P, Windom R, Pearson HA Disappearance of iron-deficiency anemia in a high-risk infant population given supplemental iron New England Journal of Medicine 1985; 313: 1239-1240
503 Vellar OD, Winther FO, Horthe K, Lystad A Upper respiratory tract infections in relation to iron medication in healthy students Journal of Otolaryngology 1974; 88: 773-783
504 Vyas D, Chandra RK Functional.implications of iron deficiency in: Iron Nutrition in infancy and childhood. ed Stekel A. Raven Press. New York 1984: 45-60
505 Walker DM, Dolby AE, Joynson DHM, Jacobs A Candida and the immune defects in iron deficiency Journal of Dental Research 1973; 52 Sup: 938-939
506 Walter T, Arredondo S, Ar valo M, Stekel A Effect of iron therapy on phagocytosis and bactericidal activity in neu~rophils of irondeficient infants American Journal of Clinical Nutrition 1986; 44: 877-882

BIBLIOGRAPHY
507 Walter T, Kovalskys J, Stekel A Effect of mild iron deficiency on infant mental development scores Journal of Pediatrics 1983; 102: 519-522
508 Ward CG Influence of iron on infection American Journal of Surgery 1986; 151: 291-295
509 Ward CG, Mitchell M, Streitfeld MM The effect of iron on mixed infection of BacteT'()ides fragilis and Escherichia coli. in mice Journal of Surgical Research 1983; 35: 351-353
510 Warren J, Mason RJ, Barbosa LH, Gabbard KL, Bucy M Increased susceptibility to murine hepatitis virus infection by treatment with iron salts Proceedings of the Society for Experimental Biology and Medicine 1968; 129: 637-642
511 Watchko JF Decision making on critically ill infants by parents American Journal of Diseases of Childhood 1983; 137: 795-798
B.39
512 Waterlot Y, Cantineaux B, Harig-Muller C, de Maertelaere-Laurent E, Vanherweghem JL, Fondu P Impaired phagocytic activity of neutrophils in patients receiving haemodialysis: the critical role of iron overload British.Medical Journal 1985; 291: 501-504
513 Webb TE, Oski FA Iron deficiency anemia and scholastic performance in young adolescents Journal of Pediatrics 1973; 82: 827-830
514 Webb TE, Oski FA Behavioural status of young adolescents with iron deficiency anemia Journal of Special Education 1974; 8: 153-156
515 Weinberg ED Iron and susceptibility to infectious disease Science 1974; 184: 952-956
516 Weinberg ED · Nutritional immunity. Host's attempt to withhold iron from microbial invaders Journal of the American Medical Association 1975; 231: 39-41
517 Weinberg ED Iron in neoplastic disease Nutrition and Cancer 1983; 4: 223-233
518 Weinberg ED Iron withholding: a defense against infection and neoplasia Physiological Reviews 1984; 64:. 65-102
519 Weinbren, Salm R, Greenberg G Intramuscular injections of iron compounds and oncogenesis in man British Medical Journal 1978; 1: 683-685
520 Werkman SL, Shifman L, Skelly T Psychosocial correlates of iron deficiency anemia in early childhood Psychosomatic Medicine 1964; 26: 125-134

7 SEP 1988 B.40 IRON NUTRITION AND IMMUNITY
521 Widdowson EM, Spray CM Chemical development in utero
522
Archives of Disease in Childhood 1951; 26: 205-214
Williams ML, Shott JU, O'Neal PL, Oski FA Role of dietary iron and fat on vitamin E deficiency anemia of infancy New England Journal of Medicine 1975; 292: 887-890
523 Woods DE, Sokol PA, Iglewski BH Modulatory effect of iron on the pathogenesis of Pseudomonas aernginosa mouse corneal infections Infection and Immunity 1982; 35: 461-464
524 Worwood M Ferritin in human tissues and serum Clinics in Haematology 1982; 11: 275-?,07
525 Wright AC, Simpson LM, Oliver JD Role of iron in the pathogenesis of Vibrio vuinificus infections Infection and Immunity 1981; 34: 503-507
526 Yetgin S, Altay C, Ciliv G, Laleli Y Myeloperoxidase activity and bactericidal function of PMN in iron deficiency Acta Haematologica 1979; 61: 10-14
527 Yip R, Johnson C, Dallman PR Age related changes in labdratory values used in the diagnosis of anemia and iron deficiency American Journal of Clinical Nutrition 1984; 39: 427A36
528 Yip R, Norris TN, Anderson AS Iron status of children with elevated blood lead concentration Journal of Pediatrics 1981; 98: 922-925
529 Yip R, Reeves JD; Lonnerdal B, Keen CL, Dallman PR Does iron supplementation compromise zinc nutrition in healthy infants? American Journal of Clinical Nutrition 1985; 42: 683-687
530 Yip R, Schwartz S, Deinard AS
531
Screening for iron deficiency with the erythrocyte protoporphyrin test Pediatrics 1983;,?2: 214-219
Yip R, Schwartz S, Deinard AS Hematocrit values in white, black, and American Indian children with comparable iron status: evidence to support uniform diagnostic criteria for anemia among all races American Journal of Clinical Nutrition 1984; 138: 824-827
532 Zajicek G On the inadequacy of the concept of disease Medical.Hypotheses 1982; 9: 169-177