The Economics of Quality Peter Bowbrick
© Peter Bowbrick, Moral right asserted
1
A REFUTATION OF THE ‘COSTS OF PRODUCING QUALITY’ THEORY
PETER BOWBRICK
This refutation is one chapter of my book, The Economics of Quality, Grades and Brands, Routledge Revivals, 2014. A list of my other books and papers on quality can be found at the end of this paper. I should be happy to provide copies to researchers: contact me at [email protected].
INTRODUCTION In the literature on quality control, quality assurance, Total Quality Management etc. there is
often a discussion of what is called The Costs of Quality, or even The Economics of Quality
Assurance.1 The cost of quality approach is essentially one carried out by quality assurance
engineers using cost accounting data, rather than one that would be used by economists.
There has been a certain amount of criticism of the approach within the paradigm (e.g.
Plunkett and Dale, 1988, and Fox, 1989) partly a criticism of the method itself, and partly an
assertion that the results quoted were not realistic. In this chapter, however, a much more
fundamental criticism will be presented, from the point of view of an economist. The main
thrust of the argument will be that the writers on the subject have used a wide variety of
variables as axes to their graphs, more or less interchangeably. They have failed to define
what exactly is the variable they are using for their axes, or how they measure the variables.
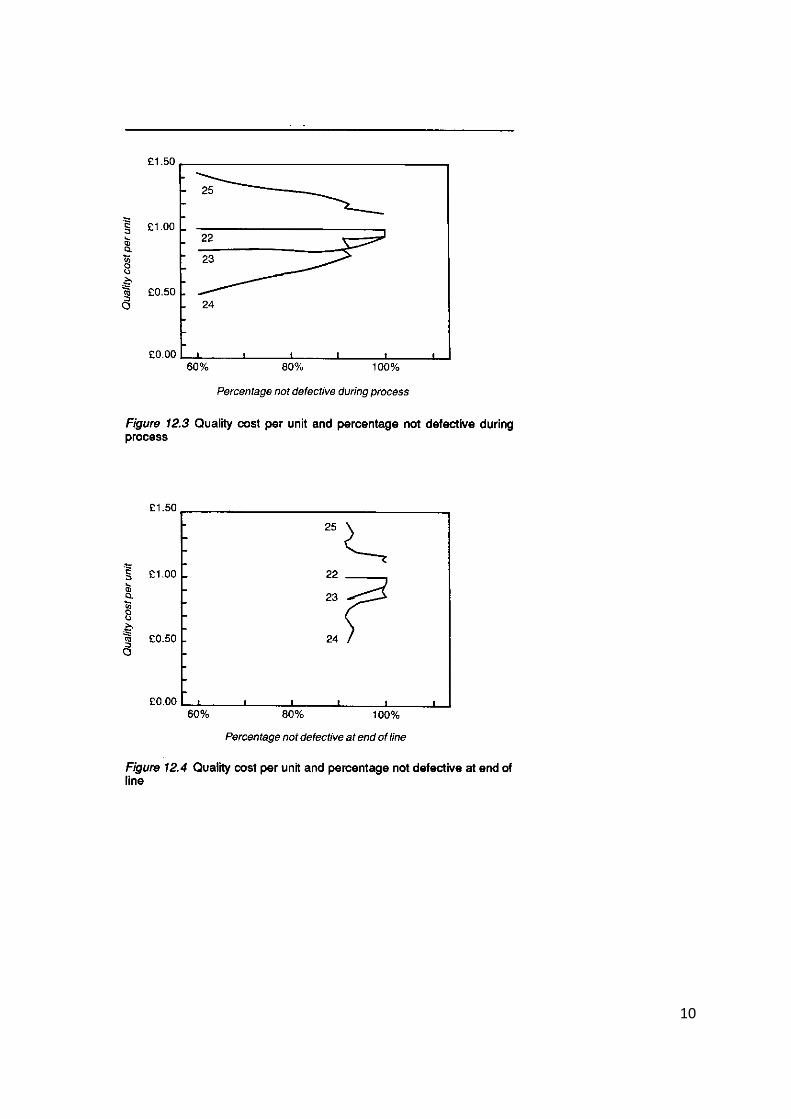
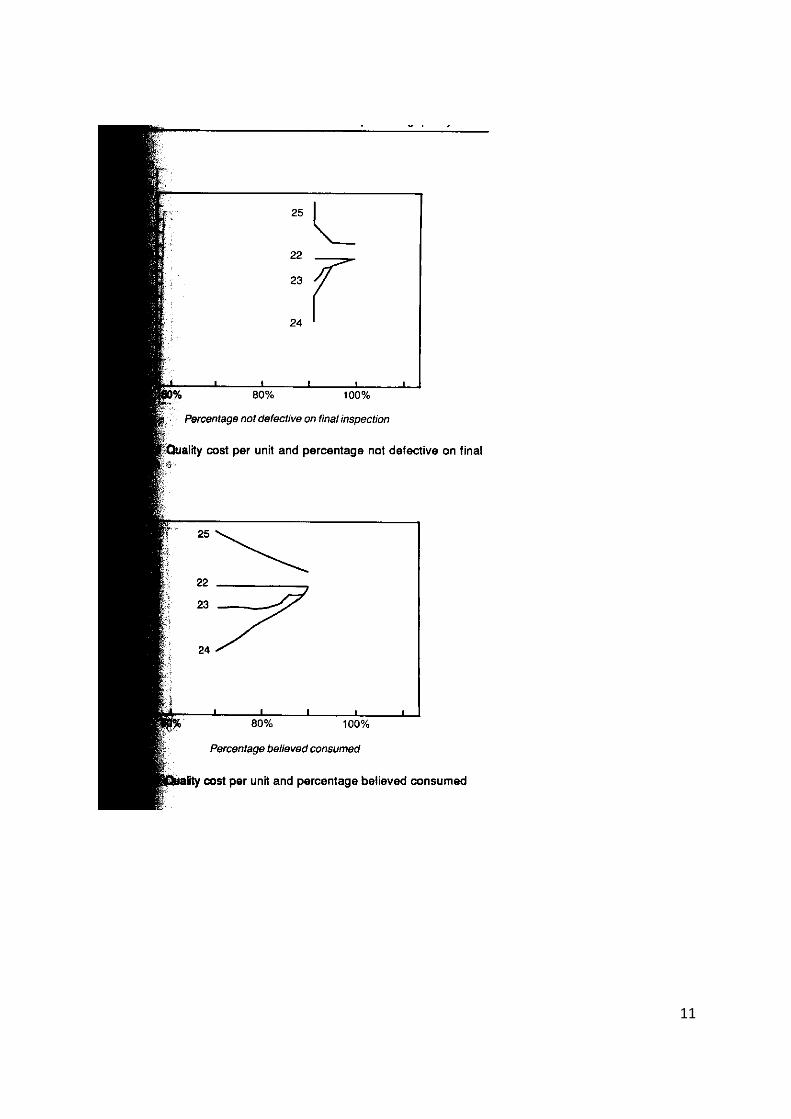
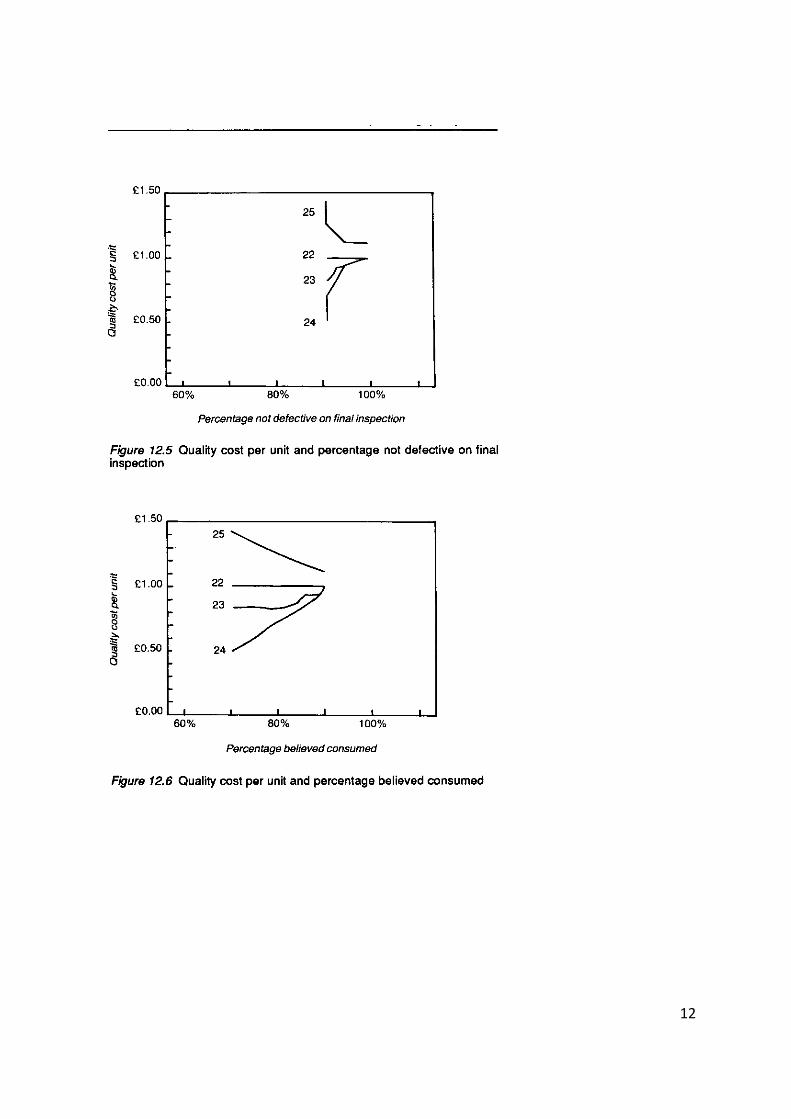
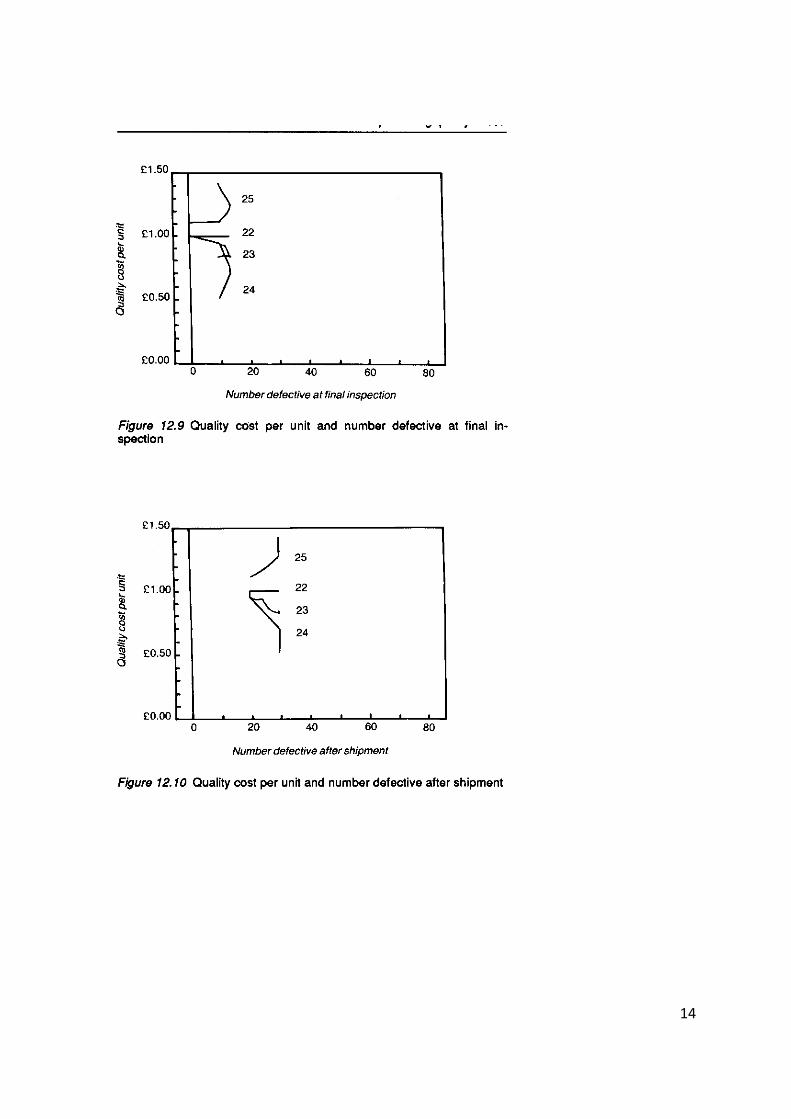
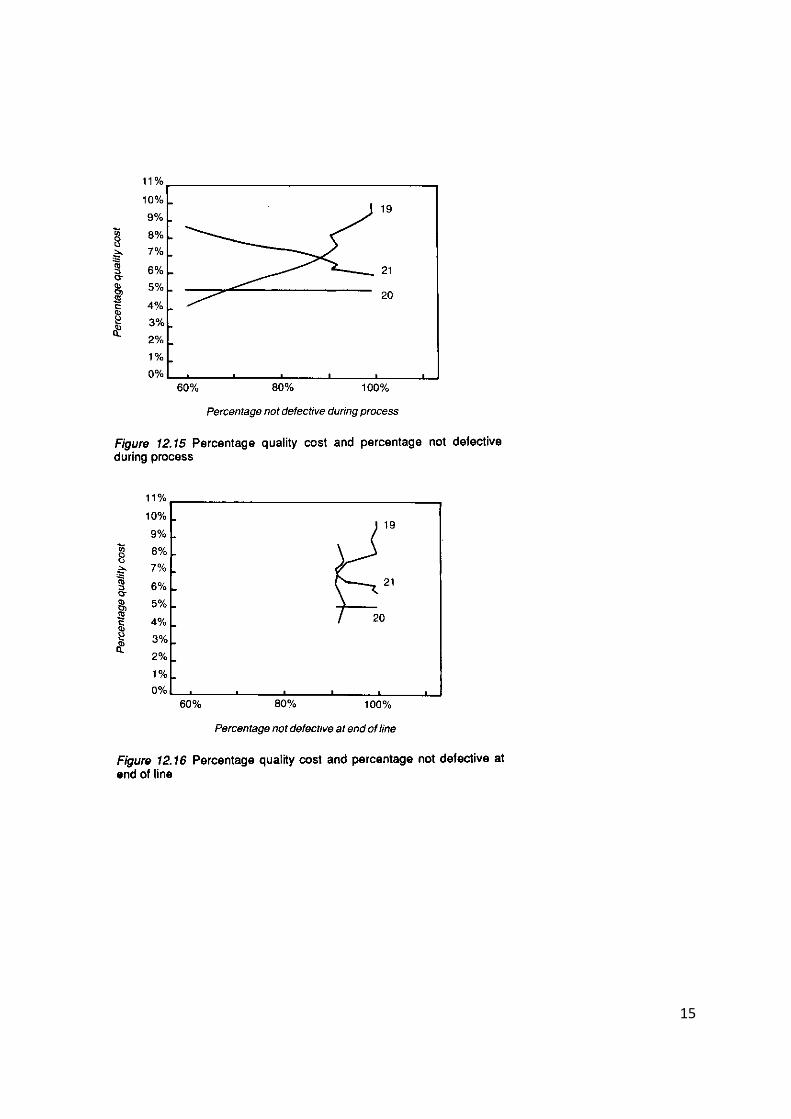
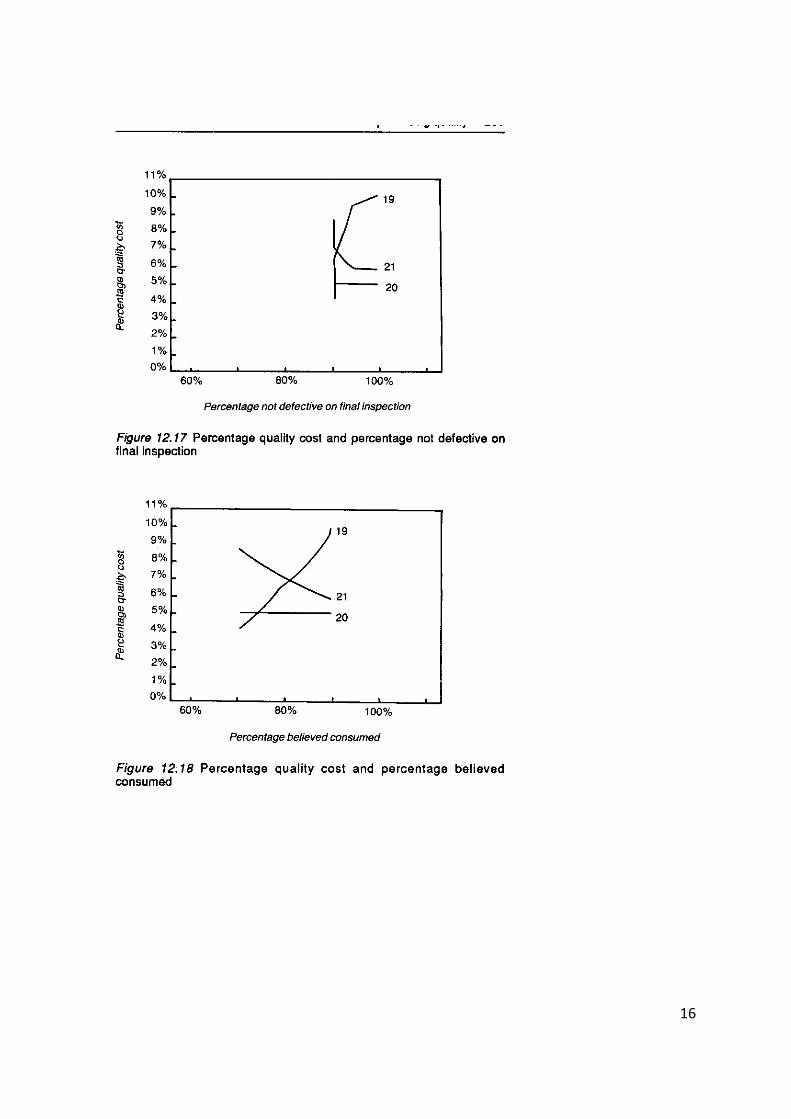
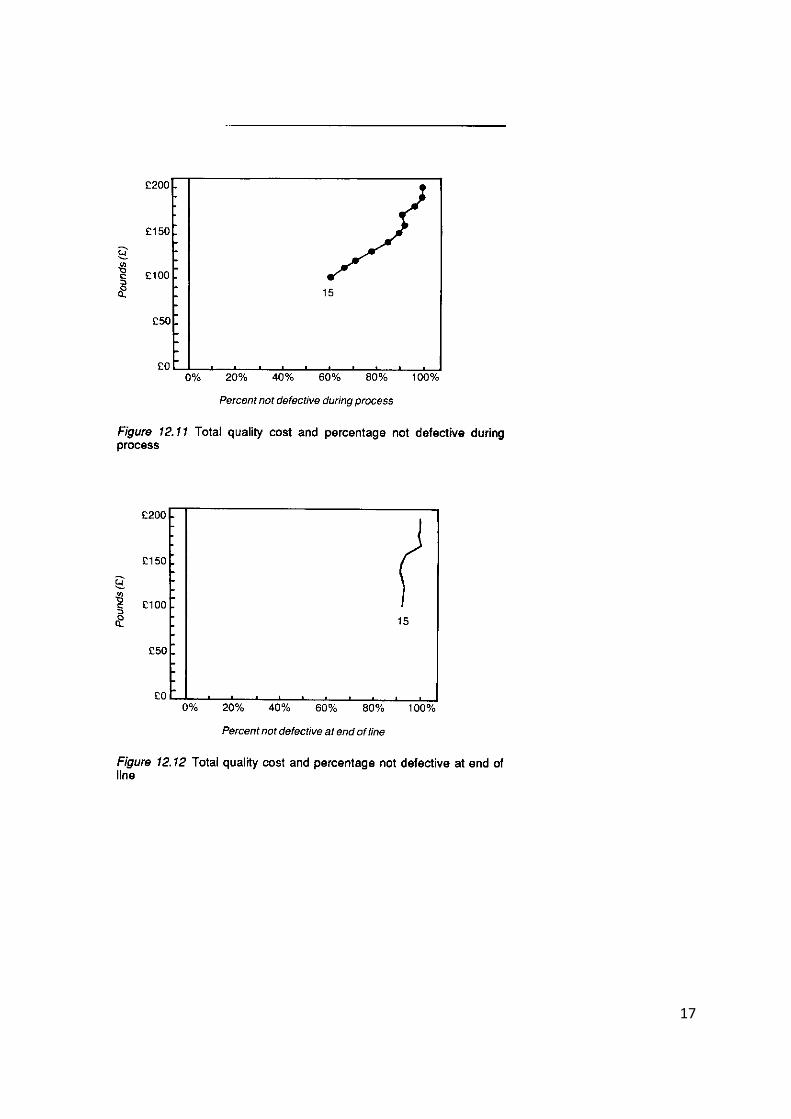
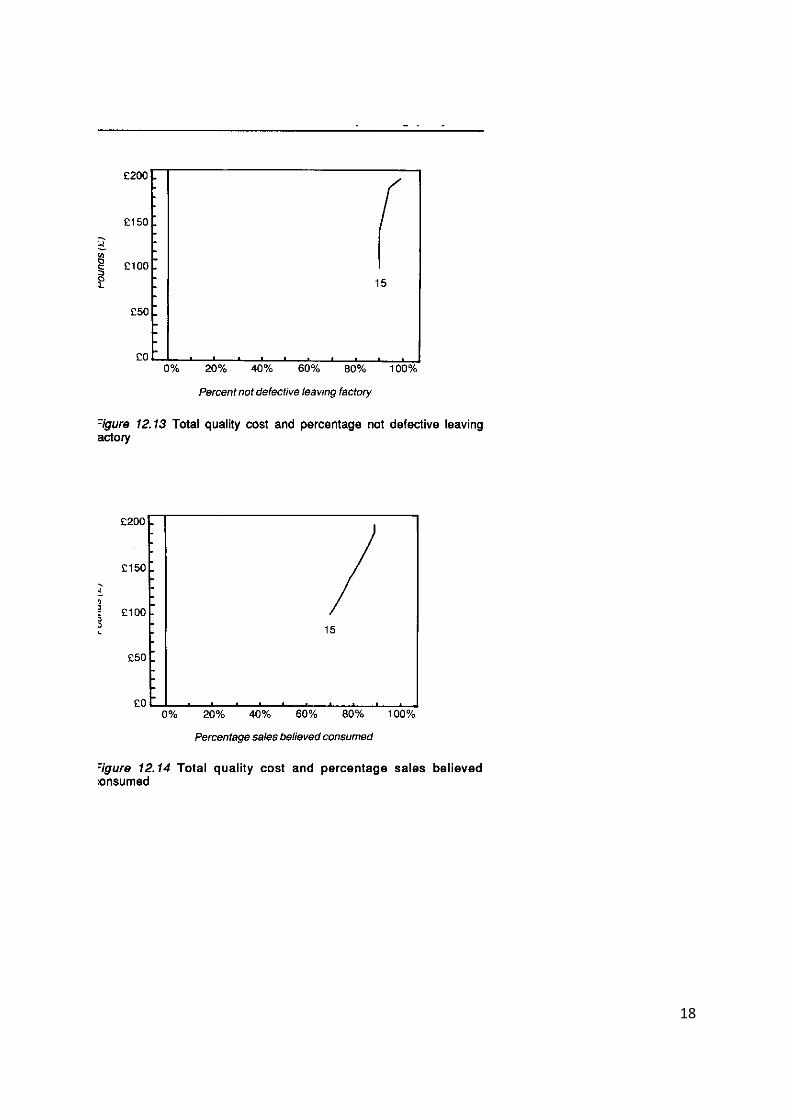
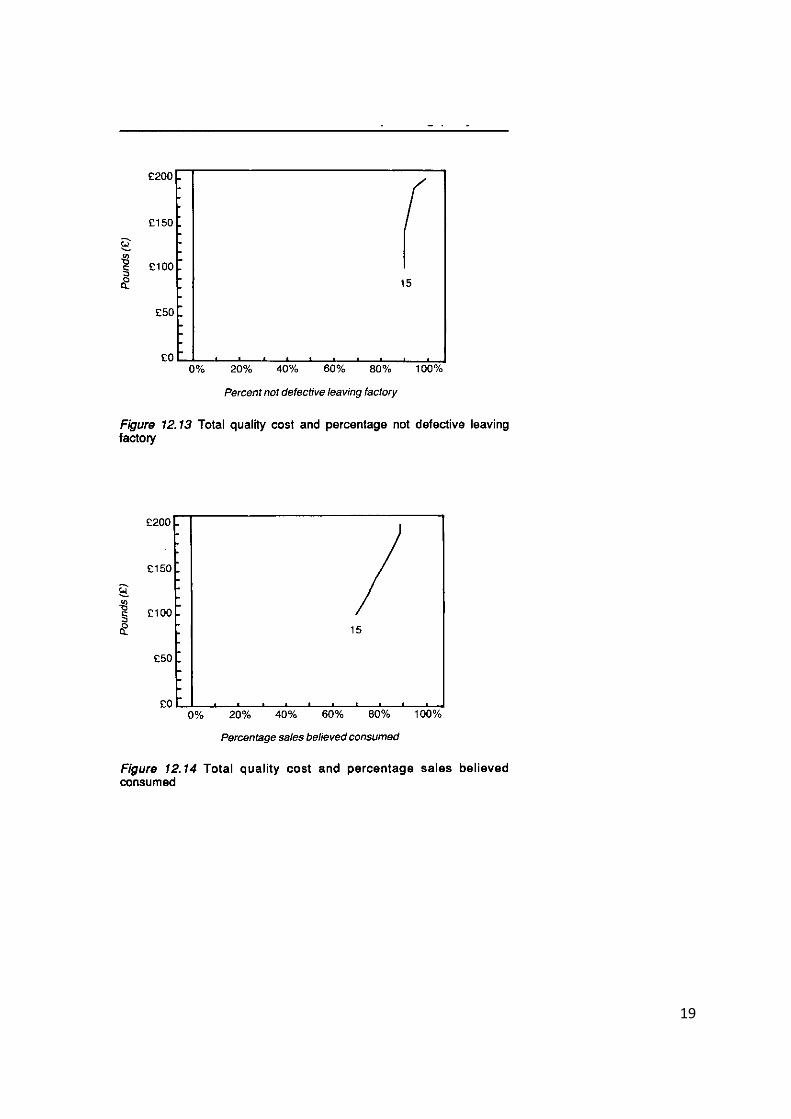
In Figures 12.3 to 12.18, some 48 curves will be plotted, all showing the same cost to an
imaginary firm (Table 12.1), but defined according to the different variables used in the
literature (the numbers attached to the curves refer to the corresponding row in Table 12.1).
The curves are completely different in shape2. It follows that the arguments in the literature
about typical shapes for the curves are pointless: everybody is plotting different variables, so
of course different curves can be expected. It will be argued that this confusion implies a
lack of a theoretical basis for the costs of quality. This paper will also show that there is
1 See BS 4891 for definitions, Plunkett and Dale ( 1988) for a review and Fox (1989) for
some criticisms. I am indebted to Plunkett and Dale for assembling the many types of
diagram used and presenting them in a way which makes comparison easy, and I use their
paper as a source for many of the references cited. They are not however responsible for the
analysis and criticism that follows. 2 No attempt will be made here to quantify data from real firms or to find industry averages or
typical curves: this would be counter-productive, given the lack of any theoretical basis.
Garvins search of the literature concluded The data on quality costs . . . is largely
anecdotal, often accounts by companies wishing to publicize successful quality programs
(1988 p82). Interestingly, he also found that The concept of quality costs is not widespread
in Japan (1988 p277).
The Economics of Quality Peter Bowbrick
© Peter Bowbrick, Moral right asserted
2
often a major misinterpretation of the graphs, attempting to draw conclusions that the graphs
do not permit. Finally, it will be asked whether the costs of quality approach is asking the right questions.
THE COST OF QUALITYThe costs of quality is an approach which asks a question that economists seldom ask, but
someone employing a quality assurance engineer may: How much should I spend on quality
assurance and control? The specifications of the product are taken as given. It will be shown
at the end of this chapter that the questions that would be asked by an economist, under 'The
Economics of Producing Quality' are very different.
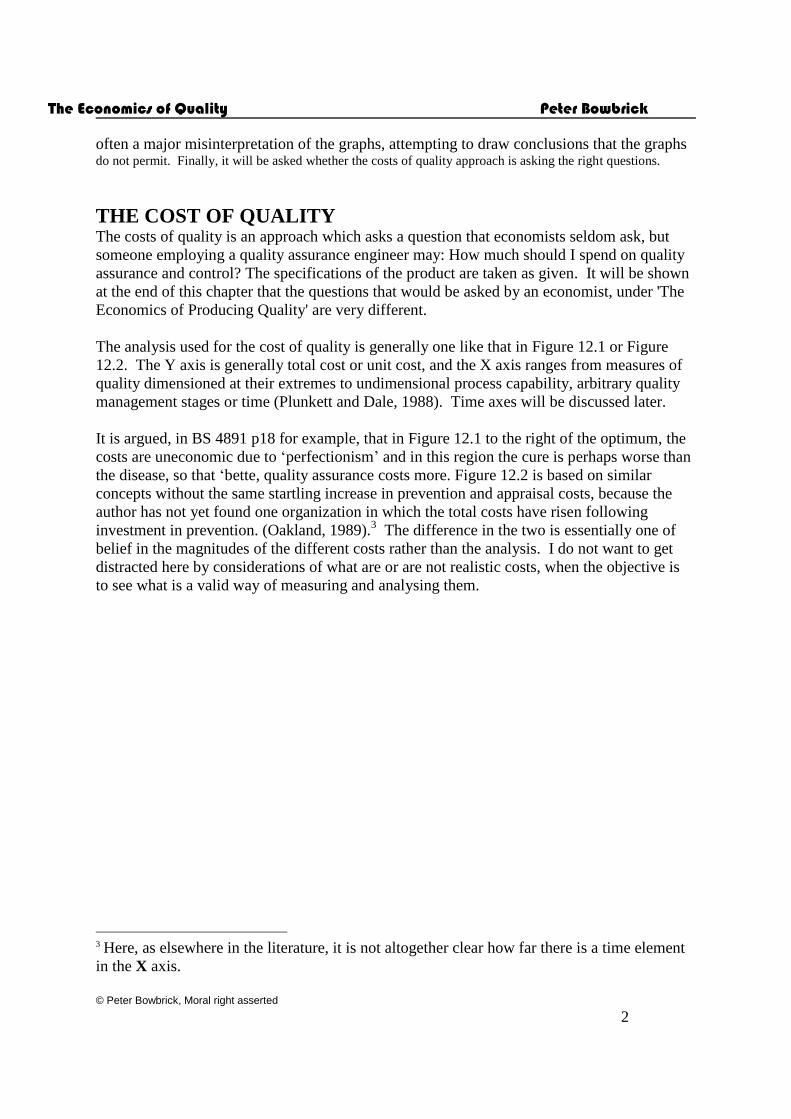
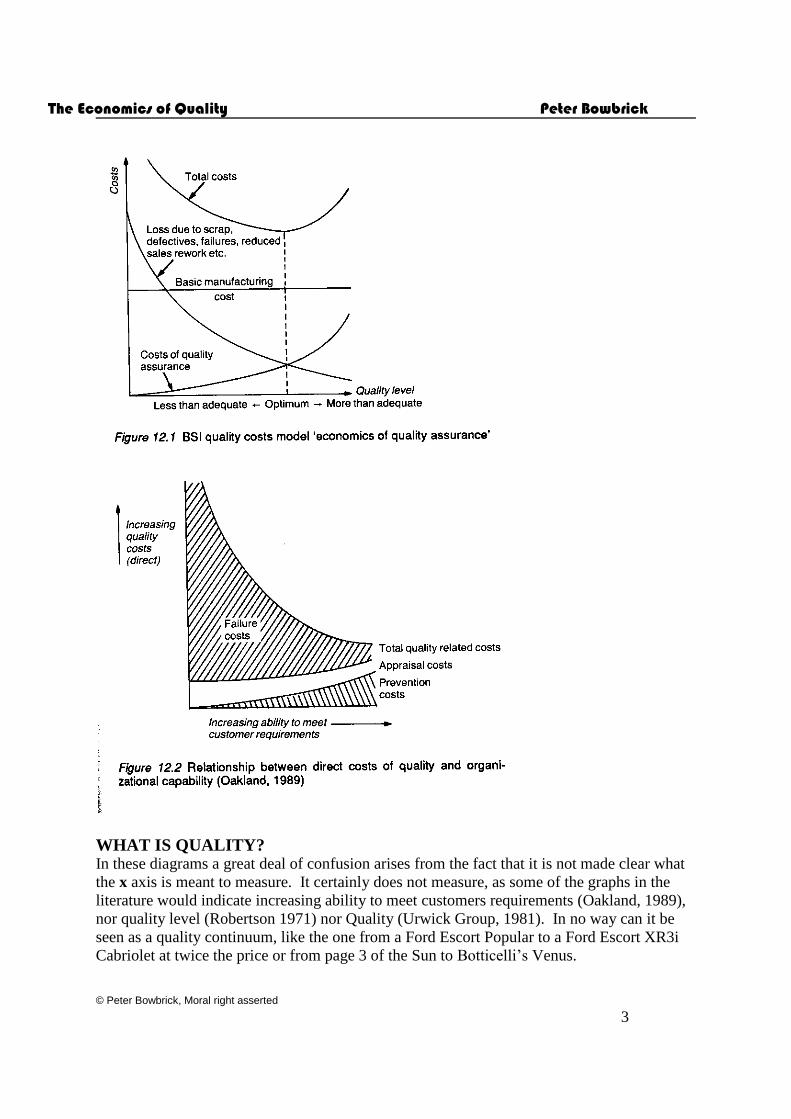
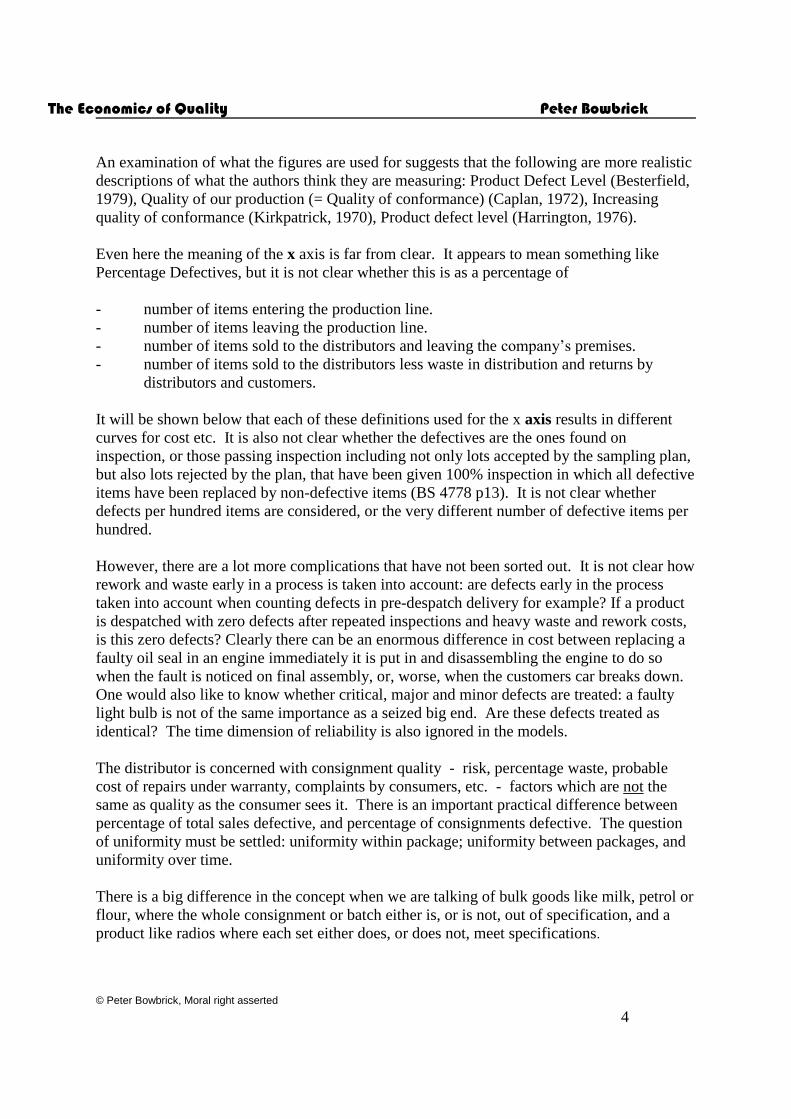
The analysis used for the cost of quality is generally one like that in Figure 12.1 or Figure
12.2. The Y axis is generally total cost or unit cost, and the X axis ranges from measures of
quality dimensioned at their extremes to undimensional process capability, arbitrary quality
management stages or time (Plunkett and Dale, 1988). Time axes will be discussed later.
It is argued, in BS 4891 p18 for example, that in Figure 12.1 to the right of the optimum, the
costs are uneconomic due to ‘perfectionism’ and in this region the cure is perhaps worse than
the disease, so that ‘bette, quality assurance costs more. Figure 12.2 is based on similar
concepts without the same startling increase in prevention and appraisal costs, because the
author has not yet found one organization in which the total costs have risen following
investment in prevention. (Oakland, 1989).3 The difference in the two is essentially one of
belief in the magnitudes of the different costs rather than the analysis. I do not want to get
distracted here by considerations of what are or are not realistic costs, when the objective is
to see what is a valid way of measuring and analysing them.
3 Here, as elsewhere in the literature, it is not altogether clear how far there is a time element
in the X axis.
The Economics of Quality Peter Bowbrick
© Peter Bowbrick, Moral right asserted
3
WHAT IS QUALITY? In these diagrams a great deal of confusion arises from the fact that it is not made clear what
the x axis is meant to measure. It certainly does not measure, as some of the graphs in the
literature would indicate increasing ability to meet customers requirements (Oakland, 1989),
nor quality level (Robertson 1971) nor Quality (Urwick Group, 1981). In no way can it be
seen as a quality continuum, like the one from a Ford Escort Popular to a Ford Escort XR3i
Cabriolet at twice the price or from page 3 of the Sun to Botticelli’s Venus.
The Economics of Quality Peter Bowbrick
© Peter Bowbrick, Moral right asserted
4
An examination of what the figures are used for suggests that the following are more realistic
descriptions of what the authors think they are measuring: Product Defect Level (Besterfield,
1979), Quality of our production (= Quality of conformance) (Caplan, 1972), Increasing
quality of conformance (Kirkpatrick, 1970), Product defect level (Harrington, 1976).
Even here the meaning of the x axis is far from clear. It appears to mean something like
Percentage Defectives, but it is not clear whether this is as a percentage of
- number of items entering the production line.
- number of items leaving the production line.
- number of items sold to the distributors and leaving the company’s premises.
- number of items sold to the distributors less waste in distribution and returns by
distributors and customers.
It will be shown below that each of these definitions used for the x axis results in different
curves for cost etc. It is also not clear whether the defectives are the ones found on
inspection, or those passing inspection including not only lots accepted by the sampling plan,
but also lots rejected by the plan, that have been given 100% inspection in which all defective
items have been replaced by non-defective items (BS 4778 p13). It is not clear whether
defects per hundred items are considered, or the very different number of defective items per
hundred.
However, there are a lot more complications that have not been sorted out. It is not clear how
rework and waste early in a process is taken into account: are defects early in the process
taken into account when counting defects in pre-despatch delivery for example? If a product
is despatched with zero defects after repeated inspections and heavy waste and rework costs,
is this zero defects? Clearly there can be an enormous difference in cost between replacing a
faulty oil seal in an engine immediately it is put in and disassembling the engine to do so
when the fault is noticed on final assembly, or, worse, when the customers car breaks down.
One would also like to know whether critical, major and minor defects are treated: a faulty
light bulb is not of the same importance as a seized big end. Are these defects treated as
identical? The time dimension of reliability is also ignored in the models.
The distributor is concerned with consignment quality - risk, percentage waste, probable
cost of repairs under warranty, complaints by consumers, etc. - factors which are not the
same as quality as the consumer sees it. There is an important practical difference between
percentage of total sales defective, and percentage of consignments defective. The question
of uniformity must be settled: uniformity within package; uniformity between packages, and
uniformity over time.
There is a big difference in the concept when we are talking of bulk goods like milk, petrol or
flour, where the whole consignment or batch either is, or is not, out of specification, and a
product like radios where each set either does, or does not, meet specifications.
The Economics of Quality Peter Bowbrick
© Peter Bowbrick, Moral right asserted
5
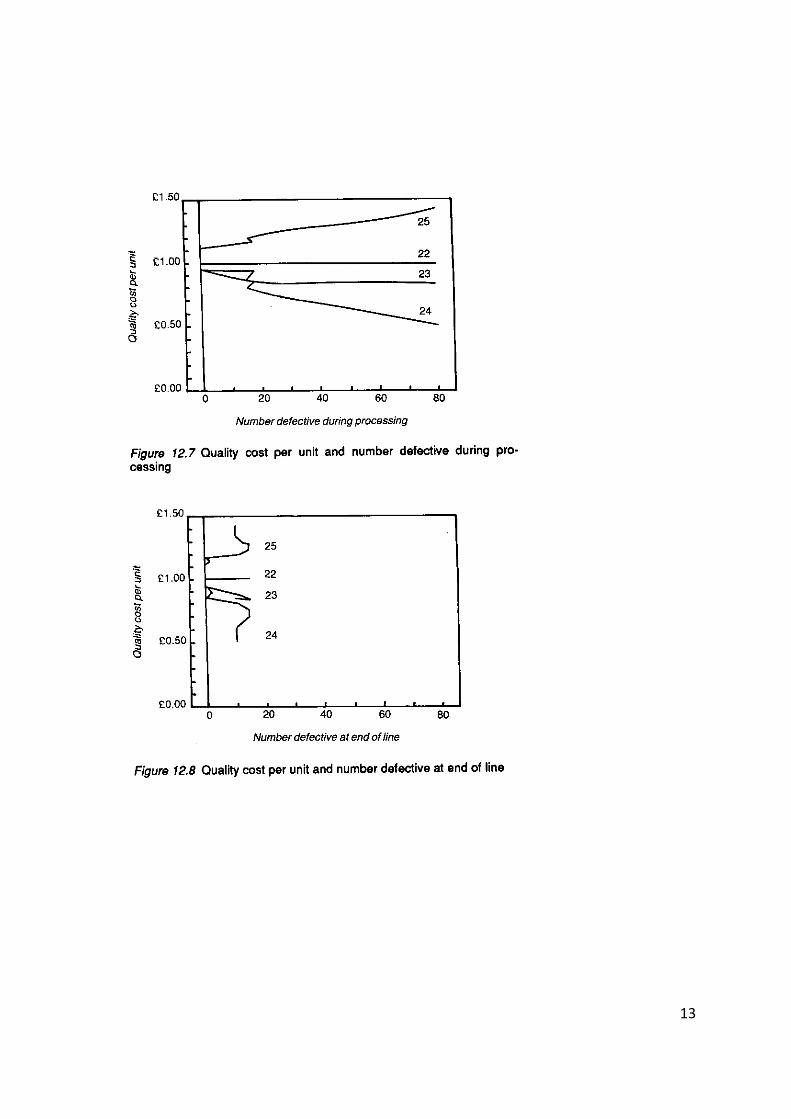
PRODUCTION CAPACITYThe capacity of a production line frequently varies with the level of defects. If, say, 20% of
the items reaching the end of the production line are defective and need extensive reworking,
the line may be producing at only half capacity, with only half as many items leaving the line
as when there are no defectives. Here, 20% defectives is the same number of defects as 10%
of theoretical capacity. As the percentage defectives falls, so does the total output increase.
This means that there will be very substantial differences in the shape of curves, depending
on whether they are plotted against number of defects or percentage of defects. Accordingly,
great caution is needed in distinguishing between costs of rework and costs of low capacity.
To further confuse the issue, economists will point out that doubling the capacity does not
mean doubling the output: it may be necessary to reduce prices to sell any increased
production, and it may not be possible to sell twice as much at any price. This, again,
changes the definition of the x axis. The change in capacity alters the cost curve at all levels
of output, so it may pay to increase output, even bringing in another shift or increasing
overtime.
THE Y AXIS There are many different labels to be found on the y axis in the literature. The following are
sometimes used when the x axis is defects:
Cost (Caplan, 1972; Robertson, 1971; Kirkpatrick, 1970; Harrington, 1976; Urwick
Group, 1971; Thoday, 1976; BS 4891, 1972)
Operating quality costs (Besterfield, 1979)
Quality costs (Direct) (Oakland, 1989)
Cost per good unit of product (Juran and Gryna, 1988)
The following are sometimes used where the x axis is time or the degree of implementation
of a quality management programme.4
Percent of cost input (Campanella and Corcoran, 1983)
Quality as percent of cost of turnover (Veen, 1974; Hagan, 1986)
Quality as percent of sales (Kohl, 1976 and two companies cited by Plunkett and
Dale, 1988)
Percent of manufacturing cost (Huckett, 1985)
4 BS 6143, for example, has the X axis labelled Quality awareness and improvement, but
from the text it is a time axis.
The Economics of Quality Peter Bowbrick
© Peter Bowbrick, Moral right asserted
6
Quality assurance cost for quality acceptable to consumer (Lockyer, 1983)
Quality related costs (BS 6143)
Plunkett and Dale (1988) say that all these are absolute cost or a simple variant of it.
However, it can be seen from Table 12.1 that these are very different concepts, and from
Figures 12.3 to 12.18 that they result in very different shapes of curve.
THE COSTS It is usual to plot costs, unit costs, etc. against something like level of defects or conformity.
The quality related cost is taken to be the cost in ensuring and assuring quality as well as loss
incurred when quality is not achieved (BS 6143). These quality related costs are sub-divided
into prevention costs, appraisal costs, internal failure costs (e.g. waste and rework costs) and
external failure costs, and a figure looking something like Figure 12.1 or Figure 12.2 is
produced. This seems to be generally interpreted in the literature as implying that as one
increases prevention costs for example, so internal failure costs are reduced, and there is
some discussion in the literature on how realistic the different curves are in indicating the
payoff from prevention and appraisal expenditures (see Fox, 1989; Oakland, 1989; Plunkett
and Dale, 1988). However there are several problems that arise:
- It is not possible to present four interdependent variables on a two-dimensional graph.
Both internal and external failure costs are changed by prevention costs, so it is not
possible to read off one level of prevention costs on the graph, and derive from it the
level of external failure costs that can be expected from it.
- It cannot be assumed that one level of appraisal costs will result in a single level of
internal and external failure costs. Checking of incoming raw materials has a totally different
impact to checking the finished product leaving the firm. A different range of payoffs can be
expected from changing the effectiveness of each quality assurance or control process.
Lumping together totally different processes, with totally different costs, totally different
effects on the product leaving the factory and totally different payoffs causes more confusion
than it cures.
- It is far from clear why the appraisal and prevention costs should be separated, except
to emphasize that the quality assurance professional using the figures belongs to one or
another school of quality assurance. The economic importance is not obvious. The economic
costs of internal and external failure are by no means simple to calculate.
7
- An economist would want to take into account the effect on sales and prices of a
change in quality, allowing for changes made by competitors: I know of no attempt to allow
for this in the paradigm. BS 6143 talks only of loss of profit due to cessation of existing
markets as a consequence of poor quality - a far cry from the economists reckoning. In the
economics of grading it is normal to ignore the physical costs, as being tiny in relation to the
price effects and waste (Chapter 6).
- One normally talks of increased revenues arising from increased costs. While it is
possible to redefine increased revenues as reduced lost potential revenue, or the cost of
imperfect operations, or quality cost, it is not in line with the way economists or management
usually think, and it does lead to confusion, as the literature shows. The BS 6143 definition
includes only some of the lost potential revenue, so it is difficult to see how confusion could
be avoided.
The only way that one can make any sense out of diagrams like Figure 12.1 and Figure 12.2,
is to take it that the granddaddy of these diagrams did not refer to total costs, but to minimum
total costs, and that it includes lost revenue as a cost. The proportion of the different costs
shown then means the proportion that exists at the least cost level of producing an output with
a given defect rate. It does not in any way imply that changing the level of one cost will have
any given effect on another cost. However, while it is easy to conceive of such a curve, it is
extremely difficult to draw one in practice. It would be necessary to calculate at each process
level a quality cost curve, and to do sequential costings through different possible processes,
comparing high input inspection, with high output inspection, high prevention with high
appraisal, early stage appraisal and inspection with later stage appraisal and inspection. I
have not come across any such economic analysis in the literature.
THE TIME AXIS One would normally be critical of any economic model which did not take into account time,
and at least distinguish between short run, medium run and long run, if not analysing the
dynamic effects. The costs of quality approach, however has handled time not by adding an
extra time axis to a static economic analysis, but by removing the static economic analysis
entirely, and replacing it with a time axis. What is left is a description of how the quality
assurance expert would like to see costs moving over a period of time (with complications
like inflation, changed input costs, changed market conditions, changed specifications and
changed technologies tacitly ignored). It is of no analytical value.
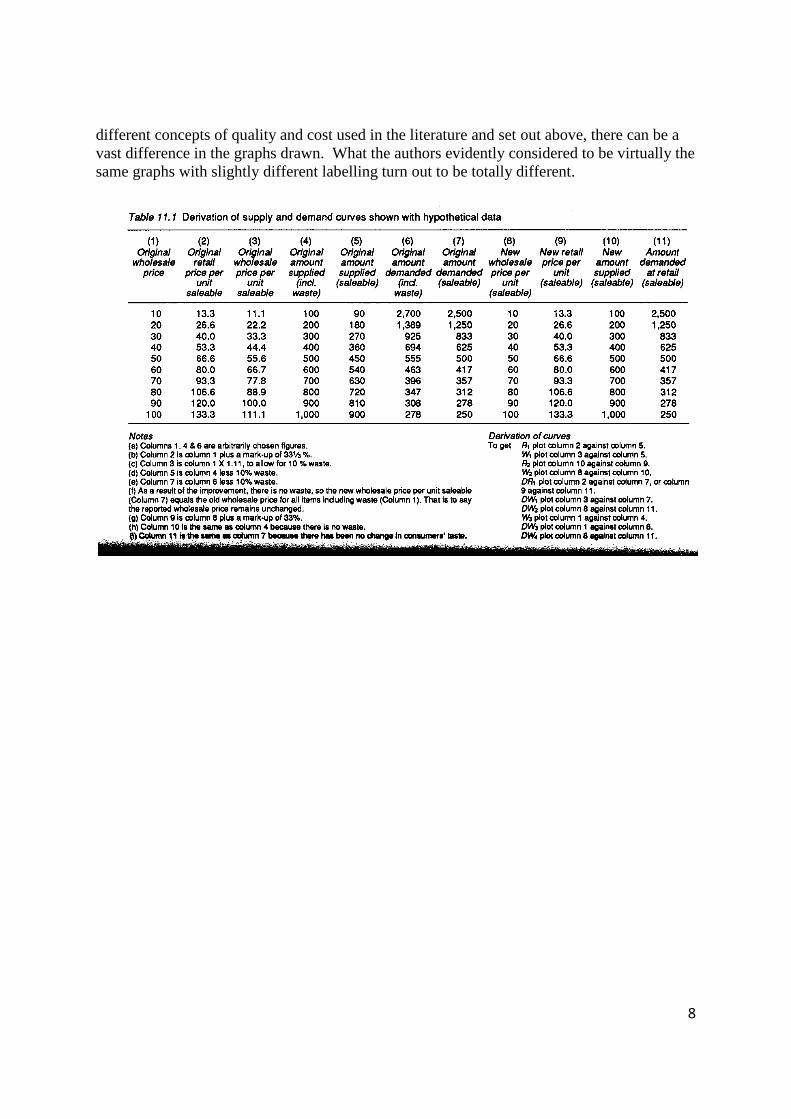
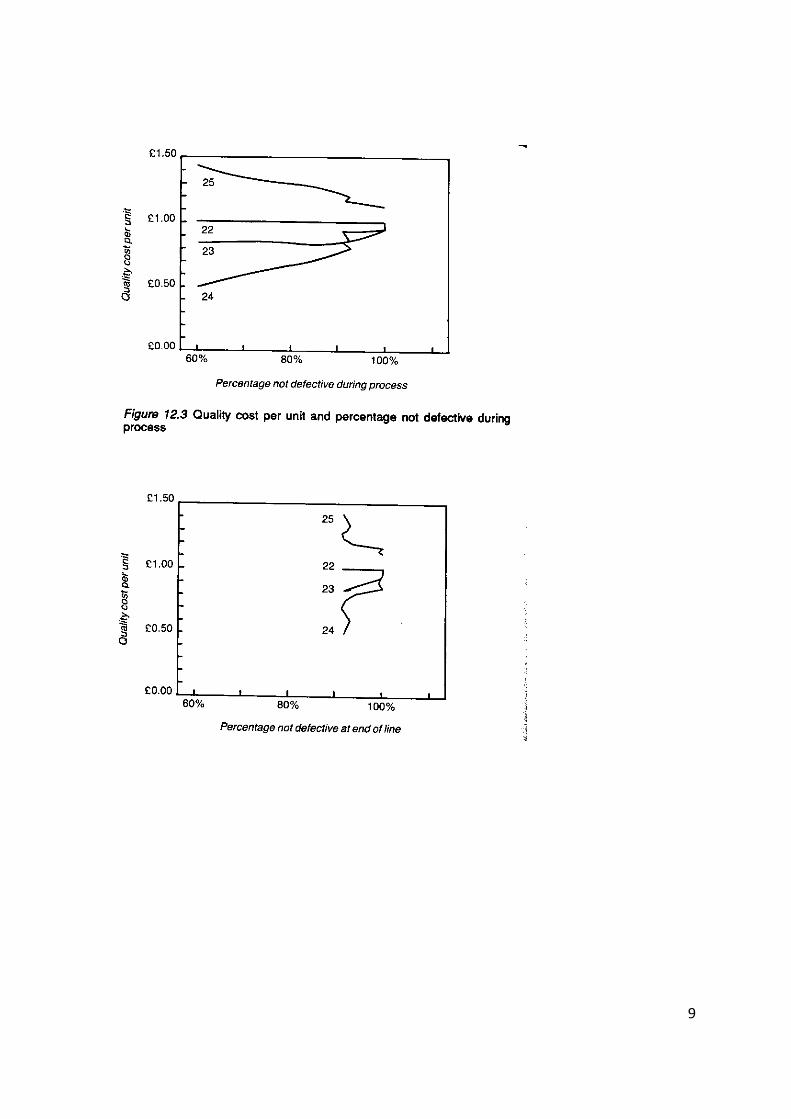
PLOTTING THE CURVES In Table 12.1 I have set out some quality costs for an imaginary firm. In Figures 12.3 to
12.18, the costs have been plotted against different axes. The numbers attached to the curves
correspond to the rows in Table 12.1, with each row being a different way of looking at the
same cost. It is not suggested that they are typical for two reasons. First, in the absence of an
economic theory on the production of quality, there is no incentive to collect the data required
for economic analysis. Second, there are so many firms using so many processes that it is
unlikely that figures for one firm will have any general application. However, the figures are
not presented because they are typical, but because they can be used to show that using the
8
different concepts of quality and cost used in the literature and set out above, there can be a
vast difference in the graphs drawn. What the authors evidently considered to be virtually the
same graphs with slightly different labelling turn out to be totally different.
9
10
11
12
13
14
15
16
17
18
19
20
THE ECONOMICS OF PRODUCING QUALITY In twenty years of researching the economics of quality, I have come across virtually nothing
on the economics of producing quality. Plunkett and Dale (1986) report that in two
comprehensive literature searches it was noted that there is virtually no information available
on the costs or economics of common quality-related engineering practices.
The Costs of Quality approach asks only How much is deviation from perfection costing the
firm, (ignoring certain marketing costs?: it does not ask questions that an economist would
ask, such as:
CHANGING THE PRODUCT - How much will it cost to increase the level of a single characteristic?
- How much will it cost to increase the level of several characteristics at one time?
- How much would it cost to produce a different characteristics mix?
- What is the trade-off in production cost between producing the same product with
lower tolerances, and producing to higher specifications with the same tolerances?
- Would it be possible to produce an entirely different product that met the same needs
more cheaply?
- What are the cost curves for the different production possibilities? How do costs vary
with quantity produced?
THE MARKET - How far are the present specifications optimal? Would consumers prefer a different
characteristics mix?
- Would they pay more for a different characteristics mix? Would they buy more?
- Would they pay more for the same product supplied to closer tolerances?
- To the consumers what is the trade-off between the same product with tighter
tolerances and a product with higher specifications and the same tolerances?
- How does consumer demand differ from distributor demand, e.g. waste in the
distribution system, repair under guarantee etc are costs to the distributor, not the
consumer.
- What is the cost of changing consumer perceptions by advertising?
- What is the cost of changing consumer search?
- What is the price effect of changes?
21
- What is the demand curve facing the manufacturer for the different qualities that
might be produced?
PRODUCTION - What is the optimum production level, given the cost curves for the different
quality options, and their demand curves?
- Would it be possible to use different processes to produce the same product?
- Would it be possible to redesign the product to make production cheaper and less
defect prone?
CONCLUSION It has been shown that there are major conceptual errors in the cost of quality approach as
practiced, and that there are a large number of unresolved questions. There has been very
little work done on the economics of producing quality, a much larger research programme.
It is concluded that a major economic input into the production end of the economics of
quality is urgently needed.
SELECTED PUBLICATIONS BY PETER BOWBRICK
These are available on www.Bowbrick.eu, www.academia.edu, www.researchgate.net or
by e-mailing [email protected]
On Quality, Grades and Brands Bowbrick, P., The Economics of Quality, Grades and Brands, Routledge Revivals, 2014.
http://www.sponpress.com/books/details/9781138793224/
Peter Bowbrick, ‘From Economic Research to Policy in 32 Years’, Eurochoices (2012) EuroChoices 11(3) p 44.
Bowbrick, P., “The case against compulsory minimum standards”, Journal of Agricultural Economics. 28: 113-
117, May. 1977. Bowbrick, P., “The Economics of Grades”, Oxford Agrarian Studies. 11, 65-92. 1982.
Bowbrick, P., An Economic Appraisal of the EEC Fruit and Vegetable Grading System. Dublin. 1981. DOI: 10.13140/2.1.3424.9762 Bowbrick, P., A Refutation of Lancaster’s theory of Consumer Demand, PhD Thesis, Henley Management
College, 1994.
Bowbrick, P., “Quality theories in agricultural economics”, Presented at EAAE Seminar Agricultural
Marketing and Consumer Behaviour, 1996.
Bowbrick, P., “Limitations of non-behavioural approaches to the economics of quality” Conference of
International Association for Research on Economic Psychology and the Society for the Advancement of
22
Behavioral Economics, Rotterdam, 1994.
Bowbrick, P., “The conceptual basis of Quality in marketing”
Bowbrick, P., “A critique of economic man theories of quality”
Bowbrick, P., The Economics of Quality, Grades and Brands, Routledge, London 1992.
http://www.bowbrick.org.uk/Publications.htm
Bowbrick, P., 1992. A refutation of (most) hedonic models, Oxford: s.n.
Bowbrick, P., 1992. A refutation of The Cost of Quality, Oxford: s.n.
Bowbrick, P., “Justifications for compulsory minimum standards” British Food Journal, 92 (2) 23-30, 1990.
Bowbrick, P., “Stars and Superstars”, American Economic Review. June. p459 vol 73 1983.
Bowbrick, P., “Pseudo-research in marketing - the case of the price:perceived quality relationship”, European
Journal of Marketing. 14(8) 466-70. 1980
Bowbrick, P., “Compulsory grading and the consumer”, Acta Horticulturae. 55. 1976.
Bowbrick, P., “A perverse price-quality relationship”, Irish Journal of Agricultural Economics and Rural
Sociology. 6 93-94. 1976.
Bowbrick, P., “Evaluating a grading system”, Irish Journal of Agricultural Economics and Rural Sociology. 7
117-126. 1979.
Bowbrick, P., “A new approach to the economics of grading”, Paper to Irish Agricultural Economics Society.
1974.
Griffiths, P., Codes of Practice, Ethics and the Law – the Case of Fairtrade Coffee. pending
Griffiths, P., 2015 Marketing by Controlling Social Discourse: the Fairtrade Case (In Press)
Griffiths, P., 2014. Fairtrade in Schools: teaching ethics or unlawful marketing to the defenceless?. Ethics and Education, DOI:, 9(3 DOI 10.1080/17449642.2014.978122), pp. 369-384.
Griffiths, P., 2011. Ethical Objections to Fairtrade. Journal of Business Ethics, pp. 357-373. http://www.griffithsspeaker.com/Fairtrade/why_fair_trade_isn.htm
Griffiths, P., 2013. Ethical Objections to Fairtrade. In: New Directions in Critical Marketing Studies. s.l.:SAGE.
Griffiths, P., 2013. Fairtrade: comment on Tedeschi and Carlson. Journal of International Development, p. DOI: 10.1002/jid.2965. http://www.griffithsspeaker.com/Fairtrade/why_fair_trade_isn.htm
Griffiths, P., 2010. Lack of rigour in defending Fairtrade: a reply to Alastair Smith. Economic Affairs, pp. 45-49. http://www.griffithsspeaker.com/Fairtrade/why_fair_trade_isn.htm
Griffiths, P., 2010. Rejoinder: False Statements, Misrepresentations and distortion in defending Fairtrade. http://www.griffithsspeaker.com/Fairtrade/Rejoinder%2026%20Jun%202010%20full.pdf
Griffiths, P., 2011. Rejoinder: False Statements, Misrepresentation and Distortion in Defending Fairtrade. Economic Affairs, pp. 103-4.
Griffiths, P., 2010. Refutation: Does Fair Trade deliver on its Core Value Proposition?. Available at: http://www.griffithsspeaker.com/Fairtrade/Arnould%20et%20al%20web.doc
ON MARKET MARGINS AND MARKETS Bowbrick, P., “Marketing Board inefficiency and farmers’ incomes”, Conference on African Marketing
Boards. African Studies Centre, Leiden, Netherlands. 1983.
Bowbrick, P. & Feeney, P., 1981. “The impact of cost-saving innovations with traditional margins”, Journal of
Agricultural Economics. May. 1981.
Bowbrick, P., “Price stabilization funds”, Agricultural Economics Society of Tanzania Conference. 1981.
Bowbrick, P. & Feeney, P., 1981. The impact of cost-saving innovations with traditional margins. Journal of
Agricultural Economics..
23
Bowbrick, P. & Twohig, D., Pick-your-own fruit marketing. Dublin, An Foras Taluntais. 1977.
Bowbrick, P., “Distributive margins - a rejoinder”, Oxford Agrarian Studies. 6 168-170. 1977.
Bowbrick, P., “Price control and market margins for fruit and vegetables”, Acta Horticulturae. 55. 1976.
Bowbrick, P., “Determining distributive margins”, Oxford Agrarian Studies. 5 124-129. 1976.
Bowbrick, P., “Market-margin investigations and price control of fruit and vegetables”, Irish Journal of
Agricultural Economics and Rural Sociology. 6 9-20. 1976. Bowbrick, P., “Commission sales or firm-price
sales - a conflict of interest”, Irish Journal of Agricultural Economics and Rural Sociology. 5 229-238. 1975.
Bowbrick, P., “Some limitations of market-margin analysis”, Irish Journal of Agricultural Economics and
Rural Sociology. 4(2) 23-28. 1974.
Bowbrick, P., “Retail mark-ups and distributive margins - a critical analysis of Professor Allen’s theory”, Irish
Journal of Agricultural Economics and Rural Sociology. 4(2) 1-23. 1973.
Bowbrick, P., “Price stabilization in a two-sector industry”, Acta Horticulturae. 40. 1972.
MISUSES OF PRICE AND OTHER STATISTICS See also discussions of the unreliability of statistics, doing economics when the data is not available and doing economics when the data are
wrong in The Art and Practice of the Economist. Major problems with market price data are also shown in the papers on market margins.
Bowbrick, P., 2015. Interpreting Statistics in an English Team Based Evaluation. In: P. Smeyers, D. Bridges, N.
Burbules & M. Griffiths, eds. International Handbook of Interpretation in Educational Research. s.l.:Springer,
pp. 1347-1381.http://link.springer.com/chapter/10.1007%2F978-94-017-9282-0_66
Bowbrick, P., “Are price reporting systems of any use?”, British Food Journal. 90(2) 65-69 March/April. 1988.
Bowbrick, P., 1985. On the total irrelevance of cost-of-production figures for subsistence agriculture.
Bowbrick, P., “Errors in horticultural cost-of-production surveys”, Irish Journal of Agricultural Economics and
Rural Sociology. 6 21-29. 1976.
Bowbrick, P., “A note on the prices of food sold to wage earners in Zambia”, Monthly Economic Bulletin.
October and November. 1966.
Bowbrick, P., “A note on vegetable statistics”, Monthly Economic Bulletin. April. 1966.
THE ART AND PRACTICE OF THE ECONOMIST How economists work once they graduate – or how they should if they want to make an impact. Griffiths, P., 2003. The Economist's Tale: a consultant encounters hunger and the World Bank.. London and
New York: Zed Books.
Bowbrick, Peter, The Art and Practice of the Economist.
Morwenna Griffiths, Tony Cotton, Peter Bowbrick, “Educational researchers doing research on educational
policy: Heroes, puppets, partners, or…?” Paper presented to the British Educational Research Association
Annual Conference, Warwick 2006.
Mal Leicester, Roger Twelvetrees, Peter Bowbrick, “Philosophical Perspectives on Lifelong Learning – insights
from education, engineering and economics,” in David Aspin (Ed.) Philosophical Perspectives on Lifelong
Learning (Kluwer Press)
Griffiths, P., 2008. Working abroad with a degree of scepticism. Sunday Times, 8 June. http://www.griffithsspeaker.com/Other%20publications/Short%20articles.htm Bowbrick, P., “Maximizing consultancy income” Journal of Management Consulting. Spring 1995.
Bowbrick, P., The use of Counseling Skills in Consultancy, MA dissertation, Nottingham University, 1993
Bowbrick, P., n.d. Thesis Fodder – a new role for the Third World. Times Higher Education Supplement.
Bowbrick, P., 1990. Profitable Consulting: Collected Papers. Nottingham: s.n.
Bowbrick, P., Effective Communication for Professionals and Executives. London/ Dordrecht /Boston, Graham
and Trotman. ISBN 1-85333-081-7. 1988.
Bowbrick, P., Practical Economics for the Real Economist. London/Dordrecht/Boston, Graham and Trotman.
ISBN 1-85333-076-0. 1988.
Bowbrick, P., “The role of the economist in applied biological research”, Agricultural Administration. 3 11-15.
1976.
24
Bowbrick, P., “The use of voice recorders in agricultural economics research”, Journal of Agricultural
Economics. 26(2) 261-263. 1975.
ON FAMINES Griffiths, P., 2003. The Economist's Tale: a consultant encounters hunger and the World Bank.. London and
New York: Zed Books.
Bowbrick, P., “A refutation of Sen’s theory of famine”, Food Policy. 11(2) 105-124. 1986.
Bowbrick, P., “Rejoinder: an untenable hypothesis on the causes of famine”, Food Policy. 12(1) 5-9, February.
1987. See also George Allen “Famines: the Bowbrick-Sen dispute and some related issues,” Food Policy,
11(3) 259-263, 1986, Amartya Sen “Reply: famine and Mr Bowbrick”, Food Policy 12(1) 10-14, and Amartya
Sen “The causes of famine: a reply”, Food Policy 11(2) 125-132, 1986.
Bowbrick, P., A refutation of Professor Sen’s theory of famines. Institute of Agricultural Economics, Oxford. 1986 updated 2009. Bowbrick, P., “How Professor Sen’s theory can cause famines”, Agricultural Economics Society Conference. March. 1985. Bowbrick, P., “Why Professor Sen’s theory is wrong”, Development Studies Association Conference. September. 1985.
Bowbrick, P., “Five Famine Fallacies” in Julian Morris and Roger Bate (eds.) Fearing Food: risk, health and
environment, Butterworth Heineman, Oxford. ISBN 0-7506-4222-x, 1999
Bowbrick, P., “Are famines caused deliberately?: the politics and micro-politics influencing decisions”
Development Studies Association Conference, Dublin 1995.
MISCELLANEOUS Peter Bowbrick and Morwenna Griffiths (Eds), Boys' Schooldays in Ruddington Remembered,, Nottingham
Trent University, 2007.
Peter Bowbrick and Morwenna Griffiths (eds), Girls’ Schooldays in Ruddington Remembered Nottingham Trent
University, 2007.

25