A Phylogenomic Approach to Vertebrate PhylogenySupports a Turtle-Archosaur Affinity and a PossibleParaphyletic LissamphibiaJonathan J. Fong1,2,3*, Jeremy M. Brown2,4, Matthew K. Fujita1,2,5,6, Bastien Boussau2,7
1Museum of Vertebrate Zoology, University of California, Berkeley, California, United States of America, 2Department of Integrative Biology, University of California,
Berkeley, California, United States of America, 3College of Natural Sciences, Seoul National University, Seoul, Republic of Korea, 4Department of Biological Sciences,
Louisiana State University, Baton Rouge, Louisiana, United States of America, 5Museum of Comparative Zoology & Department of Organismic and Evolutionary Biology,
Harvard University, Cambridge, Massachusetts, United States of America, 6Department of Biology, University of Texas-Arlington, Arlington, Texas, United States of
America, 7 Laboratorie de Biometrie et Biologie Evolutive, Universite de Lyon, Villeurbanne, France
Abstract
In resolving the vertebrate tree of life, two fundamental questions remain: 1) what is the phylogenetic position of turtleswithin amniotes, and 2) what are the relationships between the three major lissamphibian (extant amphibian) groups?These relationships have historically been difficult to resolve, with five different hypotheses proposed for turtle placement,and four proposed branching patterns within Lissamphibia. We compiled a large cDNA/EST dataset for vertebrates (75genes for 129 taxa) to address these outstanding questions. Gene-specific phylogenetic analyses revealed a great deal ofvariation in preferred topology, resulting in topologically ambiguous conclusions from the combined dataset. Due toconsistent preferences for the same divergent topologies across genes, we suspected systematic phylogenetic error asa cause of some variation. Accordingly, we developed and tested a novel statistical method that identifies sites that havea high probability of containing biased signal for a specific phylogenetic relationship. After removing putatively biased sites,support emerged for a sister relationship between turtles and either crocodilians or archosaurs, as well as for a caecilian-salamander sister relationship within Lissamphibia, with Lissamphibia potentially paraphyletic.
Citation: Fong JJ, Brown JM, Fujita MK, Boussau B (2012) A Phylogenomic Approach to Vertebrate Phylogeny Supports a Turtle-Archosaur Affinity and a PossibleParaphyletic Lissamphibia. PLoS ONE 7(11): e48990. doi:10.1371/journal.pone.0048990
Editor: Andreas Hejnol, Sars International Centre for Marine Molecular Biology, Norway
Received April 10, 2012; Accepted October 3, 2012; Published November 7, 2012
Copyright: � 2012 Fong et al. This is an open-access article distributed under the terms of the Creative Commons Attribution License, which permitsunrestricted use, distribution, and reproduction in any medium, provided the original author and source are credited.
Funding: Funding for this work came from the National Science Foundation (NSF) Doctoral Dissertation Improvement Grant (DEB-0909811 [JJF]), NSFPostdoctoral Fellowship in Biology (DBI-0905867 [JMB], DBI-0905714 [MKF]), Human Frontiers Science Program Postdoctoral Fellowship (BB), Centre National de laRecherche Scientifique (BB), and Museum of Vertebrate Zoology (JJF). The funders had no role in study design, data collection and analysis, decision to publish, orpreparation of the manuscript.
Competing Interests: The authors have declared that no competing interests exist.
* E-mail: [email protected]
Introduction
‘‘The Origin of Species,’’ and in particular its singular figure,
transformed our thinking of biological diversity from the ‘‘great
chain of being’’ to the ‘‘tree of life’’ [1]. Resolving the tree of life is
crucial to understand organismal evolution and adaptation, but
also has far-reaching benefits to diverse fields such as medicine,
conservation, and economics [2]. While vertebrates have been the
focus of intense phylogenetic research [3–5], two fundamental
questions in vertebrate systematics remain unanswered: 1) What is
the phylogenetic position of turtles within amniotes, and 2) what
are the relationships between the three major lissamphibian
(extant amphibian) groups–frogs, salamanders, and caecilians?
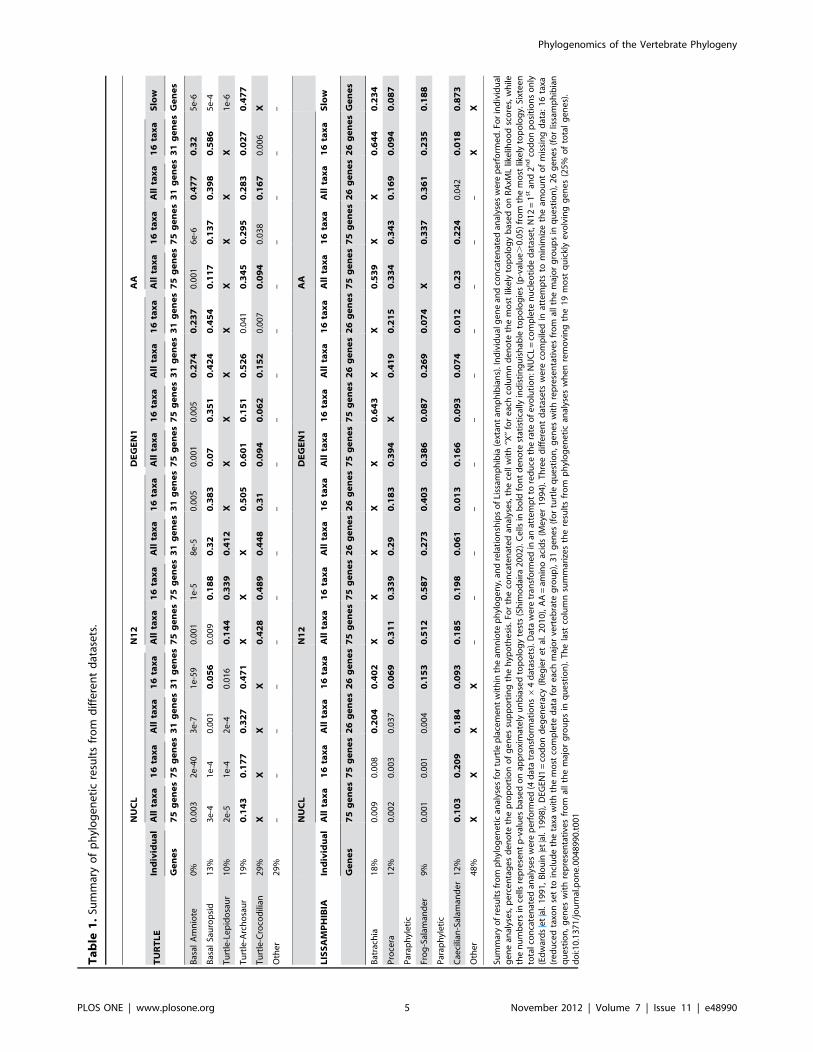
For more than 150 years, biologists have debated the
phylogenetic position of turtles, resulting in no fewer than five
different hypotheses (Figure 1A) [4]. Earlier studies used the
number of temporal skull openings for classification, with the
anapsid condition (no openings) found in turtles, the synapsid
condition (single opening) found in mammals, and the diapsid
condition (two openings) found in birds and non-turtle reptiles [6].
Morphological and molecular data have suggested four additional
hypotheses: turtles as basal sauropsids (reptiles and birds), a turtle-
lepidosaur (lizards, snakes, amphisbaenians, and tuatara) sister
relationship, a turtle-archosaur (birds and crocodilians) sister
relationship, and a turtle-crocodilian sister relationship (Figure 1A)
(see [4,7–9] for summary of references). Although recent studies
have found strong results supporting specific hypotheses, there is
no consensus as different datasets support different hypotheses [7–
9].
For amphibians, several morphological and physiological
characters, including pedicellate teeth and cutaneous respiration,
suggest frogs, salamanders, and caecilians share a common origin
[10,11]. However, the monophyly of Lissamphibia is still under
debate, as some paleontological studies have inferred a paraphy-
letic Lissamphibia [12,13]. There are four proposed branching
patterns within Lissamphibia (Figure 1B,C). Two hypotheses,
Procera and Batrachia, exhibit a monophyletic Lissamphibia, but
differ in the interrelationships among frogs, salamanders, and
caecilians. The Procera hypothesis proposes a salamander-caeci-
lian sister relationship (morphology: [14]; mitochondrial DNA:
[15,16]), while the Batrachia hypothesis proposes a frog-salaman-
der sister relationship (morphology: [17–19]; nuclear and com-
bined DNA: [20–24]) (Figure 1B). Conversely, two hypotheses
based primarily on paleontological data suggest that Lissamphibia
PLOS ONE | www.plosone.org 1 November 2012 | Volume 7 | Issue 11 | e48990

Figure 1. Alternative hypotheses in the vertebrate phylogeny. Uncertainties in the vertebrate phylogeny examined in this study. (A) The fivealternative hypotheses for the placement of turtles within amniotes 1) turtles as basal amniotes, 2) turtles as basal sauropsids, 3) turtle-lepidosaursister group, 4) turtle-archosaur sister group, and 5) turtle-crocodilian sister group. (B) monophyletic and (C) paraphyletic alternative hypotheses forlissamphibian (extant amphibians) relationships.doi:10.1371/journal.pone.0048990.g001
Phylogenomics of the Vertebrate Phylogeny
PLOS ONE | www.plosone.org 2 November 2012 | Volume 7 | Issue 11 | e48990

is paraphyletic because of an affinity between caecilians and
amniotes (Figure 1C) [12,13], with salamanders sister to either
frogs [25–27] or caecilians [28,29]. In general, paleontological
data support a paraphyletic Lissamphibia, while molecular data
support the Batrachia hypothesis.
Both turtles and lissamphibians have ancient divergences within
vertebrates (.200 Ma for turtles, frogs, salamanders, and
caecilians) [11,30] and highly modified morphologies. The lack
of intermediate forms, either fossil or extant, obscures any obvious
morphological evidence of their respective ancestries. Therefore,
molecular studies are the best option for uncovering the
information necessary to resolve the enigmatic phylogenetic
positions of these groups. However, molecular data are not perfect
and exhibit several potential pitfalls, especially when trying to
resolve difficult phylogenetic questions [31]. For instance,
stochastic error (from insufficient data) and/or systematic error
(from inadequate models of substitution), can lead to erroneous
inferences [32]. Rogue taxa (i.e., taxa with strong support for
multiple phylogenetic positions due to either variation across genes
or systematic error) can also impede phylogenetic inference by
appearing to reduce confidence in other relationships [33].
In this study, we address two difficult phylogenetic questions in
the vertebrate phylogeny: the placement of turtles among amniotes
and the relationships among frogs, salamanders, and caecilians.
Minimizing stochastic error requires acquiring a sizeable dataset
suitable for testing the hypotheses of interest. We do this in our
study by compiling one of the largest datasets for vertebrate
phylogenetics to date (75 genes for 129 taxa). Systematic error is
more difficult to address and not solvable by acquiring additional
data [31]. Some generalized approaches to address systematic
error involve transforming data [34–38] or removing fast evolving
sites [39] or genes [40] to reduce homoplasy. We test such
methods with limited levels of success. We therefore develop a new
method to remove those data that are most likely to harbor non-
phylogenetic signal. Instead of a generalized removal of fast sites or
genes, we take a different approach that identifies and removes
sites that have a high probability of containing biased signal for
a specific phylogenetic relationship. By minimizing non-phyloge-
netic signal and removing rogue taxa, ambiguity regarding the
preferred hypotheses was greatly reduced, allowing us to infer
a sister relationship between turtles and either crocodilians or
archosaurs, as well as a sister relationship between caecilians and
salamanders. Some support was also found for a paraphyletic
Lissamphibia, with the caecilian-salamander clade more closely
related to amniotes than to frogs.
Results
Dataset CharacteristicsWe obtained DNA sequences of 75 protein-coding genes for
129 taxa from 1) online genomic resources and 2) targeted
sequencing of new samples [41]. Taxon sampling spans all
vertebrates, but is skewed towards mammals (36, available data
online) and turtles (45, for future studies within turtles). The
concatenated alignment of all genes includes 33,938 base
positions, and the overall matrix completeness is 41.6% for a total
of 4,378,002 bp of sequence data. On average, taxa in the dataset
include 31 of the 75 genes. Of the 3,989 sequences, 878 are new
(Genbank #s: JF264630-264720, JN864096-864759, JN885182-
885183), while the remaining 3,111 are from online resources. In
addition to a standard nucleotide dataset [NUCL], we used three
transformations of our data to minimize homoplasy for deeper
evolutionary divergences: 1) amino acids (AA) [34,35], 2) first and
second codon positions (N12) [36,37], and 3) sequence adjustment
to account for codon degeneracy (DEGEN1) [38]. In addition, for
each of these data transformations, we applied four alternative
taxonomic and gene sampling strategies: 1) all taxa for all 75 genes
(All taxa-75 genes), 2) a subset of 16 taxa (see below) for all 75
genes (16 taxa-75genes), 3) all taxa for a reduced set of genes with
sequences from all major taxonomic groups for the turtle (All taxa-
31 genes) and lissamphibian (All taxa-26 genes) questions, and 4)
16 taxa for each reduced gene set (Turtle: 16 taxa-31 genes,
Lissamphibia: 16 taxa-26 genes). For the 16-taxon datasets, only
2–4 of the most data-complete taxa were included from each
major taxonomic group to explore the impacts of missing data, as
this dataset is 81.9% complete. Lastly, to investigate the effect of
fast evolving genes on phylogenetic reconstruction, we calculated
the rate of evolution of each gene and removed the fastest genes
from our analyses. Based on the shape of the frequency histogram
(Fig. S2), we removed the fastest 25% of genes and concatenated
the remaining genes (dataset named ‘slow genes’) for analysis. All
data files have been deposited in the Dryad Repository: http://dx.
doi.org/10.5061/dryad.25j6h.
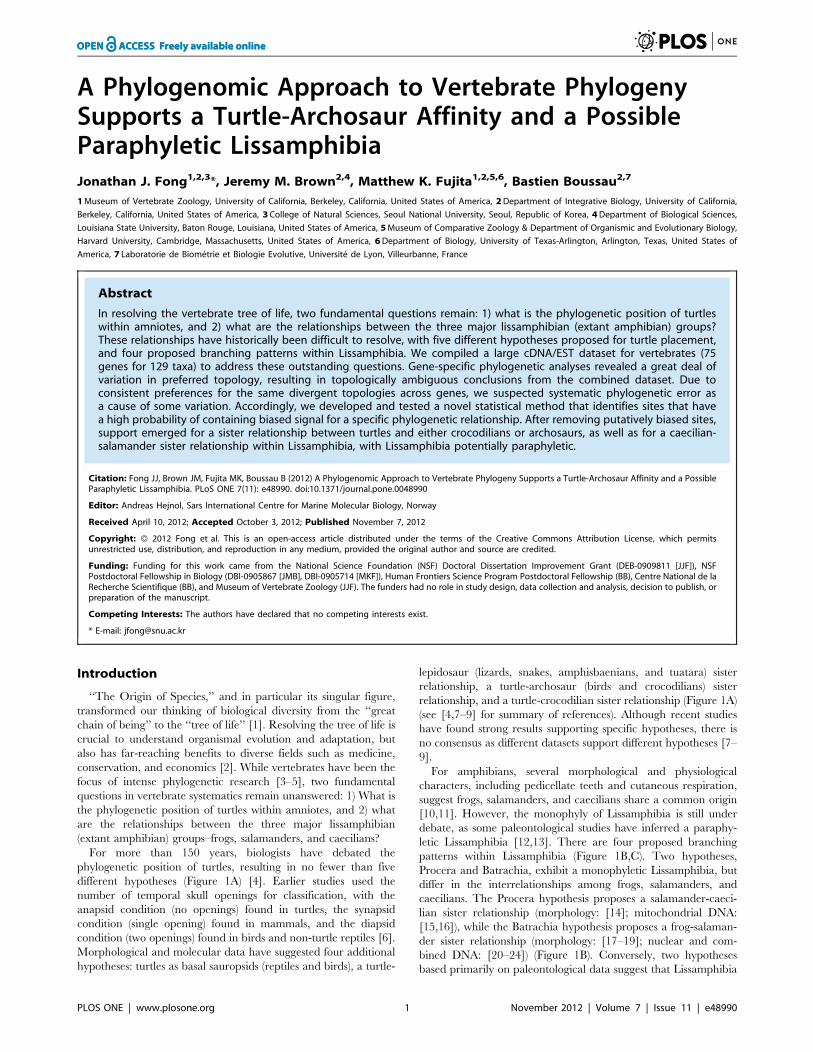
Phylogenetic Analyses and Topology TestsWe inferred gene trees for each gene using maximum likelihood
(RAxML); each hypothesis for both the turtle placement and
lissamphibian relationships was supported by subsets of these
individual gene trees (Figure 2). For the phylogenetic placement of
turtles, when all major amniote groups were included, the turtle-
crocodilian topology was most frequently supported (29%), while
the turtle-bird topology was most common (49%) when no
crocodilian was available (Figure 2A,B). For lissamphibian
relationships, the Batrachia hypothesis was most frequently
supported by individual gene analyses (18%), but support was
more evenly spread across each of the hypotheses compared to the
turtle question (Figure 2C). Coalescent-based analyses such as
BEST [42] can be used to deal with incongruent gene trees, but
were not possible for our datasets, as analyses failed to converge
(potentially due to the large amount of missing data [43]). So we
focus on the concatenated analyses and their results for the
remainder of this paper. Topology tests (approximately unbiased
topology tests [AU tests]) [44] were run alongside phylogenetic
analyses to rigorously test whether the maximum likelihood tree is
statistically better than alternative topologies.
For the phylogenetic placement of turtles, results from
concatenated datasets were generally consistent within, but
differed between, each data transformation (Figure S1, Table 1).
The NUCL data-type recovered a turtle-crocodilian relationship,
which was statistically indistinguishable from a turtle-archosaur
sister relationship based on AU tests in all datasets (Table 1). For
the N12 data-type, a turtle-archosaur relationship was recovered
in all but one dataset (16 taxa-31 genes: turtle-lepidosaur), and AU
tests statistically excluded turtles as basal amniotes. For the
DEGEN1 and AA data-types, the turtle-lepidosaur relationship
was recovered for all datasets, but results from AU tests were not
consistent.
For the lissamphibian question, phylogenetic analyses for N12,
DEGEN1, and AA often recovered different relationships, but
most AU tests did not exclude any of the four major hypotheses.
The NUCL data-type was unique in that the recovered topology
had no two lissamphibian groups monophyletic (Figure S1), but of
the four major hypotheses, provided the most support for
a paraphyletic Lissamphibia, with a caecilian-salamander clade
(Table 1).
Results from phylogenetic analyses and AU tests performed on
the ‘slow genes’ dataset are summarized in Table 1. For the turtle
question, a turtle-crocodile relationship was recovered, which was
Phylogenomics of the Vertebrate Phylogeny
PLOS ONE | www.plosone.org 3 November 2012 | Volume 7 | Issue 11 | e48990

statistically indistinguishable from a turtle-archosaur relationship.
For the lissamphibian question, results were identical to the NUCL
data-type where no two lissamphibian groups were monophyletic,
and AU tests could not statistically reject any of the four
hypotheses.
Rogue Taxa AnalysesUnstable (rogue) taxa in a phylogeny can affect phylogenetic
inference. Removal of these taxa can improve phylogenetic results
by increasing resolution and/or support values [33]. We identified
19–39 rogue taxa for each of the four data-types, with much
overlap between data-types. Although phylogenetic relationships
of major groups were the same, removal of rogue taxa improved
analyses by increasing bootstrap support values of clades.
Statistical AnalysesInitial phylogenetic results were inconclusive, possibly due to
conflicts between phylogenetic and non-phylogenetic signal.
Features of the data that may be correlated with biases in
phylogenetic reconstruction include site-specific rates of evolution
(site-rates), as well as heterogeneities between clades in GC content
(%GC) and amount of missing data (%missing) [45,46]. We reason
that if these correlates of non-phylogenetic signal alone can do
a good job of predicting the phylogeny favored by a site in the
alignment, this site is likely to be biased and cannot be trusted. A
diagram of our methodology to identify biased sites can be found
in Figure 3. First, we compute site-rates for each site in the
alignment, and %GC and %missing per site for major clades
relevant to turtle placement and lissamphibian relationships. In
addition, we compute site-wise likelihoods for all competing
hypotheses regarding the phylogenetic positions of turtles and
Lissamphibia and recorded the topology with the highest likeli-
hood for each site. Next, we use Discriminant Function Analysis
(DFA; employing a quadratic discriminant function) to predict the
favored topology based solely on descriptive statistics (site-rates,
%GC, and %missing). Based on the strength with which the DFA
was able to predict the topology preferred by any site, we
designated sites as putatively biased and progressively removed
them from the analysis.
We validated our approach on simulated data and a previously
published biological dataset [47]. We simulated sequences along
a tree with 8 leaves under strong heterogeneities in rates of
evolution among sites, relative branch lengths among sites, and
equilibrium %GC among taxa (see methods). Phylogenetic
reconstruction using all sites without filtering resulted in an
artifactual topology where species with similar %GC and high
Figure 2. Phylogenetic results from individual gene analyses. (A) The phylogenetic position of turtles within amniotes when all major groupswere present and (B) when no crocodilians were present. (C) The relationships between major lissamphibian groups. The ‘‘other’’ category includestopologies that do not match any of the previously proposed hypotheses, usually with a major amniote group being paraphyletic.doi:10.1371/journal.pone.0048990.g002
Phylogenomics of the Vertebrate Phylogeny
PLOS ONE | www.plosone.org 4 November 2012 | Volume 7 | Issue 11 | e48990
Table
1.Su
mmaryofphylogeneticresultsfrom
differentdatasets.
NUCL
N12
DEGEN1
AA
TURTLE
Individual
Alltaxa
16taxa
Alltaxa
16taxa
Alltaxa
16taxa
Alltaxa
16taxa
Alltaxa
16taxa
Alltaxa
16taxa
Alltaxa
16taxa
Alltaxa
16taxa
Slow
Genes
75genes75genes31genes31genes75genes75genes31genes31genes75genes75genes31genes31genes75genes75genes31genes31genesGenes
Basal
Amniote
0%
0.003
2e-40
3e-7
1e-59
0.001
1e-5
8e-5
0.005
0.001
0.005
0.274
0.237
0.001
6e-6
0.477
0.32
5e-6
Basal
Sauropsid
13%
3e-4
1e-4
0.001
0.056
0.009
0.188
0.32
0.383
0.07
0.351
0.424
0.454
0.117
0.137
0.398
0.586
5e-4
Turtle-Lepidosaur
10%
2e-5
1e-4
2e-4
0.016
0.144
0.339
0.412
XX
XX
XX
XX
X1e-6
Turtle-Archosaur
19%
0.143
0.177
0.327
0.471
XX
X0.505
0.601
0.151
0.526
0.041
0.345
0.295
0.283
0.027
0.477
Turtle-Crocodilian
29%
XX
XX
0.428
0.489
0.448
0.31
0.094
0.062
0.152
0.007
0.094
0.038
0.167
0.006
X
Other
29%
––
––
––
––
––
––
––
––
–
NUCL
N12
DEGEN1
AA
LISSAMPHIBIA
Individual
Alltaxa
16taxa
Alltaxa
16taxa
Alltaxa
16taxa
Alltaxa
16taxa
Alltaxa
16taxa
Alltaxa
16taxa
Alltaxa
16taxa
Alltaxa
16taxa
Slow
Genes
75genes75genes26genes26genes75genes75genes26genes26genes75genes75genes26genes26genes75genes75genes26genes26genesGenes
Batrachia
18%
0.009
0.008
0.204
0.402
XX
XX
X0.643
XX
0.539
XX
0.644
0.234
Procera
12%
0.002
0.003
0.037
0.069
0.311
0.339
0.29
0.183
0.394
X0.419
0.215
0.334
0.343
0.169
0.094
0.087
Parap
hyletic
Frog-Salam
ander
9%
0.001
0.001
0.004
0.153
0.512
0.587
0.273
0.403
0.386
0.087
0.269
0.074
X0.337
0.361
0.235
0.188
Parap
hyletic
Caecilian-Salam
ander12%
0.103
0.209
0.184
0.093
0.185
0.198
0.061
0.013
0.166
0.093
0.074
0.012
0.23
0.224
0.042
0.018
0.873
Other
48%
XX
XX
––
––
––
––
––
–X
X
Summaryofresultsfrom
phylogenetican
alysesforturtleplacementwithin
theam
niote
phylogeny,an
drelationshipsofLissam
phibia(extan
tam
phibians).Individualgenean
dconcatenatedan
alyseswere
perform
ed.Forindividual
genean
alyses,percentagesdenote
theproportionofgenessupportingthehyp
othesis.Fo
rtheconcatenatedan
alyses,thecellwith‘‘X’’foreachcolumndenote
themost
likelytopologybasedonRAxM
Llikelih
oodscores,while
thenumbersin
cells
representp-valuesbasedonap
proximatelyunbiasedtopologytests(Shim
odaira
2002).Cells
inbold
fontdenote
statistically
indistinguishab
letopologies(p-value.0.05)from
themostlikelytopology.Sixteen
totalconcatenatedan
alyseswere
perform
ed(4
datatran
sform
ations6
4datasets).Datawere
tran
sform
edin
anattemptto
reduce
therate
ofevo
lution:N
UCL=complete
nucleotidedataset,N12=1stan
d2ndcodonpositionsonly
(Edwardsetal.1991,Blouin
etal.1998),DEG
EN1=codondegeneracy
(Regieretal.2010),AA=am
inoacids(M
eyer1994).Threedifferentdatasets
were
compiledin
attempts
tominim
izetheam
ountofmissingdata:
16taxa
(reducedtaxo
nsetto
includethetaxa
withthemost
complete
dataforeachmajorvertebrate
group),31genes(forturtle
question,geneswithrepresentativesfrom
allthemajorgroupsin
question),26genes(forlissamphibian
question,geneswithrepresentativesfrom
allthemajorgroupsin
question).Thelast
columnsummarizestheresultsfrom
phylogenetican
alyseswhenremovingthe19most
quicklyevo
lvinggenes(25%
oftotalgenes).
doi:10.1371/journal.pone.0048990.t001
Phylogenomics of the Vertebrate Phylogeny
PLOS ONE | www.plosone.org 5 November 2012 | Volume 7 | Issue 11 | e48990

rates of evolution clustered together. We computed %GC and site-
rates (simulated dataset was complete, without missing data) on the
simulated sequences, and used our procedure to filter sites using
site-rates only or both site-rates and %GC. Although the
sequences had been simulated under strong compositional
heterogeneity, filtering based on site-rates only resulted in better
overall results. In fact, the removal of putatively biased sites
resulted in the recovery of the correct topology at all thresholds
tested. In contrast, filtering based on both %GC and site-rates
resulted in the recovery of the correct topology only when
removing the largest proportion of sites (Table S1). Contrary to
site-rates, %GC contains a complex mixture of phylogenetic and
biased signal, which may confuse the method, as shown by the
following toy example. If one considers 3 clades A, B, C, with the
correct topology ((A,B),C) and convergence towards higher GC
content in clades B and C leads to the artifactual topology
(A,(B,C)). High GC contents in clade B, clade C, or even in both
clades B and C are not by themselves sufficient for predicting that
a site is likely to provide biased signal. Only in the case where A is
GC poor and both B and C are GC rich can this site be safely
assumed to likely provide biased signal. All seven other config-
urations (all three clades GC rich; the two other configurations
Figure 3. Flow diagram of data filtering method. Steps of the new statistical methodology to identify and filter out sites that contain putativenon-phylogenetic signal (i.e. biased sites). Analyses pertaining to the phylogenetic position of turtles are used in this example.doi:10.1371/journal.pone.0048990.g003
Phylogenomics of the Vertebrate Phylogeny
PLOS ONE | www.plosone.org 6 November 2012 | Volume 7 | Issue 11 | e48990

with two clades GC rich, the three configurations where two clades
are GC poor, and three clades GC poor) are not indicative of
a compositional artifact. Consequently, to predict putatively biased
sites using compositional statistics for clades, a complex interaction
between three variables has to be uncovered by the method. As
our DFA does not consider interaction terms between two or more
variables, it cannot perform well with %GC. Other predictor
variables (e.g., site-rates or %missing) may not require interactions
between two or more variables for predicting putatively biased
sites, and are thus more amenable to our analysis through DFA.
For instance, the rate of a site or the percent of missing data in
a particular clade could be enough to predict that a site has the
potential for providing biased signal.
To further validate our approach, we used a dataset of eight
gene concatenates addressing the Ecdysozoa-Coelomata contro-
versy [48]. In their paper, Wolf et al. (2003) [47] concluded in
favor of the Coelomata hypothesis, as analyses of the datasets
resulted in 5/8 topologies strongly supporting Coelomata.
However, most recent studies support the Ecdysozoa hypothesis
and suggest that the Coelomata hypothesis is an artifactual result
linked to fast-evolving taxa and inadequate taxonomic sampling
[49]. The original dataset was a complete, amino acid dataset, so
we are unable to calculate %GC and %missing. Therefore, we
only computed site-rates and applied our filtering procedure on
the eight datasets, comparing it to random removal of sites as
a control. After filtering, 6/8 alignments support the Ecdysozoa
hypothesis (Table S2), changing the support of three genes from
Coelomata to Ecdysozoa. These results suggest that our approach
had successfully filtered out biased signal from the alignments.
We computed site-wise descriptive statistics and most likely
topologies for the NUCL dataset. As our method focuses on
specific phylogenetic questions, we performed filtering of biased
sites twice, once for the turtle question and once for the
Lissamphibia question, producing two different sets of alignments.
We find that DFA accurately predicts the most likely topology
for 47% of the sites for Lissamphibia, and 36% of the sites for
turtles. DFA is able to predict the topology with the highest site
likelihood more accurately than the control (see methods; sites are
correctly predicted by the DFA analysis 1.556 and 1.656more
often than random expectations for Lissamphibia and turtles,
respectively) (Table S3). The predictive ability of DFA is
significantly better than expected at random, based on the results
of permutation tests (Figure S3).
Interestingly, the ability of DFA to predict the preferred
topology at a site varies by topology. In lissamphibians, DFA is
most able to predict the Procera topology (1.986more accurately
than the control predictor) and least able to predict the Batrachia
topology (1.436). In turtles, DFA is most able to predict the
Lepidosaur topology (3.626) and least able to predict the
Archosaur topology (0.666) (Table S3). For each site, DFA can
also be used to calculate a support value corresponding to the
strength of its prediction. For instance, regarding Lissamphibia,
the 1% most confidently predicted sites based on DFA all support
the Procera hypothesis, and for turtles, the 1% most confidently
predicted sites all support the Sauropsid topology. This shows that
the Procera topology for lissamphibian relationships, and the
Lepidosaur and Sauropsid topologies for turtle placement can be
predicted by characteristics of the sites that should be unrelated to
the site’s preferred topology, and suggests they may be supported
in part by non-phylogenetic signal in the alignment. We note that
all four candidate topologies for Lissamphibia are predicted with
similar accuracies by the DFA analysis, in contrast with the turtle
analysis. This may imply that the biased signal we detect is more
equally distributed among the different lissamphibian hypotheses
than for the turtle hypotheses.
Based on the performance of DFA-filtering when analyzing
simulated as well as empirical data, we performed two DFA
analyses: three types of descriptive statistics (site-rates, %GC, and
%missing) or two types (excluding %GC). We generated several
alignments by removing the 10%, 20%, 30%, 40%, or 50% most
confidently predicted (i.e. most suspect) sites from the alignment
for the turtle and Lissamphibia analyses, and generated phylog-
enies from these sub-sampled alignments as well as alignments of
the discarded sites. For turtles, all phylogenetic analyses and
topology tests based on DFA-filtering using all three descriptive
statistics support turtles as the sister group to crocodilians (Table
S4). Filtered datasets generated without the use of clade-specific
%GC as a predictor supported either turtle-crocodilian or turtle-
archosaur relationships (Table S4). For Lissamphibia, all analyses
using all three descriptive statistics support the same topology in
which Lissamphibians are paraphyletic and a caecilian-salaman-
der clade forms the sister group to amniotes (Table S4). However,
for analyses excluding %GC, two hypotheses (Procera and
Paraphyletic Caecilian-Salamander) are often statistically indistin-
guishable. Additionally, when excluding %GC and removing 50%
and 40% of the data, supported topologies do not match any of the
four proposed hypotheses (Table S4). The low bootstrap support
values suggest these highly unlikely topologies come from an
absence of a clear phylogenetic signal in the remaining sites.
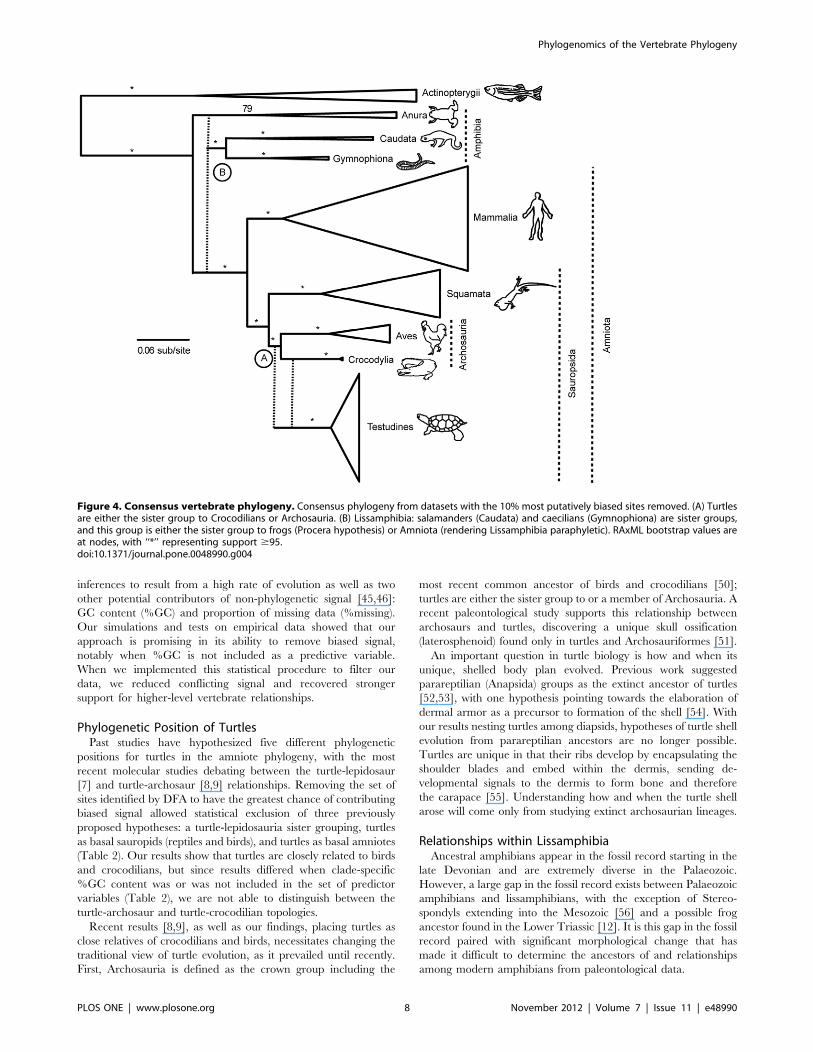
From the four alignments with the 10% most suspect data
removed, one for each combination of taxonomic question and
number of DFA predictor types (2 or 3), we can exclude all but
four possible topologies relating major vertebrate groups. We
combine these trees to produce a consensus phylogeny, with
relationships within amniotes from the turtle datasets and deeper
vertebrate relationships from the lissamphibian datasets. The
consensus phylogeny of higher-level vertebrate relationships from
our study is in Figure 4.
Discussion
Previous studies of the vertebrate phylogeny have resulted in
ambiguity regarding the phylogenetic placement of turtles within
amniotes and the interrelationships within Lissamphibia
(Figure 1), in part because the short internodes and long
branches that characterize these groups are notoriously difficult
problems in phylogenetic inference. Using standard phylogenetic
approaches, past studies – as well as similar efforts with our data
– have not yielded consistent results (see [5,12]). We believe that
difficult phylogenetic problems, such as these, could be due to
the presence of conflicting phylogenetic signal in the dataset. In
large datasets, the problem may not be the amount of
phylogenetic signal, but rather the confounding effects of
phylogenetic error. Philippe et al. (2011) [31] outline three
primary sources of phylogenetic error: 1) incorrect identification
of orthologs, 2) erroneous sequence alignments, and 3) in-
adequate models of evolution. The first two points are addressed
in our dataset by rigorously testing orthology and alignment
through the marker development and data analysis stages [41].
Some standard methods to address the third point are to reduce
homoplasy by transforming data and removing genes. For our
study, data transformations were ineffective at removing con-
flicting signal, while removal of fast evolving genes was partially
successful, but conflicting signal remained, especially for the
lissamphibian question. Accordingly we developed a new method
that predicts and removes potentially biased sites for a specific
phylogenetic question. Our method tests the potential for biased
Phylogenomics of the Vertebrate Phylogeny
PLOS ONE | www.plosone.org 7 November 2012 | Volume 7 | Issue 11 | e48990
inferences to result from a high rate of evolution as well as two
other potential contributors of non-phylogenetic signal [45,46]:
GC content (%GC) and proportion of missing data (%missing).
Our simulations and tests on empirical data showed that our
approach is promising in its ability to remove biased signal,
notably when %GC is not included as a predictive variable.
When we implemented this statistical procedure to filter our
data, we reduced conflicting signal and recovered stronger
support for higher-level vertebrate relationships.
Phylogenetic Position of TurtlesPast studies have hypothesized five different phylogenetic
positions for turtles in the amniote phylogeny, with the most
recent molecular studies debating between the turtle-lepidosaur
[7] and turtle-archosaur [8,9] relationships. Removing the set of
sites identified by DFA to have the greatest chance of contributing
biased signal allowed statistical exclusion of three previously
proposed hypotheses: a turtle-lepidosauria sister grouping, turtles
as basal sauropids (reptiles and birds), and turtles as basal amniotes
(Table 2). Our results show that turtles are closely related to birds
and crocodilians, but since results differed when clade-specific
%GC content was or was not included in the set of predictor
variables (Table 2), we are not able to distinguish between the
turtle-archosaur and turtle-crocodilian topologies.
Recent results [8,9], as well as our findings, placing turtles as
close relatives of crocodilians and birds, necessitates changing the
traditional view of turtle evolution, as it prevailed until recently.
First, Archosauria is defined as the crown group including the
most recent common ancestor of birds and crocodilians [50];
turtles are either the sister group to or a member of Archosauria. A
recent paleontological study supports this relationship between
archosaurs and turtles, discovering a unique skull ossification
(laterosphenoid) found only in turtles and Archosauriformes [51].
An important question in turtle biology is how and when its
unique, shelled body plan evolved. Previous work suggested
parareptilian (Anapsida) groups as the extinct ancestor of turtles
[52,53], with one hypothesis pointing towards the elaboration of
dermal armor as a precursor to formation of the shell [54]. With
our results nesting turtles among diapsids, hypotheses of turtle shell
evolution from parareptilian ancestors are no longer possible.
Turtles are unique in that their ribs develop by encapsulating the
shoulder blades and embed within the dermis, sending de-
velopmental signals to the dermis to form bone and therefore
the carapace [55]. Understanding how and when the turtle shell
arose will come only from studying extinct archosaurian lineages.
Relationships within LissamphibiaAncestral amphibians appear in the fossil record starting in the
late Devonian and are extremely diverse in the Palaeozoic.
However, a large gap in the fossil record exists between Palaeozoic
amphibians and lissamphibians, with the exception of Stereo-
spondyls extending into the Mesozoic [56] and a possible frog
ancestor found in the Lower Triassic [12]. It is this gap in the fossil
record paired with significant morphological change that has
made it difficult to determine the ancestors of and relationships
among modern amphibians from paleontological data.
Figure 4. Consensus vertebrate phylogeny. Consensus phylogeny from datasets with the 10% most putatively biased sites removed. (A) Turtlesare either the sister group to Crocodilians or Archosauria. (B) Lissamphibia: salamanders (Caudata) and caecilians (Gymnophiona) are sister groups,and this group is either the sister group to frogs (Procera hypothesis) or Amniota (rendering Lissamphibia paraphyletic). RAxML bootstrap values areat nodes, with ‘‘*’’ representing support $95.doi:10.1371/journal.pone.0048990.g004
Phylogenomics of the Vertebrate Phylogeny
PLOS ONE | www.plosone.org 8 November 2012 | Volume 7 | Issue 11 | e48990

The most recent molecular study based on mitochondrial
genomes and eight nuclear genes [24] supports the Batrachia
hypothesis, which is in contrast to most paleontological studies
supporting a paraphyletic Lissamphibia [12,13,25–29]. This raises
the question of whether morphological or molecular data are
correct [26]. The results of our molecular study supports
a caecilian-salamander sister relationship, but cannot distinguish
between a monophyletic and paraphyletic Lissamphibia (Figure 4).
Although our results do not resolve the lissamphibian origin
problem, we resurrect an often-overlooked hypothesis of a para-
phyletic Lissamphibia. This is the first molecular study to have
signal supporting a paraphyletic Lissamphibia, allowing for the
possibility of concordance between morphological and molecular
data. If the paraphyletic hypothesis is true, caecilians and
salamanders would be more closely related to humans and other
amniotes than to frogs. To discriminate between the alternative
hypotheses of a monophyletic and paraphyletic Lissamphibia,
deeper taxon and gene sampling for lissamphibian groups will
probably be needed.
Removal of Biased SignalA common notion in molecular systematics is that the solution
to resolving difficult relationships is to include ever increasing
amounts of data. This belief is based on the idea that true
phylogenetic signal will eventually dominate and drive the results
of an analysis, circumventing any methodological problems.
However, our results suggest that inclusion of more data can
introduce biased signal into a dataset, resulting in a lack of
resolution or even misleading inferences, a possibility also raised
by others [31]. Methods to filter data based on the rate of
evolution have been previously used to increase resolution by
removing non-phylogenetic signal [39,40]. In an effort to remove
non-phylogenetic signal in a more targeted way, we develop a new
DFA-based filtering method that attempts to identify sites
contributing biased signal based on several data set characteristics
known to cause inference problems in certain contexts (site-rates,
%GC, %missing). In addition to using more information for
predicting non-phylogenetic signal, our approach is different from
other methods because it targets a specific phylogenetic relation-
ship (i.e. sites identified as biased for the turtle question are specific
to that question). We anticipate and encourage future studies that
will more fully assess which characteristics of sites can be used with
this method to accurately predict the presence of phylogenetic bias
(e.g. whether or not %GC can improve the prediction of bias and,
if so, when). Future studies could also assess potential performance
gains from including interaction terms among variables in the
DFA or including information about the strength with which
a particular site supports its preferred phylogenetic hypothesis.
Proper modeling of molecular evolution and evaluation of the fit
between data and model seem to be just as important as the
amount of data present in a study. With the advent of new
technologies that produce sequence data faster and more cheaply
than ever before, datasets will only become larger, and issues
relating to signal quality will become even more important in
molecular systematics. We view our DFA approach as an
important step towards the goal of objectively identifying non-
phylogenetic signal in large datasets.
ConclusionWith increasingly large datasets being gathered for phyloge-
netics, many relationships have been confidently resolved. What
remains are controversial, difficult to resolve phylogenetic
questions, probably arising from conflicting and biased phyloge-
netic signal in the data. We developed a method for identifying
and minimizing biases from molecular data to tackle two persistent
yet fundamental problems in vertebrate phylogenetics: the
Table 2. Phylogenetic results from filtered datasets.
3 types (site-rates, %GC, %missing) 2 types (site-rates, %missing)
TURTLE 50% 40% 30% 20% 10% 50% 40% 30% 20% 10%
Archosaur 7e-5 2e-5 1e-4 1e-4 0.031 X X X 0.313 0.173
Crocodilian X X X X X 0.006 0.119 0.32 X X
Lepidosaur 6e-79 5e-33 8e-98 2e-54 6e-6 1e-68 1e-7 2e-59 1e-46 1e-48
Basal Sauropsid 4e-5 3e-117 4e-5 2e-8 2e-4 8e-65 2e-50 2e-70 1e-56 1e-44
Basal Amniote 6e-5 7e-10 1e-6 1e-84 0.001 5e-26 1e-4 5e-7 1e-6 12e-5
3 types (site-rates, %GC, %missing) 2 types (site-rates, %missing)
LISSAMPHIBIA 50% 40% 30% 20% 10% 50% 40% 30% 20% 10%
Batrachia 7e-36 7e-34 3e-6 2e-65 4e-52 0.004 0.003 0.019 0.015 0.003
Procera 7e-11 5e-61 5e-5 2e-66 93–94 0.029 0.405 0.375 0.131 3e-4
Paraphyletic
Frog-Salamander 3e-76 2e-7 1e-6 6e-67 5e-6 2e-7 0.004 1e-4 0.002 0.001
Paraphyletic
Caecilian-Salamander X X X X X 7e-11 0.036 X X X
Other – – – – – X X – – –
Varying amounts of suspect sites were removed and tested. A) Position of turtles in the amniote phylogeny using three descriptive statistics (site-rates, %GC, and%missing), B) position of turtles in the amniote phylogeny using two descriptive statistics (excluding %GC), C) interrelationships of Lissamphibian groups using threedescriptive statistics (site-rates, %GC, and %missing), D) interrelationships of Lissamphibian groups using two descriptive statistics (excluding %GC). The percentage ineach column represents the percentage of sites removed from the dataset. Values in cells represent p-values, ‘‘X’’ denotes the best tree, and trees statisticallyindistinguishable from the best tree are in bold font (Approximately Unbiased topology test p-value .5%).doi:10.1371/journal.pone.0048990.t002
Phylogenomics of the Vertebrate Phylogeny
PLOS ONE | www.plosone.org 9 November 2012 | Volume 7 | Issue 11 | e48990

placement of turtles within amniotes and the interrelationships
within Lissamphibia. Based on tests of our filtering method on
simulated and empirical datasets, we believe that we are able to
reduce the amount of conflicting signal in datasets. For the
vertebrate phylogeny, the application of this filtering method
results in analyses that support turtles being closely related to
archosaurs, as either the sister group to crocodilians or archosaurs,
and a caecilian-salamander sister relationship, with the possible
paraphyly of Lissamphibia. Because of our use of a new statistical
approach, we view our results to be tentative and encourage more
work from paleontologists and molecular biologists alike to further
evaluate these hypotheses and methodology. Given the impor-
tance of the historical framework provided by phylogenetic
systematics in fields as diverse as developmental biology, genomics,
conservation biology and paleontology, we believe approaches like
ours will be useful to resolve major phylogenetic questions and
advance modern biological thought.
Materials and Methods
Ethics StatementThis research was conducted under and approved by UC
Berkeley’s Animal Care and Use Committee (protocol #R279-
0211). Tissue samples used in this study were obtained from the
Museum of Vertebrate Zoology (MVZ), an institution that serves
as a specimen and tissue repository for researchers. The MVZ has
a strict policy for researchers when depositing specimens and
tissues into the museum, requiring local collecting permits and
import permits when necessary.
Taxon SamplingOur study included sampling for all major vertebrate groups
except Tuatara (Sphenodon). Omission of the Tuatara is inconse-
quential to our investigation due to its uncontroversial affinity with
Squamata ( = Lepidosauria) [57]. Of the 129 taxa included in this
study, data were available for 46 taxa from complete genomes or
ESTs (GenBank and Ensembl [58]), and the remaining 82 samples
were newly sequenced. Available data were skewed heavily
towards mammals (36 taxa), but also include fish (5 taxa), frog (1
taxon), salamander (1 taxon), lizard (1 taxon), bird (2 taxa), and
crocodile (1 taxon). New taxon sampling expanded representation
within amphibians, reptiles, and birds. A detailed list of all taxa
used in this study, along with Genbank numbers, can be found in
Table S5.
Marker SamplingMarkers used in this study are single-copy, orthologous, protein-
coding genes [41]. The single-copy nature of the markers was
checked both during marker development and after data
collection. During marker development, markers were pre-
screened using BLAST to compare with the high-coverage, well-
annotated chicken genome and gene families were identified in
Ensembl and Metazome. After data collection, to identify and
remove paralogous genes, preliminary phylogenetic analyses using
RAxML [59] were performed for each gene. Each of the trees was
analyzed individually by eye for erroneous phylogenetic relation-
ships (e.g. mammal species more closely related to fish) and
signatures of gene duplications (i.e. replicated tree topologies
within the larger tree). Sequences with erroneous positions were
removed, and when gene duplications were detected, the sub-tree
that included newly sequenced data was retained for subsequent
analyses. We obtained new sequences according to the methods of
Fong & Fujita (2011) [41]. Briefly, we used cDNA preparations as
template to amplify the protein-coding genes using conserved
primers. Amplicons were sequenced using ABI3730 chemistry,
and sequences were edited using Geneious 5 (Biomatters Ltd.) and
aligned using MUSCLE [60].
Datasets and Data-typesSequences were combined into two main categories of datasets:
individual genes and concatenations. Individual datasets for the 75
genes consisted of orthologous sequences from online genomes and
the new samples. Combining individual genes using a Perl script
(available upon request) produced the concatenated datasets. We
compiled seven different concatenated datasets: 1) All taxa-75
genes, 2) 16 taxa-75 genes, 3) All taxa-31 genes (turtle), 4) All taxa-
26 genes (Lissamphibia), 5) 16 taxa-31 genes (turtle), 6) 16 taxa-26
genes (Lissamphibia), 7) slow genes (removal of fastest 25% of
genes). For the 16-taxon datasets, the vertebrate group Crocodilia
is represented by two individuals of the species Alligator
mississippiensis (from the EST database and a new sample). We
combined the data from both individuals to minimize missing
data; this approach is justified, as when there were data from both
individuals for a marker, data were identical. The dataset of
reduced loci for all taxa was used when evaluating the specific
phylogenetic questions (turtle and Lissamphibia). Loci without
representatives of all the focal groups were removed, leaving 31
genes for the turtle analysis and 26 genes for the lissamphibian
analysis.
The standard nucleotide (NUCL) dataset was transformed to
three data-types using the following methods. AA was translated in
Geneious 5 (Biomatters Ltd.), 3rd codon positions were removed
for N12 using MacClade v4.08 [61], and DEGEN1 was converted
using a Perl script [38].
The rate of evolution for each of the 75 genes was calculated by
computing tree length and averaging branch lengths using an R
script [62]. Based on the shape of the frequency histogram (Fig.
S2), we drew a cut-off of average branch length of 0.04, which
denoted the top 25% fastest genes (19 genes) for removal. The
names of these genes are: DSCR3, EXOC2, GAPDH, GDE1,
GNAS, HPD, H2AFY2, IFT57, MAT2B, OAT, OAZ1, PPM1A,
PPTC7, PSAT1, SEC13, SGK1, TAT, UBE2J2, and XPOT
(Table S5) [41].
Phylogenetic AnalysesAll datasets were subject to maximum likelihood analyses using
RAxML [59], and a subset of datasets were also subject to
Bayesian analyses using MrBayes [63].
Since this study deals with a complex, multi-gene dataset, we
explored heterogeneous processes of molecular evolution through
partitioning the data. Tests of alternative partitioning strategies
were performed on the NUCL dataset only, as the N12 dataset is
a subset of the NUCL dataset, and the DEGEN1 and AA datasets
have information on codon position integrated into gene
partitions. For RAxML analyses of the NUCL dataset, three
different partitioning strategies were tested: by gene (75 partitions),
by gene and 1st+2nd and 3rd codon position (150 partitions), and by
gene and codon position (225 partitions). Likelihood ratio tests
selected the 150 partitions as the best partitioning strategy.
RAxML nucleotide analyses used the GTRGAMMA model of
evolution for tree inference and bootstrapping (1,000 replicates).
RAxML amino acid analyses employed the protein gamma model
of evolution and the appropriate model of protein evolution
selected using ProtTest v2.4 [64], with empirical amino-acid
frequencies for both tree inference and bootstrapping (1,000
replicates). All concatenated datasets were partitioned according to
the optimal partitioning strategy. RAxML v7.2.5 and v7.2.6
Phylogenomics of the Vertebrate Phylogeny
PLOS ONE | www.plosone.org 10 November 2012 | Volume 7 | Issue 11 | e48990

[59,65] analyses were run locally and on the CIPRES portal v2.2
[66].
For individual gene analyses, the support values of clades are
generally very low, since these relatively short genes (average
length is ,450bp) were used to infer the entire vertebrate
phylogeny. However, to understand and summarize the phyloge-
netic signal for each gene, we classified them based on preferred
topology (see Figure 2) irrespective of nodal support.
Bayesian analyses were only run on individual genes and 16-
taxon datasets, as the computational burden for the larger datasets
would require extremely long analysis times to achieve stationarity
(i.e. .2000 hours). When both RAxML and MrBayes analyses
were run, preferred topologies were almost identical, so results
should not be compromised by reporting only inferences from
RAxML. MrBayes v3.1.2 and v3.2 [63] analyses were run locally
and using the BioHPC@CBSU resource at Cornell University
(http://cbsuapps.tc.cornell.edu). All analyses were run with four
chains for 10 million generations. Appropriate models of DNA
substitution for each partition were selected using MrModeltest
v2.3 [67], and amino acid substitution models were the same as
those used in RAxML analyses. Burn-in of MCMC chains was
evaluated using the online program AWTY, examining cumula-
tive plots of posterior probabilities of the 20 most variable splits
[68].
Rogue Taxa AnalysesRogue taxa analyses were performed using RAxML (Stamatakis
2006) and an algorithm described in Pattengale et al. (2010) [33].
Determining the set of rogue taxa to remove was a multi-step
process that was run on the concatenated datasets, separately for
each of the four data-types. First, a preliminary RAxML analysis
was run with all 129 taxa. Based on this phylogeny, taxa that were
obviously in incorrect phylogenetic positions (e.g. turtle placed in
the mammal clade) were manually removed. These removed taxa
tended to be those with the highest levels of missing data. This was
repeated until all remaining taxa were placed in the correct clades.
Next, the bootstrap results from the RAxML analysis were used as
the input data in rogue taxa analyses. The rogue taxa analysis was
run 20 times in total, 10 each for both the strict and majority rules
consensus trees, using the ‘‘2r’’ randomization option to select
a dropset. To maximize the number of taxa retained and remove
the most unstable taxa, taxa were considered rogues if they were
identified in $5 of the 10 analyses under either strict or majority
rules consensus. These taxa were removed and steps repeated until
there were no rogue taxa identified or no improvement in
bootstrap values.
Topology TestsApproximately unbiased topology tests (AU tests) [44] were used
to test whether sub-optimal trees were significantly worse than the
maximum likelihood tree. AU tests were performed to compare
the five turtle and four lissamphibian alternative hypotheses for
each of the different datasets. Constrained RAxML analyses were
run for each of the different topologies using the GTRGAMMA
model of sequence evolution, and per-site log likelihoods
calculated. These per-site log likelihoods were then input into
the program CONSEL [69].
Discriminant Function Analyses (DFA)Scripts for DFA analyses of the NUCL dataset were written
using the R language [62] and rely on the SeqinR [70] and MASS
[71] libraries. These scripts are available from the authors upon
request. Per-site log-likelihood scores (LLS) were calculated for
each of the constrained phylogenies pertaining to a relevant
hypothesis (five turtle positions, four Lissamphibia hypotheses)
using RAxML. Site-wise GC content (%GC) and proportion of
missing data (%missing) were computed for major clades with
potential sister-relationships for turtle placement (turtles, arch-
osaurs, crocodilians, reptiles excluding turtles, and amniotes
excluding turtles) and lissamphibian relationships (amniotes,
caecilians, caecilians+salamanders, frogs+salamanders, and lissam-
phibians). Site-specific rates of evolution (site-rates) were calculated
for each of the nine constrained phylogenies using HyPhy [72]
under a GTR model of sequence evolution with model parameters
estimated independently for each phylogenetic hypothesis. These
rates were then averaged across the five turtle and four
lissamphibian topologies. %GC and %missing were both calcu-
lated for each site in the NUCL data matrix, averaged across all
taxa in each clade of interest.
DFA (from the MASS library) was run with preferred topology
as the predicted category, and %GC (for relevant clades),
%missing (for relevant clades), and site-rates as predictor variables
in one case, and without %GC in another case. Posterior
probabilities from the DFA were calculated using leave-one-out
cross-validation and normalized with prior probabilities (posteri-
or/prior ratio). The prior probability of assignment to any
particular topology was simply the proportion of sites in the
alignment preferring that topology. Two different types of DFA
were tested to maximize the predictive power of our analysis:
linear discriminant analysis (LDA), and quadratic discriminant
analysis (QDA). Comparisons of average posterior/prior ratios
show that QDA performed best (Turtle: LDA=1.483,
QDA=1.693; Lissamphibian: LDA: 1.219, QDA=1.572).
DFA Methodology ValidationWe validate this new methodology by evaluating its perfor-
mance in two situations: (1) when analyzing DNA data simulated
under conditions known to cause phylogenetic inference problems,
and (2) when analyzing empirical amino acid data for a challenging
phylogenetic question [47].
For the simulation study, we simulated two 8-taxon datasets
under conditions that cause standard phylogenetic methods to
recover the incorrect phylogeny. Tree topologies were balanced
and included four groups of two sister species. On each side of
the short innermost branch are two sister groups, one of which
has a short subtending branch and one of which has a long
subtending branch. Equilibrium GC content was set to 80% for
long branches and the sister groups that they subtend, while it
was set to 50% for all other branches. Other parameters of the
substitution matrices were equal among branches. Each simulat-
ed dataset was 1,500 bp in length and consisted of one 1000-bp
subset, and one 500-bp subset. The 500-bp partition
[(((A1:0.05,A2:0.05):0.5,(B1:0.05,B2:0.05):0.02):0.05,((C1:0.05,-
C2:0.05):0.02,(D1:0.05,D2:0.05):0.5):0.05);] showed larger differ-
ences in branch lengths than the other one
[(((A1:0.05,A2:0.05):0.3,(B1:0.05,B2:0.05):0.02):0.05,((C1:0.05,-
C2:0.05):0.02,(D1:0.05,D2:0.05):0.3):0.05);]. Simulations were
performed using bppseqgen [73]. Precise command lines used
for simulation can be obtained from the authors.
The simulated dataset was filtered for biased sites with DFA
comparing the true topology used in simulations and the biased
topology in which clades with long branches are clustered
together. We used either two descriptive statistics (%GC and
site-rates) or one descriptive statistic (site-rate), removing 10%,
20%, 30%, 40% and 50% of the sites. These alignments were
compared to the random removal of a comparable number of
sites. Phylogenetic analyses of the datasets were performed using
RAxML with the same parameters as above. Results of these
Phylogenomics of the Vertebrate Phylogeny
PLOS ONE | www.plosone.org 11 November 2012 | Volume 7 | Issue 11 | e48990

analyses are found in Table S1. Removing sites according to the
strength of DFA prediction has different effects on the phyloge-
netic inference compared to removing sites at random: DFA-based
removal allows recovery of the correct topology when enough sites
are removed, but random removal does not. In this simulation,
filtering based on DFA prediction excluding %GC performs better
at escaping the incorrect topology and closely estimating the true
phylogeny (Table S1). This result motivated us to try DFA filtering
without clade-specific %GC for our empirical data (see above).
For an empirical test of our methodology, we focus on the
Coelomata-Ecdysozoa debate regarding metazoan phylogeny
[48]. Although some studies support the traditional Coelomata
relationship, evidence is mounting in support of a monophyletic
Ecdysozoa (see [49] for a summary). In the multi-gene dataset of
Wolf et al. (2003) [47], eight macromolecular complex subunits
were analyzed, with 5 of 8 genes supporting the Coelomata
relationship. We employ our DFA methodology on each of the
eight datasets, with some slight modifications; datasets are
comprised of amino acid sequences so we only use site-rates as
a filtering variable (no missing data or GC content). We generated
five filtered alignments varying in the amount of data removed
(10%, 20%, 30%, 40%, 50%), and compare these results to
random removal of sites. Results dramatically changed compared
to those in the original study [47]; originally 5/8 datasets
supported the Coelomata relationship, while after data filtering,
6/8 datasets support the Ecdysozoa relationship (Table S2). Three
datasets, based on original analyses and random removal of sites,
that support the Coelomata relationship (CH, CL, LF) shift
support to the Ecdysozoa relationship after DFA data filtering,
while three datasets originally supporting the Ecdysozoa (RI, RP)
maintain support after data filtering. One of the datasets originally
supporting Ecdysozoa (PR) maintains support after some filtering,
but show inconsistent results for the 40% and 50% dataset (neither
supporting Coelomate nor Ecdysozoa).
While we endeavored to include those predictor variables that
we felt were most likely to be correlated with biased signal in the
data, we note that these decisions were subjective and we may
have left out stronger correlates. Similarly, interactions among
predictors were ignored for the sake of tractability. The potential
also exists for true phylogenetic signal to manifest itself in %GC in
some cases, leading to the exclusion of sites with unbiased signal.
However, for both analyses we repeated the QDA procedure after
excluding all %GC variables as predictors and report those results
as well. Examining the sensitivity of phylogenetic conclusions to
these considerations will be an interesting avenue for future work.
Supporting Information
Figure S1 Maximum Likelihood phylogenies of thedifferent data transformations. Phylogenies have been
simplified to only show higher-level relationships within verte-
brates. A) All taxa-NUCL dataset, B) 16 taxa-NUCL dataset, C)
All taxa-N12 dataset, D) 16 taxa-N12 dataset (note: the Bayesian
analysis recovered a turtle-crocodile relationship), E) All taxa-
DEGEN1 dataset, F) 16 taxa-DEGEN1 dataset, G) All taxa-AA
dataset, H)16 taxa-AA dataset. Support values for phylogenies
with all taxa (A,C,E,G) show RAxML bootstrap values only if
$50. Support values for phylogenies with 16 taxa show support
values in the form of RAxML bootstrap/Bayesian posterior
probability. An * indicates full support.
(PDF)
Figure S2 Frequency histogram of the rate of evolutionfor the 75 molecular markers. Rate of evolution of the 75
markers was estimated by computing average branch length. The
red, vertical line indicates the top 25% fastest genes, which were
removed for subsequent phylogenetic analyses.
(PDF)
Figure S3 Permutation test results for the predictiveability of discriminant function analysis (DFA). Permuta-
tion results are compared to random expectations regarding A)
lissamphibian relationships and B) the phylogenetic position of
turtles. Preferred lissamphibian relationships were permuted
among sites (1,000 replicates). Values on the x-axis are the
posterior/prior ratio for the preferred topology averaged across all
sites for each replicate. The arrow indicates the empirical value,
which falls far outside the null distribution.
(PDF)
Table S1 Test of discriminant function analysis (DFA)filtering method on simulated data.
(DOCX)
Table S2 Test of discriminant function analysis filter-ing method on empirical example.
(DOCX)
Table S3 Predictive power of discriminant functionanalyses (DFA) for alternative hypotheses.
(DOCX)
Table S4 Phylogenetic results from filtered datasets.
(DOCX)
Table S5 List of Taxa and Genbank numbers.
(XLS)
Acknowledgments
This work represents the partial fulfillment of the degree of Doctor of
Philosophy for JJF. We would like to thank Drs. Carol Spencer and Jim
McGuire, Jerome Fuchs, Chris Witt, Ricardo Pereira, and Adam Leache
for sample collection and/or tissue loans. Drs. Alexandros Stamatakis, Nick
Pattengale, and Matt Brandley were invaluable in help with phylogenetic
analyses. We would like to thank Jim McGuire, Jeff Boore, Richard
Harland, Adam Leache, Bryan Stuart, Guin Wogan, Shobi Lawalata, Tom
Devitt, Sarah Werning, Alison Davis, Sean Reilly, and Dan Portik helpful
discussions and revisions of this manuscript. Also, the comments of two
anonymous reviewers also helped in improving this manuscript. Lastly, this
work would not have been possible without the online computing resources
provided by Cyberinfrastructure for Phylogenetic Research (CIPRES).
Author Contributions
Conceived and designed the experiments: JJF MKF. Performed the
experiments: JJF MKF. Analyzed the data: JJF MKF JMB BB.
Contributed reagents/materials/analysis tools: JMB BB. Wrote the paper:
JJF MKF JMB BB.
References
1. Darwin C (1859) On the origin of species. London: John Murray. 502p.
2. Yates TL, Salazar-Bravo J, Dragoo JW (2004) The importance of the tree of life
to society. In: Cracraft J, Donoghue MJ, editors. Assembling the tree of life. New
York: Oxford University Press. 7–17.
3. Benton MJ (1990) Phylogeny of the major tetrapod groups: morphological data
and divergence dates. J Mol Evol 30: 409–424.
4. Meyer A, Zardoya R (2003) Recent advances in the (molecular) phylogeny of
vertebrates. Annu Rev Ecol Evol and Syst 34: 311–338.
5. Thomson RC, Shaffer HB (2010) Rapid progress on the vertebrate tree of life.
BMC Biol 8: 19.
Phylogenomics of the Vertebrate Phylogeny
PLOS ONE | www.plosone.org 12 November 2012 | Volume 7 | Issue 11 | e48990

6. Gaffney ES (1980) Phylogenetic relationships of the major groups of amniotes.
In: Panchen AL, editor. The terrestrial environment and the origin of land
vertebrates. New York: Academic Press. 593–610.
7. Lyson TR et al. (2011). MicroRNAs support a turtle + lizard clade. Biol Lett 8:
104–107.
8. Crawford NG, Faircloth BC, McCormack JE, Brumfield RT, Winker K, et al.
(2012) More than 1000 ultraconserved elements provide evidence that turtles are
the sister group of archosaurs. Biol Lett. doi:10.1098/rsbl.2012.0331.
9. Chiari Y, Cahais V, Galtier N, Delsuc F (2012) Phylogenomic analyses support
the position of turtles as the sister group of birds and crocodiles (Archosauria).
BMC Biol 10: 65.
10. Parsons TS, Williams EE (1963) The relationship of the modern Amphibia: a re-
examination. Q Rev Biol 38: 26–53.
11. Carroll RL (2009) The Rise of Amphibians. Baltimore: The Johns Hopkins
University Press. 360p.
12. Carroll RL (2001) The origin and early radiation of terrestrial vertebrates.
J Palaeontol 75: 1202–1213.
13. Cannatella DC, Vieites DR, Zhang P, Wake MH, Wake DB (2009) Amphibians
(Lissamphibia). In: Hedges SB, Kumar S, editors. The timetree of life. New
York: Oxford University Press. 353–356.
14. Vallin G, Laurin M (2004) Cranial morphology and affinities of Microbrachis,
and a reappraisal of the phylogeny and lifestyle of the first amphibians. J Vert
Paleontol 24: 56–72.
15. Hedges SB, Maxson LR (1993) A molecular perspective on lissamphibian
phylogeny. Herpetol Monogr 7: 27–42.
16. Feller AE, Hedges SB (1998) Molecular evidence for the early history of living
amphibians. Mol Phylogenet Evol 9: 509–516.
17. Milner AR (1993) The Paleozoic relatives of lissamphibians. Herpetol Monogr 6:
8–27.
18. Trueb L, Cloutier R (1991) Toward an understanding of the amphibians: two
centuries of systematic history. In: Schultze H-P, Trueb L, editors. Origins of the
higher groups of tetrapods: controversy and consensus. Ithaca: Cornell
University Press. 233–313.
19. Ruta M, Coates MI, Quicke DLJ (2003) Early tetrapod relationships revisited.
Biol Rev 78: 251–345.
20. Zardoya R, Meyer A (2001) On the origin and phylogenetic relationships among
living amphibians. Proc Natl Acad Sci USA 98: 7380–7383.
21. Hugall AF, Foster R, Lee MSY (2007) Calibration choice, rate smoothing, and
the pattern of tetrapod diversification according to the long nuclear gene RAG-
1. Syst Biol 56: 543–563.
22. Roleants K et al. (2007) Global patterns of diversification in the history of
modern amphibians. Proc Natl Acad Sci USA 104: 887–892.
23. San Mauro D, Vences M, Alcobendas M, Zardoya R, Meyer A (2005) Initial
diversification of living amphibians predated the breakup of Pangaea. Am Nat
165: 590–599.
24. San Mauro D (2010) A multilocus timescale for the origin of extant amphibians.
Mol Phylogenet Evol 56: 554–561.
25. Anderson JS, Reisz RR, Scott D, Frobisch NB, Sumida SS (2008) A stem
batrachian from the Early Permian of Texas and the origin of frogs and
salamanders. Nature 453: 515–518.
26. Anderson JS (2008) Focal review: the origin(s) of modern amphibians. Evol Biol
35: 231–247.
27. Carroll RL (2007) The Palaeozoic ancestry of salamanders, frogs, and caecilians.
Zool J Linn Soc 150 (suppl. 1): 1–142.
28. Carroll RL, Holmes R (1980) The skull and jaw musculature as guides to the
ancestry of salamanders. Zool J Linn Soc 68: 1–40.
29. Carroll RL, Boisvert C, Bolt J, Green DM, Philip N, et al. (2004) Changing
patterns of ontogeny from osteopiform fish through Permian tetrapods as a guide
to the early evolution of land vertebrates. In: Arratia G, Wilson MHV, Coutier
R, editors. Recent advances in the origin and early radiation of vertebrates.
Munchen: Verlag Dr. Friedrich Pfeil, Munchen. 321–343.
30. Li C, Wu X, Rieppel O, Wang L, Zhao L (2008) An ancestral turtle from the
Late Triassic of southwestern China. Nature 456: 497–501.
31. Philippe H, Brinkmann H, Lavrov DV, Littlewood TJ, Manuel M, et al. (2011)
Solving difficult phylogenetic questions: why more sequences are not enough.
PLoS Biol 9: e1000602.
32. Jeffroy O, Brinkmann H, Delsuc F, Philippe H (2006) Phylogenomics: the
beginning of incongruence? Trends Genet 22: 225–231.
33. Pattengale ND, Swenson KM, Moret BME (2010) Uncovering hidden
phylogenetic consensus. Bioinformat Res Appl 6053: 128–139.
34. Meyer A (1994) Shortcomings of the cytochrome b gene as a molecular marker.
T Ecol Evol 9: 278–280.
35. Simon C, Buckley TR, Frati F, Stewart JB, Beckenbach AT (1994) Evolution,
weighting, and phylogenetic utility of mitochondrial gene sequences and
a compilation of conserved polymerase chain reaction primers. Ann Entomol
Soc Am 87: 651–701.
36. Edwards SV, Arctander P, Wilson AC (1991) Mitochondrial resolution of a deep
branch in the genealogical tree for perching birds. Proc R Soc Lond B 243: 99–
107.
37. Blouin MS, Yowell CA, Courtnely CH, Dame JB (1998) Substitution bias, rapid
saturation, and the use of mtDNA for nematode systematics. Mol Biol Evol 15:
1719–1727.
38. Regier JC, Schultz JW, Zwick A, Hussey A, Ball B, et al. (2010) Arthropodrelationships revealed by phylogenomic analysis of nuclear protein-coding
sequences. Nature 463: 1079–1083.
39. Brinkmann H, Philippe H (1999) Archaea sister group of bacteria? Indications
from tree reconstruction artifacts in ancient phylogenies. Mol Biol Evol 16: 817–825.
40. Philippe H, Lartillot N, Brinkmann H (2005) Multigene analyses of bilateriananimals corroborate the monophyly of Ecdysozoa, Lophotrochozoa, and
Protostomia. Mol Biol Evol 22: 1246–1253.
41. Fong JJ, Fujita MK (2011) Evaluating phylogenetic informativeness and data-
type usage for new protein-coding genes across Vertebrata. Mol Phylogenet Evol61: 300–307.
42. Edwards SV, Liu L, Pearl DK (2007) High-resolution species trees without
concatenation. Proc Natl Acad Sci USA 104: 5936–5941.
43. Cranston KA, Hurwitz B, Ware D, Stein L, Wing RA (2009) Species trees from
highly incongruent gene trees in rice. Syst Biol 58: 489–500.
44. Shimodaira H (2002) An approximately unbiased test of phylogenetic tree
selection. Syst Biol 51: 492–508.
45. Rodriguez-Ezpeleta N, Brinkmann H, Roure B, Lartillot N, Lang BF, et al.
(2007) Detecting and overcoming systematic errors in genome-scale phylogenies.Syst Biol 56: 389–399.
46. Lemmon AR, Brown JM, Stanger-Hall K, Lemmon EM (2009) The effect of
ambiguous data on phylogenetic estimates obtained by maximum likelihood and
Bayesian inference. Syst Biol 58: 130–145.
47. Wolf YI, Rogozin IB, Koonin EV (2003) Coelomata and not Ecdysozoa:
evidence from genome-wide phylogenetic analysis. Genome Res 14: 29–36.
48. Aguinaldo AM, Tubeville JM, Linford LS, Rivera MC, Raff RA, et al. (1997)Evidence for a clade of nematodes, arthropods and other moulting animals.
Nature 387: 489–493.
49. Telford MJ, Bourlat SJ, Economou A, Papillon D, Rota-Stabelli O (2008) The
evolution of the Ecdysozoa. Phil Trans R Soc B 363: 1529–1537.
50. Gauthier J, Padian K (1985) Phylogenetic, functional, and aerodynamic analyses
of the origin of birds and their flight. In: Hecht JH, Ostrom GV, Wellnhofer P,editors. The beginnings of birds. Eichstatt: Freunde des Jura-Museum. 185–197.
51. Bhullar B-A, Bever GS (2009) An archosaur-like laterosphenoid in early turtles(Reptilia: Pantestudines). Breviora 518: 1–11.
52. Laurin M, Reisz R (1995) A reevaluation of early amniote phylogeny. Zool J Linn
Soc 113: 165–223.
53. Lee MSY (1995) Historical burden in systematics and the interrelationships of
‘parareptiles’. Biol Rev 70: 459–547.
54. Lee MSY (1996) Correlated progression and the origin of turtles. Nature 379:
812–815.
55. Nagashima H, Sugahara F, Takechi M, Ericsson R, Kawashima-Ohya Y, et al.
(2009) Evolution of the turtle body plan by the folding and creation of newmuscle connections. Science 325: 193–196.
56. Yates AM, Warren A (2000) The phylogeny of ‘higher’ temnospondyls(Vertebrata: Choanata) and its implications for the monophyly and origins of
the Stereospondyli. Zool J Linn Soc 128: 77–121.
57. Hedges SB, Poling LL (1999) A molecular phylogeny of reptiles. Science 283:
998–1001.
58. Hubbard TJP, Aken BL, Ayling S, Ballester B, Beal K, et al. (2009) Ensembl2009. Nucleic Acids Res 37: D690–D697.
59. Stamatakis A (2006) RAxML-VI-HPC: maximum likelihood-based phylogeneticanalyses with thousands of taxa and mixed models. Bioinformatics 22: 2688–
2690.
60. Edgar RC (2004) MUSCLE: multiple sequence alignment with high accuracy
and high throughput. Nucleic Acids Res 32: 1792–1797.
61. Maddison DR, Maddison WP (2005) MacClade 4: Analysis of phylogeny and
character evolution. Version 4.08a. http://macclade.org.
62. R Development Core Team (2011). R: a language and environment forstatistical computing. R Foundation for Statistical Computing, Vienna, Austria.
ISBN 3-900051-07-0. URL: http://www.R-project.org/.
63. Ronquist F, Huelsenbeck JP (2003) MrBayes 3: Bayesian phylogenetic inference
under mixed models. Bioinformatics 19: 1572–1574.
64. Abascal F, Zardoya R, Posada D (2005) ProtTest: Selection of best-fit models of
protein evolution. Bioinformatics 21: 2104–2105.
65. Stamatakis A, Hoover P, Rougemont J (2008) A rapid bootstrap algorithm for
the RAxML web-servers. Syst Biol 75: 758–771.
66. Miller MA, Holder MT, Vos R, Midford PE, Liebowitz T, et al. (2009) The
CIPRES Portals. CIPRES. 2009-08-04. URL: http://www.phylo.org/sub_sections/portal. Accessed: 2009-08-04. (Archived by WebCite(r) at http://www.
webcitation.org/5imQlJeQa).
67. Nylander JAA (2004) MrModeltest 2.3. Program distributed by the author.
Evolutionary Biology Centre, Uppsala University.
68. Wilgenbusch JC, Warren DL, Swofford DL (2004) AWTY: A system forgraphical exploration of MCMC convergence in Bayesian phylogenetic
inference. http://ceb.csit.fsu.edu/awty.
69. Shimodaira H, Hasegawa M (2001) CONSEL: for assessing the confidence of
phylogenetic tree selection. Bioinformatics 17: 1246–1247.
70. Charif D, Lobry JR (2007) SeqinR 1.0–2: a contributed package to the R project
for statistical computing devoted to biological sequences retrieval and analysis.In: Bastolla U, Porto M, Roman HE, Vendruscolo M, editors. Structural
approaches to sequence evolution: molecules, networks, populations. Springer
Verlag, New York. 207–232.
Phylogenomics of the Vertebrate Phylogeny
PLOS ONE | www.plosone.org 13 November 2012 | Volume 7 | Issue 11 | e48990

71. Venables WN, Ripley BD (2002) Modern applied statistics with S, 4th edition.
New York: Springer. 512p.72. Pond SLK, Frost SDW, Muse SV (2005) HyPhy: hypothesis testing using
phylogenies. Bioinformatics 21: 676–679.
73. Dutheil J, Boussau B (2008) Non-homogeneous models of sequence evolution in
the Bio++ suite of libraries and programs. BMC Evol Biol. 8: 255.
Phylogenomics of the Vertebrate Phylogeny
PLOS ONE | www.plosone.org 14 November 2012 | Volume 7 | Issue 11 | e48990