A local regulatory network around three NAC transcriptionfactors in stress responses and senescence in Arabidopsisleaves
Richard Hickman1,†,‡, Claire Hill2,†, Christopher A. Penfold1, Emily Breeze1,2, Laura Bowden2,§, Jonathan D. Moore1,
Peijun Zhang2, Alison Jackson2, Emma Cooke3, Findlay Bewicke-Copley2, Andrew Mead2, Jim Beynon1,2, David L. Wild1,
Katherine J. Denby1,2, Sascha Ott1 and Vicky Buchanan-Wollaston1,2,*1Warwick Systems Biology Centre, University of Warwick, Coventry CV4 7AL, UK,2School of Life Sciences, University of Warwick, Coventry CV4 7AL, UK, and3Molecular Organisation and Assembly of Cells Doctoral Training Centre, University of Warwick, Coventry CV4 7AL, UK
Received 14 February 2013; revised 26 March 2013; accepted 28 March 2013; published online 11 April 2013.
*For correspondence (e-mail [email protected]).†These authors contributed equally.‡Present address: Department of Biology, Faculty of Science, Utrecht University, PO Box 800.56, 3508 TB Utrecht, The Netherlands.§Present address: Science and Advice for Scottish Agriculture (SASA), Roddinglaw Road, Edinburgh EH12 9FJ, UK.
SUMMARY
A model is presented describing the gene regulatory network surrounding three similar NAC transcription
factors that have roles in Arabidopsis leaf senescence and stress responses. ANAC019, ANAC055 and
ANAC072 belong to the same clade of NAC domain genes and have overlapping expression patterns. A
combination of promoter DNA/protein interactions identified using yeast 1-hybrid analysis and modelling
using gene expression time course data has been applied to predict the regulatory network upstream of
these genes. Similarities and divergence in regulation during a variety of stress responses are predicted by
different combinations of upstream transcription factors binding and also by the modelling. Mutant analysis
with potential upstream genes was used to test and confirm some of the predicted interactions. Gene
expression analysis in mutants of ANAC019 and ANAC055 at different times during leaf senescence has
revealed a distinctly different role for each of these genes. Yeast 1-hybrid analysis is shown to be a valuable
tool that can distinguish clades of binding proteins and be used to test and quantify protein binding to pre-
dicted promoter motifs.
Keywords: Arabidopsis thaliana, Botrytis cinerea, NAC transcription factors, gene regulatory network,
senescence, stress.
INTRODUCTION
As plants are sessile organisms, constant exposure to bio-
tic and abiotic stresses has driven evolution of ever more
complex mechanisms to defend against attack from other
organisms and to deal with environmental perturbations.
Elicitation of these stress responses requires signal percep-
tion, signal transduction and large-scale gene expression
changes. Although some gene expression may be specific
to each stress there is often a large overlap between stres-
ses, suggesting that common features are likely to be
involved (e.g. Kilian et al., 2007).
Genetic studies have highlighted the important role of
the plant-specific NAC (NAM/ATAF1, 2/CUC2) family of tran-
scription factors (TFs) in the regulation of stress responses
(reviewed in Puranik et al., 2012). NAC proteins share a
conserved N-terminal NAC domain and form one of the
largest plant TF families with over 100 members encoded in
the Arabidopsis genome (Ooka et al., 2003). NAC TFs have
been implicated functionally in a variety of stress-related
programs such as the response to drought, high-salinity,
bacterial pathogens, fungal pathogens and senescence
(Fujita et al., 2004; Tran et al., 2004; Guo and Gan, 2006; Hu
et al., 2006; Balazadeh et al., 2010). Many members of the
NAC family have overlapping expression patterns and are
induced by several stresses, a situation that suggests com-
mon roles and regulation in multiple stress responses
(Balazadeh et al., 2010; Nakashima et al., 2012).
Three members of the NAC family that have been impli-
cated in overlapping stress responses are ANAC019,
© 2013 The AuthorsThe Plant Journal © 2013 John Wiley & Sons Ltd
26
The Plant Journal (2013) 75, 26–39 doi: 10.1111/tpj.12194
ANAC055 and ANAC072. These TFs form part of a closely
related clade of stress-related NAC proteins of the SNAC-A
class as defined recently in Nakashima et al. (2012) or
group III-3 as defined in Jensen et al. (2010). There is evi-
dence that these three genes have overlapping functions,
but that they may also act individually in different stress
responses. Tran et al. (2004) have shown that overexpres-
sion of any of the three genes results in increased drought
tolerance, that all were induced in expression following
salt stress, abscisic acid (ABA) or jasmonic acid (JA) treat-
ment and that all three proteins could bind the promoter of
the drought-inducible ERD1 gene. However, ANAC072
(RD26) has been shown to have a role in cold and desicca-
tion stress in addition to a central role in ABA signalling
(Fujita et al., 2004), while ANAC019 and ANAC055 are
implicated in JA and/or ethylene signalling following path-
ogen infection (Bu et al., 2008).
The elucidation of the individual roles and regulatory
pathways for these NACs is complicated by their overlap-
ping activities, but here we present a dual approach to
address this question and to identify common and distin-
guishing factors that lie upstream and downstream of
ANAC019, ANAC055 and ANAC072 in stress-specific gene
regulatory networks (GRNs). A key mechanism in the regu-
lation of differential gene expression is through the
sequence-specific binding of TFs to DNA motifs present in
the promoters of targets. The physical interactions
between these trans- and cis-acting factors and the nature
of their expression-controlling activity form the basis of
GRNs that tightly coordinate the spatiotemporal expres-
sion of gene products that are responsible for stress toler-
ance at the biochemical and physiological level.
High-throughput yeast 1-hybrid (Y1H) assays are becoming
an increasingly popular ‘gene-centred’ approach for delin-
eating GRNs in Arabidopsis (Mitsuda et al., 2010; Brady
et al., 2011; Castrillo et al., 2011; Ou et al., 2011). We used
Y1H to identify TFs that interact with the promoters of
ANAC019, ANAC055 and ANAC072 and, by modelling
expression patterns of these potential regulators, excellent
candidates for direct upstream regulation in different stress
responses were predicted. We complemented this
approach with microarray analysis of these potential
upstream regulators to test the model predictions and also
investigated the consequences of knockout mutants of the
NAC genes to reveal genes that lie downstream in the
GRN in senescence.
RESULTS
Y1H assays identify TFs that interact with ANAC019,
ANAC055 and ANAC072 promoters
The Y1H technique was used to identify TFs capable of inter-
acting physically with the promoters of ANAC019, ANAC055
and ANAC072. Distal effects on transcription in yeast were
minimised using a ‘promoter-hiking’ (Pruneda-Paz et al.,
2009) approach with a series of overlapping promoter
sequences of approximately 400 bp and that spanned
800–1200 bp upstream of the predicted transcription start
site (TSS). These promoter fragments were used as bait
against an Arabidopsis TF library (Castrillo et al., 2011) that
was comprised of approximately 1500 Arabidopsis TFs. All
interactions were verified pairwise with each fragment–TF
pair.
The Y1H assays identified many TFs that were capable
of binding to the promoters of ANAC019, ANAC055 and
ANAC072 respectively: a total of 71 interactions between
TFs and all bait fragments (Table 1). The interacting TFs
comprised members of several TF families including bZIP,
bHLH, MYB, AP2/ERF and homeodomain and are all
expressed above background in green and/or stressed leaf
tissues [based on internal gene expression data and/or eFP
Browser analysis (Winter et al., 2007)]. In silico analysis of
each fragment sequence revealed the presence of putative
binding sites for all the interacting TFs identified (Figures
S1, S2 and S3).
Analysis of the biological processes associated with the
interacting TFs using gene ontology (GO) classifications
revealed significant enrichment for TFs associated with
‘response to hormone stimulus’ and ‘response to ABA’.
Expression of all three NAC TFs is induced by ABA (Tran
et al., 2004) and thus targeting by TFs that are known to
mediate ABA signalling would be expected. Indeed, the
key ABA-related TFs ABF3 and ABF4, which recognise the
ABA-responsive element (ABRE) (Yoshida et al., 2010),
were found to bind to all three promoters (Table 1). ABRE
occurs multiple times within each NAC promoter fragment
(Figures S1, S2 and S3) and recent motif analysis revealed
two ABRE-like motifs in the promoter of ANAC019 that
were sufficient to drive expression in response to stress
(Zou et al., 2011). The promoter fragments of ANAC019
and ANAC055 also interact with another key mediator of
ABA expression, ABI4 (Table 1), an AP2 family TF whose
predicted binding motif (Niu et al., 2002) is present in the
promoters of these genes (Figures S1 and S2).
Members of a MYB TF family group, MYB2, MYB21,
MYB108, MYB112 and MYB116, bound to the promoters of
all three NAC genes (Table 1). An example of these interac-
tions is shown in Figure 1(a) and demonstrates the interac-
tion of overlapping fragments of the ANAC055 promoter
(ANAC055_F3 and ANAC055_F4) with these five MYB TFs.
Consistent with this observation is the presence of a MYB
binding motif (TRANSFAC ID: M00218, Solano et al., 1995)
in the overlapping region of these two fragments
(Figure 1b). The five MYB TFs form part of a phylogenetic
clade within the MYB family, based on the similarity of the
DNA- binding domain (Stracke et al., 2001). Interestingly
MYB21, the least related within this group, shows a weaker
interaction (i.e. less growth) with the NAC promoters
© 2013 The AuthorsThe Plant Journal © 2013 John Wiley & Sons Ltd, The Plant Journal, (2013), 75, 26–39
Local networks around stress-related NAC genes 27
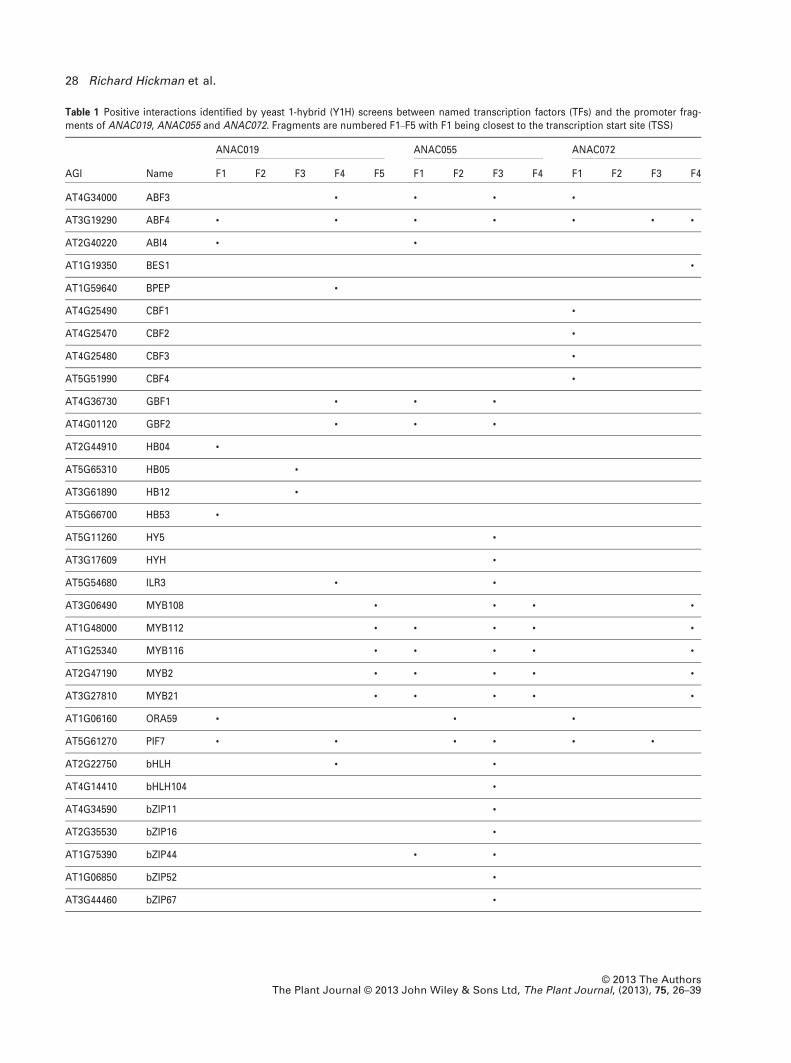
Table 1 Positive interactions identified by yeast 1-hybrid (Y1H) screens between named transcription factors (TFs) and the promoter frag-ments of ANAC019, ANAC055 and ANAC072. Fragments are numbered F1–F5 with F1 being closest to the transcription start site (TSS)
AGI Name
ANAC019 ANAC055 ANAC072
F1 F2 F3 F4 F5 F1 F2 F3 F4 F1 F2 F3 F4
AT4G34000 ABF3 • • • •
AT3G19290 ABF4 • • • • • • •
AT2G40220 ABI4 • •
AT1G19350 BES1 •
AT1G59640 BPEP •
AT4G25490 CBF1 •
AT4G25470 CBF2 •
AT4G25480 CBF3 •
AT5G51990 CBF4 •
AT4G36730 GBF1 • • •
AT4G01120 GBF2 • • •
AT2G44910 HB04 •
AT5G65310 HB05 •
AT3G61890 HB12 •
AT5G66700 HB53 •
AT5G11260 HY5 •
AT3G17609 HYH •
AT5G54680 ILR3 • •
AT3G06490 MYB108 • • • •
AT1G48000 MYB112 • • • • •
AT1G25340 MYB116 • • • • •
AT2G47190 MYB2 • • • • •
AT3G27810 MYB21 • • • • •
AT1G06160 ORA59 • • •
AT5G61270 PIF7 • • • • • •
AT2G22750 bHLH • •
AT4G14410 bHLH104 •
AT4G34590 bZIP11 •
AT2G35530 bZIP16 •
AT1G75390 bZIP44 • •
AT1G06850 bZIP52 •
AT3G44460 bZIP67 •
© 2013 The AuthorsThe Plant Journal © 2013 John Wiley & Sons Ltd, The Plant Journal, (2013), 75, 26–39
28 Richard Hickman et al.
(Figure 1a). Members of this MYB subgroup are implicated
in regulating the same stress responses as the NAC TFs.
MYB2 is involved in the ABA-mediated regulation of salt
and drought-responsive genes (Abe et al., 2003), whilst
MYB108 is induced in response to ABA, JA and ethylene
and is involved in regulating the response to infection by
B. cinerea and other pathogens (Mengiste et al., 2003;
Mandaokar and Browse, 2009). The observation that only
these related members of the MYB family demonstrate
positive interactions with the three NAC promoters
suggests that this binding occurs in a selective, sequence--
specific manner.
In contrast to the common interactions of ABA-related
and MYB family TFs with all three NAC promoters, binding
of four highly related proteins, CBF1 (C-repeat/dehydration
responsive element (DRE) Binding Factor 1) CBF2, CBF3
and CBF4, was detected to the ANAC072 promoter only
(Figure 2a). The CBFs bind via the DRE, which has the
consensus (A/G)CCGAC (Sakuma et al., 2002) and is present
in the interacting promoter fragment (Figure 2b). To
confirm that CBF1–CBF4 are interacting via the DRE motif,
mutational analysis was performed and the protein/DNA
interactions were quantified. Firstly the DRE motif was
completely replaced with the sequence TTTTT (Figure 3a –
M1). This replacement resulted in the abolition of the inter-
action between the ANAC072 promoter fragment 1 and all
four of the CBFs (Figure 3c). Hao et al. (2002) showed that
the core DRE was CCGAC by testing the effect on CBF1
binding of mutating the nucleotides at either end of this
motif. As this study identified only the boundaries of the
DRE motif, mutation of the central nucleotide (CCGAC) was
(a)
(b)
Figure 1. Related MYB transcription factors (TFs) bind to the promoter of
ANAC055.
(a) Interactions between MYB TFs and ANAC055 promoter fragments 3 and
4 linked to the HIS3 reporter gene were transformed into yeast with plas-
mids carrying an Activation Domain (AD)-MYBTF translational fusion or the
control plasmid expressing AD alone. Growth was assessed in the presence
of increasing 3-amino-1,2,4-triazol (3AT) concentrations.
(b) The ANAC055 promoter indicating the putative MYB binding site high-
lighted in bold (TRANSFAC ID: M00218, Solano et al., 1995) in the overlap-
ping region of fragments 3 and 4.
(a)
(b)
Figure 2. The C-repeat/dehydration-responsive element (DRE) binding fac-
tor genes (CBF1–CBF4) bind to the promoter of ANAC072.
(a) Interactions between CBF1-CBF4 and fragment 1 of the ANAC072 pro-
moter (ANAC072_F1) were confirmed by transforming yeast that carried the
HIS3 reporter gene under the control of ANAC072_F1 with plasmids that
expressed the AD-CBF fusion proteins or a control plasmid that expressed
AD alone and by assessing growth on media that lacked histidine.
(b) The DRE motif (consensus (A/G)CCGAC, bold text) in the ANAC072 pro-
moter on the reverse strand reading 5′ to 3′.
© 2013 The AuthorsThe Plant Journal © 2013 John Wiley & Sons Ltd, The Plant Journal, (2013), 75, 26–39
Local networks around stress-related NAC genes 29
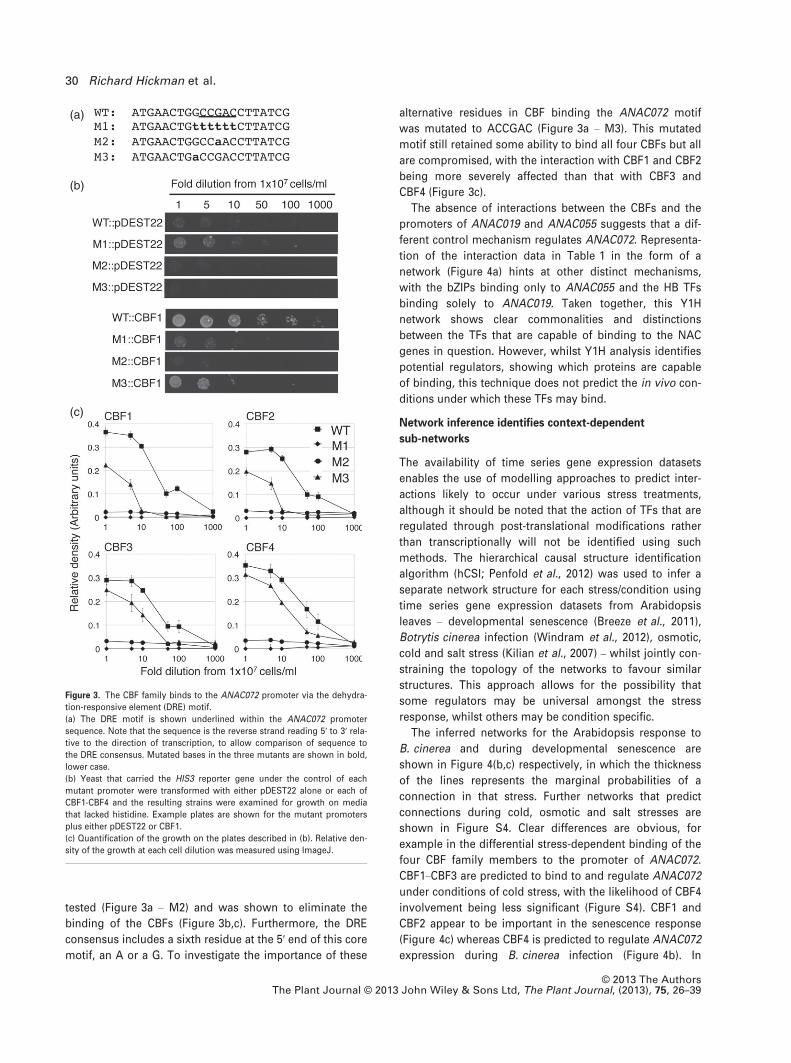
tested (Figure 3a – M2) and was shown to eliminate the
binding of the CBFs (Figure 3b,c). Furthermore, the DRE
consensus includes a sixth residue at the 5′ end of this core
motif, an A or a G. To investigate the importance of these
alternative residues in CBF binding the ANAC072 motif
was mutated to ACCGAC (Figure 3a – M3). This mutated
motif still retained some ability to bind all four CBFs but all
are compromised, with the interaction with CBF1 and CBF2
being more severely affected than that with CBF3 and
CBF4 (Figure 3c).
The absence of interactions between the CBFs and the
promoters of ANAC019 and ANAC055 suggests that a dif-
ferent control mechanism regulates ANAC072. Representa-
tion of the interaction data in Table 1 in the form of a
network (Figure 4a) hints at other distinct mechanisms,
with the bZIPs binding only to ANAC055 and the HB TFs
binding solely to ANAC019. Taken together, this Y1H
network shows clear commonalities and distinctions
between the TFs that are capable of binding to the NAC
genes in question. However, whilst Y1H analysis identifies
potential regulators, showing which proteins are capable
of binding, this technique does not predict the in vivo con-
ditions under which these TFs may bind.
Network inference identifies context-dependent
sub-networks
The availability of time series gene expression datasets
enables the use of modelling approaches to predict inter-
actions likely to occur under various stress treatments,
although it should be noted that the action of TFs that are
regulated through post-translational modifications rather
than transcriptionally will not be identified using such
methods. The hierarchical causal structure identification
algorithm (hCSI; Penfold et al., 2012) was used to infer a
separate network structure for each stress/condition using
time series gene expression datasets from Arabidopsis
leaves – developmental senescence (Breeze et al., 2011),
Botrytis cinerea infection (Windram et al., 2012), osmotic,
cold and salt stress (Kilian et al., 2007) – whilst jointly con-
straining the topology of the networks to favour similar
structures. This approach allows for the possibility that
some regulators may be universal amongst the stress
response, whilst others may be condition specific.
The inferred networks for the Arabidopsis response to
B. cinerea and during developmental senescence are
shown in Figure 4(b,c) respectively, in which the thickness
of the lines represents the marginal probabilities of a
connection in that stress. Further networks that predict
connections during cold, osmotic and salt stresses are
shown in Figure S4. Clear differences are obvious, for
example in the differential stress-dependent binding of the
four CBF family members to the promoter of ANAC072.
CBF1–CBF3 are predicted to bind to and regulate ANAC072
under conditions of cold stress, with the likelihood of CBF4
involvement being less significant (Figure S4). CBF1 and
CBF2 appear to be important in the senescence response
(Figure 4c) whereas CBF4 is predicted to regulate ANAC072
expression during B. cinerea infection (Figure 4b). In
(a)
(b)
(c)
Figure 3. The CBF family binds to the ANAC072 promoter via the dehydra-
tion-responsive element (DRE) motif.
(a) The DRE motif is shown underlined within the ANAC072 promoter
sequence. Note that the sequence is the reverse strand reading 5′ to 3′ rela-tive to the direction of transcription, to allow comparison of sequence to
the DRE consensus. Mutated bases in the three mutants are shown in bold,
lower case.
(b) Yeast that carried the HIS3 reporter gene under the control of each
mutant promoter were transformed with either pDEST22 alone or each of
CBF1-CBF4 and the resulting strains were examined for growth on media
that lacked histidine. Example plates are shown for the mutant promoters
plus either pDEST22 or CBF1.
(c) Quantification of the growth on the plates described in (b). Relative den-
sity of the growth at each cell dilution was measured using ImageJ.
© 2013 The AuthorsThe Plant Journal © 2013 John Wiley & Sons Ltd, The Plant Journal, (2013), 75, 26–39
30 Richard Hickman et al.
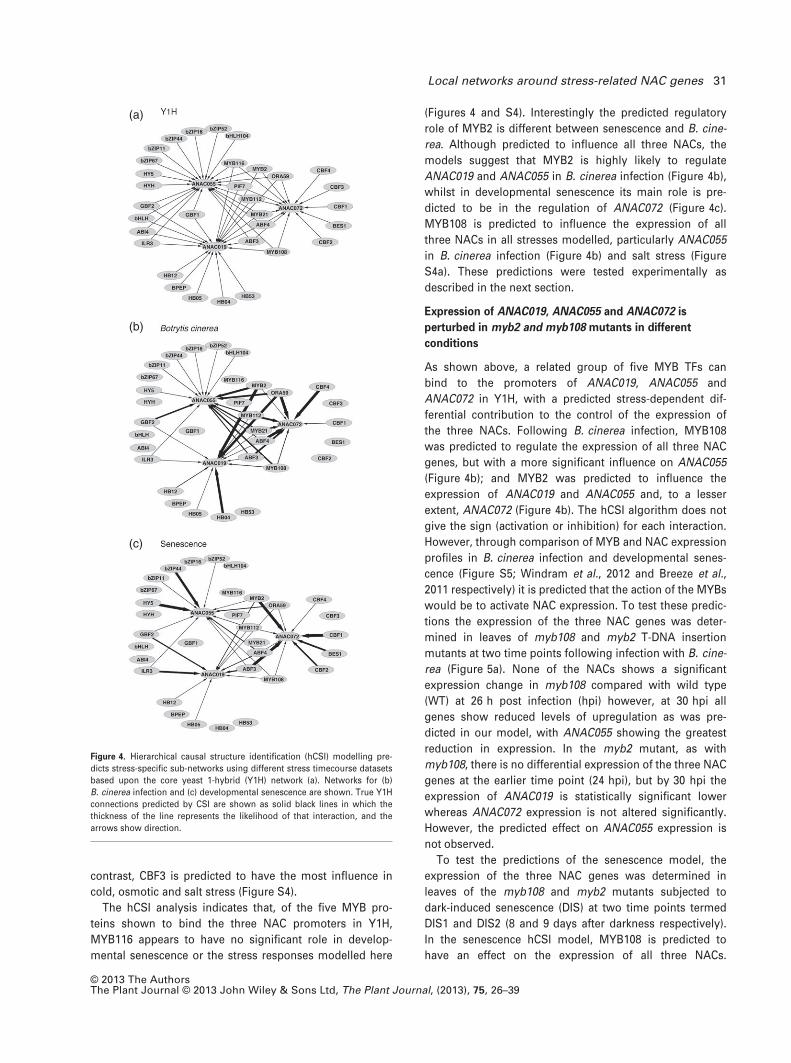
contrast, CBF3 is predicted to have the most influence in
cold, osmotic and salt stress (Figure S4).
The hCSI analysis indicates that, of the five MYB pro-
teins shown to bind the three NAC promoters in Y1H,
MYB116 appears to have no significant role in develop-
mental senescence or the stress responses modelled here
(Figures 4 and S4). Interestingly the predicted regulatory
role of MYB2 is different between senescence and B. cine-
rea. Although predicted to influence all three NACs, the
models suggest that MYB2 is highly likely to regulate
ANAC019 and ANAC055 in B. cinerea infection (Figure 4b),
whilst in developmental senescence its main role is pre-
dicted to be in the regulation of ANAC072 (Figure 4c).
MYB108 is predicted to influence the expression of all
three NACs in all stresses modelled, particularly ANAC055
in B. cinerea infection (Figure 4b) and salt stress (Figure
S4a). These predictions were tested experimentally as
described in the next section.
Expression of ANAC019, ANAC055 and ANAC072 is
perturbed in myb2 and myb108 mutants in different
conditions
As shown above, a related group of five MYB TFs can
bind to the promoters of ANAC019, ANAC055 and
ANAC072 in Y1H, with a predicted stress-dependent dif-
ferential contribution to the control of the expression of
the three NACs. Following B. cinerea infection, MYB108
was predicted to regulate the expression of all three NAC
genes, but with a more significant influence on ANAC055
(Figure 4b); and MYB2 was predicted to influence the
expression of ANAC019 and ANAC055 and, to a lesser
extent, ANAC072 (Figure 4b). The hCSI algorithm does not
give the sign (activation or inhibition) for each interaction.
However, through comparison of MYB and NAC expression
profiles in B. cinerea infection and developmental senes-
cence (Figure S5; Windram et al., 2012 and Breeze et al.,
2011 respectively) it is predicted that the action of the MYBs
would be to activate NAC expression. To test these predic-
tions the expression of the three NAC genes was deter-
mined in leaves of myb108 and myb2 T-DNA insertion
mutants at two time points following infection with B. cine-
rea (Figure 5a). None of the NACs shows a significant
expression change in myb108 compared with wild type
(WT) at 26 h post infection (hpi) however, at 30 hpi all
genes show reduced levels of upregulation as was pre-
dicted in our model, with ANAC055 showing the greatest
reduction in expression. In the myb2 mutant, as with
myb108, there is no differential expression of the three NAC
genes at the earlier time point (24 hpi), but by 30 hpi the
expression of ANAC019 is statistically significant lower
whereas ANAC072 expression is not altered significantly.
However, the predicted effect on ANAC055 expression is
not observed.
To test the predictions of the senescence model, the
expression of the three NAC genes was determined in
leaves of the myb108 and myb2 mutants subjected to
dark-induced senescence (DIS) at two time points termed
DIS1 and DIS2 (8 and 9 days after darkness respectively).
In the senescence hCSI model, MYB108 is predicted to
have an effect on the expression of all three NACs.
(a)
(b)
(c)
Figure 4. Hierarchical causal structure identification (hCSI) modelling pre-
dicts stress-specific sub-networks using different stress timecourse datasets
based upon the core yeast 1-hybrid (Y1H) network (a). Networks for (b)
B. cinerea infection and (c) developmental senescence are shown. True Y1H
connections predicted by CSI are shown as solid black lines in which the
thickness of the line represents the likelihood of that interaction, and the
arrows show direction.
© 2013 The AuthorsThe Plant Journal © 2013 John Wiley & Sons Ltd, The Plant Journal, (2013), 75, 26–39
Local networks around stress-related NAC genes 31
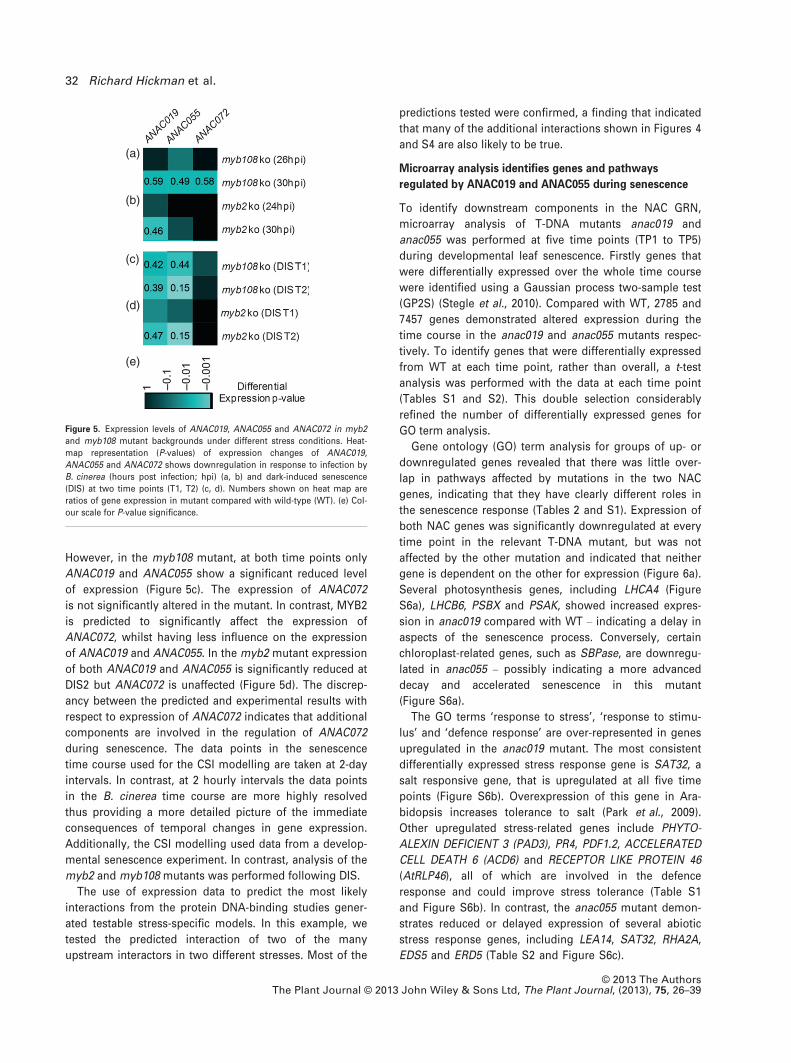
However, in the myb108 mutant, at both time points only
ANAC019 and ANAC055 show a significant reduced level
of expression (Figure 5c). The expression of ANAC072
is not significantly altered in the mutant. In contrast, MYB2
is predicted to significantly affect the expression of
ANAC072, whilst having less influence on the expression
of ANAC019 and ANAC055. In the myb2 mutant expression
of both ANAC019 and ANAC055 is significantly reduced at
DIS2 but ANAC072 is unaffected (Figure 5d). The discrep-
ancy between the predicted and experimental results with
respect to expression of ANAC072 indicates that additional
components are involved in the regulation of ANAC072
during senescence. The data points in the senescence
time course used for the CSI modelling are taken at 2-day
intervals. In contrast, at 2 hourly intervals the data points
in the B. cinerea time course are more highly resolved
thus providing a more detailed picture of the immediate
consequences of temporal changes in gene expression.
Additionally, the CSI modelling used data from a develop-
mental senescence experiment. In contrast, analysis of the
myb2 and myb108 mutants was performed following DIS.
The use of expression data to predict the most likely
interactions from the protein DNA-binding studies gener-
ated testable stress-specific models. In this example, we
tested the predicted interaction of two of the many
upstream interactors in two different stresses. Most of the
predictions tested were confirmed, a finding that indicated
that many of the additional interactions shown in Figures 4
and S4 are also likely to be true.
Microarray analysis identifies genes and pathways
regulated by ANAC019 and ANAC055 during senescence
To identify downstream components in the NAC GRN,
microarray analysis of T-DNA mutants anac019 and
anac055 was performed at five time points (TP1 to TP5)
during developmental leaf senescence. Firstly genes that
were differentially expressed over the whole time course
were identified using a Gaussian process two-sample test
(GP2S) (Stegle et al., 2010). Compared with WT, 2785 and
7457 genes demonstrated altered expression during the
time course in the anac019 and anac055 mutants respec-
tively. To identify genes that were differentially expressed
from WT at each time point, rather than overall, a t-test
analysis was performed with the data at each time point
(Tables S1 and S2). This double selection considerably
refined the number of differentially expressed genes for
GO term analysis.
Gene ontology (GO) term analysis for groups of up- or
downregulated genes revealed that there was little over-
lap in pathways affected by mutations in the two NAC
genes, indicating that they have clearly different roles in
the senescence response (Tables 2 and S1). Expression of
both NAC genes was significantly downregulated at every
time point in the relevant T-DNA mutant, but was not
affected by the other mutation and indicated that neither
gene is dependent on the other for expression (Figure 6a).
Several photosynthesis genes, including LHCA4 (Figure
S6a), LHCB6, PSBX and PSAK, showed increased expres-
sion in anac019 compared with WT – indicating a delay in
aspects of the senescence process. Conversely, certain
chloroplast-related genes, such as SBPase, are downregu-
lated in anac055 – possibly indicating a more advanced
decay and accelerated senescence in this mutant
(Figure S6a).
The GO terms ‘response to stress’, ‘response to stimu-
lus’ and ‘defence response’ are over-represented in genes
upregulated in the anac019 mutant. The most consistent
differentially expressed stress response gene is SAT32, a
salt responsive gene, that is upregulated at all five time
points (Figure S6b). Overexpression of this gene in Ara-
bidopsis increases tolerance to salt (Park et al., 2009).
Other upregulated stress-related genes include PHYTO-
ALEXIN DEFICIENT 3 (PAD3), PR4, PDF1.2, ACCELERATED
CELL DEATH 6 (ACD6) and RECEPTOR LIKE PROTEIN 46
(AtRLP46), all of which are involved in the defence
response and could improve stress tolerance (Table S1
and Figure S6b). In contrast, the anac055 mutant demon-
strates reduced or delayed expression of several abiotic
stress response genes, including LEA14, SAT32, RHA2A,
EDS5 and ERD5 (Table S2 and Figure S6c).
(b)
(c)
(d)
(e)
(a)
Figure 5. Expression levels of ANAC019, ANAC055 and ANAC072 in myb2
and myb108 mutant backgrounds under different stress conditions. Heat-
map representation (P-values) of expression changes of ANAC019,
ANAC055 and ANAC072 shows downregulation in response to infection by
B. cinerea (hours post infection; hpi) (a, b) and dark-induced senescence
(DIS) at two time points (T1, T2) (c, d). Numbers shown on heat map are
ratios of gene expression in mutant compared with wild-type (WT). (e) Col-
our scale for P-value significance.
© 2013 The AuthorsThe Plant Journal © 2013 John Wiley & Sons Ltd, The Plant Journal, (2013), 75, 26–39
32 Richard Hickman et al.
Gene ontology (GO) term analysis indicates that these
two closely related NACs may have reciprocal roles in the
regulation of JA and salicylic acid (SA) signalling.
ANAC055 may be required for normal JA signalling, while
ANAC019 could enhance SA and repress JA signalling.
Enriched GO terms for JA biosynthesis and signalling at
TP1 and 5 in the anac019 mutant are illustrated by
increased expression of JA biosynthesis genes, including
LOX2 and ALLENE OXIDE SYNTHASE (AOS) (Figure S6b),
and JA response genes including PR4 and PDF1.2 (Table
S1). In contrast, reduced expression of JA signalling genes
such as JAZ7 and JAZ10 is observed in the anac055
mutant (Figures 6b and S6c and Table S2). SA signalling
appears to be the dominant pathway in the anac055
mutant with GO term enrichment for this response associ-
ated with upregulated genes at TP1. This is illustrated by
early enhanced expression of genes such as CELL WALL-
ASSOCIATED KINASE (WAK1), usually expressed in
response to SA (Figure S6c) (He et al., 1999), and EDS1,
which is involved in SA-mediated signalling in plant
defence (Feys et al., 2001). This change may result in the
apparent inhibition of the JA pathway in the anac055
mutant. Downregulation of the SA pathway in the anac019
mutant is illustrated by decreased expression of AHBP-1B
(Figure S6b), a transcriptional repressor implicated in SA
signalling (Fan and Dong, 2002).
ANAC019 may act to enhance expression of the flavo-
noid biosynthesis pathway but repress the activity of the
camalexin pathway (possibly as a consequence of the
repression of JA signalling). The flavonoid biosynthesis
pathway is significantly downregulated in the anac019
mutant, including genes such as DFR, LDOX, F3H, TT4 and
TT5, which show reduced expression at TP3 and TP4 in the
mutant when compared with WT (Table S1 and Figure 6c).
In addition, two potential regulatory genes MYB90 and
TT8, both of which are TFs implicated in regulation of
flavonoid biosynthesis (Borevitz et al., 2000; Baudry et al.,
2004), are also downregulated, indicating that these TFs
could be a primary target for ANAC019. Example expres-
sion patterns (for DFR and TT8) in Figure 6(c) show that
the rapid induction of expression of these genes in the WT
is blocked in the mutant, but that expression recovers to
WT levels by TP5, indicating that the lack of this TF can be
compensated for later in senescence.
Genes involved in the synthesis of the antifungal phyto-
alexin camalexin are associated with the GO term ‘indole
biosynthesis’, over-represented in upregulated genes in
the anac019 mutant. These genes include ANTHRANILATE
SYNTHASE ALPHA SUBUNIT 1 (ASA1), PHOSPHORIBOSYL
ANTHRANILATE TRANSFERASE 1, and INDOLE-3-GLYC-
EROL PHOSPHATE SYNTHASE (IGPS), which all function
in the biosynthesis pathway from chorismate to tryptophan
and in addition to PAD3 and CYTOCHROME P450 MONO-
OXYGENASE 79B2 (CYP79B2), which are required for the
production of camalexin from tryptophan (Schuhegger
et al., 2006). The presence of ANAC019 causes a delay in
the early expression of camalexin synthesis genes (see
PAD3 example in Figure S6b); by TP5 the levels of expres-
sion are the same in both mutant and WT.
In the anac055 mutant there is a striking group of genes
with the GO annotation ‘response to chitin’ that show
lower expression than WT at TP2, but that exhibit higher
expression at TP4 and TP5 (illustrated by WRKY53 expres-
sion in Figure 6b). This group contains several TFs, includ-
ing WRKY33, WRKY53, WRKY11 and ERF5, all of which are
enhanced in expression in response to chitin and in
defence responses (Libault et al., 2007). These genes show
a peak in expression at TP2 that is considerably delayed in
Table 2 Enriched gene ontology (GO) terms in groups of genes showing higher or lower expression in the NAC gene knockout mutantscompared with wild-type (WT) at different times during senescence
Days after sowing
anac019 mutant anac055 mutant
Up-regulated Down-regulated Up-regulated Down-regulated
23 Response to stressJA biosynthesisResponse to JA
Response to SAResponse to timulus
29 Response to stimulusCell wall
Response to chitinJA stimulus
31 Indole derivative biosynthesisDefence responsePhotosynthesis
Flavonoid biosynthesisSA signalling
Response to stimulusTransporter activity
Response to stressJA stimulus
33 Chromatin assemblyResponse to biotic stimulusPhotosystem
Flavonoid biosynthesisSA signalling
Response to chitinDefence response
ChloroplastResponse to stress
35 JA biosynthesisResponse to stimulusResponse to JA
Response to chitinResponse to stress
Response to stimulusResponse to stress
JA, jasmonic acid; SA, salicylic acid.
© 2013 The AuthorsThe Plant Journal © 2013 John Wiley & Sons Ltd, The Plant Journal, (2013), 75, 26–39
Local networks around stress-related NAC genes 33
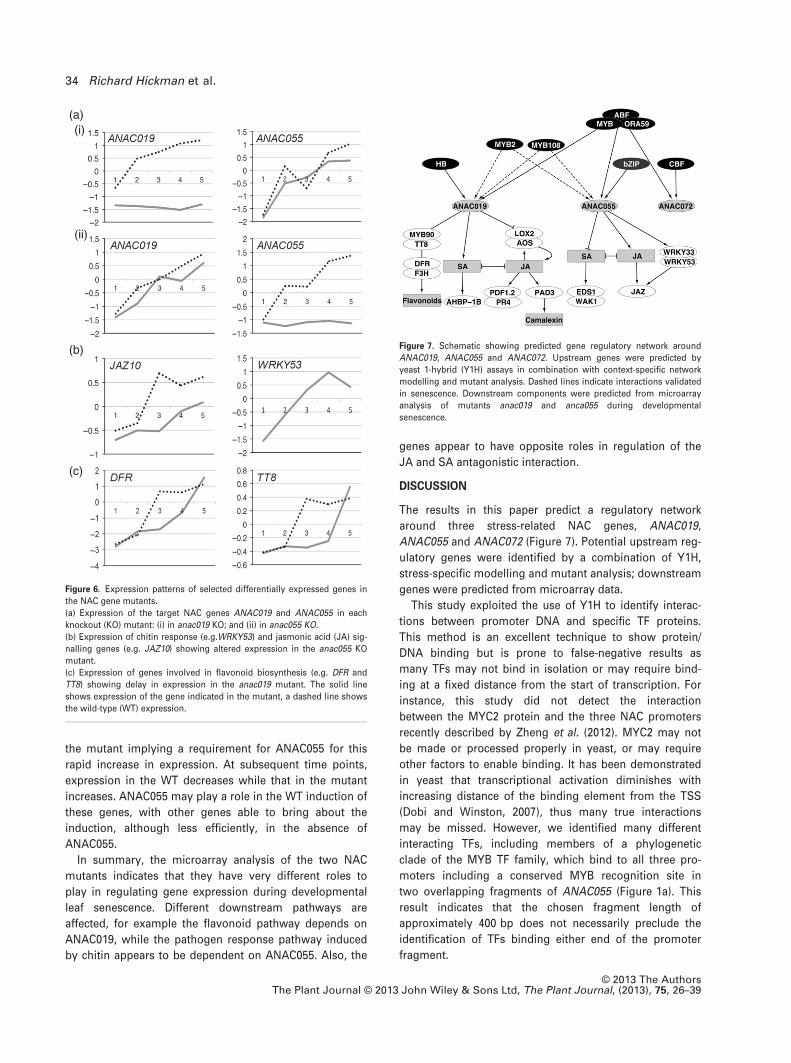
the mutant implying a requirement for ANAC055 for this
rapid increase in expression. At subsequent time points,
expression in the WT decreases while that in the mutant
increases. ANAC055 may play a role in the WT induction of
these genes, with other genes able to bring about the
induction, although less efficiently, in the absence of
ANAC055.
In summary, the microarray analysis of the two NAC
mutants indicates that they have very different roles to
play in regulating gene expression during developmental
leaf senescence. Different downstream pathways are
affected, for example the flavonoid pathway depends on
ANAC019, while the pathogen response pathway induced
by chitin appears to be dependent on ANAC055. Also, the
genes appear to have opposite roles in regulation of the
JA and SA antagonistic interaction.
DISCUSSION
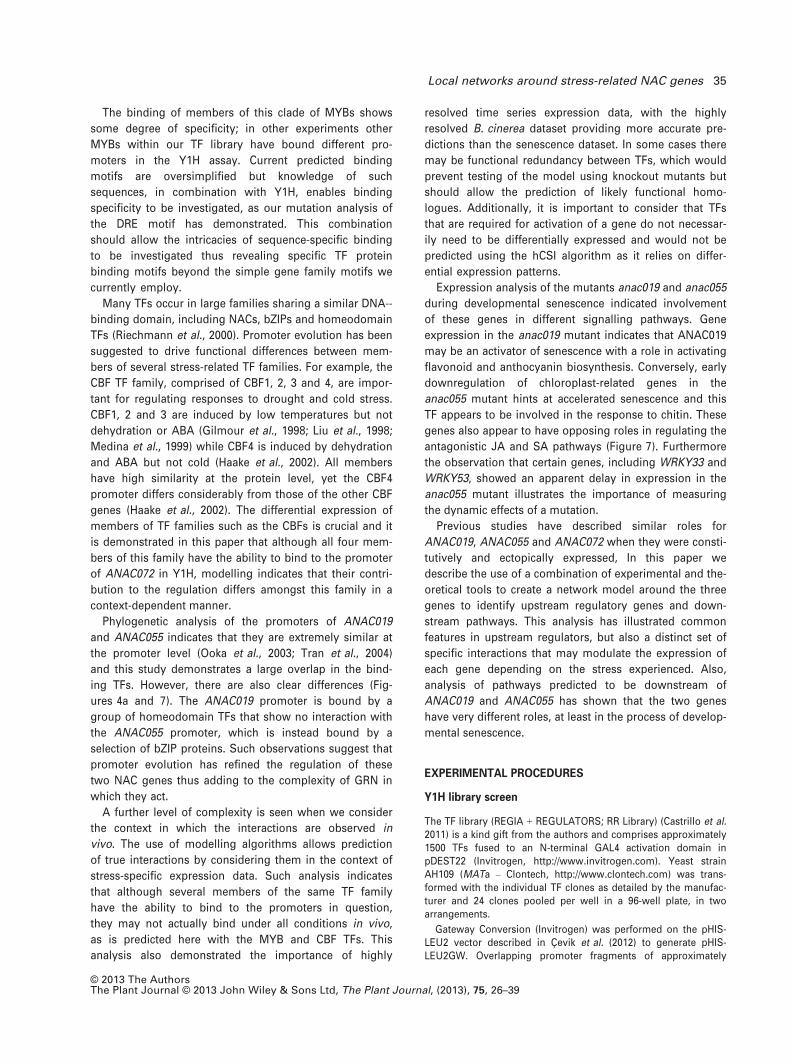
The results in this paper predict a regulatory network
around three stress-related NAC genes, ANAC019,
ANAC055 and ANAC072 (Figure 7). Potential upstream reg-
ulatory genes were identified by a combination of Y1H,
stress-specific modelling and mutant analysis; downstream
genes were predicted from microarray data.
This study exploited the use of Y1H to identify interac-
tions between promoter DNA and specific TF proteins.
This method is an excellent technique to show protein/
DNA binding but is prone to false-negative results as
many TFs may not bind in isolation or may require bind-
ing at a fixed distance from the start of transcription. For
instance, this study did not detect the interaction
between the MYC2 protein and the three NAC promoters
recently described by Zheng et al. (2012). MYC2 may not
be made or processed properly in yeast, or may require
other factors to enable binding. It has been demonstrated
in yeast that transcriptional activation diminishes with
increasing distance of the binding element from the TSS
(Dobi and Winston, 2007), thus many true interactions
may be missed. However, we identified many different
interacting TFs, including members of a phylogenetic
clade of the MYB TF family, which bind to all three pro-
moters including a conserved MYB recognition site in
two overlapping fragments of ANAC055 (Figure 1a). This
result indicates that the chosen fragment length of
approximately 400 bp does not necessarily preclude the
identification of TFs binding either end of the promoter
fragment.
Figure 7. Schematic showing predicted gene regulatory network around
ANAC019, ANAC055 and ANAC072. Upstream genes were predicted by
yeast 1-hybrid (Y1H) assays in combination with context-specific network
modelling and mutant analysis. Dashed lines indicate interactions validated
in senescence. Downstream components were predicted from microarray
analysis of mutants anac019 and anca055 during developmental
senescence.
(a)
(b)
(c)
(i)
(ii)
Figure 6. Expression patterns of selected differentially expressed genes in
the NAC gene mutants.
(a) Expression of the target NAC genes ANAC019 and ANAC055 in each
knockout (KO) mutant: (i) in anac019 KO; and (ii) in anac055 KO.
(b) Expression of chitin response (e.g.WRKY53) and jasmonic acid (JA) sig-
nalling genes (e.g. JAZ10) showing altered expression in the anac055 KO
mutant.
(c) Expression of genes involved in flavonoid biosynthesis (e.g. DFR and
TT8) showing delay in expression in the anac019 mutant. The solid line
shows expression of the gene indicated in the mutant, a dashed line shows
the wild-type (WT) expression.
© 2013 The AuthorsThe Plant Journal © 2013 John Wiley & Sons Ltd, The Plant Journal, (2013), 75, 26–39
34 Richard Hickman et al.
The binding of members of this clade of MYBs shows
some degree of specificity; in other experiments other
MYBs within our TF library have bound different pro-
moters in the Y1H assay. Current predicted binding
motifs are oversimplified but knowledge of such
sequences, in combination with Y1H, enables binding
specificity to be investigated, as our mutation analysis of
the DRE motif has demonstrated. This combination
should allow the intricacies of sequence-specific binding
to be investigated thus revealing specific TF protein
binding motifs beyond the simple gene family motifs we
currently employ.
Many TFs occur in large families sharing a similar DNA--
binding domain, including NACs, bZIPs and homeodomain
TFs (Riechmann et al., 2000). Promoter evolution has been
suggested to drive functional differences between mem-
bers of several stress-related TF families. For example, the
CBF TF family, comprised of CBF1, 2, 3 and 4, are impor-
tant for regulating responses to drought and cold stress.
CBF1, 2 and 3 are induced by low temperatures but not
dehydration or ABA (Gilmour et al., 1998; Liu et al., 1998;
Medina et al., 1999) while CBF4 is induced by dehydration
and ABA but not cold (Haake et al., 2002). All members
have high similarity at the protein level, yet the CBF4
promoter differs considerably from those of the other CBF
genes (Haake et al., 2002). The differential expression of
members of TF families such as the CBFs is crucial and it
is demonstrated in this paper that although all four mem-
bers of this family have the ability to bind to the promoter
of ANAC072 in Y1H, modelling indicates that their contri-
bution to the regulation differs amongst this family in a
context-dependent manner.
Phylogenetic analysis of the promoters of ANAC019
and ANAC055 indicates that they are extremely similar at
the promoter level (Ooka et al., 2003; Tran et al., 2004)
and this study demonstrates a large overlap in the bind-
ing TFs. However, there are also clear differences (Fig-
ures 4a and 7). The ANAC019 promoter is bound by a
group of homeodomain TFs that show no interaction with
the ANAC055 promoter, which is instead bound by a
selection of bZIP proteins. Such observations suggest that
promoter evolution has refined the regulation of these
two NAC genes thus adding to the complexity of GRN in
which they act.
A further level of complexity is seen when we consider
the context in which the interactions are observed in
vivo. The use of modelling algorithms allows prediction
of true interactions by considering them in the context of
stress-specific expression data. Such analysis indicates
that although several members of the same TF family
have the ability to bind to the promoters in question,
they may not actually bind under all conditions in vivo,
as is predicted here with the MYB and CBF TFs. This
analysis also demonstrated the importance of highly
resolved time series expression data, with the highly
resolved B. cinerea dataset providing more accurate pre-
dictions than the senescence dataset. In some cases there
may be functional redundancy between TFs, which would
prevent testing of the model using knockout mutants but
should allow the prediction of likely functional homo-
logues. Additionally, it is important to consider that TFs
that are required for activation of a gene do not necessar-
ily need to be differentially expressed and would not be
predicted using the hCSI algorithm as it relies on differ-
ential expression patterns.
Expression analysis of the mutants anac019 and anac055
during developmental senescence indicated involvement
of these genes in different signalling pathways. Gene
expression in the anac019 mutant indicates that ANAC019
may be an activator of senescence with a role in activating
flavonoid and anthocyanin biosynthesis. Conversely, early
downregulation of chloroplast-related genes in the
anac055 mutant hints at accelerated senescence and this
TF appears to be involved in the response to chitin. These
genes also appear to have opposing roles in regulating the
antagonistic JA and SA pathways (Figure 7). Furthermore
the observation that certain genes, including WRKY33 and
WRKY53, showed an apparent delay in expression in the
anac055 mutant illustrates the importance of measuring
the dynamic effects of a mutation.
Previous studies have described similar roles for
ANAC019, ANAC055 and ANAC072 when they were consti-
tutively and ectopically expressed, In this paper we
describe the use of a combination of experimental and the-
oretical tools to create a network model around the three
genes to identify upstream regulatory genes and down-
stream pathways. This analysis has illustrated common
features in upstream regulators, but also a distinct set of
specific interactions that may modulate the expression of
each gene depending on the stress experienced. Also,
analysis of pathways predicted to be downstream of
ANAC019 and ANAC055 has shown that the two genes
have very different roles, at least in the process of develop-
mental senescence.
EXPERIMENTAL PROCEDURES
Y1H library screen
The TF library (REGIA + REGULATORS; RR Library) (Castrillo et al.2011) is a kind gift from the authors and comprises approximately1500 TFs fused to an N-terminal GAL4 activation domain inpDEST22 (Invitrogen, http://www.invitrogen.com). Yeast strainAH109 (MATa – Clontech, http://www.clontech.com) was trans-formed with the individual TF clones as detailed by the manufac-turer and 24 clones pooled per well in a 96-well plate, in twoarrangements.
Gateway Conversion (Invitrogen) was performed on the pHIS-LEU2 vector described in C�evik et al. (2012) to generate pHIS-LEU2GW. Overlapping promoter fragments of approximately
© 2013 The AuthorsThe Plant Journal © 2013 John Wiley & Sons Ltd, The Plant Journal, (2013), 75, 26–39
Local networks around stress-related NAC genes 35
400 bp were amplified in a two-step polymerase chain reaction(PCR) from Arabidopsis (Col-0) genomic DNA using KODDNA polymerase (Merck, http://www.merckmillipore.com) forANAC019, ANAC055 and ANAC072. Fragments were amplifiedwith sequence-specific oligonucleotides containing half attB Gate-way recombination sites (Table S3). Second round PCR was per-formed with generic attB oligonucleotides (Table S3). Promoterfragments were cloned into the pDonrZeo vector (Invitrogen)using BP clonase II (Invitrogen) and then recombined into pHIS-LEU2GW using LR clonase II (Invitrogen). Yeast strain Y187(MATa) (Clontech) was transformed with the pHISLEU2GW-pro-moter clones to generate bait strains.
The pooled library and bait strains were grown in SD-Trp orSD-Leu media respectively. 3 ll of each promoter strain was spot-ted onto YPDA (yeast, peptone, dextrose, adenine) plates andoverlaid with 3 ll of TF library pools. After incubation for 24 h at30°C, diploid cells were replica plated onto selective plates [SD--Leu-Trp and SD-Leu-Trp-His � 1–100 mM 3-amino-1,2,4-triazol(3AT)]. Following overnight incubation, plates were replica--cleaned, then incubated for 4 days. Growth was scored and posi-tive colonies patched onto selective plates and grown overnight at30°C. Colony PCR was performed by adding a colony to 20 mM
NaOH, boiling for 10 min, then these were used as a template in aPCR reaction using pD22 oligonucleotides (Table S3). Productswere sequenced to identify the TF showing a positive interaction.
To verify the Y1H results, Y187 was transformed with all pro-moter constructs and then with pDEST22 or the appropriate TFclone. Cultures were grown in SD-Leu-Trp, diluted to 108 cells/ml,3 ll spots of serial 10-fold dilutions plated onto selective plates(SD-Leu-Trp and SD-Leu-Trp-His � 3AT) and grown at 30°C for3 days before scoring.
Prediction of transcription factor binding sites
Position specific scoring matrices (PSSMs) that model DNA-bindingspecificities for TFs isolated from the Y1H screen were retrieved fromthe TRANSFAC (Matys et al., 2006) and PLACE (Higo et al., 1999)databases. PSSMs for a similar TF were used when absent fromthe databases. The matrix similarity score (Kel et al., 2003) wascomputed at each position and converted to P-values based on ascore distribution of that PSSM on random sequence. Motifinstances that achieved a score <0.001 were judged to be candi-date binding sites.
Promoter mutations and quantification of Y1H interactions
Promoter mutations were generated by inverse PCR on entryclones containing the relevant promoter sequences using oligo-nucleotides shown in Table S4. Entry clones were recombinedwith the pHISLEU2GW plasmid using LR clonase II. Serial five-fold dilutions of Y187 strains containing the promoter mutantclones and relevant TF were plated as described above. Threeindependent isolates of each promoter-TF pair were plated intriplicate onto selective plates (SD-Leu-Trp and SD-Leu-Trp--His � 3AT) and grown at 30°C for 3 days before scoring. Using aconsistent sized circle, the integrated density function in ImageJwas used to measure the growth of each yeast spot, normalizedby subtracting the integrated density of an adjacent equal sizedarea of empty agar.
GO analysis
Gene ontology (GO) annotation analysis was performed usingBINGO 2.3 (Maere et al., 2005). Over-represented categories wereidentified using a hypergeometric test with a significance thresh-
old of 0.05 after Benjamini–Hochberg false discovery rate (FDR)correction (Benjamini and Hochberg, 1995) with the whole anno-tated genome as the reference set except for the analysis of inter-acting TFs in the Y1H experiment in which all TFs were used asthe reference set.
Causal structure identification
The Gaussian process two-sample (GP2S) approach was used todetermine differential expression of each gene in the cold, osmo-tic and salt stress datasets from Kilian et al. (2007). GP2S wasimplemented as described in Windram et al. (2012), except that alog-likelihood ratio of >8 was chosen as the threshold for indicat-ing differential expression. For the B. cinerea and senescence timeseries differential expression was from our previous studies(Breeze et al., 2011 and Windram et al., 2012 respectively). ThehCSI approach (Klemm, 2008; Penfold and Wild, 2011; Penfoldet al., 2012) was used to infer a separate network topology for thethree NAC genes using data from each of five datasets describedabove, using the Y1H network as a constraining hypernetwork. Ini-tial hyperparameters and prior distributions over the hyperparam-eters for the Gaussian process priors were set as in Penfold et al.(2012). The maximum number of TFs that could bind simulta-neously within the algorithm was limited to five if the total num-ber of putative regulators was <15 and 4 otherwise, due to thecombinatorial scaling. Five Markov chain Monte Carlo chains wererun in parallel, each generating 50 000 samples network structureswith the first 10 000 sampled discarded to allow equilibration ofthe algorithm. The remaining 200 000 samples were thinned by afactor of 5 and used to calculate the marginal probability for eachpairwise connection in the Y1H network.
Plant material and stress treatments
The myb2, myb108 and anac055 lines were T-DNA insertion linesSalk_045455, Salk_024059 and Salk_011069 respectively (obtainedfrom the Nottingham Arabidopsis Seed Centre). The anac019dSpm insertion mutant was identified with gene-specific primersin a pool of SLAT line DNA (Tissier et al., 1999). Arabidopsisplants were grown mostly as described by Windram et al. (2012).For the developmental senescence timecourse, anac019 andanac055 mutants and their WT controls, Col-5 and Col-0, weregrown as described by Breeze et al. (2011); leaf 7 was tagged withcotton 18 days after sowing (DAS) and harvested from five ran-domly selected plants, 8 h into the light period, at 23, 29, 31, 33 or35 DAS (full senescence).
Botrytis cinerea pepper strain spores (Denby et al., 2004) wereprepared and Arabidopsis leaves treated as described in Windramet al. (2012). Col-0, myb2 and myb108 leaves were inoculated withseveral 10 ll droplets of B. cinerea spores. Replicate samples forthe comparison between myb108 or myb2 and Col-0 were har-vested at 26 and 30 hpi or 24 and 30 hpi respectively.
For the dark induces senescence screen, nine 3-week old Col-0,myb2 and myb108 rosettes, were cut and transferred to water-sat-urated filter paper and stored at 20°C in complete darkness. Plateswere photographed daily and RGB colour values calculated forleaf 5 of each rosette using the Color Histogram function in Ima-geJ. RGB intensities were normalized using a white-backgroundreference point and average red–green ratios provided a quantita-tive measure of leaf yellowing. A red–green ratio of around 0.8indicates the initiation of senescence. When the average ratio ofCol-0 samples was >0.8, leaf 5 for Col-0, myb2 and myb108 lineswas harvested (four biological replicates). The same sampling pro-cedure was then performed on consecutive days to sample assenescence progressed.
© 2013 The AuthorsThe Plant Journal © 2013 John Wiley & Sons Ltd, The Plant Journal, (2013), 75, 26–39
36 Richard Hickman et al.
Microarray analysis
Total RNA was extracted from four leaves per line, labelled andhybridized to CATMA v4 arrays (Allemeersch et al., 2005; http://www.catma.org) as described (Breeze et al., 2011). For analysis ofCol-0, myb2 and myb108 samples four replicates were pooled andlabelled twice with each dye giving four technical replicates. Com-parisons were made pairwise between WT and mutant under eachcondition. For analysis of the Col-0 and anac055, and Col-5 andanac019, biological replicates were labelled separately, twice witheach dye, and comparisons made within and between time pointsin a ‘loop design’ (Kerr and Churchill, 2001). Analysis of expres-sion differences between Col-0 and myb2 and Col-0 and myb108under each condition was performed using the R Bioconductorpackage limmaGUI (Wettenhall and Smyth, 2004) applying Print-Tip lowess transformation and quantile-normalization. The datawere fitted to a linear model using a least squares method, P-val-ues adjusted to control the false discovery rate (Benjamini andHochberg, 1995). Analysis of the anac019 and anac055 time courseexperiment was performed using a local adaptation of the MAANOVA
package as described (Breeze et al., 2011). The GP2S approachwas used (as described in Windram et al., 2012) to identify differ-entially expressed genes (log-likelihood ratio of >5) in the anac019and anac055 mutants compared with WT. A t-test analysis wasthen performed to identify genes that were differentiallyexpressed at each time point. Genes expressed at a higher orlower level than WT (ratio >1.7 or <0.6 respectively, P-value <0.1)were identified (Tables S1 and S2).
Data repository
The microarray data used in this paper have been deposited inNCBI’s Gene Expression Omnibus (Edgar et al., 2002) and havebeen given a GEO Series accession number GSE46318. These datawill be released on publication.
ACKNOWLEDGEMENTS
Funding: R.H. – Engineering and Physical Sciences ResearchCouncil (EPSRC)/Biotechnology and Biological Sciences ResearchCouncil (BBSRC) Warwick Systems Biology Doctoral TrainingCentre; C.H., C.P., L.B., P.Z., A.J., J.B., D.W., K.D., S.O. and V.B.-W. –BBRSC (BB/F005806/1) Plant Response to Environmental StressArabidopsis; E.B. – BBSRC core strategic grant to Warwick HRI;E.C. – EPSRC Molecular Organisation and Assembly in Cells DoctoralTraining Centre; D.W. – EPSRC grant EP/I036575/1. The RR TF librarywas a kind gift from Franziska Turck, Max Planck Institute, Cologne,Germany.
SUPPORTING INFORMATION
Additional Supporting Information may be found in the online ver-sion of this article.Figure S1. Identification of putative binding locations for transcrip-tion factors that interact with fragments of the ANAC019 promoterin Y1H assays.
Figure S2. Identification of putative binding locations for transcrip-tion factors that interact with fragments of the ANAC055 promoterin Y1H assays.
Figure S3. Identification of putative binding locations for transcrip-tion factors that interact with fragments of the ANAC072 promoterin Y1H assays.
Figure S4. Hierarchical CSI modeling was used to identify a treat-ment-specific subnetwork for various stress datasets (develop-
mental senescence, Botrytis cinerea infection, salt, osmotic andcold stresses) based upon the core Y1H network.
Figure S5. Expression of MYB2 and MYB108 is positively corre-lated with that of ANAC019, ANAC055 and ANAC072 duringB. cinerea infection and developmental senescence.
Figure S6. Gene expression patterns of selected genes represent-ing GO terms identified as being enriched at one or more time-points during the experiment.
Table S1. Genes differentially expressed in the anac019 mutantcompared to Col-5 WT control over the whole time course wereidentified using GP2S sampling (Stegle et al., 2010) and geneswith a GP2S score >5 were retained.
Table S2. Genes differentially expressed in the anac055 mutantcompared to Col-0 WT control over the whole time course wereidentified using GP2S sampling (Stegle et al., 2010) and geneswith a GP2S score >5 were retained.
Table S3. Oligonucleotides used to generate promoter fragmentclones for Y1H screens.
Table S4. Oligonucleotides used to generate mutations in the DREmotif.
REFERENCES
Abe, H., Urao, T., Ito, T., Seki, M., Shinozaki, K. and Yamaguchi-Shinozaki,
K. (2003) Arabidopsis AtMYC2 (bHLH) and AtMYB2 (MYB) function as
transcriptional activators in abscisic acid signaling. Plant Cell, 15, 63–78.Allemeersch, J., Durinck, S., Vanderhaeghen, R. et al. (2005) Benchmarking
the CATMA microarray. A novel tool for Arabidopsis transcriptome anal-
ysis. Plant Physiol. 137, 588–601.Balazadeh, S., Siddiqui, H., Allu, A.D., Matallana-Ramirez, L.P., Caldana,
C., Mehrnia, M., Zanor, M.I., Kohler, B. and Mueller-Roeber, B. (2010)
A gene regulatory network controlled by the NAC transcription factor
ANAC092/AtNAC2/ORE1 during salt-promoted senescence. Plant J. 62,
250–264.Baudry, A., Heim, M.A., Dubreucq, B., Caboche, M., Weisshaar, B. and
Lepiniec, L. (2004) TT2, TT8, and TTG1 synergistically specify the expression
of BANYULS and proanthocyanidin biosynthesis in Arabidopsis thaliana.
Plant J. 39, 366–380.Benjamini, Y. and Hochberg, Y. (1995) Controlling the false discovery rate: a
practical and powerful approach to multiple testing. J. Roy. Stat. Soc. 57,
289–300.Borevitz, J.O., Xia, Y., Blount, J., Dixon, R.A. and Lamb, C. (2000) Activation
tagging identifies a conserved MYB regulator of phenylpropanoid bio-
synthesis. Plant Cell, 12, 2383–2394.Brady, S.M., Zhang, L., Megraw, M. et al. (2011) A stele-enriched gene regu-
latory network in the Arabidopsis root. Mol. Syst. Biol. 7, 459.
Breeze, E., Harrison, E., McHattie, S. et al. (2011) High-resolution temporal
profiling of transcripts during Arabidopsis leaf senescence reveals a dis-
tinct chronology of processes and regulation. Plant Cell, 23, 873–894.Bu, Q., Jiang, H., Li, C.-B., Zhai, Q., Zhang, J., Wu, X., Sun, J., Xie, Q. and Li,
C. (2008) Role of the Arabidopsis thaliana NAC transcription factors
ANAC019 and ANAC055 in regulating jasmonic acid-signaled defense
responses. Cell Res. 18, 756–767.Castrillo, G., Turck, F., Leveugle, M., Lecharny, A., Carbonero, P., Coupland, G.,
Paz-Ares, J. and On~ate-S�anchez, L. (2011) Speeding cis-trans regulation
discovery by phylogenomic analyses coupled with screenings of an arrayed
library of Arabidopsis transcription factors. PLoS ONE, 6, e21524.
C�evik, V., Kidd, B.N., Zhang, P. et al. (2012) MEDIATOR25 Acts as an inte-
grative hub for the regulation of Jasmonate-responsive gene expression
in Arabidopsis. Plant Physiol. 160, 541–535.Denby, K.J., Kumar, P. and Kliebenstein, D.J. (2004) Identification of
Botrytis cinerea susceptibility loci in Arabidopsis thaliana. Plant J. 38,
473–486.Dobi, K.C. and Winston, F. (2007) Analysis of transcriptional activation at a
distance in Saccharomyces cerevisiae. Mol. Cell. Biol. 27, 5575–5586.Edgar, R., Domrachev, M. and Lash, A.E. (2002) Gene expression omnibus:
NCBI gene expression and hybridization array data repository. Nucleic
Acids Res. 30, 207–210.
© 2013 The AuthorsThe Plant Journal © 2013 John Wiley & Sons Ltd, The Plant Journal, (2013), 75, 26–39
Local networks around stress-related NAC genes 37
Fan, W. and Dong, X. (2002) In vivo interaction between NPR1 and transcrip-
tion factor TGA2 leads to salicylic acid–mediated gene activation in Ara-
bidopsis. Plant Cell, 14, 1377–1389.Feys, B.J., Moisan, L.J., Newman, M.A. and Parker, J.E. (2001) Direct inter-
action between the Arabidopsis disease resistance signaling proteins,
EDS1 and PAD4. EMBO J. 20, 5400–5411.Fujita, M., Fujita, Y., Maruyama, K., Seki, M., Hiratsu, K., Ohme-Takagi, M.,
Tran, L.-S.P., Yamaguchi-Shinozaki, K. and Shinozaki, K. (2004) A dehy-
dration-induced NAC protein, RD26, is involved in a novel ABA-depen-
dent stress-signaling pathway. Plant J. 39, 863–876.Gilmour, S.J., Zarka, D.G., Stockinger, E.J., Salazar, M.P., Houghton, J.M.
and Thomoashow, M.F. (1998) Low temperature regulation of the Ara-
bidopsis CBF family of AP2 transcriptional activators as an early step in
cold-induced COR gene expression. Plant J. 16, 433–442.Guo, Y. and Gan, S. (2006) AtNAP, a NAC family transcription factor, has an
important role in leaf senescence. Plant J. 46, 601–612.Haake, V., Cook, D., Riechmann, J.L., Pineda, O., Thomashow, M.F. and
Zhang, J.Z. (2002) Transcription factor CBF4 is a regulator of drought
adaptation in Arabidopsis. Plant Physiol. 130, 639–648.Hao, D., Yamasaki, K., Sarai, A. and Ohme-Takagi, M. (2002) Determinants
in the sequence specific binding of two plant transcription factors, CBF1
and NtERF2, to the DRE and GCC motifs. Biochemistry, 41, 4202–4208.He, Z.H., Cheeseman, I., He, D. and Kohorn, B.D. (1999) A cluster of five cell
wall-associated receptor kinase genes, Wak1–5, are expressed in specific
organs of Arabidopsis. Plant Mol. Biol. 39, 1189–1196.Higo, K., Ugawa, Y., Iwamoto, M. and Korenaga, T. (1999) Plant cis-acting
regulatory DNA elements (PLACE) database: 1999. Nucleic Acids Res. 27,
297–300.Hu, H., Dai, M., Yao, J., Xiao, B., Li, X., Zhang, Q. and Xiong, L. (2006) Over-
expressing a NAM, ATAF, and CUC (NAC) transcription factor enhances
drought resistance and salt tolerance in rice. Proc. Natl Acad. Sci. USA,
103, 12987–12992.Jensen, M.K., Kjaersgaard, T., Nielsen, M.M., Galberg, P., Petersen, K.,
O’Shea, C. and Skriver, K. (2010) The Arabidopsis thaliana NAC transcrip-
tion factor family: structure-function relationships and determinants of
ANAC019 stress signalling. Biochem. J. 426, 183–196.Kel, A., Gossling, E. and Reuter, I. (2003) MATCHTM: a tool for searching
transcription factor binding sites in DNA sequences. Nucleic Acids Res.
31, 3576–3579.Kerr, M.K. and Churchill, G.A. (2001) Experimental design for gene expres-
sion microarrays. Biostatistics, 2, 183–201.Kilian, J., Whitehead, D., Horak, J., Wanke, D., Weinl, S., Batistic, O.,
D’Angelo, C., Bornberg-Bauer, E., Kudla, J. and Harter, K. (2007) The
AtGenExpress global stress expression data set: protocols, evaluation
and model data analysis of UV-B light, drought and cold stress
responses. Plant J. 50, 347–363.Klemm, S.L. (2008) Causal structure identification in nonlinear dynamical
systems. Master’s thesis. Department of Engineering, University of
Cambridge, UK.
Libault, M., Wan, J.R., Czechowski, T., Udvardi, M. and Stacey, G. (2007)
Identification of 118 Arabidopsis transcription factor and 30 ubiquitin-
ligase genes responding to chitin, a plant-defense elicitor. Mol. Plant
Microbe Interact. 20, 900–911.Liu, Q., Kasuga, M., Abe, H., Miura, S., Yamaguchi-Shinozaki, K. and
Shinozaki, K. (1998) Two transcription factors, DREB1 and DREB2, with an
EREBP/AP2 DNA binding domain separate two cellular signal transduction
pathways in drought- and low-temperature-responsive gene expression,
respectively, in Arabidopsis. Plant Cell, 10, 1391–1406.Maere, S., Heymans, K. and Kuiper, M. (2005) BiNGO: a cytoscape plugin to
assess overrepresentation of gene ontology categories in biological net-
works. Bioinformatics, 21, 3448–3449.Mandaokar, A. and Browse, J. (2009) MYB108 acts together with MYB24 to
regulate jasmonate-mediated stamen maturation in Arabidopsis. Plant
Physiol. 149, 851–862.Matys, V., Kel-Margoulis, O.V., Fricke, E. et al. (2006) TRANSFAC and its
module TRANSCompel: transcriptional gene regulation in eukaryotes.
Nucleic Acids Res. 34, D108–D110.Medina, J., Bargues, M., Terol, J., Perez-Alonso, M. and Salinas, J. (1999) The
Arabidopsis CBF gene family is composed of three genes encoding AP2
domain-containing proteins whose expression is regulated by low tempera-
ture but not by abscisic acid or dehydration. Plant Physiol. 119, 463–470.
Mengiste, T., Chen, X., Salmeron, J. and Dietrich, R. (2003) The BOTRYTIS
SUSCEPTIBLE1 gene encodes an R2R3MYB transcription factor protein
that is required for biotic and abiotic stress responses in Arabidopsis.
Plant Cell, 15, 2551–2565.Mitsuda, N., Ikeda, M., Takada, S., Takiguchi, Y., Kondou, Y., Yoshizumi, T.,
Fujita, M., Shinozaki, K., Matsui, M. and Ohme-Takagi, M. (2010) Efficient
yeast one-/two-hybrid screening using a library composed only of tran-
scription factors in Arabidopsis thaliana. Plant Cell Physiol. 51, 2145–2151.
Nakashima, K., Takasaki, H., Mizoi, J., Shinozaki, K. and Yamaguchi-Shino-
zaki, K. (2012) NAC transcription factors in plant abiotic stress responses.
Biochim. Biophys. Acta, 1819, 97–103.Niu, X., Helentjaris, T. and Bate, N.J. (2002) Maize ABI4 binds coupling ele-
ment1 in abscisic acid and sugar response genes. Plant Cell, 14, 2565–2575.
Ooka, H., Satoh, K., Doi, K. et al. (2003) Comprehensive analysis of NAC family
genes in Oryza sativa and Arabidopsis thaliana. DNA Res. 10, 239–247.Ou, B., Yin, K.-Q., Liu, S.-N. et al. (2011) A high-throughput screening
system for Arabidopsis transcription factors and its application to
Med25-dependent transcriptional regulation. Mol. Plant, 4, 546–555.Park, M.Y., Chung, M.S., Koh, H.S., Lee, D.J., Ahn, S.J. and Kim, C.S. (2009)
Isolation and functional characterization of the Arabidopsis salt-tolerance
32 (AtSAT32) gene associated with salt tolerance and ABA signaling.
Physiol. Plant. 135, 426–435.Penfold, C.A. and Wild, D.L. (2011) How to infer gene networks from expres-
sion profiles, revisited. Interface Focus, 1, 857–870.Penfold, C.A., Buchanan-Wollaston, V., Denby, K.J. and Wild, D.L. (2012)
Nonparametric Bayesian inference for perturbed and orthologous gene
regulatory networks. Bioinformatics, 28, i223–i241.Pruneda-Paz, J.L., Breton, G., Para, A. and Kay, S.A. (2009) A functional
genomics approach reveals CHE as a component of the Arabidopsis
circadian clock. Science, 323, 1481–1485.Puranik, S., Sahu, P.P., Srivastava, P.S. and Prasad, M. (2012) NAC proteins:
regulation and role in stress tolerance. Trends Plant Sci. 17, 369–381.Riechmann, J., Heard, J., Martin, G. et al. (2000) Arabidopsis transcription
factors: genome-wide comparative analysis among eukaryotes. Science,
290, 2105–2110.Sakuma, Y., Liu, Q., Dubouzet, J.G., Abe, H., Shinozaki, K. and Yamaguchi-
Shinozaki, K. (2002) DNA-binding specificity of the ERF/AP2 domain of
Arabidopsis DREBs, transcription factors involved in dehydration- and
cold- inducible gene expression. Biochem. Biophys. Res. Commun. 290,
998–1009.Schuhegger, R., Nafisi, M., Mansourova, M., Petersen, B.L., Olsen, C.E., Sva-
tos, A., Halkier, B.A. and Glawischnig, E. (2006) CYP71B15 (PAD3) cata-
lyzes the final step in camalexin biosynthesis. Plant Physiol. 141, 1248–1254.
Solano, R., Nieto, C., Avila, J., Canas, L., Diaz, I. and Paz-Ares, J. (1995) Dual
DNA binding specificity of a petal epidermis-specific MYB transcription
factor (MYB.Ph3) from Petunia hybrid. EMBO J. 14, 1773–1784.Stegle, O., Denby, K.J., Cooke, E.J., Wild, D.L., Ghahramani, Z. and Borgwardt,
K.M. (2010) A robust Bayesian two-sample test for detecting intervals of
differential gene expression in microarray time series. J. Comput. Biol. 17,
355–367.Stracke, R., Werber, M. and Weisshaar, B. (2001) The R2R3-MYB gene fam-
ily in Arabidopsis thaliana. Curr. Opin. Plant Biol. 4, 447–456.Tissier, A.F., Marillonnet, S., Klimyuk, V., Patel, K., Torres, M.A., Murphy, G.
and Jones, J.D. (1999) Multiple independent defective suppressor-muta-
tor transposon insertions in Arabidopsis: A tool for functional genomics.
Plant Cell, 11, 1841–1852.Tran, L.-S.P., Nakashima, K., Sakuma, Y., Simpson, S.D., Fujita, Y., Maruy-
ama, K., Fujita, M., Seki, M., Shinozaki, K. and Yamaguchi-Shinozaki, K.
(2004) Isolation and functional analysis of Arabidopsis stress-inducible
NAC transcription factors that bind to a drought-responsive cis-element
in the early responsive to dehydration stress 1 promoter. Plant Cell, 16,
2481–2498.Wettenhall, J.M. and Smyth, G.K. (2004) limmaGUI: a graphical user inter-
face for linear modeling of microarray data. Bioinformatics, 20, 3705–3706.
Windram, O., Madhou, P., McHattie, S. et al. (2012) Arabidopsis defense
against Botrytis cinerea: chronology and regulation deciphered by
high-resolution temporal transcriptomic analysis. Plant Cell, 24, 3530–3557.
© 2013 The AuthorsThe Plant Journal © 2013 John Wiley & Sons Ltd, The Plant Journal, (2013), 75, 26–39
38 Richard Hickman et al.

Winter, D., Vinegar, B., Nahal, H., Ammar, R., Wilson, G.V. and Provart, N.J.
(2007) An “Electronic Fluorescent Pictograph” browser for exploring and
analyzing large-scale biological data sets. PLoS ONE, 2, e718.
Yoshida, T., Fujita, Y., Sayama, H., Kidokoro, S., Maruyama, K., Mizoi, J.,
Shinozaki, K. and Yamaguchi-Shinozaki, K. (2010) AREB1, AREB2, and
ABF3 are master transcription factors that cooperatively regulate ABRE-
dependent ABA signaling involved in drought stress tolerance and
require ABA for full activation. Plant J. 61, 672–685.
Zheng, X.Y., Spivey, N.W., Zeng, W., Liu, P.P., Fu, Z.Q., Klessig, D.F., He,
S.Y. and Dong, X. (2012) Coronatine promotes Pseudomonas syringae
virulence in plants by activating a signaling cascade that inhibits salicylic
acid accumulation. Cell Host Microbe, 11, 587–596.Zou, C., Sun, K., Mackaluso, J.D., Seddon, A.E., Jin, R., Thomashow, M.F.
and Shiu, S.-H. (2011) Cis-regulatory code of stress-responsive transcrip-
tion in Arabidopsis thaliana. Proc. Natl Acad. Sci. USA, 108, 14992–14997.
© 2013 The AuthorsThe Plant Journal © 2013 John Wiley & Sons Ltd, The Plant Journal, (2013), 75, 26–39
Local networks around stress-related NAC genes 39


![A Rice NAC Transcription Factor Promotes Leaf Senescence via … · A Rice NAC Transcription Factor Promotes Leaf Senescence via ABA Biosynthesis1[OPEN] Chanjuan Mao,2 Songchong Lu,2](https://static.cupdf.com/doc/110x72/602cb6e0c6287175e9229cd2/a-rice-nac-transcription-factor-promotes-leaf-senescence-via-a-rice-nac-transcription.jpg)