


1
A dataset of brands and their characteristics
Mitchell Lovett
University of Rochester [email protected]
Renana Peres
School of Business Administration Hebrew University of Jerusalem, Jerusalem, Israel 91905
Ron Shachar
Arison School of Business, IDC Herzliya, Israel [email protected]
February 2014
Acknowledgment: We thank all those how helped to collect the dataset. Our industry collaborators: Brad Fay from the Keller Fay Group, and Ed Lebar and John Gerzema from Young and Rubicam Brand Asset Valuator for sharing their data. We thank Kristin Luck and the Decipher Inc. team for programming and managing the survey. We gratefully thank our research assistants - at Wharton : Christina Andrews, Linda Wang, Chris Webber-Deonauth, Derric Bath, Grace Choi, Rachel Amalo, Yan Yan, Niels Mayrargue, Nathan Pamart, and Fangdan Chen; at the Hebrew University: Yair Cohen, Dafna Presler, Oshri Weiss, Liron Zaretzky, Anna Proviz, Tal Tamir, and Haneen Matar. We also thank the review team for helpful suggestions.
This data collection was supported by the Marketing Science Institute, The Wharton Customer Analytics Initiative (WCAI), The Israeli Internet Association, Kmart International Center for Marketing and Retailing at the Hebrew University of Jerusalem; the Israel Science Foundation, and the Marketing Department at the Wharton School.
2
A dataset of brands and their characteristics Abstract:
Brands stand at the core of marketing. They are central to positioning, marketing communications, word-
of-mouth, customer relationships, and firm profits. Brands have been studied from multiple perspectives
using a variety of measures and scales.
We offer a dataset (available at: [Place link here]) that contains 136 different measures of the brand
characteristics for almost 700 of the top US national brands across 16 categories measured by 2010.
These measures cover a broad range of characteristics including brand personality, satisfaction, age,
attributes related to Rogers' innovation scheme such as complexity, and the brand equity four pillars of
Young and Rubicam Brand Asset Valuator. The data were collected from a combination of sources
including an original survey on 4769 subjects. In addition, we provide quarterly data on the variables
available from Young and Rubicam for two and a half years between 2008 and 2010.
These data can be used as a building block in research that aims to explore the antecedents of brand
perceptions or connect brand characteristics with market and financial outcomes. This paper describes the
data and some relevant research questions.
Keywords: brands, brand characteristics, brand personality, complexity, differentiation, esteem,
3
Overview
Brands are viewed as one of the most valuable marketing assets and are a core concept in marketing.
Research on brands over the last 70 years covers many topics including brand management, brand
extensions, umbrella brands, positioning, and the role of brands in consumers’ lives. Today, research on
brands continues to be a vibrant area of study with recent contributions linking brands to stock market
reactions (Cao and Sorescu 2013) and global venture success (Steenkamp and Geyskens 2013).
Due to its centrality, brands have been studied from multiple perspectives (e.g., strategic and behavioral).
Each has shed light on specific elements of brands and developed its own measures and scales to
characterize brands. These measures and scales include (1) the four pillars of the Brand Asset Valuator
tool of Young and Rubicam (BAV Y&R) measuring brand equity via its perceived strength and emotional
capital (Mizik and Jacobson 2008; Stahl, Heitman, Lehmann and Neslin 2012), (2) the Interbrand ranking
that assesses brand equity based on the price premium of branded products (Ailawadi, Lehmann and
Neslin 2003), (3) brand personality traits (Aaker 1997), (4) brand identity and its role in consumers
expression of self-worth (Fournier 1998; Shachar, Erdem, Cutright and Fitzsimons 2011), (5) satisfaction,
loyalty, and other CRM related measures (Oliver 1999), and (6) the characteristics introduced by Rogers
(1995) for understanding the diffusion of innovation (such as complexity, and perceived risk) that were
used both in the context of products and brands.
The focus of each perspective on its own measures has certainly advanced our understanding of brands.
However, it seems likely that a comprehensive and integrative approach that will rely on all of these
measures and scales can yield some new insights. Indeed, such an approach was proven effective in
understanding brands role in simulating word-of-mouth (Lovett, Peres and Shachar 2013).
In order to encourage research taking the comprehensive and integrative approach to brands and to
facilitate cross-perspective research, we provide a unique database on brand characteristics. The dataset
contains 136 measures of brand characteristics for a cross-section of almost 700 top national US brands
across 16 product and service categories measured by 2010. These characteristics include the BAV Y&R
pillars, brand personality components, Rogers’ attributes, satisfaction, and many other characteristics such
as age, and type of good. The data come from market research companies, as well as from our own data
collection. Parts of this dataset were used in Lovett, Peres, and Shachar (2013). Here we describe the
dataset, and offer a list of potential research questions it can help to address.
4
Dataset description
The dataset contains multiple characteristics for 697 major US national brands (both corporate and
product) from 16 broad product categories. Since the dataset was originally used in the context of word-
of-mouth, the brands are selected to have large volumes of word-of-mouth mentions offline and over the
Internet. However, this list of brands is consistent with other lists used by brand research agencies such as
Young and Rubicam or Interbrand. For example, 92 brands of Interbrand's top global 100 list for 2009 are
part of our dataset. Note that Oil and Tobacco categories are not included in the dataset. Table 1 displays
the distribution of brands across categories.
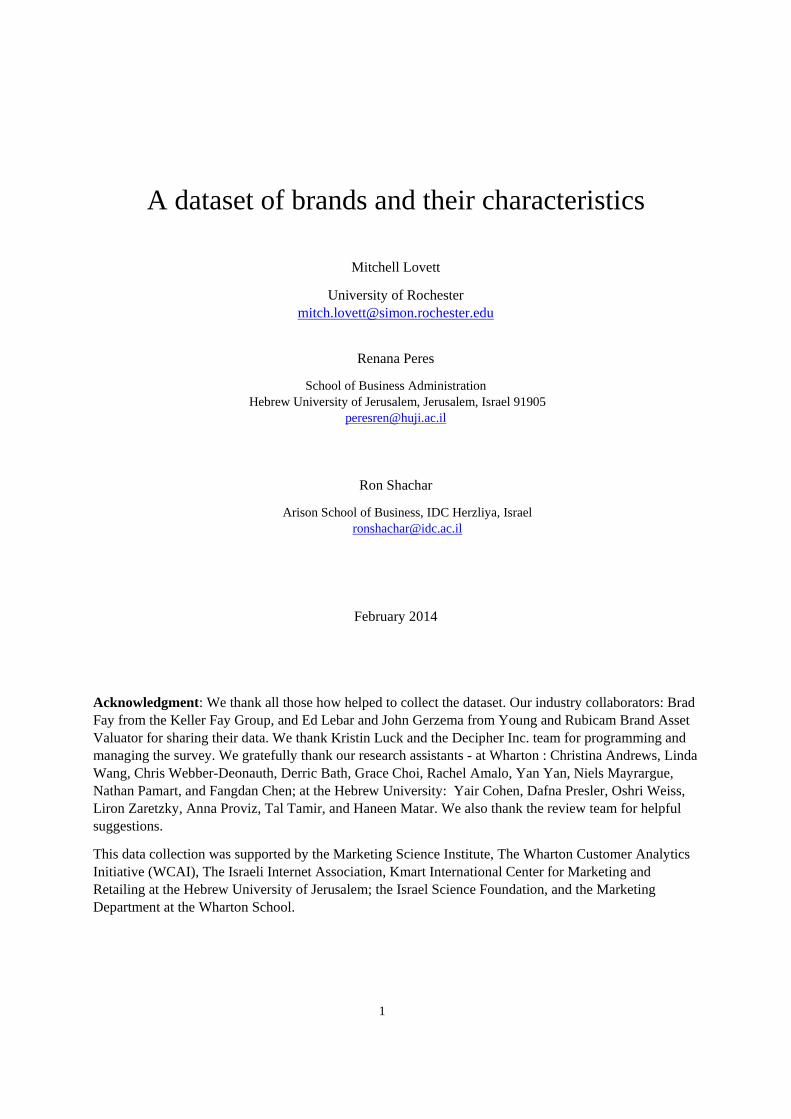
Table 1: Distribution of the 697 brands in the dataset across categories:
Category Number of brands % of brands
Food and dining 105 15.1%
Media and entertainment 103 14.8%
Beverages 66 9.5%
Technology products and stores 56 8.0%
Beauty products 52 7.5%
Clothing products 51 7.3%
Cars 47 6.7%
Financial services 39 5.6%
Travel services 34 4.9%
Health products and services 27 3.9%
Telecommunications 25 3.6%
Household Products (cleaning ingredients etc.) 24 3.4%
Sports and hobbies 21 3.0%
Children's products 19 2.7%
Department stores 15 2.2%
Home design and decoration 13 1.9%
The data have three main sources. Figure 1 displays the sources and the variables extracted from each:
1. Young and Rubicam’s Brand Asset Valuator (Y&R BAV). Young and Rubicam conducts a
quarterly survey among a representative panel of the US population (17,000 individuals, where each
respondent answers on several dozen brands). The survey measures a broad array of perceptions and
attitudes for a large number of brands. The dataset provided here includes information on 629 of the 697
brands and describes the most recent data point that was available at the end of 2010Q2. The dataset also
contains a separate file with the quarterly information for 2008Q1-2010Q2. While some brands were
measured in each one of the quarters, others were measured in only a subset – e.g. Circuit City was

5
measured in only five out of ten quarters. The opening worksheet in the separate file is showing the data
availability for each brand. Included are not only the values of the specific questions in the Y&R survey,
but also of the four pillars of brand equity that Y&R constructs from them. More details on the measures
can be found at http://bavconsulting.com/.
2. Survey. We developed a survey to measure additional characteristics. The survey was administered
online to a representative sample of the US population via the platform of Decipher, during September-
October 2010. We collected data from 4,769 respondents and each brand is evaluated by at least 35
respondents. Respondents were screened to ensure a high level of brand familiarity. Hence, although the
overall sample is representative of the US population, the brand ratings are representative of those
familiar with the brand. The variables measured in this survey include product involvement and brand
familiarity, excitement, complexity, visibility, and perceived risk. We used existing measurement scales
whenever possible. An annotated version of this questionnaire, plus a description of the quotas and
response rates is described in the supplementary material.
3. Secondary data (including Interbrand, and ACSI). For the remaining measures in the database, we
use various secondary data sources. From Interbrand we use the list of brands that were ranked in the top
100 places in 2009. From the American Customer Satisfaction Index (ACSI) we use the measure of
brand-level satisfaction. We determine other variables such as the age of the brand, whether it is a
premium or a value brand, or whether it is a product or a service from the business press and industry
reports or based on independent judges.
Figure 1: Data sources and variables

6
We next provide a detailed description of each brand characteristic, the scale, the measures and the source
used to collect it. This description is summarized in Table 1. The first worksheet of the data file contains a
dictionary with all the variable names and a brief description of each of them.
Data from Young and Rubicam’s Brand Asset Valuator:
1. Usage – The percentage of respondents who use the brand occasionally or often.
2. Consideration - The percentage of respondents who indicate that this is the brand, or one of the
several brands they would consider to buy or use.
3. Energized_Differentiation – This Y&R BAV pillar captures the extent to which the brand is
perceived as differentiated from other brands. It is measured through items stating whether the brand is
different, distinctive, unique, dynamic, and innovative.
4. Relevance – This Y&R BAV pillar captures the average on the question "How appropriate is the
brand for you personally?"
5. Esteem – This Y&R BAV pillar captures the extent to which people hold a brand in high esteem. It is
measured through items asking about the regard, leadership, reliability, and quality of the brand.
6. Knowledge – This Y&R BAV pillar indicates the level of intimate understanding of the brand.
7. Stature, Strength and Overall Asset - The scores of the four pillars are combined into three scores
termed stature, strength and overall Asset. See the data files for details.
8. The items that created the pillars - These are the individual items that make up
Energized_Differentiation and Esteem. Note, that due to quota weighting issues the score of the pillars
cannot be derived directly from the items in the dataset (i.e. averaging the items for
Energized_Differentiation for a brand is not necessarily equal to the Energized_Differentiation score).
9. Brand image - Respondents were asked to check whether they can associate the brand with 40
attributes, such as: arrogant, authentic, friendly etc. For each item, the dataset contains the percentage of
respondents who checked this attribute with respect to the brand. Then, these 40 attributes are factor
analyzed into 8 brand personality factors, which are also part of the dataset. These traits are Cutting-edge
Classic, Superior, Chic, Customer-centric, Outgoing, No-nonsense, and Distant. The exact factor analysis
coefficients are proprietary to Young and Rubicam.
10. Loyalty - A set of 18 attributes which capture brand attitudinal loyalty. For each item, the dataset
contains the percentage of respondents who checked this attribute with respect to the brand.
Data from our survey:
11. Involvement - Q2-Q4 - The involvement scale of Ratchford (1987), a three-item, 5 point scale
7
which asks about the importance of the purchase decision, the amount of thought invested in the decision,
and the risk of making the wrong decision. For simplicity, and since there is not much variability in
involvement levels of different brands within a category, involvement was measured at the category level.
Therefore the involvement score is the same for all the brands in a category.
12. Familiarity - Q5 - A single item familiarity question, asking to what extent the respondent is
familiar with the brand.
13. Complexity – Q6_1 - Q6_5 - Five items that form a measure based on Moore and Benbasat (1991)
and Speier and Venkatesh (2002).
14. Visibility – Q6_6 - Q6_10 - These variables come from the observability construct of Rogers (1995)
using a five-item 5-points scale based on Moore and Benbasat (1991).
15. Perceived risk - Q6_11 - Q6_13 - Items based on Rogers' (1995) definition of perceived risk as the
functional, financial, and emotional uncertainty associated with the product. We use the full three item,
scale of Ostlund (1974).
16. Excitement – Q7_1- Q7_11 - These variables come from Aaker’s (1997) excitement scale.
17. Competence - Q7_12 - Q7_20 - These variables come from Aaker’s (1997) competence scale.
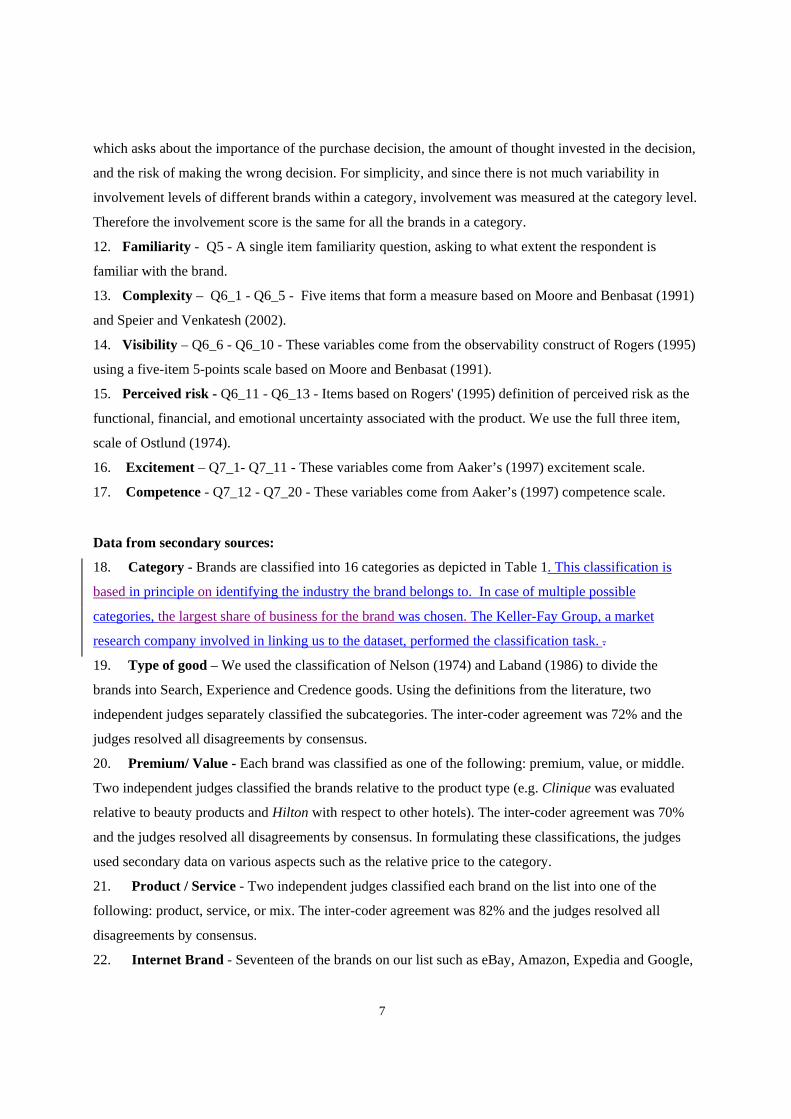
Data from secondary sources:
18. Category - Brands are classified into 16 categories as depicted in Table 1. This classification is
based in principle on identifying the industry the brand belongs to. In case of multiple possible
categories, the largest share of business for the brand was chosen. The Keller-Fay Group, a market
research company involved in linking us to the dataset, performed the classification task. .
19. Type of good – We used the classification of Nelson (1974) and Laband (1986) to divide the
brands into Search, Experience and Credence goods. Using the definitions from the literature, two
independent judges separately classified the subcategories. The inter-coder agreement was 72% and the
judges resolved all disagreements by consensus.
20. Premium/ Value - Each brand was classified as one of the following: premium, value, or middle.
Two independent judges classified the brands relative to the product type (e.g. Clinique was evaluated
relative to beauty products and Hilton with respect to other hotels). The inter-coder agreement was 70%
and the judges resolved all disagreements by consensus. In formulating these classifications, the judges
used secondary data on various aspects such as the relative price to the category.
21. Product / Service - Two independent judges classified each brand on the list into one of the
following: product, service, or mix. The inter-coder agreement was 82% and the judges resolved all
disagreements by consensus.
22. Internet Brand - Seventeen of the brands on our list such as eBay, Amazon, Expedia and Google,

8
are Internet based services. We provide a binary variable for whether the brand is an Internet brand or not.
Inter-coder agreement was 100%,
23. Age – We define age as the time (in years) elapsed from the commercial launch of the brand to the
reference date, August 1st 2010. We obtained the data from brand publications and from historical
business and press data.
24. Newness relative to the product type - The time interval (in years) between the US national
commercial launch of the first brand of this product to the brand's commercial launch. For example, the
toothpaste brand Crest was introduced in 1955, but the first US national commercial toothpaste brand
dates back to 1800 with a brand called Crème Dentifrice. Therefore its relative newness is 155 years.
Classification was done relative to the product type.
25. Interbrand top list - Based on Interbrand’s list of top 100 brands during any 2009 we code a
binary variable indicating whether the brand is in the list or not.
26. Satisfaction (ACSI) –The American Customer Satisfaction Index is a standard measure of
satisfaction for American corporate brands (Fornell et al 1996), collected each quarter using 250 customer
telephone interviews per brand on a rolling set of brands with each receiving at least one measure each
year. Of our list of brands, 209 have an ACSI score (with Heinz having the highest score and Charter
Communications the lowest). The dataset contains the average ASCI index for 2008-2010.
Next, we describe the data and correlations among the variables.
Descriptive Statistics
This section provides a brief view into the rich detail and variation available in the dataset by presenting
description of some of the variables. Although we cannot feasibly present all of the variables, we select
some of the main variables that we think are likely to be of interest to users of this dataset. In Table 2 we
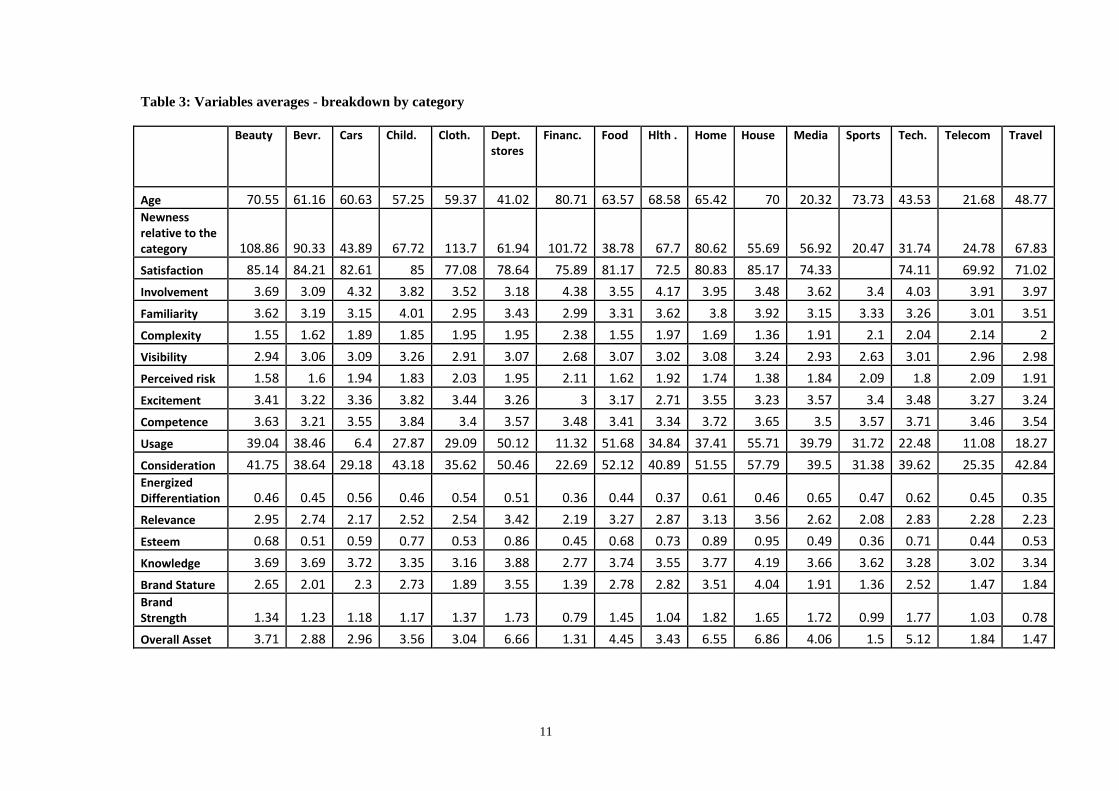
present the descriptive statistics of these variables and Table 3 contains the category averages. We point
to a few interesting patterns in this data. From Table 3, we see high usage and consideration for food,
department stores, and household products. The last two categories also enjoy high brand strength and
stature. Also interesting is the low satisfaction for service categories such as health, telecom and travel
relative to that of goods categories. Financial services score high on complexity and low on esteem,
whereas technology, which is also perceived as complicated, is highly esteemed by respondents.
Table 4 contains correlations for these same variables. As expected, usage is highly correlated with
consideration and familiarity, and also with the Y&R BAV pillars. It is interesting to see its negative
correlation with risk and complexity, a correlation that might stem either because less used brands are
perceived as risky and complex, or the other way around – their risk and complexity leads to lower usage.

9
Other interesting correlations include the positive correlations of risk and complexity, and the negative
correlations between risk and satisfaction, as well as the Y&R BAV pillars.
Figure 2: Average values as a function of time for the four Y&R BAV pillars, for three categories
As mentioned above, for the Y&R BAV, data is available for ten quarters. To illustrate the nature of
variation in the data we focus on the brands that are available across all 10 quarters. Figure 2 describes the
Cars, Food and dining, and Household products categories. It depicts the category average over time for
the four Y&R BAV pillars. As the figure indicates, time variation is not large, and only the Knowledge
pillar shows any systematic pattern (decline). Table 5 presents the descriptive statistics for the four Y&R
BAV pillars and the eight Y&R BAV personality factors. We present standard summary statistics as well
as the mean squared errors from a variable-by-variable ANOVA containing brand and time factors. As the
mean squared error measures (significance in parentheses) indicate, both factors are significant,
suggesting both sources of variation are present. More importantly, brand plays a much larger role than

10
time in explaining the variation. In fact, for most variables, brand dwarfs time, suggesting cross-sectional
variation is much more important than time variations. We also conducted an unreported ANOVA
including category and category*time interactions. The category*time interactions were not significant
suggesting that the time trends are relatively similar across categories.
Table 2: Descriptive statistics
Mean Std. Dev.
Min Max Max value Brand
Min Value Brand
Obs.
Age 54.19 39.54 1.10 204.66 Colgate Transformers: Rev. of the Fallen
697
Newness relative to the category
64.48 61.67 0.00 370.07 * Multiple (e.g. Amazon, American Express)
697
Satisfaction 79.40 6.56 55.00 89.33 Heinz Charter Communications
209
Involvement** 3.72 0.36 3.09 4.38 Financial Services
Beverages 697
Familiarity 3.30 0.62 0 4.62 Band Aid HEB Grocery 697
Complexity 1.84 0.38 1.01 3.31 Medicare Pledge 693
Visibility 2.99 0.38 1.54 3.99 Microsoft Lamborghini 693
Perceived risk 1.80 0.31 1.02 2.72 Medicare Dr. Pepper 693
Excitement 3.32 0.36 2.16 4.44 iPhone Medicare 695
Competence 3.50 0.28 2.61 4.45 iPhone Diet Mountain Dew
695
Usage 33.35 22.35 0.28 89.31 Band Aid Porche 618
Consideration 40.48 16.63 9.18 82.72 Hershey Regions Bank 618
Energized Differentiation
0.50 0.16 0.17 1.12 Food Network Days Inn 629
Relevance 2.74 0.72 1.39 4.75 Kraft Saab 629
Esteem 0.61 0.30 0.09 1.67 Tylenol Ugly Betty 629
Knowledge 3.54 0.90 0 5.16 Walmart Shaw's Supermarket
630
Brand Stature 2.33 1.54 0.12 8.10 Tylenol Pacific Sunwear 629
Brand Strength 1.36 0.56 0.31 4.24 Discovery Channel
Alamo 629
Overall Asset 3.66 3.63 0.10 23.98 Google Pacific Sunwear 629
Type of Good Search 20.5% / Experience 73.2% / Credence 6.3% 697
Premium/Value Premium 24.8% / Middle 50.5% / Value 24.7% 697
Product / Service Product 52.5% / Service 44.3% / Mix 3.2% 697
Internet Internet 2%/ Non Internet 98% 697
Interbrand top list
Part of Interbrand top 100: 12%/Not a part of Interbrand top 100: 88% 697
* There are multiple versions as to the exact name of the first commercial soap maker, all providing convergent evidence that it dates back to 1620.
** Involvement is measured at the category level
11
Table 3: Variables averages - breakdown by category
Beauty Bevr. Cars Child. Cloth. Dept. stores
Financ. Food Hlth . Home House Media Sports Tech. Telecom Travel
Age 70.55 61.16 60.63 57.25 59.37 41.02 80.71 63.57 68.58 65.42 70 20.32 73.73 43.53 21.68 48.77 Newness relative to the category 108.86 90.33 43.89 67.72 113.7 61.94 101.72 38.78 67.7 80.62 55.69 56.92 20.47 31.74 24.78 67.83
Satisfaction 85.14 84.21 82.61 85 77.08 78.64 75.89 81.17 72.5 80.83 85.17 74.33 74.11 69.92 71.02
Involvement 3.69 3.09 4.32 3.82 3.52 3.18 4.38 3.55 4.17 3.95 3.48 3.62 3.4 4.03 3.91 3.97
Familiarity 3.62 3.19 3.15 4.01 2.95 3.43 2.99 3.31 3.62 3.8 3.92 3.15 3.33 3.26 3.01 3.51
Complexity 1.55 1.62 1.89 1.85 1.95 1.95 2.38 1.55 1.97 1.69 1.36 1.91 2.1 2.04 2.14 2
Visibility 2.94 3.06 3.09 3.26 2.91 3.07 2.68 3.07 3.02 3.08 3.24 2.93 2.63 3.01 2.96 2.98
Perceived risk 1.58 1.6 1.94 1.83 2.03 1.95 2.11 1.62 1.92 1.74 1.38 1.84 2.09 1.8 2.09 1.91
Excitement 3.41 3.22 3.36 3.82 3.44 3.26 3 3.17 2.71 3.55 3.23 3.57 3.4 3.48 3.27 3.24
Competence 3.63 3.21 3.55 3.84 3.4 3.57 3.48 3.41 3.34 3.72 3.65 3.5 3.57 3.71 3.46 3.54
Usage 39.04 38.46 6.4 27.87 29.09 50.12 11.32 51.68 34.84 37.41 55.71 39.79 31.72 22.48 11.08 18.27
Consideration 41.75 38.64 29.18 43.18 35.62 50.46 22.69 52.12 40.89 51.55 57.79 39.5 31.38 39.62 25.35 42.84 Energized Differentiation 0.46 0.45 0.56 0.46 0.54 0.51 0.36 0.44 0.37 0.61 0.46 0.65 0.47 0.62 0.45 0.35
Relevance 2.95 2.74 2.17 2.52 2.54 3.42 2.19 3.27 2.87 3.13 3.56 2.62 2.08 2.83 2.28 2.23
Esteem 0.68 0.51 0.59 0.77 0.53 0.86 0.45 0.68 0.73 0.89 0.95 0.49 0.36 0.71 0.44 0.53
Knowledge 3.69 3.69 3.72 3.35 3.16 3.88 2.77 3.74 3.55 3.77 4.19 3.66 3.62 3.28 3.02 3.34
Brand Stature 2.65 2.01 2.3 2.73 1.89 3.55 1.39 2.78 2.82 3.51 4.04 1.91 1.36 2.52 1.47 1.84 Brand Strength 1.34 1.23 1.18 1.17 1.37 1.73 0.79 1.45 1.04 1.82 1.65 1.72 0.99 1.77 1.03 0.78
Overall Asset 3.71 2.88 2.96 3.56 3.04 6.66 1.31 4.45 3.43 6.55 6.86 4.06 1.5 5.12 1.84 1.47

12
Table 4: Correlations
Age New rel. Satis. Invol. Faml. Comp. Visib. Risk Excite. Compt. Usage Consid.
Ener Diff Relev. Esteem Know. Stat. Strgth.
Ovrl Asset
Age 1 ‐.161** .134 .039 .206
**‐.160
**.105
**‐.182
**‐.319
**.113
** .143
**.227
**‐.307
**.247
**.348
**.238
**.342
**‐.090
* .186
**
New rel. ‐.161
**1 .180
** ‐.067 ‐.065 .025 ‐.101
**.031 .010 ‐.112
** ‐.069 ‐.085
*‐.110
**‐.099
*‐.145
**‐.091
*‐.141
**‐.143
** ‐.153
**
Satis. .134 .180** 1 ‐.347
**.104 ‐.545
**.126 ‐.598
**.227
**.115 .235
**.209
**.194
**.250
**.230
**.266
**.234
**.242
** .195
**
Invol. .039 ‐.067 ‐.347** 1 ‐.018 .382
**‐.069 .312
**‐.084
*.238
** ‐.461
**‐.235
**‐.011 ‐.259
**.012 ‐.170
**‐.053 ‐.166
** ‐.092
*
Familiarity .206** ‐.065 .104 ‐.018 1 ‐.548
** .571
** ‐.545
** ‐.064 .288
** .683
** .787
** ‐.046 .690
** .676
** .780
** .749
** .394
** .613
**
Complexity ‐.160** .025 ‐.545
** .382
** ‐.548
** 1 ‐.496
** .813
** .085
* ‐.013 ‐.654
** ‐.644
** .125
** ‐.616
** ‐.417
** ‐.527
** ‐.479
** ‐.263
** ‐.367
**
Visibility .105**
‐.101** .126 ‐.069 .571
**‐.496
**1 ‐.504
**.118
**.301
** .445
**.513
**.091
*.535
**.507
**.461
**.540
**.407
** .504
**
Risk ‐.182**
.031 ‐.598** .312
**‐.545
**.813
**‐.504
**1 .014 ‐.215
** ‐.636
**‐.657
**.066 ‐.668
**‐.487
**‐.475
**‐.516
**‐.350
** ‐.431
**
Excitement ‐.319**
.010 .227** ‐.084
*‐.064 .085
*.118
**.014 1 .524
** ‐.140
**‐.124
**.598
**‐.169
**‐.090
*‐.137
**‐.122
**.340
** .044
Competence .113** ‐.112
** .115 .238
** .288
** ‐.013 .301
** ‐.215
** .524
** 1 .017 .195
** .296
** .191
** .430
** .109
** .347
** .345
** .355
**
Usage .143** ‐.069 .235
** ‐.461
** .683
** ‐.654
** .445
** ‐.636
** ‐.140
** .017 1 .873
** ‐.026 .847
** .584
** .689
** .682
** .503
** .638
**
Consideration .227**
‐.085* .209
** ‐.235
**.787
**‐.644
**.513
**‐.657
**‐.124
**.195
** .873
**1 ‐.044 .884
**.740
**.741
**.799
**.514
** .710
**
Ener Dif ‐.307**
‐.110** .194
** ‐.011 ‐.046 .125
**.091
*.066 .598
**.296
** ‐.026 ‐.044 1 ‐.013 .104
**.022 .068 .756
** .350
**
Relevance .247** ‐.099
* .250
** ‐.259
** .690
** ‐.616
** .535
** ‐.668
** ‐.169
** .191
** .847
** .884
** ‐.013 1 .800
** .668
** .832
** .614
** .776
**
Esteem .348** ‐.145
** .230
** .012 .676
** ‐.417
** .507
** ‐.487
** ‐.090
* .430
** .584
** .740
** .104
** .800
** 1 .637
** .968
** .585
** .882
**
Knowledge .238** ‐.091
* .266
** ‐.170
** .780
** ‐.527
** .461
** ‐.475
** ‐.137
** .109
** .689
** .741
** .022 .668
** .637
** 1 .774
** .420
** .636
**
Stature .342**
‐.141** .234
** ‐.053 .749
**‐.479
**.540
**‐.516
**‐.122
**.347
** .682
**.799
**.068 .832
**.968
**.774
**1 .572
** .901
**
Strength ‐.090*
‐.143** .242
** ‐.166
**.394
**‐.263
**.407
**‐.350
**.340
**.345
** .503
**.514
**.756
**.614
**.585
**.420
**.572
**1 .799
**
Overall Asset .186** ‐.153
** .195
** ‐.092
* .613
** ‐.367
** .504
** ‐.431
** .044 .355
** .638
** .710
** .350
** .776
** .882
** .636
** .901
** .799
** 1
** Correlation is significant at the 0.01 level (2‐tailed). * Correlation is significant at the 0.05 level (2‐tailed).

13
Table 5: Time variability of some of the Y&R BAV variables
Mean Std. Dev.
Min Max Median MSE Brand
MSE Time
Usage 34.92 23.43 0.07 91.87 31.18 5553.4* 278.2*
Consideration 41.93 17.77 6.63 88.00 40.55 2996.32* 305.78*
Energized Differentiation
0.48 0.16 0.12 1.24 0.45 0.21* 0.15*
Relevance 2.78 0.77 1.11 4.92 2.70 5.65* 0.28*
Esteem 0.63 0.32 0.05 1.97 0.57 0.86* 0.19*
Knowledge 3.79 0.96 ‐1.00 5.66 3.97 8.15* 3.82*
Cutting Edge 8.05 2.75 2.66 19.72 7.49 66.7* 41.56*
Classic 12.91 4.80 2.15 32.93 12.27 191.49* 75.72*
Superior 12.08 4.67 2.56 35.97 11.18 195.88* 60.29*
Chic 7.00 4.07 1.61 29.60 5.65 164.87* 22.52*
Customer Centric
13.02 4.81 2.79 31.61 12.72 192.67* 92.35*
Outgoing 10.82 4.83 1.79 34.84 9.68 217.6* 56.15*
No nonsense 8.26 2.58 2.49 18.40 8.04 56.21* 32.45*
Distant 5.55 2.21 1.58 19.34 5.03 37.21* 16.74*
* F value is significant at the 0.001 level.

14
Potential Research questions This dataset can be used on its own or with other data to shed light on managing and building brands as
well as the role of brands in marketing and economics. Here are some initial ideas:
1. The antecedents of brand perceptions. Understanding what influences brand perceptions is an
important line of research that this data can support. For example, one can study the dependence of
these perceptions on market factors, past investments, date of launch, competition, or the presence of
similar brands in the category.
2. The connection between brand characteristics and features of social networks. Brand
characteristics were already shown to be associated with word of mouth (Lovett, Peres, and Shachar
2013), but they might also be related to other aspects of social networks (such as the speed that
information diffuses through social networks or the effectiveness of seeding).
3. Brand networks. It was recently shown that brands exist as part of a network in which purchasing
one is related to another not just due to substitution effects (e.g. Oestreicher-Singer et al 2013). One
could examine whether the nature of such networks and the connections within it are related to brand
characteristics.
4. Marketing activities and market outcomes. Research on the relationship between marketing
activities and market outcomes has a long history. With this dataset one could study whether the
relationship depends on brand characteristics. For example, a study of the efficiency of a certain
advertising campaign, or a brand promotion, on sales, might benefit from including brand
characteristics (e.g. type of good, age, differentiation, and visibility) as either moderators or controls.
5. The inter-dependence of brand characteristics. As illustrated above, there are some interesting
relationships among the different characteristics. The data can assist in directing and testing theories
about these relationships.
6. Substitution based on brand characteristics. In typical models in marketing, products and brands
are mapped into categories based on functional characteristics of the product and brand substitution is
measured based on purchases. Our data enable a different means of exploring competition by using
brand characteristics to define similarity of brands within a category. For example, are brands with
similar complexity scores perceived as closer substitutes than brands that differ in their complexity?
If two brands are perceived as high on excitement, do they compete more intensely with each other
than with less exciting brands?
7. The role of satisfaction. The satisfaction-loyalty connection has been explored in the CRM literature
(e.g. Richins 1983). This connection might depend on brand characteristics (e.g. for exciting brands,
high satisfaction might convert more or less easily into actual purchase or retention).
15
8. Brand characteristics and brand loyalty - Brand loyalty, both in terms of retention and attitude are
considered to be a desired outcome in the CRM literature. Our data can be used to test to what extent
they depend on the brand characteristics vs. the firm's CRM policy (e.g. are brands with certain
characteristics more robust to service failures; does retention rate or repeat purchase depend on the
brand's level of differentiation, or esteem).
9. Brand characteristics and the financial value of the brand - Assessing the financial value of
brands has a long tradition with various methodologies. Both the cross-sectional and the longitudinal
data can be leveraged to shed new light on this question.
10. The evolution of brand perception. Our data can be viewed as a snapshot taken at one point in time.
Given the detailed description of the way the data was constructed one can take such a snapshot again
(of either all the variables or some of them) and study the evolution of brand perceptions.
Limitations
To some degree the dataset arrives with an expiration date. For all research questions that require
additional data sources (e.g. point 2 above) the brand dataset is useful only if this other data is available
for a similar time period. Otherwise, the measures of brand perceptions may have changed and may be
less relevant. Of course, (1) in many cases it is easy to collect data that describe things as they were in
2010 (e.g. for the purpose of point 1 above), (2) there are many research questions that do not require
additional data sources (e.g. point 5 above), and (3) in some cases having data from 2010 is an advantage
(e.g. point 9 above).
In addition, one other important limitation is the sample selection. The set of brands is made up of large,
widely known brands and lacks smaller, lesser-known brands. Although in some competitive settings
(e.g., telecom and computers), the data includes all of the major players, for other settings the data may be
sparse. This could limit the usefulness of the dataset (without further data collection) for some purposes.
References
Aaker, Jennifer L. (1997), “Dimensions of brand personality,” JMR, Journal of Marketing Research, 34
(3), 347-356.
Ailawadi, Kusum L., Donald R. Lehmann and Scott A. Neslin (2003), “Revenue Premium as an Outcome Measure of Brand Equity,” The Journal of Marketing 67(4) 1-17.
Anand, Bharat N. and Ron Shachar (2011), “Advertising, the Matchmaker,” RAND Journal of Economics, 42(2), 205-245.
16
Cao, Zixia and Alina Sorescu (2013), “Wedded Bliss or Tainted Love? Stock Market Reactions to the Introduction of Co-Branded Products,” Marketing Science, forthcoming.
Fornell, Claes, Michael D. Johnson, Eugene W. Anderson, Jaesung Cha and Barbara Everitt Bryant (1996), “The American Customer Satisfaction Index: Nature, Purpose, and Findings,” The Journal of Marketing, 60 (4) 7-18.
Fournier Susan (1998), “Consumers and Their Brands: Developing Relationship THeory in Consumer Research,” Journal of Consumer Research 24 (4) 343-353.
Laband David N. (1986), “Advertising as Information: An Empirical Note,” The Review of Economics and Statistics, 68(3), 517-552.
Lovett, Mitch, Renana Peres and Ron Shachar (2013), “On Brands and Word of Mouth, ” Journal of Marketing Research 50(4) 427-444.
Mizik, Natalie, and Robert Jacobson (2008), “The Financial Value Impact of Perceptual brand Attributes,” Journal of Marketing Research, 45(1), 15-32.
Moore Gary C. and Izak Benbasat (1991), “Development of an Instrument to Measure the Perceptions of Adopting an Information Technology Innovation,” Information Systems Research, 2(3), 192-222.
Nelson Phillip (1974), “Advertising as Information,” Journal of Political Economy, 82(4), 729-754.
Oestreicher-Singer, Gal, Barak Libai, Liron Sivan, Eyal Carmi and Ohad Yassin (2013), “The Network Value of Products,” Journal of Marketing, 77(1) 1-14.
Oliver, Richard L. (1999), “Whence Consumer Loyalty?,” The Journal of Marketing 63 (sp issue) 33-44.
Ostlund, Lyman E. (1974), “Perceived Innovation Attributes as Predictors of Innovativeness,” Journal of Consumer Research, 1(August), 23-29.
Parasuraman, A., Valarie A. Zeithaml and Leonard L. Berry (1985), “A Conceptual Model of Service Quality and Its Implications for Future Research,” Journal of Marketing , 49 (4), 41-50.
Ratchford, Brian T. (1987), “New Insights About the FCB Grid,” Journal of Advertising Research, ” 27(4), 24-38.
Richins, Marsha L. (1983), “Negative Word-of-Mouth by Dissatisfied Consumers: a Pilot Study,” Journal of Marketing, 47 (1), 68-78.
Rogers (1995), The Diffusion of Innovations, New York: Free Press.
Shachar, Ron,Tulin Erdem, Keisha M. Cutright, and Gavan J. Fitzsimons, (2011). “Brands: The opiate of the nonreligious masses? ” Marketing Science 30(1) 92-110.
Speier, Cheri, and Viswanath Venkatesh (2002), “The Hidden Minefields in the Adoption of Sales Force Automation Technologies,” Journal of Marketing, 66 (3), 98-111.
Stahl, Florian, Mark Heitmann, Donald R. Lehmann, Scott A. Neslin (2012), “The Impact of Brand Equity on Customer Acquisition, Retention, and Profit Margin,” Journal of Marketing 76 (4) 44-63.
Steenkamp, Jan-Benedict E.M. and Inge Geyskens (2013) Manufacturer and Retailer Strategies to Impact Store Brand Share: Global Integration, Local Adaptation, and Worldwide Learning, Marketing Science, forthcoming.


![Stanford University · 3.1 Dataset SQuAD dataset is a machine comprehension dataset on Wikipedia articles with more than 100,000 questions [1]. The dataset is randomly partitioned](https://static.cupdf.com/doc/110x72/602d75745c2a607275039f53/stanford-university-31-dataset-squad-dataset-is-a-machine-comprehension-dataset.jpg)


![Image Space Embeddings and Generalized Convolutional ...Example: Wisconsin Breast Cancer Dataset 569 examples in R30 describing characteristics of cells obtained from biopsy [15] each](https://static.cupdf.com/doc/110x72/5f6a4ac249f0f312eb24fad2/image-space-embeddings-and-generalized-convolutional-example-wisconsin-breast.jpg)


