Western University Western University
Scholarship@Western Scholarship@Western
Electronic Thesis and Dissertation Repository
8-27-2021 3:00 PM
A Case Study on Medium and High Rise Timber Buildings A Case Study on Medium and High Rise Timber Buildings
Moustafa EL-Assaly, The University of Western Ontario
Supervisor: El-Damatty, Ashraf, The University of Western Ontario
A thesis submitted in partial fulfillment of the requirements for the Master of Engineering
Science degree in Civil and Environmental Engineering
© Moustafa EL-Assaly 2021
Follow this and additional works at: https://ir.lib.uwo.ca/etd
Part of the Civil Engineering Commons, and the Structural Engineering Commons
Recommended Citation Recommended Citation EL-Assaly, Moustafa, "A Case Study on Medium and High Rise Timber Buildings" (2021). Electronic Thesis and Dissertation Repository. 8095. https://ir.lib.uwo.ca/etd/8095
This Dissertation/Thesis is brought to you for free and open access by Scholarship@Western. It has been accepted for inclusion in Electronic Thesis and Dissertation Repository by an authorized administrator of Scholarship@Western. For more information, please contact [email protected].
ii
Abstract
Heavy timber is the upcoming and rising star in the construction industry in the European and
north American market. However, this topic is yet to be discovered. Light frame wood LFW
has been used for decades but was always restricted to certain limits. Limits that heavy timber
can overcome easily. In this thesis, topics related to the application of heavy timber in the
construction of buildings are searched. First, a comparative study based on the Canadian
market discussing the alternatives heavy timber can offer such as glulam and cross laminated
timber (CLT) in comparison with LFW when applied to mid-rise buildings. Different heavy
timber structural systems were designed to have equal stiffness as the relative LFW building
while achieving all the strength requirements, a cost comparison is carried out between the
varying heavy timber systems and the LFW system based on the Canadian market. Second, an
investigation is held based on the performance-based design concept for a 19-story glulam
building, with a moment resisting frame as a structural system. The building is numerically
modeled and exposed to real wind loads obtained from the Boundary layer wind tunnel
laboratory (BLWTL). The moment connection shared characteristics based on tests conducted
in the literature on a small moment connection. The wind loads are extracted from a previously
tested rigid model at the BLWTL, and a time history analysis is performed. Following the time
history analysis, decomposition of the wind components is conducted and a reduction factor is
applied to the resonant component. A modified time history response is reapplied to the
building and the new straining actions are evaluated. The connection’s hysteresis behavior is
evaluated after applying the reduction factor. Furthermore, A parametric study is performed
for two damping values. This thesis provides a conclusive study between heavy timber and
LFW that discusses the ability of heavy timber to replace the LFW in commercial buildings.
Also, it demonstrates the capabilities of heavy timber buildings to resist lateral loads such as
wind loads in high altitudes granted that it is provided with an adequate structural system and
a ductile connection that can dissipate the energy implied on it properly.
iii
Keywords
Heavy timber, Glulam, Cross laminated timber (CLT), Performance-based design, Wind
tunnel test, Dynamic time-History analysis, High-rise buildings, Nonlinear analysis.
Summary for Lay Audience
The global demand for the use of sustainable materials has been rising rapidly over the past
decade. There is a paradigm shift in the construction industry towards the green, biodegradable,
and renewable materials. Heavy timber is definitely considered among those materials. Heavy
timber has proven its superiority in many aspect such as being environmentally friendly and a
better insulator when compared to steel, concrete, and light frame wood (LFW). In north
America, most of the residential buildings consist of LFW. Heavy timber is capable of
replacing LFW, while still having room to integrate vertically and reach high altitudes. This
research is divided into two parts, each part discusses the potentials and pushes the heavy
timber to its limits, in terms of using it as a renewable, biodegradable, and a clean material for
construction. The first part is a case study that studies the replacement of LFW through
Conducting a cost comparison according to the Canadian market between an existing multi-
story light frame wood building (LFW) with two concrete cores acting as lateral load resisting
systems and different structural systems of heavy timber, while achieving equal stiffness and
satisfying the strength requirements. The second part of this research evaluates the possibility
of allocating the heavy timber in a high-rise building without using another material as a lateral
load resisting system. Most of the timber high rise buildings fail to resist the lateral loads
resembled in seismic and wind loads, therefore, steel or concrete are used in these buildings as
a lateral load resisting system. In this study, the potential use of ductility-based design is tested
on a 19 story high rise moment resisting frame building that is numerically modelled, exposed
to wind loads which are obtained from a previous test performed at the boundary layer wind
iv
tunnel laboratory (BLWTL), and its behavior is observed, while relying on the connections
ductility.
Co-Authorship Statement
This thesis has been prepared in accordance with the regulations for an Integrated Article
format thesis stipulated by the School of Graduate and Postdoctoral Studies at Western
University. Statements of the co-authorship of individual chapters are as follows:
Chapter 2: Case study for mid-rise building with different wood structural systems
The numerical model was introduced by Dr. A. Hamada. The completion and modification to
the numerical models and the cost comparisons were done by M.EL-Assaly. Under the
continuous assistance of the supervisor Prof. A. A. El Damatty with the co-operation of Dr. A.
Hamada.
Drafts of Chapter 2 were written by M. EL-Assaly, and modifications were done under the
supervision of Prof. A. A. El Damatty. A paper co-authored by M. EL-Assaly, A. A. El
Damatty, and A. Hamada has been published to 2021 CSCE virtual conference.
Chapter 3: Preliminary investigation to assess the application of ductility-based
approach for high-rise timber buildings subjected to extreme wind loads
The numerical model was introduced by Dr. A.Hamada. The completion and modification to
the numerical model was done by M.EL-Assaly under the continuous assistance of the
supervisor Prof. A.A. El-Damatty with the co-operation of Dr. A. Hamada.
Drafts for chapter 3 were done by M.EL-Assaly, and modifications were done under the
supervision of Prof. A.A. El-Damatty.
v
To my parents Dr. Mohamed EL-Assaly & Mrs. Omayma abou-zeid
To my beloved wife Nour El-houda Abou-Seada
To my brother Youssef El-Assaly and sister Jana EL-Assaly
For their support, encouragement, and sharing my journey with me.
To my Supervisor, Prof. A. EL-Damatty
For his guidance, patience, and support during my period at Western.

vi
Acknowledgments
First and foremost, I would like to thank Allah (the Almighty) for all his blessings and mercy,
for granting me strength, patience, and inspiration to pursue and finish my degree at Western
University.
I would like to thank Prof. EL-Damatty for investing in me and for giving me the opportunity
to pursue one of my dreams, without his guidance and patience this thesis wouldn’t have seen
the light. It has been a great pleasure working with him.
I also want to thank Dr. Mahdy for his support throughout my master’s period, and for sharing
his knowledge with me.
I extend my gratitude to my Father Dr. Mohamed EL-Assaly and my mother Omayma
Abouzeid for their continuous emotional support and doing their best to provide the best life
they can offer to me, my brother, and my sister. I am forever in your debt.
I wish to pay a special thanks from the heart to my beloved wife for enduring the long distances
and the mood swings. I want to thank her for her constant love, support, and understanding to
my circumstances.
I would also like to thank my grandparents Dr. Mohamed Abouzeid and Rawya abo-shanif for
their support.
Finally, I would like to offer my sincere appreciation to my friends whom I met in Canada. To
Dr. Ahmed Alaa, Abdelrahman Tarek and Kareem Embaby for being the big brother that I
never had. To my roommates Moustafa El-Bahrawy, and Bahey El-Din. To Fouad El-Ezaby
for his constant support and his after-hours consultations. To my colleagues at Western
University, Amr Ismail, Chu peng, Wesam Abdelhamid, Moustafa Ramadan, Mohamed Abo-
gazia, and Ibrahim Ibrahim.
vii
Table of Contents
Abstract ............................................................................................................................... ii
Summary for Lay Audience ............................................................................................... iii
Co-Authorship Statement................................................................................................... iv
Acknowledgments.............................................................................................................. vi
Table of Contents .............................................................................................................. vii
List of Tables ...................................................................................................................... x
List of Figures ................................................................................................................... xii
1 Chapter 1 ........................................................................................................................ 1
1.1 Introduction ............................................................................................................. 1
1.2 Literature ................................................................................................................. 3
1.3 Research gap ........................................................................................................... 8
1.4 Thesis objective ...................................................................................................... 9
1.5 Thesis organization ............................................................................................... 10
1.6 Case study for mid-rise building with different wood structural systems ............ 10
1.7 Preliminary investigation to assess the application of ductility-based approach for
high-rise timber buildings subjected to extreme wind loads ................................ 11
2 Chapter 2 ...................................................................................................................... 12
2.1 Introduction ........................................................................................................... 12
2.2 Objective ............................................................................................................... 14
2.3 Methodology ......................................................................................................... 14
2.4 Building layout...................................................................................................... 17
2.5 Timber properties .................................................................................................. 19
2.6 Connections........................................................................................................... 21
2.6.1 Type 1: Moment connection ..................................................................... 21
2.6.2 Type 2: Knife connection with several bracing members ........................ 24
viii
2.6.3 Type 3: Knife connection with a single bracing member ......................... 25
2.6.4 Type 4: Gravity connection ...................................................................... 25
2.6.5 Type 5: CLT connection system ............................................................... 26
2.7 Design and validation procedures ......................................................................... 29
2.8 Braced frame semi-rigid connection (BFSRC) ..................................................... 29
2.9 Braced frame pinned connection (BFPC) ............................................................. 34
2.10 Moment resisting frame (MRF) ............................................................................ 37
2.11 Cross laminated timber (CLT) .............................................................................. 40
2.12 Results ................................................................................................................... 43
2.13 Conclusion ............................................................................................................ 46
3 Chapter 3 ...................................................................................................................... 48
3.1 Introduction ........................................................................................................... 48
3.1.1 Research gaps............................................................................................ 49
3.1.2 Methodology ............................................................................................. 49
3.2 Building components ............................................................................................ 50
3.2.1 Building’s description ............................................................................... 50
3.2.2 Timber Elements ....................................................................................... 51
3.2.3 Connection system .................................................................................... 52
3.3 Finite element analysis .......................................................................................... 55
3.4 Wind tunnel testing ............................................................................................... 59
3.4.1 Wind tunnel pressure test model ............................................................... 59
3.4.2 Evaluation of wind forces from the wind tunnel data ............................... 60
3.5 Ductility-based design .......................................................................................... 63
3.6 Evaluation of static and dynamic analysis ............................................................ 65
3.6.1 Dynamic time history analysis .................................................................. 66
3.6.2 Decomposition of wind responses ............................................................ 69
ix
3.7 Ductility based approach....................................................................................... 72
3.8 Redesign of structural system under new sets of loads ......................................... 75
3.9 Effect of reducing the resonant component on the structural dynamic
characteristics ........................................................................................................ 77
3.10 Dynamic time history analysis of the structure with reduced cross sections ........ 79
3.11 Conclusion ............................................................................................................ 79
4 Chapter 4 ...................................................................................................................... 81
4.1 Summary ............................................................................................................... 81
4.2 Conclusions ........................................................................................................... 82
4.3 Recommendation for future work ......................................................................... 84
5 References .................................................................................................................... 84
6 Appendices ................................................................................................................... 88
Appendix A .................................................................................................................. 88
6.1 Appendix B ........................................................................................................... 92
Curriculum Vitae .............................................................................................................. 97
x
List of Tables
Table 1.1: List of constructed tall timber-based buildings ....................................................... 2
Table 2.1: Wind forces on each floor...................................................................................... 19
Table 2.2: Load combinations used from the NBCC 2015 ..................................................... 19
Table 2.3: Strength and modulus of elasticity for D-fir glulam material ................................ 20
Table 2.4: Bending strength and modulus of elasticity for CLT, SPF material...................... 20
Table 2.5: Minimum beam size requirements (courtesy of MyTiCon) .................................. 21
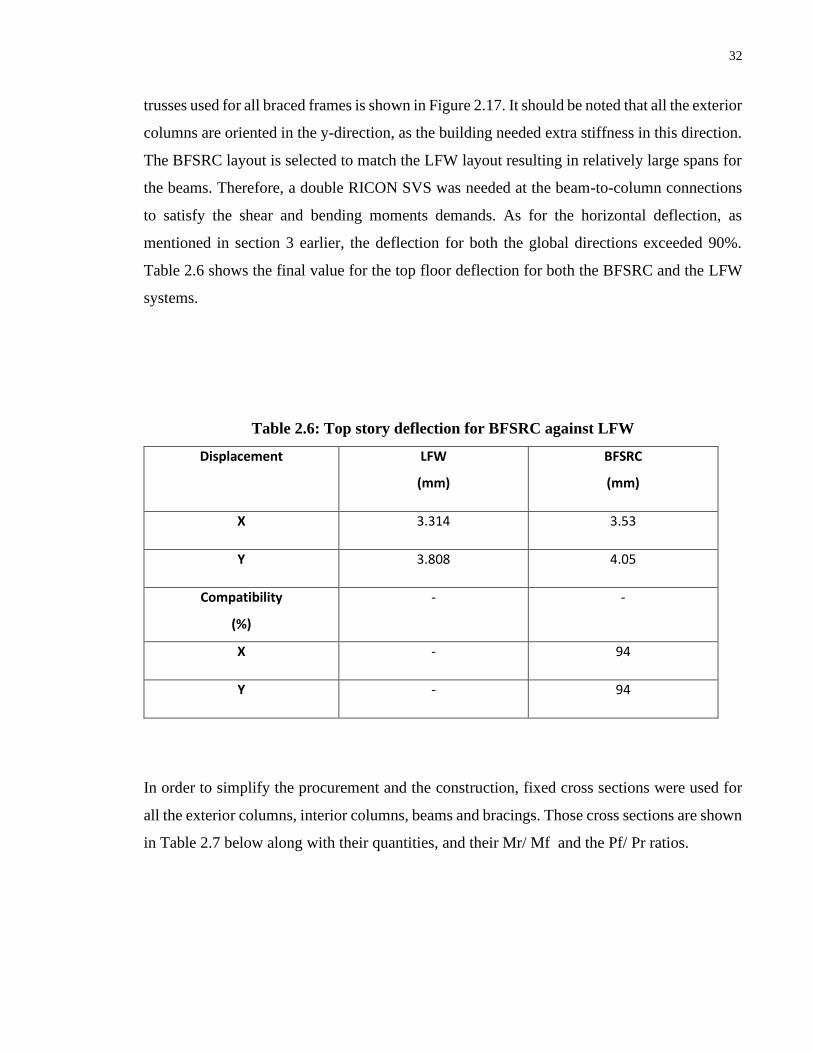
Table 2.6: Top story deflection for BFSRC against LFW ...................................................... 32
Table 2.7: Final cross sections, quantities, cost, and ratios .................................................... 33
Table 2.8: Top story deflection for BFPC against LFW ......................................................... 36
Table 2.9: BFPC final cross sections, quantities, cost, and ratios .......................................... 36
Table 2.10: Top story deflection for MRF against LFW. ....................................................... 39
Table 2.11: MRF final cross sections, quantities, cost, and ratios .......................................... 39
Table 2.12: CLT panel’s physical information ....................................................................... 41
Table 2.13: Top story deflection for CLT against LFW ......................................................... 42
Table 2.14: CLT final cross sections, quantities, cost, and ratios ........................................... 43
Table 2.15: Displacement comparison .................................................................................... 45
Table 2.16: Cost comparison .................................................................................................. 45
Table 2.17: Connection quantities .......................................................................................... 46
Table 3.1: Model analysis results with original cross sections ............................................... 56
xi
Table 3.2: Static base shear ..................................................................................................... 58
Table 3.3: Base shear for different angle of attacks (2% Damping) ....................................... 67
Table 3.4: Base shear for different angle of attacks (1% Damping) ....................................... 68
Table 3.5: Summary of reduction procedure on specified connections .................................. 76
Table 3.6: Comparison between serviceability limits ............................................................. 78
Table 3.7: Modal characteristics for reduced building ........................................................... 78
Table 6.1: BFSRC calculation ................................................................................................ 88
Table 6.2: BFPC calculation ................................................................................................... 89
Table 6.3: MRF calculation .................................................................................................... 90
Table 6.4: CLT calculation ..................................................................................................... 91
Table 6.5: Beam calculation for bending ................................................................................ 92
Table 6.6: Bracing member for axial loading ......................................................................... 93
Table 6.7: CLT wall panel factors .......................................................................................... 94
Table 6.8: CLT wall panels calculation .................................................................................. 95
xii
List of Figures
Figure 2.1: Scope of work ....................................................................................................... 17
Figure 2.2: Building’s layout .................................................................................................. 18
Figure 2.3: Ricon SVS available sizes (courtesy of MyTiCon).............................................. 22
Figure 2.4: A female and a male Ricon connection (courtesy of MyTiCon) ......................... 22
Figure 2.5: Three major axes for Ricon SVS .......................................................................... 23
Figure 2.6: Moment-curvature relationship ............................................................................ 23
Figure 2.7: Double Ricon SVS (courtesy of MyTiCon) ......................................................... 24
Figure 2.8: Knife connection (John Leckie, 2007) ................................................................. 25
Figure 2.9: Knife connection for chevron bracing (John Leckie, 2007) ................................. 25
Figure 2.10: Regular gravity connection (Acton Ostry, 1999) ............................................... 26
Figure 2.11: Illustration of a connection system for a CLT shear wall .................................. 27
Figure 2.12: Measured force vs. displacement curve for a shear bracket (courtesy of UL
FGG) ....................................................................................................................................... 28
Figure 2.13: Measured force vs. displacement curve for a hold-down (courtesy of UL FGG)
................................................................................................................................................. 28
Figure 2.14: Angle shear bracket and hold-down connection (courtesy of MyTiCon) .......... 29
Figure 2.15: BFSRC numerical model.................................................................................... 30
Figure 2.16: BFSRC plan ........................................................................................................ 31
Figure 2.17: Bracing configuration ......................................................................................... 31
Figure 2.18: BFPC numerical model ...................................................................................... 34
xiii
Figure 2.19: BFPC plan .......................................................................................................... 35
Figure 2.20: BFPC bracing configuration ............................................................................... 35
Figure 2.21: MRF numerical model........................................................................................ 38
Figure 2.22: MRF plan ............................................................................................................ 38
Figure 2.23: CLT numerical model ........................................................................................ 41
Figure 3.1: Plan view .............................................................................................................. 51
Figure 3.2: Elevation of the building (source: BLWTL) ........................................................ 51
Figure 3.3: Hysteresis behaviour of RICON SVS 200x80 ..................................................... 53
Figure 3.4: 2 spring model ...................................................................................................... 54
Figure 3.5: 6 springs model .................................................................................................... 54
Figure 3.6: Backbone curve for modified connection ............................................................ 55
Figure 3.7: The first three mode shapes of the building ......................................................... 57
Figure 3.8: Connection behavior under service loading ......................................................... 58
Figure 3.9: Connection behavior under ultimate loading ....................................................... 59
Figure 3.10: Pressure test model tested at the BLWTL (source BLWTL) ............................. 60
Figure 3.11: Ring distribution along the building’s height ..................................................... 62
Figure 3.12: Story forces in X direction for ring 1 ................................................................. 62
Figure 3.13: Scope of work ..................................................................................................... 65
Figure 3.14: Different azimuth analyzed for the dynamic analysis ........................................ 66
Figure 3.15: Total base shear VT-X(t) .................................................................................... 67
xiv
Figure 3.16: Total base shear VT-Y(t) .................................................................................... 67
Figure 3.17: Base shear values with different loading time steps........................................... 70
Figure 3.18: Mean + Background base shear VQ-X(t) ............................................................ 71
Figure 3.19: Mean + Background base shear VQ-Y(t) ............................................................ 71
Figure 3.20: Wind components (M+B+R) V-X(t) .................................................................. 72
Figure 3.21: Wind components (M+B+R) V-Y(t) .................................................................. 72
Figure 3.22: Reduced resonant base shear VR-X(t)/R ............................................................ 73
Figure 3.23: Reduced resonant base shear VR-Y(t)/R ............................................................ 74
Figure 3.24: New design base shear (VT-I-X(t)) ..................................................................... 74
Figure 3.25: New base shear (VT-I-Y(t)) ................................................................................ 75
Figure 3.26: Connection behavior under new sets of dynamic loads ..................................... 77
1
1 Chapter 1
1.1 Introduction
For decades, wood buildings have been used for low-rise buildings. Light frame wood (LFW)
has been considered a suitable solution for residential buildings. As the world shifts into
greener and eco-friendly materials for construction, wood as a material stands out as an
adequate alternative from the typical concrete and steel materials. However, mid, and high-rise
buildings are considered an obstacle for LFW.
LFW does not have enough stiffness nor strength to resist the lateral loads that could be
generated on mid or high-rise buildings. As a result, heavy timber is considered a suitable
alternative for LFW. Heavy timber has more advanced mechanical properties that could
overcome the limitations that face LFW.
Glue Laminated Timber (Glulam) and Cross Laminated Timber (CLT) are both types of heavy
timber. Glulam and CLT are engineered timber products that have witnessed enormous
development in their mechanical properties, such as, stiffness, strength, and ductility. CLT was
first developed in Austria and Germany and ever since has been gaining extreme popularity
for both residential and commercial buildings in Europe.
Over the last few years, both CLT and glulam buildings increased in Europe and north
America. These buildings have become a living proof that heavy timber is indeed a reliable
and an eco-friendly material. The idea basically, revolves around joining several lumbers using
either mechanical or structural adhesives.
Canadian Glulam and CLT are manufactured using one of three Canadian species, each species
has its own grading system and mechanical properties. Douglas Fir-larch (D-Fir), Spruce-
Lodge pole, and Hem-Fir are outlined in the CSA-O86.
To date, tall heavy timber structures are being introduced to the north American market. There
have been several attempts to compete with the traditional concrete and steel structures in terms
of cost, efficiency, and height of structure. It is emerging through the north American market
as a suitable, quick, and efficient alternative to the materials previously mentioned.
2
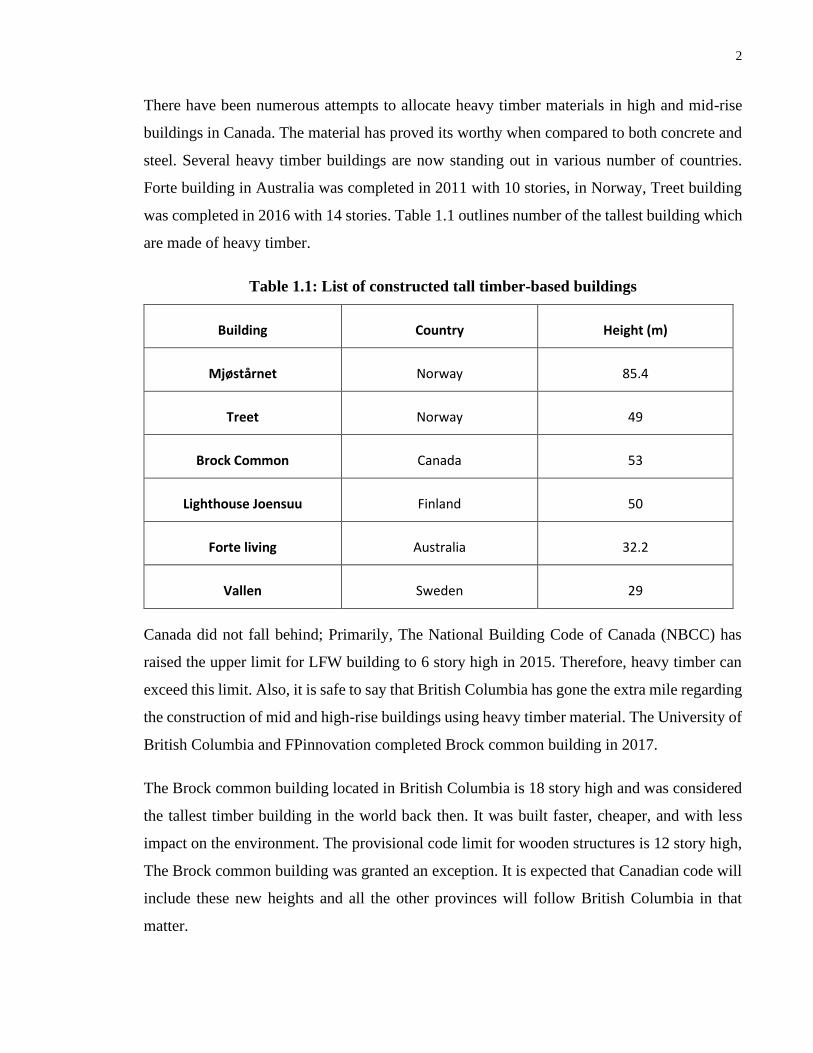
There have been numerous attempts to allocate heavy timber materials in high and mid-rise
buildings in Canada. The material has proved its worthy when compared to both concrete and
steel. Several heavy timber buildings are now standing out in various number of countries.
Forte building in Australia was completed in 2011 with 10 stories, in Norway, Treet building
was completed in 2016 with 14 stories. Table 1.1 outlines number of the tallest building which
are made of heavy timber.
Table 1.1: List of constructed tall timber-based buildings
Building Country Height (m)
Mjøstårnet Norway 85.4
Treet Norway 49
Brock Common Canada 53
Lighthouse Joensuu Finland 50
Forte living Australia 32.2
Vallen Sweden 29
Canada did not fall behind; Primarily, The National Building Code of Canada (NBCC) has
raised the upper limit for LFW building to 6 story high in 2015. Therefore, heavy timber can
exceed this limit. Also, it is safe to say that British Columbia has gone the extra mile regarding
the construction of mid and high-rise buildings using heavy timber material. The University of
British Columbia and FPinnovation completed Brock common building in 2017.
The Brock common building located in British Columbia is 18 story high and was considered
the tallest timber building in the world back then. It was built faster, cheaper, and with less
impact on the environment. The provisional code limit for wooden structures is 12 story high,
The Brock common building was granted an exception. It is expected that Canadian code will
include these new heights and all the other provinces will follow British Columbia in that
matter.
3
The brock common building is considered a hybrid structure due to its 2 concrete cores that
are considered the main lateral resisting system. This building led the way for investors to
invest more in timber-based structures.
1.2 Literature
Extensive studies have been conducted to carve a scientific path for high-rise and mid-rise
heavy timber buildings. It has been rated as top priority research in several academic and
technical facilities.
MyTiCon (MTC) has conducted a research using a typical post and beam glulam structure
which experienced both gravity loads and cyclic loading to test the stresses induced on their
moment connection. The connection type was mainly tested under a quasi-static rotational
loading. This test was done at the structure labs of UBC. MTC tested their commercial
connection called RICON SVS under quasi-static rotational loading and was able to also
withstand static forces while subjected to reversed cyclic rotational forces. These tests
produced Moment vs. rotation graphs which was later used in this study to define the behavior
of connections for both the rigid frame and partially braced frame model.
Shu et al. (2019) conducted a nonlinear analysis for a post tensioned self-centering timber
frame, and for a typical post and beam frame system with timber braces. Both systems were
designed in line with the Chinese design code for a high seismic region. The study examined
seismic performance, peak inter-story drift, residual inter-story drift, and the peak damage
index at the system level.
Several different approaches were proposed to accurately capture the performance. Steel
angles and plates as connections to dissipate the energy rather than relying completely on the
wood. Also, orthotropic engineered wood materials such as laminated veneer lumber (LVL)
and CLT are used to give an upgrade to the timber property. The loading protocol that took
place included dead, live, and wind loads. Seismic loads were further introduced to the model.
Also, the wind loads were only applied to the external walls as a constant value. The seismic
performance of both structural systems was evaluated and compared. The post-tensioned
4
timber solution showed that it could eliminate the inter-story drift and provide fast and cheap
post-earthquake structural restoring capacity.
Tomasi et al. (2015) determined that the mechanical properties of CLT floor panels are very
similar to normal reinforced concrete slabs of equal thickness. This is ideal for mid-rise
building in highly seismic areas. Up till now, there are no general production standards for the
CLT mass production in Europe.
Tomasi et al. (2015) investigated the mechanical behavior of several steel angle brackets
connectors. A range of commercially and specially designed steel bracket connectors were
included in the study. All brackets were evaluated by the European organization for technical
approvals (ETA). More than 100 tests were conducted using both monotonic and cyclic loading
on angle shear brackets. The loading protocol included both monotonic and fully reversed
displacement-controlled loading. The results from both loading protocols showed that, the
capacities of the angle brackets are highly dependent on the geometry of the bracket, the type
of fasteners and their number. Tomasi et al. (2015) proved that it is almost impossible to
establish a guideline for bracket design due to the existence of many altered design variables.
Tomasi et al. (2015) has agreed that it is very hard to predict the behavior of angle shear
brackets. Moreover, it is very complex to derive an equation that would help identify the
number of fastener or the geometry of the shear bracket. The general conclusion was that the
only reliable method are the test-based studies to determine the design capacities.
Dujic et al. (2010) discuss a 7- story CLT building that was built to scale and tested on a
shaking table located in Japan within the SOFIE project. The loading protocol was based on
records from the Kobe 1995 earthquake. The paper had very important assumptions concerning
the mechanical connections, such as stiffness and load bearing capacity. The types of anchors
and their positions were based on a static analysis where the structure was loaded with an
equivalent horizontal seismic force.
Dujic et al. (2010) developed a numerical model using SAP 2000. The modal and time history
dynamic analysis were carried out to compare between the test results and the numerical model.
5
It was concluded that most of the mechanical connectors were not needed since the forces are
being transferred through the compression zones between the panels.
Polastri et al. (2018) examined the seismic behavior of heavy timber building braced with CLT
shear walls. A total of 3 numerical models were developed and dynamically analyzed. All
systems had the same arrangement of shear walls, and type of framework. However, the
anchorage methods for the shear walls, and number of stories were considered as variables.
All the mechanical properties for the connections were obtained from actual testing. This study
was performed to analyze the seismic behavior of the proposed structural system. The results
showed large values for inter-story drifts that exceeded the limit prescribed in the standards
(Eurocode 8). The study indicates that for seismic regions, buildings with CLT shear walls can
control the lateral drifts by providing hold-downs connection system along with metal tie-down
to resist the large uplift forces exerted from the lateral loads. Polastri et al. (2018) results are
considered a comprehensive basis for further exploration and studies for the CLT connection
system.
The stiffness of the timber frame panels is mainly dependent on the bending and shear
flexibility of the composite wall element, and the flexibility of the fasteners. Unfortunately,
the stiffness values for such mechanical fasteners are not included in either Eurocode 5 or
CSA-O86. Even though the problem is discussed in several papers by different authors, only
few empirical and analytical formulas are available in the present literature reviews.
Vogrinec et al. (2018) has executed experimental test for inter-story hold-down connections
which resulted in an analytical expression for one type of the connection. Vogrinec et al. (2018)
performed experimental tests on 2 different types of hold-downs, which are appropriate for
timber framed walls from the upper floor through the ceiling and for lower floors. The
experimental results showed that the connections do not provide enough rigidity, and that their
flexibility should be considered in the design process.
Vogrinec et al. (2018) proposed for hold-down connection with perforated strap an analytical
expression to determine its stiffness.
Kt = na * k
6
Where na is the number of fasteners in the steel to timber connection and K is the slip modulus
per shear plane per fastener. The Eurocode 5 doesn’t provide analytical expressions for
calculating the stiffness for hold-downs however, it provides formulas in which the Slip
modulus per shear plane per fastener can be calculated. The results show as mentioned earlier,
that the hold-down connection does not provide enough rigid support and its flexibility should
be taken into consideration.
Wind design for structures is based on strength provision under ultimate loads, there are
numerous concerns when it comes to designing heavy timber structures. Heavy timber is
considered relatively light weight when compared to steel and concrete. This creates serious
problems as the building height increase. As the building’s height increase the structure
becomes more flexible and vulnerable to lateral loads such as wind and seismic. As the building
becomes more flexible and elastic, this produces a relatively high natural frequency.
Performance based design (PBD) is an approach that tries to overcome the overestimating
factors of the design codes. PBD is becoming a well-known approach for seismic loads and
extreme wind loads. Numerous amounts of research have been conducted in PBD for buildings
under seismic loads, the performance-based wind design (PBWD) is surfacing as a promise
design framework to enhance the current practices performed on tall building. It has been
identified as a national research priority (CTBUH 2014). PBWD was first introduced by
Davenport and Hill-Carroll (1986).
Prescribed code methods for wind design are considered conservative, this is resulting from
limiting the members stresses to their linear-elastic ranges for strength level events. Recent
studies started exploring PBWD for several reasons, such as, the increase of the return period
employed in design wind speed, the current codes have increased the return periods to match
the return periods used in seismic design.
A key challenge in PBWD is applying nonlinear analysis to forecast the inelastic behavior of
the building. In addition to, the characteristics of wind pressure that depends on several factors
such as, shape of the building, terrain exposure, etc. While, on the other hand, the seismic load
characteristics depends on the mass of the building and its surrounding tectonic environment.
7
According to Van de Lindt (2009), Ciampoli et al. (2013a) and Griffis et al (2013b), there has
been several proposed frameworks for PBWD. Gani and Legeron (2012) predicted the
nonlinear response of a single degree of freedom (SDOF) model using a spectral stochastic
method. However, this approach required the use of an equivalent elastic system.
Judd and charney (2015) performed a nonlinear dynamic analysis to examine the inelastic
behavior for a 10 story SDOF steel building. One of the main aims of this study was to
investigate if the load reduction factor used for seismic could be used, and would it result in
an economic design. It was concluded that by providing a limited level of ductility for the
moment frame system, a load reduction factor of 2 was considered adequate.
The serviceability of a tall mass building was examined using load information from wind
tunnel tests. The building was tested under ultimate limit state design according to ASCE 7-
10, while maintaining the serviceability checks satisfied according to ASCE 7-10 and the
national building code of Canada NBCC.
The lateral load resisting systems consisted of glulam columns, CLT cores, and spandrel
Reinforced concrete beams. All the lateral load resisting components followed the capacity
design concept, so that inelastic rotation and damage should happen to the RC beams,
connections for the CLT would enter its plastic phase, and wood crushing would occur.
Bezaneh et al. (2018a) stated that the governing lateral loads that led the building to failure
were wind loads. After performing dynamic analysis based on real wind loads obtained from
wind tunnel testing, the building did satisfy the drift requirements of the building codes with a
small safety margin. However, these results neglected the uncertainties in the design such as,
wind speed and errors from the wind tunnel testing. Bezabeh et al. (2018b) performed a
probabilistic study for a better understanding of the behavior of the building.
El Ezaby and EL Damatty (2020) constructed a three-dimensional numerical model for a 65-
story building to assess the adaptation of ductility-based design approach in the wind design.
The lateral load resisting system was concrete shear walls, real wind loads were applied to the
high-rise building, both dynamic and quasi-static analysis were conducted in-order to capture
the wind components. A reduction factor of “2” was used on the resonant component to obtain
8
the reduced inelastic loads. The reduced resonant component was then added to the mean, and
background component. The elements of the lateral load resisting system were re-evaluated
and re-designed under the new sets of reduced loads. The results showed that the shear walls
were reduced in size by 20-25 % with no major change in the fundamental period of the
structure. El Ezaby and El Damatty (2020) compared the dynamic characteristics of the
building before and after the reduction of the loads and the cross-sections, it showed no major
changed has happened to the structure.
1.3 Research gap
The Canadian market tend to use LFW in most of the commercial buildings, while the use of
heavy timber is considered minimal. This is due to several reasons such as: the unknown
behavior of the connection systems related to the heavy timber as a material, and the higher
cost when using heavy timber.
The construction of a high-rise building without the aid of another lateral supporting system
other than timber is still considered a challenge. This is resulting from the lack of enough
research that discusses and study’s the connection’s behavior and heavy timber as a material.
The connections are considered the element with enough ductility that allow for the dissipation
of energy exerted from lateral loads such as winds and seismic loads.
As mentioned earlier in the literature by Tomasi et al. (2015) and many others, almost all the
studies that were conducted on connection systems recognized the difficulty in predicting the
behavior of these connections. It also concurred that, experimental testing is considered the
most reliable approach for a better understanding to their behavior. Therefore, in this thesis, an
existing commercial connection that has been experimentally tested before at the University of
British Columbia (UBC) is mathematically improved and enhanced to fit a certain criteria that
will be discussed in chapter 3.
Moreover, most of the available literature focuses on one type of dynamic loading, which is
seismic loading. Also, it focuses on the CLT connection system. Meanwhile, chapter 3
concentrates only on wind loads rather than seismic and on developing a moment connection
that can provide enough ductility to withstand extreme wind loads. Heavy timber buildings
9
tend to be light weighted compared to both steel and concrete buildings, this results in a more
flexible structure which will acquire a relatively large natural period and make it more
susceptible to extreme wind loads.
Furthermore, a conclusive comparison between static loading and dynamic loading is
conducted on an all-heavy timber 19-story building. The static loads are acquired from the
NBCC 2015, while the dynamic loads are obtained from a previously conducted test at the
BLWTL.
If ductility-based design is applied adequately, this will result in smaller cross-sections or a
reduction in the number of connections used, which will make the building exposed to even
higher fluctuating component. Therefore, a ductile connection could improve the behavior of
the building.
Based on the addressed research gap in the literature, Chapter 2 concentrates on the heavy
timber as a reliable material against LFW by performing an informative comparison based on
the Canadian market. This is stemming from the lack of heavy timber presence as a material
in the Canadian market. Chapter 1 also provides a cost comparison between several different
heavy timber structural systems against LFW. This study introduces the heavy timber as a
strong competitive material against LFW.
Chapter 3 focuses on exposing a mid-rise all-heavy timber building that has a Moment resisting
frame as a lateral resisting system subjected to realistic wind loads obtained from the BLWTL
to both dynamic and static loading while, comparing the outcome results in terms of
serviceability and strength.
1.4 Thesis objective
The main objectives for this thesis are summarized as follows:
1- Conduct a cost comparison between an existing multi-story light frame wood
building (LFW) and different structural systems of heavy timber, while achieving
equal stiffness and satisfying the strength requirements.
10
2- Assess the potential use of ductility-based design on high rise heavy timber
building, while relying on the moment connection’s ductility.
3- Perform a comparison between quasi-static analysis and dynamic analysis on high
rise heavy timber building by increasing the time step, in order to eliminate the
resonant component.
4- Develop a framework for ductility-based design for heavy timber mid-rise building
subjected to extreme wind loads.
1.5 Thesis organization
This thesis has been prepared in a monographic format. In chapter 1, a review of the literature
traces the applications and the latest research conducted in the heavy timber field, it also
addresses the research gap and outlines the objectives from the studies conducted in the thesis.
In chapter 2, A study is executed to assess through a case study, the economic viability of
various heavy timber systems used in a multi-story building in comparison with the light-frame
wood (LFW) system. Several finite element models are developed using different heavy timber
materials, connection systems, and structural systems. In Chapter 3, A non-linear analysis is
conducted on a high-rise numerical finite element model. The model is developed using glulam
as a material and moment resisting frame as the lateral supporting system. This study is carried
out to assess the non-linear behavior of the connection assigned in the model by applying real
wind loads obtained from a wind tunnel pressure test to evaluate the full dynamic, quasi-static
response of the building, and the ductility demand (µ).
1.6 Case study for mid-rise building with different wood structural systems
In this chapter, The study is conducted to introduce the heavy timber as a competitive material
against LFW. It discusses the outcomes of a comparative study performed on four different
heavy timber systems against to those of LFW system, when used in the design of a mid-rise
building. The paper starts with allocating four structural systems with an adequate heavy
timber material and modeling each system using a finite element program (ETABS 2016), then
choosing a suitable cross-section according to the prefabricated connection requirements.
11
Following this step, both the gravity loads, and lateral loads are applied according to the NBCC
(2015). Cross sections are then designed following the guidelines of the CSA-O86. Finally,
after achieving an acceptable building top deflection ratio compared with the LFW building, a
cost comparison study is conducted among all considered buildings.
1.7 Preliminary investigation to assess the application of ductility-based approach for high-rise timber buildings subjected to extreme wind loads
In this chapter, a numerical 3D model is developed for a 19-story building using ETABS
software. The building’s main lateral load resisting system is glulam moment resisting frames.
The connection system is extrapolated based on the RICON SVS 200x80 to fit larger beam
sizes and to increase its capacity. The model is analyzed under ULS and SLS according to the
(NBBC), and the behavior of the connection is monitored. Real wind loads are taken from
wind tunnel testing. The testing is conducted at the BLWTL at the University of Western
Ontario. Dynamic time history analysis is performed to assess the full dynamic response of the
building. A Quasi-static analysis is conducted to separate the Mean+background and the
resonant responses by introducing a relatively high time step. The wind response is then
decomposed into Mean, background, and resonant component. A Load reduction factor (R) is
applied to the resonant part, and the number of connections is altered. The building’s behavior
is monitored, the ductility demand (µ) is evaluated, and the number of connections is compared
before and after the reduction factor is applied, while maintaining the serviceability limits
stated by the NBCC.
12
2 Chapter 2
2.1 Introduction
Light frame wood (LFW) structures have been used for decades in low-rise buildings. Wood
is a reliable, efficient, and most importantly a clean material for construction. However, when
used in the construction of medium and high-rise buildings, light frame wood (LFW) systems
fail to have enough stiffness and strength to resist the applied lateral loads. An alternative
material with advanced mechanical properties that could overcome the limitations of LFW, is
heavy timber. As the industry’s goals shift to creating buildings that are more environmentally
friendly and sustainable, the demand for heavy mass timber is increasing. Wood buildings are
sustainable because they are made of renewable and natural materials; Moreover, they are
enjoyable for people to work in, Richmond (2020). Canada has a wide variety of wood species,
such as Douglas fir Larch(D-fur), Spruce-Lodgepole Pine (SPF), and Hem-Fir. All these
species contribute to the production of heavy timber. Heavy timber buildings consist of beams,
columns, walls, floors, and foundations. Typically, foundations are cast-in-place (CIP)
concrete to provide more durability to soil and weather elements. As for heavy timber walls
and floors, different heavy timber products can be used such as Cross-Laminated Timber
(CLT), Nail-Laminated Timber (NLT or nail-lam), Glued-Laminated Timber (GLT or
Glulam), and Dowel-Laminated Timber (DLT), Miyamoto et al. (2020). As for beam and
columns, Glued Laminated Timber (GLT or Glulam) and Engineering Wood Composites
(EWC) are the most used products. The two most used timber products in construction are
CLT and glulam, Miyamoto et al. (2020). Glulam and cross laminated timber are engineered
heavy timber products that have witnessed enormous manufacturer development in the recent
years, such as: stiffness, strength, ductility, and durability. Therefore, this study focuses on
those two products. CLT is made of several layers of large wood panels ranging from around
2.1 cm to 5.1 cm (5/6 to 2 inches) thick that are placed perpendicular to each other, then finger
jointed and glued together. This type of mass timber is typically used for wall and floor panels.
The main benefit of CLT is its crossed layers orientation, which unlike other mass timber
products, provides similar mechanical properties in both in-plane directions (Karacabeyli and
Douglas, 2013). This is ideal for mid-rise buildings in high seismic areas. Typically, CLT is
used for shear walls in mid-rise and high-rise heavy timber buildings. The shear walls are
13
positioned directly on Reinforced Concrete (RC) foundation walls or on a concrete transfer
slabs Tomasi et al. (2015). Glulam is made of layers of wood or laminations that are glued and
end jointed together with the orientation of the wood being parallel to the grain along the length
of the beam or height of column. The thickness of each lamination is typically 1.5 inches.
Glulam is generally used in the fabrication of beams. According to the American plywood
association (APA), a non-profit trade group that researches and tests manufactured lumber,
glulam has higher strength than steel when it comes to strength to weight ratio (Gulam Product
Guide, 2017). Prefabricated steel connections and long driven screws are typically needed to
assemble timber elements instead of nails as for LFW structures. Connections have been
undergoing significant improvements in recent years based on experimental approach. Full
understanding of heavy timber connections and research are still behind with limited resources
available in the literature. As the demand for tall wood-based buildings is constantly
increasing, it is essential to understand the different types of connections. The transfer of
internal forces between wood components can be complicated and therefore it is important to
pay close attention to the different connections employed (Bainbridge & Mettem (1998). It
was pointed by Vogrinec et al. (2018) that Eurocode 5 (1994) does not provide suitable
formulas for calculating either strength or stiffness for CLT walls hold-down anchors which
are a key element in CLT walls connection systems. Also, Tomasi et al. (2015) has agreed that
it is very hard to predict the behavior of CLT connection systems. Moreover, it is very complex
to derive an equation that would help identify the number of fasteners or the geometry of the
shear bracket, which is the second key element in a CLT connection system. The general
conclusion is that the only reliable method is test based studies to determine design capacities,
Tomasi et al. (2015). Authors have suggested including more contributions when estimating
the stiffness and strength of heavy timber connection systems, due to the lack of literature
regarding the deformation of the fasteners that connects the element to the anchor system. The
design of buildings in cross-laminated system is not yet considered by European standards,
Dujic et al. (2010)
14
2.2 Objective
The objective of this study is to assess, through a case study, the economic viability of various
heavy timber systems used in a multi-story building in comparison with light-frame wood
(LFW) system.
2.3 Methodology
The reference structure is a real 4-storey L-shaped LFW building recently constructed in
Canada. The same building layout is remodeled and redesigned using four different heavy
timber structural systems:
1) heavy timber Moment resisting frames (MRF).
2) heavy timber Braced Frame with Pinned Connections (BFPC) as beam-column
connection.
3) braced frame with semi-rigid connection (BFSRC) between beams and columns.
4) shear walls using Cross laminated timber (CLT) panels.
The four structural systems are numerically modelled using the commercial software ETABS.
In order to be able to compare between the different systems, the layout, and dimensions of the
structural system of the four heavy timber buildings are configured such that those buildings
have almost the same lateral stiffness as the reference LFW building. A key element that
governs the behavior of timber structures is the connection between various elements. To
assure that the study is realistic, connections with known mechanical characteristics based on
test results are used in the study. The choice of the members for the heavy timber systems is
restricted to those used in the experimental testing. In addition, all members are designed to
satisfy the strength requirements under the combined effects of gravity and lateral loads
according to the CSA-O86 provisions. A cost comparison, based on Canadian market, between
the four buildings is presented with in detailed break-down of the major cost differences. The
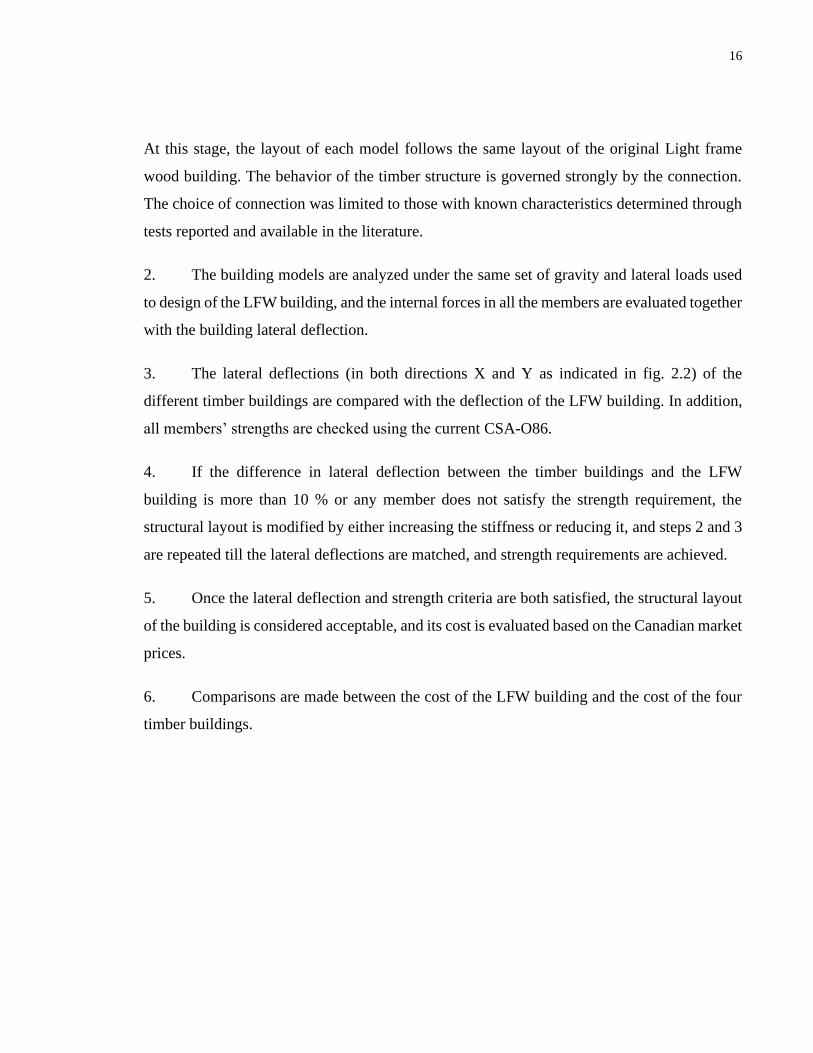
methodology used in the study is demonstrated by the flow chart shown in Figure 2.1 and
follows those steps.
15
1. A three-dimensional nonlinear finite element models are developed for the building as
follows:
a) Braced Frame Pinned Connection (BFPC).
b) Braced Frame with Semi-Rigid Connection (BFSRC).
c) Moment Resisting Frame (MRF).
d) Cross Laminated Timber (CLT).
For BFPC, the study building is modelled using beam and column system to support gravity
load with braced frames supporting the lateral loads. Glulam is used for beams, columns, and
bracing. CLT panels were used as the flooring system for the LFW, and therefore, the flooring
system remained the same as the actual building to ensure same diaphragm performance and
loads. The connection between the beam and columns are assumed to be fully hinge connection
with rotation capabilities, same as for the connection between bracing and beam\column.
For BFSRC, the same procedures are followed. Glulam is used for all the building components;
the floor system is kept the same as the actual building to guarantee the same behavior. As for
the connections, the braced frames connections are assumed to be semi-rigid. This approach is
more realistic as some multi-bolted wood connections are not fully hinged. More information
regarding the behavior of the connections used and their mechanical properties are discussed
in the following sub-sections.
The MRF model is slightly different than the previous models. The lateral resistance is
obtained from the moment connection, which is installed at each bay.
Finally, the CLT model is modelled using shear walls to support the gravity loads and to
laterally resist the applied wind loads. The CLT shear wall panels are located to match the
layout of the LFW walls. While maintaining the floor system similar to the LFW to ensure the
same behavior. The CLT wall panels have a specific connection system that consist of hold-
downs and shear angle brackets. This connection system is discussed in the upcoming sub-
sections.
16
At this stage, the layout of each model follows the same layout of the original Light frame
wood building. The behavior of the timber structure is governed strongly by the connection.
The choice of connection was limited to those with known characteristics determined through
tests reported and available in the literature.
2. The building models are analyzed under the same set of gravity and lateral loads used
to design of the LFW building, and the internal forces in all the members are evaluated together
with the building lateral deflection.
3. The lateral deflections (in both directions X and Y as indicated in fig. 2.2) of the
different timber buildings are compared with the deflection of the LFW building. In addition,
all members’ strengths are checked using the current CSA-O86.
4. If the difference in lateral deflection between the timber buildings and the LFW
building is more than 10 % or any member does not satisfy the strength requirement, the
structural layout is modified by either increasing the stiffness or reducing it, and steps 2 and 3
are repeated till the lateral deflections are matched, and strength requirements are achieved.
5. Once the lateral deflection and strength criteria are both satisfied, the structural layout
of the building is considered acceptable, and its cost is evaluated based on the Canadian market
prices.
6. Comparisons are made between the cost of the LFW building and the cost of the four
timber buildings.
17
Figure 2.1: Scope of work
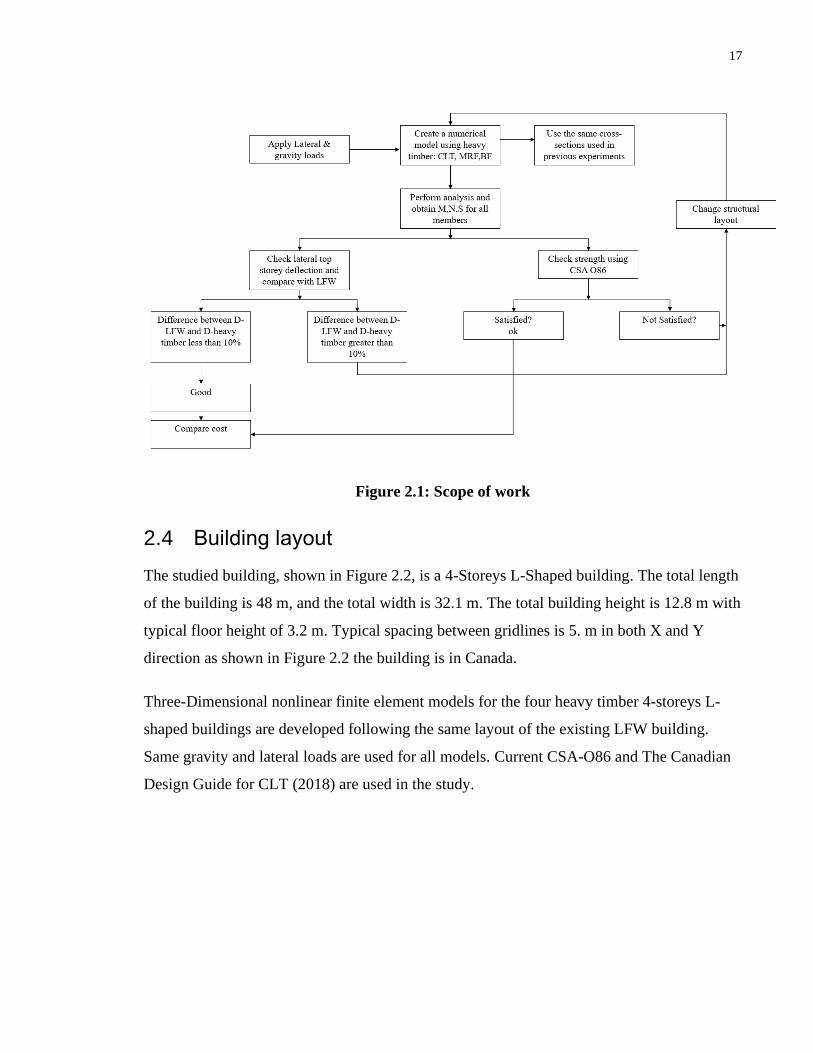
2.4 Building layout
The studied building, shown in Figure 2.2, is a 4-Storeys L-Shaped building. The total length
of the building is 48 m, and the total width is 32.1 m. The total building height is 12.8 m with
typical floor height of 3.2 m. Typical spacing between gridlines is 5. m in both X and Y
direction as shown in Figure 2.2 the building is in Canada.
Three-Dimensional nonlinear finite element models for the four heavy timber 4-storeys L-
shaped buildings are developed following the same layout of the existing LFW building.
Same gravity and lateral loads are used for all models. Current CSA-O86 and The Canadian
Design Guide for CLT (2018) are used in the study.
18
Figure 2.2: Building’s layout
The floors of the building are assumed to be rigid in-plane and are therefore modeled as rigid
diaphragms. Gravity loads were calculated based on the NBCC 2015 and included: Own
weight (DL), live loads (LL), super-imposed dead loads (SDL), snow loads (SL) and wind
loads. The values of the wind loads acting on each floor of the building in both the x and y
directions are provided in Table 2.1 below. Seismic loads are not considered in the current
study for two reasons, a) seismic loads depend on building mass which change based on the
change of the structure system and the location of the building, and b) wind loads were
considered the main focus for this study. Those loads were applied at the geometric center of
the building. Also, Load combinations obtained from the NBCC 2015, shown in Table 2.2 are
used.
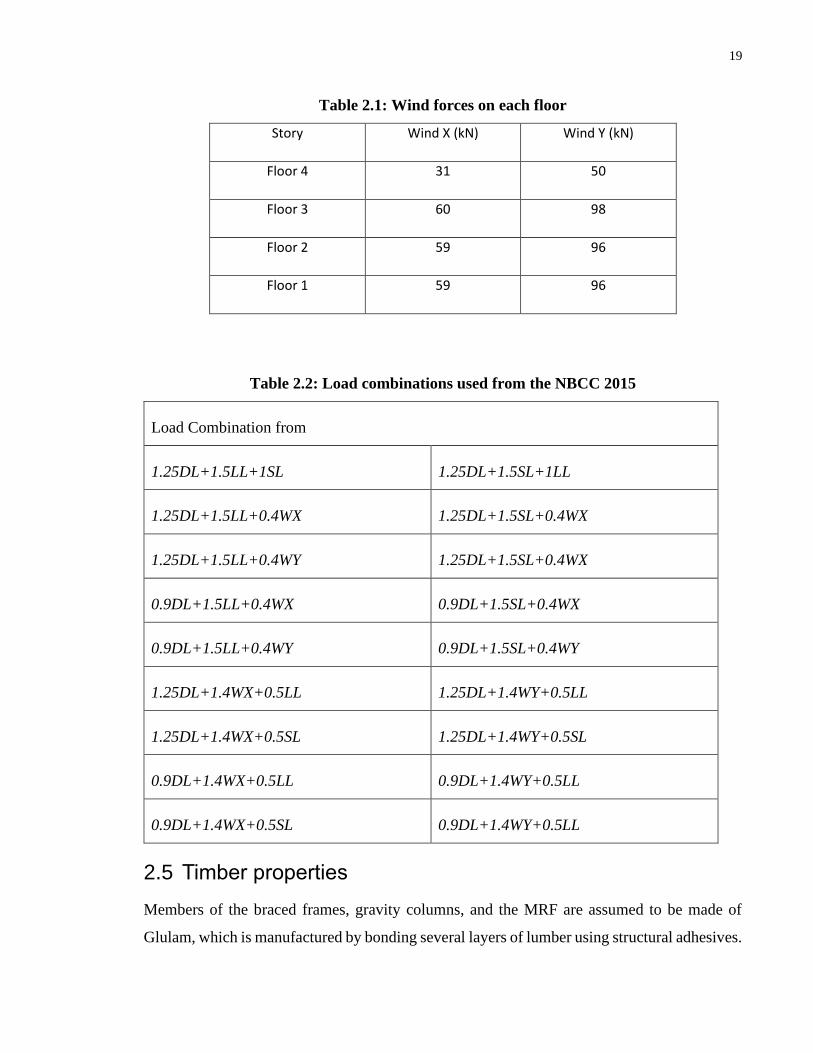
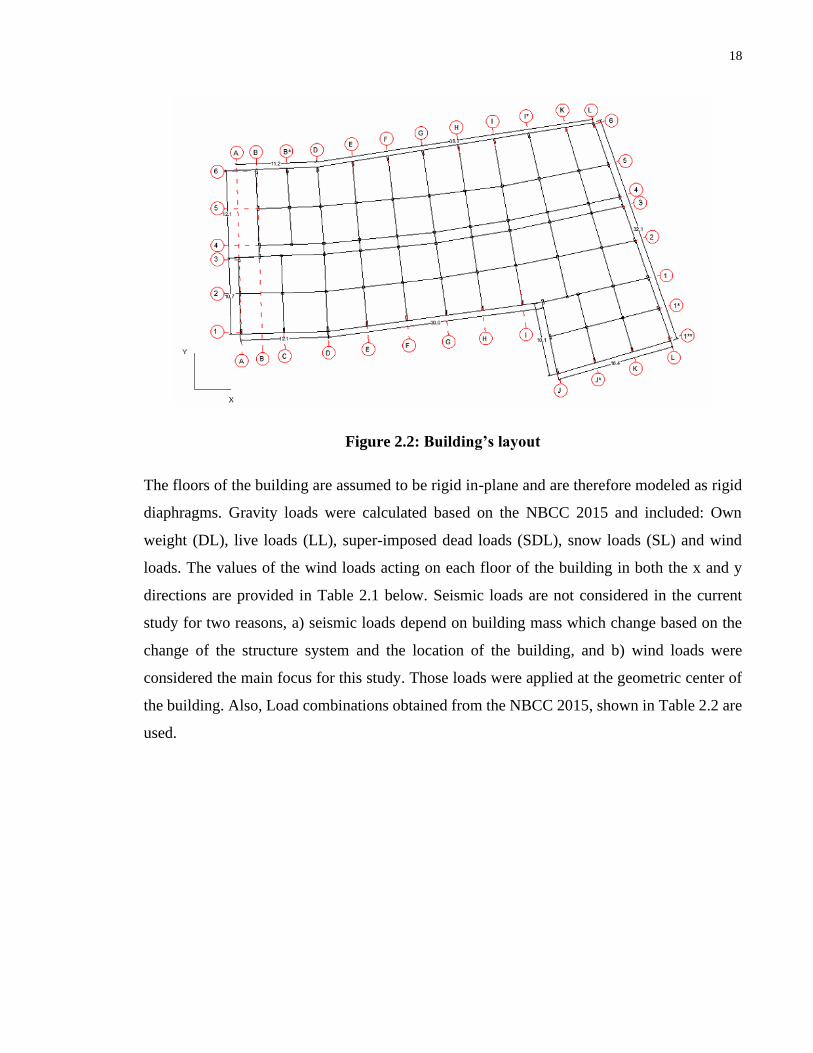
19
Table 2.1: Wind forces on each floor
Story Wind X (kN) Wind Y (kN)
Floor 4 31 50
Floor 3 60 98
Floor 2 59 96
Floor 1 59 96
Table 2.2: Load combinations used from the NBCC 2015
Load Combination from
1.25DL+1.5LL+1SL 1.25DL+1.5SL+1LL
1.25DL+1.5LL+0.4WX 1.25DL+1.5SL+0.4WX
1.25DL+1.5LL+0.4WY 1.25DL+1.5SL+0.4WX
0.9DL+1.5LL+0.4WX 0.9DL+1.5SL+0.4WX
0.9DL+1.5LL+0.4WY 0.9DL+1.5SL+0.4WY
1.25DL+1.4WX+0.5LL 1.25DL+1.4WY+0.5LL
1.25DL+1.4WX+0.5SL 1.25DL+1.4WY+0.5SL
0.9DL+1.4WX+0.5LL 0.9DL+1.4WY+0.5LL
0.9DL+1.4WX+0.5SL 0.9DL+1.4WY+0.5LL
2.5 Timber properties
Members of the braced frames, gravity columns, and the MRF are assumed to be made of
Glulam, which is manufactured by bonding several layers of lumber using structural adhesives.
20
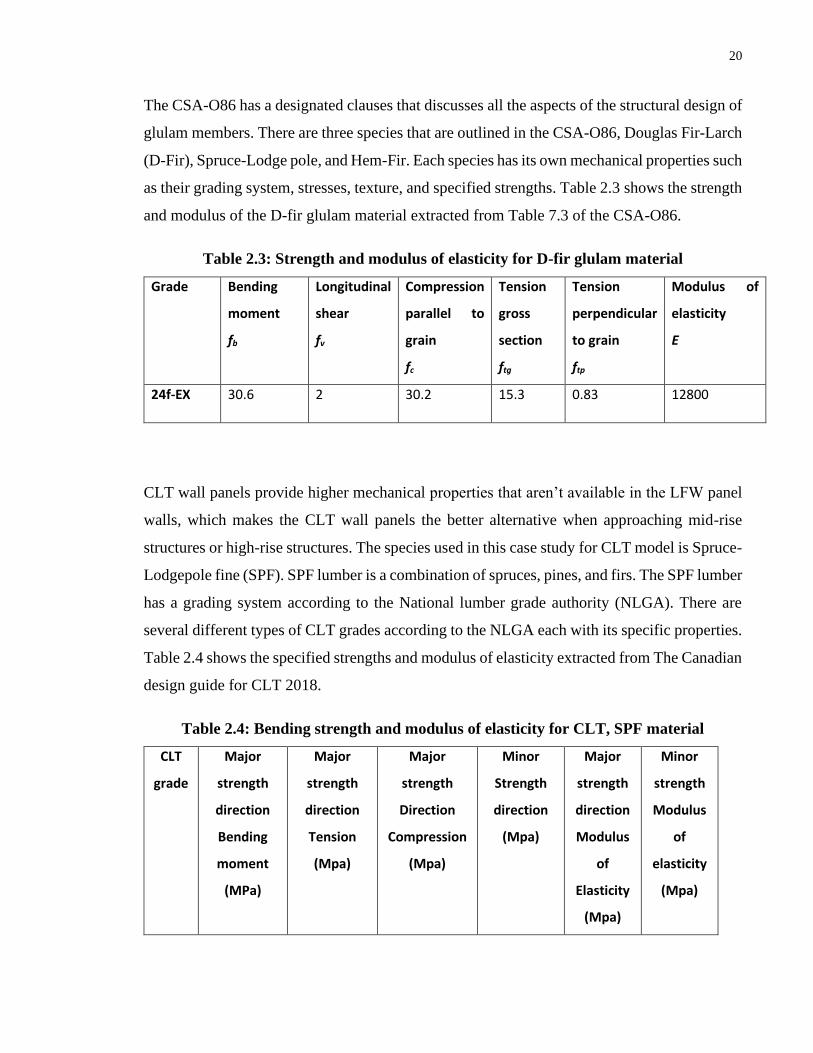
The CSA-O86 has a designated clauses that discusses all the aspects of the structural design of
glulam members. There are three species that are outlined in the CSA-O86, Douglas Fir-Larch
(D-Fir), Spruce-Lodge pole, and Hem-Fir. Each species has its own mechanical properties such
as their grading system, stresses, texture, and specified strengths. Table 2.3 shows the strength
and modulus of the D-fir glulam material extracted from Table 7.3 of the CSA-O86.
Table 2.3: Strength and modulus of elasticity for D-fir glulam material
Grade Bending
moment
fb
Longitudinal
shear
fv
Compression
parallel to
grain
fc
Tension
gross
section
ftg
Tension
perpendicular
to grain
ftp
Modulus of
elasticity
E
24f-EX 30.6 2 30.2 15.3 0.83 12800
CLT wall panels provide higher mechanical properties that aren’t available in the LFW panel
walls, which makes the CLT wall panels the better alternative when approaching mid-rise
structures or high-rise structures. The species used in this case study for CLT model is Spruce-
Lodgepole fine (SPF). SPF lumber is a combination of spruces, pines, and firs. The SPF lumber
has a grading system according to the National lumber grade authority (NLGA). There are
several different types of CLT grades according to the NLGA each with its specific properties.
Table 2.4 shows the specified strengths and modulus of elasticity extracted from The Canadian
design guide for CLT 2018.
Table 2.4: Bending strength and modulus of elasticity for CLT, SPF material
CLT
grade
Major
strength
direction
Bending
moment
(MPa)
Major
strength
direction
Tension
(Mpa)
Major
strength
Direction
Compression
(Mpa)
Minor
Strength
direction
(Mpa)
Major
strength
direction
Modulus
of
Elasticity
(Mpa)
Minor
strength
Modulus
of
elasticity
(Mpa)
21
fb ft,0 fc fb Eo Eo
E1M5 30.4 17.7 19.9 11.8 12400 9000
2.6 Connections
The connection system used for every model was considered a challenge, as every connection
has its own requirements, and load capacities. In many occasions throughout this study, the
selection of the cross sections was dependent on the connections’ requirements.
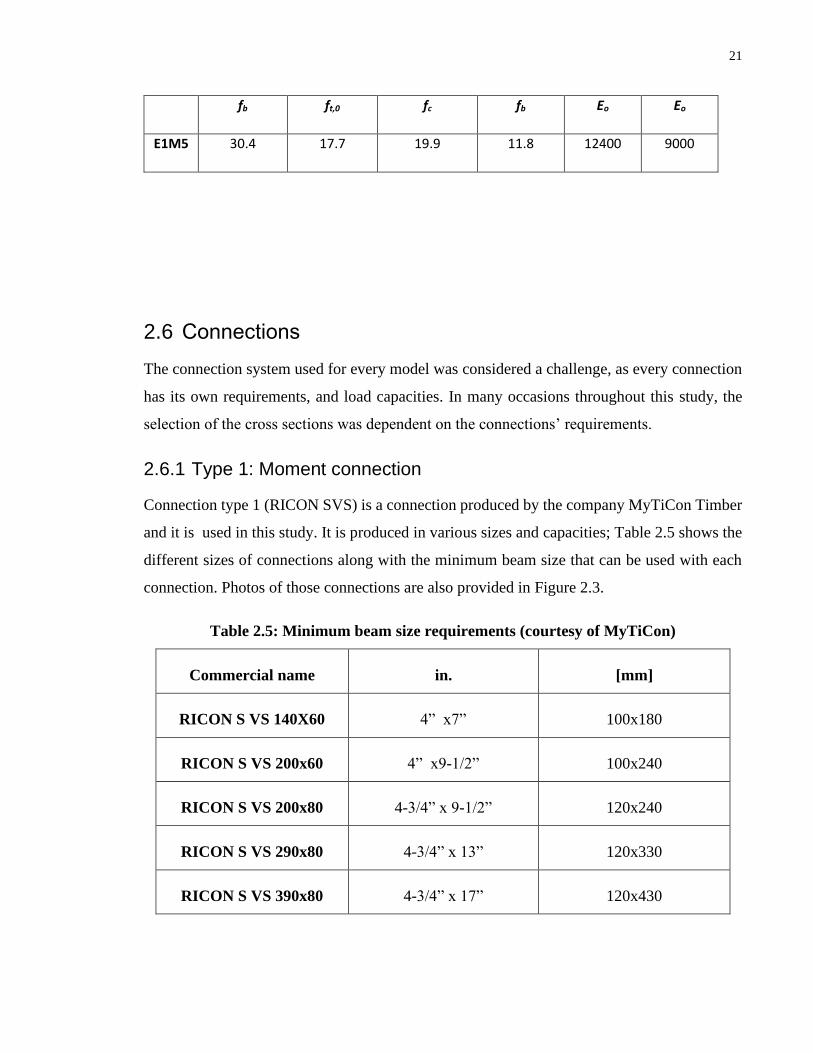
2.6.1 Type 1: Moment connection
Connection type 1 (RICON SVS) is a connection produced by the company MyTiCon Timber
and it is used in this study. It is produced in various sizes and capacities; Table 2.5 shows the
different sizes of connections along with the minimum beam size that can be used with each
connection. Photos of those connections are also provided in Figure 2.3.
Table 2.5: Minimum beam size requirements (courtesy of MyTiCon)
Commercial name in. [mm]
RICON S VS 140X60 4” x7” 100x180
RICON S VS 200x60 4” x9-1/2” 100x240
RICON S VS 200x80 4-3/4” x 9-1/2” 120x240
RICON S VS 290x80 4-3/4” x 13” 120x330
RICON S VS 390x80 4-3/4” x 17” 120x430
22
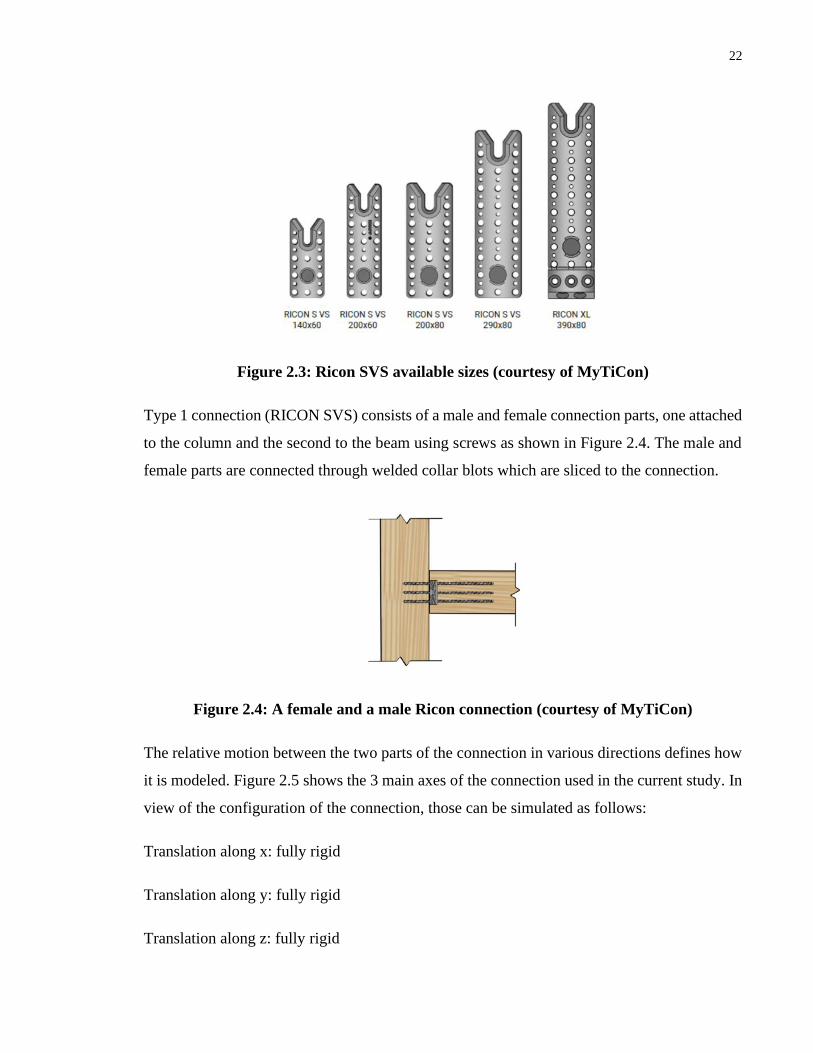
Figure 2.3: Ricon SVS available sizes (courtesy of MyTiCon)
Type 1 connection (RICON SVS) consists of a male and female connection parts, one attached
to the column and the second to the beam using screws as shown in Figure 2.4. The male and
female parts are connected through welded collar blots which are sliced to the connection.
Figure 2.4: A female and a male Ricon connection (courtesy of MyTiCon)
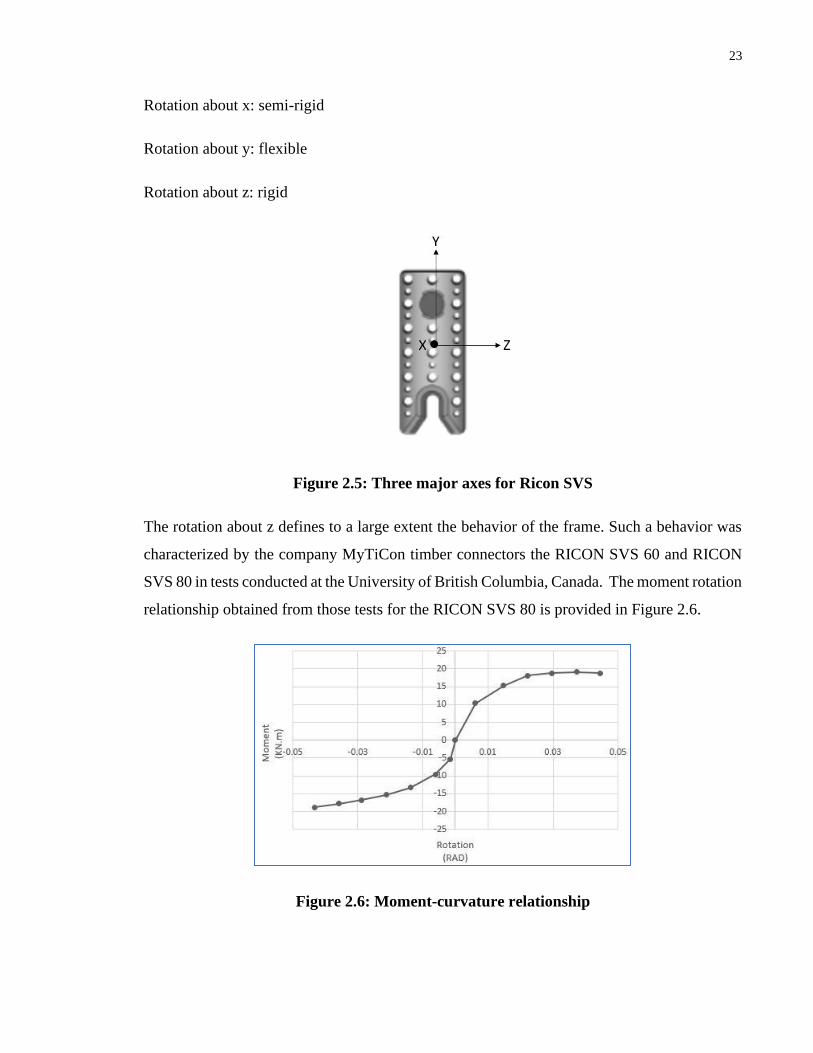
The relative motion between the two parts of the connection in various directions defines how
it is modeled. Figure 2.5 shows the 3 main axes of the connection used in the current study. In
view of the configuration of the connection, those can be simulated as follows:
Translation along x: fully rigid
Translation along y: fully rigid
Translation along z: fully rigid
23
Rotation about x: semi-rigid
Rotation about y: flexible
Rotation about z: rigid
Figure 2.5: Three major axes for Ricon SVS
The rotation about z defines to a large extent the behavior of the frame. Such a behavior was
characterized by the company MyTiCon timber connectors the RICON SVS 60 and RICON
SVS 80 in tests conducted at the University of British Columbia, Canada. The moment rotation
relationship obtained from those tests for the RICON SVS 80 is provided in Figure 2.6.
Figure 2.6: Moment-curvature relationship
24
The RICON SVS 80 was used in the study since it is one of the two connections with known
characteristics and it also provides a higher upper limit for the beam size compared to the other
tested connection. The connections are modeled using a nonlinear three-dimensional link
element with three displacements and three rotations degrees of freedom. The characteristics
of those links are defined based on the above discussion for the connection, which are rigid
along the three-translation motion, free in the out-of-plane rotation, rigid in torsion and
following the moment-rotation curve for in-plane rotation.
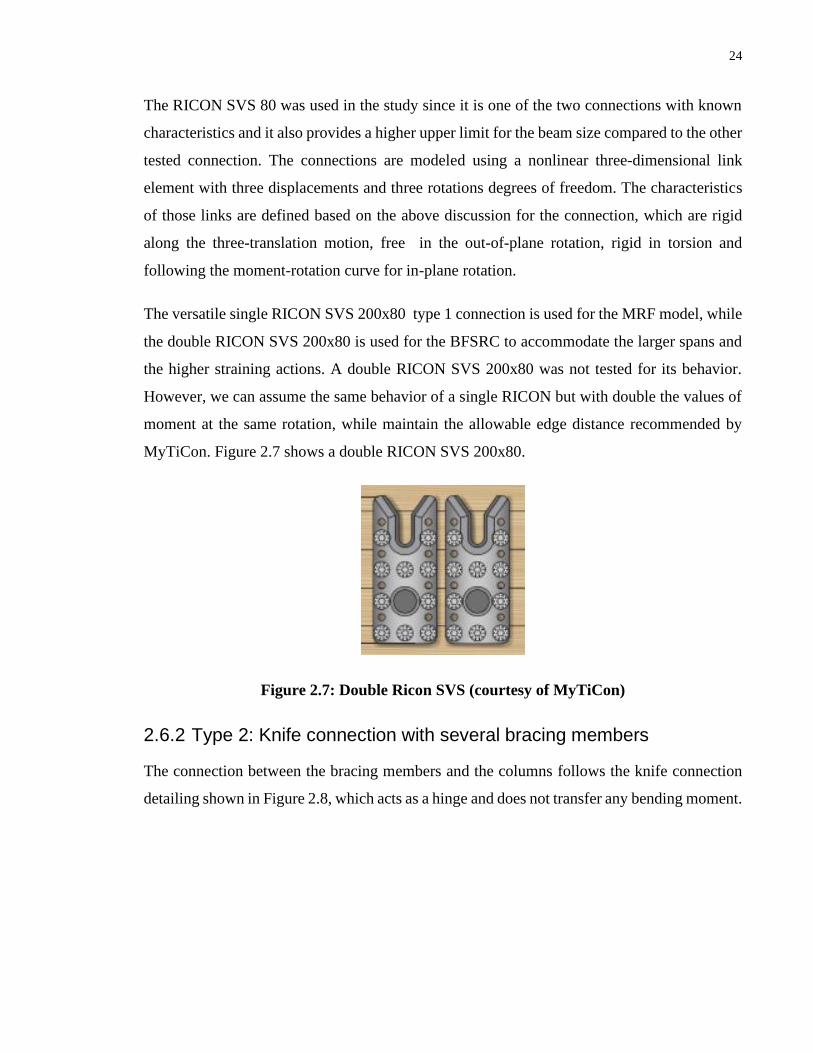
The versatile single RICON SVS 200x80 type 1 connection is used for the MRF model, while
the double RICON SVS 200x80 is used for the BFSRC to accommodate the larger spans and
the higher straining actions. A double RICON SVS 200x80 was not tested for its behavior.
However, we can assume the same behavior of a single RICON but with double the values of
moment at the same rotation, while maintain the allowable edge distance recommended by
MyTiCon. Figure 2.7 shows a double RICON SVS 200x80.
Figure 2.7: Double Ricon SVS (courtesy of MyTiCon)
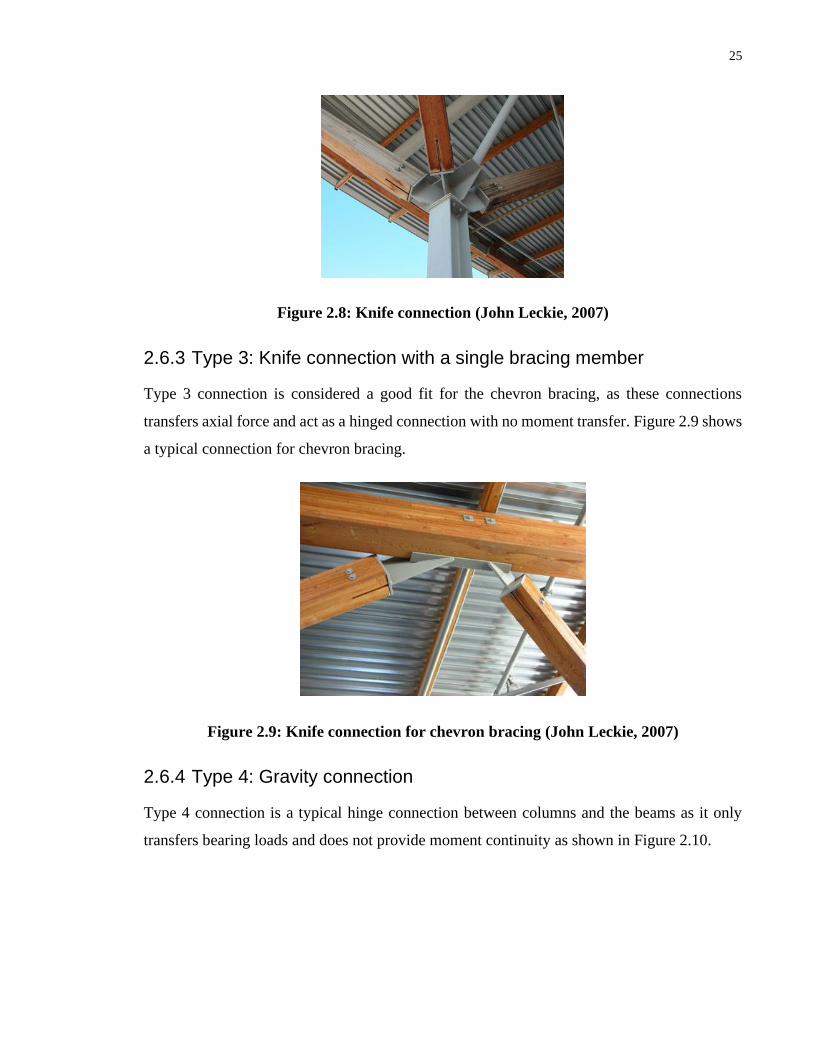
2.6.2 Type 2: Knife connection with several bracing members
The connection between the bracing members and the columns follows the knife connection
detailing shown in Figure 2.8, which acts as a hinge and does not transfer any bending moment.
25
Figure 2.8: Knife connection (John Leckie, 2007)
2.6.3 Type 3: Knife connection with a single bracing member
Type 3 connection is considered a good fit for the chevron bracing, as these connections
transfers axial force and act as a hinged connection with no moment transfer. Figure 2.9 shows
a typical connection for chevron bracing.
Figure 2.9: Knife connection for chevron bracing (John Leckie, 2007)
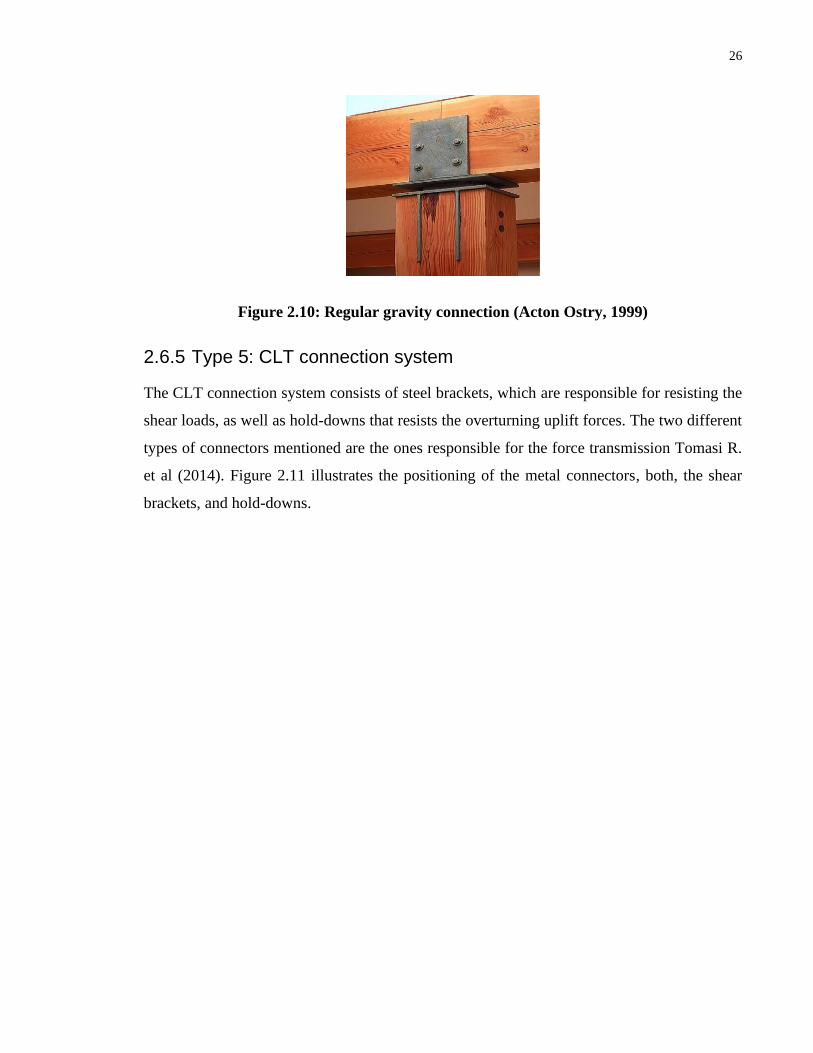
2.6.4 Type 4: Gravity connection
Type 4 connection is a typical hinge connection between columns and the beams as it only
transfers bearing loads and does not provide moment continuity as shown in Figure 2.10.
26
Figure 2.10: Regular gravity connection (Acton Ostry, 1999)
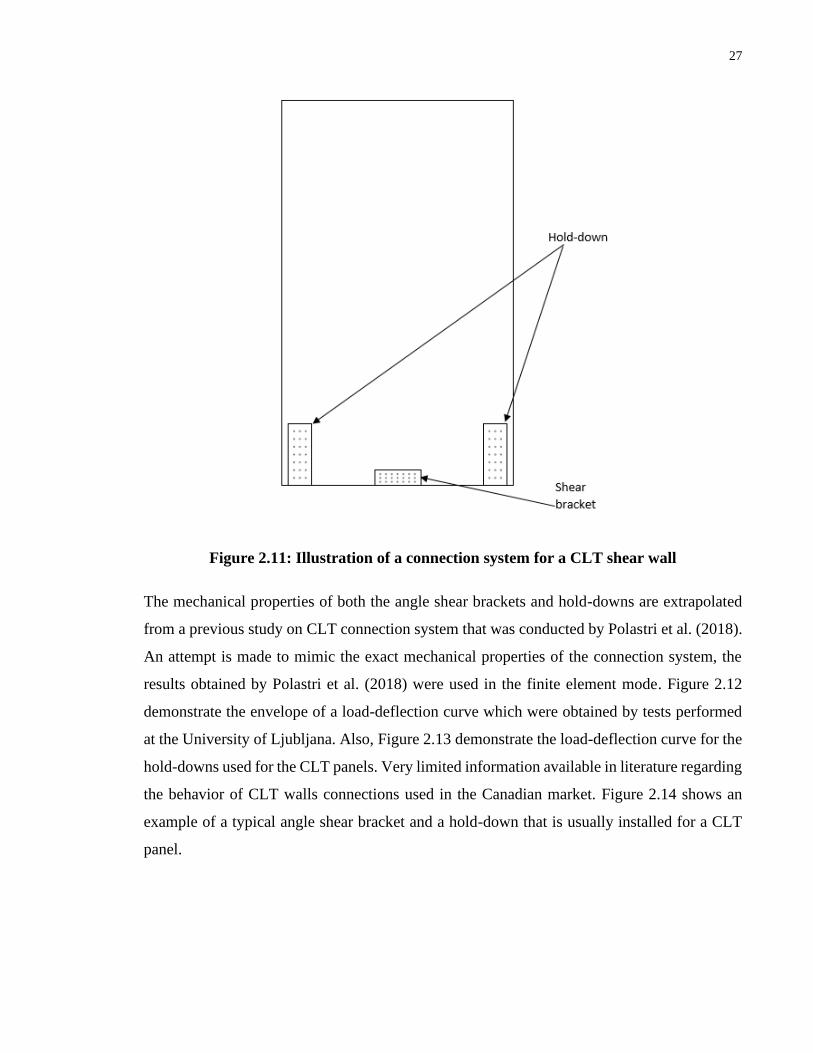
2.6.5 Type 5: CLT connection system
The CLT connection system consists of steel brackets, which are responsible for resisting the
shear loads, as well as hold-downs that resists the overturning uplift forces. The two different
types of connectors mentioned are the ones responsible for the force transmission Tomasi R.
et al (2014). Figure 2.11 illustrates the positioning of the metal connectors, both, the shear
brackets, and hold-downs.
27
Figure 2.11: Illustration of a connection system for a CLT shear wall
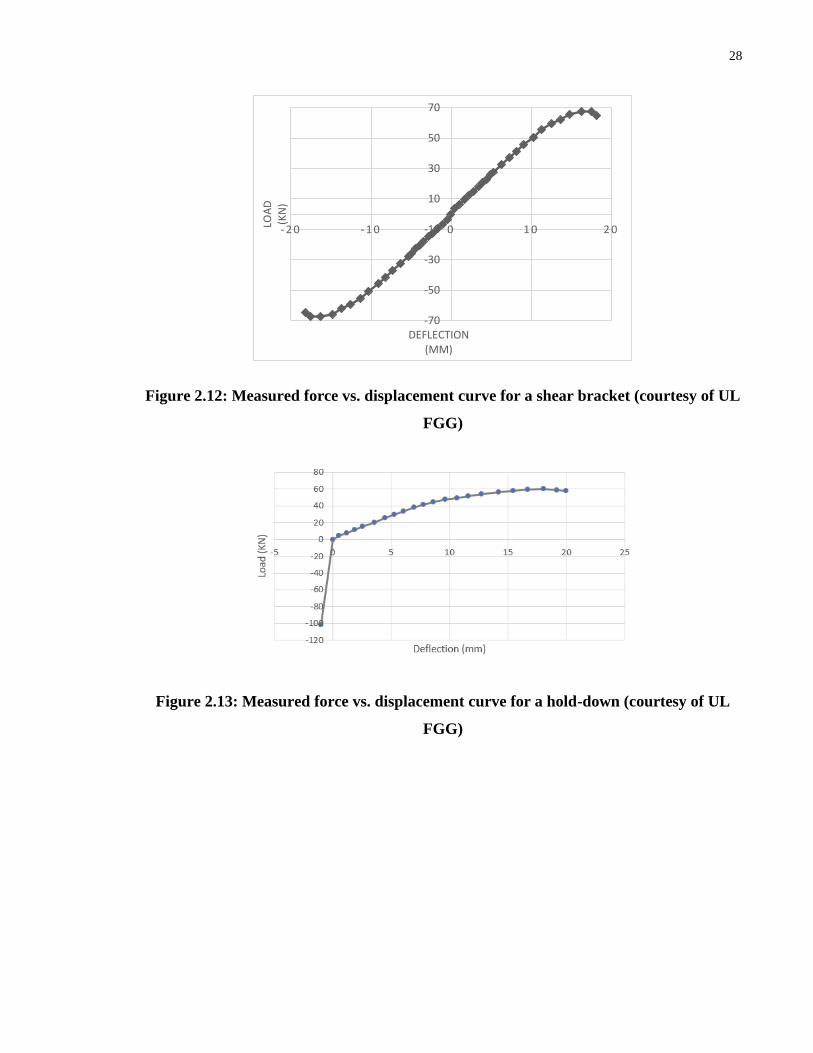
The mechanical properties of both the angle shear brackets and hold-downs are extrapolated
from a previous study on CLT connection system that was conducted by Polastri et al. (2018).
An attempt is made to mimic the exact mechanical properties of the connection system, the
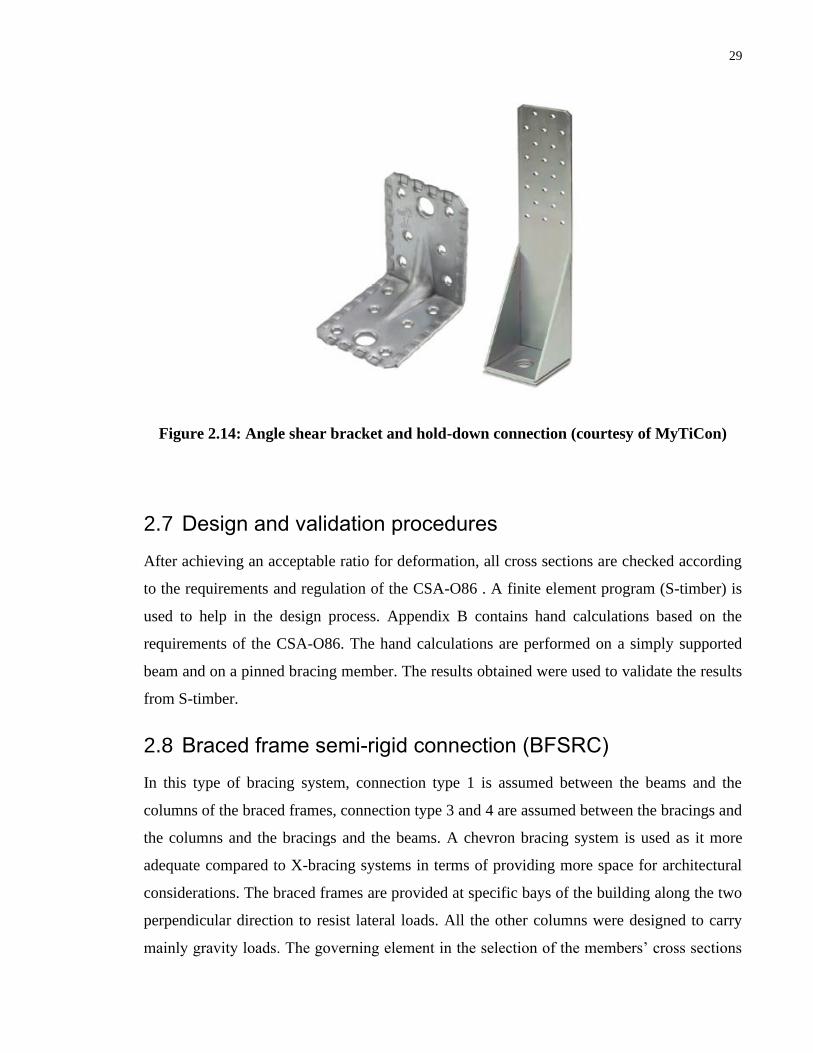
results obtained by Polastri et al. (2018) were used in the finite element mode. Figure 2.12
demonstrate the envelope of a load-deflection curve which were obtained by tests performed
at the University of Ljubljana. Also, Figure 2.13 demonstrate the load-deflection curve for the
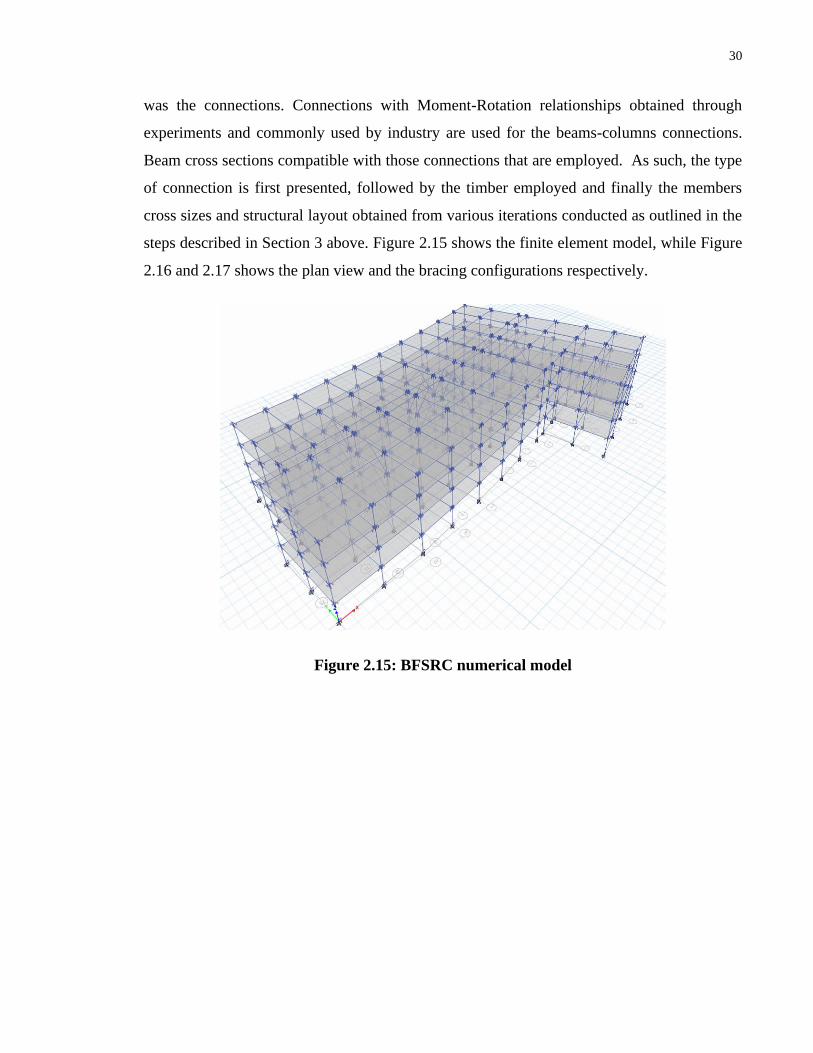
hold-downs used for the CLT panels. Very limited information available in literature regarding
the behavior of CLT walls connections used in the Canadian market. Figure 2.14 shows an
example of a typical angle shear bracket and a hold-down that is usually installed for a CLT
panel.
28
Figure 2.12: Measured force vs. displacement curve for a shear bracket (courtesy of UL
FGG)
Figure 2.13: Measured force vs. displacement curve for a hold-down (courtesy of UL
FGG)
-70
-50
-30
-10
10
30
50
70
- 2 0 - 1 0 0 1 0 2 0LOA
D(K
N)
DEFLECTION(MM)
29
Figure 2.14: Angle shear bracket and hold-down connection (courtesy of MyTiCon)
2.7 Design and validation procedures
After achieving an acceptable ratio for deformation, all cross sections are checked according
to the requirements and regulation of the CSA-O86 . A finite element program (S-timber) is
used to help in the design process. Appendix B contains hand calculations based on the
requirements of the CSA-O86. The hand calculations are performed on a simply supported
beam and on a pinned bracing member. The results obtained were used to validate the results
from S-timber.
2.8 Braced frame semi-rigid connection (BFSRC)
In this type of bracing system, connection type 1 is assumed between the beams and the
columns of the braced frames, connection type 3 and 4 are assumed between the bracings and
the columns and the bracings and the beams. A chevron bracing system is used as it more
adequate compared to X-bracing systems in terms of providing more space for architectural
considerations. The braced frames are provided at specific bays of the building along the two
perpendicular direction to resist lateral loads. All the other columns were designed to carry
mainly gravity loads. The governing element in the selection of the members’ cross sections
30
was the connections. Connections with Moment-Rotation relationships obtained through
experiments and commonly used by industry are used for the beams-columns connections.
Beam cross sections compatible with those connections that are employed. As such, the type
of connection is first presented, followed by the timber employed and finally the members
cross sizes and structural layout obtained from various iterations conducted as outlined in the
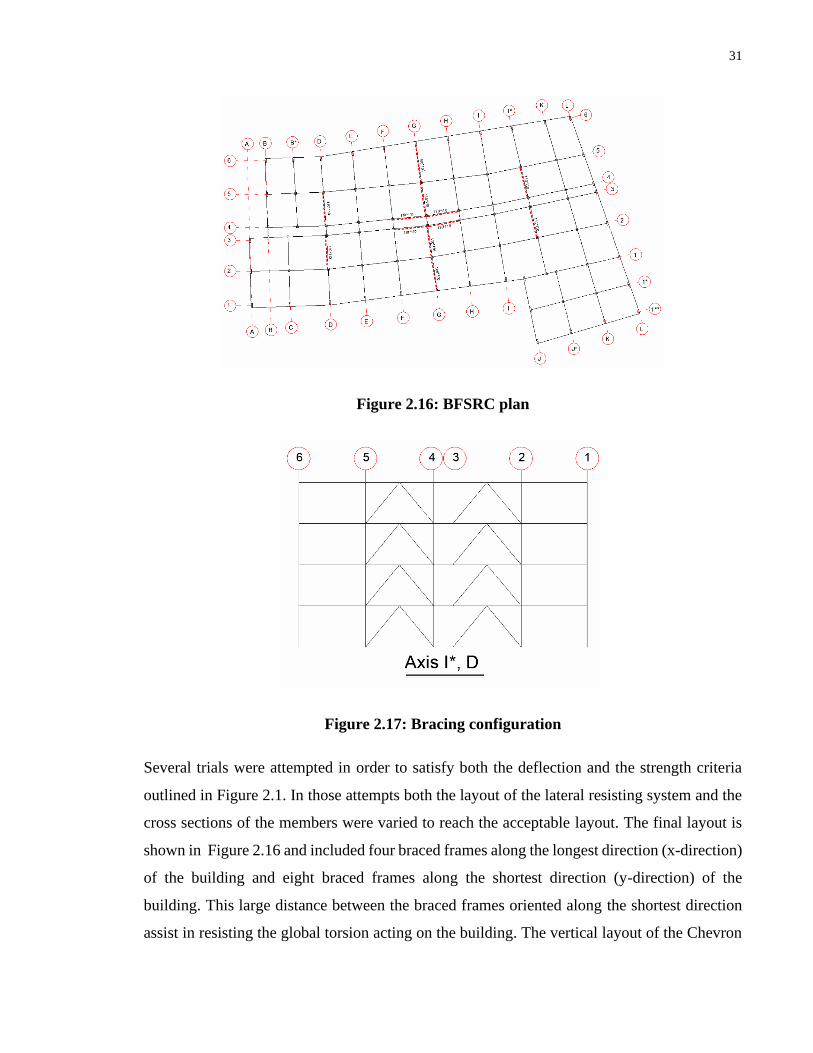
steps described in Section 3 above. Figure 2.15 shows the finite element model, while Figure
2.16 and 2.17 shows the plan view and the bracing configurations respectively.
Figure 2.15: BFSRC numerical model
31
Figure 2.16: BFSRC plan
Figure 2.17: Bracing configuration
Several trials were attempted in order to satisfy both the deflection and the strength criteria
outlined in Figure 2.1. In those attempts both the layout of the lateral resisting system and the
cross sections of the members were varied to reach the acceptable layout. The final layout is
shown in Figure 2.16 and included four braced frames along the longest direction (x-direction)
of the building and eight braced frames along the shortest direction (y-direction) of the
building. This large distance between the braced frames oriented along the shortest direction
assist in resisting the global torsion acting on the building. The vertical layout of the Chevron
32
trusses used for all braced frames is shown in Figure 2.17. It should be noted that all the exterior
columns are oriented in the y-direction, as the building needed extra stiffness in this direction.
The BFSRC layout is selected to match the LFW layout resulting in relatively large spans for
the beams. Therefore, a double RICON SVS was needed at the beam-to-column connections
to satisfy the shear and bending moments demands. As for the horizontal deflection, as
mentioned in section 3 earlier, the deflection for both the global directions exceeded 90%.
Table 2.6 shows the final value for the top floor deflection for both the BFSRC and the LFW
systems.
Table 2.6: Top story deflection for BFSRC against LFW
Displacement LFW
(mm)
BFSRC
(mm)
X 3.314 3.53
Y 3.808 4.05
Compatibility
(%)
- -
X - 94
Y - 94
In order to simplify the procurement and the construction, fixed cross sections were used for
all the exterior columns, interior columns, beams and bracings. Those cross sections are shown
in Table 2.7 below along with their quantities, and their Mr/ Mf and the Pf/ Pr ratios.
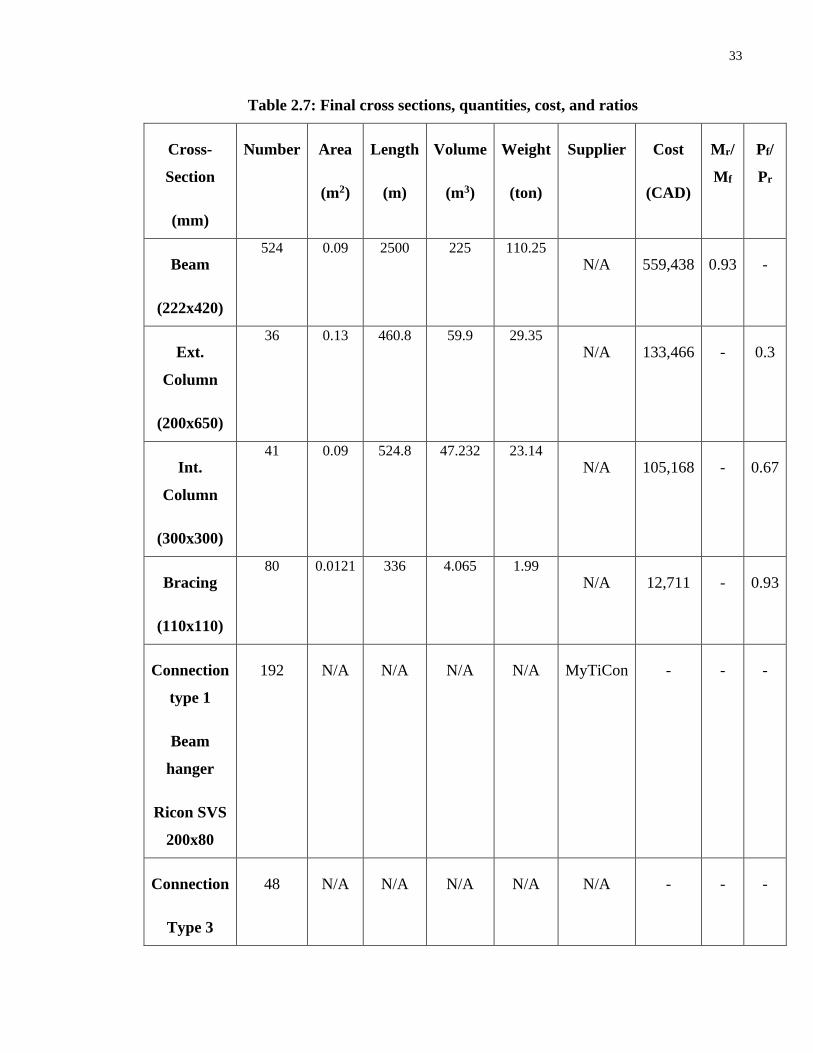
33
Table 2.7: Final cross sections, quantities, cost, and ratios
Cross-
Section
(mm)
Number Area
(m2)
Length
(m)
Volume
(m3)
Weight
(ton)
Supplier Cost
(CAD)
Mr/
Mf
Pf/
Pr
Beam
(222x420)
524 0.09 2500 225 110.25
N/A 559,438 0.93 -
Ext.
Column
(200x650)
36 0.13 460.8 59.9 29.35
N/A 133,466 - 0.3
Int.
Column
(300x300)
41 0.09 524.8 47.232 23.14
N/A 105,168 - 0.67
Bracing
(110x110)
80 0.0121 336 4.065 1.99
N/A 12,711 - 0.93
Connection
type 1
Beam
hanger
Ricon SVS
200x80
192 N/A N/A N/A N/A MyTiCon - - -
Connection
Type 3
48 N/A N/A N/A N/A N/A - - -
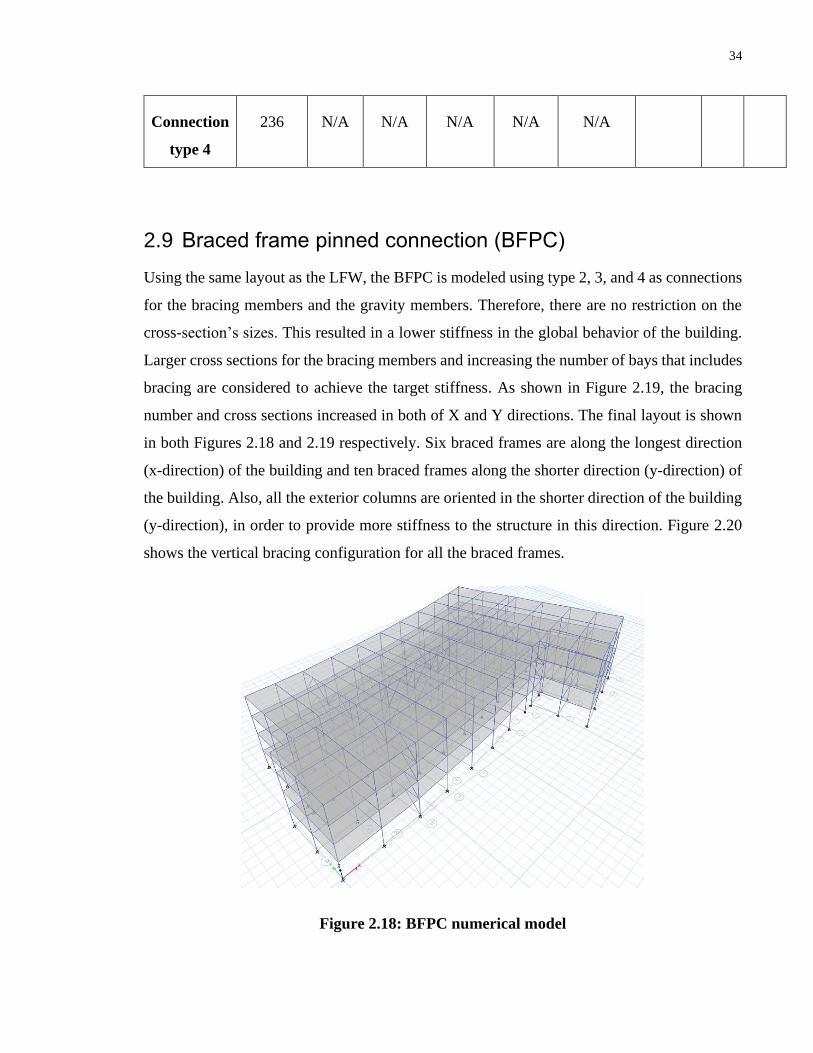
34
Connection
type 4
236 N/A N/A N/A N/A N/A
2.9 Braced frame pinned connection (BFPC)
Using the same layout as the LFW, the BFPC is modeled using type 2, 3, and 4 as connections
for the bracing members and the gravity members. Therefore, there are no restriction on the
cross-section’s sizes. This resulted in a lower stiffness in the global behavior of the building.
Larger cross sections for the bracing members and increasing the number of bays that includes
bracing are considered to achieve the target stiffness. As shown in Figure 2.19, the bracing
number and cross sections increased in both of X and Y directions. The final layout is shown
in both Figures 2.18 and 2.19 respectively. Six braced frames are along the longest direction
(x-direction) of the building and ten braced frames along the shorter direction (y-direction) of
the building. Also, all the exterior columns are oriented in the shorter direction of the building
(y-direction), in order to provide more stiffness to the structure in this direction. Figure 2.20
shows the vertical bracing configuration for all the braced frames.
Figure 2.18: BFPC numerical model
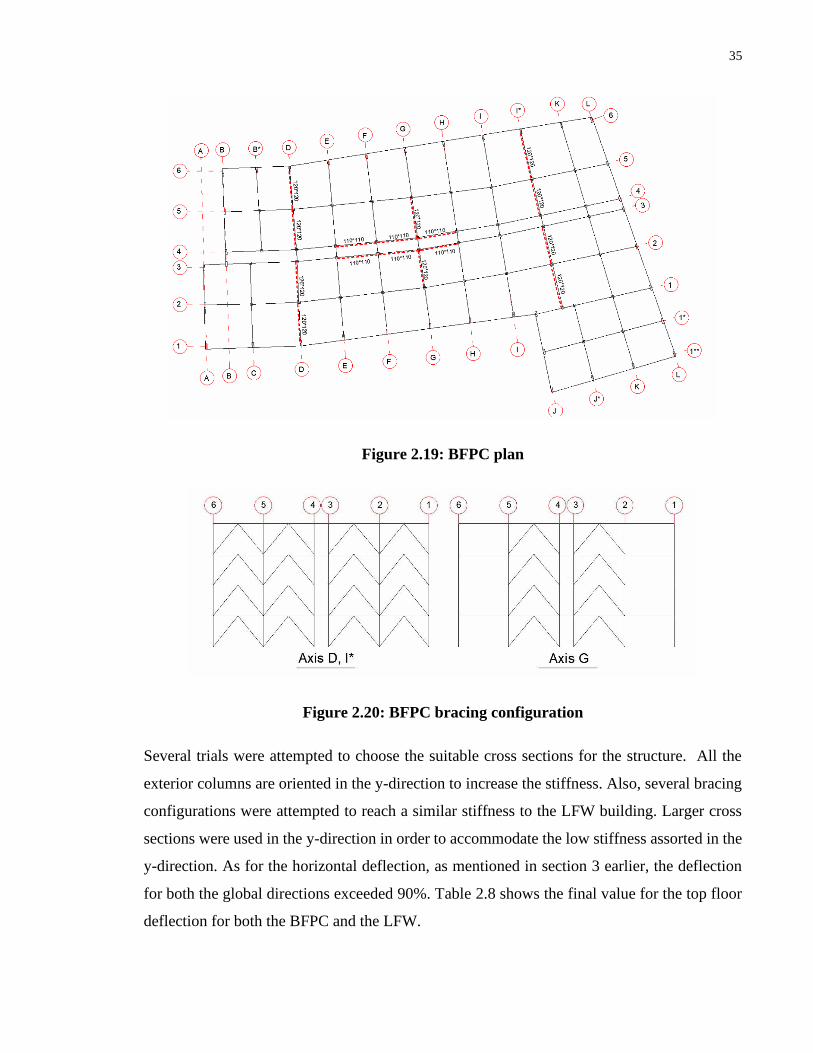
35
Figure 2.19: BFPC plan
Figure 2.20: BFPC bracing configuration
Several trials were attempted to choose the suitable cross sections for the structure. All the
exterior columns are oriented in the y-direction to increase the stiffness. Also, several bracing
configurations were attempted to reach a similar stiffness to the LFW building. Larger cross
sections were used in the y-direction in order to accommodate the low stiffness assorted in the
y-direction. As for the horizontal deflection, as mentioned in section 3 earlier, the deflection
for both the global directions exceeded 90%. Table 2.8 shows the final value for the top floor
deflection for both the BFPC and the LFW.
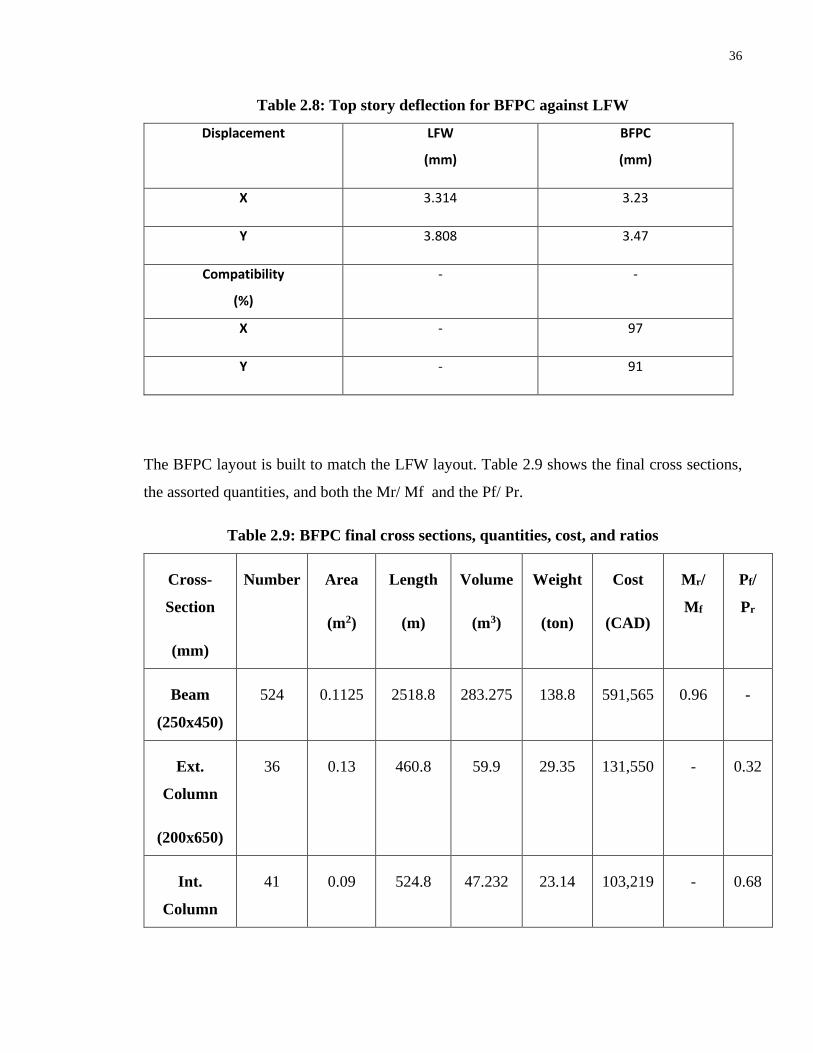
36
Table 2.8: Top story deflection for BFPC against LFW
Displacement LFW
(mm)
BFPC
(mm)
X 3.314 3.23
Y 3.808 3.47
Compatibility
(%)
- -
X - 97
Y - 91
The BFPC layout is built to match the LFW layout. Table 2.9 shows the final cross sections,
the assorted quantities, and both the Mr/ Mf and the Pf/ Pr.
Table 2.9: BFPC final cross sections, quantities, cost, and ratios
Cross-
Section
(mm)
Number Area
(m2)
Length
(m)
Volume
(m3)
Weight
(ton)
Cost
(CAD)
Mr/
Mf
Pf/
Pr
Beam
(250x450)
524 0.1125 2518.8 283.275 138.8 591,565 0.96 -
Ext.
Column
(200x650)
36 0.13 460.8 59.9 29.35 131,550 - 0.32
Int.
Column
41 0.09 524.8 47.232 23.14 103,219 - 0.68
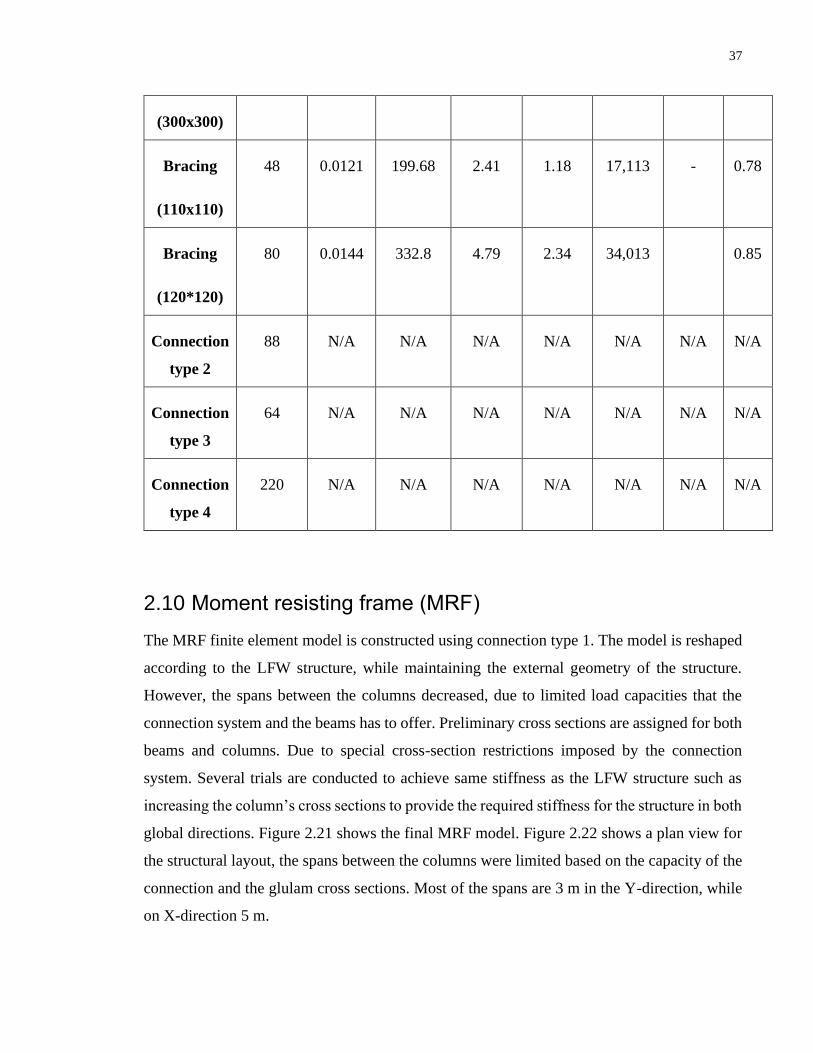
37
(300x300)
Bracing
(110x110)
48 0.0121 199.68 2.41 1.18 17,113 - 0.78
Bracing
(120*120)
80 0.0144 332.8 4.79 2.34 34,013 0.85
Connection
type 2
88 N/A N/A N/A N/A N/A N/A N/A
Connection
type 3
64 N/A N/A N/A N/A N/A N/A N/A
Connection
type 4
220 N/A N/A N/A N/A N/A N/A N/A
2.10 Moment resisting frame (MRF)
The MRF finite element model is constructed using connection type 1. The model is reshaped
according to the LFW structure, while maintaining the external geometry of the structure.
However, the spans between the columns decreased, due to limited load capacities that the
connection system and the beams has to offer. Preliminary cross sections are assigned for both
beams and columns. Due to special cross-section restrictions imposed by the connection
system. Several trials are conducted to achieve same stiffness as the LFW structure such as
increasing the column’s cross sections to provide the required stiffness for the structure in both
global directions. Figure 2.21 shows the final MRF model. Figure 2.22 shows a plan view for
the structural layout, the spans between the columns were limited based on the capacity of the
connection and the glulam cross sections. Most of the spans are 3 m in the Y-direction, while
on X-direction 5 m.
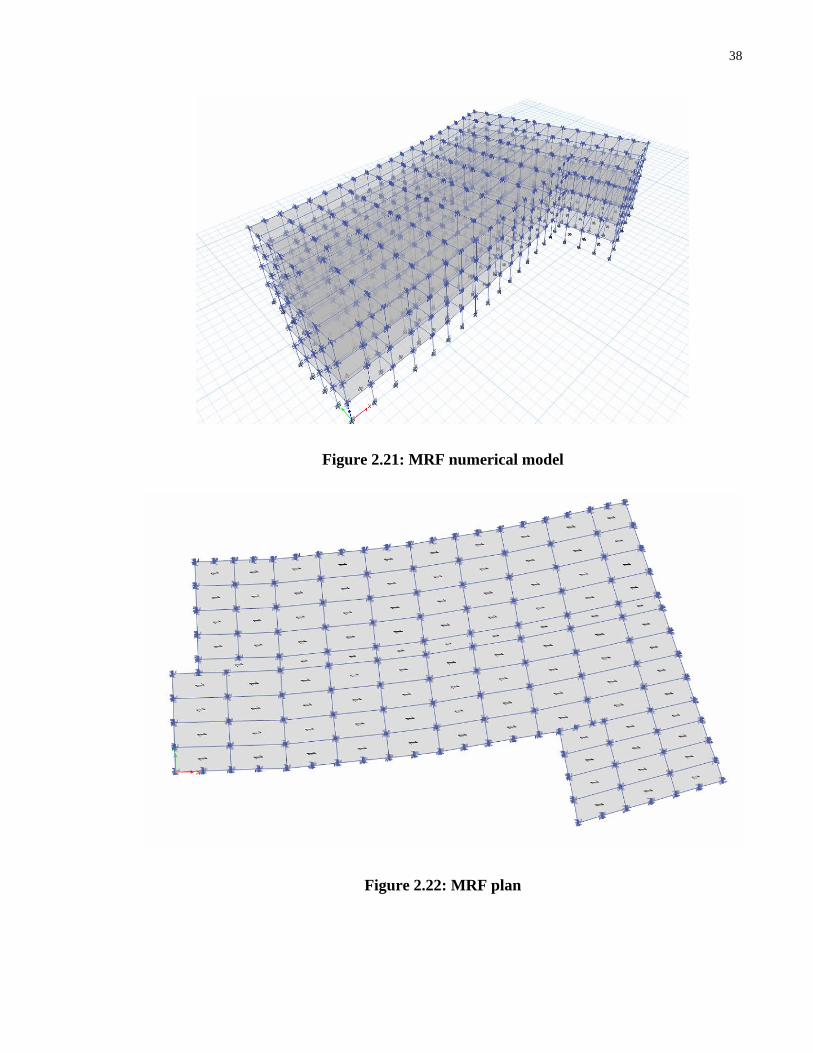
38
Figure 2.21: MRF numerical model
Figure 2.22: MRF plan
39
Several attempts were done to choose the suitable cross sections for the structure. All the
exterior columns are oriented in the y-direction, as the building needed extra stiffness in this
direction more than the x-direction. Beam size is chosen as it matches the minimum
requirement for type 1 connection. Also, The Mr/ Mf ratio is calculated to try optimizing the
design process. Table 2.10 shows the top story deflection comparison between MRF and LFW,
while Table 2.11 shows the final cross sections for the MRF and their assorted quantities.
Table 2.10: Top story deflection for MRF against LFW.
Displacement LFW
(mm)
MRF
(mm)
X 3.314 3.125
Y 3.808 3.579
Compatibility
(%)
- -
X - 94
Y - 94
Table 2.11: MRF final cross sections, quantities, cost, and ratios
Cross-
Section
(mm)
Number Area
(m2)
Length
(m)
Volume
(m3)
Weight
(ton)
Supplier Cost
(CAD)
Mr/
Mf
Beam
(210x240)
1000 0.05 850 43 21 N/A 285,347 0.6
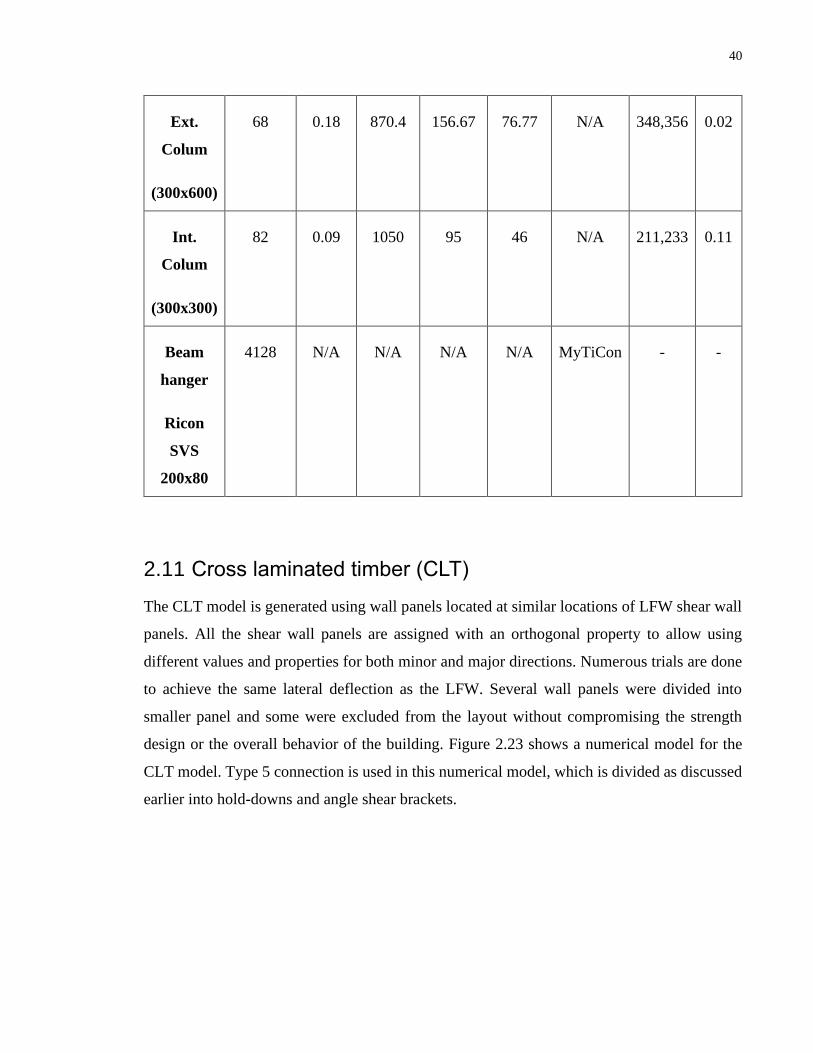
40
Ext.
Colum
(300x600)
68 0.18 870.4 156.67 76.77 N/A 348,356 0.02
Int.
Colum
(300x300)
82 0.09 1050 95 46 N/A 211,233 0.11
Beam
hanger
Ricon
SVS
200x80
4128 N/A N/A N/A N/A MyTiCon - -
2.11 Cross laminated timber (CLT)
The CLT model is generated using wall panels located at similar locations of LFW shear wall
panels. All the shear wall panels are assigned with an orthogonal property to allow using
different values and properties for both minor and major directions. Numerous trials are done
to achieve the same lateral deflection as the LFW. Several wall panels were divided into
smaller panel and some were excluded from the layout without compromising the strength
design or the overall behavior of the building. Figure 2.23 shows a numerical model for the
CLT model. Type 5 connection is used in this numerical model, which is divided as discussed
earlier into hold-downs and angle shear brackets.
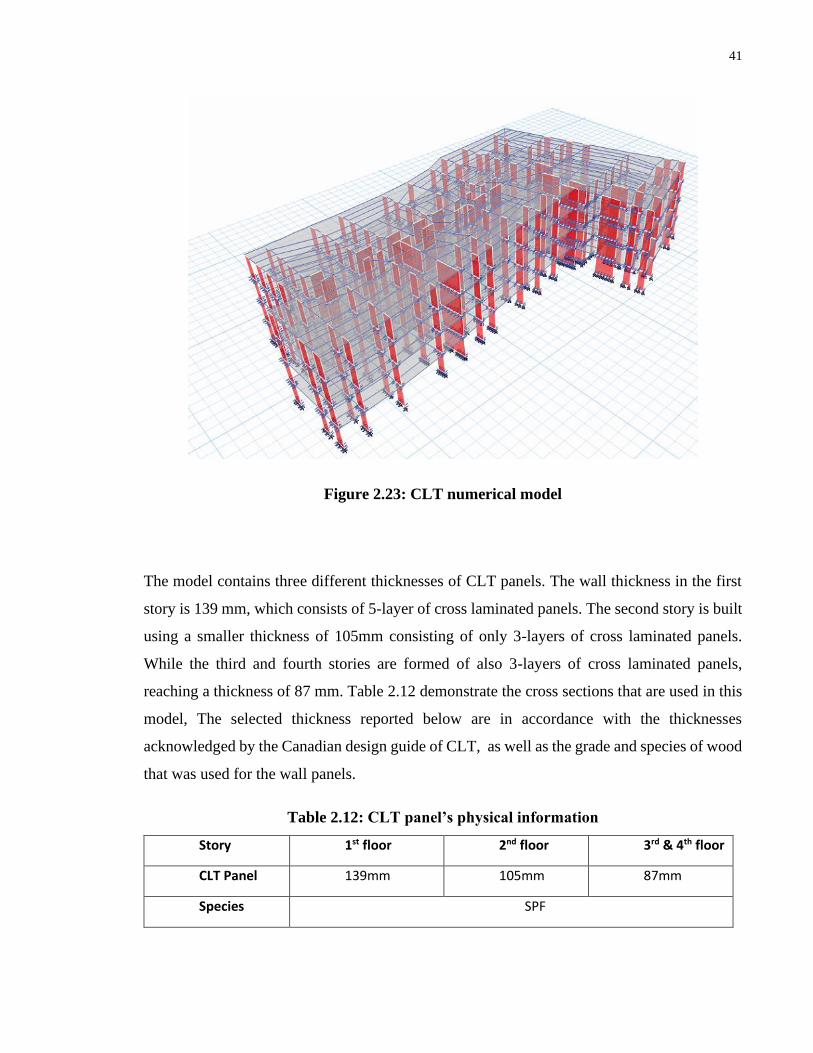
41
Figure 2.23: CLT numerical model
The model contains three different thicknesses of CLT panels. The wall thickness in the first
story is 139 mm, which consists of 5-layer of cross laminated panels. The second story is built
using a smaller thickness of 105mm consisting of only 3-layers of cross laminated panels.
While the third and fourth stories are formed of also 3-layers of cross laminated panels,
reaching a thickness of 87 mm. Table 2.12 demonstrate the cross sections that are used in this
model, The selected thickness reported below are in accordance with the thicknesses
acknowledged by the Canadian design guide of CLT, as well as the grade and species of wood
that was used for the wall panels.
Table 2.12: CLT panel’s physical information
Story 1st floor 2nd floor 3rd & 4th floor
CLT Panel 139mm 105mm 87mm
Species SPF
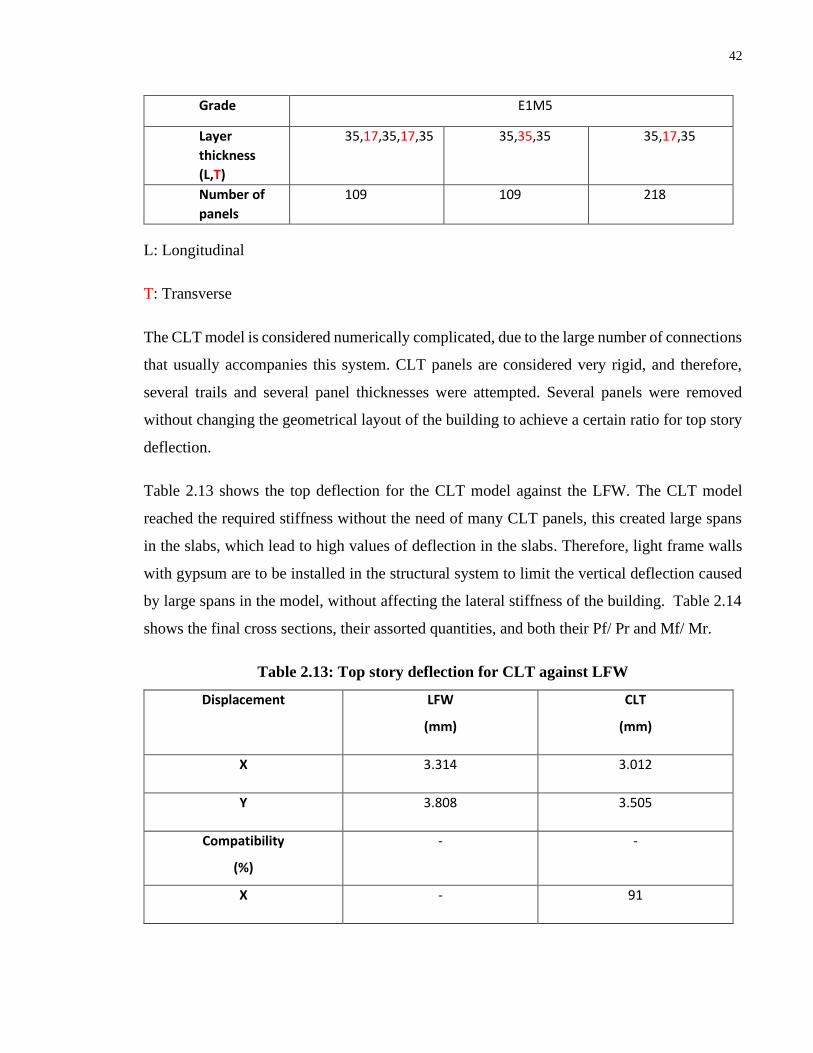
42
Grade E1M5
Layer
thickness
(L,T)
35,17,35,17,35 35,35,35 35,17,35
Number of
panels
109 109 218
L: Longitudinal
T: Transverse
The CLT model is considered numerically complicated, due to the large number of connections
that usually accompanies this system. CLT panels are considered very rigid, and therefore,
several trails and several panel thicknesses were attempted. Several panels were removed
without changing the geometrical layout of the building to achieve a certain ratio for top story
deflection.
Table 2.13 shows the top deflection for the CLT model against the LFW. The CLT model
reached the required stiffness without the need of many CLT panels, this created large spans
in the slabs, which lead to high values of deflection in the slabs. Therefore, light frame walls
with gypsum are to be installed in the structural system to limit the vertical deflection caused
by large spans in the model, without affecting the lateral stiffness of the building. Table 2.14
shows the final cross sections, their assorted quantities, and both their Pf/ Pr and Mf/ Mr.
Table 2.13: Top story deflection for CLT against LFW
Displacement LFW
(mm)
CLT
(mm)
X 3.314 3.012
Y 3.808 3.505
Compatibility
(%)
- -
X - 91
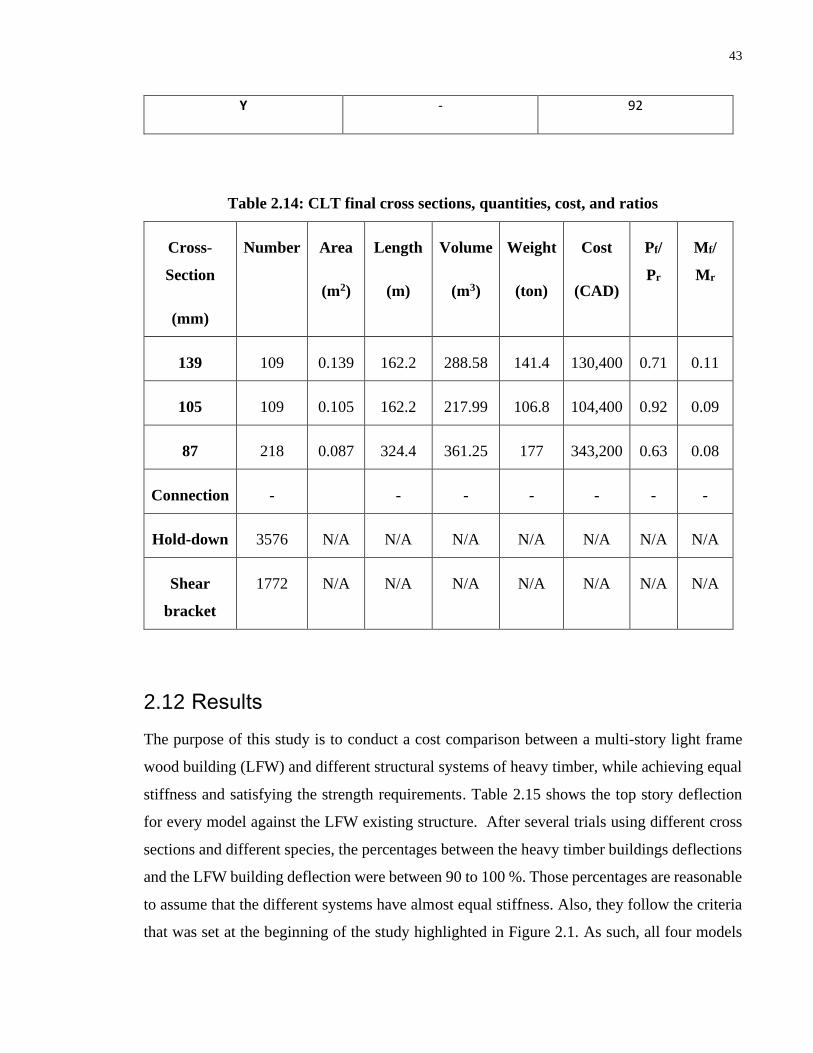
43
Y - 92
Table 2.14: CLT final cross sections, quantities, cost, and ratios
Cross-
Section
(mm)
Number Area
(m2)
Length
(m)
Volume
(m3)
Weight
(ton)
Cost
(CAD)
Pf/
Pr
Mf/
Mr
139 109 0.139 162.2 288.58 141.4 130,400 0.71 0.11
105 109 0.105 162.2 217.99 106.8 104,400 0.92 0.09
87 218 0.087 324.4 361.25 177 343,200 0.63 0.08
Connection - - - - - - -
Hold-down 3576 N/A N/A N/A N/A N/A N/A N/A
Shear
bracket
1772 N/A N/A N/A N/A N/A N/A N/A
2.12 Results
The purpose of this study is to conduct a cost comparison between a multi-story light frame
wood building (LFW) and different structural systems of heavy timber, while achieving equal
stiffness and satisfying the strength requirements. Table 2.15 shows the top story deflection
for every model against the LFW existing structure. After several trials using different cross
sections and different species, the percentages between the heavy timber buildings deflections
and the LFW building deflection were between 90 to 100 %. Those percentages are reasonable
to assume that the different systems have almost equal stiffness. Also, they follow the criteria
that was set at the beginning of the study highlighted in Figure 2.1. As such, all four models
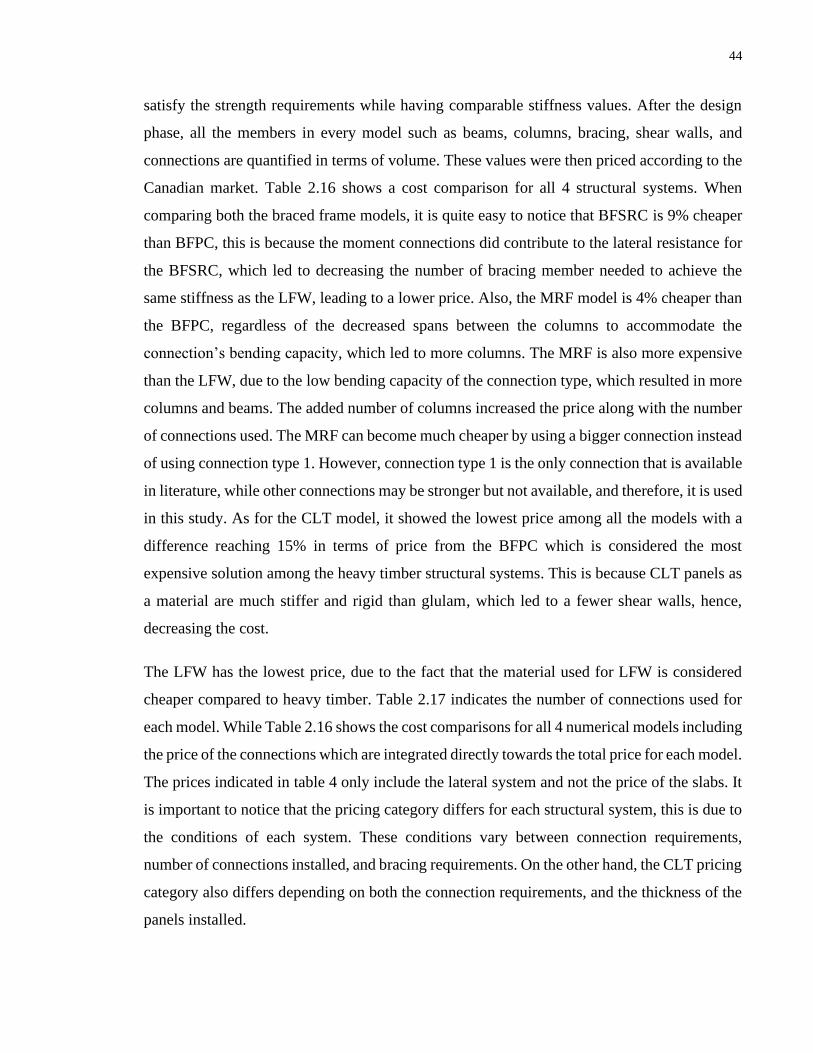
44
satisfy the strength requirements while having comparable stiffness values. After the design
phase, all the members in every model such as beams, columns, bracing, shear walls, and
connections are quantified in terms of volume. These values were then priced according to the
Canadian market. Table 2.16 shows a cost comparison for all 4 structural systems. When
comparing both the braced frame models, it is quite easy to notice that BFSRC is 9% cheaper
than BFPC, this is because the moment connections did contribute to the lateral resistance for
the BFSRC, which led to decreasing the number of bracing member needed to achieve the
same stiffness as the LFW, leading to a lower price. Also, the MRF model is 4% cheaper than
the BFPC, regardless of the decreased spans between the columns to accommodate the
connection’s bending capacity, which led to more columns. The MRF is also more expensive
than the LFW, due to the low bending capacity of the connection type, which resulted in more
columns and beams. The added number of columns increased the price along with the number
of connections used. The MRF can become much cheaper by using a bigger connection instead
of using connection type 1. However, connection type 1 is the only connection that is available
in literature, while other connections may be stronger but not available, and therefore, it is used
in this study. As for the CLT model, it showed the lowest price among all the models with a
difference reaching 15% in terms of price from the BFPC which is considered the most
expensive solution among the heavy timber structural systems. This is because CLT panels as
a material are much stiffer and rigid than glulam, which led to a fewer shear walls, hence,
decreasing the cost.
The LFW has the lowest price, due to the fact that the material used for LFW is considered
cheaper compared to heavy timber. Table 2.17 indicates the number of connections used for
each model. While Table 2.16 shows the cost comparisons for all 4 numerical models including
the price of the connections which are integrated directly towards the total price for each model.
The prices indicated in table 4 only include the lateral system and not the price of the slabs. It
is important to notice that the pricing category differs for each structural system, this is due to
the conditions of each system. These conditions vary between connection requirements,
number of connections installed, and bracing requirements. On the other hand, the CLT pricing
category also differs depending on both the connection requirements, and the thickness of the
panels installed.
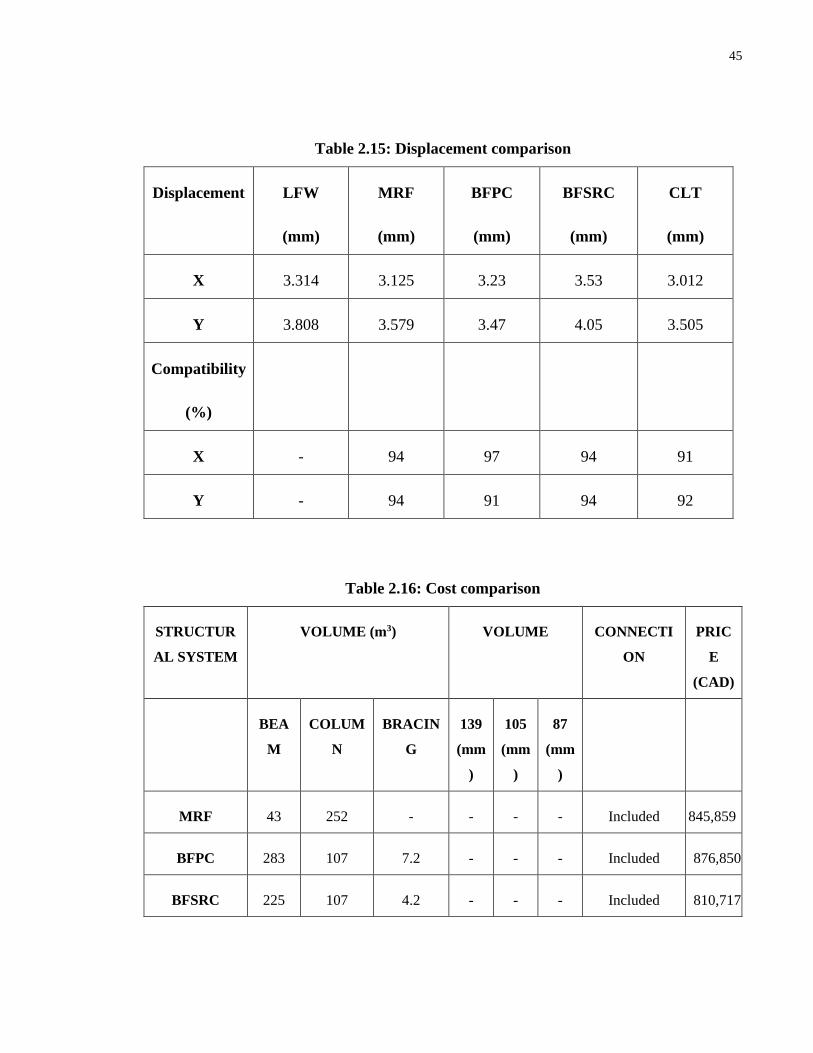
45
Table 2.15: Displacement comparison
Displacement LFW
(mm)
MRF
(mm)
BFPC
(mm)
BFSRC
(mm)
CLT
(mm)
X 3.314 3.125 3.23 3.53 3.012
Y 3.808 3.579 3.47 4.05 3.505
Compatibility
(%)
X - 94 97 94 91
Y - 94 91 94 92
Table 2.16: Cost comparison
STRUCTUR
AL SYSTEM
VOLUME (m3) VOLUME CONNECTI
ON
PRIC
E
(CAD)
BEA
M
COLUM
N
BRACIN
G
139
(mm
)
105
(mm
)
87
(mm
)
MRF 43 252 - - - - Included 845,859
BFPC 283 107 7.2 - - - Included 876,850
BFSRC 225 107 4.2 - - - Included 810,717
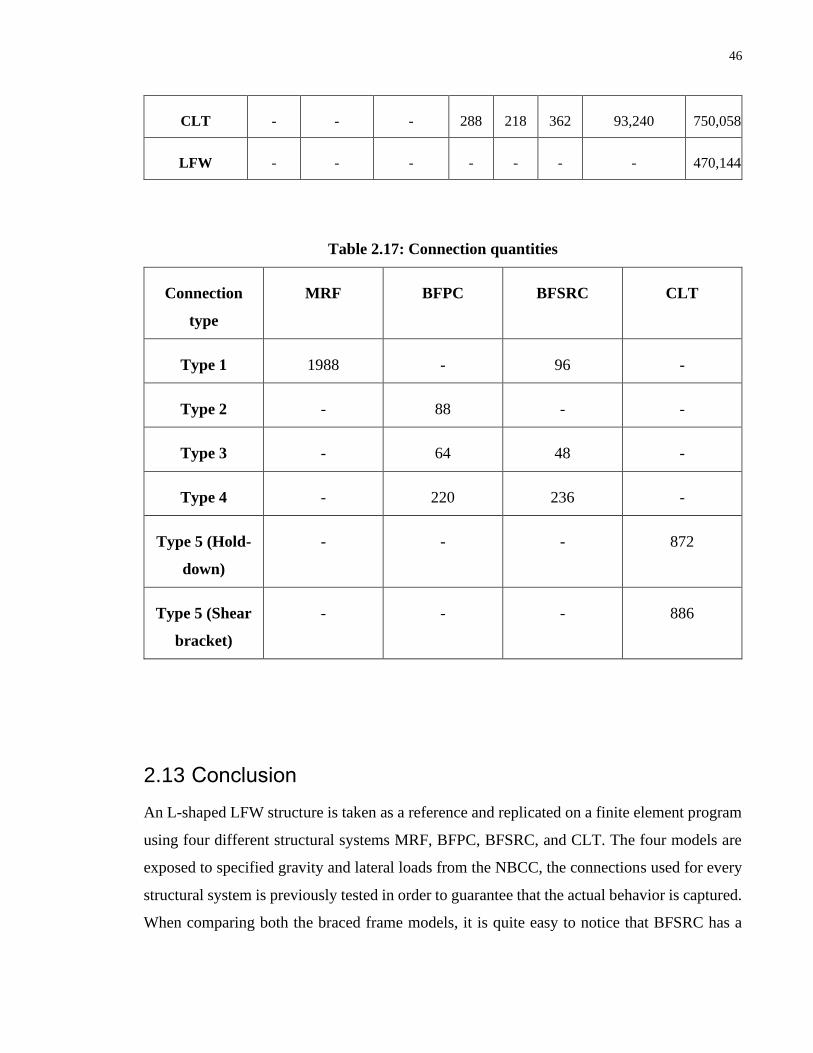
46
CLT - - - 288 218 362 93,240 750,058
LFW - - - - - - - 470,144
Table 2.17: Connection quantities
Connection
type
MRF BFPC BFSRC CLT
Type 1 1988 - 96 -
Type 2 - 88 - -
Type 3 - 64 48 -
Type 4 - 220 236 -
Type 5 (Hold-
down)
- - - 872
Type 5 (Shear
bracket)
- - - 886
2.13 Conclusion
An L-shaped LFW structure is taken as a reference and replicated on a finite element program
using four different structural systems MRF, BFPC, BFSRC, and CLT. The four models are
exposed to specified gravity and lateral loads from the NBCC, the connections used for every
structural system is previously tested in order to guarantee that the actual behavior is captured.
When comparing both the braced frame models, it is quite easy to notice that BFSRC has a
47
lower price than BFPC, this is due to the fact that the moment connections did contribute to
the lateral resistance, which led to decreasing the lateral loads that affects the bracing, leading
to a smaller number of bracing members. On the other hand, the MRF model showed that it is
the most expensive model. This is because the spans between the columns are decreased to
accommodate the connection’s bending capacity. Therefore, the quantities for the MRF are
much greater than the quantities needed for the rest of the models. This can be solved by using
a bigger connection instead of using connection type 1. However, connection type 1 is the only
moment connection that has been tested and therefore, it is used in this study. As for the CLT
model, it showed the lowest price among all the models. This is because CLT panels as a
material are much stiffer and rigid than glulam. Also, shear walls tend to attract more loads
and therefore less panels were needed to reach a compatible story deflection. Also, a cost
comparison is conducted among all the numerical models, the results clearly indicates that the
LFW is almost half the price when compared to MRF, BFSRC, and BFPC. However, it can be
concluded despite the extra cost, that heavy timber is more reliable than the LFW because it
has a better strength to weight ratio, more consistent as a material, better fire resistance, and
the ability to reach higher altitudes without resorting to an external lateral supporting system.
Challenges throughout the study case are also present. First, few studies and investigations are
conducted on heavy timber and CLT in the Canadian market. Second, such investigations have
a widespread in both the European and Asian market, which is most of the data and information
is acquired. Lastly, the connection system for the CLT panels which is resembled in the hold-
downs and the angle shear brackets also have a narrow spread among the Canadian market.
Further work on understanding the nature of these new sustainable materials and their relations
should be performed.
48
3 Chapter 3
3.1 Introduction
Wind design for structures is based on elastic strength provision under ultimate loads, there
are numerous concerns when it comes to designing heavy timber structures. Heavy timber is
considered relatively light weight when compared to steel and concrete. This creates serious
problems as the building height increase. As the building’s height increase, the structure
becomes more flexible and vulnerable to lateral loads such as wind aerodynamic forces and
vibrations.
Performance-based seismic design (PBSD) has become a well-recognized methodology for
designing buildings under seismic loads. This professional practice is stemmed directly from
the principles of PBD in both (Eurocode and ASCE 7-10), while the capacity design procedures
can be found in the National Building Code of Canada (NBCC 2015) Elezaby et al. (2017).
On the other hand, wind- induced performance-based design (PBWD) is evolving greatly as a
design methodology to improve the current practice in tall buildings performance under wind
loads. Normally, buildings that are subjected to wind loads are designed using elastic analysis
and equivalent static loads as described by the building codes. PBWD propose benefits from
the inelastic behavior of the members and connections and the dynamic effects of the natural
hazard. Several frameworks have been studying PBWD according to Van de Lindt (2009),
Ciampoli et al. (2011), Griffis (2013a) and Griffis et al. (2013b), and El-damatty et al. (2020).
Usually, this approach is allowed in seismic design. PBWD involves increasing the return
period used in wind design to almost match the seismic return period.
49
Tall heavy timber buildings are still undergoing enormous transformation in terms of
performance-based design. The key to a successful analysis would rely completely on the type
of connections and the amount of non-linearity they have to offer to the behavior of the building
3.1.1 Research gaps
Design codes tend to be conservative when it comes to wind design. The current method used
is equivalent static method, this method eventually results in high cross-sections and disregard
the ductility possessed by the structural elements whether in the connection or in reinforcement
concrete. Moreover, all the framework proposed addresses concrete and steel structures. Very
few literature addresses the heavy timber mid-rise or high-rise building, therefore, based on
the addressed gaps in the literature, a framework for a ductility-based design for heavy timber
building subjected to wind loads is presented in this study.
3.1.2 Methodology
In this section, a proposed framework for ductility-based design for tall heavy timber building
subjected to wind forces is presented. The objective of this section is to assess the building’s
performance as a whole and the connection under wind loads. First, A modified RICON SVS
200x80, which was previously introduced in the previous chapter, is mathematically developed
to be used in current study. As mentioned earlier, the RICON SVS 200x80 is a moment
connection with certain limitations in terms of failure modes, and dimensions of beams that
would fit for this connection. The modified connection is developed to fit larger beam sizes
and to increase its moment capacity. Second, wind tunnel data Cp(t), which are pressure
coefficients, are acquired from the BLWTL and processed to evaluate story forces Fx(t) and
Fy(t). These forces are applied to the three-dimensional finite element simulation of the studied
building. Time history dynamic analysis is conducted to evaluate the response of the building
such as: Peak Base shear, time-history base shear, and top story time history displacements.
Third, the wind response is decomposed into background and resonant component through
performing quasi-static analysis. This is performed through introducing a relatively large time
step instead of the actual real time step, by increasing the time step, the resonant component is
eliminated. The Mean and background responses are then calculated by subtracting the total
dynamic response from the quasi-static response. Then, the resonant part is reduced by an R
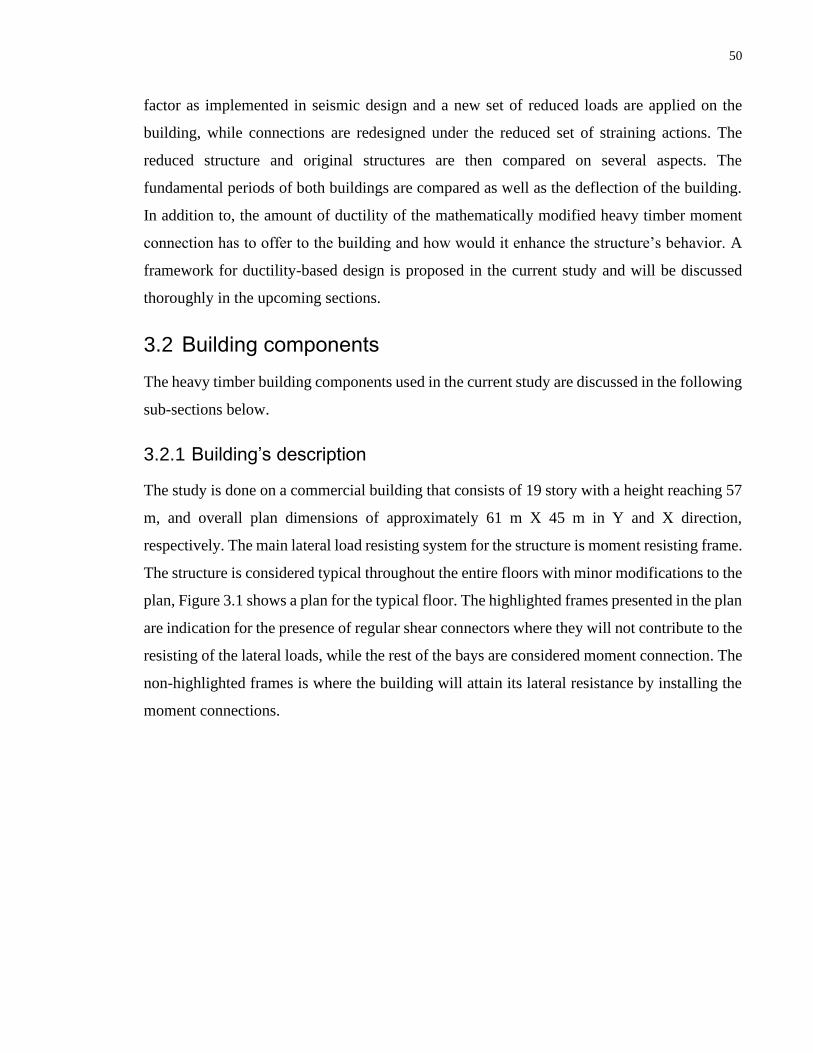
50
factor as implemented in seismic design and a new set of reduced loads are applied on the
building, while connections are redesigned under the reduced set of straining actions. The
reduced structure and original structures are then compared on several aspects. The
fundamental periods of both buildings are compared as well as the deflection of the building.
In addition to, the amount of ductility of the mathematically modified heavy timber moment
connection has to offer to the building and how would it enhance the structure’s behavior. A
framework for ductility-based design is proposed in the current study and will be discussed
thoroughly in the upcoming sections.
3.2 Building components
The heavy timber building components used in the current study are discussed in the following
sub-sections below.
3.2.1 Building’s description
The study is done on a commercial building that consists of 19 story with a height reaching 57
m, and overall plan dimensions of approximately 61 m X 45 m in Y and X direction,
respectively. The main lateral load resisting system for the structure is moment resisting frame.
The structure is considered typical throughout the entire floors with minor modifications to the
plan, Figure 3.1 shows a plan for the typical floor. The highlighted frames presented in the plan
are indication for the presence of regular shear connectors where they will not contribute to the
resisting of the lateral loads, while the rest of the bays are considered moment connection. The
non-highlighted frames is where the building will attain its lateral resistance by installing the
moment connections.
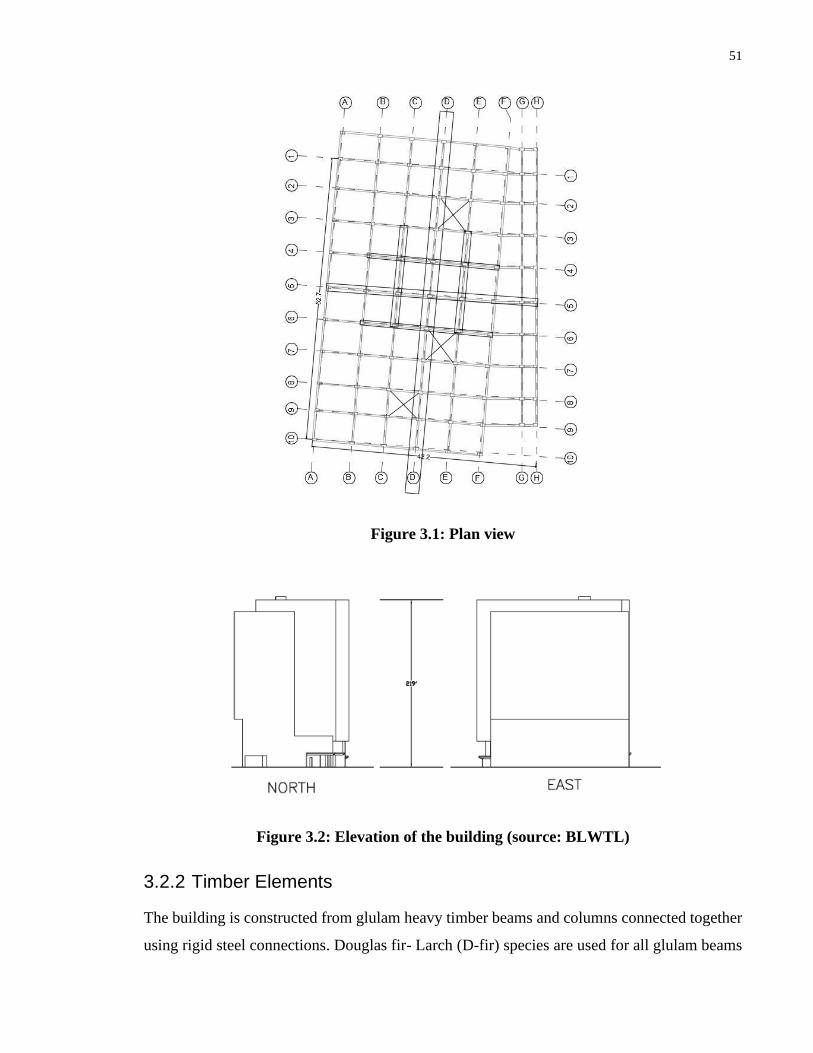
51
Figure 3.1: Plan view
Figure 3.2: Elevation of the building (source: BLWTL)
3.2.2 Timber Elements
The building is constructed from glulam heavy timber beams and columns connected together
using rigid steel connections. Douglas fir- Larch (D-fir) species are used for all glulam beams
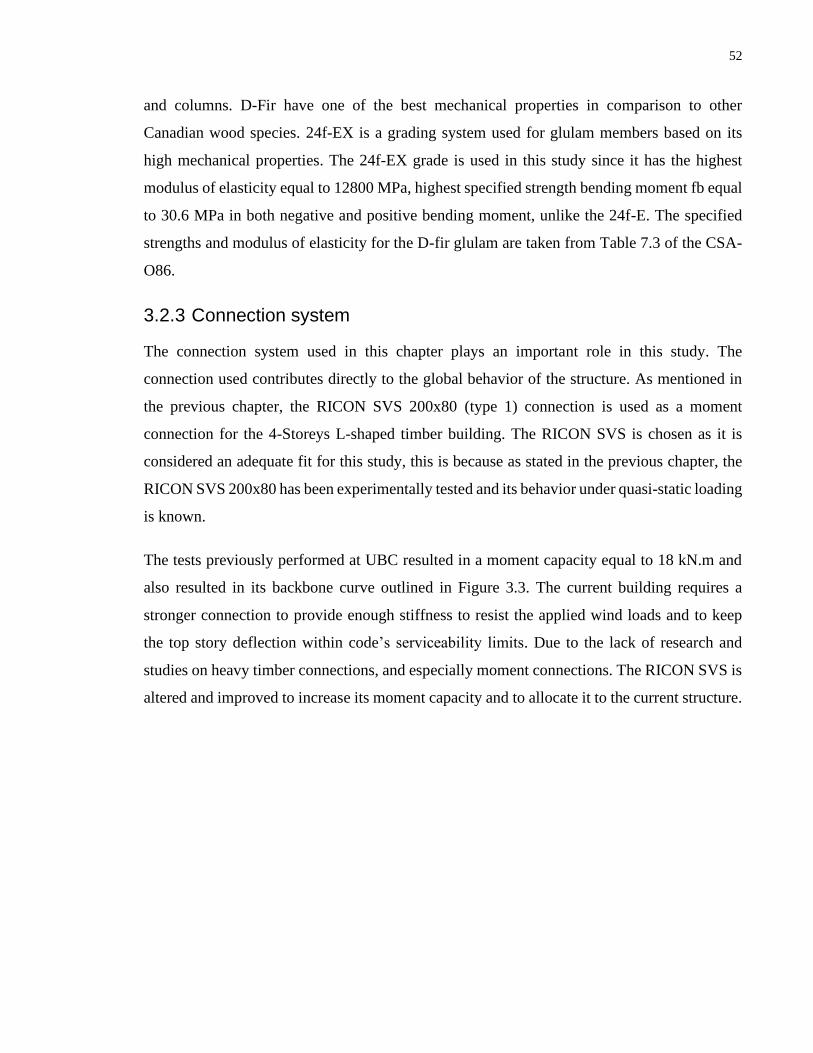
52
and columns. D-Fir have one of the best mechanical properties in comparison to other
Canadian wood species. 24f-EX is a grading system used for glulam members based on its
high mechanical properties. The 24f-EX grade is used in this study since it has the highest
modulus of elasticity equal to 12800 MPa, highest specified strength bending moment fb equal
to 30.6 MPa in both negative and positive bending moment, unlike the 24f-E. The specified
strengths and modulus of elasticity for the D-fir glulam are taken from Table 7.3 of the CSA-
O86.
3.2.3 Connection system
The connection system used in this chapter plays an important role in this study. The
connection used contributes directly to the global behavior of the structure. As mentioned in
the previous chapter, the RICON SVS 200x80 (type 1) connection is used as a moment
connection for the 4-Storeys L-shaped timber building. The RICON SVS is chosen as it is
considered an adequate fit for this study, this is because as stated in the previous chapter, the
RICON SVS 200x80 has been experimentally tested and its behavior under quasi-static loading
is known.
The tests previously performed at UBC resulted in a moment capacity equal to 18 kN.m and
also resulted in its backbone curve outlined in Figure 3.3. The current building requires a
stronger connection to provide enough stiffness to resist the applied wind loads and to keep
the top story deflection within code’s serviceability limits. Due to the lack of research and
studies on heavy timber connections, and especially moment connections. The RICON SVS is
altered and improved to increase its moment capacity and to allocate it to the current structure.
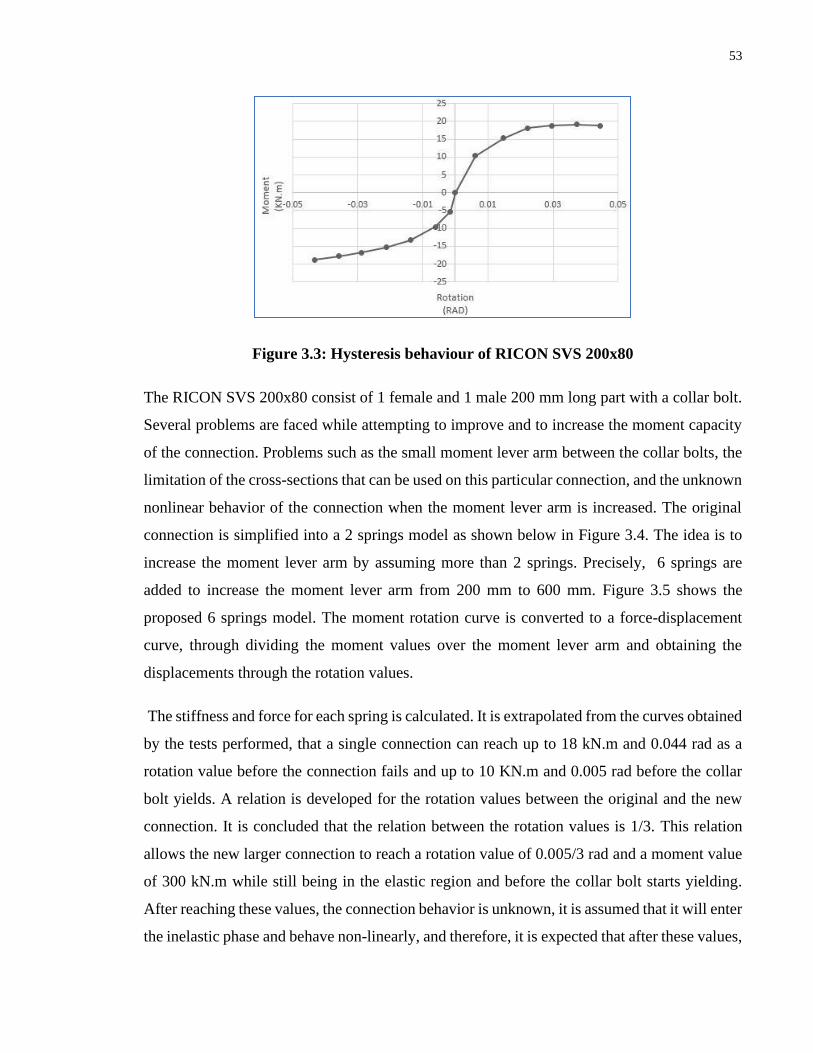
53
Figure 3.3: Hysteresis behaviour of RICON SVS 200x80
The RICON SVS 200x80 consist of 1 female and 1 male 200 mm long part with a collar bolt.
Several problems are faced while attempting to improve and to increase the moment capacity
of the connection. Problems such as the small moment lever arm between the collar bolts, the
limitation of the cross-sections that can be used on this particular connection, and the unknown
nonlinear behavior of the connection when the moment lever arm is increased. The original
connection is simplified into a 2 springs model as shown below in Figure 3.4. The idea is to
increase the moment lever arm by assuming more than 2 springs. Precisely, 6 springs are
added to increase the moment lever arm from 200 mm to 600 mm. Figure 3.5 shows the
proposed 6 springs model. The moment rotation curve is converted to a force-displacement
curve, through dividing the moment values over the moment lever arm and obtaining the
displacements through the rotation values.
The stiffness and force for each spring is calculated. It is extrapolated from the curves obtained
by the tests performed, that a single connection can reach up to 18 kN.m and 0.044 rad as a
rotation value before the connection fails and up to 10 KN.m and 0.005 rad before the collar
bolt yields. A relation is developed for the rotation values between the original and the new
connection. It is concluded that the relation between the rotation values is 1/3. This relation
allows the new larger connection to reach a rotation value of 0.005/3 rad and a moment value
of 300 kN.m while still being in the elastic region and before the collar bolt starts yielding.
After reaching these values, the connection behavior is unknown, it is assumed that it will enter
the inelastic phase and behave non-linearly, and therefore, it is expected that after these values,
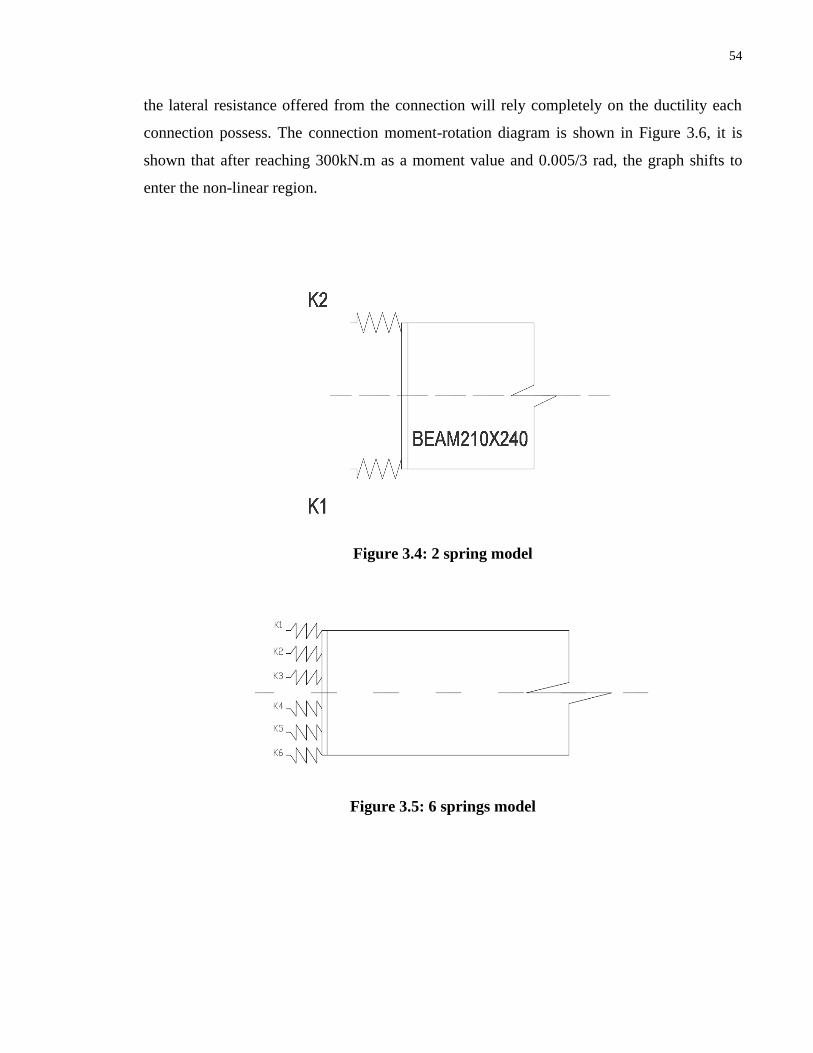
54
the lateral resistance offered from the connection will rely completely on the ductility each
connection possess. The connection moment-rotation diagram is shown in Figure 3.6, it is
shown that after reaching 300kN.m as a moment value and 0.005/3 rad, the graph shifts to
enter the non-linear region.
Figure 3.4: 2 spring model
Figure 3.5: 6 springs model
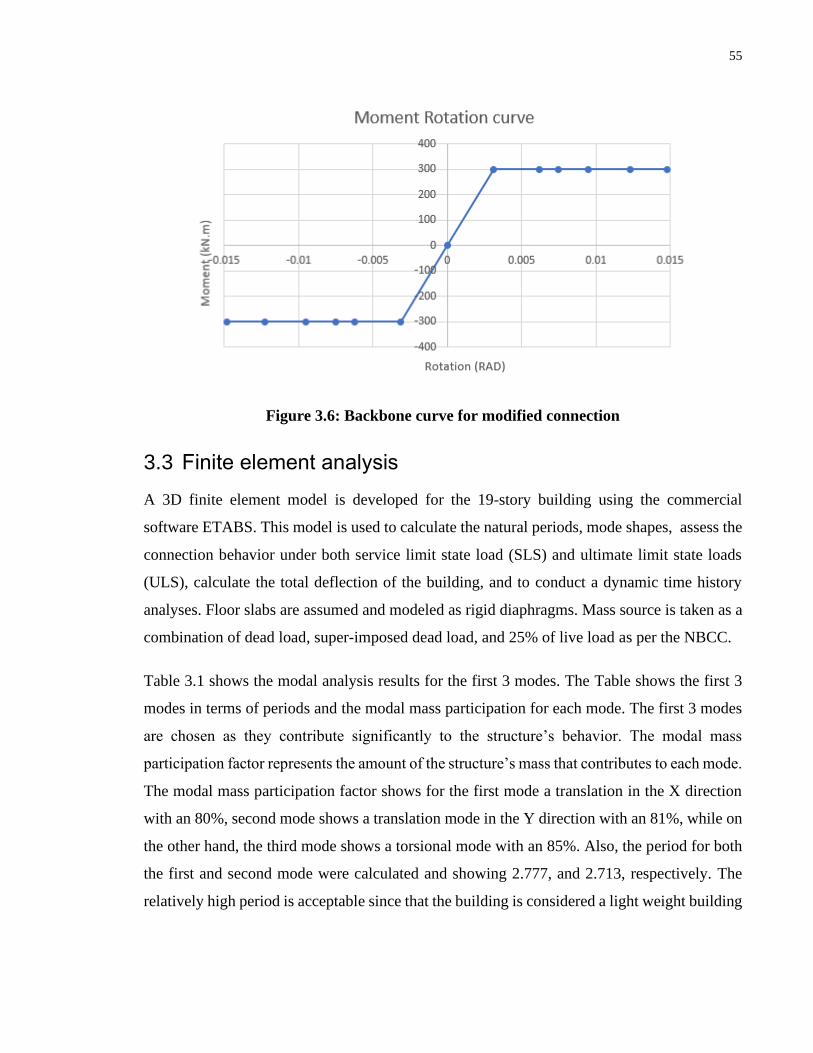
55
Figure 3.6: Backbone curve for modified connection
3.3 Finite element analysis
A 3D finite element model is developed for the 19-story building using the commercial
software ETABS. This model is used to calculate the natural periods, mode shapes, assess the
connection behavior under both service limit state load (SLS) and ultimate limit state loads
(ULS), calculate the total deflection of the building, and to conduct a dynamic time history
analyses. Floor slabs are assumed and modeled as rigid diaphragms. Mass source is taken as a
combination of dead load, super-imposed dead load, and 25% of live load as per the NBCC.
Table 3.1 shows the modal analysis results for the first 3 modes. The Table shows the first 3
modes in terms of periods and the modal mass participation for each mode. The first 3 modes
are chosen as they contribute significantly to the structure’s behavior. The modal mass
participation factor represents the amount of the structure’s mass that contributes to each mode.
The modal mass participation factor shows for the first mode a translation in the X direction
with an 80%, second mode shows a translation mode in the Y direction with an 81%, while on
the other hand, the third mode shows a torsional mode with an 85%. Also, the period for both
the first and second mode were calculated and showing 2.777, and 2.713, respectively. The
relatively high period is acceptable since that the building is considered a light weight building
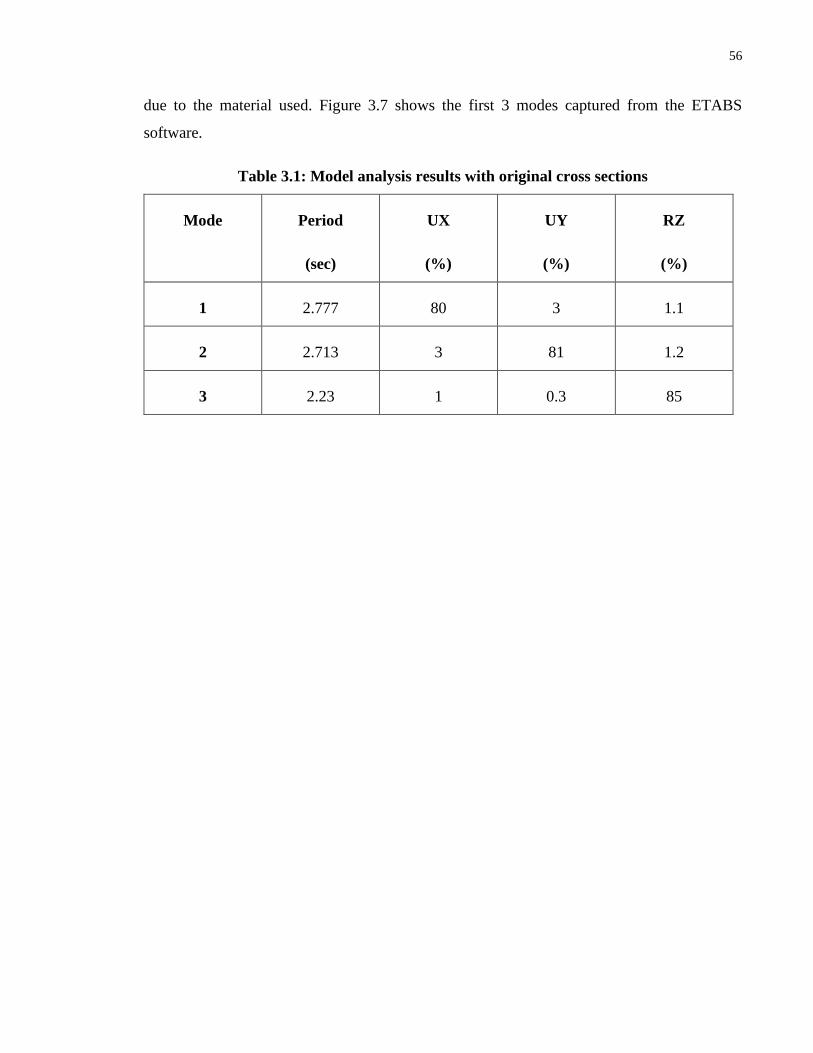
56
due to the material used. Figure 3.7 shows the first 3 modes captured from the ETABS
software.
Table 3.1: Model analysis results with original cross sections
Mode Period
(sec)
UX
(%)
UY
(%)
RZ
(%)
1 2.777 80 3 1.1
2 2.713 3 81 1.2
3 2.23 1 0.3 85
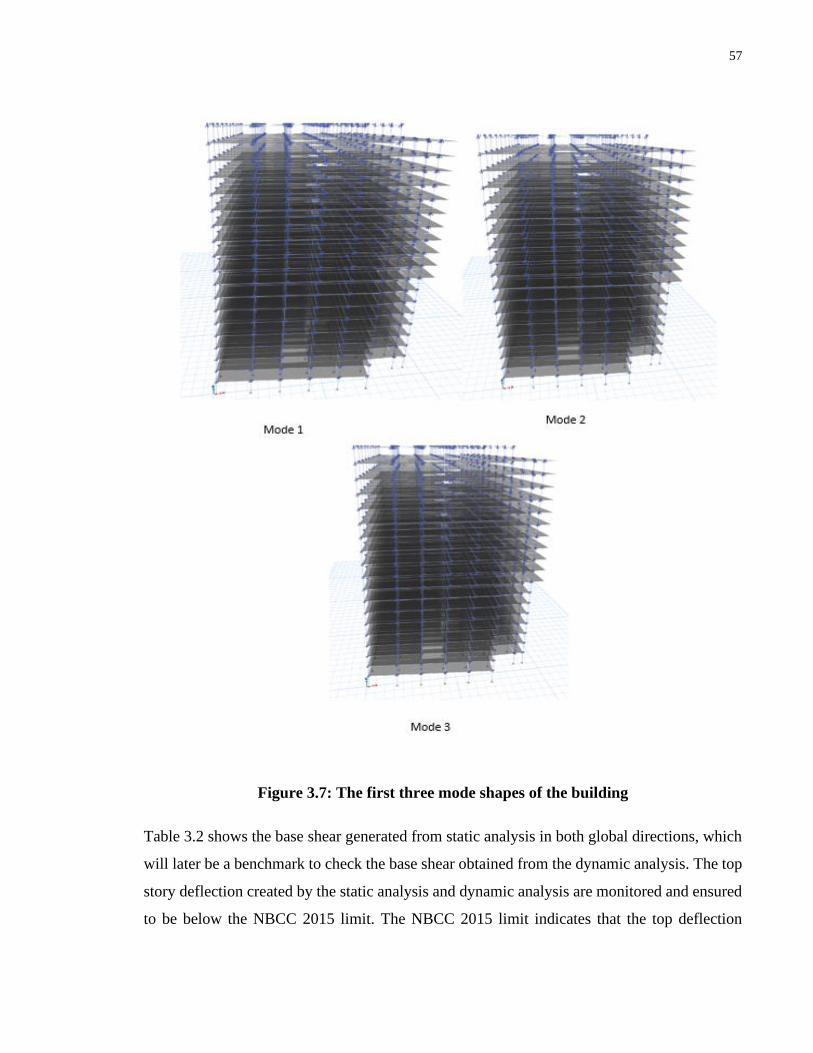
57
Figure 3.7: The first three mode shapes of the building
Table 3.2 shows the base shear generated from static analysis in both global directions, which
will later be a benchmark to check the base shear obtained from the dynamic analysis. The top
story deflection created by the static analysis and dynamic analysis are monitored and ensured
to be below the NBCC 2015 limit. The NBCC 2015 limit indicates that the top deflection
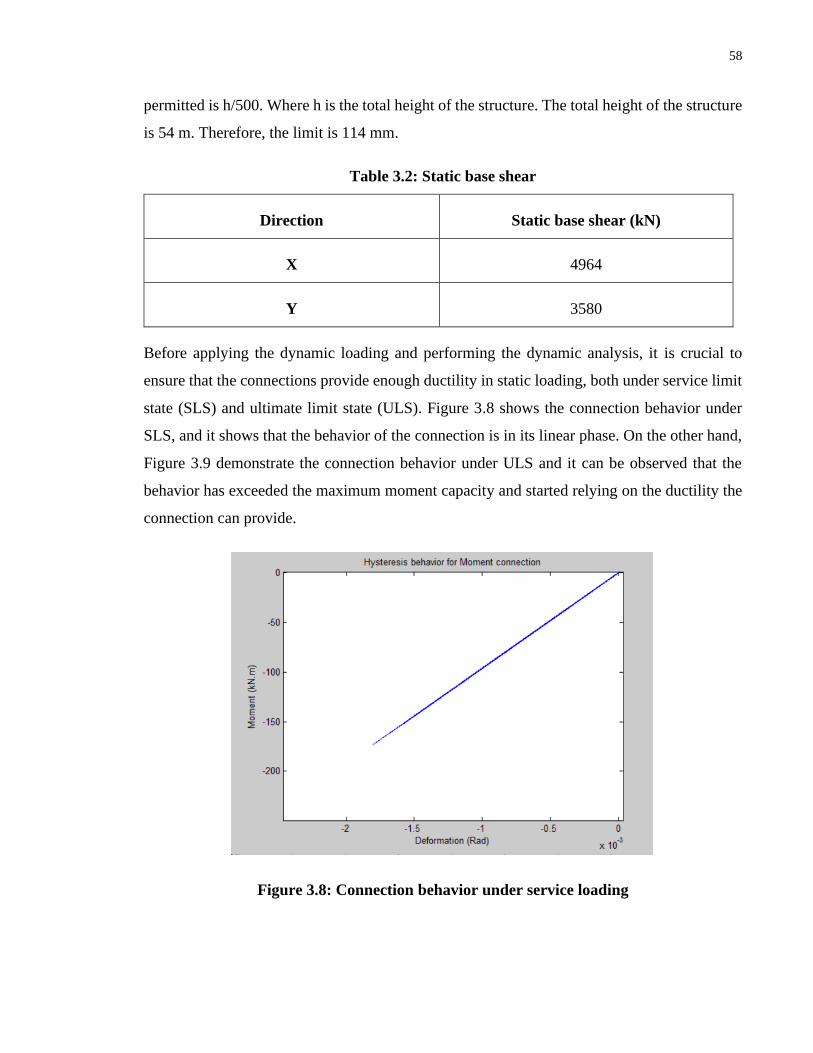
58
permitted is h/500. Where h is the total height of the structure. The total height of the structure
is 54 m. Therefore, the limit is 114 mm.
Table 3.2: Static base shear
Direction Static base shear (kN)
X 4964
Y 3580
Before applying the dynamic loading and performing the dynamic analysis, it is crucial to
ensure that the connections provide enough ductility in static loading, both under service limit
state (SLS) and ultimate limit state (ULS). Figure 3.8 shows the connection behavior under
SLS, and it shows that the behavior of the connection is in its linear phase. On the other hand,
Figure 3.9 demonstrate the connection behavior under ULS and it can be observed that the
behavior has exceeded the maximum moment capacity and started relying on the ductility the
connection can provide.
Figure 3.8: Connection behavior under service loading
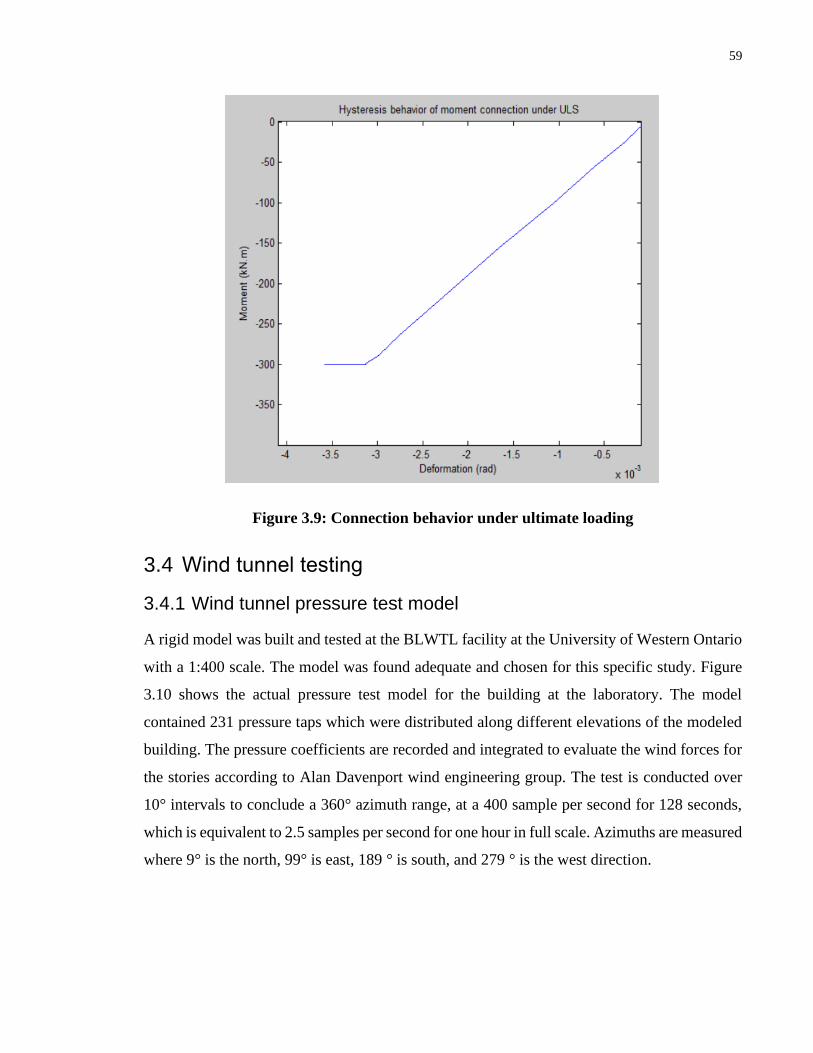
59
Figure 3.9: Connection behavior under ultimate loading
3.4 Wind tunnel testing
3.4.1 Wind tunnel pressure test model
A rigid model was built and tested at the BLWTL facility at the University of Western Ontario
with a 1:400 scale. The model was found adequate and chosen for this specific study. Figure
3.10 shows the actual pressure test model for the building at the laboratory. The model
contained 231 pressure taps which were distributed along different elevations of the modeled
building. The pressure coefficients are recorded and integrated to evaluate the wind forces for
the stories according to Alan Davenport wind engineering group. The test is conducted over
10° intervals to conclude a 360° azimuth range, at a 400 sample per second for 128 seconds,
which is equivalent to 2.5 samples per second for one hour in full scale. Azimuths are measured
where 9° is the north, 99° is east, 189 ° is south, and 279 ° is the west direction.
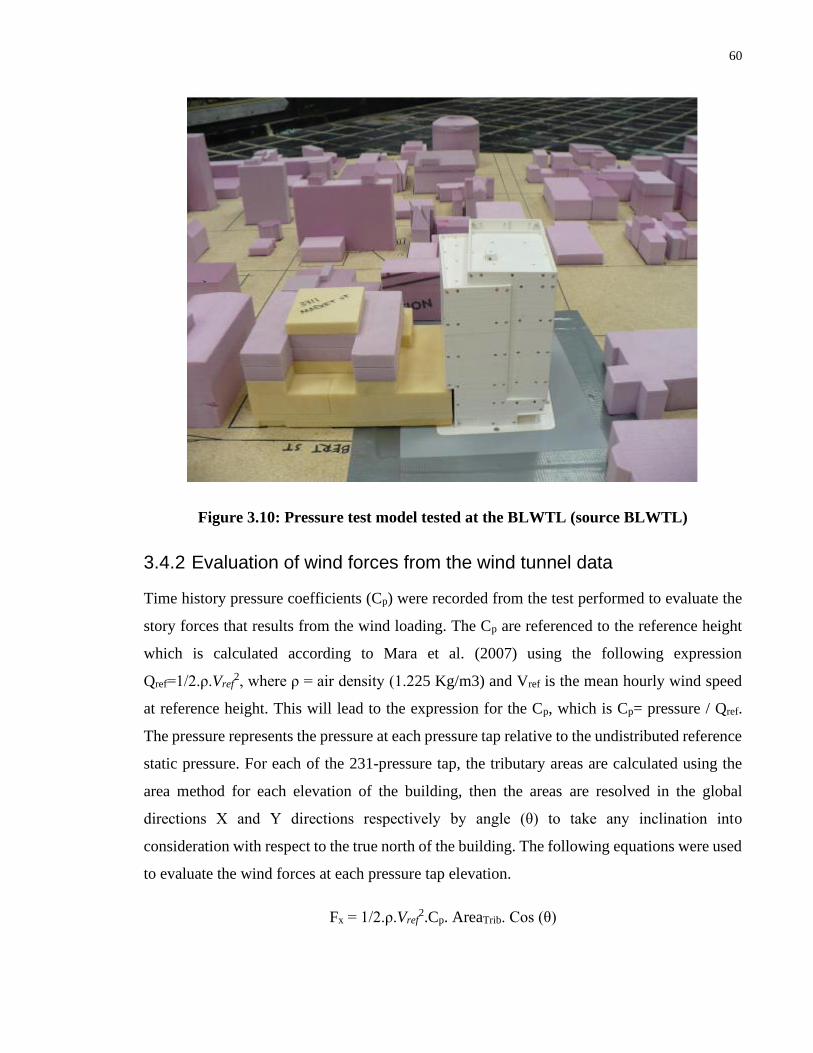
60
Figure 3.10: Pressure test model tested at the BLWTL (source BLWTL)
3.4.2 Evaluation of wind forces from the wind tunnel data
Time history pressure coefficients (Cp) were recorded from the test performed to evaluate the
story forces that results from the wind loading. The Cp are referenced to the reference height
which is calculated according to Mara et al. (2007) using the following expression
Qref=1/2.ρ.Vref2, where ρ = air density (1.225 Kg/m3) and Vref is the mean hourly wind speed
at reference height. This will lead to the expression for the Cp, which is Cp= pressure / Qref.
The pressure represents the pressure at each pressure tap relative to the undistributed reference
static pressure. For each of the 231-pressure tap, the tributary areas are calculated using the
area method for each elevation of the building, then the areas are resolved in the global
directions X and Y directions respectively by angle (θ) to take any inclination into
consideration with respect to the true north of the building. The following equations were used
to evaluate the wind forces at each pressure tap elevation.
Fx = 1/2.ρ.Vref2.Cp. AreaTrib. Cos (θ)
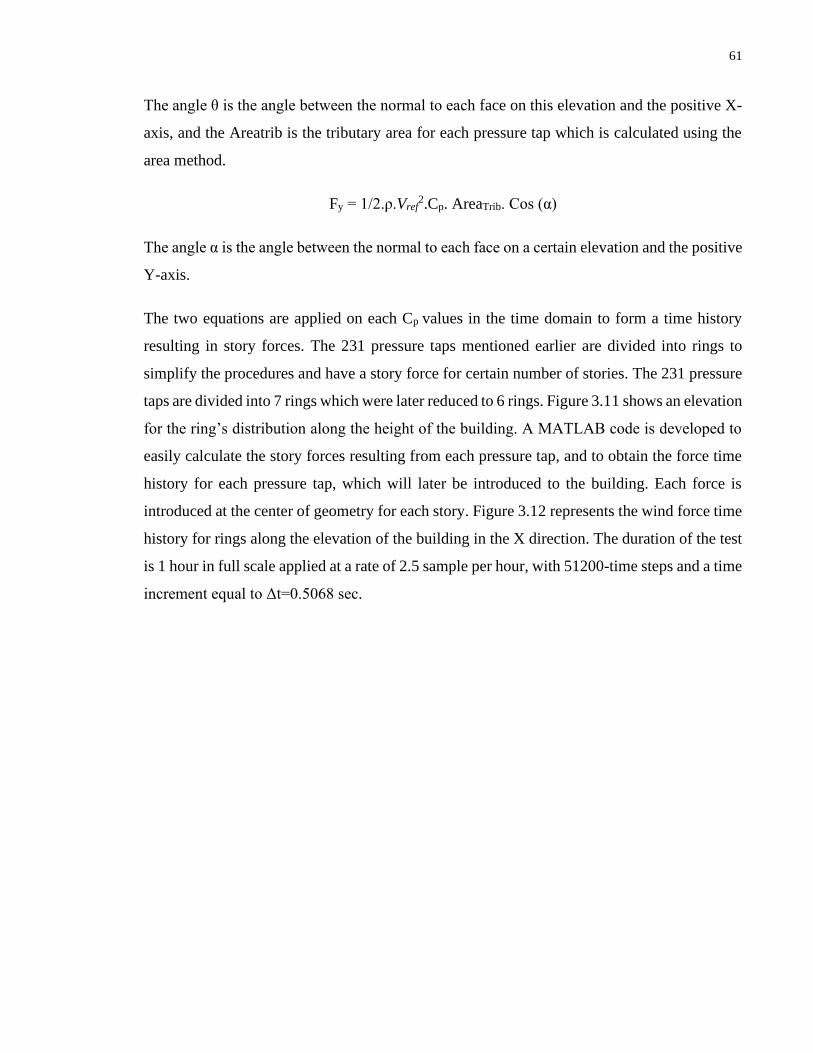
61
The angle θ is the angle between the normal to each face on this elevation and the positive X-
axis, and the Areatrib is the tributary area for each pressure tap which is calculated using the
area method.
Fy = 1/2.ρ.Vref2.Cp. AreaTrib. Cos (α)
The angle α is the angle between the normal to each face on a certain elevation and the positive
Y-axis.
The two equations are applied on each Cp values in the time domain to form a time history
resulting in story forces. The 231 pressure taps mentioned earlier are divided into rings to
simplify the procedures and have a story force for certain number of stories. The 231 pressure
taps are divided into 7 rings which were later reduced to 6 rings. Figure 3.11 shows an elevation
for the ring’s distribution along the height of the building. A MATLAB code is developed to
easily calculate the story forces resulting from each pressure tap, and to obtain the force time
history for each pressure tap, which will later be introduced to the building. Each force is
introduced at the center of geometry for each story. Figure 3.12 represents the wind force time
history for rings along the elevation of the building in the X direction. The duration of the test
is 1 hour in full scale applied at a rate of 2.5 sample per hour, with 51200-time steps and a time
increment equal to Δt=0.5068 sec.
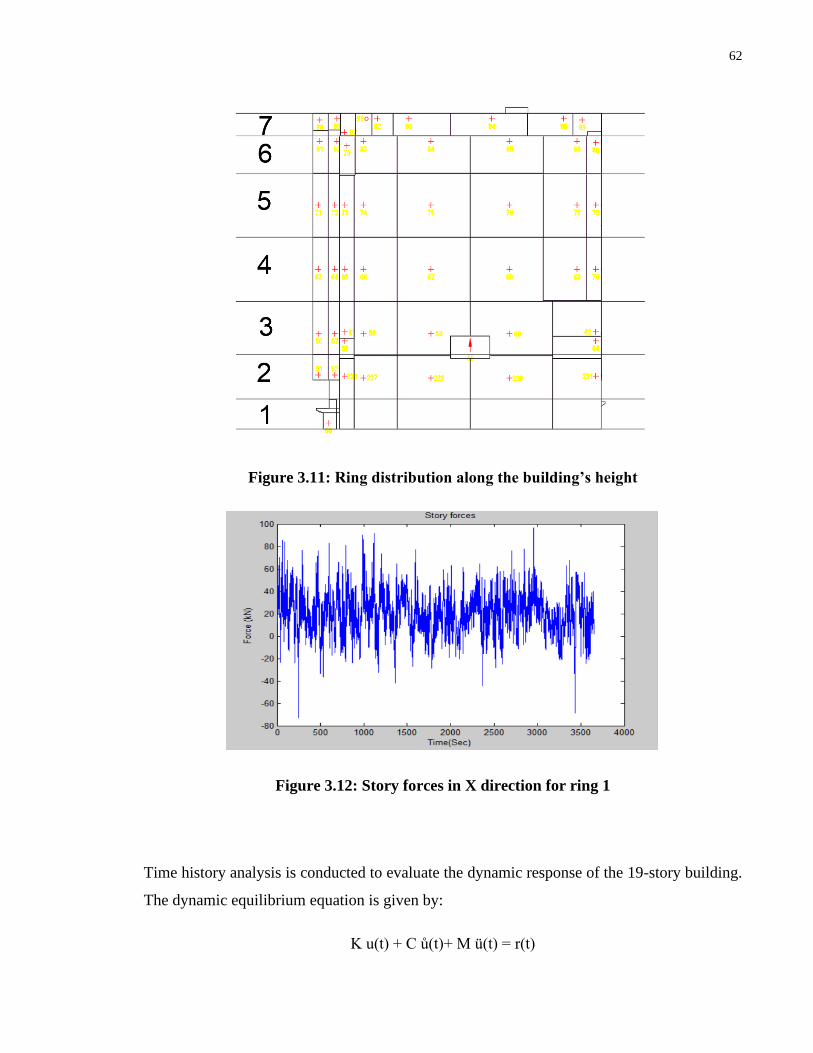
62
Figure 3.11: Ring distribution along the building’s height
Figure 3.12: Story forces in X direction for ring 1
Time history analysis is conducted to evaluate the dynamic response of the 19-story building.
The dynamic equilibrium equation is given by:
K u(t) + C ů(t)+ M ü(t) = r(t)
63
Where u, ů, and ü represent displacement, velocity, and acceleration respectively and K, C, M
represent the stiffness matrix, damping matrix, and the diagonal mass matrix, respectively.
While on the other hand, r is the applied load. The analysis is performed on two different
damping values to assess the effect of damping and its correlation to the overall performance
of the structure. The damping ratios used in this study is 1% and 2%. Also, Newmark method
is used for performing the direct-integration time history analysis with γ = 0.5 and β = 0.25.
3.5 Ductility-based design
The ductility-based design concept enables the structure to undergo large cyclic deformation
whilst sustaining the load carrying capacity and dissipating energy in hysteresis cycles. El
Ezaby and El Damatty (2020) conducted a study for a 65-story concrete high-rise building
with a shear wall as a lateral resisting system. The building was exposed to real wind loads
obtained from the BLWTL. Wind components such as mean, background and resonance are
attained separately through dynamic and quasi-static analysis. The resonant component is then
reduced by a reducing factor and recombined with the mean and background component. The
numerical building is analyzed again under the new sets of loads obtained after the reduction
factor is introduced t the resonance component. The building’s elements are re-evaluated and
re-designed. The results indicated that following the ductility-based design concept a 25 %
reduction on the shear walls took place without major changes in the dynamic characteristics
of the building.
This study replicates the same procedures as El Ezaby and El damatty (2020) but with an all-
timber mid-rise building. The following steps presented in figure 3.13 are the scope of work
which are followed throughout this study. Both steps 1 and 2 have been discussed earlier in
the previous sections.
1- Conduct a wind tunnel pressure test and evaluate Cp(t), Fx(t), and Fy(t). The test is
conducted at the BLWTL.
2- Generate a three-dimensional finite element model and evaluate its base shear, and
dynamic characteristics and compare the results with the outcome from the static analysis.
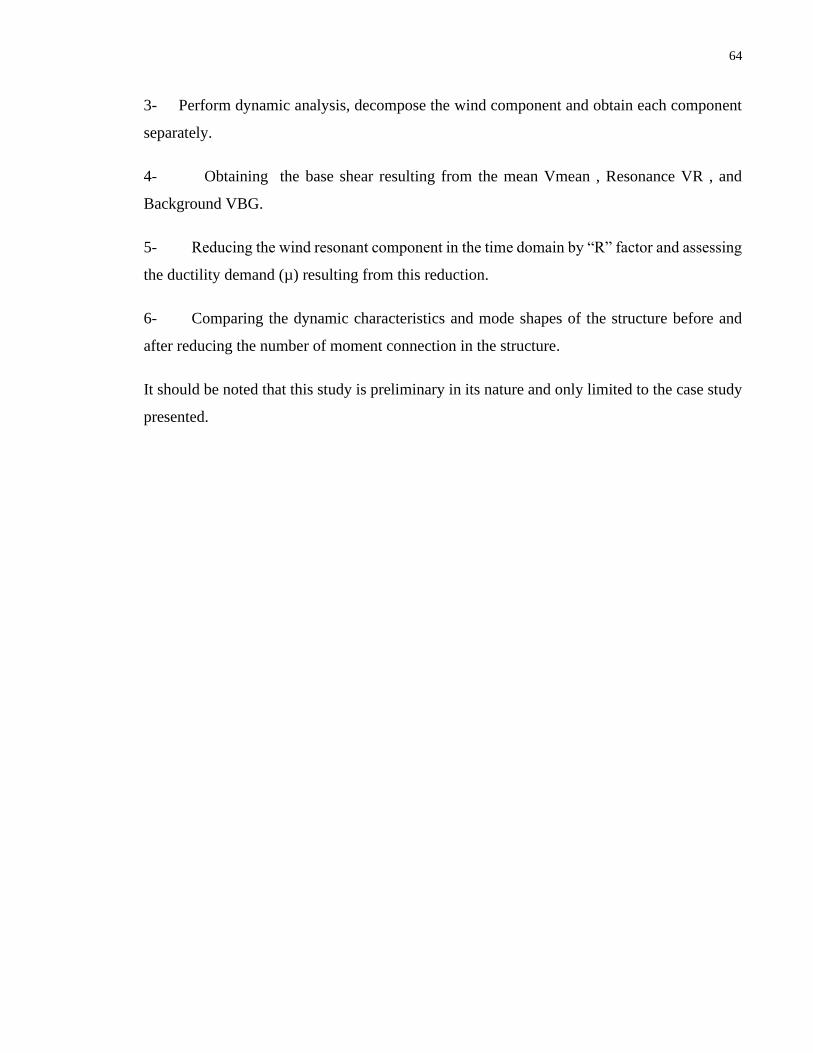
64
3- Perform dynamic analysis, decompose the wind component and obtain each component
separately.
4- Obtaining the base shear resulting from the mean Vmean , Resonance VR , and
Background VBG.
5- Reducing the wind resonant component in the time domain by “R” factor and assessing
the ductility demand (µ) resulting from this reduction.
6- Comparing the dynamic characteristics and mode shapes of the structure before and
after reducing the number of moment connection in the structure.
It should be noted that this study is preliminary in its nature and only limited to the case study
presented.
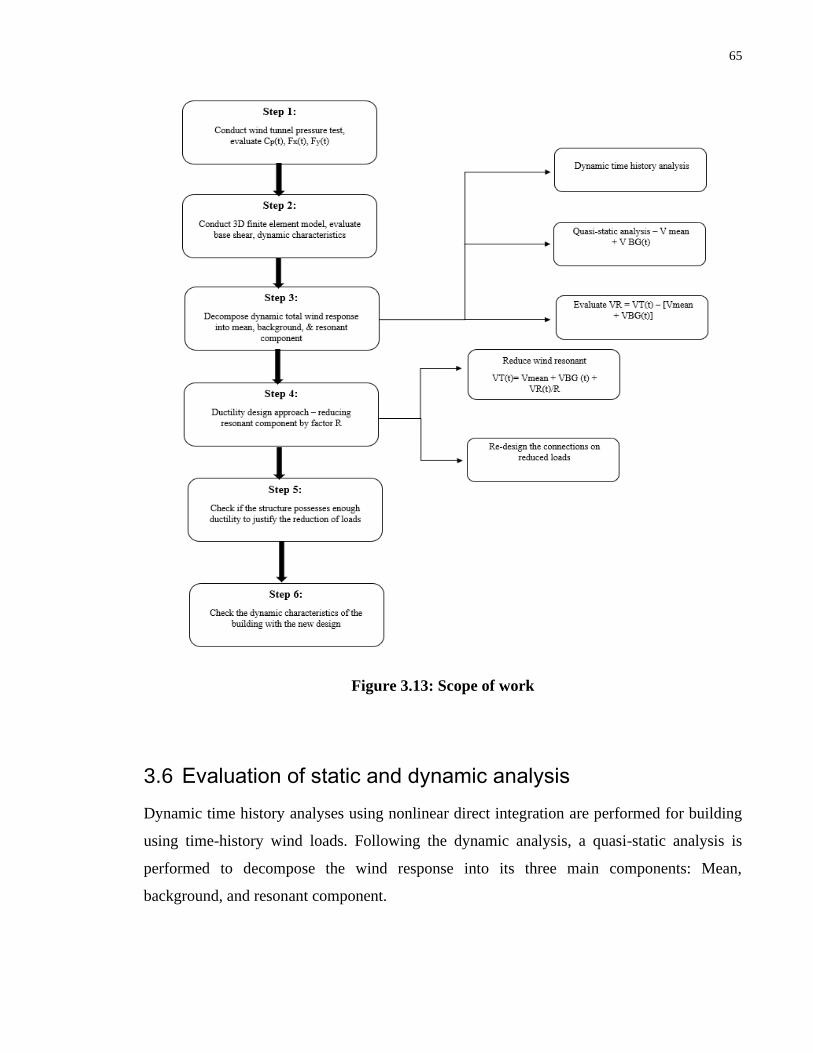
65
Figure 3.13: Scope of work
3.6 Evaluation of static and dynamic analysis
Dynamic time history analyses using nonlinear direct integration are performed for building
using time-history wind loads. Following the dynamic analysis, a quasi-static analysis is
performed to decompose the wind response into its three main components: Mean,
background, and resonant component.
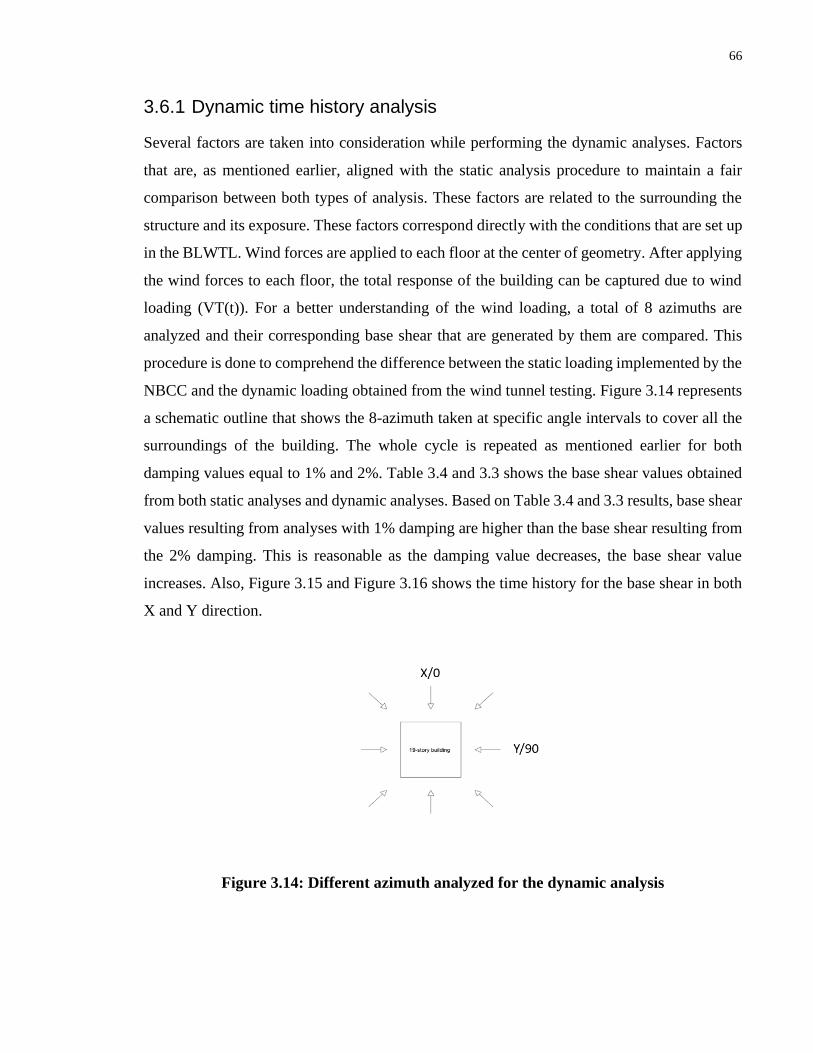
66
3.6.1 Dynamic time history analysis
Several factors are taken into consideration while performing the dynamic analyses. Factors
that are, as mentioned earlier, aligned with the static analysis procedure to maintain a fair
comparison between both types of analysis. These factors are related to the surrounding the
structure and its exposure. These factors correspond directly with the conditions that are set up
in the BLWTL. Wind forces are applied to each floor at the center of geometry. After applying
the wind forces to each floor, the total response of the building can be captured due to wind
loading (VT(t)). For a better understanding of the wind loading, a total of 8 azimuths are
analyzed and their corresponding base shear that are generated by them are compared. This
procedure is done to comprehend the difference between the static loading implemented by the
NBCC and the dynamic loading obtained from the wind tunnel testing. Figure 3.14 represents
a schematic outline that shows the 8-azimuth taken at specific angle intervals to cover all the
surroundings of the building. The whole cycle is repeated as mentioned earlier for both
damping values equal to 1% and 2%. Table 3.4 and 3.3 shows the base shear values obtained
from both static analyses and dynamic analyses. Based on Table 3.4 and 3.3 results, base shear
values resulting from analyses with 1% damping are higher than the base shear resulting from
the 2% damping. This is reasonable as the damping value decreases, the base shear value
increases. Also, Figure 3.15 and Figure 3.16 shows the time history for the base shear in both
X and Y direction.
Figure 3.14: Different azimuth analyzed for the dynamic analysis
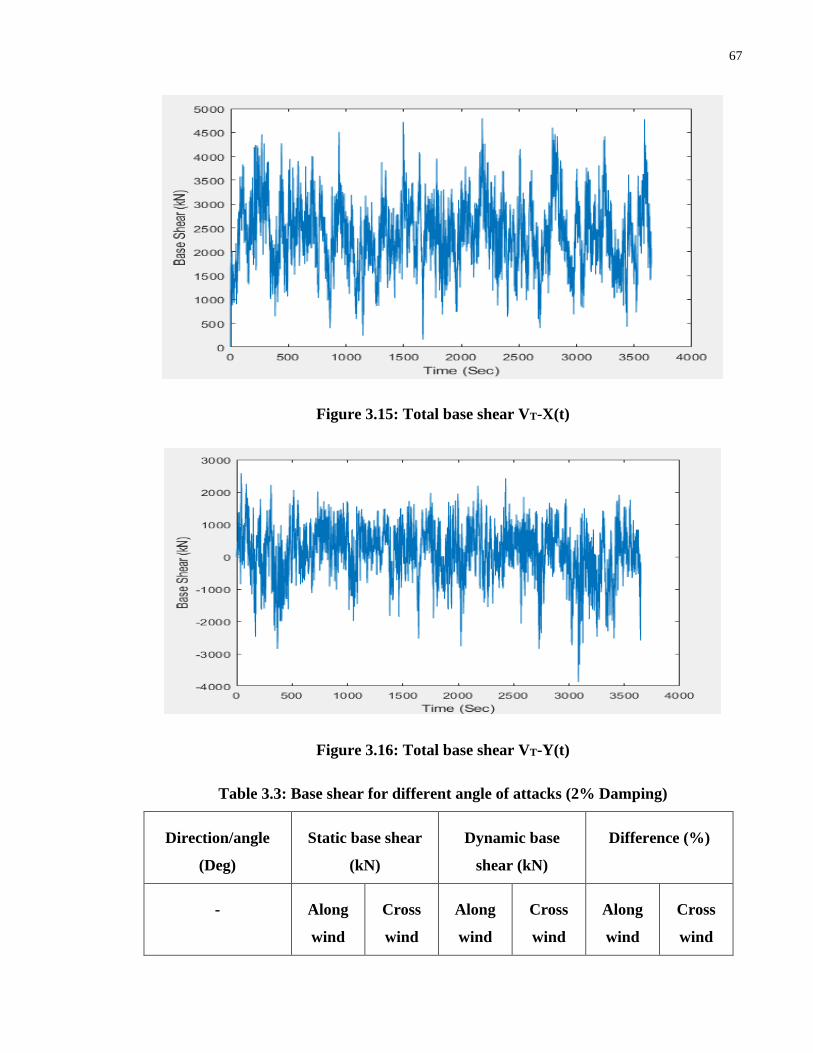
67
Figure 3.15: Total base shear VT-X(t)
Figure 3.16: Total base shear VT-Y(t)
Table 3.3: Base shear for different angle of attacks (2% Damping)
Direction/angle
(Deg)
Static base shear
(kN)
Dynamic base
shear (kN)
Difference (%)
- Along
wind
Cross
wind
Along
wind
Cross
wind
Along
wind
Cross
wind
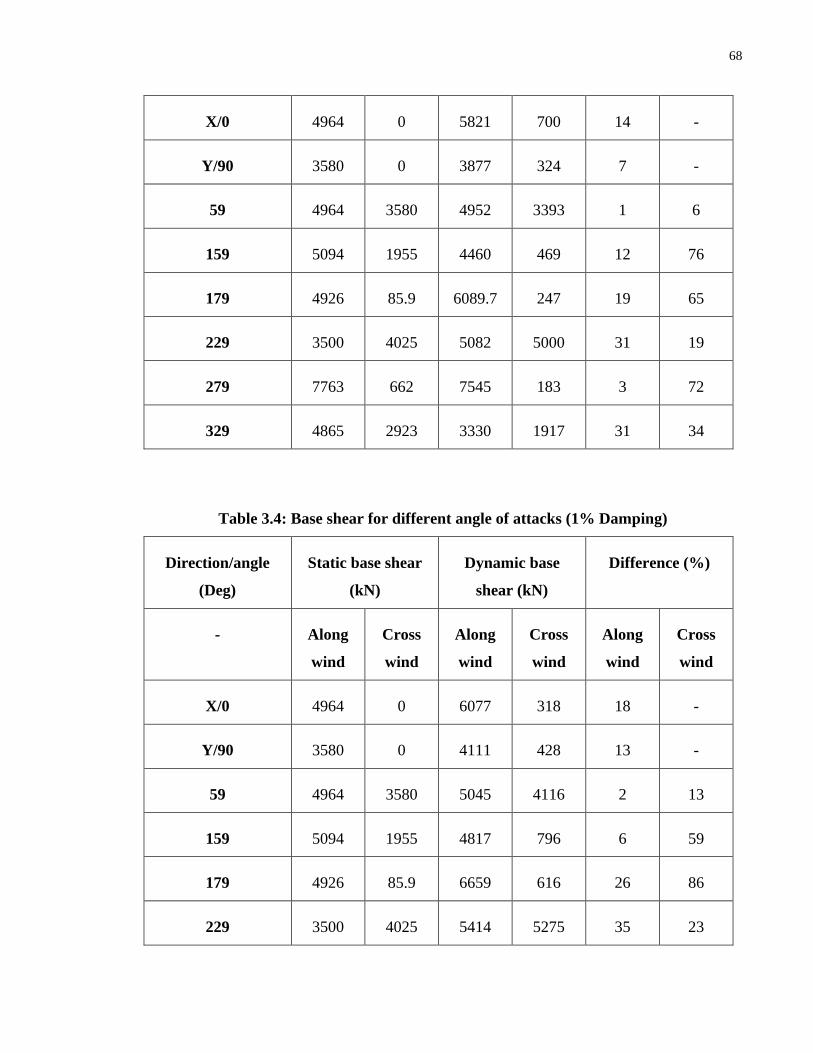
68
X/0 4964 0 5821 700 14 -
Y/90 3580 0 3877 324 7 -
59 4964 3580 4952 3393 1 6
159 5094 1955 4460 469 12 76
179 4926 85.9 6089.7 247 19 65
229 3500 4025 5082 5000 31 19
279 7763 662 7545 183 3 72
329 4865 2923 3330 1917 31 34
Table 3.4: Base shear for different angle of attacks (1% Damping)
Direction/angle
(Deg)
Static base shear
(kN)
Dynamic base
shear (kN)
Difference (%)
- Along
wind
Cross
wind
Along
wind
Cross
wind
Along
wind
Cross
wind
X/0 4964 0 6077 318 18 -
Y/90 3580 0 4111 428 13 -
59 4964 3580 5045 4116 2 13
159 5094 1955 4817 796 6 59
179 4926 85.9 6659 616 26 86
229 3500 4025 5414 5275 35 23
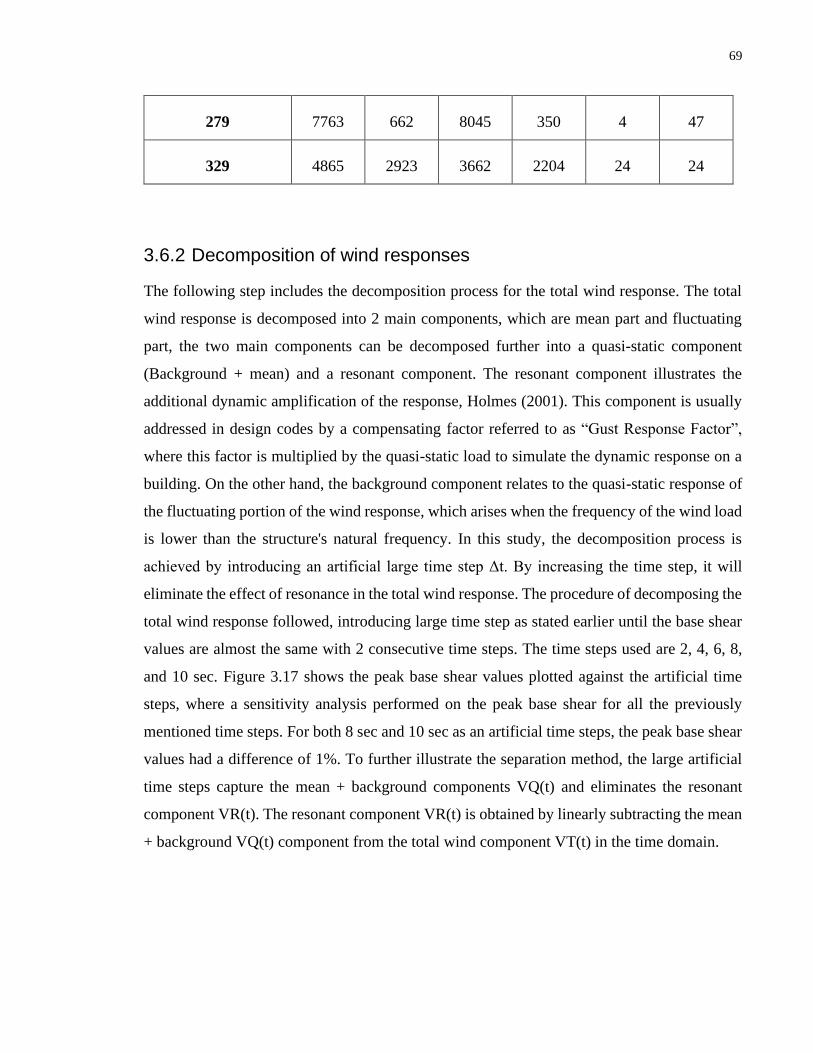
69
279 7763 662 8045 350 4 47
329 4865 2923 3662 2204 24 24
3.6.2 Decomposition of wind responses
The following step includes the decomposition process for the total wind response. The total
wind response is decomposed into 2 main components, which are mean part and fluctuating
part, the two main components can be decomposed further into a quasi-static component
(Background + mean) and a resonant component. The resonant component illustrates the
additional dynamic amplification of the response, Holmes (2001). This component is usually
addressed in design codes by a compensating factor referred to as “Gust Response Factor”,
where this factor is multiplied by the quasi-static load to simulate the dynamic response on a
building. On the other hand, the background component relates to the quasi-static response of
the fluctuating portion of the wind response, which arises when the frequency of the wind load
is lower than the structure's natural frequency. In this study, the decomposition process is
achieved by introducing an artificial large time step Δt. By increasing the time step, it will
eliminate the effect of resonance in the total wind response. The procedure of decomposing the
total wind response followed, introducing large time step as stated earlier until the base shear
values are almost the same with 2 consecutive time steps. The time steps used are 2, 4, 6, 8,
and 10 sec. Figure 3.17 shows the peak base shear values plotted against the artificial time
steps, where a sensitivity analysis performed on the peak base shear for all the previously
mentioned time steps. For both 8 sec and 10 sec as an artificial time steps, the peak base shear
values had a difference of 1%. To further illustrate the separation method, the large artificial
time steps capture the mean + background components VQ(t) and eliminates the resonant
component VR(t). The resonant component VR(t) is obtained by linearly subtracting the mean
+ background VQ(t) component from the total wind component VT(t) in the time domain.
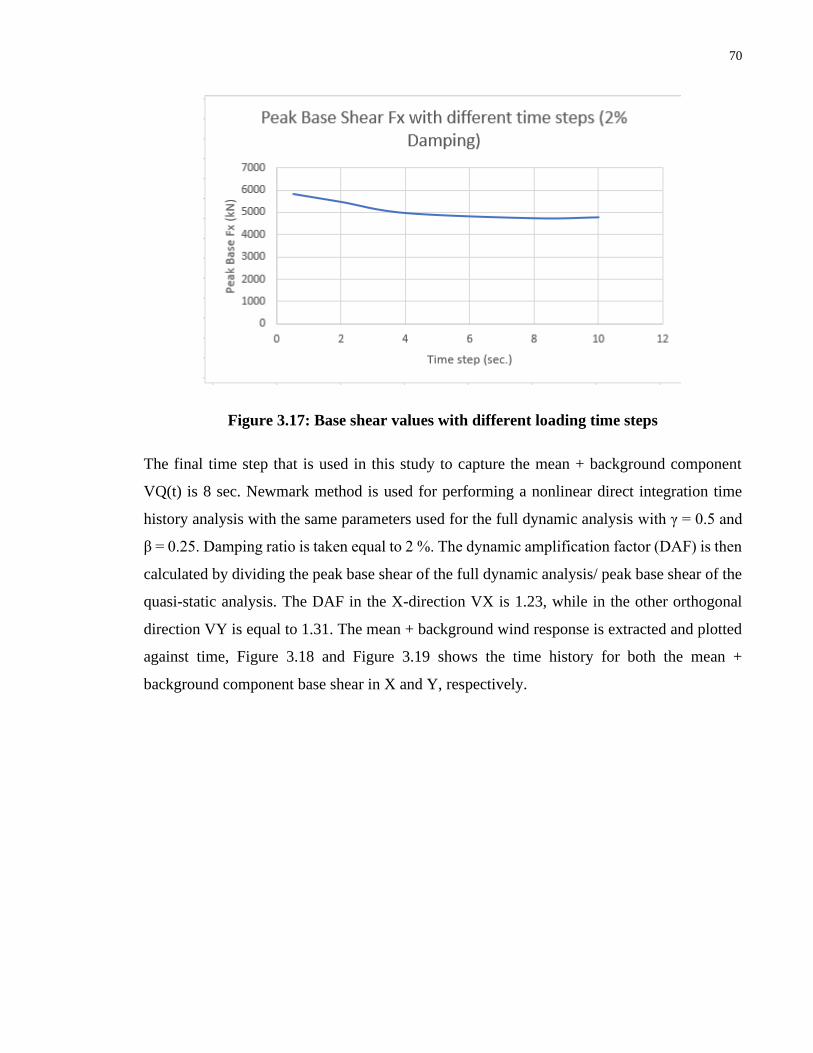
70
Figure 3.17: Base shear values with different loading time steps
The final time step that is used in this study to capture the mean + background component
VQ(t) is 8 sec. Newmark method is used for performing a nonlinear direct integration time
history analysis with the same parameters used for the full dynamic analysis with γ = 0.5 and
β = 0.25. Damping ratio is taken equal to 2 %. The dynamic amplification factor (DAF) is then
calculated by dividing the peak base shear of the full dynamic analysis/ peak base shear of the
quasi-static analysis. The DAF in the X-direction VX is 1.23, while in the other orthogonal
direction VY is equal to 1.31. The mean + background wind response is extracted and plotted
against time, Figure 3.18 and Figure 3.19 shows the time history for both the mean +
background component base shear in X and Y, respectively.
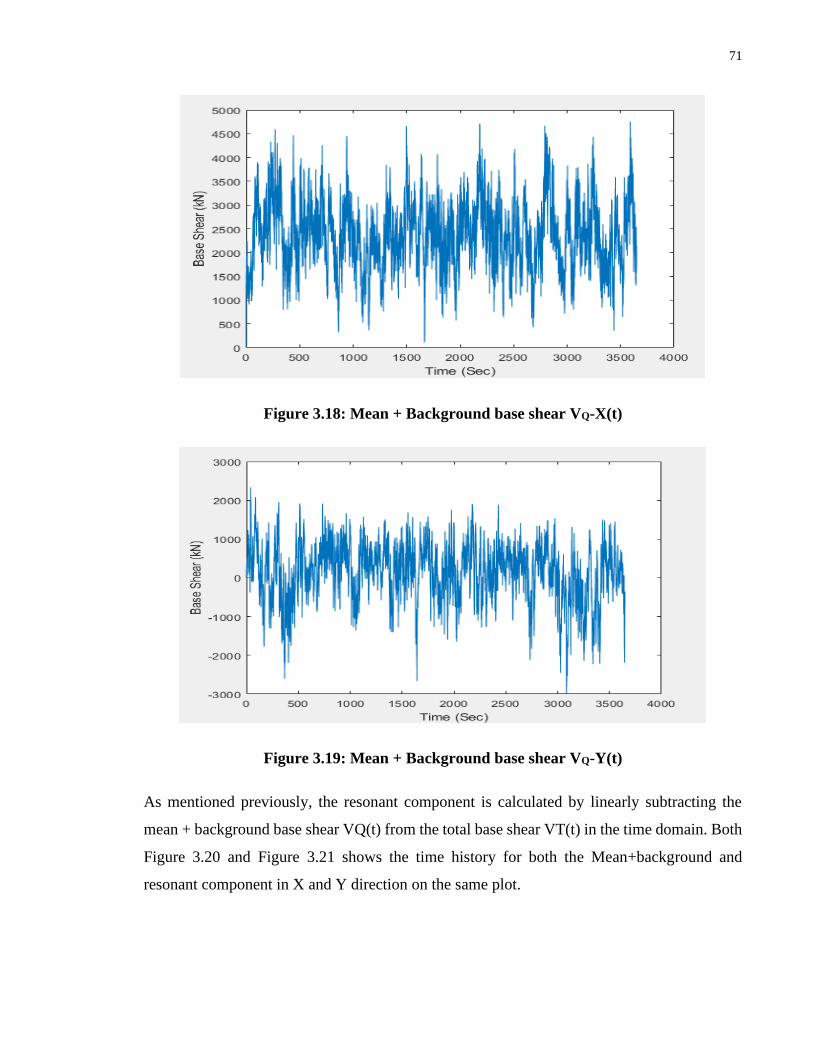
71
Figure 3.18: Mean + Background base shear VQ-X(t)
Figure 3.19: Mean + Background base shear VQ-Y(t)
As mentioned previously, the resonant component is calculated by linearly subtracting the
mean + background base shear VQ(t) from the total base shear VT(t) in the time domain. Both
Figure 3.20 and Figure 3.21 shows the time history for both the Mean+background and
resonant component in X and Y direction on the same plot.
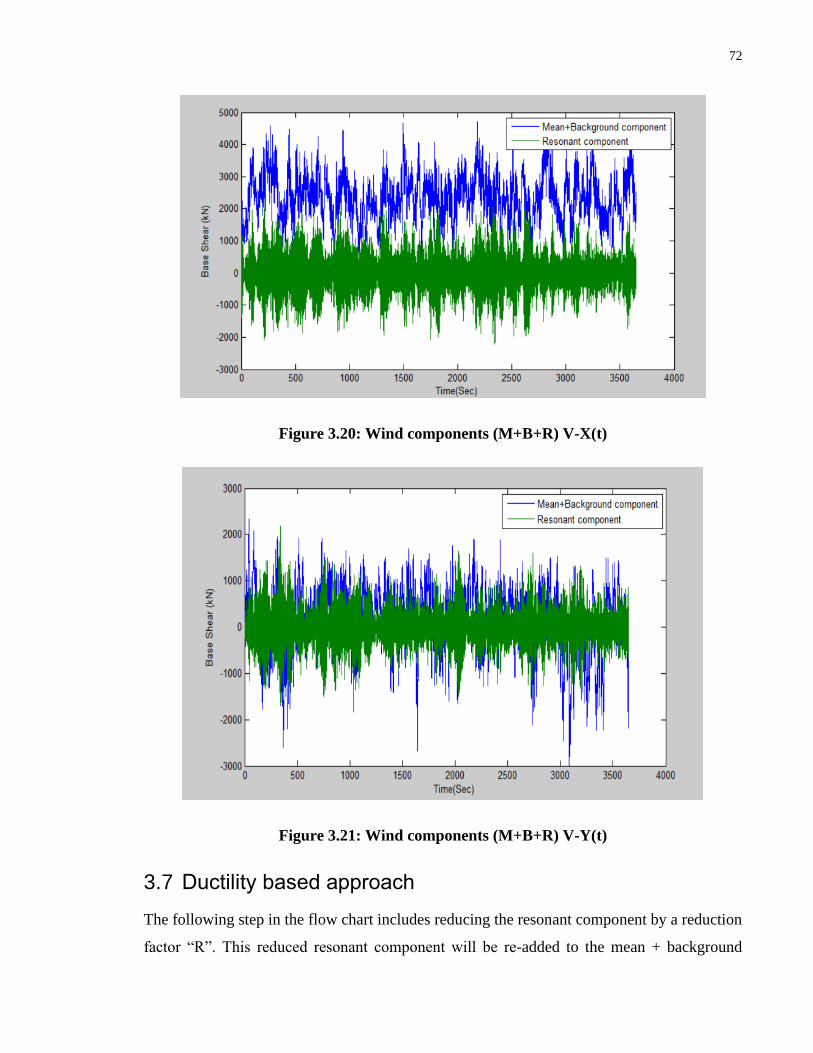
72
Figure 3.20: Wind components (M+B+R) V-X(t)
Figure 3.21: Wind components (M+B+R) V-Y(t)
3.7 Ductility based approach
The following step in the flow chart includes reducing the resonant component by a reduction
factor “R”. This reduced resonant component will be re-added to the mean + background
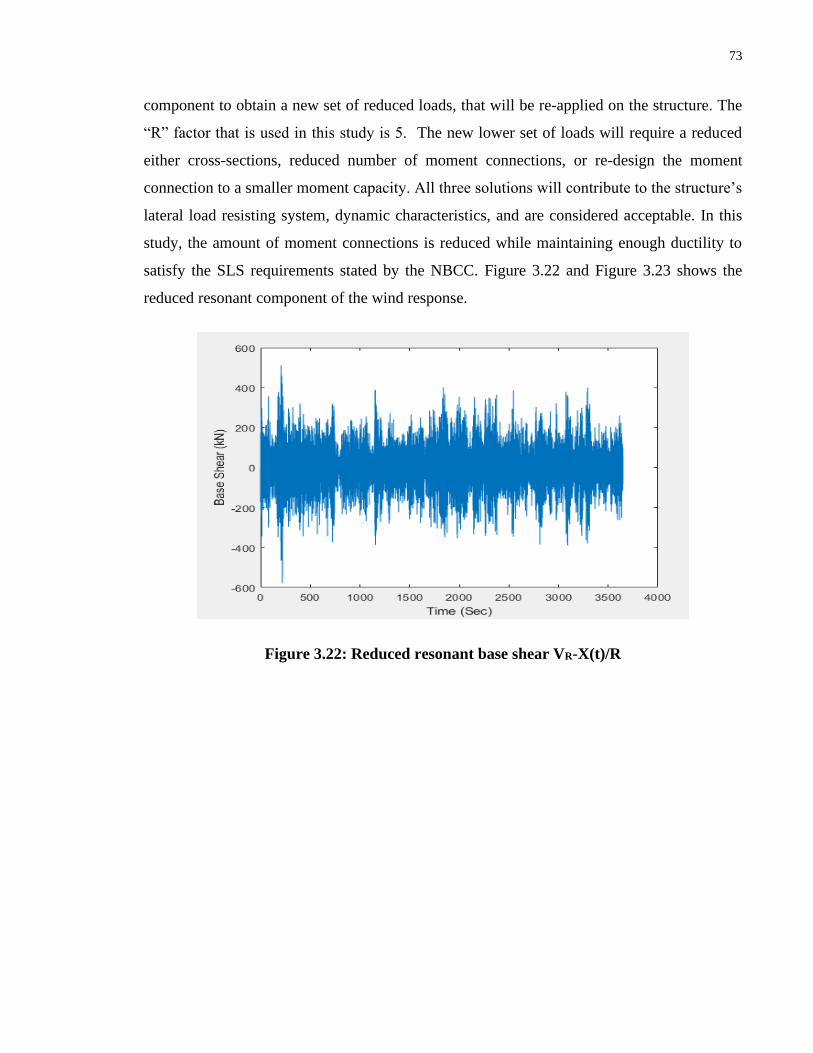
73
component to obtain a new set of reduced loads, that will be re-applied on the structure. The
“R” factor that is used in this study is 5. The new lower set of loads will require a reduced
either cross-sections, reduced number of moment connections, or re-design the moment
connection to a smaller moment capacity. All three solutions will contribute to the structure’s
lateral load resisting system, dynamic characteristics, and are considered acceptable. In this
study, the amount of moment connections is reduced while maintaining enough ductility to
satisfy the SLS requirements stated by the NBCC. Figure 3.22 and Figure 3.23 shows the
reduced resonant component of the wind response.
Figure 3.22: Reduced resonant base shear VR-X(t)/R
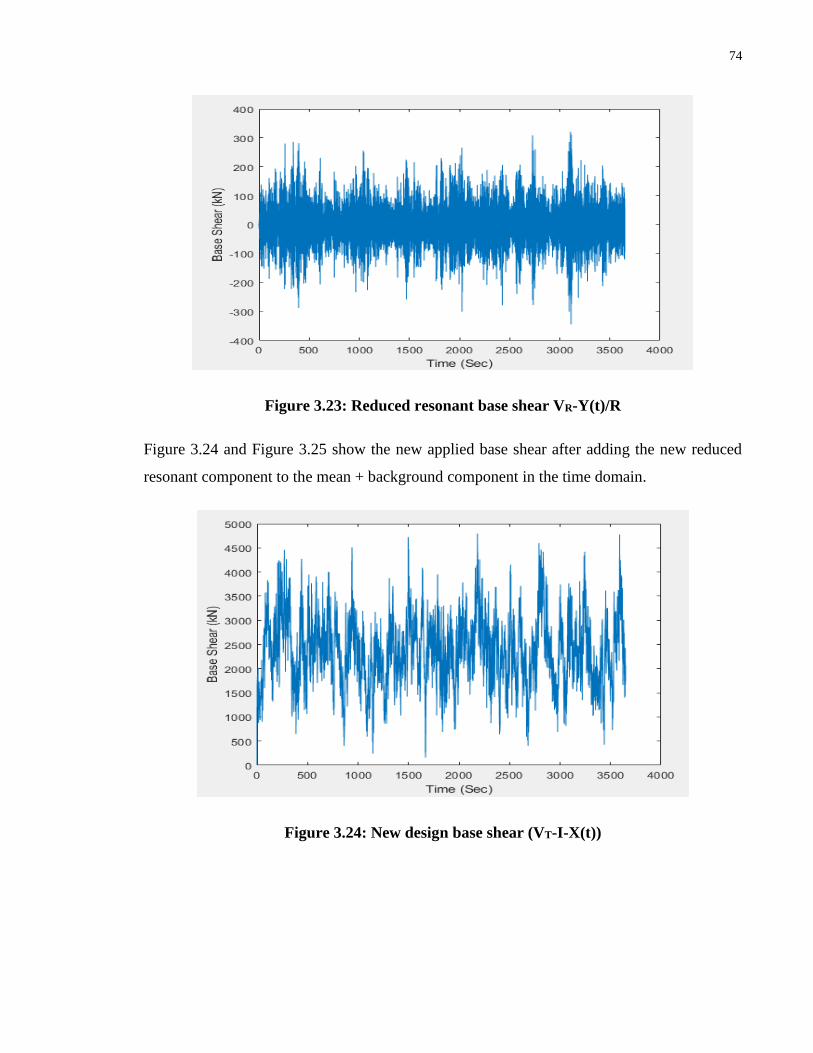
74
Figure 3.23: Reduced resonant base shear VR-Y(t)/R
Figure 3.24 and Figure 3.25 show the new applied base shear after adding the new reduced
resonant component to the mean + background component in the time domain.
Figure 3.24: New design base shear (VT-I-X(t))
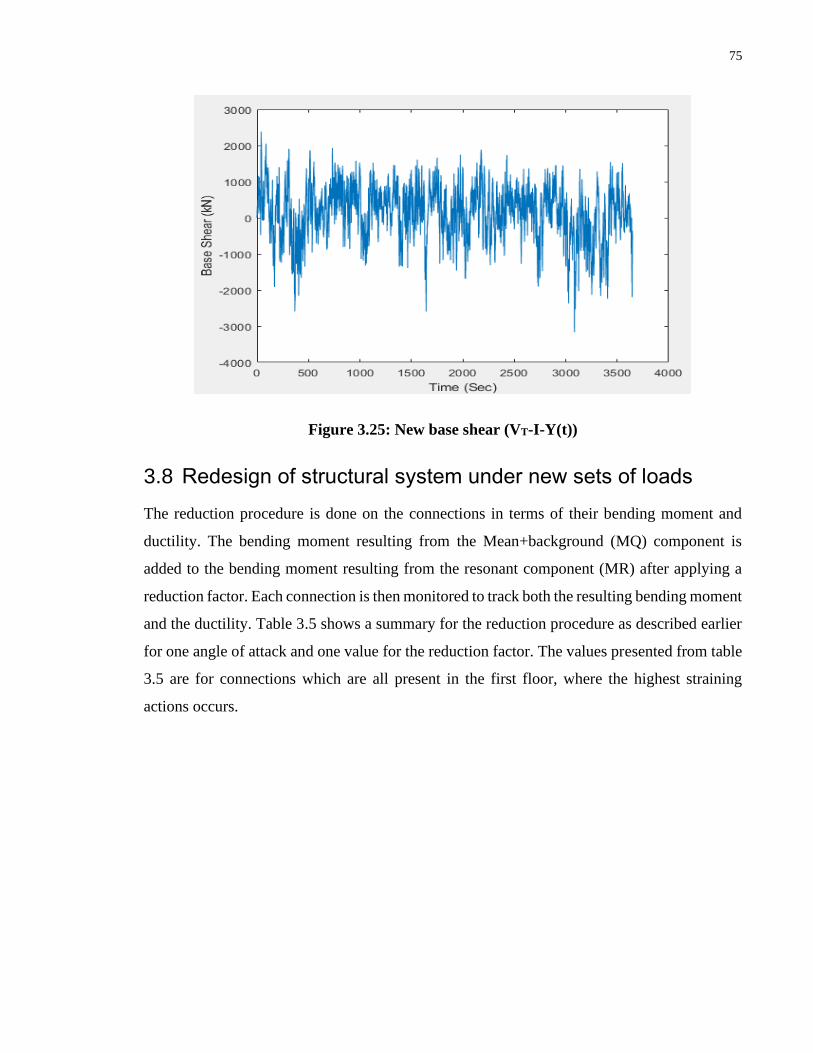
75
Figure 3.25: New base shear (VT-I-Y(t))
3.8 Redesign of structural system under new sets of loads
The reduction procedure is done on the connections in terms of their bending moment and
ductility. The bending moment resulting from the Mean+background (MQ) component is
added to the bending moment resulting from the resonant component (MR) after applying a
reduction factor. Each connection is then monitored to track both the resulting bending moment
and the ductility. Table 3.5 shows a summary for the reduction procedure as described earlier
for one angle of attack and one value for the reduction factor. The values presented from table
3.5 are for connections which are all present in the first floor, where the highest straining
actions occurs.
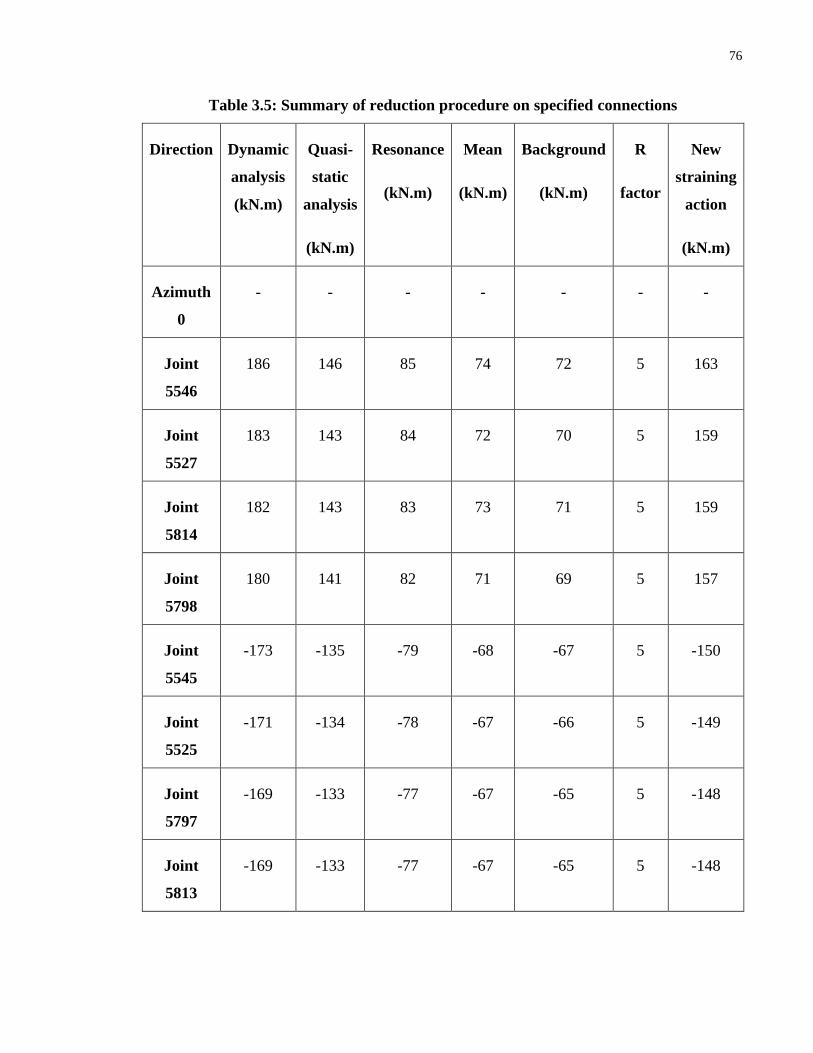
76
Table 3.5: Summary of reduction procedure on specified connections
Direction Dynamic
analysis
(kN.m)
Quasi-
static
analysis
(kN.m)
Resonance
(kN.m)
Mean
(kN.m)
Background
(kN.m)
R
factor
New
straining
action
(kN.m)
Azimuth
0
- - - - - - -
Joint
5546
186 146 85 74 72 5 163
Joint
5527
183 143 84 72 70 5 159
Joint
5814
182 143 83 73 71 5 159
Joint
5798
180 141 82 71 69 5 157
Joint
5545
-173 -135 -79 -68 -67 5 -150
Joint
5525
-171 -134 -78 -67 -66 5 -149
Joint
5797
-169 -133 -77 -67 -65 5 -148
Joint
5813
-169 -133 -77 -67 -65 5 -148
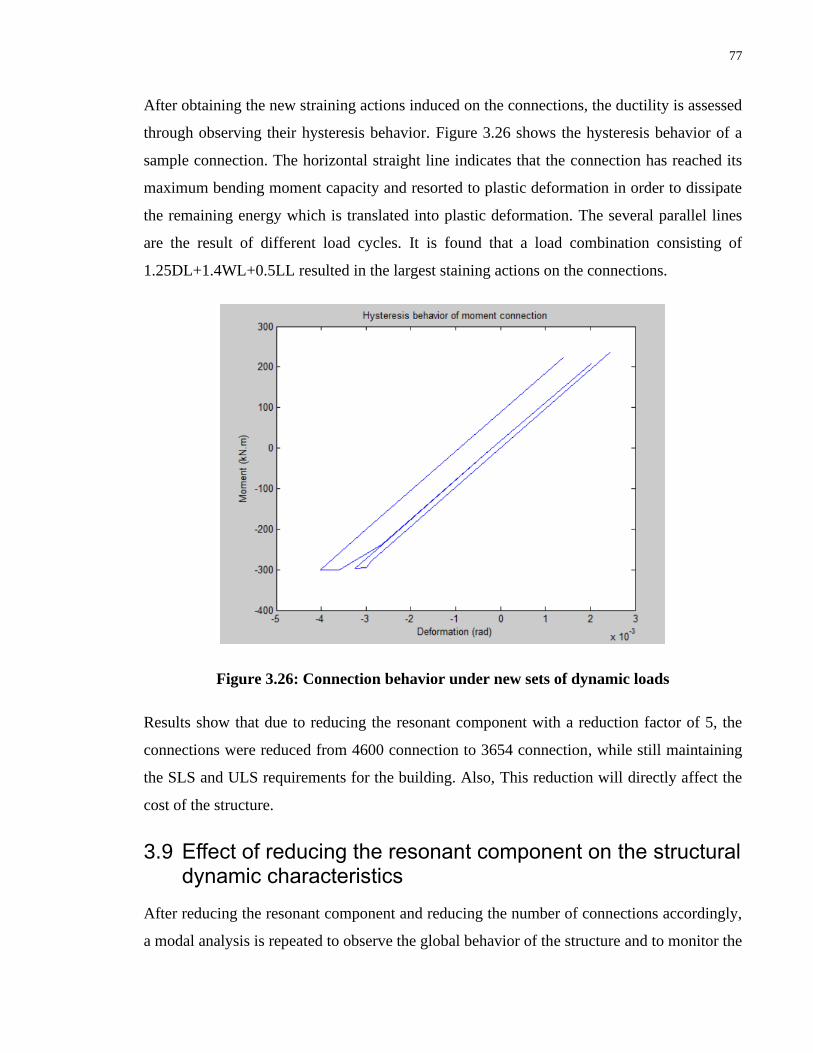
77
After obtaining the new straining actions induced on the connections, the ductility is assessed
through observing their hysteresis behavior. Figure 3.26 shows the hysteresis behavior of a
sample connection. The horizontal straight line indicates that the connection has reached its
maximum bending moment capacity and resorted to plastic deformation in order to dissipate
the remaining energy which is translated into plastic deformation. The several parallel lines
are the result of different load cycles. It is found that a load combination consisting of
1.25DL+1.4WL+0.5LL resulted in the largest staining actions on the connections.
Figure 3.26: Connection behavior under new sets of dynamic loads
Results show that due to reducing the resonant component with a reduction factor of 5, the
connections were reduced from 4600 connection to 3654 connection, while still maintaining
the SLS and ULS requirements for the building. Also, This reduction will directly affect the
cost of the structure.
3.9 Effect of reducing the resonant component on the structural dynamic characteristics
After reducing the resonant component and reducing the number of connections accordingly,
a modal analysis is repeated to observe the global behavior of the structure and to monitor the
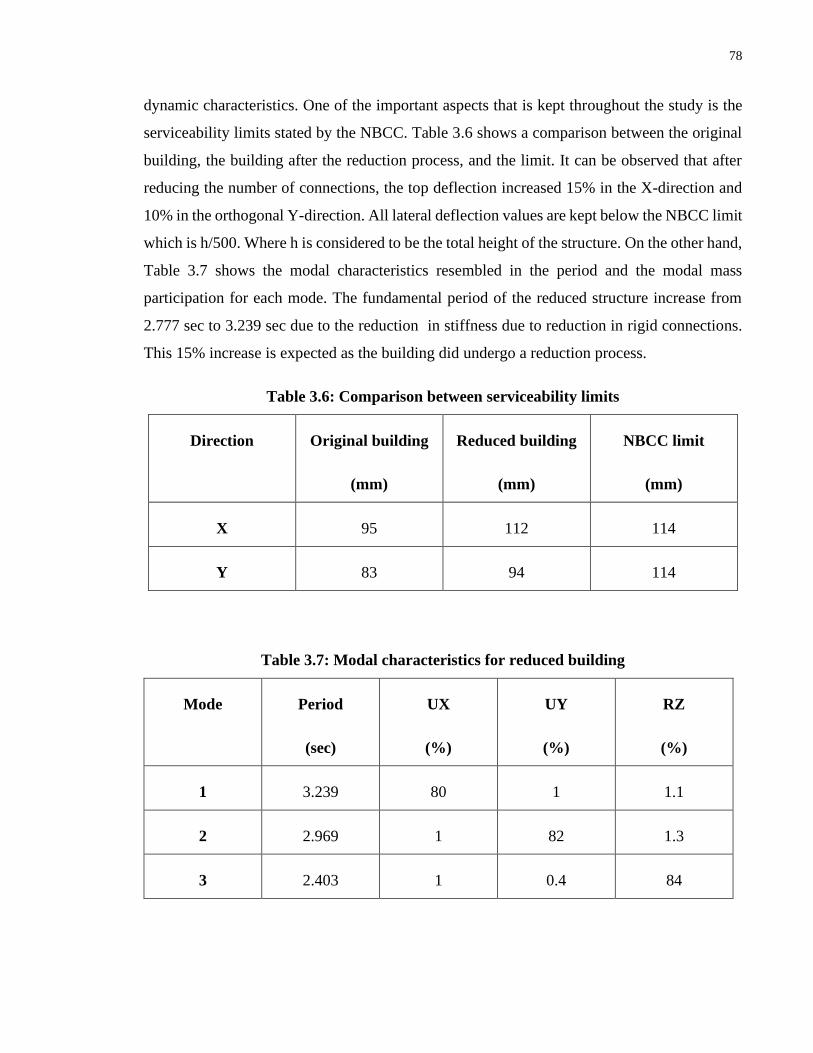
78
dynamic characteristics. One of the important aspects that is kept throughout the study is the
serviceability limits stated by the NBCC. Table 3.6 shows a comparison between the original
building, the building after the reduction process, and the limit. It can be observed that after
reducing the number of connections, the top deflection increased 15% in the X-direction and
10% in the orthogonal Y-direction. All lateral deflection values are kept below the NBCC limit
which is h/500. Where h is considered to be the total height of the structure. On the other hand,
Table 3.7 shows the modal characteristics resembled in the period and the modal mass
participation for each mode. The fundamental period of the reduced structure increase from
2.777 sec to 3.239 sec due to the reduction in stiffness due to reduction in rigid connections.
This 15% increase is expected as the building did undergo a reduction process.
Table 3.6: Comparison between serviceability limits
Direction Original building
(mm)
Reduced building
(mm)
NBCC limit
(mm)
X 95 112 114
Y 83 94 114
Table 3.7: Modal characteristics for reduced building
Mode Period
(sec)
UX
(%)
UY
(%)
RZ
(%)
1 3.239 80 1 1.1
2 2.969 1 82 1.3
3 2.403 1 0.4 84
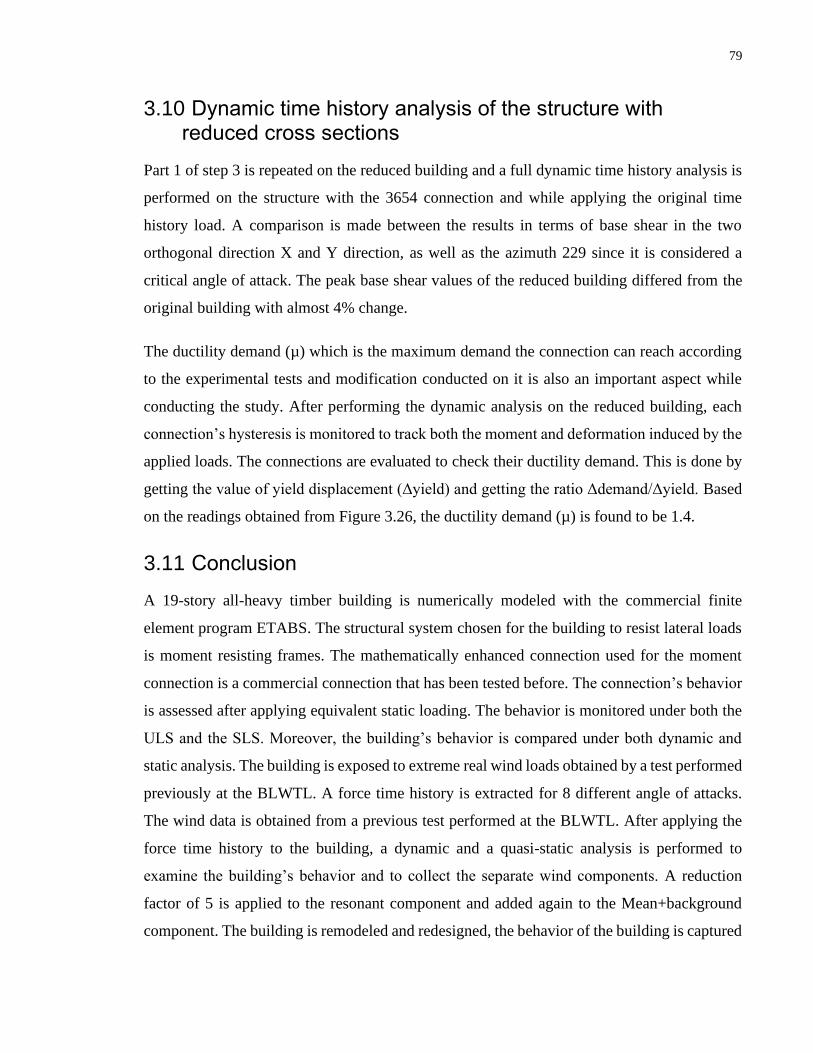
79
3.10 Dynamic time history analysis of the structure with reduced cross sections
Part 1 of step 3 is repeated on the reduced building and a full dynamic time history analysis is
performed on the structure with the 3654 connection and while applying the original time
history load. A comparison is made between the results in terms of base shear in the two
orthogonal direction X and Y direction, as well as the azimuth 229 since it is considered a
critical angle of attack. The peak base shear values of the reduced building differed from the
original building with almost 4% change.
The ductility demand (µ) which is the maximum demand the connection can reach according
to the experimental tests and modification conducted on it is also an important aspect while
conducting the study. After performing the dynamic analysis on the reduced building, each
connection’s hysteresis is monitored to track both the moment and deformation induced by the
applied loads. The connections are evaluated to check their ductility demand. This is done by
getting the value of yield displacement (Δyield) and getting the ratio Δdemand/Δyield. Based
on the readings obtained from Figure 3.26, the ductility demand (µ) is found to be 1.4.
3.11 Conclusion
A 19-story all-heavy timber building is numerically modeled with the commercial finite
element program ETABS. The structural system chosen for the building to resist lateral loads
is moment resisting frames. The mathematically enhanced connection used for the moment
connection is a commercial connection that has been tested before. The connection’s behavior
is assessed after applying equivalent static loading. The behavior is monitored under both the
ULS and the SLS. Moreover, the building’s behavior is compared under both dynamic and
static analysis. The building is exposed to extreme real wind loads obtained by a test performed
previously at the BLWTL. A force time history is extracted for 8 different angle of attacks.
The wind data is obtained from a previous test performed at the BLWTL. After applying the
force time history to the building, a dynamic and a quasi-static analysis is performed to
examine the building’s behavior and to collect the separate wind components. A reduction
factor of 5 is applied to the resonant component and added again to the Mean+background
component. The building is remodeled and redesigned, the behavior of the building is captured
80
and compared against the behavior under the static loading. This procedure is repeated for two
scenarios with two different damping ratios of 1% and 2%. Several aspects of the results were
observed and compared, such as base shear, top story deflection, fundamental period, and the
amount of reduction that is implemented without major changes in the dynamic characteristics
of the building. The difference between the static base shear and the 1% damping dynamic
shear base reached 18% and 13% difference in the X and Y directions respectively. While the
difference for the 2% damping ratio resulted in a smaller percentage difference reaching 14%
and 7% difference in the X and Y directions respectively. This is expected as the damping ratio
increased. After the reduction process, the dynamic characteristics are re-examined and
compared. The reduction process reduced the number of connections in the building from 4600
connection to 3654 connection with almost a 1000 connection less. This type of reduction is
expected to have an impact on the building’s behavior and its dynamic characteristics.
As mentioned earlier, the NBCC limit for top story deflection is h/500. The static procedures
resulted in 95 mm and 83 mm in both X and Y directions respectively, while, after the reduction
process that top story deflection recorded is 112 mm in the X direction and 94 mm in the Y
direction. These values are considered safe as they did not exceed the NBCC limit. Also, the
fundamental period showed an increase of 12% which is also expected as the reduction process
is directly proportional to the rigidity of the structure.
81
4 Chapter 4
4.1 Summary
The research conducted in this thesis investigates the application of heavy timber. It
investigates the environmentally friendly change that should be implemented in north America,
and the paradigm shift in both the construction and research communities are focused on heavy
timber.
Chapter 2 discussed through a detailed case study both glulam and CLT as a material, in terms
of structural systems, design, code limits and provisions, and cost. The detailed study is then
compared with an existing low-rise building built with LFW. The purpose of the comparative
study is to introduce a reliable and a strong alternative that can meet the requirements of the
north American market. Also, the connection systems that are usually accompanied with the
heavy timber industry are discussed intensively. First, Four numerical models are created using
a finite element program to represent the L-shaped existing LFW structure. The components
of every model are numerically modeled to simulate the behavior of the actual structure.
Moreover, connection systems used for all four models are calibrated from former actual tests
performed by investigators to replicate the actual behavior for the connection under both
gravity and lateral loading. The loads utilized on the existing buildings are also applied on the
numerical model for the purpose of fair comparison. Second, each numerical model is then
designed according to the CSA-O86 provisions and follows the requirements set by the NBCC.
Third, a comparison between all the numerical buildings and the existing low-rise building is
held to evaluate all the previously mentioned aspects to fit the north American market.
Chapter 3 on the other side, discuss heavy timber allocation in tall rise-buildings. The European
market is excelling in this aspect in terms of number of tall buildings, and types of connections.
Chapter 3 investigates the ductility-based approach employed in wind design for high-rise
buildings subjected to intense wind loads. Also, the nonlinear behavior experienced by a new
developed connection is evaluated in terms of ductility demand (µ). The connection is stemmed
82
from a smaller commercial connection available in the Canadian market. However, it is
mathematically enhanced in order to improve its behavior. First, a 3D numerical model is
developed for a 19-story building that was tested previously at the Boundary Layer Wind
Tunnel (BLWTL) facility in the University of Western Ontario. Static analysis is conducted
on the numerical model to assess the building’s serviceability, dynamic characteristics, cross-
sections. The lateral load resisting system is moment resisting frame (MRF). The moment
connection mentioned earlier is installed at specific bays to create the lateral resistance. The
behavior of the connection is first observed under both SLS and ULS to ensure that the
connection can operate properly under the loads established by the NBCC 2015. Second,
dynamic time history analysis is conducted to capture the building’s total response. A total of
8 angle of attacks are examined to ensure that the full building’s behavior is captured. Only
the two orthogonal directions X and Y are examined furthermore. Following the dynamic
analysis is a quasi-static analysis to evaluate all the wind components separately. Third, A load
reduction factor is subtracted from the resonant component in the time domain, and then added
to the Mean + background component in the time domain to obtain a new reduced sets of loads.
Fourth, the new sets of loads are applied to the building and the connections are redesigned
and reduced based on the new loads. Fifth, after the reduction process is complete, a
comparison between the original building and the reduced building is held to evaluate the
dynamic characteristics, serviceability checks stated by the NBCC, and design provisions
specified by the CSA-O86. Furthermore, the ductility demand is calculated for the connections.
4.2 Conclusions
Four numerical models are created using a finite element program to represent the L-shaped
existing LFW structure. The components of every model are numerically modeled to simulate
the behavior of the actual structure. Moreover, connection systems used for all four models are
calibrated from former actual tests performed by investigators to replicate the actual behavior
for the connection under both gravity and lateral loading. The structural behavior of every
model is carefully evaluated. The top story lateral deflection, cost, and quantity comparisons
are investigated thoroughly for all four numerical models. The advantage of heavy timber is
clearly captured as they could resist specified wind load given by the NBCC without the need
83
to extrapolate another material to perform as a lateral load resisting system. Also, the cost
comparison is conducted according to the Canadian market drew a benchmark on these new
materials. The cost of each heavy timber building is double the price of the LFW, however, it
can be concluded despite the extra cost, that heavy timber is more reliable than the LFW due
to several reasons such as the high strength to weight ratio which is considered according to
the APA, higher than steel. The excellent fire resistance heavy timber has to offer is considered
a huge advantage, because heavy timber does not deform like steel, this prolongs the fire
performance of glulam. Also, the consistency in heavy timber performance. This is due to the
lamination technique that eliminates the natural variance that can be observed in sawn lumber.
Chapter 3 discuss the possible heights high-rise building heavy timber can reach. The 19-
glulam heavy timber structure is modeled and dynamic analysis is performed. Several factors
changed throughout the modeling process for better understanding of the behavior of both the
glulam as a material and the connection system that is developed for this study. Eight angles
of attacks are tested upon the building, 2 damping ratios are also used. Two sets of base shears
are tested using 1% and 2% as a damping ratio, and the results showed that as the damping
ratio increase the base shear decrease. The difference is about 4% between both values for all
the angle of attacks. The difference in base shear between the static and dynamic analysis is
less than 15 % in both of the global direction X and Y. Following the dynamic analysis, the
decomposition process showed the dynamic amplification factor (DAF) is found to be 1.23 in
the X-direction and 1.31 in the orthogonal Y-direction. After applying the reduction factor (R),
the connections are reduced from 4600 to 3654, which is almost 1000 connection. This
reduction did affect the building’s behavior as expected. The first fundamental period increased
from 2.777 sec to 3.239 sec, the serviceability limits increased to about 10 %, while still
honoring the limit h/500 stated by the NBCC. Also, the ductility demand is calculated to
evaluate the amount of ductility that developed in the connections, it is found to be equal to
1.4.
These conclusions are confined to this particular case study. In order to obtain a more general
conclusion, further research should be performed in a probabilistic approach.
84
4.3 Recommendation for future work
The studies conducted in this thesis discussed the application of heavy timber in both low-rise
and high-rise buildings. Several factors are taken into consideration during these studies.
Factors such as, cost, material, availability, ductility-based approach, available connections in
the north American market, and assessing the inelastic actions resulting from the real wind
loads obtained from the BLWTL. The following investigations are suggested for the future
research:
1- Conducting more experimental work on connection systems in the north American
market for a better understanding of their behavior.
2- Repeating the analysis for more wind events and including more angle of attacks for a
better understanding of the behavior.
3- Extending the study to include different structural systems other than MRF.
5 References
Aivars Vilguts, Kjell Arne Malo, Haris Stamatopoulos: Moment Resisting Frames and
Connections using Threaded Rods in Beam-To-Column Timber Joints, 2018.
Alan Davenport Wind Engineering GroupG, 2007. “Wind Tunnel Testing: A General
Outline.” (May): G2–4.
American Society of Civil Engineers (ASCE). (2010). Minimum Design Loads for Buildings
and Other Structures (7-10), Reston, VA.
Aygul Ceylan and Z.Canan Girgin: Comparison on withdrawal resistance of resin and
phosphate coated annular nails in CLT specimens, 2020
85
B.H. Xu, A. Bouchaïr, M. Taazount, and E.J. Vega: Numerical and experimental analyses of
multiple-dowel steel-to-timber joints in tension perpendicular to grain, 2009.
Bezabeh. M.A. et al. (2018). Probabilistic serviceability-performance assessment of tall
mass-timber buildings subjected to stochastic wind loads: Part I - structural design and wind
tunnel testing. Journal of Wind Engineering & Industrial Aerodynamics. 181, 85–103.
Bezabeh. M.A. et al. (2018). Probabilistic serviceability-performance assessment of tall
mass-timber buildings subjected to stochastic wind loads: Part II – structural reliability
analysis. Journal of Wind Engineering & Industrial Aerodynamics. 181, 112–125.
Bo-Han Xu, Abdelhamid Bouchaïr, and Patrick Racher: Mechanical Behaviour and
Modeling of Dowelled Steel-to-Timber Moment-Resisting Connections, 2014.
Bradly Taylor, Andre R. Barbosa, and Arijit Sinha: Cyclic performance of in-plane shear
cross-laminated panel-to-panel surface spline connections, 2020.
British Standrads Institute. 1996. Eurocode 8: Design Provisions for Earthquake Resistance
of Structures: British Strandards Inistitution.
Bryne T. Miyamoto, Arijit Sinha, and Ian Morrell: Connection Performance of Mass
Plywood Panels, 2020.
Canadian Design Guide for CLT 2018, Structurlam, 2017.
Canada, National Research Council of. 2010. “National Building Code of Canada.”
Cedou Kumpenza, Andreas Ringhofer, Thomas Krenke, Adeayo Sotayo, Maximilian
Pramreiter, and Ulrich Muller: Timber Screw Connection: Study of the Strian along the
Interface Using Optical Measurement Techniques and Simulations, 2020.
CEN, NS-EN 1995-1-1:2004+A1:2008+A2:2014, Design of timber structures – Part 1-1:
General – Common rules and rules for buildings, European committee for standardization,
Brussels.
86
Chen, J., Wang, H., Yu, Y., Liu, Y., & Jiang, D. (2020). Loosening of Bolted Connections
under Transverse Loading in Timber Structures. Forests, 11(8), 816.
Ciampoli, M.. Petrini, F. and Augusti, G. 2011a. “Performance-Based Wind Engineering:
Towards a General Procedure.” Structural Safety 33(6): 367–78.
Cong Zhang, Richard Harris, Wen-Shao Chang: Strain distribution of dowel-type
connections reinforced with self-tapping screws, 2020.
Computers and Structures Inc. 2015. “CSI Analysis Reference Manual.”
CSA-O86. 2014. Engineering Design in Wood. Mississauga ON: CSA Group
Dujic, B. et al, (2010), ‘PREDICTION OF DYNAMIC RESPONSE OF A 7-STOREY
MASSIVE XLam WOODEN BUILDING TESTED ON A SHAKING TABLE’, WTCE,
Trento, Italy.
Douglas C. Stahl, M. ASCE, Ronald W. Wolfe, and Marshall Begel: Improved Analysis of
Timber Rivet Connections, 2004.
Echavarría, C. (2007). Bolted timber joints with self-tapping screws. Revista EIA, (8), pp.37-
47.
Elezaby, F, et al. (2020). Ductility-based design approach of tall buildings under wind loads.
Wind and structure Journal. Vol. 31, No. 2, 143-152
EN12512:2001. Timber structures-test methods-cyclic testing of joints made with mechanical
fasteners. Brussels: European Committee for Standardisation.
European Committee for Standardization. 1994. Eurocode 5: design of timber structure.
Brussels: BSI.
Gluelam Product Guide (Tech.). (2017). Tacoma, WA: APA.
Griffis, L., Patel, V., Muthukumar, S., and Baldava, S. (2012). “A framework for
performance-based wind engineering.” Advances in Hurricane Engineering. 1205-1216.
87
Inter-Story Drift Testing of KNAPP RICON S VS Under Design Load, MyTiCon.
Judd, P. and Charney, A. 2015. “Inelastic Behavior and Collapse Risk for Buildings
Subjected to Wind Loads.” (2012): 2089–2100.
Karacabeyli, E., P. Eng., & Douglas, B., P.E. (Eds.). (2013). CLT Handbook (U.S. ed.,
Publication). FPInnovations.
Mohammad, M., Douglas, B., Rammer, D., & Pryor, S. E. (2013). Connections in
crosslaminated timber buildings. In CLT Handbook: Cross-laminated timber.:
FPInnovations.
Polastri, A. et al, (2018). ‘Seismic analysis of multi‑storey timber buildings braced with a
CLT core and perimeter shear‑walls’. Bulletin of Earthquake Engineering, 17:1009–1028.
R. J. Bainbridge and C. J. Mettem. (1998): A review of moment-resistant structural timber
connections.
Ryan L. Richmond, 2020. Highlighting the Unique Challenges and Differences of Building
with Mass Timber.
Shu, Z. et al. (2019). Seismic design and performance evaluation of self-centering timber
moment resisting frames. Soil Dynamics and Earthquake Engineering Journal. 119 (2019)
346–357
Tomasi, R., & Smith, I. (2015). Experimental characterization of monotonic and cyclic
loading responses of CLT panel-to-foundation angle bracket connections. Journal of
Materials in Civil Engineering, 27(6), 04014189.
Van de Lindt, J. and Dao, T. (2009). “Performance-Based Wind Engineering for Wood-
Frame Buildings.” Journal of Structural Engineering 9445 (November 2003).
Vogrinec, K., & Premrov, M. (2018). Experimental and analytical study of the inter-storey
hold-down connections in timber-frame panel buildings. Journal of Applied Engineering
Science, 16(3), 358-367.
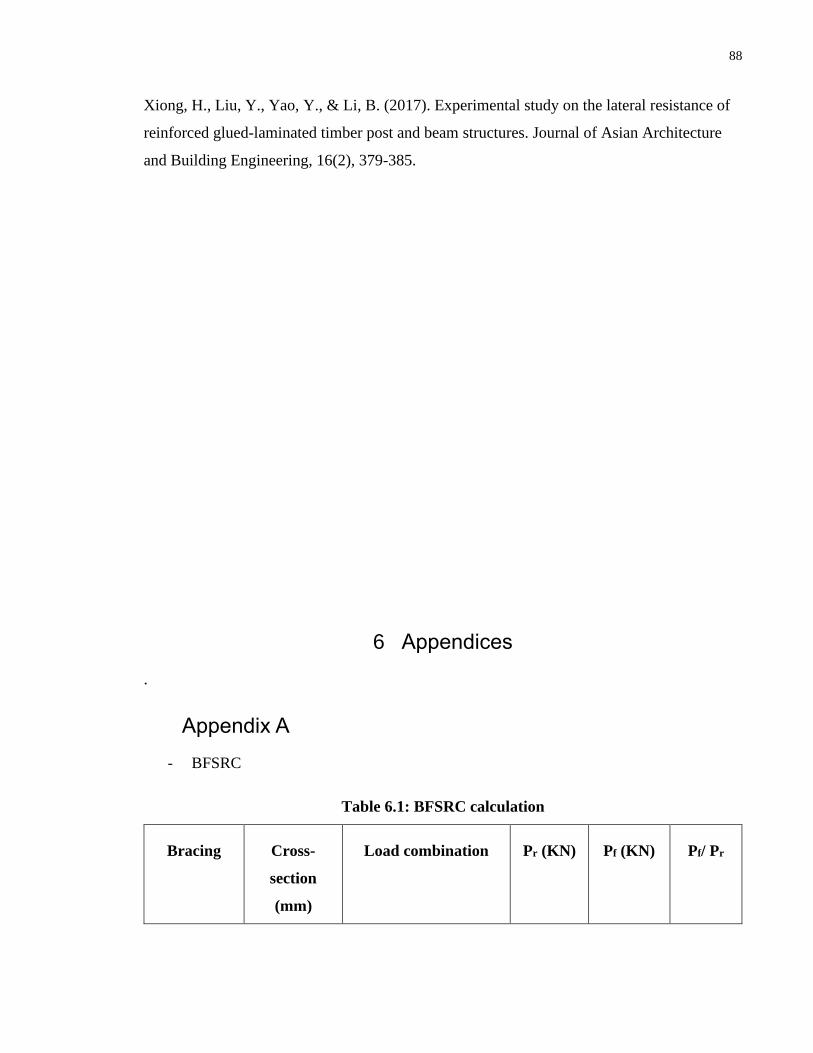
88
Xiong, H., Liu, Y., Yao, Y., & Li, B. (2017). Experimental study on the lateral resistance of
reinforced glued-laminated timber post and beam structures. Journal of Asian Architecture
and Building Engineering, 16(2), 379-385.
6 Appendices
.
Appendix A
- BFSRC
Table 6.1: BFSRC calculation
Bracing Cross-
section
(mm)
Load combination Pr (KN) Pf (KN) Pf/ Pr
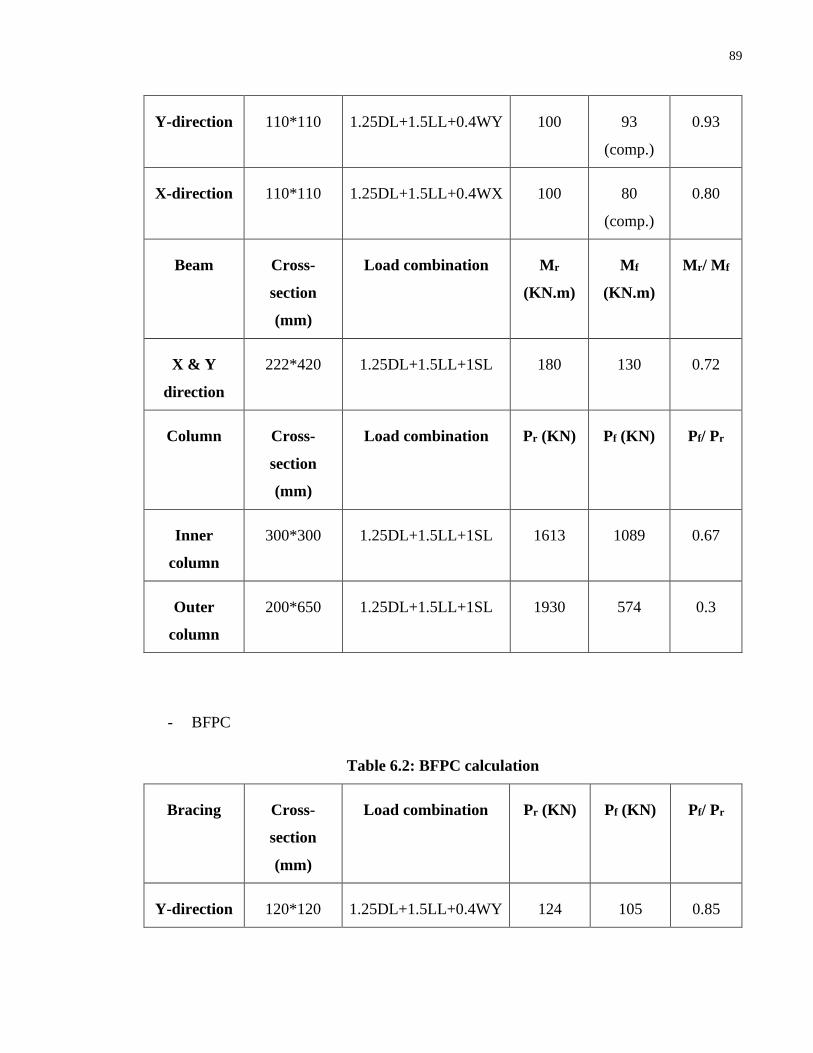
89
Y-direction 110*110 1.25DL+1.5LL+0.4WY 100 93
(comp.)
0.93
X-direction 110*110 1.25DL+1.5LL+0.4WX 100 80
(comp.)
0.80
Beam Cross-
section
(mm)
Load combination Mr
(KN.m)
Mf
(KN.m)
Mr/ Mf
X & Y
direction
222*420 1.25DL+1.5LL+1SL 180 130 0.72
Column Cross-
section
(mm)
Load combination Pr (KN) Pf (KN) Pf/ Pr
Inner
column
300*300 1.25DL+1.5LL+1SL 1613 1089 0.67
Outer
column
200*650 1.25DL+1.5LL+1SL 1930 574 0.3
- BFPC
Table 6.2: BFPC calculation
Bracing Cross-
section
(mm)
Load combination Pr (KN) Pf (KN) Pf/ Pr
Y-direction 120*120 1.25DL+1.5LL+0.4WY 124 105 0.85
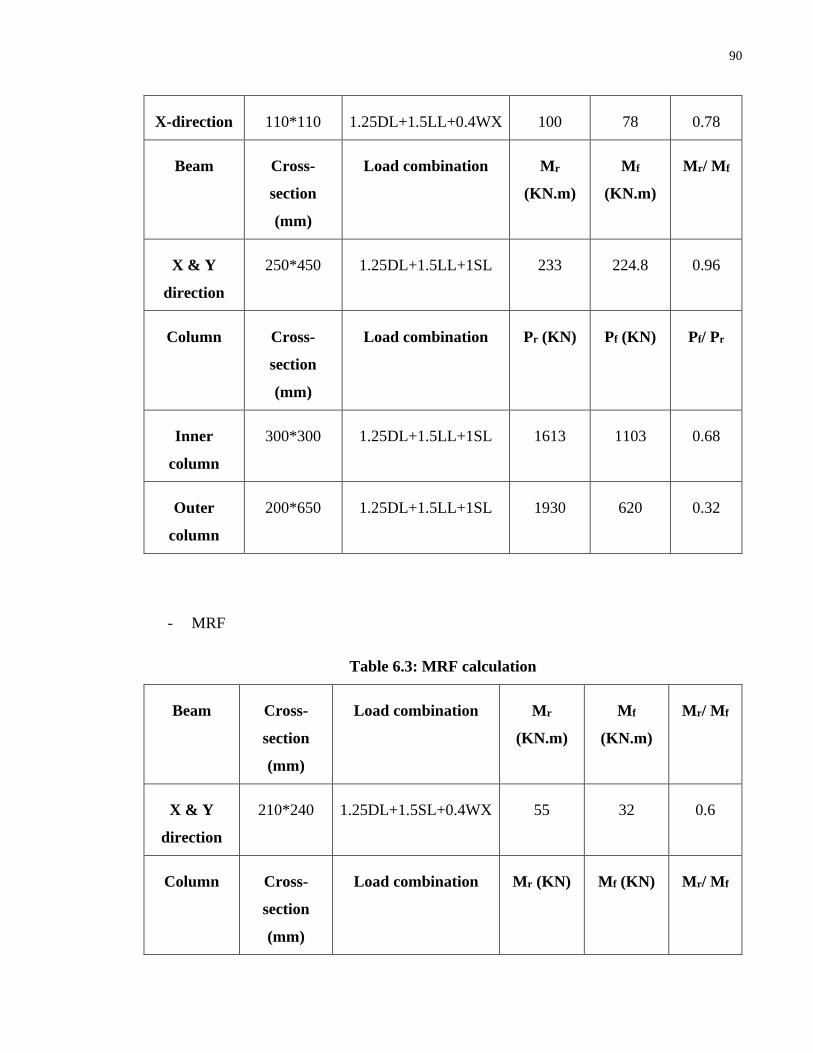
90
X-direction 110*110 1.25DL+1.5LL+0.4WX 100 78 0.78
Beam Cross-
section
(mm)
Load combination Mr
(KN.m)
Mf
(KN.m)
Mr/ Mf
X & Y
direction
250*450 1.25DL+1.5LL+1SL 233 224.8 0.96
Column Cross-
section
(mm)
Load combination Pr (KN) Pf (KN) Pf/ Pr
Inner
column
300*300 1.25DL+1.5LL+1SL 1613 1103 0.68
Outer
column
200*650 1.25DL+1.5LL+1SL 1930 620 0.32
- MRF
Table 6.3: MRF calculation
Beam Cross-
section
(mm)
Load combination Mr
(KN.m)
Mf
(KN.m)
Mr/ Mf
X & Y
direction
210*240 1.25DL+1.5SL+0.4WX 55 32 0.6
Column Cross-
section
(mm)
Load combination Mr (KN) Mf (KN) Mr/ Mf
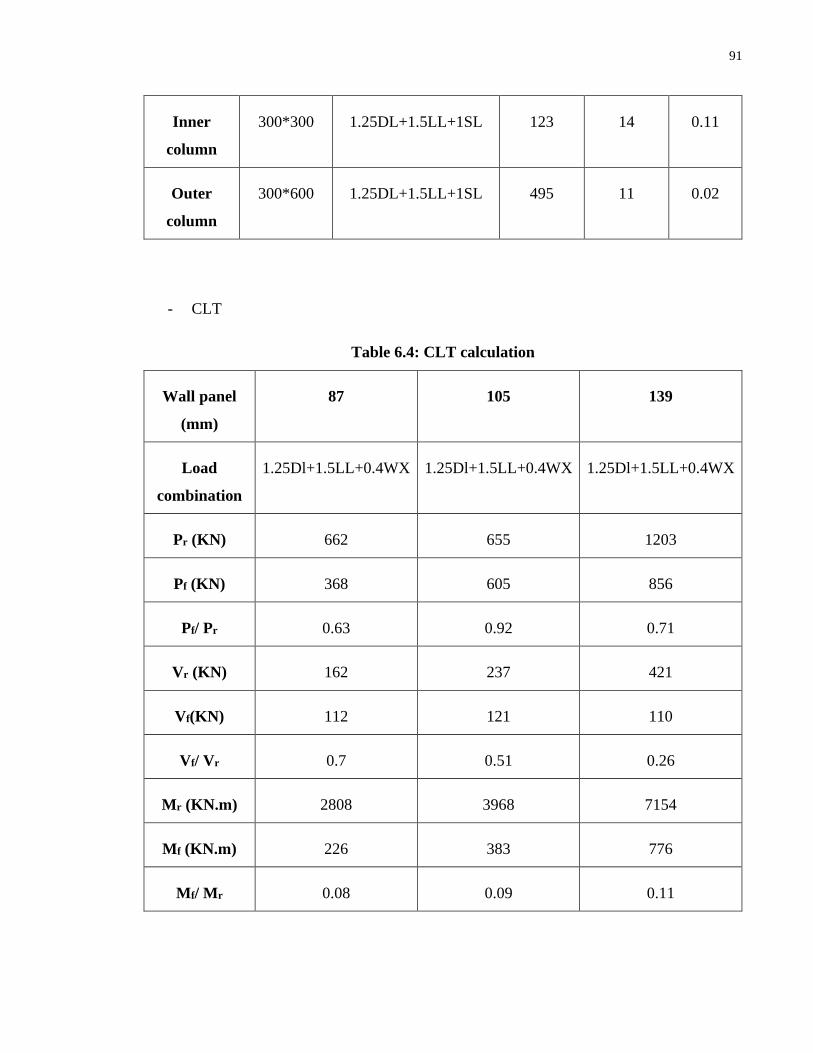
91
Inner
column
300*300 1.25DL+1.5LL+1SL 123 14 0.11
Outer
column
300*600 1.25DL+1.5LL+1SL 495 11 0.02
- CLT
Table 6.4: CLT calculation
Wall panel
(mm)
87 105 139
Load
combination
1.25Dl+1.5LL+0.4WX 1.25Dl+1.5LL+0.4WX 1.25Dl+1.5LL+0.4WX
Pr (KN) 662 655 1203
Pf (KN) 368 605 856
Pf/ Pr 0.63 0.92 0.71
Vr (KN) 162 237 421
Vf(KN) 112 121 110
Vf/ Vr 0.7 0.51 0.26
Mr (KN.m) 2808 3968 7154
Mf (KN.m) 226 383 776
Mf/ Mr 0.08 0.09 0.11
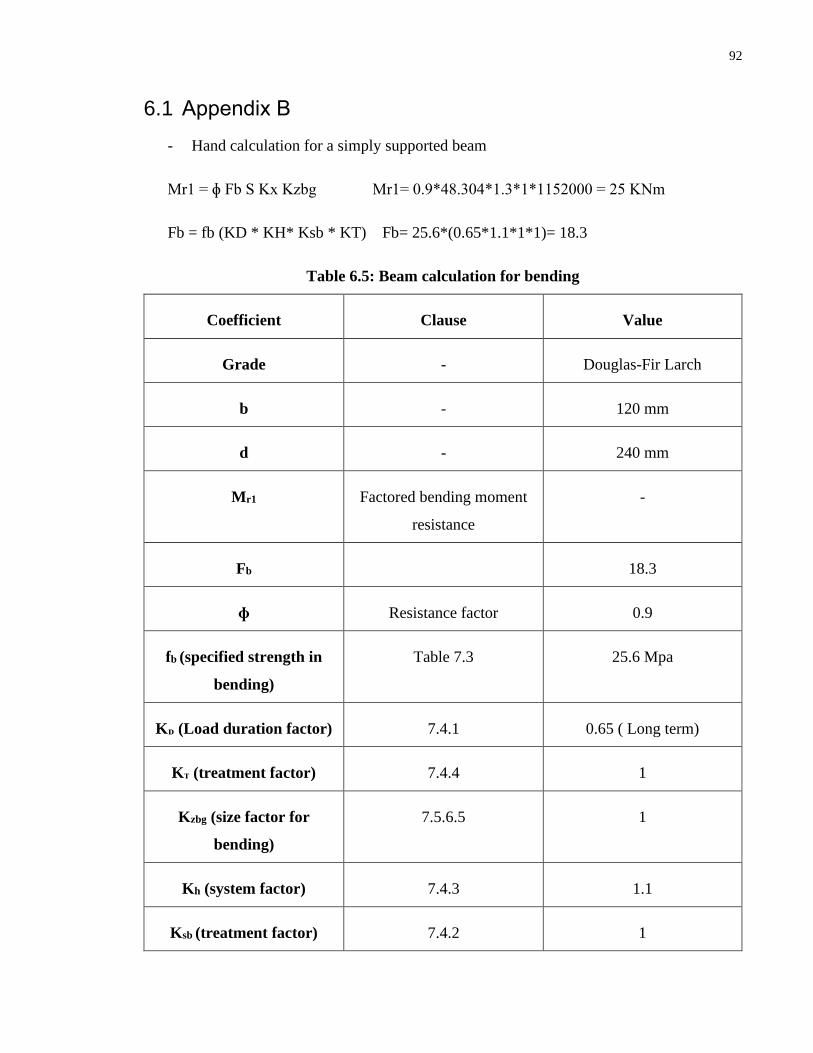
92
6.1 Appendix B
- Hand calculation for a simply supported beam
Mr1 = ɸ Fb S Kx Kzbg Mr1= 0.9*48.304*1.3*1*1152000 = 25 KNm
Fb = fb (KD * KH* Ksb * KT) Fb= 25.6*(0.65*1.1*1*1)= 18.3
Table 6.5: Beam calculation for bending
Coefficient Clause Value
Grade - Douglas-Fir Larch
b - 120 mm
d - 240 mm
Mr1 Factored bending moment
resistance
-
Fb 18.3
ɸ Resistance factor 0.9
fb (specified strength in
bending)
Table 7.3 25.6 Mpa
Kᴅ (Load duration factor) 7.4.1 0.65 ( Long term)
Kᴛ (treatment factor) 7.4.4 1
Kᴢbg (size factor for
bending)
7.5.6.5 1
Kh (system factor) 7.4.3 1.1
Ksb (treatment factor) 7.4.2 1
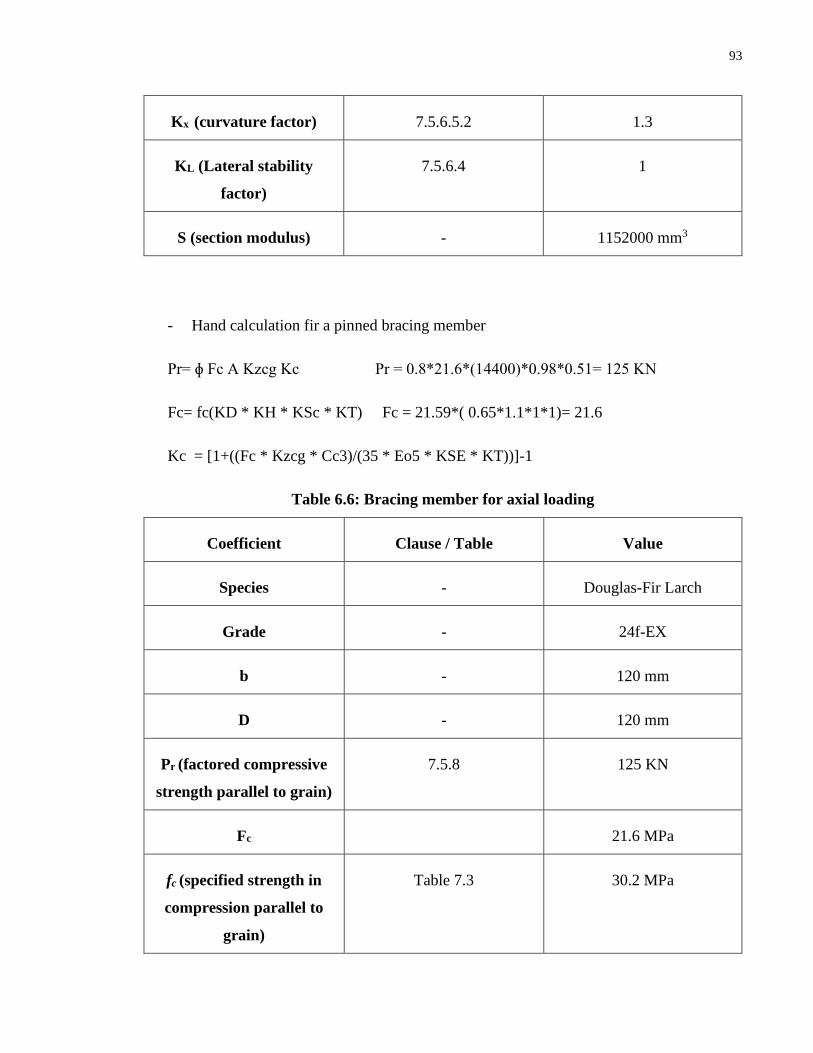
93
Kx (curvature factor) 7.5.6.5.2 1.3
KL (Lateral stability
factor)
7.5.6.4 1
S (section modulus) - 1152000 mm3
- Hand calculation fir a pinned bracing member
Pr= ɸ Fc A Kzcg Kc Pr = 0.8*21.6*(14400)*0.98*0.51= 125 KN
Fc= fc(KD * KH * KSc * KT) Fc = 21.59*( 0.65*1.1*1*1)= 21.6
Kc = [1+((Fc * Kzcg * Cc3)/(35 * Eo5 * KSE * KT))]-1
Table 6.6: Bracing member for axial loading
Coefficient Clause / Table Value
Species - Douglas-Fir Larch
Grade - 24f-EX
b - 120 mm
D - 120 mm
Pr (factored compressive
strength parallel to grain)
7.5.8 125 KN
Fc 21.6 MPa
fc (specified strength in
compression parallel to
grain)
Table 7.3 30.2 MPa
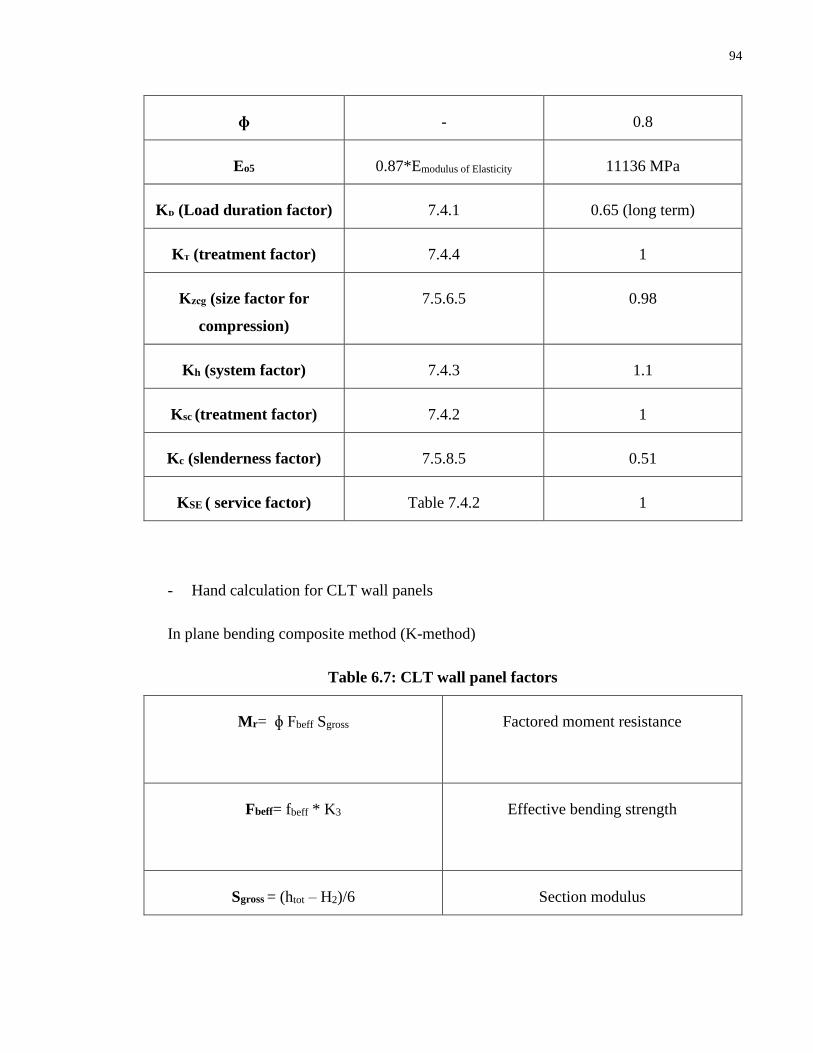
94
ɸ - 0.8
Eo5 0.87*Emodulus of Elasticity 11136 MPa
Kᴅ (Load duration factor) 7.4.1 0.65 (long term)
Kᴛ (treatment factor) 7.4.4 1
Kᴢcg (size factor for
compression)
7.5.6.5 0.98
Kh (system factor) 7.4.3 1.1
Ksc (treatment factor) 7.4.2 1
Kc (slenderness factor) 7.5.8.5 0.51
KSE ( service factor) Table 7.4.2 1
- Hand calculation for CLT wall panels
In plane bending composite method (K-method)
Table 6.7: CLT wall panel factors
Mr= ɸ Fbeff Sgross
Factored moment resistance
Fbeff= fbeff * K3
Effective bending strength
Sgross = (htot – H2)/6 Section modulus
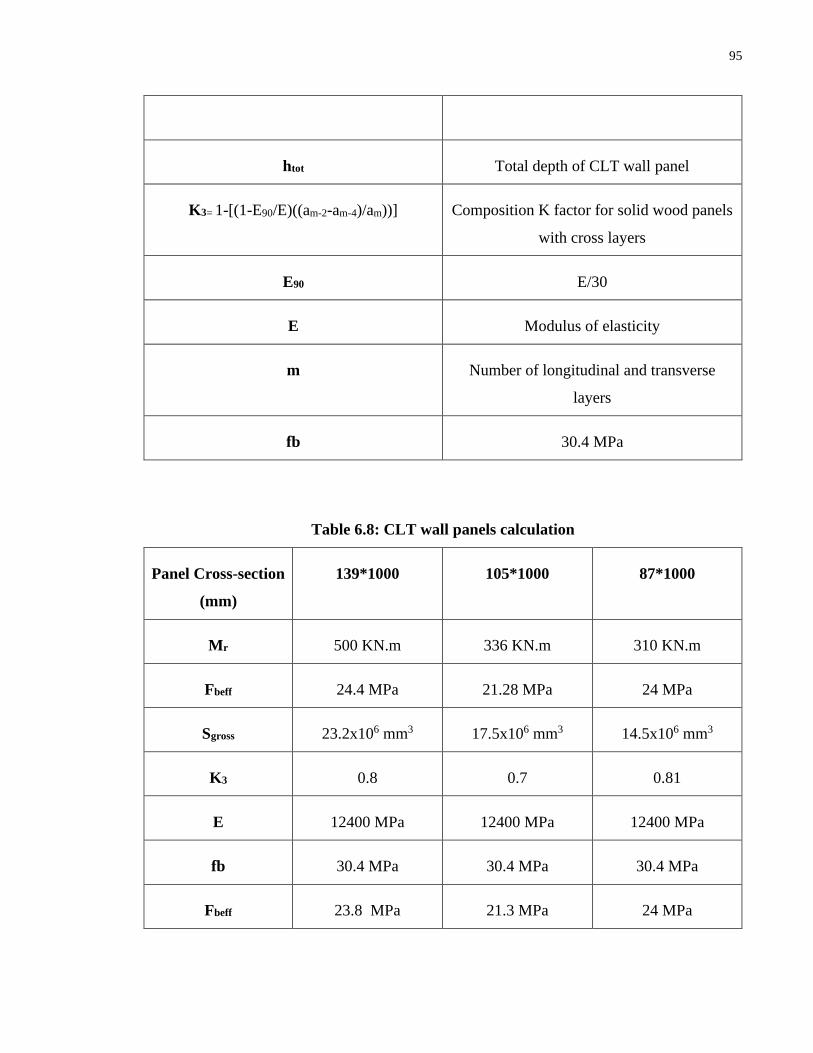
95
htot Total depth of CLT wall panel
K3= 1-[(1-E90/E)((am-2-am-4)/am))] Composition K factor for solid wood panels
with cross layers
E90 E/30
E Modulus of elasticity
m Number of longitudinal and transverse
layers
fb 30.4 MPa
Table 6.8: CLT wall panels calculation
Panel Cross-section
(mm)
139*1000 105*1000 87*1000
Mr 500 KN.m 336 KN.m 310 KN.m
Fbeff 24.4 MPa 21.28 MPa 24 MPa
Sgross 23.2x106 mm3 17.5x106 mm3 14.5x106 mm3
K3 0.8 0.7 0.81
E 12400 MPa 12400 MPa 12400 MPa
fb 30.4 MPa 30.4 MPa 30.4 MPa
Fbeff 23.8 MPa 21.3 MPa 24 MPa

96
97
Curriculum Vitae
Name: Moustafa EL-Assaly
Post-secondary Cairo University
Education and Cairo, Egypt
Degrees: 2012-2017 B.A.
The University of Western Ontario
London, Ontario, Canada
2019-2021 M.A.
Honours and Nominated for the best teaching assistant award
Awards: (Winter, Fall) 2020
Related Work Teaching Assistant
Experience The American University in Cairo
2017-2019
The University of Western Ontario
2019-2020
Publications El-Assaly, M. El-Damatty, A.A., Hamada, A. Case Study For a Mid-
Rise Building With Different Wood Structural Systems. The CSCE virtual conference, 2021.